“Improved” Graphic Capability yields even worse practices.
Only 10% of the screen is used to show poorly-presented numeric data,
90% is a just a “pretty picture”
Other Industries Do It Better
�Speed
�Altitude
�Position
�Course
�Time Enroute
�Time to next Waypoint
�Time to Destination
�Fuel Remaining
�Proximity to Ground
�Proximity to Rising Terrain
�Nearby Airports
�Positions of nearby aircraft
�Real-time weather & lightning
�Glide Radius
�Engine diagnostics
�Data on Available Services at Airports
�Comm & Nav Frequencies
� Instrument Approaches
�Lots more!
GARMIN ® 1000 Avionics System
The High Performance HMI
Study by Nova Chemicals and ASM® Consortium
Task With “Traditional” HMI
With High Performance
HMI
Improvement
Detecting Abnormal
Situations Before
Alarms Occur
10% of the time 48% of the time A 5X increase
Success Rate in Handling
Abnormal Situation 70% 96%37% over base
case
Time to Complete
Abnormal Situation
Tasks
18.1 min 10.6 min 41% reduction
$800,000 per year savings anticipated on 1 ethylene plant
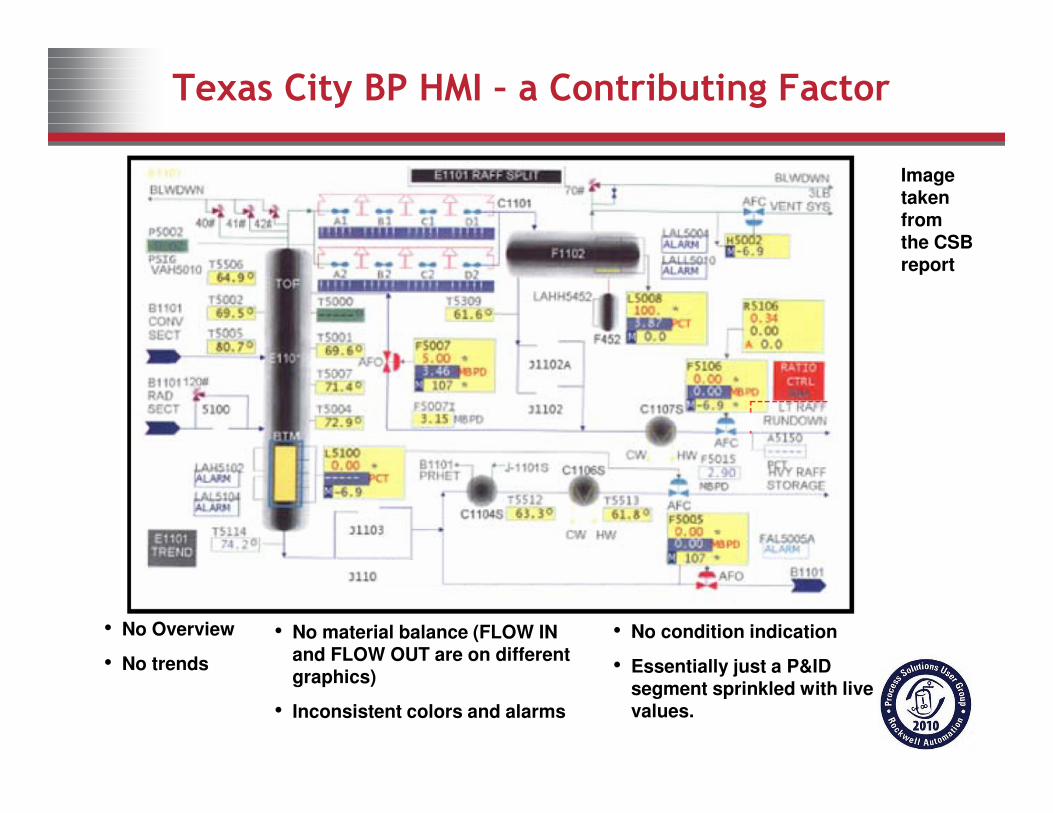
Time after time, poor HMIs are cited as contributing factors to major accidents!
Texas City BP HMI – a Contributing Factor
• No Overview
• No trends
• No condition indication
• Essentially just a P&ID segment sprinkled with live values.
• No material balance (FLOW IN and FLOW OUT are on different graphics)
• Inconsistent colors and alarms
Image taken from the CSB report
Data is Not Information: Is Fluffy Sick?
Blood Tests for Fluffy -1
Test Results
HCT 31.7%
HGB 10.2 g/dl
MCHC 32.2 6/dl
WBC 9.2 x10⁹ /L
GRANS 6.5 x10⁹ /L
L/M 2.7 x10⁹ /L
PLT 310 x109 /L
Answer: Unless you are vet, how
can you know?
What About Now?
After awhile, you might figure it out…
Blood Tests for Fluffy -2
Test Results Range
HCT 31.7% 24.0 – 45.0
HGB 10.2 g/dl 8.0 – 15.0
MCHC 32.2 6/dl 30.0 - 36.9
WBC 9.2 x10⁹ /L 5.0 – 18.9
GRANS 6.5 x10⁹ /L 2.5 – 12.5
L/M 2.7 x10⁹ /L 1.5 – 7.8
PLT 310 x109 /L 175 - 500
How About Now?
ABNORMAL VALUES can be seen at a glance.
Blood Tests for Fluffy -3
Test Results Range IndicatorLow – Normal - High
HCT 31.7% 24.0 – 45.0
HGB 10.2 g/dl 8.0 – 15.0
MCHC 32.2 6/dl 30.0 - 36.9
WBC 9.2 x10⁹ /L 5.0 – 18.9
GRANS 6.5 x10⁹ /L 2.5 – 12.5
L/M 2.7 x10⁹ /L 1.5 – 7.8
PLT 310 x109 /L 175 - 500
Data is Not Information: Common Depictions
45.1°
48.2°
50.6°
53.8°
54.9°
22.5%
42.9°
98.2 MPPH
221.2 PSI
96.2% “XYZ”
22.3% “ABC”
60.1°
DP INH20
12-15 22.8
1-12 16.3
1-15 39.1
77.8 MPPH
45.1°
48.2°
50.6°
53.8°
54.9°
22.5%
42.9°
98.2 MPPH
221.2 PSI
96.2% “XYZ”
22.3% “ABC”
60.1°
DP INH20
12-15 22.8
1-12 16.3
1-15 39.1
77.8 MPPH
Most graphics in the world basically look
like this!
• Lots of Data
• Not Much Information
• Poor Presentation
• High Mental Workload
to Decipher
• Cannot grasp what is
going on “at-a-glance”
Analog in Industrial Examples
A Column Temperature Profile
Deviation or
absolute numbers optionally toggled
20.1
24.2
25.6
27.8
28.9
+1.1
-0.7
+0.8
A good
profile?
Yes, this
one is.
Too hot at
the top, too cold at the bottom
Optional:Line color
indicates abnormality,
alarm is not yet activated
P&IDs are not HMIs: A Poor Paradigm
Typical “P&ID Process Pictorial” – a low performance, overused paradigm
West East
Drive: 232.2 amps
Cooler
W. Vibration: 2.77 E. Vibration: 3.07
2.77MSCFH
155.2 °F 108.2 °F 166.1 °F55.7 psig
135.1psig
190.5 psig
Oil 155.2 °F
Oil 85.1 psi
65.1 °F
Information is Data in Context Made Useful
F
L
O
W
RECYCLE COMPRESSOR K43
S.
P
R
E
S
I.
P
R
E
S
D.
P
R
E
S
S.
T
E
M
P
I.
T
E
M
P
I.
T
E
M
P
Alarm Indicator
Appears here
with Priority
Level and
Color
Desirable
Operating
Range shown
as dotted lines
Alarm Range
depicted and
(for some)
shutdown
value
Alarm Range
depicted and
(for some)
shutdown or
interlock
initiator
Show Values Show Trends
Buttons for
additional
functionality
D.
T
E
M
P
E.
V
I
B
W.
V
I
B
A
M
P
S
O
I
L
P
S
I
O
I
L
T
E
M
P
OutIn
2
Compressor Status Showing Alarm/Shutdown Limits
Analog is Powerful
Analog Indicators with values, direction, and history
Optional Enhancements for Moving Analog Indicators
S.
P
R
E
S
Display
Measurement
variability in
the last hour
S.
P
R
E
S
Display
Measurement
direction –
rolling 10
minutes
S.
P
R
E
S
Display
Current
Value:32.1
Analog in Industrial Examples
Material Balance Indicators
Scrubber Material Balance
31.1
1
Total
Flow
IN
Reset
Show Trends
Total
Flow
OUT
Accumulated
Difference
27.9
0.0
Leak
Warning
Overflow
Warning
Diff: 3.2
Hours: 22.8
Since: 06/02/07 14:00:00
0.0
Scrubber Material Balance
31.1
1
Total
Flow
IN
Reset
Show Trends
Total
Flow
OUT
Accumulated
Difference
27.9
0.0
Leak
Warning
Overflow
Warning
Diff: 3.2
Hours: 22.8
Since: 06/02/07 14:00:00
0.0
Analog in Industrial Examples
Material Balance Indicator Animation
Scrubber Material Balance
31.1
1
Total
Flow
IN
Reset
Show Trends
Total
Flow
OUT
Accumulated
Difference
27.9
0.0
Leak
Warning
Overflow
Warning
Diff: 3.2
Hours: 22.8
Since: 06/02/07 14:00:00
0.0
The Importance Of Trends
Current Pressure
Alarm Limit Shutdown Actuation
235.2 psig 250 psig 300 psig
Shutdown
-2 HRS
250
300
200
150
100
50
Alarm
Shutdown
-2 HRS
250
300
200
150
100
50
Alarm
Shutdown
-2 HRS
250
300
200
150
100
50
Alarm
Shutdown
-2 HRS
250
300
200
150
100
50
Alarm
Shutdown
-2 HRS
250
300
200
150
100
50
Alarm
Shutdown
-2 HRS
250
300
200
150
100
50
Alarm
Value
Needing
Trend
Very Different Situations that only trends can show!
The Importance Of Trends
PSOAUTO
7.2 mph 7.0
34.5 %
Feed FlowPSOAUTO
85.2 deg85.050.5 %
Head TempPSOAUTO
45.1 deg46.034.5 %
Base TempPSOAUTO
25.6 %20.024.5 %
Level %PSOAUTO
5.1 mph4.5
28.7 %
Bot FlowPSOAUTO
15.1 mph15.047.5 %
RB Steam#7
RHP COLUMN
Feed MPH 7.2
5.0
9.0
-60 -30-90
Base Temp Deg C 45.6
44.0
48.0
-60 -30-90
Bottom Flow MPH 5.1
2.2
6.5
-60 -30-90
Head Temp Deg C 85.8
83.0
87.0
-60 -30-90
Level % 25.6
12.0
28.0
-60 -30-90
Reboiler Steam MPH 7.2
13.0
17.0
-60 -30-90
TIME
BASE2 HOURS
Toggle
OUTPUT
• Proper Auto-ranges
• Show boundaries of “What is good”
Custom Elements for Startups
Always try to clearly depict:
“Where am I?”
“How am I doing vs. what is “good?”
Reactor 7 Startup
0
Temperature
Deg C
+30 +60 +90
Feed
Rate
MPH
Additive
Flow
MPH
20
40
60
80
65.1
0
5
10
15
20
0
2
4
6
8
21.1
6.9
Other Principles
Poor Vessel
and Line
Depiction !
Crude
Feed
TK-21
CRUDE
FEED
TK-21
Better Vessel
and Line
Depiction
PROD TANK
SCRUBBER
To Scrubber
To Product
Tank
Not a navigation target
Navigation target
• Don’t get fancy
• Avoid 3-D objects
Proper Level Depiction
Poor
Vessel
Level
Indication
Better
Vessel
Level
Indication
Very Poor
Vessel
Level
Indication
Crude
Feed
TK-21
Trend
Vessel
Level
Indication
2 Hrs
Simple, Non-Distracting Element Depiction
CRUDE
FEED
TK-21
SURGE
SCRUBBER
100.0%
FEED SYS
PSOAUTO
75.1 %60.088.5 %
TK21 Level
33.4%
Simple Output % numbers can be more effective than tiny scales
Tiny
Illegible
Scales
Tiny
Illegible
Scales
Status Depiction
Bright saturated color is used to indicate abnormal situations only
(Shape is Unfilled
and darker)
Pumps with Run Indication Sensor:
Wrong Better
Pumps without Run Indication Sensing have a fill matching the background:
Not
Running
Running
Wrong Better
STOPPED
RUNNING
(Shape is Filled
and lighter)
Basic Principles - Hierarchy
HIERARCHY for Displays:
• Level 1 – Process Area Overview
• Entire Operator Span of Control. “Single-Glance”
• Level 2 – Process Unit Control
• Sub-unit controlled by operator
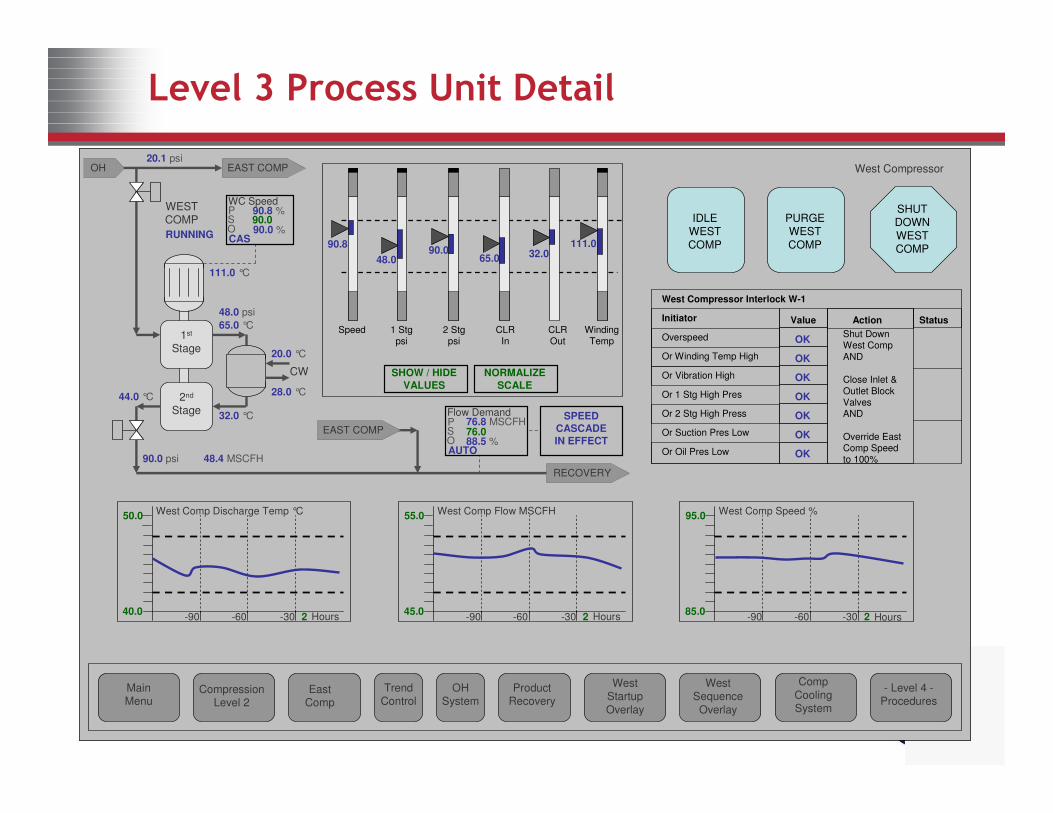
• Level 3 – Process Unit Detail
• Equipment or controller
• Level 4 – Process Unit Support and Diagnostic Displays
• Interlocks, ESDs, diagnostic screens, etc.
• Proper Hierarchy minimizes the number of physical screens and makes for proper navigation
• Graphics designed from P&IDs will not accomplish a proper hierarchy!
Level 1
Process AreaOverview Display
Level 2
Process UnitControl Display
Level 2
Process UnitControl Display
Level 2
Process UnitControl Display
Level 3
Process UnitDetail Display
Level 3
Process UnitDetail Display
Level 3
Process UnitDetail Display
Level 4
Process UnitSupport Display
Level 4
Process UnitSupport Display
Level 4
Process UnitSupport Display
Reactor 1
ThioniteMid-RunONCLEAR
Prod:
State:
Agit:Locks:
Run Plan:
Actual:
IN OUTBalance
Menus
Main
Menu
Feed
Sys
Aux
Sys
Reactor1
L2
Trend
Control
Comp A Comp B
72.0
80.0
2 HR
Cool CPC CRM
Rate
Reactor 2
CRM-114Mid-RunONCLEAR
Prod:
State:
Agit:Locks:
Run Plan:
Actual:
Balance
Comp A Comp B
60.0
68.0
2 HR
Cool CPC CRM
Rate
IN OUT
Hydrog A
Bed
A1
Bed
A2
Suct Dsch
OKOKOKCLEAR
VIB:
BRG:OIL:
Locks:
Cycle
Comp A
470
500
FLOW
2 HR
Hydrog B
Bed
B1
Bed
B2
Suct Dsch
OKOKOKCLEAR
VIB:
BRG:
OIL:
Locks:
Cycle
Comp B
470
500
FLOW
2 HR
Alarms:ACK
UNACK
Toggle
List /Summary
P100
P210
P3
21
P4
41
Reactor2
HydrogA
HydrogB
L3 L4
70
80
%
12 HR
Key Performance Indicators
Conversion Efficiency
0.5
1.0
12 HR
Emissions Limit Ratio
Feed A Feed B Feed C SynG
Feed System Aux Systems
Atv 1 Atv 2 Pres %IP
Clr T-In T-Out Visc
CWT CWP S10
PWR VentP VentT
C57D Null-A Jup2
S200
MGA
Grok2
2
071608 08:55:07 RX2 LOW CRM –QUALITY EXC
LVL
LVL
Level 1 Overview – “At-A-Glance Status”
PSOAUTO
76.8 MPH76.088.5 %
Main Feed
Main Feed MPH
72.0
80.0
-60 -30-90 2 Hours
PSOAUTO
11.9 MPH12.022.3 %
Additive 1
Additive 1 MPH
10.0
14.0
-60 -30-90 2Hours
PSOAUTO
4.0 MPH4.0
44.3 %
Additive 2
Additive 2 MPH
2.0
6.0
-60 -30-90 2 Hours
VENT SYS
Analysis: Purity %
32.0
40.0
-60 -30-90 2 Hours
Analysis: Inhibitor Concentration %
4.0
6.0
-60 -30-90 2 Hours
AgitatorON
Reactor M5
Pump 1RUNNING
PSOAUTO
95.044.3 %
M5 Pressure98.0 psig
PSOAUTO
70.054.3 %
M5 Level %71.0 %
ThioniteProduct: Mid-Run
52.3 %
5.0 %
CoolantFlow
CoolantTemp
PSOAUTO
45.054.3 %
M5 Temp45.0 °C
To Coils
COOLING SYS
92.0 MPHPRODUCT
Temperature °C
40.0
48.0
-60 -30-90 2 Hours
Diagnostics1-OK
Pumps
Needed 1
SHUTDOWN
M5
Run Plan:Actual:
FREEZEM5
IN
Reset
OUT
Calc Diff:
-10%
+10%
Hours: 238.1Since:
State:
19707 19301
Material Balance
2.1 %
06/02/07 14:00:00
ISOLATEM5
Pump 2STOPPED2-BAD
M4MainMenu
- Level 3 -
M5 Interlocks
FeedSystem
Product Recovery
Level 1 ReactionOverview
M5 Sequence Overlay
PurgeRate
ConversionEfficiency
Cat.Activity
Reserve Capacity
M5 StartupOverlay
M6
- Level 3 -
M5 Cooling System
Feed Components: A - B - C
+/- 5 psi, 2hr
+/- 1 %, 2hr
Trend Control
4
Level 2 Process Unit Control
Level 3 Process Unit Detail
PSOAUTO
76.8 MSCFH76.088.5 %
Flow Demand
RUNNING
PSOCAS
90.090.0 %
WC Speed
65.0 °C
West Comp Discharge Temp °C
40.0
50.0
-60 -30-90 2 Hours
East Comp
MainMenu
OHSystem
Product Recovery
CompressionLevel 2
West Sequence
Overlay
West Startup
Overlay
Comp
Cooling System
Trend Control
1st
Stage
2nd
Stage
CW
32.0 °C
20.0 °C
28.0 °C
WESTCOMP
OH
44.0 °C
90.8 %
48.0 psi
90.0 psi
1 Stgpsi
EAST COMP
Speed
90.8
20.1 psiEAST COMP
2 Stgpsi
48.090.0
SHOW / HIDE VALUES
CLRIn
SPEED CASCADEIN EFFECT
CLROut
NORMALIZESCALE
65.0 32.0
WindingTemp
111.0 °C
111.0
West Compressor Interlock W-1
Overspeed
Or Winding Temp High
Or Vibration High
Or 1 Stg High Pres
Or 2 Stg High Press
Or Suction Pres Low
Or Oil Pres Low
Initiator ActionValue Status
OK
OK
OK
OK
OK
OK
OK
Shut Down West Comp
AND
Close Inlet &
Outlet Block ValvesAND
Override East Comp Speed to 100%
West Comp Flow MSCFH
45.0
55.0
-60 -30-90 2 Hours
48.4 MSCFH
West Comp Speed %
85.0
95.0
-60 -30-90 2 Hours
SHUTDOWN
WESTCOMP
- Level 4 -Procedures
RECOVERY
IDLEWEST
COMP
PURGEWEST
COMP
West Compressor
7 Steps for Creating High Performance Displays
Step 1: Develop a High Performance HMI Philosophy
and Style Guide
Step 2: Assess and benchmark existing graphics against
the HMI Philosophy
Step 3: Determine specific performance and goal objectives
for the control of the process, for all modes
of operation
Step 4: Perform task analysis to determine the control manipulations
needed to achieve the performance and goal objectives
Step 5: Design and build high performance graphics, using the design
principles in the HMI Philosophy and elements from the Style
Guide, to address the identified tasks
Step 6: Install, commission, and provide training on the new HMI
Step 7: Control, maintain, and periodically reassess the HMI performance
Step 1: Philosophy and Style Guide
• Philosophy: the overall principles for
creating the HMI– Philosophy includes information about the
consoles and control room practices.
• Style Guide: The DCS and site-specific
collection of graphic elements , indicators,
sub-pictures, trend objects, templates, and
other specific graphic parts to be used
consistently in creating the HMI
• Experience has shown that without a
philosophy and style guide, graphics will
usually be created inconsistently and
improperly.
High Performance HMI Philosophy Example Table of Contents
Note: All sub-sections are not shown.
1.0 Introduction
1.1 Purpose and Use of a High Performance HMI Philosophy
1.2 The HMIs Purpose and Functions
1.3 Functional Description of HMI Elements
1.3.1 Display Content
1.3.2 Display Layout
1.3.3 Display Hierarchy
1.3.4 Display Navigation
1.3.5 Alarm Depiction and Alarm Management
2.0 HMI Design Process (considerable detail in this section)
3.0 Purpose and use of an HMI Style Guide and Object Library
3.1 DCS Specificity
3.2 Object Library Contents and Usage
4.0 HMI Performance Monitoring
5.0 HMI Management of Change (MOC)
6.0 Control Room
6.1 Control Room Design Factors
6.2 Control Room Work Practices
6.3 Operator Console Design
6.4 Operator Work Practices
A detailed and comprehensive document!
Step 2: HMI Performance Assessment
Evaluate existing HMIs vs. High Performance Principles and
Best Practices
Criteria:
– HMI information during normal conditions.
– HMI information for effectively monitoring abnormal or upset conditions.
– Control room interruptions and distractions by non-essential personnel
– Operator tasks during upset or abnormal conditions.
– HMI compliance to best practices
– Proper Alarm Management
A 100-item questionnaire for use in assessment is included in The High Performance HMI Handbook
F
D
C
B
A
Step 3: Determine Performance and Goal Objectives for
………….Process Control
This is rarely done!
Performance and goal objectives should be determined for factors such as:
– Process Safety
– Efficiency
– Equipment health
– Production cost
– Catalyst life
– Environmental
– Qaulity
Different operating modes may have different goals (startup, partial rate, alternative feedstocks, products, etc…)
Performance against goals must be depicted on the HMI
Step 3: Determine Performance and Goal Objectives for
Process Control
Example performance and goal objectives:
Mode: Full Rates Product “A” – Example Performance & Goal Objectives
Overhead Purity >99.2% Production rate 36,000 lb/hr average on a daily basis Energy usage <42 MMBTU/Hr Overhead Pressure between 220 psig and 230 psig Vent to flare: zero flow Recycle compressor vibration and bearing temperatures within limits Overall column tray differential pressure < 62 in.H2O Sidedraw purity > 88%
Example: Refining System Modes of Operation
Full Rates Product “A” Full Rates Product “B” End-of-Run Cleanup Empty - Standby
Step 4: Task Analysis
• For a task analysis, the operator needs:
– Information
– Controls
– Operations
– Communications
• Typical tasks include:
– Controller setpoint and mode manipulation
– Digital (on-off) point manipulation (pumps, fin-fan banks, compressor loading,
valve switching, etc.)
– Activation and monitoring of advanced control schemes or programmatic controls
– Observation of lab results
– Direction of outside operators to perform non-automated tasks
– Interaction with daily production planning goals & changes
– Troubleshooting
– Abnormal Situation response
Performance of Operator Tasks
Accomplishment of Performance
Objectives
Step 4: Task Analysis
Example output of
Step 4 is used to
determine the graphic
content for each
hierarchy level
Full Rates Product “A” – Necessary Level 2 Display Control Indications & Manipulations
Indicator Type (from Style Guide)
Range
Overhead Analyzer Product Purity
Main Display Trend #1
Desired purity range is 98% - 100%. Default time scale 2 hrs.
Production rate Main Display Trend #1
Scale 30,000 to 40,000 lb/hr.
Calculated hourly energy usage in MMBTU/Hr.
Vertical Scale Good: 40 to 42. Poor: 42 to 50.
Overhead Pressure Vertical Scale 220 psig to 230 psig. Shutdown at 300.
Vent to flare Vertical Scale Zero flow is normal. Scale to 5,000 lb/hr with auto-rescale when exceeded
30 to 70 in.H2O, alarm above 62. Default time scale 2 hrs.
Sidedraw purity > 18% Main Display Trend #2
10% to 25% range, bad below 18%. Time scale 2 hrs.
Column Pressure Controller PC2011-1
Standard Controller block
Column Level Controller LC-2011-2
Standard Level depiction
Reflux pump Start/Stop HS-2011-3
Standard Digital Controller
Base pump Start/Stop HS-2011-4
Standard Digital Controller
Recycle compressor function
Radar plot of multiple items
See separate list in the compressor specification
Sidedraw sep. level Std. Level depiction
Mode: Full Rates Product “A” – Example Performance & Goal Objectives
Overhead Purity >99.2% Production rate 36,000 lb/hr average on a daily basis Energy usage <42 MMBTU/Hr Overhead Pressure between 220 psig and 230 psig Vent to flare: zero flow Recycle compressor vibration and bearing temperatures within limits Overall column tray differential pressure < 62 in.H2O Sidedraw purity > 88%
Example: Refining System Modes of Operation
Full Rates Product “A” Full Rates Product “B” End-of-Run Cleanup Empty - Standby
PSOAUTO
76.8 MPH76.088.5 %
Main Feed
Main Feed MPH
72.0
80.0
-60 -30-90 2 Hours
PSOAUTO
11.9 MPH12.022.3 %
Additive 1
Additive 1 MPH
10.0
14.0
-60 -30-90 2Hours
PSOAUTO
4.0 MPH4.0
44.3 %
Additive 2
Additive 2 MPH
2.0
6.0
-60 -30-90 2 Hours
VENT SYS
Analysis: Purity %
32.0
40.0
-60 -30-90 2 Hours
Analysis: Inhibitor Concentration %
4.0
6.0
-60 -30-90 2 Hours
AgitatorON
Reactor M5
Pump 1RUNNING
PSOAUTO
95.044.3 %
M5 Pressure98.0 psig
PSOAUTO
70.054.3 %
M5 Level %71.0 %
ThioniteProduct: Mid-Run
52.3 %
5.0 %
Coolant
Flow
Coolant
Temp
PSOAUTO
45.054.3 %
M5 Temp45.0 °C
To
Coils
COOLING SYS
92.0 MPHPRODUCT
Temperature °C
40.0
48.0
-60 -30-90 2 Hours
Diagnostics1-OK
Pumps
Needed 1
SHUTDOWN
M5
Run Plan:Actual:
FREEZE
M5
IN
Reset
OUT
Calc Diff:
-10%
+10%
Hours: 238.1Since:
State:
19707 19301
Material Balance
2.1 %
06/02/07 14:00:00
ISOLATEM5
Pump 2STOPPED2-BAD
M4MainMenu
- Level 3 -
M5 Interlocks
FeedSystem
Product Recovery
Level 1
ReactionOverview
M5
Sequence Overlay
Purge
Rate
Conversion
Efficiency
Cat.
Activity
Reserve
Capacity
M5
StartupOverlay
M6
- Level 3 -
M5 Cooling System
Feed Components: A - B - C
+/- 5 psi, 2hr
+/- 1 %, 2hr
Trend Control
4
This sounds easy….
Step 6: Install, Commission, And Provide Training On The New
Displays
Implementation and training issues can
be complex - thoroughly covered in
the HMI Handbook
Some example topics for operator
training:
– DCS operating procedures (refresher)
– Aspects of the High Performance HMI Philosophy relevant to operations
– The reasons the HMI was changed and the expected benefits
– Features of the DCS and HMI alarm presentation, annunciation, and management
– Navigation in the High Performance HMI
– Use of trends
– The HMI’s progressive hierarchy
– Graphics for specific situations (such as rate changes, product changes, and shutdowns)
– Changes from the old graphics and proper use of the new graphics
? ??
??
?
Step 7: Control, Maintain, and Periodically Reassess
the HMI Performance
– Operator Surveys
– On-going HMI suggestion system
– Specific HMI performance review after production upsets,
incidents, and accidents
Summary
• Poor HMIs have been cited as contributing factors to incidents and accidents
• Poor HMI practices are common
• Proper HMIs are an important success factor
• A High Performance HMI is practical and achievable.