Page 1
Kasetsart J. (Nat. Sci.) 38 : 157 - 178 (2004)
Properties Enhancement of Short-Glass-Fiber ReinforcedThermoplastics by Sandwich Injection Molding Technique
Somjate Patcharaphun1 and Günter Mennig2
ABSTRACT
This article demonstrates the possibility of using sandwich injection molding in order to improve
the mechanical properties of short-glass-fiber-reinforced thermoplastic by investigating the effect of fiber
orientation, compared with conventional injection molding. The effects of short-glass-fiber content
within skin and core materials, in the present case PP, varying from 0 to 40 wt % were studied. The results
showed an increase in the maximum tensile stress and impact strength as the concentration of the short-
glass-fiber was increased. The mechanical properties of sandwich moldings were observed to be slightly
higher than conventional injection moldings, which is attributed to the higher fiber orientation and lesser
voids within the core layer. The effect of different processing types on the phase distribution of short-
glass-fibers showed no significant phase separation effects between sandwich and conventional injection
molding processes, except when using of sandwich injection process with different materials. The results
obtained by analyzing the fiber attrition inside the skin and core regions in the longitude direction of
tensile specimens showed that the degree of fiber degradation inside the skin layers were higher than the
core layers and there are only minor differences in fiber length inside skin regions observed between
sandwich and conventional injection molding processes, whilst this effect being more pronounced in the
core regions and for the higher fiber volume fraction. The theoretically calculated values of the ultimate
tensile stress (UTS) were found to be considerably higher than the experimental values. However, a more
realistic estimation of UTS can be achieved by using measured values for fiber length within skin and core
layers.
Key words: sandwich injection molding, fiber orientation, fiber length distribution, short-glass-fiber,
mechanical properties
INTRODUCTION
At present, the use of composite materials
in industry is well accepted and increasing every
years. Both thermoset and thermoplastic polymers
are used in combination with glass fibers (chopped
strand, continuous, etc.). The main advantage of
composites over steel is higher strength to weight
1 Department of Material Engineering, Faculty of Engineering, Kasetsart University, Bangkok 10900, Thailand.
2 Institut für Allgemeinen Maschinenbau und Kunststofftechnik, Techniche Universität Chemnitz, Chemnitz 09107, Germany.
ratio and remarkably enhanced physical properties
when compared with pure polymer products. The
other benefits are ease of processing, design
freedom, high impact and corrosion resistance.
Recently, thermoplastic composites play
an important role because of their greater ductility
and processing speed, as compared to thermosets.
They are frequently used as matrices of short-
Page 2
158 Kasetsart J. (Nat. Sci.) 38 (6)
fiber-reinforced thermoplastics (SFRT). Although
SFRT do not achieve the characteristic mechanical
values which can be obtained by long-fiber
reinforcement (Thomson, 2002; Regan et al., 1995.)
but they can still be processed in convenient way
and their excellent price/property ratio, e.g. by
using the injection molding of these composites
for the high volume production purposes, complex
shapes, and lower manufacturing costs.
Furthermore, their intrinsic recyclability is rapidly
being recognized as a strong driving force for their
further application (Clegg, 1994). However, the
properties of short-fiber-reinforced thermoplastics
are posing a problem of fiber orientation depending
on processing conditions such as velocity, pressure,
temperature, and by mold design such as gating,
inserts and section thickness (Akay and Barkley,
1985; Gupta dnd Wang, 1993.) as schematically
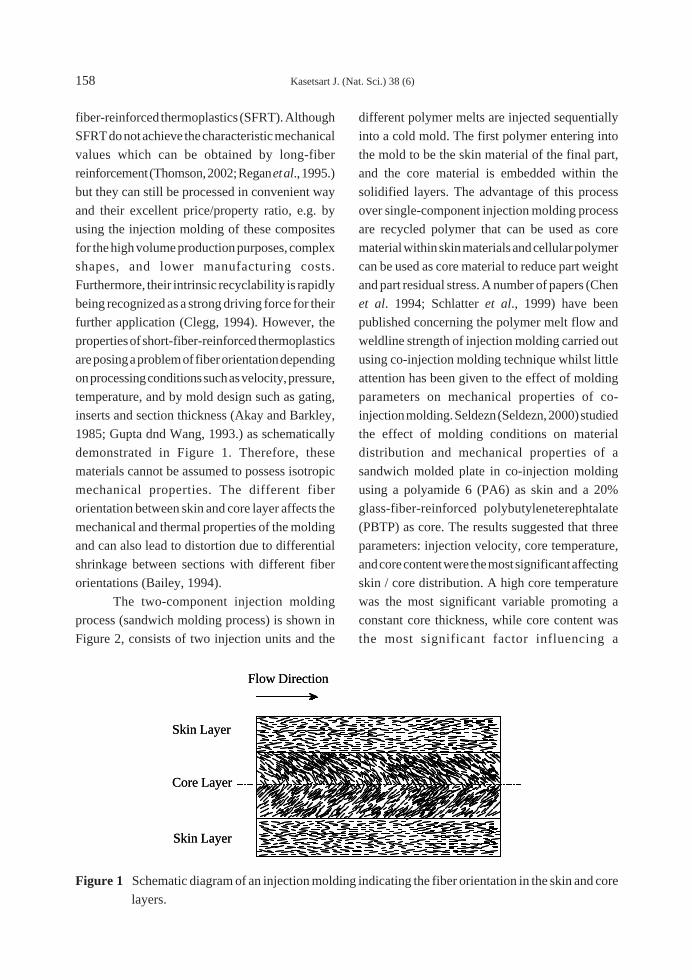
demonstrated in Figure 1. Therefore, these
materials cannot be assumed to possess isotropic
mechanical properties. The different fiber
orientation between skin and core layer affects the
mechanical and thermal properties of the molding
and can also lead to distortion due to differential
shrinkage between sections with different fiber
orientations (Bailey, 1994).
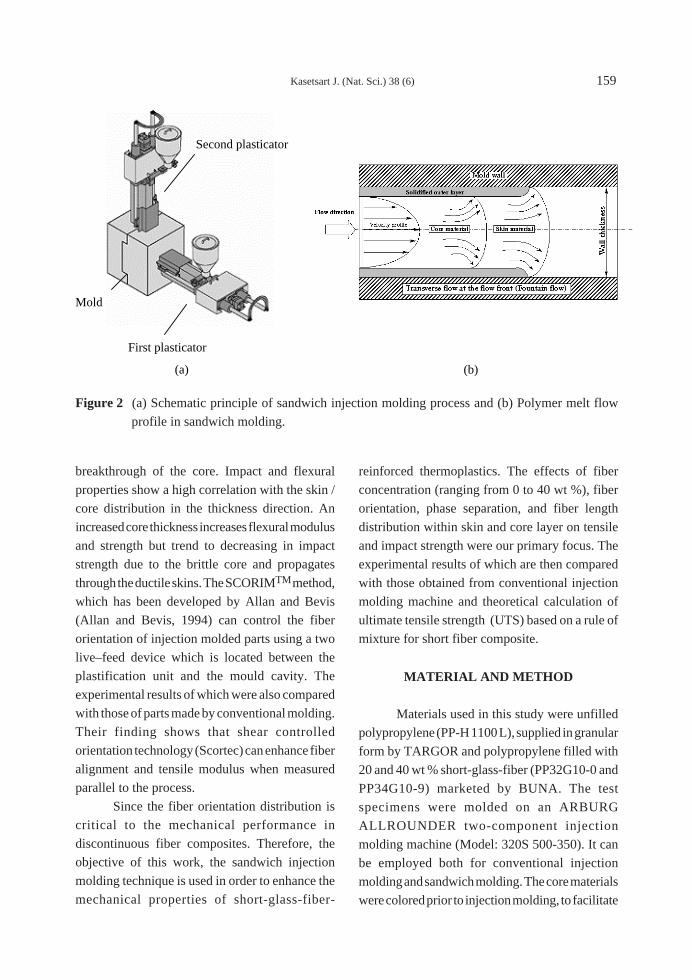
The two-component injection molding
process (sandwich molding process) is shown in
Figure 2, consists of two injection units and the
different polymer melts are injected sequentially
into a cold mold. The first polymer entering into
the mold to be the skin material of the final part,
and the core material is embedded within the
solidified layers. The advantage of this process
over single-component injection molding process
are recycled polymer that can be used as core
material within skin materials and cellular polymer
can be used as core material to reduce part weight
and part residual stress. A number of papers (Chen
et al. 1994; Schlatter et al., 1999) have been
published concerning the polymer melt flow and
weldline strength of injection molding carried out
using co-injection molding technique whilst little
attention has been given to the effect of molding
parameters on mechanical properties of co-
injection molding. Seldezn (Seldezn, 2000) studied
the effect of molding conditions on material
distribution and mechanical properties of a
sandwich molded plate in co-injection molding
using a polyamide 6 (PA6) as skin and a 20%
glass-fiber-reinforced polybutyleneterephtalate
(PBTP) as core. The results suggested that three
parameters: injection velocity, core temperature,
and core content were the most significant affecting
skin / core distribution. A high core temperature
was the most significant variable promoting a
constant core thickness, while core content was
the most significant factor influencing a
Flow Direction
Skin Layer
Core Layer
Skin Layer
Flow Direction
Skin Layer
Core Layer
Skin Layer
Figure 1 Schematic diagram of an injection molding indicating the fiber orientation in the skin and core
layers.
Page 3
Kasetsart J. (Nat. Sci.) 38 (6) 159
breakthrough of the core. Impact and flexural
properties show a high correlation with the skin /
core distribution in the thickness direction. An
increased core thickness increases flexural modulus
and strength but trend to decreasing in impact
strength due to the brittle core and propagates
through the ductile skins. The SCORIMTM method,
which has been developed by Allan and Bevis
(Allan and Bevis, 1994) can control the fiber
orientation of injection molded parts using a two
live–feed device which is located between the
plastification unit and the mould cavity. The
experimental results of which were also compared
with those of parts made by conventional molding.
Their finding shows that shear controlled
orientation technology (Scortec) can enhance fiber
alignment and tensile modulus when measured
parallel to the process.
Since the fiber orientation distribution is
critical to the mechanical performance in
discontinuous fiber composites. Therefore, the
objective of this work, the sandwich injection
molding technique is used in order to enhance the
mechanical properties of short-glass-fiber-
reinforced thermoplastics. The effects of fiber
concentration (ranging from 0 to 40 wt %), fiber
orientation, phase separation, and fiber length
distribution within skin and core layer on tensile
and impact strength were our primary focus. The
experimental results of which are then compared
with those obtained from conventional injection
molding machine and theoretical calculation of
ultimate tensile strength (UTS) based on a rule of
mixture for short fiber composite.
MATERIAL AND METHOD
Materials used in this study were unfilled
polypropylene (PP-H 1100 L), supplied in granular
form by TARGOR and polypropylene filled with
20 and 40 wt % short-glass-fiber (PP32G10-0 and
PP34G10-9) marketed by BUNA. The test
specimens were molded on an ARBURG
ALLROUNDER two-component injection
molding machine (Model: 320S 500-350). It can
be employed both for conventional injection
molding and sandwich molding. The core materials
were colored prior to injection molding, to facilitate
(a)
Mold
First plasticator
(b)
Second plasticator
Figure 2 (a) Schematic principle of sandwich injection molding process and (b) Polymer melt flow
profile in sandwich molding.
Page 4
160 Kasetsart J. (Nat. Sci.) 38 (6)
identification of the interface between the two
materials. Levels for injection speed and skin/core
volume ratio were chosen by trial and error such
as: the injection speed of first plasticator (skin
material) should be high in order to achieve a good
surface finish and to prevent premature
solidification of the melt (Zoltex, 2000) whereas,
lower injection speed of second plasticator (core
material) was used to assess the uniform core
extension along the flow direction without the
breakthrough of the core material at the far end of
the bar (Schlatter et al., 1999; Seldezn, 2000).
Several settings were tried and those leading to an
overall satisfying quality with regard to visual
properties were finally chosen, as shown in Figure
3. All the specimens were molded only after the
machine had attained steady state with respect to
the preset melt and mold temperatures. The mold
temperature was 55∞C and the five heating zones
(from nozzle to feed zone) were set to 250∞C, 240∞C, 230∞C, 220∞C, and 210∞C, respectively. The
processing parameters were summarized in Table
1 and the experimental outlines for investigating
of single and sandwich molding specimens,
containing different short-glass-fiber contents
between skin and core materials, are given in
Table 2.
The molded tensile specimens were tested
on Zwick 1464 mechanical tester at a crosshead
speed of 5 mm/min for a sample gage length of 50
mm, according to the recommendation of DIN EN
ISO 527-1/1A/5. For each molding condition, five
dumbbell-shaped specimens were tested and the
average values of the maximum tensile stress were
used for analysis.
Charpy impact tests were conducted on a
CEAST impact tester model 6545 using the
specimens with a V-notch. The tests were carried
out with impact energy of 1 Joule and a sample
span length of 80 mm, referring to the standard of
DIN EN ISO 179/1 e A. The average values of
notched impact strength (kJ/m2) were obtained
again from group of five specimens.
The fiber orientation distribution and area
(a)
(b)
22.2 ccm/s 14.8 ccm/s 8.88 ccm/s 4.44 ccm/s
The uniformcore material
The exceed ofcore material(Breakthrough)The lack of core material
(c)
X
Y
ZFlow direction
Longitudinal area
Cross-sectional area
Mid-plane area
The core melt front with and withoutbreakthrough at the end of the bar
Figure 3 (a) Isochrones in sandwich injection molded short shots at different times, (b) Flow patterns
in the region of the far end of the tensile bar at different injection flow rates of core material,
and (c) Location of cross-sectional and longitudinal areas for this investigation.
Page 5
Kasetsart J. (Nat. Sci.) 38 (6) 161
fraction between skin and core layers were assessed
by OLYMPUS model PMG3 optical microscopy
and computer aided image analysis (a4i Analysis
version 5.1 and Image-Pro Plus). The specimens
for the observation of fiber orientation were
obtained from tensile test piece by cutting at the
center of the specimen, as illustrated in Figure 2
(c), and mounting the section of parts on a stage,
which were then polished by a metallurgical
polishing technique. The average fiber orientation
factor, fp in the skin and core regions (fps and fpc,
respectively) were calculated using equations 1a
and 1b (Karger - Koscis, 1989).
fp = 2·cos2 jÒ –1 (1a)
cos
cos2
2 2
jj j
j=
( ) ( )( )
Â
Â
N
Ni
i i
ii
(1b)
where ji is the angle between the individual
fibers and local flow direction, and N(ji) is the
number of fibers with a certain angle ji to the local
flow direction. This orientation function takes
values between –1 when all the fibers are
Table 1 Processing conditions.
Conditions Single molding Sandwich molding
1st-plasticator 2nd-plasticator
Injection pressure (bar) 1000 1000 1000
Holding pressure (bar) 800 - 800
Holding time (sec) 10.8 - 10.8
Back pressure (bar) 60 60 60
Cooling time (sec) 36 - 36
Injection flow time (sec) 0.80 0.80 3.0
Screw speed (m/min) 12 12 12
Injection volume (ccm), (%) 37 (100%) 14.8 (40%) 22.2 (60%)
Table 2 Experimental outlines in this study.
No. Single molding Sample code
1 PP PP
2 PP+SGF 20 wt% SFRPP20
3 PP+SGF 40 wt% SFRPP40
Sandwich molding Sample code
Skin material Core material (Skin/Core)
4 PP+SGF 20 wt% PP SFRPP20/PP
5 PP PP+SGF 20 wt% PP/SFRPP20
6 PP+SGF 20 wt% PP+SGF 20 wt% SFRPP20/SFRPP20
7 PP+SGF 40 wt% PP SFRPP40/PP
8 PP PP+SGF 40 wt% PP/SFRPP40
9 PP+SGF 40 wt% PP+SGF 20 wt% SFRPP40/SFRPP20
10 PP+SGF 40 wt% PP+SGF 40 wt% SFRPP40/SFRPP40
Page 6
162 Kasetsart J. (Nat. Sci.) 38 (6)
perpendicular to the flow and 1 when all the fibers
are parallel to the flow. In the case of random
orientation, the value is 0.
For the investigation of fiber length within
skin and core layer, the tensile specimen were cut
into seven pieces, as indicated in Figure 4 and the
separation of skin and core materials were utilized
by microtome technique. Short-glass-fibers were
then isolated from the composite materials by
pyrolysis at the temperature of 650∞C in a muffle
furnace for about 1 hour. Ash of fibrous material
was left and some fibers were extracted from the
sample ash and dispersed on a rectangular glass
plate. The plate was placed on the observation
stage of a microscope. Magnified fiber images
were transmitted to a suitable magnification (¥50),
and fiber images were then semi-automatically
digitized by Image-Pro Plus software with a PC.
The fiber length distributions (FLD) were
determined by number-average fiber lengths which
calculated from a minimum of 500 length
measurements on fibers recovered from
incineration of subdivision parts and individual
layers. The percentage of the differences between
a number-average fiber length of pellets and the
overall glass fiber length inside the molded part
(%Dl ) was used to describe the results, which can
be considered using the following equation:
%Dll l
lj G
G=
-È
ÎÍ
˘
˚˙ ¥ 100 (2)
with lG being the number-average fiber
length inside the granule and lj is the local fiber
length inside the individual layers (skin and core
layers) of sectioned parts
The phase separation analysis of sandwich
and single molding processes were determined
using a burning-off method according to DIN EN
60. The same subdivision as shown in Figure 4 was
selected. The statistical calculation and the
experimental procedure were employed in
accordance with the work carried out by Hegler et
al. [24]. The percentage of the differences between
the local filler concentration of sectioned part and
the overall glass content inside the molded part
(%DMj ) was used to illustrate the results, which
can be determined using the following equation:
%DMM M
Mjj tot
tot=
-È
ÎÍ
˘
˚˙ ¥ 100 (3)
where Mj is the local filler content and Mtot
is the average total mass of specimen, which is
calculated by Equation 2.
Figure 4 Subdivision of dumbbell specimen for fiber length measurement and phase distribution
analysis.
Page 7
Kasetsart J. (Nat. Sci.) 38 (6) 163
Mn
m
mjtot
Gj
Pj
i
n=
È
Î
ÍÍÍÍ
˘
˚
˙˙˙˙
Â
ÂÂ17, , = 1,KK (4)
where mP is the weight of specimen prior to
burning off, mG is the weight of the remaining
glass, and is the number of samples (n ≥ 5).
RESULTS AND DISCUSSION
Fiber Orientation DistributionSingle molding and a simple type of mold
cavity were considered to study fiber orientation
distribution. The skin and the core were easily
observed in longitudinal direction to the flow in
the skin and a perpendicular orientation to the skin
in the core. This has been observed also in other
studies (Gogos et al., 1986; Akay and Barkley,
1991; Gupta and Wang, 1993; Allan and Bevis,
1994). In the skin region, the fiber orientation is
predominately along the flow direction due to the
elongational forces developed during fountain flow
at the front and the shear flow after the front has
passed (Gogos et al., 1986; Tadmor, 1974). In
contrast, the core region consists of random-in-
plane fiber alignment caused by differential
solidification, shearing, and melt-flow patterns
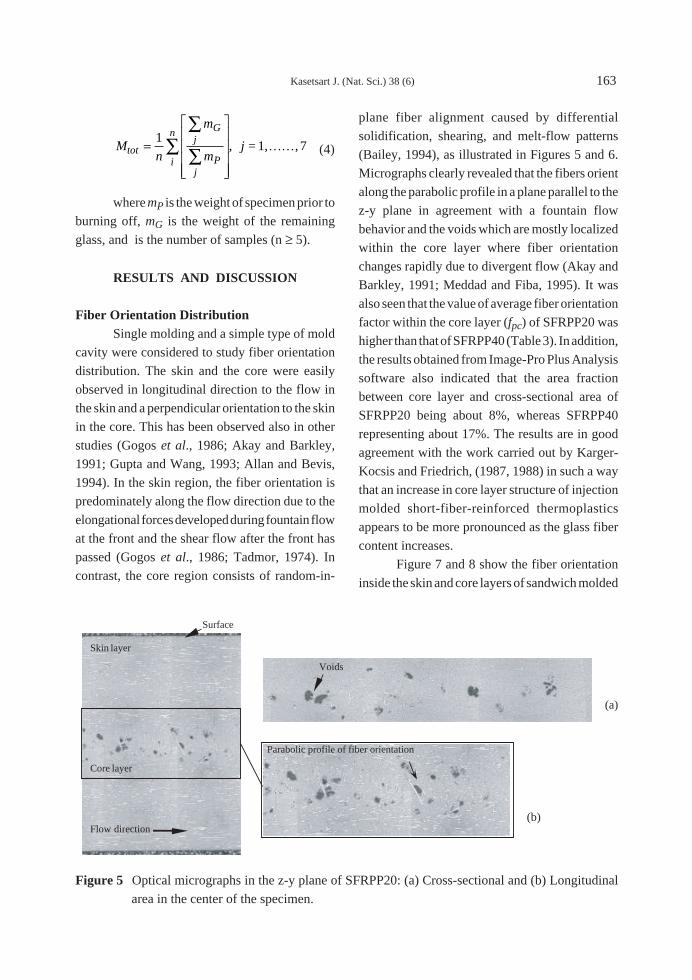
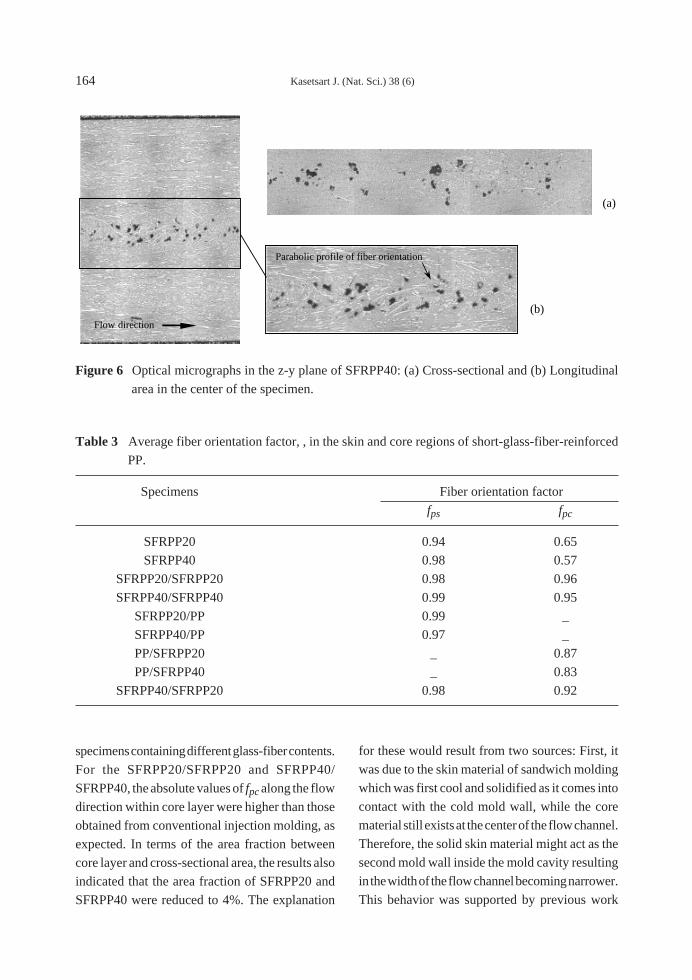
(Bailey, 1994), as illustrated in Figures 5 and 6.
Micrographs clearly revealed that the fibers orient
along the parabolic profile in a plane parallel to the
z-y plane in agreement with a fountain flow
behavior and the voids which are mostly localized
within the core layer where fiber orientation
changes rapidly due to divergent flow (Akay and
Barkley, 1991; Meddad and Fiba, 1995). It was
also seen that the value of average fiber orientation
factor within the core layer (fpc) of SFRPP20 was
higher than that of SFRPP40 (Table 3). In addition,
the results obtained from Image-Pro Plus Analysis
software also indicated that the area fraction
between core layer and cross-sectional area of
SFRPP20 being about 8%, whereas SFRPP40
representing about 17%. The results are in good
agreement with the work carried out by Karger-
Kocsis and Friedrich, (1987, 1988) in such a way
that an increase in core layer structure of injection
molded short-fiber-reinforced thermoplastics
appears to be more pronounced as the glass fiber
content increases.
Figure 7 and 8 show the fiber orientation
inside the skin and core layers of sandwich molded
Voids
(b)
(a)
Flow direction
Skin layer
Core layer
Surface
Parabolic profile of fiber orientation
Figure 5 Optical micrographs in the z-y plane of SFRPP20: (a) Cross-sectional and (b) Longitudinal
area in the center of the specimen.
Page 8
164 Kasetsart J. (Nat. Sci.) 38 (6)
(b)
(a)
Flow direction
Parabolic profile of fiber orientation
Table 3 Average fiber orientation factor, , in the skin and core regions of short-glass-fiber-reinforced
PP.
Specimens Fiber orientation factor
fps fpc
SFRPP20 0.94 0.65
SFRPP40 0.98 0.57
SFRPP20/SFRPP20 0.98 0.96
SFRPP40/SFRPP40 0.99 0.95
SFRPP20/PP 0.99 _
SFRPP40/PP 0.97 _
PP/SFRPP20 _ 0.87
PP/SFRPP40 _ 0.83
SFRPP40/SFRPP20 0.98 0.92
Figure 6 Optical micrographs in the z-y plane of SFRPP40: (a) Cross-sectional and (b) Longitudinal
area in the center of the specimen.
specimens containing different glass-fiber contents.
For the SFRPP20/SFRPP20 and SFRPP40/
SFRPP40, the absolute values of fpc along the flow
direction within core layer were higher than those
obtained from conventional injection molding, as
expected. In terms of the area fraction between
core layer and cross-sectional area, the results also
indicated that the area fraction of SFRPP20 and
SFRPP40 were reduced to 4%. The explanation
for these would result from two sources: First, it
was due to the skin material of sandwich molding
which was first cool and solidified as it comes into
contact with the cold mold wall, while the core
material still exists at the center of the flow channel.
Therefore, the solid skin material might act as the
second mold wall inside the mold cavity resulting
in the width of the flow channel becoming narrower.
This behavior was supported by previous work
Page 9
Kasetsart J. (Nat. Sci.) 38 (6) 165
carried out by Akay and Barkley (1991) and
Pechulis and Vautour (1997), dealing with the
core thickness and the presence of voids which
increased with increasing the thickness of molding
which significantly divergent flow occurring in
the mold cavity. Second, the slower the injection
speed of the second material, the higher the
thickness of solid layer formed during the filling
stage, which restricts the cross-sectional area
available for the flowing melt. This leads to a
higher velocity gradient that tends to increase the
orientation at the adjacent melt layer. Theses
observations are also in accordance with those of
Gupta and Wang (1993) as well as Gerard et al.
(1998) in that the increasing the thickness of cold
boundary layer, fibers at the mid-plane become
more flow-aligned and the thickness of the core
region decreases.
(a)
(b)Flow direction
Figure 7 Optical micrographs in the z-y plane of SFRPP20/SFRPP20: (a) Cross-sectional and (b)
Longitudinal area in the center of the specimen.
(a)
(b)Flow direction
Figure 8 Optical micrographs in the z-y plane of SFRPP40/SFRPP40: (a) Cross-sectional and (b)
Longitudinal area in the center of the specimen.
Page 10
166 Kasetsart J. (Nat. Sci.) 38 (6)
The photomicrographs of longitudinal
surface of sandwich specimens are illustrated in
Figure 9 (a) through 9 (e). These pictures clearly
indicate that the fibers are highly oriented parallel
to the local flow direction within the skin region,
as presented in Figures 9 (a) to 9 (c). It is interesting
to note that, in the core region, it also can be
observed that the higher degree of fiber orientation
and lesser voids (Figures 9c-e) were thought to be
caused by the shape of the velocity profile and the
thickness of the frozen layer near the wall as stated
earlier.
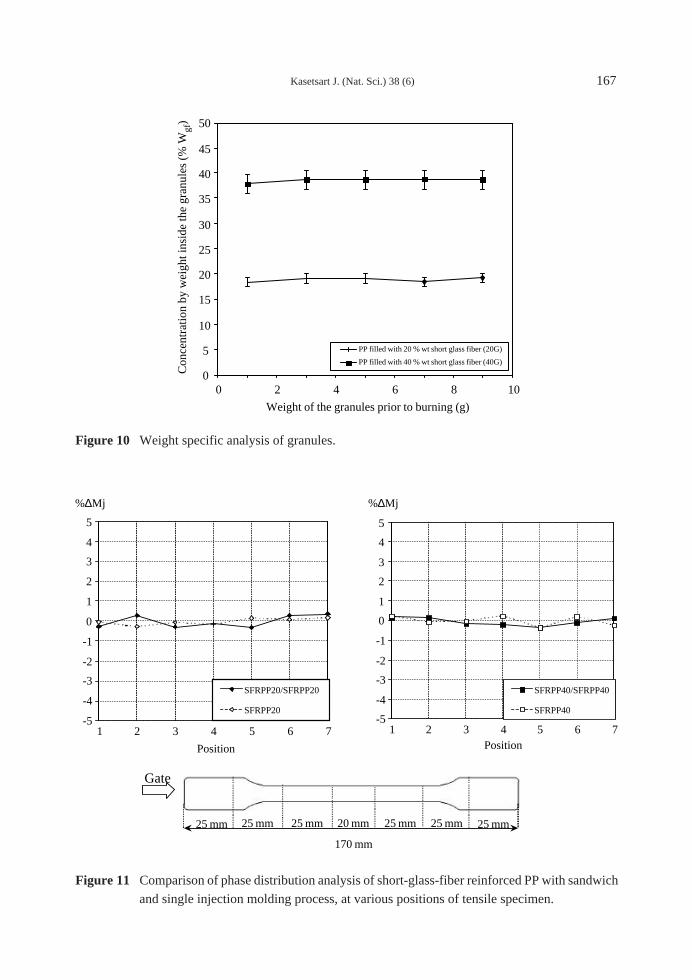
Phase Separation AnalysisFigure 10 shows the change in the percent
by weight of glass-fiber inside the granules (%Wgf)
as a function of the granular loading. It can be seen
that no variation of the Wgf of PP filled with 20 and
40 wt% (20G and 40G) with all case of granular
loading. Hence, it is clearly observed that the
granular loading did not affect the homogeneity of
glass-fiber inside granules, which supplied by
manufacturer (BUNA).
The effect of fiber contents and the effect of
different processing types on the phase distribution
Flow direction Flow direction Flow direction
Flow direction Flow direction
SFRPP20 SFRPP40
SFRPP20
SFRPP40
PPPP
PP PP
SFRPP20 SFRPP40
(a) (b) (c)
(d) (e)
Figure 9 Optical micrographs of longitudinal area (z-y plane) of sandwich specimens: (a) SFRPP20/PP,
(b) SFRPP40/PP, (c) SFRPP400/SFRPP20, (d) PP/SFRPP20, and (e) PP/SFRPP40.
Page 11
Kasetsart J. (Nat. Sci.) 38 (6) 167
0
5
10
15
20
25
30
35
40
45
50
0 2 4 6 8 10
Weight of the granules prior to burning (g)
Con
cent
ratio
n by
wei
ght i
nsid
e th
e gr
anul
es (
% W
gf)
PP filled with 20 % wt short glass fiber (20G)
PP filled with 40 % wt short glass fiber (40G)
Figure 10 Weight specific analysis of granules.
25 mm 25 mm 25 mm 25 mm 25 mm 25 mm20 mm
170 mm
1 2 3 4 5 6 7
Gate
-5
-4
-3
-2
-1
0
1
2
3
4
5
1 2 3 4 5 6 7
Position
%∆Mj %∆Mj
SFRPP20/SFRPP20
SFRPP20-5
-4
-3
-2
-1
0
1
2
3
4
5
1 2 3 4 5 6 7Position
SFRPP40/SFRPP40
SFRPP40
Figure 11 Comparison of phase distribution analysis of short-glass-fiber reinforced PP with sandwich
and single injection molding process, at various positions of tensile specimen.
Page 12
168 Kasetsart J. (Nat. Sci.) 38 (6)
of short-glass-fiber are depicted in Figure 11. The
results clearly evident that the percentage of the
differences between the local filler concentration
of sectioned part and the overall glass content
inside the molded part (%DMj) did not change with
the various short-glass-fiber concentration. The
results agree fairly well with the findings of Hegler
et al. (1987) and Kubat and Szalanezi (1974).
Furthermore, it was also observed that there are no
significant variations of phase separation effects
detectable between the both of sandwich and
conventional injection molding processes.
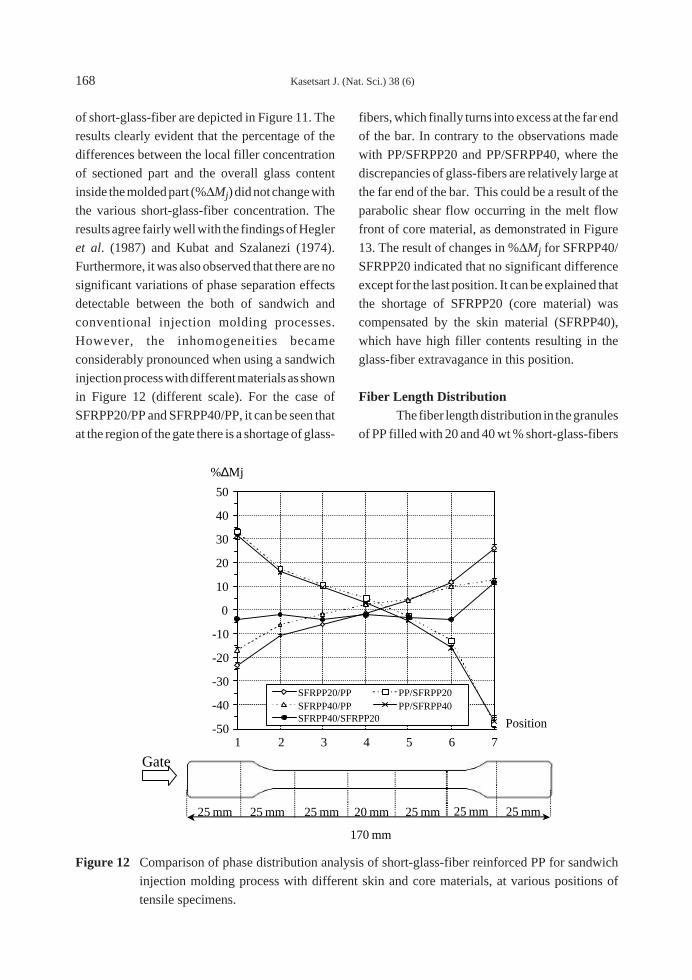
However, the inhomogeneities became
considerably pronounced when using a sandwich
injection process with different materials as shown
in Figure 12 (different scale). For the case of
SFRPP20/PP and SFRPP40/PP, it can be seen that
at the region of the gate there is a shortage of glass-
fibers, which finally turns into excess at the far end
of the bar. In contrary to the observations made
with PP/SFRPP20 and PP/SFRPP40, where the
discrepancies of glass-fibers are relatively large at
the far end of the bar. This could be a result of the
parabolic shear flow occurring in the melt flow
front of core material, as demonstrated in Figure
13. The result of changes in %DMj for SFRPP40/
SFRPP20 indicated that no significant difference
except for the last position. It can be explained that
the shortage of SFRPP20 (core material) was
compensated by the skin material (SFRPP40),
which have high filler contents resulting in the
glass-fiber extravagance in this position.
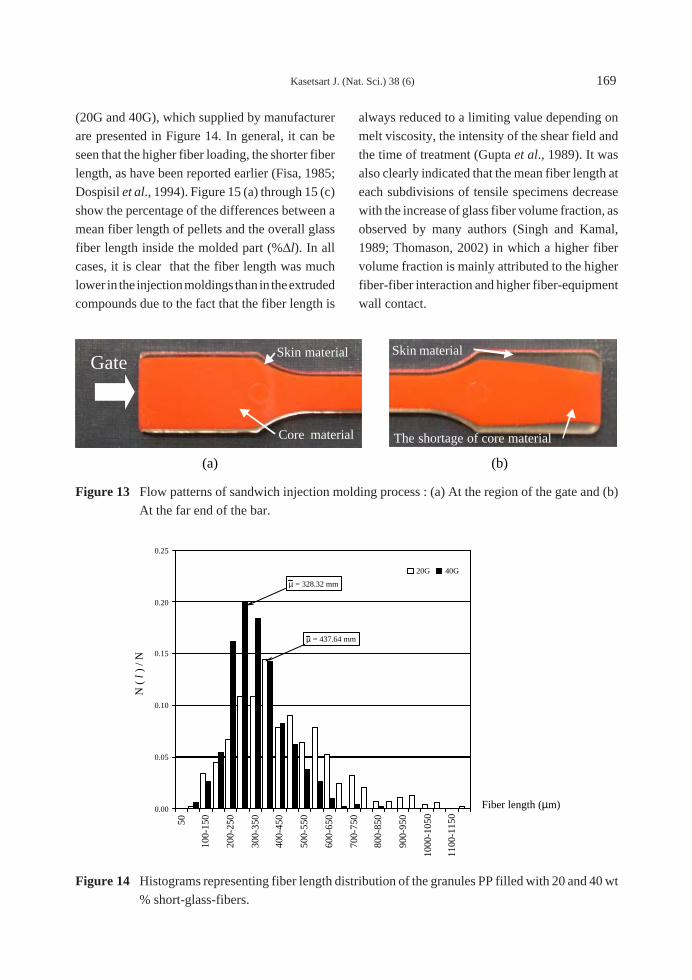
Fiber Length DistributionThe fiber length distribution in the granules
of PP filled with 20 and 40 wt % short-glass-fibers
25 mm 25 mm 25 mm 25 mm 25 mm 25 mm20 mm
170 mm
1 2 3 4 5 6 7
Gate
-50
-40
-30
-20
-10
0
10
20
30
40
50
1 2 3 4 5 6 7
Position
SFRPP20/PP PP/SFRPP20SFRPP40/PP PP/SFRPP40SFRPP40/SFRPP20
%∆Mj
Figure 12 Comparison of phase distribution analysis of short-glass-fiber reinforced PP for sandwich
injection molding process with different skin and core materials, at various positions of
tensile specimens.
Page 13
Kasetsart J. (Nat. Sci.) 38 (6) 169
(20G and 40G), which supplied by manufacturer
are presented in Figure 14. In general, it can be
seen that the higher fiber loading, the shorter fiber
length, as have been reported earlier (Fisa, 1985;
Dospisil et al., 1994). Figure 15 (a) through 15 (c)
show the percentage of the differences between a
mean fiber length of pellets and the overall glass
fiber length inside the molded part (%Dl). In all
cases, it is clear that the fiber length was much
lower in the injection moldings than in the extruded
compounds due to the fact that the fiber length is
always reduced to a limiting value depending on
melt viscosity, the intensity of the shear field and
the time of treatment (Gupta et al., 1989). It was
also clearly indicated that the mean fiber length at
each subdivisions of tensile specimens decrease
with the increase of glass fiber volume fraction, as
observed by many authors (Singh and Kamal,
1989; Thomason, 2002) in which a higher fiber
volume fraction is mainly attributed to the higher
fiber-fiber interaction and higher fiber-equipment
wall contact.
(a) (b)
Gate
Core material
Skin material
The shortage of core material
Skin material
Figure 13 Flow patterns of sandwich injection molding process : (a) At the region of the gate and (b)
At the far end of the bar.
0.00
0.05
0.10
0.15
0.20
0.25
50
100-
150
200-
250
300-
350
400-
450
500-
550
600-
650
700-
750
800-
850
900-
950
1000
-105
0
1100
-115
0
Fiber length (µm)
N (
l )
/ N
20G 40G
µ = 328.32 mm
µ = 437.64 mm
Figure 14 Histograms representing fiber length distribution of the granules PP filled with 20 and 40 wt
% short-glass-fibers.
Page 14
170 Kasetsart J. (Nat. Sci.) 38 (6)
(a) (b)
(c)
25 mm 25 mm 25 mm 25 mm 25 mm 25 mm20 mm
170 mm
1 2 3 4 5 6 7
Gate
-50%
-40%
-30%
-20%
-10%
0%
1 2 3 4 5 6 7
Position
%∆ l
%∆ l
%∆ l
SFRPP20 (Core layer) SFRPP20 (Skin layer)
SFRPP20/SFRPP20 (Core layer) SFRPP20/SFRPP20 (Skin layer)
-50%
-40%
-30%
-20%
-10%
0%
1 2 3 4 5 6 7
Position
SFRPP40 (Core layer) SFRPP40 (Skin layer)
SFRPP40/SFRPP40 (Core layer) SFRPP40/SFRPP40 (Skin layer)
-50%
-40%
-30%
-20%
-10%
0%
1 2 3 4 5 6 7
Position
SFRPP20/PP (Skin layer) SFRPP40/PP (Skin layer)
PP/SFRPP20 (Core layer) PP/SFRPP40 (Core layer)
SFRPP40/SFRPP20 (Core layer) SFRPP40/SFRPP20 (Skin layer)
Figure 15 Fiber length distribution in the skin and the core layers at various positions of tensile
specimens. (a) For single and sandwich molding processes with 20 wt % short-glass-fibers,
(b) For single and sandwich injection molding processes with 40 wt % short-glass-fibers, and
(c) For sandwich injection molding process with different skin and core materials.
Page 15
Kasetsart J. (Nat. Sci.) 38 (6) 171
The data in Figures 15 (a) –15 (c) also
indicated that the fiber attrition inside the skin
layer of injection moldings were higher than in the
core layers. In our experiment, simple molded
geometry, the reduction of fiber length of SFRPP20
in the core layer which was approximated to be 10-
15% and in the skin layer representing about 20-
25%. For the higher fiber volume fraction, the
higher degrees of fiber degradation inside skin and
core layers were found, approximately 30% in the
core layer and 40-45% in the skin layer. However,
these were not the case for this work. Karger-
Kocsis and Friedrich (1987) and Baily and Kraft
(1987) were also found that the skin region of the
molding contained much shorter fibers than the
core region due to a high shear rate near the mold
surface coupled with fiber interacts with the mold
geometry.
With respect to the fiber attrition in the
longitude direction of the bar, it can be observed
from Figures 15 (a) to 15 (c) that the effects of
different processing types and glass-fiber
concentration do not lead to significant changes on
the fiber length reduction along the bar. In all
cases, there were only insignificant differences
between each subdivision. Probably cause by a
simply mold gravity used for this investigation
which has lesser affect on fiber length destruction
along the bar, compared to a complicated geometry
which has greater affect on the fiber attrition. This
was due to the higher injection pressure occurred
during the filling and packing processes (Hegler et
al., 1987.
Additionally, in comparing, the effect of
different processing types on the fiber length inside
the skin and the core regions. From the results
obtained in this work, there are only minor
differences in fiber length inside skin regions
observed between the both of sandwich and
conventional injection molding processes. This
was associated with a high shear rate near the mold
surface and fiber interactions with the mold wall,
as mentioned earlier. However, the effect of
different processing types being more pronounced
in the core region. In comparing the fiber length of
SFRPP20 (Core layer) and SFRPP20/SFRPP20
(Core layer), it was interesting to observe that the
fiber length distribution within the core layer of
sandwich molding was slightly lower than the
values obtained from single molding. For a higher
fiber loading, the different values of fiber length
inside the core region between SFRPP40 (Core
layer) and SFRPP40/SFRPP40 (Core layer)
become larger. The explanation for these would be
not only related to the narrower flow channel, the
higher shear rate occurred during sandwich molding
process but also the higher the fiber loading, the
more frequent are fiber-fiber interactions resulting
in the higher fiber destruction in the core region of
sandwich moldings [56].
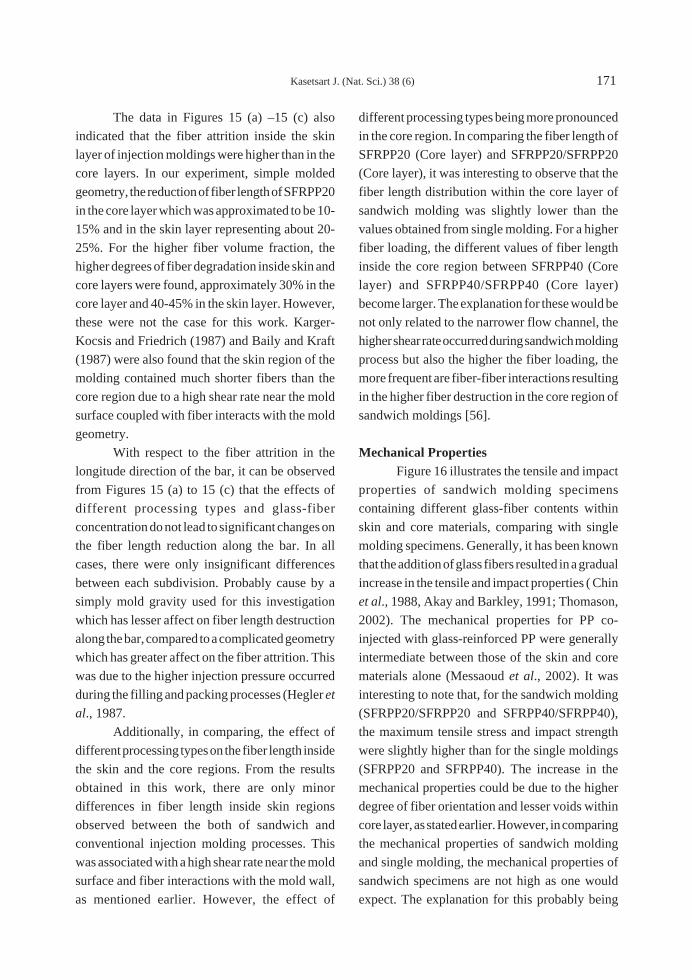
Mechanical PropertiesFigure 16 illustrates the tensile and impact
properties of sandwich molding specimens
containing different glass-fiber contents within
skin and core materials, comparing with single
molding specimens. Generally, it has been known
that the addition of glass fibers resulted in a gradual
increase in the tensile and impact properties ( Chin
et al., 1988, Akay and Barkley, 1991; Thomason,
2002). The mechanical properties for PP co-
injected with glass-reinforced PP were generally
intermediate between those of the skin and core
materials alone (Messaoud et al., 2002). It was
interesting to note that, for the sandwich molding
(SFRPP20/SFRPP20 and SFRPP40/SFRPP40),
the maximum tensile stress and impact strength
were slightly higher than for the single moldings
(SFRPP20 and SFRPP40). The increase in the
mechanical properties could be due to the higher
degree of fiber orientation and lesser voids within
core layer, as stated earlier. However, in comparing
the mechanical properties of sandwich molding
and single molding, the mechanical properties of
sandwich specimens are not high as one would
expect. The explanation for this probably being
Page 16
172 Kasetsart J. (Nat. Sci.) 38 (6)
due to the higher fiber attrition occurred during
sandwich molding process, as mention earlier and
this reduction in fiber length then reduces fiber
reinforcing efficiency.
Comparison of Experimental and TheoreticalResults
It was essential that the experimental results
of maximum tensile stress should be considered
by comparing with those obtained theoretically. In
this work, the theoretical prediction used was
based on a rule-of–mixtures expression for the
ultimate strength (UTS) of the short-fiber-
reinforced composites by assuming the fiber-matrix
interfacial bond is very good such that deformation
of both matrix and fibers is the same (an isostrain
situation). Under this condition, the total load
sustained by the composite ( ) is equal to the loads
carried by longitudinal fibers and transverse (or
random) fibers McCrum et al., 1988.
FC = FL + FT (5)
From the definition of stress, F = sA, and
thus expressions for FC, FL, and FT in terms of
their respective stresses are possible. Substitution
of these into Equation 3 yields
sUC AC = sUL AL + sUT AT (6)
where , , , and represent the composite, the
longitudinal layer (skin material), the transverse
layer (core material), and across the area,
respectively. The types of molding were
schematically demonstrated in Figure 17 (a). By
dividing through by the total cross-sectional area
of the composite, AC and then the UTS of composite
material, sUC is
s s sUC ULL
CUT
T
C
A
A
A
A= + (7)
where AL/AC and AT/AC are area fraction of
skin and core regions of composite, respectively.
The ultimate tensile strength, sUL of the
skin layer where fibers are parallel to the tensile
axis is given by
0
10
20
30
40
50
60
70
80
90
100PP
SFR
PP20
/PP
PP/S
FRPP
20
SFR
PP20
SFR
PP20
/SFR
PP20
SFR
PP40
/PP
PP/S
FRPP
40
SFR
PP40
/SFR
PP20
SFR
PP40
SFR
PP40
/SFR
PP40
Max
imum
Ten
sile
Str
ess
(MPa
)
Maximum Tensile Stress
0
2
4
6
8
10
12
14
PP
SFR
PP20
/PP
SFR
PP40
/PP
PP/S
FRPP
20
PP/S
FRPP
40
SFR
PP20
SFR
PP20
/SFR
PP20
SFR
PP40
/SFR
PP20
SFR
PP40
SFR
PP40
/SFR
PP40
Impa
ct S
tren
gth
(kJ/
m2 )
Impact Strength
Figure 16 Effect of glass-fiber contents on maximum tensile stress and impact strength.
Page 17
Kasetsart J. (Nat. Sci.) 38 (6) 173
s t sUL f m fl
dV V= + -( )1 for < (8)
sUL = sf Vf (1- lc/2l) + sm (1-Vf) for l ≥ lc (9)
where t is interface shear strength of
bondage between fiber and matrix, sm is the tensile
strength of the matrix, Vf is the fiber volume
fraction, l and d are the mean length and the
diameter of the fiber, lc is the critical fiber length
= (sf d) / 2t, and sf is tensile strength of glass fiber
(= 3.4 GPa) (Milewsky and Katz, 1987).
In the core layer, the short fibers are more
likely to be randomly oriented rather than aligned.
The ultimate tensile strength of the core layer, sUT,
may be predicted as in [61]:
sUT = K (tl/d) Vf + smVm (10)
In this expression, K is a fiber efficiency
parameter, which depends on Vf and sf/sm ratio.
Of course, its magnitude will be less than unity,
usually in the range 0.1 to 0.6. In the case of fibers
randomly and uniformly distributed within three
dimensions in space, the fiber efficiency parameter
was taken as 0.2. Therefore, the ultimate tensile
strength of the short-fiber-reinforced composites
(sUC) can be evaluated with following equation:
s t sUC f m f T Cl d V V A A= + -( )Î ˚ +( / ) 1
K l d V Vf m m( / )t s+( ) (11)
The Equation 8 can also be expressed in
terms of ultimate tensile strength of sandwich
molding, for the SFRPP40/PP and SFRPP20/PP,
as illustrated in Figure 17 (b), the sUC can be
calculated from following equation:
s t sUC f m f Skin Cl d V V A A= + -( )Î ˚ +( / ) 1
s m m Core CV A A( ) (12)
where ACore and ASkin are the cross-sectional
area of skin and core materials, respectively.
Furthermore, in the case of SFRPP40/SFRPP20,
Figure 17(c), this equation can be employed as
given below
s t sUC f m f Skin Cl d V V A A= + -( )Î ˚ +( / ) 40 401
( / )t sl d V V A Af m f Core C20 201+ -( )Î ˚ +
K l d V V A Af m m T C( / )t s20 +( ) (13)
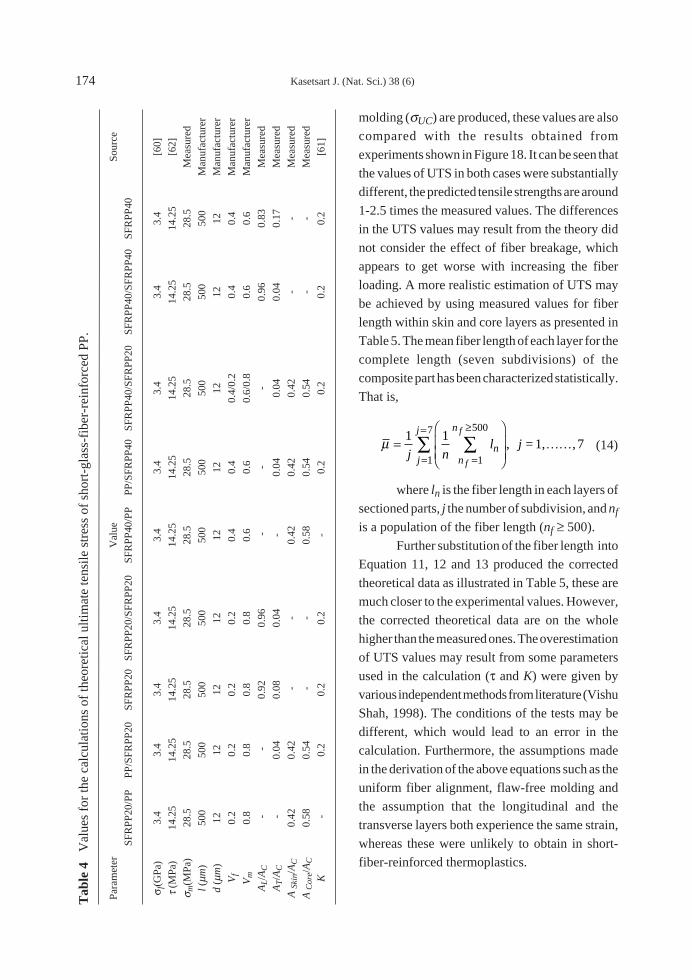
By substituting the parameter data (Table
4) in Equation 11, 12 and 13 the theoretically
calculated results of UTS for single and sandwich
Figure 17: Schematic illustration of cross-sectional area of single and sandwich molding.
(a) (b)
(c)
AL
AT
AC = AL+AT
Skin layer
Core layer ACoreCore material
Skin materialASkin
AC = ASkin+ Acore
Skin material
Core materialACore
AT
ASkin
AC = ASkin + Acore + AT
Page 18
174 Kasetsart J. (Nat. Sci.) 38 (6)
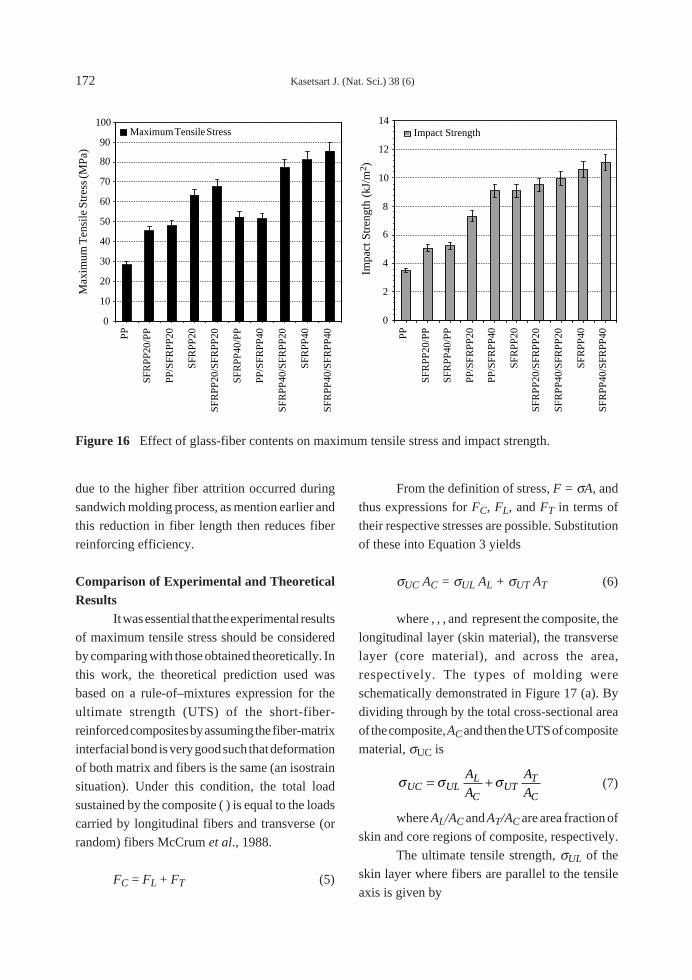
molding (sUC) are produced, these values are also
compared with the results obtained from
experiments shown in Figure 18. It can be seen that
the values of UTS in both cases were substantially
different, the predicted tensile strengths are around
1-2.5 times the measured values. The differences
in the UTS values may result from the theory did
not consider the effect of fiber breakage, which
appears to get worse with increasing the fiber
loading. A more realistic estimation of UTS may
be achieved by using measured values for fiber
length within skin and core layers as presented in
Table 5. The mean fiber length of each layer for the
complete length (seven subdivisions) of the
composite part has been characterized statistically.
That is,
m =Ê
ËÁÁ
ˆ
¯˜˜=
≥
=
=
ÂÂ1 17
1
500
1
7
j nl jn
n
n
j
j
f
f
, , = 1,KK (14)
where ln is the fiber length in each layers of
sectioned parts, j the number of subdivision, and nf
is a population of the fiber length (nf ≥ 500).
Further substitution of the fiber length into
Equation 11, 12 and 13 produced the corrected
theoretical data as illustrated in Table 5, these are
much closer to the experimental values. However,
the corrected theoretical data are on the whole
higher than the measured ones. The overestimation
of UTS values may result from some parameters
used in the calculation (t and K) were given by
various independent methods from literature (Vishu
Shah, 1998). The conditions of the tests may be
different, which would lead to an error in the
calculation. Furthermore, the assumptions made
in the derivation of the above equations such as the
uniform fiber alignment, flaw-free molding and
the assumption that the longitudinal and the
transverse layers both experience the same strain,
whereas these were unlikely to obtain in short-
fiber-reinforced thermoplastics.
Tab
le 4
Val
ues
for
the
calc
ulat
ions
of
theo
retic
al u
ltim
ate
tens
ile s
tres
s of
sho
rt-g
lass
-fib
er-r
einf
orce
d PP
.
Para
met
erV
alue
Sour
ce
SFR
PP20
/PP
PP/S
FRPP
20SF
RPP
20SF
RPP
20/S
FRPP
20SF
RPP
40/P
PPP
/SFR
PP40
SFR
PP40
/SFR
PP20
SFR
PP40
/SFR
PP40
SFR
PP40
s f(G
Pa)
3.4
3.4
3.4
3.4
3.4
3.4
3.4
3.4
3.4
[60]
t (M
Pa)
14.2
514
.25
14.2
514
.25
14.2
514
.25
14.2
514
.25
14.2
5[6
2]
s m(M
Pa)
28.5
28.5
28.5
28.5
28.5
28.5
28.5
28.5
28.5
Mea
sure
d
l (mm
)50
050
050
050
050
050
050
050
050
0M
anuf
actu
rer
d (m
m)
1212
1212
1212
1212
12M
anuf
actu
rer
Vf
0.2
0.2
0.2
0.2
0.4
0.4
0.4/
0.2
0.4
0.4
Man
ufac
ture
r
Vm
0.8
0.8
0.8
0.8
0.6
0.6
0.6/
0.8
0.6
0.6
Man
ufac
ture
r
AL/A
C -
-0.
920.
96 -
--
0.96
0.83
Mea
sure
d
AT/A
C -
0.04
0.08
0.04
-0.
040.
040.
040.
17M
easu
red
A S
kin/
AC
0.42
0.42
--
0.42
0.42
0.42
--
Mea
sure
d
A C
ore/
AC
0.58
0.54
--
0.58
0.54
0.54
--
Mea
sure
d
K -
0.2
0.2
0.2
-0.
20.
20.
20.
2[6
1]
Page 19
Kasetsart J. (Nat. Sci.) 38 (6) 175
Table 5 Mean glass fiber lengths for short-glass-fiber-reinforced polypropylene.
Sample Mean glass fiber length (mm)
SFRPP20 (Core layer) 327.65
SFRPP20 (Skin layer) 333.04
SFRPP40 (Core layer) 232.22
SFRPP40 (Skin layer) 184.38
SFRPP20/SFRPP20 (Core layer) 370.93
SFRPP20/SFRPP20 (Skin layer) 332.73
SFRPP40/SFRPP40 (Core layer) 210.95
SFRPP40/SFRPP40 (Skin layer) 183.15
SFRPP20/PP (Skin layer) 344.05
SFRPP40/PP (Skin layer) 190.68
PP/SFRPP20 (Core layer) 379.81
PP/SFRPP40 (Core layer) 224.24
SFRPP40/SFRPP20 (Core layer) 373.68
SFRPP40/SFRPP20 (Skin layer) 193.19
Table 6 Comparison of experimental, theoretical and corrected theoretical UTS for short-glass-fiber-
reinforced PP made by single and sandwich injection molding processes.
Specimens Maximum tensile stress (MPa)
Experimental data Theoretical data Corrected theorectical data
SFRPP20/PP 45.38 72.68 57.11
SFRPP40/PP 52.16 116.85 55.14
PP/SFRPP20 48.19 87.88 72.23
PP/SFRPP40 51.33 157.59 81.61
SFRPP20 63.20 133.95 96.82
SFRPP20/SFRPP20 67.58 137.75 99.37
SFRPP40/SFRPP20 77.17 185.23 107.58
SFRPP40 81.29 222.30 93.54
SFRPP40/SFRPP40 85.49 247.00 101.42
CONCLUSIONS
A sandwich injection molding technique
was employed to enhance the mechanical properties
of thermoplastic composites with respect to the
fiber orientation and the orientation of short-glass-
fibers within skin and core region. The results
show that the mechanical properties are strongly
dependent not only on the fiber concentration, but
also on the fiber orientation, the fiber length
distribution, and the voids inside the part. It is
thought that the slight discrepancies in the results
Page 20
176 Kasetsart J. (Nat. Sci.) 38 (6)
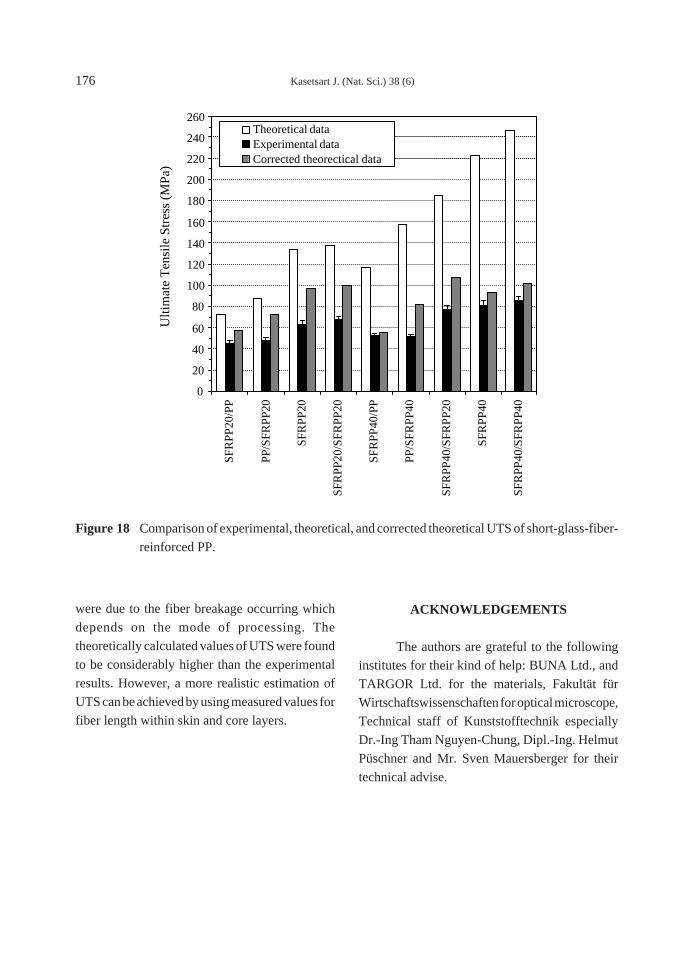
were due to the fiber breakage occurring which
depends on the mode of processing. The
theoretically calculated values of UTS were found
to be considerably higher than the experimental
results. However, a more realistic estimation of
UTS can be achieved by using measured values for
fiber length within skin and core layers.
ACKNOWLEDGEMENTS
The authors are grateful to the following
institutes for their kind of help: BUNA Ltd., and
TARGOR Ltd. for the materials, Fakultät für
Wirtschaftswissenschaften for optical microscope,
Technical staff of Kunststofftechnik especially
Dr.-Ing Tham Nguyen-Chung, Dipl.-Ing. Helmut
Püschner and Mr. Sven Mauersberger for their
technical advise.
Figure 18 Comparison of experimental, theoretical, and corrected theoretical UTS of short-glass-fiber-
reinforced PP.
0
20
40
60
80
100
120
140
160
180
200
220
240
260
SFR
PP20
/PP
PP/S
FRPP
20
SFR
PP20
SFR
PP20
/SFR
PP20
SFR
PP40
/PP
PP/S
FRPP
40
SFR
PP40
/SFR
PP20
SFR
PP40
SFR
PP40
/SFR
PP40
Ulti
mat
e T
ensi
le S
tres
s (M
Pa)
Theoretical dataExperimental dataCorrected theorectical data
Page 21
Kasetsart J. (Nat. Sci.) 38 (6) 177
NOMENCLATURE
Symbol Meaning
fp average fiber orientation factor
fps average fiber orientation factor in the skin region
fpc average fiber orientation factor the core region
ji angle between the individual fibers and local flow direction
N(ji) number of fibers with a certain angle to the local flow direction
%Dl percentage of the differences between a number-average fiber length of pellets and the
overall glass fiber length inside the molded part
lG number-average fiber length inside the granule
lj local fiber length inside the individual layers of sectioned part
%DMj percentage of the differences between the local filler concentration of sectioned part
and the overall glass content inside the molded part
Mj local filler content
Mtot average total mass of specimen
mP weight of specimen prior to burning off
mG weight of the remaining glass
n number of sample
FC total load sustained by the composite
FL load carried by longitudinal fibers
FT load carried by transverse (or random) fibers
sUC ultimate tensile stress of composite material
sUL ultimate tensile strength of the skin layer
sUT ultimate tensile strength of the core layer
AC total cross-sectional area of the composite
AL/AC area fraction of skin region of the composite
AT/AC area fraction of core region of the composite
t interface shear strength of bondage between fiber and matrix
sm tensile strength of the matrix
Vf fiber volume fraction
l mean length of the fiber
d diameter of the fiber
lc critical fiber length
sf tensile strength of glass fiber
K fiber efficiency parameter
ACore cross-sectional area of core material
ASkin cross-sectional area of skin material
ln fiber length in each layers of sectioned part
j number of subdivision
nf population of the fiber length
Page 22
178 Kasetsart J. (Nat. Sci.) 38 (6)
LITERATURE CITED
Akay M. and D. Barkley. 1991. Journal ofMaterials Science 26: 2731-2742.
Allan P.S. and M.J. Bevis 1994. Handbook ofPolymer-Fiber Composites, PolymerScience and Technology Series. Longman
Scientific & Technical: New York.
Bailey R.S. 1994. Handbook of Polymer-FiberComposites, Polymer Science andTechnology Series. Longman Scientific &
Technical: New York.
Bailey R.S. and H. Kraft. 1987. InternationalPolymer Processing 2: 94-101.
Chen S.C., K.F. Hsu and J.S. Huang. 1994.
International Communications in Heat andMass Transfer 21(4): 499-508.
Chin W.K., H.T. Liu and Y.D. Lee. 1988. PolymerComposites 5: 74-83.
Clegg D.W. 1994. Handbook of Polymer-FiberComposites, Polymer Science andTechnology Series. Longman Scientific &
Technical. New York.
Dospisil D., J., Kubat M. Plesek and P. Saha. 1994.
International Polymer Processing 4: 303-
309.
Fisa B. 1985. Polymer Composites 6: 232-239.
Franzen B., C. Klason, J. Kubat and T. Kitano
1989. Composites 200: 65-76.
Gerard P., J. Raine and J. Pabiot 1998 Journal ofReinforced Plastics and Composites 17(10):
922-934.
Gogos C.G., C-F. Huang and L.R. Schmidt. 1986.
Polymer Engineering and Science 26: 1457.
Gupta M. and K.K. Wang. 1993; PolymerComposite 14(5): 367-382.
Hegler, R.P., G. Mennig and C. Schmauch. 1987.
Advances in Polymer Technology 7(1): 3-
20.
Karger-Koscis, J. 1989. Composite MaterialsSeries: Application of Fracture Mechanicsto Composite Materials. Elsevier Science
Publishers B.V.
Karger-Kocsis J. and K. Friedrich 1987. Journalof Materials Science 22: 947-961.
Kubat J. and A. Szalanczi. 1974. PolymerEngineering and Science 14: 873.
McCrum N.G., C.P. Buckley and C.B. Bucknall.
1988. Principles of Polymer Engineering,
Oxford University Press, New York.
Meddad A. and B. Fisa. 1995. PolymerEngineering and Science 35(11): 893-901.
Messaoud D.A., B. Sanschagrin and A. Derdouri,
2002. SPE ANTEC Technical Papers 645-
648.
Milewsky J.V. and H.S. Katz, 1987. Handbook ofReinforcements for Plastics. Van Nostrand
Company Limited, New York.
O¢ Regan D.F., R.S. Bailey and M. Akay. 1995.
Composite Science and Technology 55: 109-
118.
Pechulis, M. and Vautour, D. 1997. SPE ANTECTechnical Paper : 1860-1864.
Schlatter G., J.F. Agassant, A. Davidoff and M.
Vincent. 1999. Polymer Engineering andScience 39(1): 78-88.
Seldezn, R. 2000. Polymer Engineering andScience 40(5): 1165-1176.
Tadmor Z. 1974. Journal of Applied PolymerScience 18(6): 1753-1772.
Thomason J.L. 2002. Composites: Part A 33:
1641-1652.
Vishu Shah. 1998. Handbook of Plastics TestTechnology, 2nd ed. John Wiley & Sons, Inc.,
ZOLTEX Companies, INC., 2000. ST.Louis, MO
63044, User ‘s guide for short carbon fibercomposites, June.