Properties of Biocomposites from Rapeseed Meal, Fruit Pomaceand Microcrystalline Cellulose Made by Press Pressing:Mechanical and Physicochemical Characteristics
Department of Production Engineering, Institute of Mechanical Engineering, Warsaw University of LifeSciences—SGGW, Nowoursynowska 164, 02-787 Warsaw, Poland; [email protected]
Abstract: This paper presents the results of research on biocomposites made of the mixture ofpost-extraction rapeseed meal, microcrystalline cellulose and various fruit pomace (chokeberry, black-currant, apple and raspberry pomace). The biocomposites were made in the process of mechanicalthickening by means of a heated mould (die and stamp) which is located between two heatingelements installed on a hydraulic press. The presented research combines mechanical engineeringand material engineering issues. The physical and mechanical tests of obtained biocomposites in-cluded mechanical strength measurements, thermogravimetric analyses (TGA), colour change testsand scanning electron microscopic (SEM) tests of the internal structure after breaking the sample.In addition, Fourier transform infrared spectroscopy (FTIR) tests were carried out. Generally, thebend tests and Young’s modulus were significantly increased, for example, biocomposites with anaddition of chokeberry pomace had the flexural strength higher by approximately 25% in relationto the primary sample. Furthermore, it is interesting to note the increase of water contact angle ofthese biocomposites by 40% in relation to the primary sample. The research indicates the potentialfor using fruit pomace for the needs of biocomposite production.
Keywords: biocomposites; process parameters; fruit pomace; mechanical engineering; hydraulicpress; flexural strength; thermal analysis
1. Introduction
Environmentally oriented activities observed in the world economy will force thesearch for new solutions, limiting the use of plastics in the agro-food industry [1]. Atthe same time, in line with growing awareness of people of the adverse effects on theenvironment from the technology using fossil fuels, each activity aimed at improvingthe surrounding environment is well-perceived by the society [2–5]. Present trends andincreasing demand mean that biodegradable products do not only include foils, disposableplates, drinking straws or other small objects for everyday use. Researchers increasinglystrive to obtain biocomposites of a constructional nature that could be used in various in-dustrial sectors, e.g., automotive industry (vehicle interior elements), construction industry(planks, beams), furniture industry (boards) and others [6,7]. At present, these trends arewidely promoted all around the world, which opens the possibilities of implementing suchinnovative products on a global level. The use of raw materials, which are completelyof natural origin and consistent with sustainable development and “zero waste” rules, isan important criterion in the production of modern biocomposites [8,9]. This type of rawmaterials includes various by-products of earlier technological processes related to agricul-tural and food processing. They can include, e.g., fruit and vegetable pomace from juiceproduction, spent grains from beer production, oil cake after oil extraction and many others.These raw materials are usually rich in a number of natural binding components (ligno-celluloses, polysaccharides, proteins, etc.). After suitable treatment, they may continue tobe a valuable material for the manufacture of new biodegradable products intended for a
range of new applications [10]. The rational use of vegetable waste materials for the needsof the biocomposite manufacture is therefore fully reasoned and prospective [11]. Theessence of the modern biocomposite production is to find proper components from which afinished product can be directly made. It is also essential to match appropriate parametersof mechanical pressing or compacting processes, as is indicated by Lisowski et al. [12].Despite a number of advantages of biodegradable materials, in many cases, the quality ofthese products is not satisfied. Generally, some researchers say that unsatisfied physicaland mechanical properties are one of the main limitations regarding the manufactureof biodegradable materials [13]. Therefore, the solution seems to be the search for newcomponents which can improve the properties of such biocomposites.
Raw materials, the potential of which is not sufficiently used, can include materialsrich in proteins. These involve pomace after production of vegetable oil, from whichso-called post-extraction meal is manufactured. The meal contains 30–38% of vegetableprotein and approximately 20% of crude fibre on average. As it results from the publishedreferences, the attempts to manufacture biocomposites based on high-protein raw materialsgenerally came out well. This was confirmed by the tests carried out on soybean materialsand grape marc [14]. The author stated that an addition of proteins had a particularlyfavourable effect on the improvement of mechanical properties of biocomposites. Theauthors of Reference [15] stated similarly, however, that they connect the improvement ofthe mechanical properties with crosslinking properties of proteins. According to Prochonand Ntumba [16], sulphur protein amino acids containing rich rapeseed protein haveparticularly good crosslinking properties. Such properties of proteins show the widerpossibilities of using them, e.g., as binders or adhesives, which significantly expands thepossibilities of high-protein raw material applications [17]. The proteins also demonstrateantioxidant activities, which is associated with combining active forms of oxygen andcreating reactions of polymer chains, which is undoubtedly their positive feature [18].Furthermore, heat-treated proteins are characterised by increased thermal resistance due toa large number of atoms in the polypeptide molecule which can provide tangible benefitsto the heat-treated products [19]. In addition to many favourable properties of proteins, itshould be noted that the proteins are generally available and more ecological than syntheticbinders. According to the other authors’ research, it is possible to use protein raw materialsto manufacture thickened stable plastics, however, such products can be fragile [20]. Inline with the other references, the properties of such products can be improved by addingcellulose raw materials, such as microcrystalline cellulose (MCC) [21]. Such a material isfully biodegradable and can perfectly complement the modern biocomposites [22].
For ecological reasons, it is also justified to combine protein raw materials with othersignificantly cheaper biodegradable raw materials. This may enrich the composition ofsuch materials and improve physical and mechanical parameters of obtained products atthe same time [23]. Such products, which can include fruit residues after juice extractionprocesses, are waste materials, and are difficult to manage. It is generally accepted that fruitpomace is particularly rich in vegetable fibres, the content of which can exceed even 70% inthe dry mass. However, it generally depends on the pomace type which is affected by theamounts of certain components: husks, stones/kernels and woody parts. Taking accountof the fact that the vegetable fibre composition includes mainly cellulose, hemicellulose,lignin and pectin, fruit pomace can be a raw material for biocomposites. Those products,after thickening, will be a homogenous durable material, which is pointed out by thestudies of other researchers [24]. Chokeberry, currant, apple and raspberry pomace can beincluded to the promising raw materials, which due to their properties, could enrich thecomposition of modern biocomposites. According to Górecka et al. [25], raspberry pomaceincludes 24.2% of cellulose, 6.00% of hemicellulose and 24.60% of lignin. According toReference [26], the dry mass of chokeberry pomace contains: 33.14% of cellulose, 32.8% ofhemicellulose, 23.03% of lignin, 7.52% of pectin and 4.23% of other components. The drymass of blackcurrant pomace includes 7.92% of cellulose, 14.69% of hemicellulose, 73.8%of lignin, 2.48% of pectin and 1.11% of other components. The dry mass of apple pomace
Materials 2021, 14, 890 3 of 16
consists of 43.17% of cellulose, 24.27% of hemicellulose, 11.76% of pectin, 20.34% of ligninand 0.46% of other components.
Taking the above into account, the combination of high-protein raw material (rapeseedmeal) with pomace (with a different fibre composition) will make it possible to explorenew possible applications for these components. An added value of research is alsothe manufacture of a new type of biocomposites based mainly on agricultural and foodindustry by-products.
The purpose of this paper is therefore to verify the possibilities of using post-extractionrapeseed meal with a MCC addition and various fruit pomace to produce biodegradablecomposite materials by the hot-pressing method.
2. Materials and Methods2.1. Materials
The material used to produce biocomposites included post-extraction rapeseed meal,dried fruit pomace (chokeberry, currant, apple and raspberry pomace) and microcrystallinecellulose (MCC). The post-extraction rapeseed meal was purchased from a local market(Mar-Rol, Jarocin, Poland). The basic chemical composition (% in dry weight) was asfollows: 39.6% of total protein, 13.7% of crude fibre, 7.8% of crude ash, 2.5% of crudefat and 36.4% of other ingredients (manufacturer data). Fruit pomace was delivered bya fruit processing company (Greenherb, Łancut, Poland). The company also dried thepomace by using a drum dryer with heat exchanger at a temperature of 100 ◦C. Dried fruitscomprised pomace obtained after juice extraction from fruits (country of origin—Poland:chokeberry (melanocarpa (Michx.) Elliott) black currant (Ribes nigrum ‘Tiben’), raspberry(Rabus idaeus ‘Polana’) and apple (Malus domestica ‘Chmpion’, Malus domestica ‘Lobo’,Malus domestica ‘Ligol’). An addition of microcrystalline cellulose (MCC) (CellulosePowder, Cotton linters), 20 µm type (Sigma Aldrich, Saint Louis, MO, USA), was usedin the composition of the mixture for manufacture of biocomposites. The percentage ofcomponents intended for manufacture of biocomposites along with process temperatureand sample acronym are specified in Table 1. The basic composition of each mixture wasthe sum of three components (%wt—weight percentage), e.g., fruit pomace—10 wt% +rapeseed meal 83 wt% + microcrystalline cellulose (MCC) 7 wt%, etc. The control sampleconsisted only of rapeseed meal and MCC. Each sample was produced at the processtemperatures of 130 and 160 ◦C. In this way, 26 samples of biocomposites were produced forfurther research. The paper also uses markings which facilitate description of results, e.g.,(10_130), (20_130), (30_130), (10_160), (20_160), (30_160). The first part of the abbreviationmeans the percentage of specific fruit pomace in the mixture (10, 20, and 30 wt%), and thesecond part means the process temperature (130 or 160 ◦C).
Table 1. Raw material composition and temperature parameters of the biocomposites production process.
* Acronym for colour change ∆E between samples: control 1 and control 2.
2.2. Biocomposite Production
The biocomposites were made of post-extraction rapeseed meal mixtures with anaddition of various fruit pomace (chokeberry, currant, raspberry and apple pomace). The7 wt% microcrystalline cellulose (MCC) addition was used as a strengthening componentin each mixture. The rapeseed meal and pomace were shredded by a MKM 6000 impact
Materials 2021, 14, 890 4 of 16
mill (BOSCH, Gerlinge, Germany). The material was shredded during 25–30 s until theparticles below 1.6 mm were obtained (during milling, the material was agitated twice forapproximately 2 s). The granulometric composition of individual mixture componentswere checked by a LPzE-2e sieve screen unit (MULTISERW-Morek, Brzeznica, Poland).The sieves with a size of 1.6, 1.0, 0.8, 0.5, 0.25, 0.1, <0.05 mm compliant with DIN ISO3310-1:2017-11 were used in the screen unit column [27]. The screening time was 10 min,vibration amplitude was 60 and frequency was 2 Hz. A detailed distribution of raw materialparticles after shredding was presented in Table 2. The material for the manufacture ofbiocomposites was prepared in a plastic container with a capacity of 400 mL and mixed bya CAT 30 mechanical stirrer (CAT, Deerfield, IL, USA) at a speed of 250 rpm for 60 s. Thematerial moisture content, after mixture preparation, was 9.2% (±0.2%).
Table 2. Average values of the particle size distribution of crushed raw materials. Average of three repetitions.
Size Range
Mass Percent (wt%)
RapeseedMeal
ChokeberryPomace
BlackcurrantPomace
ApplePomace
RaspberryPomace
1.6–1.0 mm 1.94 2.45 3.08 3.57 4.601.0–0.8 mm 10.35 12.29 10.94 11.19 9.13
0.8–0.71 mm 5.49 6.58 7.51 7.55 6.510.71–0.5 mm 22.61 21.84 21.57 22.64 25.600.5–0.25 mm 51.73 47.88 50.11 47.76 46.92
<0.25 mm 7.01 8.19 6.61 6.90 6.49Total mass accounted for 99.1 99.2 99.8 99.6 99.2
The samples were made on a test bench consisting of a hydraulic press with a pressingforce of maximum (max.) 150 KN (FR–5014, producer, Farys, Poland). Upper and lowerheating plates with a thickness of 30 mm, with internal heating coils with a total power of1600 W, were installed on a basis and piston rod. The temperature of heating plates wasadjusted separately for the upper place and lower plate by means of heater controllerswith an accuracy of ±0.1 ◦C. The heating plates were used to heat a metal mould used inthe biocomposite pressing process (Figure 1). The mould made it possible to manufacturesquare biocomposite plates with dimensions of (length 90 mm, width 90 mm and a thicknessof 5 mm). Each time, in order to produce a single sample, the mould was poured with80 g of prepared material. The samples were manufactured at two thickening processtemperatures, i.e., at 130 and 160 ◦C. The thickening process was carried out in twostages. In the first stage, the raw material was subjected to 5 MPa stress for approximately30 s. Then, the die stamp was lifted for approximately 10 s (at this time, water rapidlyevaporated). In the second stage, the material was pressed once again, but with theincreased pressure equal to 20 MPa for 5.5 min. The material obtained in such a way waskept at room temperature for 5 h.
The process parameters (temperature, exposure time) were selected on the basis ofpreliminary studies and literature data. The selected temperature range of the processresulted from the significant amount of protein in the raw material. To obtain the stickinessof the protein, it is necessary to denature it. The above pressing method was chosenbecause it is one of the simplest methods used in the production of such materials. Itmay be relevant for the further commercial application of such products (e.g., productionof consumables).
Materials 2021, 14, 890 5 of 16
Materials 2021, 14, x FOR PEER REVIEW 5 of 16
relevant for the further commercial application of such products (e.g., production of con-sumables).
Figure 1. Biocomposite production process: (a) material load, (b) initial pressing, 5 MPa during 30 s, (c) evaporation of water, 10 s, (d) main pressing, 20 MPa, time 5.5 min.
2.3. Mechanical Properties The material strength was determined by the three-point flexural method and the
Young’s modulus (YM) was defined. The flexural strength (FS) parameters of biocompo-sites were determined in accordance with PN-EN ISO 178:2011 [28]. The distance between supporting beams was 50 mm. The radius of the loading element was 5 mm. The samples were cut out by mechanical treatment. An INSTRON 8802 universal strength testing ma-chine was used for strength tests (Instron, Norwood, MA, USA).
2.4. Water Contact Angle The water contact angle values were determined by a so-called sitting drop method.
The outline of a drop applied on the biocomposite surface was analysed and the internal tangent inclination angle to the horizontal surface at the point of contact of drop and ma-terial was determined in accordance with Giri et al. during the measurements [29]. The tests were carried out on the measurement bench consisting of adjustable table, syringe for dosing drops of distilled water and A2500-14uc, 5 megapixels (Mpix) camera (pro-ducer: Basler, Ahrensburg, Germany). The drop volume was 15 µL, and water tempera-ture was 23 °C. Pictures were taken for up to 1 s after drop application by Pylon Viewer software (producer: Basler, Ahrensburg, Germany). The pictures, taken in such a manner, were introduced as a raster image to Autodesk Autocad Mechanical 2019 software, prod-uct version: 23.0.46.0, where the water contact angle values were determined.
2.5. Colour Analysis A change of the colour was analysed on the basis of pictures taken by an Optatech
STX stereomicroscope equipped with a 5 megapixels (Mpix) colour camera and light emit-ting diodes illuminator (LED) with a colour temperature of 7000 K (Opta-Tech, Warsaw, Poland). The camera was calibrated by performing a white balance by means of Minolta S no. 1863310 white chart. The research used the L*, a*, b* colour space (L* - brightness, a* - colour from green to magenta, b* - colour from blue to yellow). The values of individual components of the colour were read by a histogram function using CorelDRAW Home and Student X7 Version 17.1.0.572 (Corel Corporation, Ottawa, Canada). The colour changes of biocomposites ΔE due to the process temperature difference were calculated in accordance with the following Equation (1): ∆ = ∆ ∗ + ∆ ∗ ∆ ∗ ⁄ (1)
where ΔL*, Δa*, Δb* represent the changes in the colour value ΔE after increasing the pro-cess temperature from 130 to 160 °C.
Figure 1. Biocomposite production process: (a) material load, (b) initial pressing, 5 MPa during 30 s,(c) evaporation of water, 10 s, (d) main pressing, 20 MPa, time 5.5 min.
2.3. Mechanical Properties
The material strength was determined by the three-point flexural method and theYoung’s modulus (YM) was defined. The flexural strength (FS) parameters of biocompositeswere determined in accordance with PN-EN ISO 178:2011 [28]. The distance betweensupporting beams was 50 mm. The radius of the loading element was 5 mm. The sampleswere cut out by mechanical treatment. An INSTRON 8802 universal strength testingmachine was used for strength tests (Instron, Norwood, MA, USA).
2.4. Water Contact Angle
The water contact angle values were determined by a so-called sitting drop method.The outline of a drop applied on the biocomposite surface was analysed and the internaltangent inclination angle to the horizontal surface at the point of contact of drop andmaterial was determined in accordance with Giri et al. during the measurements [29]. Thetests were carried out on the measurement bench consisting of adjustable table, syringe fordosing drops of distilled water and A2500-14uc, 5 megapixels (Mpix) camera (producer:Basler, Ahrensburg, Germany). The drop volume was 15 µL, and water temperature was23 ◦C. Pictures were taken for up to 1 s after drop application by Pylon Viewer software(producer: Basler, Ahrensburg, Germany). The pictures, taken in such a manner, wereintroduced as a raster image to Autodesk Autocad Mechanical 2019 software, productversion: 23.0.46.0, where the water contact angle values were determined.
2.5. Colour Analysis
A change of the colour was analysed on the basis of pictures taken by an Optatech STXstereomicroscope equipped with a 5 megapixels (Mpix) colour camera and light emittingdiodes illuminator (LED) with a colour temperature of 7000 K (Opta-Tech, Warsaw, Poland).The camera was calibrated by performing a white balance by means of Minolta S no.1863310 white chart. The research used the L*, a*, b* colour space (L*—brightness, a*—colour from green to magenta, b*—colour from blue to yellow). The values of individualcomponents of the colour were read by a histogram function using CorelDRAW Home andStudent X7 Version 17.1.0.572 (Corel Corporation, Ottawa, Canada). The colour changes ofbiocomposites ∆E due to the process temperature difference were calculated in accordancewith the following Equation (1):
∆E =[(∆L∗)2 + (∆a∗)2(∆b∗)2
]1/2(1)
where ∆L*, ∆a*, ∆b* represent the changes in the colour value ∆E after increasing theprocess temperature from 130 to 160 ◦C.
2.6. Microscopic Analysis
The structure of obtained materials was analysed using the SEM HITACHI S-3400Nscanning electron microscope (SEM, Tokyo, Japan) with an accelerating voltage of 20 kV
Materials 2021, 14, 890 6 of 16
in low vacuum conditions under 70 Pa. The composite fracture and external surface wereanalysed.
2.7. Thermogravimetry Analysis (TGA) and Derivative Differential Thermal Analysis (DTA)
The thermogravimetry analysis (TGA) and derivative differential thermal analysis(DTA) were carried out with the use of Q50 TGA V20. 13. Build 39 (TA Instruments, NewCastle, DE, USA). The sample with a mass of 50 mg was heated at a speed of 10 ◦C min−1
from room temperature to 700 ◦C. The nitrogen flow was 40 mL min−1.
The infrared spectrum (FTIR) of biocomposites was analysed by means of a spectrometer-model Spectrum 2000 (Perkin-Elmer, Waltham, MA, USA). The spectra were recorded at aresolution of 4 cm−1 within the range of 400–4000 cm−1. The measurements were conductedat room temperature. In order to improve the accuracy of the research, 32 scans were made fora single sample.
2.9. Statistical Analysis
The findings obtained (strength tests, water contact angle, colour changes) were subjectedto statistical treatment in the STATISTICA 2013 version 13.3 software (TIBCO Software Inc., PaloAlto, CA, USA). The results were presented as average values (n = 5) ± standard deviation(SD). The Shapiro–Wilk test was used to test the normality of the data. The differences wereconsidered relevant at the confidence level of 95% (p < 0.05) in one-way analysis of variance(ANOVA) examination with a post-hoc Tukey’s test. Statistically significant and not significantdifferences are presented by means of capital and small letters placed above the bars of thegraphs. Various case letters (e.g., a, b, c, d . . . ) located at the results indicate relevant differencesbetween the percentage of pomace share in the sample. Various capital letters (e.g., A, B, C,D . . . ) indicate relevant differences between the individual sample biocomposites with thesame percentage share of components. The same letters, for example, (a, a) or (B, B) means nostatistical significance (between homogeneous groups.
3. Results3.1. Flexural Strength and Young’s Modulus
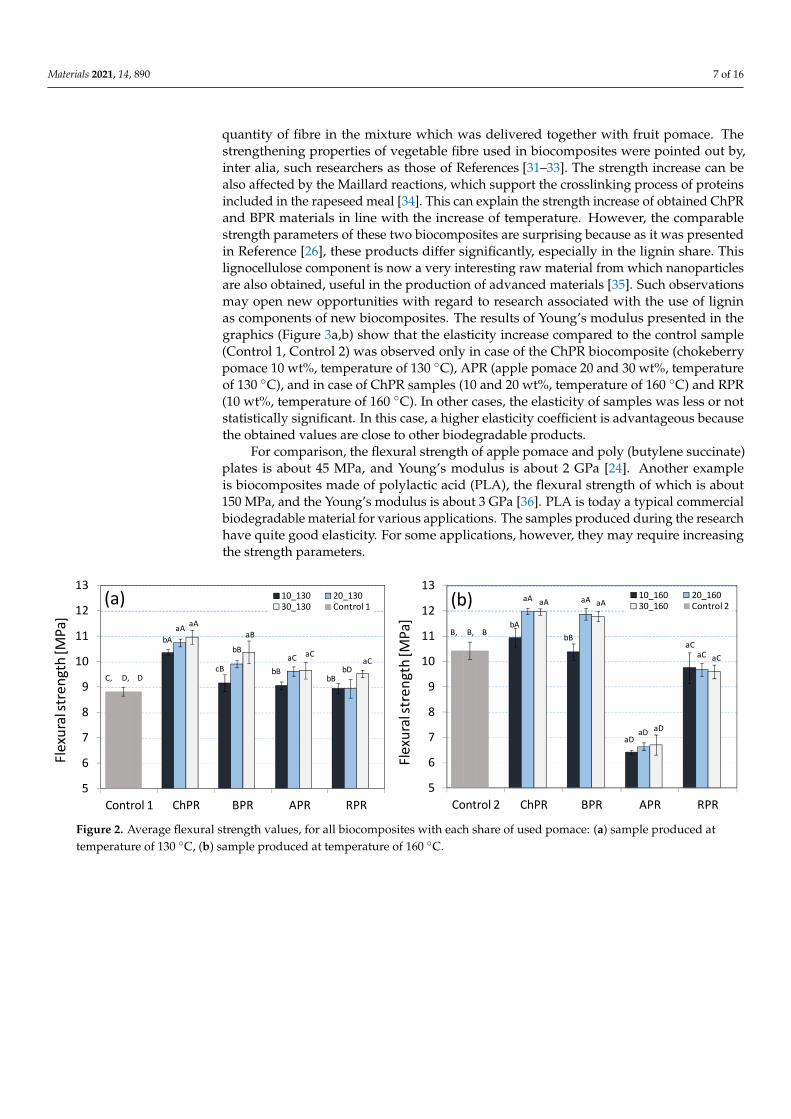
On the basis of the obtained results, it was found that the flexural strength (FS)of the produced biocomposites was different depending on the type of pomace and itspercentage share in the mixture (Figure 2a,b). It was stated that the materials with anaddition of chokeberry pomace (ChPR) were characterised by the largest FS strength,which was observed at the production process temperatures of 130 and 160 ◦C. Comparingthe results to the rapeseed and microcrystalline cellulose (MCC) sample (Control 1), theuse of process temperature of 130 ◦C allowed the improvement of the strength parametersof biocomposites. At this process temperature, the strength increased each time in tandemwith the share of fruit pomace in the mixture. The use of the process temperature of 160 ◦Callowed the improvement of the strength parameters of ChPR and BPR biocomposites(chokeberry and currant pomace share at the level of 20 and 30 wt%), where the maximumstresses during binding were from 11.8 to 12.1 MPa. The same temperature in case ofAPR and RPR biocomposites caused the relevant reduction of strength parameters inrelation to the control sample (Control 2). In this case, the low-strength values couldbe associated with too rapid water evaporation when the mould stamp is lifted, as aresult of which small pores (internal and external) formed. A similar phenomenon isobserved, inter alia, when the raw material passes from the area of high pressure to thearea of atmospheric pressure in the extrusion process of vegetable raw materials [30].Generally, the observed increase of the strength parameters of composites in tandemwith the increase of pomace share can be associated with a fibrous structure of the rawmaterial and cross-linking properties protein the rapeseed meal. This is confirmed byresearch [16,17]. So, the strength increase can be associated with the increase of the
Materials 2021, 14, 890 7 of 16
quantity of fibre in the mixture which was delivered together with fruit pomace. Thestrengthening properties of vegetable fibre used in biocomposites were pointed out by,inter alia, such researchers as those of References [31–33]. The strength increase can bealso affected by the Maillard reactions, which support the crosslinking process of proteinsincluded in the rapeseed meal [34]. This can explain the strength increase of obtained ChPRand BPR materials in line with the increase of temperature. However, the comparablestrength parameters of these two biocomposites are surprising because as it was presentedin Reference [26], these products differ significantly, especially in the lignin share. Thislignocellulose component is now a very interesting raw material from which nanoparticlesare also obtained, useful in the production of advanced materials [35]. Such observationsmay open new opportunities with regard to research associated with the use of ligninas components of new biocomposites. The results of Young’s modulus presented in thegraphics (Figure 3a,b) show that the elasticity increase compared to the control sample(Control 1, Control 2) was observed only in case of the ChPR biocomposite (chokeberrypomace 10 wt%, temperature of 130 ◦C), APR (apple pomace 20 and 30 wt%, temperatureof 130 ◦C), and in case of ChPR samples (10 and 20 wt%, temperature of 160 ◦C) and RPR(10 wt%, temperature of 160 ◦C). In other cases, the elasticity of samples was less or notstatistically significant. In this case, a higher elasticity coefficient is advantageous becausethe obtained values are close to other biodegradable products.
For comparison, the flexural strength of apple pomace and poly (butylene succinate)plates is about 45 MPa, and Young’s modulus is about 2 GPa [24]. Another exampleis biocomposites made of polylactic acid (PLA), the flexural strength of which is about150 MPa, and the Young’s modulus is about 3 GPa [36]. PLA is today a typical commercialbiodegradable material for various applications. The samples produced during the researchhave quite good elasticity. For some applications, however, they may require increasingthe strength parameters.
Materials 2021, 14, x FOR PEER REVIEW 7 of 16
pressure in the extrusion process of vegetable raw materials [30]. Generally, the observed increase of the strength parameters of composites in tandem with the increase of pomace share can be associated with a fibrous structure of the raw material and cross-linking properties protein the rapeseed meal. This is confirmed by research [16,17]. So, the strength increase can be associated with the increase of the quantity of fibre in the mixture which was delivered together with fruit pomace. The strengthening properties of vegeta-ble fibre used in biocomposites were pointed out by, inter alia, such researchers as those of References [31–33]. The strength increase can be also affected by the Maillard reactions, which support the crosslinking process of proteins included in the rapeseed meal [34]. This can explain the strength increase of obtained ChPR and BPR materials in line with the increase of temperature. However, the comparable strength parameters of these two biocomposites are surprising because as it was presented in Reference [26], these products differ significantly, especially in the lignin share. This lignocellulose component is now a very interesting raw material from which nanoparticles are also obtained, useful in the production of advanced materials [35]. Such observations may open new opportunities with regard to research associated with the use of lignin as components of new biocom-posites. The results of Young’s modulus presented in the graphics (Figure 3a,b) show that the elasticity increase compared to the control sample (Control 1, Control 2) was observed only in case of the ChPR biocomposite (chokeberry pomace 10 wt%, temperature of 130 °C), APR (apple pomace 20 and 30 wt%, temperature of 130 °C), and in case of ChPR sam-ples (10 and 20 wt%, temperature of 160 °C) and RPR (10 wt%, temperature of 160 °C). In other cases, the elasticity of samples was less or not statistically significant. In this case, a higher elasticity coefficient is advantageous because the obtained values are close to other biodegradable products.
For comparison, the flexural strength of apple pomace and poly (butylene succinate) plates is about 45 MPa, and Young’s modulus is about 2 GPa [24]. Another example is bio-composites made of polylactic acid (PLA), the flexural strength of which is about 150 MPa, and the Young’s modulus is about 3 GPa [36]. PLA is today a typical commercial biode-gradable material for various applications. The samples produced during the research have quite good elasticity. For some applications, however, they may require increasing the strength parameters.
Figure 2. Average flexural strength values, for all biocomposites with each share of used pomace: (a) sample produced at temperature of 130 °C, (b) sample produced at temperature of 160 °C.
bA
cB bBbBC, D, D
aA
bBaC
bD
aAaB
aCaC
5
6
7
8
9
10
11
12
13
Control 1 ChPR BPR APR RPR
Flex
ural
stre
ngth
[MPa
]
10_130 20_13030_130 Control 1(a)
bAbB
aD
aCB, B, B
aA aA
aD
aC
aA aA
aD
aC
5
6
7
8
9
10
11
12
13
Control 2 ChPR BPR APR RPR
Flex
ural
stre
ngth
[MPa
]
10_160 20_16030_160 Control 2(b)
Figure 2. Average flexural strength values, for all biocomposites with each share of used pomace: (a) sample produced attemperature of 130 ◦C, (b) sample produced at temperature of 160 ◦C.
Materials 2021, 14, 890 8 of 16Materials 2021, 14, x FOR PEER REVIEW 8 of 16
Figure 3. Average Young’s modulus, for all biocomposites with each share of used pomace: (a) sample produced at tem-perature of 130 °C, (b) sample produced at temperature of 160 °C.
3.2. Water Contact Angle The tests of water contact angle (Figure 4a,b) were carried out due to the fact that the
wettability is the value which defines the use of biocomposites as biodegradable products for everyday use (e.g., plates, cups, saucer, cutlery, etc.). It was found that all the obtained biocomposites reached the water contact angle at the level of 59–84°, which indicates their hydrophilic nature [37]. However, it was stated that the increase of the pomace share in the samples up to 30 wt%, regardless of the used biocomposite production temperature, caused the increase of water contact angle. This means that the hydrophobicity of these products increased. This increase can be associated with adding significant quantities of lignin, recognised as hydrophobic, being in the composition of every pomace [38]. The highest water contact angle was stated for ChPR (84.2°) and BPR (73.1°) samples with an addition of 30 wt% of pomace. According to the literature data, a hemicellulose, generally recognised as hydrophilic, can be a factor limiting the hydrophobicity increase of materi-als [39]. At the same time, this impact can be limited through combining the remains of fats from used raw materials [40]. Such thesis can explain the least wettability of ChPR and BPR samples. The increase of the process temperature up to 160 °C caused a slight decrease of water contact angle of materials with the 30 wt% share of ChPR, APR and BPR pomace. This can be explained by the beginning of chemical transformation causing an initial decomposition of lignocellulosic components [41]. This may be related to the sof-tening of the pectin matrix, which is a binder for cellulose fibres, as indicated [42]. The results of water contact angle are similar to the exemplary biocomposites reinforced with nanocellulose and microcrystalline cellulose (MCC) [29].
For comparison, the most hydrophobic biodegradable materials have a contact angle as high as 158° [43]. Pure PLA, on the other hand, has a contact angle of only 75° [44]. Taking into account the above, the tested biocomposites may require improvement of this parameter.
Figure 3. Average Young’s modulus, for all biocomposites with each share of used pomace: (a) sample produced attemperature of 130 ◦C, (b) sample produced at temperature of 160 ◦C.
3.2. Water Contact Angle
The tests of water contact angle (Figure 4a,b) were carried out due to the fact that thewettability is the value which defines the use of biocomposites as biodegradable productsfor everyday use (e.g., plates, cups, saucer, cutlery, etc.). It was found that all the obtainedbiocomposites reached the water contact angle at the level of 59–84◦, which indicates theirhydrophilic nature [37]. However, it was stated that the increase of the pomace share in thesamples up to 30 wt%, regardless of the used biocomposite production temperature, causedthe increase of water contact angle. This means that the hydrophobicity of these productsincreased. This increase can be associated with adding significant quantities of lignin,recognised as hydrophobic, being in the composition of every pomace [38]. The highestwater contact angle was stated for ChPR (84.2◦) and BPR (73.1◦) samples with an addition of30 wt% of pomace. According to the literature data, a hemicellulose, generally recognisedas hydrophilic, can be a factor limiting the hydrophobicity increase of materials [39]. At thesame time, this impact can be limited through combining the remains of fats from used rawmaterials [40]. Such thesis can explain the least wettability of ChPR and BPR samples. Theincrease of the process temperature up to 160 ◦C caused a slight decrease of water contactangle of materials with the 30 wt% share of ChPR, APR and BPR pomace. This can beexplained by the beginning of chemical transformation causing an initial decomposition oflignocellulosic components [41]. This may be related to the softening of the pectin matrix,which is a binder for cellulose fibres, as indicated [42]. The results of water contact angle aresimilar to the exemplary biocomposites reinforced with nanocellulose and microcrystallinecellulose (MCC) [29].
For comparison, the most hydrophobic biodegradable materials have a contact angleas high as 158◦ [43]. Pure PLA, on the other hand, has a contact angle of only 75◦ [44].Taking into account the above, the tested biocomposites may require improvement ofthis parameter.
Materials 2021, 14, 890 9 of 16Materials 2021, 14, x FOR PEER REVIEW 9 of 16
Figure 4. Average water contact angle, for all biocomposites with each share of used pomace: (a) sample produced at temperature of 130 °C, (b) sample produced at temperature of 160 °C.
3.3. Colour Analysis It was found that the obtained biocomposites were dark, in shades close to brown and
black (Table 3). This is due to the low values of product luminosity, L* (9.04–12.09 wt%), and the values of coefficients a* and b*, which range between −0.18 and 2.49 on the Lab colour space scale. It was also stated that the luminosity of materials manufactured at a temperature of 130 °C decreased with the increase in the pomace share. A similar tendency was observed in case of materials manufactured at a temperature of 160 °C, however, this concerned only ChPR, APR and BPR biocomposites. While analysing the parameters of colour a* and b* for APR and BPR biocomposites, it was found that the values tended to zero on the Lab colour space scale along with the share increase of chokeberry and currant pomace. So, this explains the share increase of black shades in these products. In the case of ChPR and BPR biocomposites, the dark colour may also be caused by the content of anthocyanins present in chokeberry and black currants [45]. This pigment also contributes to the more intensive colouring of bright particles of mixture components. It was stated as well that the colour changes are affected by the temperature increase in the sample thickening process. In this case, the darker colour may result from protein denaturation and the Maillard reaction (browning) in the surroundings where the process temperature is increased up to 160 °C [46]. Figure 5 presents the ΔE differences between the colour of materials produced at a temperature of 130 and 160 °C. Research indicated that the most intensive changes, at the level of 1.25–2.62, appeared in the samples with an addition of 10 wt% of pomace. The share increase in fruit pomace up to 30 wt% caused the decrease in the value of this indicator in each case. It was found that in case of ChPR and APR biocomposites, the changes in colour were least intensive, which indicates the increased resistance of these materials to the colour changes while the sample is heated. At the same time, it was also stated that the sample based on rapeseed meal and MCC (Control 3) is least resistant to the process temperature increase. In this case, the colour difference is 4.2 and it is clearly perceptible even with the naked eye.
bA bAbA
bBC, C, D
bA bA bA
aB
aA
aB aB
aC
30
40
50
60
70
80
90
100
Control 1 ChPR BPR APR RPR
Wat
er co
ntac
t ang
le[o ]
10_130 20_13030_130 Control 1
(a)
cAbA bA
aBA , C, C
bA
aBbC
aB
aA
aB aB aB
30
40
50
60
70
80
90
100
Control 2 ChPR BPR APR RPR
Wat
er co
ntac
t ang
le[o ]
10_160 20_16030_160 Control 2
(b)
Figure 4. Average water contact angle, for all biocomposites with each share of used pomace: (a) sample produced attemperature of 130 ◦C, (b) sample produced at temperature of 160 ◦C.
3.3. Colour Analysis
It was found that the obtained biocomposites were dark, in shades close to brown andblack (Table 3). This is due to the low values of product luminosity, L* (9.04–12.09 wt%),and the values of coefficients a* and b*, which range between −0.18 and 2.49 on the Labcolour space scale. It was also stated that the luminosity of materials manufactured at atemperature of 130 ◦C decreased with the increase in the pomace share. A similar tendencywas observed in case of materials manufactured at a temperature of 160 ◦C, however, thisconcerned only ChPR, APR and BPR biocomposites. While analysing the parameters ofcolour a* and b* for APR and BPR biocomposites, it was found that the values tended tozero on the Lab colour space scale along with the share increase of chokeberry and currantpomace. So, this explains the share increase of black shades in these products. In the caseof ChPR and BPR biocomposites, the dark colour may also be caused by the content ofanthocyanins present in chokeberry and black currants [45]. This pigment also contributesto the more intensive colouring of bright particles of mixture components. It was statedas well that the colour changes are affected by the temperature increase in the samplethickening process. In this case, the darker colour may result from protein denaturationand the Maillard reaction (browning) in the surroundings where the process temperatureis increased up to 160 ◦C [46]. Figure 5 presents the ∆E differences between the colour ofmaterials produced at a temperature of 130 and 160 ◦C. Research indicated that the mostintensive changes, at the level of 1.25–2.62, appeared in the samples with an addition of10 wt% of pomace. The share increase in fruit pomace up to 30 wt% caused the decreasein the value of this indicator in each case. It was found that in case of ChPR and APRbiocomposites, the changes in colour were least intensive, which indicates the increasedresistance of these materials to the colour changes while the sample is heated. At the sametime, it was also stated that the sample based on rapeseed meal and MCC (Control 3) isleast resistant to the process temperature increase. In this case, the colour difference is 4.2and it is clearly perceptible even with the naked eye.
Materials 2021, 14, 890 10 of 16Materials 2021, 14, x FOR PEER REVIEW 10 of 16
Figure 5. Average colour change values, ΔE, resulting from increase in process tempera-ture from 130 to 160 °C.
Table 3. Average values of L*, a*, b* colour changes for all biocomposites with each share of used additives. Average of five repetitions.
Samples Process Temperature 130 °C Process Temperature 160 °C
Control 1 15.47(±0.13) −0.32 (±0.0093) 2.87(±0.014) - - - Control 2 - - - 9.33 (±0.11) −0.03 (±0.001) 1.31(±0.014)
3.4. Microscopic Analysis The SEM microscope analysis was carried out in order to assess the impact of used
additions on the changes in the internal and external structure of obtained biocomposites. The utilitarian purpose was to recognise the changes in the structural features of biocom-posites after the sample fracture, which could have a direct impact on the strength param-eters of the samples. It was found that a characteristic feature of all the samples was a struc-ture consisting of raw material particles flattened to a varying degree (Figure 6a,b,e,g). Such a structure was most evident in case of the sample (Control 1) made of rapeseed and mi-crocrystalline cellulose MCC (Figure 6e), as well as in case of other samples manufactured
Figure 5. Average colour change values, ∆E, resulting from increase in process temperature from 130to 160 ◦C.
Table 3. Average values of L*, a*, b* colour changes for all biocomposites with each share of used additives. Average offive repetitions.
SamplesProcess Temperature 130 ◦C Process Temperature 160 ◦C
The SEM microscope analysis was carried out in order to assess the impact of used ad-ditions on the changes in the internal and external structure of obtained biocomposites. Theutilitarian purpose was to recognise the changes in the structural features of biocompositesafter the sample fracture, which could have a direct impact on the strength parameters ofthe samples. It was found that a characteristic feature of all the samples was a structureconsisting of raw material particles flattened to a varying degree (Figure 6a,b,e,g). Such astructure was most evident in case of the sample (Control 1) made of rapeseed and micro-crystalline cellulose MCC (Figure 6e), as well as in case of other samples manufacturedat a temperature of 130 ◦C. The process temperature increase up to 160 ◦C contributed tothe better fluidisation of material structure (Figure 6b,d), which also could be affected bybetter denaturation of protein included in the raw material. Furthermore, all the obtainedsamples were characterised by a smooth external surface with visible small micropores(Figure 6c,f). The pores are usually formed due to rapid water evaporation and they are the
Materials 2021, 14, 890 11 of 16
result of rapid changes in pressure. The limitation of porosity is usually a challenge whenplanning the production process of biocomposites. However, it can be a positive featurewhen a protective layer is applied on such a type of products. While analysing the pointsof sample fractures, it can be observed that the introduction of an additional vegetable fibre(in the form of fruit pomace) makes numerous material extensions/elongations at the pointof sample fracture (Figure 6h). This can be observed especially in case of ChPR and BPR(pomace 30 wt%, temperature 130 ◦C). According to Picard [24], such a situation occurswhen the material consistency is disturbed, which makes it easier to pull out fibres underthe effect of a mechanical force. In turn, the consistency disturbances can be associatedwith hydrophobic and hydrophilic reactions (sorted fibre), which is indicated by otherauthors [47]. However, such a phenomenon, in the performed strength tests, improvedthe strength parameters of samples, in particular, ChPR and BPR samples. Therefore,the pomace addition improved the quality of phase-to-phase combinations between theused raw materials. The increased process temperature caused better consolidation ofobtained materials (Figure 6b,c) and further improvement of phase-to-phase interactionsof consolidated materials at the same time. Such a material structure could cause betterstress dissipation during sample fracture and affect the improvement of mechanical prop-erties of biocomposites, which was also stated in Reference [48]. To understand better theinteractions between the fibres and the matrix, the distribution of raw material particlesis presented (Table 2). Based on this analysis, it can be seen that the share of 0.5–1.6 mmparticles accounted for more than 40 wt%. Less than 9% were smaller than 0.25 in size.
Materials 2021, 14, x FOR PEER REVIEW 11 of 16
at a temperature of 130 °C. The process temperature increase up to 160 °C contributed to the better fluidisation of material structure (Figure 6b,d), which also could be affected by better denaturation of protein included in the raw material. Furthermore, all the obtained samples were characterised by a smooth external surface with visible small micropores (Figure 6c,f). The pores are usually formed due to rapid water evaporation and they are the result of rapid changes in pressure. The limitation of porosity is usually a challenge when planning the production process of biocomposites. However, it can be a positive feature when a protective layer is applied on such a type of products. While analysing the points of sample fractures, it can be observed that the introduction of an additional vege-table fibre (in the form of fruit pomace) makes numerous material extensions/elongations at the point of sample fracture (Figure 6h). This can be observed especially in case of ChPR and BPR (pomace 30 wt%, temperature 130 °C). According to Picard [24], such a situation occurs when the material consistency is disturbed, which makes it easier to pull out fibres under the effect of a mechanical force. In turn, the consistency disturbances can be associ-ated with hydrophobic and hydrophilic reactions (sorted fibre), which is indicated by other authors [47]. However, such a phenomenon, in the performed strength tests, im-proved the strength parameters of samples, in particular, ChPR and BPR samples. There-fore, the pomace addition improved the quality of phase-to-phase combinations between the used raw materials. The increased process temperature caused better consolidation of obtained materials (Figure 6b,c) and further improvement of phase-to-phase interactions of consolidated materials at the same time. Such a material structure could cause better stress dissipation during sample fracture and affect the improvement of mechanical prop-erties of biocomposites, which was also stated in Reference [48]. To understand better the interactions between the fibres and the matrix, the distribution of raw material particles is presented (Table 2). Based on this analysis, it can be seen that the share of 0.5–1.6 mm parti-cles accounted for more than 40 wt%. Less than 9% were smaller than 0.25 in size.
Figure 6. Scanning electron microscope (SEM) images of selected biocomposite samples: (a) samplefracture site ChPR (30_130), (b) sample fracture site ChPR (30_160), (c) sample surface ChPR (30_160),(d) close-up of the fibre embedded in the matrix ChPR (30_160), (e) sample (control 1), (f) APR samplearea (30_160), (g) sample fracture site RPR (30_130), (h) sample fracture site APR (30_130).
Materials 2021, 14, 890 12 of 16
3.5. Thermogravimetry Analysis (TGA) and Derivative Differential Thermal Analysis (DTA)
Graphics (Figure 7a–d) present the results of thermogravimetry analysis (TGA) andderivative differential thermal analysis (DTA). The TGA was carried out for the share ofpomace equal to 10 and 30 wt%, manufactured at the process temperature of 130 ◦C. It wasfound that in both cases, the mass loss took place in five main stages. The first temperaturestage (30–170 ◦C) corresponds mainly to water evaporation from the sample. The masslosses in this stage ranged between 6.17% (BPR sample) and 7.63% (APR sample), forbiocomposites with the 10 wt% share of pomace. The significant reduction of evaporatedwater was observed in case of BPR, APR and RPR composites with an addition of 30 wt%of pomace. The ChPR biocomposites, regardless of the amount of chokeberry pomaceaddition, were characterised by the mass loss at the level of 7.42–7.62%. The mass loss in thesecond zone ranged between 4.28% (ChPR with 30 wt% of pomace) and 5.42% (RPR with10 wt% of pomace) and was associated with softening, mainly of cellulosic components,which is also indicated by Kamdem et al. [41]. The further mass loss in the temperaturerange of 220–260 ◦C could be due to degradation of hemicellulose and the beginning ofdegradation of fats contained in post-extraction meal. The next stage of temperature range(260–400 ◦C) covers mainly cellulose degradation [49]. The BPR sample (30 wt% of pomace)was significantly characterised by the highest thermal resistance in this process stage. Thiscan be justified by the increased thermal resistance of lignin in relation to cellulose andhemicellulose contained in the raw material, which is indicated by Lisowski et al. andKim et al. [12,50]. In the last temperature zone (400–600 ◦C), the mass loss was caused bydepolymerisation and degradation of biocomposite components. In this stage, the massloss is associated with the acetylated degradation of components of high molecular massand other processes [51]. It was also found that the highest value of temperature, i.e.,152.7 ◦C, at which a 5% mass loss was recorded, was identified in the APR biocomposites(30 wt% of pomace), and the lowest value of temperature, i.e., 104 ◦C, was identified in theChPR materials (10 wt% of pomace). A 50% mass loss was recorded in the temperaturerange between 344 and 358 ◦C, which also corresponded to the highest values of the massderivative (Figure 7c, d). This is due to the high content of cellulosic components in theraw material composition of biocomposites.
Materials 2021, 14, x FOR PEER REVIEW 12 of 16
Figure 6. Scanning electron microscope (SEM) images of selected biocomposite samples: (a) sam-ple fracture site ChPR (30_130), (b) sample fracture site ChPR (30_160), (c) sample surface ChPR (30_160), (d) close-up of the fibre embedded in the matrix ChPR (30_160), (e) sample (control 1), (f) APR sample area (30_160), (g) sample fracture site RPR (30_130), (h) sample fracture site APR (30_130).
3.5. Thermogravimetry Analysis (TGA) and Derivative Differential Thermal Analysis (DTA) Graphics (Figure 7a–d) present the results of thermogravimetry analysis (TGA) and
derivative differential thermal analysis (DTA). The TGA was carried out for the share of pomace equal to 10 and 30 wt%, manufactured at the process temperature of 130 °C. It was found that in both cases, the mass loss took place in five main stages. The first tem-perature stage (30–170 °C) corresponds mainly to water evaporation from the sample. The mass losses in this stage ranged between 6.17% (BPR sample) and 7.63% (APR sample), for biocomposites with the 10 wt% share of pomace. The significant reduction of evapo-rated water was observed in case of BPR, APR and RPR composites with an addition of 30 wt% of pomace. The ChPR biocomposites, regardless of the amount of chokeberry pomace addition, were characterised by the mass loss at the level of 7.42–7.62%. The mass loss in the second zone ranged between 4.28% (ChPR with 30 wt% of pomace) and 5.42% (RPR with 10 wt% of pomace) and was associated with softening, mainly of cellulosic components, which is also indicated by Kamdem et al. [41]. The further mass loss in the temperature range of 220–260 °C could be due to degradation of hemicellulose and the beginning of degradation of fats contained in post-extraction meal. The next stage of tem-perature range (260–400 °C) covers mainly cellulose degradation [49]. The BPR sample (30 wt% of pomace) was significantly characterised by the highest thermal resistance in this process stage. This can be justified by the increased thermal resistance of lignin in relation to cellulose and hemicellulose contained in the raw material, which is indicated by Lisowski et al. and Kim et al. [12,50]. In the last temperature zone (400–600 °C), the mass loss was caused by depolymerisation and degradation of biocomposite components. In this stage, the mass loss is associated with the acetylated degradation of components of high molecular mass and other processes [51]. It was also found that the highest value of temperature, i.e., 152.7 °C, at which a 5% mass loss was recorded, was identified in the APR biocomposites (30 wt% of pomace), and the lowest value of temperature, i.e., 104 °C, was identified in the ChPR materials (10 wt% of pomace). A 50% mass loss was recorded in the temperature range between 344 and 358 °C, which also corresponded to the highest values of the mass derivative (Figure 7c, d). This is due to the high content of cellulosic components in the raw material composition of biocomposites.
Materials 2021, 14, 890 13 of 16Materials 2021, 14, x FOR PEER REVIEW 13 of 16
Figure 7. Thermogravimetric analyses of biocomposites: (a) mass loss of biocomposites containing 10 wt% of pomace, (b) mass loss of biocomposites containing 30 wt% of pomace, (c) derivative mass change of biocomposites containing 10 wt% of pomace, (d) derivative mass change of biocomposites containing 30 wt% of pomace.
3.6. Fourier Transform Infrared Spectroscopy (FTIR) The FTIR analysis was conducted for biocomposite samples manufactured at tem-
peratures of 130 and 160 °C, with the highest pomace share of 30 wt% (Figure 8a,b). It was found that the obtained spectra showed a similar distribution, and the observed vibration types were typical for cellulose-rich organic materials, which was confirmed by Refer-ences [24,52]. The use of additions of various fruit pomace did not contribute to formation of new groups of compounds—only a small shift in the spectrum transmittance distribu-tion was observed. However, comparing the spectra obtained on the basis of the tests of samples manufactured at temperatures of 130 and 160 °C, a slight transmittance increase for hydroxyl bonds (-OH) was stated, in tandem with the process temperature increase. It was also found that the obtained results can be divided into three main areas. The first of them is between 2800 and 3500 cm−1, where the observed peaks can be associated with ten-sion vibrations of bonds of methyl groups (O-H). The vibrations in the second area (1500–2200 cm−1) indicate the presence of groups of compounds containing double bonds (C=C, C=O). The vibrations typical of the fingerprint range were observed in the third region, where the bands correspond to deformation vibrations and originate mainly from single C-O bonds.
Figure 7. Thermogravimetric analyses of biocomposites: (a) mass loss of biocomposites containing 10 wt% of pomace, (b)mass loss of biocomposites containing 30 wt% of pomace, (c) derivative mass change of biocomposites containing 10 wt% ofpomace, (d) derivative mass change of biocomposites containing 30 wt% of pomace.
The FTIR analysis was conducted for biocomposite samples manufactured at tem-peratures of 130 and 160 ◦C, with the highest pomace share of 30 wt% (Figure 8a,b). Itwas found that the obtained spectra showed a similar distribution, and the observed vi-bration types were typical for cellulose-rich organic materials, which was confirmed byReferences [24,52]. The use of additions of various fruit pomace did not contribute toformation of new groups of compounds—only a small shift in the spectrum transmittancedistribution was observed. However, comparing the spectra obtained on the basis of thetests of samples manufactured at temperatures of 130 and 160 ◦C, a slight transmittanceincrease for hydroxyl bonds (-OH) was stated, in tandem with the process temperatureincrease. It was also found that the obtained results can be divided into three main areas.The first of them is between 2800 and 3500 cm−1, where the observed peaks can be associ-ated with tension vibrations of bonds of methyl groups (O-H). The vibrations in the secondarea (1500–2200 cm−1) indicate the presence of groups of compounds containing doublebonds (C=C, C=O). The vibrations typical of the fingerprint range were observed in thethird region, where the bands correspond to deformation vibrations and originate mainlyfrom single C-O bonds.
Materials 2021, 14, x FOR PEER REVIEW 13 of 16
Figure 7. Thermogravimetric analyses of biocomposites: (a) mass loss of biocomposites containing 10 wt% of pomace, (b) mass loss of biocomposites containing 30 wt% of pomace, (c) derivative mass change of biocomposites containing 10 wt% of pomace, (d) derivative mass change of biocomposites containing 30 wt% of pomace.
3.6. Fourier Transform Infrared Spectroscopy (FTIR) The FTIR analysis was conducted for biocomposite samples manufactured at tem-
peratures of 130 and 160 °C, with the highest pomace share of 30 wt% (Figure 8a,b). It was found that the obtained spectra showed a similar distribution, and the observed vibration types were typical for cellulose-rich organic materials, which was confirmed by Refer-ences [24,52]. The use of additions of various fruit pomace did not contribute to formation of new groups of compounds—only a small shift in the spectrum transmittance distribu-tion was observed. However, comparing the spectra obtained on the basis of the tests of samples manufactured at temperatures of 130 and 160 °C, a slight transmittance increase for hydroxyl bonds (-OH) was stated, in tandem with the process temperature increase. It was also found that the obtained results can be divided into three main areas. The first of them is between 2800 and 3500 cm−1, where the observed peaks can be associated with ten-sion vibrations of bonds of methyl groups (O-H). The vibrations in the second area (1500–2200 cm−1) indicate the presence of groups of compounds containing double bonds (C=C, C=O). The vibrations typical of the fingerprint range were observed in the third region, where the bands correspond to deformation vibrations and originate mainly from single C-O bonds.
Materials 2021, 14, 890 14 of 16Materials 2021, 14, x FOR PEER REVIEW 14 of 16
Figure 8. Fourier Transform Infrared Spectroscopy (FTIR): (a) tests of biocomposites containing 30 wt% of pomace, produced at process temperature of 130 °C, (b) tests of biocomposites containing 30 wt% of pomace, produced at process temperature of 160 °C.
4. Conclusions On the basis of the obtained results, it can be concluded that all the used raw materi-
als (with assumed manufacture process parameters) can be used for the direct production of biocomposites on the basis of rapeseed meal made of MCC. It is useful to use an addi-tion of chokeberry, apple, raspberry and currant pomace in the amount of 30%, which has a substantial impact on the improvement of flexural strength and the increase of water contact angle of the surface. The increase of the fruit pomace share in the samples up to 30%, regardless of the used biocomposite production temperature, causes the increase of water contact angle. The biocomposites, reinforced with an addition of chokeberry and currant pomace (addition of 20 and 30 wt%), had the best flexural strength parameters (FS) from among the tested materials, where the strength parameters ranged from 11.1 to 12.3 MPa, regardless of the used process temperature. Such results can be promising for further research associated with the limitation of the energy intensity through a reduction of the temperature in the hot-pressing process. The highest Young’s modulus of biocom-posites was 1.43 GPa, which is a promising result compared to other studies. An analysis of SEM pictures showed that the irregular extended shapes (with numerous fibres) can be observed in the fracture of the tested sample, which improves physical and mechanical parameters of such materials. Generally, the increase of pomace share reduces luminosity (L*), which was observed for each analysed biocomposite. It is useful to use an addition of ChPR and BPR pomace to the biocomposite because the colour changes (ΔE) due to the increase of process temperature can be imperceptible with the naked eye. All the manu-factured materials are characterised by the high thermal resistance between 170 and 220 °C, which is positive from the point of view of their further use, e.g., as formulated products. The use of additives of various fruit pomace (tested in this work) does not contribute to the formation of new groups of compounds. Taking into account the above, the obtained samples may have application potential, e.g., biodegradable kitchen accessories, packag-ing and various utility elements, and others.
Funding: This research was funded by “National Science Center, Poland, MINIATURA 3, no. 2019/03/X/NZ9/01608”. The APC was funded by Warsaw University of Life Sciences (Institute of Mechanical Engineering)
Acknowledgments: I would like to thank the National Science Center (Poland) for the financial support I received for conducting this research.
Figure 8. Fourier Transform Infrared Spectroscopy (FTIR): (a) tests of biocomposites containing30 wt% of pomace, produced at process temperature of 130 ◦C, (b) tests of biocomposites containing30 wt% of pomace, produced at process temperature of 160 ◦C.
4. Conclusions
On the basis of the obtained results, it can be concluded that all the used raw materials(with assumed manufacture process parameters) can be used for the direct production ofbiocomposites on the basis of rapeseed meal made of MCC. It is useful to use an additionof chokeberry, apple, raspberry and currant pomace in the amount of 30%, which hasa substantial impact on the improvement of flexural strength and the increase of watercontact angle of the surface. The increase of the fruit pomace share in the samples up to 30%,regardless of the used biocomposite production temperature, causes the increase of watercontact angle. The biocomposites, reinforced with an addition of chokeberry and currantpomace (addition of 20 and 30 wt%), had the best flexural strength parameters (FS) fromamong the tested materials, where the strength parameters ranged from 11.1 to 12.3 MPa,regardless of the used process temperature. Such results can be promising for furtherresearch associated with the limitation of the energy intensity through a reduction of thetemperature in the hot-pressing process. The highest Young’s modulus of biocompositeswas 1.43 GPa, which is a promising result compared to other studies. An analysis of SEMpictures showed that the irregular extended shapes (with numerous fibres) can be observedin the fracture of the tested sample, which improves physical and mechanical parametersof such materials. Generally, the increase of pomace share reduces luminosity (L*), whichwas observed for each analysed biocomposite. It is useful to use an addition of ChPRand BPR pomace to the biocomposite because the colour changes (∆E) due to the increaseof process temperature can be imperceptible with the naked eye. All the manufacturedmaterials are characterised by the high thermal resistance between 170 and 220 ◦C, which ispositive from the point of view of their further use, e.g., as formulated products. The use ofadditives of various fruit pomace (tested in this work) does not contribute to the formationof new groups of compounds. Taking into account the above, the obtained samples mayhave application potential, e.g., biodegradable kitchen accessories, packaging and variousutility elements, and others.
Funding: This research was funded by “National Science Center, Poland, MINIATURA 3, no.2019/03/X/NZ9/01608”. The APC was funded by Warsaw University of Life Sciences (Institute ofMechanical Engineering).
Data Availability Statement: The data presented in this study are available on request from thecorresponding author.
Materials 2021, 14, 890 15 of 16
Acknowledgments: I would like to thank the National Science Center (Poland) for the financialsupport I received for conducting this research.
Conflicts of Interest: The author declares no conflict of interest.
References1. Gowman, A.C.; Picard, M.C.; Lim, L.T.; Misra, M.; Mohanty, A.K. Fruit Waste Valorization for Biodegradable Biocomposite
Applications: A Review. BioResources 2019, 14, 10047–10092. [CrossRef]2. Borowski, P.F. Zonal and Nodal Models of energy market in European Union. Energies 2020, 13, 4182. [CrossRef]3. Kupczyk, A.; Maczynska-Seczek, J.; Golisz, E.; Borowski, P.F. Renewable Energy Sources in Transport on the Example of Methyl
Esters and Bioethanol. Processes 2020, 8, 1610. [CrossRef]4. Zhu, Z.; Gavahian, M.; Barba, F.J.; Roselló-Soto, E.; Kovacevic, D.B.; Putnik, P.; Denoya, G.I. Valorization of waste and by-products
from food industries through the use of innovative technologies. In Agri-Food Industry Strategies for Healthy Diets and Sustainability;Academic Press: Cambridge, MA, USA, 2020; pp. 249–266.
5. Zelazinski, T.; Ekielski, A.; Tulska, E.; Vladut, V.; Durczak, K. Wood dust application for improvement of selected properties ofthermoplastic starch. Inmateh-Agric. Eng. 2019, 58, 37–44.
6. Oliver-Ortega, H.; Julian, F.; Espinach, F.X.; Tarrés, Q.; Ardanuy, M.; Mutjé, P. Research on the use of lignocellulosic fibersreinforced bio-polyamide 11 with composites for automotive parts: Car door handle case study. J. Clean. Prod. 2019, 226, 64–73.[CrossRef]
7. Kremensas, A.; Kairyte, A.; Vaitkus, S.; Vejelis, S.; Balciunas, G. Mechanical performance of biodegradable thermoplasticpolymer-based biocomposite boards from hemp shivs and corn starch for the building industry. Materials 2019, 12, 845. [CrossRef]
8. Song, Q.; Li, J.; Zeng, X. Minimizing the increasing solid waste through zero waste strategy. J. Clean. Prod. 2015, 104, 199–210.[CrossRef]
9. Sánchez-Safont, E.L.; Aldureid, A.; Lagarón, J.M.; Gámez-Pérez, J.; Cabedo, L. Biocomposites of different lignocellulosic wastesfor sustainable food packaging applications. Compos. Part B Eng. 2018, 145, 215–225. [CrossRef]
10. Fierascu, R.C.; Sieniawska, E.; Ortan, A.; Fierascu, I.; Xiao, J. Fruits By-Products—A Source of Valuable Active Principles. A ShortReview. Front. Bioeng. Biotechnol. 2020, 8, 319. [CrossRef]
11. Rodriguez, L.J.; Peças, P.; Carvalho, H.; Orrego, C.E. A literature review on life cycle tools fostering holistic sustainabilityassessment: An application in biocomposite materials. J. Environ. Manag. 2020, 262, 110308. [CrossRef]
12. Lisowski, A.; Pajor, M.; Swietochowski, A.; Dabrowska, M.; Klonowski, J.; Mieszkalski, L.; Ekielski, A.; Stasiak, M.; Piatek, M.Effects of moisture content, temperature, and die thickness on the compaction process, and the density and strength of walnutshell pellets. Renew. Energy 2019, 141, 770–781. [CrossRef]
13. Nanthananon, P.; Seadan, M.; Pivsa-Art, S.; Hamada, H.; Suttiruengwong, S. Reactive Compatibilization of Short-Fiber ReinforcedPoly (lactic acid) Biocomposites. J. Renew. Mater. 2018, 6, 573–583. [CrossRef]
14. Jiang, Y.; Simonsen, J.; Zhao, Y. Compression-molded biocomposite boards from red and white wine grape pomaces. J. Appl.Polym. Sci. 2011, 119, 2834–2846. [CrossRef]
15. Kim, J.T.; Netravali, A.N. Mechanical, thermal, and interfacial properties of green composites with ramie fiber and soy resins. J.Agric. Food Chem. 2010, 58, 5400–5407. [CrossRef] [PubMed]
16. Prochon, M.; Ntumba, Y.H.T. Effects of Biopolymer Keratin Waste Sources in XNBR Compounds. Rubber Chem. Technol. 2015,88, 258–275. [CrossRef]
17. Kim, J.R.; Netravali, A.N. Self-healing green composites based on soy protein and microfibrillated cellulose. Compos. Sci. Technol.2017, 143, 22–30. [CrossRef]
18. Cibulkova, Z.; Cerna, A.; Simon, P.; Uhlar, J.; Kosar, K.; Lehocky, P. Stabilization effect of potential antioxidants on the thermoox-idative stability of styrene–butadiene rubber. J. Therm. Anal. Calorim. 2011, 105, 607–613. [CrossRef]
19. Prochon, M.; Janowska, G.; Przepiorkowska, A.; Kucharska-Jastrzabek, A. Thermal stability and flammability of biodecomposableelastomer materials. Polimery 2013, 58, 413–420. [CrossRef]
20. Goudarzi, T.; Spring, D.W.; Paulino, G.H.; Lopez-Pamies, O. Filled elastomers: A theory of filler reinforcement based onhydrodynamic and interphasial effects. J. Mech. Phys. Solids 2015, 80, 37–67. [CrossRef]
21. Pichandi, S.; Rana, S.; Parveen, S.; Fangueiro, R. A green approach of improving interface and performance of plant fibrecomposites using microcrystalline cellulose. Carbohydr. Polym. 2018, 197, 137–146. [CrossRef] [PubMed]
23. Park, S.I.; Jiang, Y.; Simonsen, J.; Zhao, Y. Feasibility of creating compression-molded biocomposite boards from berry fruitpomaces. J. Appl. Polym. Sci. 2010, 115, 127–136. [CrossRef]
24. Picard, M.C.; Rodriguez-Uribe, A.; Thimmanagari, M.; Misra, M.; Mohanty, A.K. Sustainable biocomposites from poly (butylenesuccinate) and apple pomace: A study on compatibilization performance. Waste Biomass Valorization 2020, 11, 3775–3787.[CrossRef]
25. Górecka, D.; Pachołek, B.; Dziedzic, K.; Górecka, M. Raspberry pomace as a potential fiber source for cookies enrichment. ActaSci. Pol. Technol. Aliment. 2010, 9, 451–461.
26. Nawirska, A.; Kwasniewska, M. Dietary fibre fractions from fruit and vegetable processing waste. Food Chem. 2005, 91, 221–225.[CrossRef]
27. DIN ISO 3310-1: 2017-11. Test Sieves—Technical Requirements and Testing—Part 1: Test Sieves of Metal Wire Cloth; German Institutefor Standardization: Berlin, Germany, 2017.
28. PN-EN ISO 178:2011. Plastics—Determination of Flexural Properties (Tworzywa Sztuczne—Oznaczanie Własciwosci Przy Zginaniu);Polish Standardization Committee: Warsaw, Poland, 2011.
29. Giri, J.; Lach, R.; Grellmann, W.; Susan, M.A.; Saiter, J.M.; Henning, S.; Katiyar, V.; Adhikari, R. Compostable composites ofwheat stalk micro-and nanocrystalline cellulose and poly (butylene adipate-co-terephthalate): Surface properties and degradationbehavior. J. Appl. Polym. Sci. 2019, 136, 48149. [CrossRef]
30. Robin, F.; Dubois, C.; Pineau, N.; Schuchmann, H.P.; Palzer, S. Expansion mechanism of extruded foams supplemented withwheat bran. J. Food Eng. 2011, 107, 80–89. [CrossRef]
31. Sarasini, F.; Fiore, V. A systematic literature review on less common natural fibres and their biocomposites. J. Clean. Prod. 2018,195, 240–267. [CrossRef]
32. Ramesh, M.; Palanikumar, K.; Reddy, K.H. Plant fibre based bio-composites: Sustainable and renewable green materials. Renew.Sustain. Energy Rev. 2017, 79, 558–584. [CrossRef]
34. Su, J.F.; Huang, Z.; Yuan, X.Y.; Wang, X.Y.; Li, M. Structure and properties of carboxymethyl cellulose/soy protein isolate blendedible films crosslinked by Maillard reactions. Carbohydr. Polym. 2010, 79, 145–153. [CrossRef]
35. Mishra, P.K.; Ekielski, A. A simple method to synthesize lignin nanoparticles. Colloids Interfaces 2019, 3, 52. [CrossRef]36. Raj, S.A.; Muthukumaran, E.; Jayakrishna, K. A case study of 3D printed PLA and its mechanical properties. Mater. Today Proc.
2018, 5, 11219–11226. [CrossRef]37. Grylewicz, A.; Spychaj, T.; Zdanowicz, M. Thermoplastic starch/wood biocomposites processed with deep eutectic solvents.
Compos. Part A Appl. Sci. Manuf. 2019, 121, 517–524. [CrossRef]38. Nourbakhsh, A.; Baghlani, F.F.; Ashori, A. Nano-SiO2 filled rice husk/polypropylene composites: Physico-mechanical properties.
Ind. Crop. Prod. 2011, 33, 183–187. [CrossRef]39. Aydin, I.; Colakoglu, G. Variation in surface roughness, wettability and some plywood properties after preservative treatment
with boron compounds. Build. Environ. 2007, 42, 3837–3840. [CrossRef]40. Rodríguez-Gutiérrez, G.; Rubio-Senent, F.; Lama-Muñoz, A.; Garcia, A.; Fernández-Bolaños, J. Properties of lignin, cellulose, and
hemicelluloses isolated from olive cake and olive stones: Binding of water, oil, bile acids, and glucose. J. Agric. Food Chem. 2014,62, 8973–8981. [CrossRef] [PubMed]
41. Kamdem, D.P.; Shen, Z.; Nabinejad, O.; Shu, Z. Development of biodegradable composite chitosan-based films incorporated withxylan and carvacrol for food packaging application. Food Packag. Shelf Life 2019, 21, 100344. [CrossRef]
43. Wang, X.; Pan, Y.; Yuan, H.; Su, M.; Shao, C.; Liu, C.; Guo, Z.; Shen, C.; Liu, X. Simple fabrication of superhydrophobic PLA withhoneycomb-like structures for high-efficiency oil-water separation. Chin. Chem. Lett. 2020, 31, 365–368. [CrossRef]
44. Bhasney, S.M.; Patwa, R.; Kumar, A.; Katiyar, V. Plasticizing effect of coconut oil on morphological, mechanical, thermal,rheological, barrier, and optical properties of poly(lactic acid): A promising candidate for food packaging. J. Appl. Polym. Sci.2017, 134, 45390. [CrossRef]
45. Roda-Serrat, M.C.; Andrade, T.A.; Rindom, J.; Lund, P.B.; Norddahl, B.; Errico, M. Optimization of the recovery of anthocyaninsfrom chokeberry juice pomace by homogenization in acidified water. Waste Biomass Valorization 2020, 1–13. [CrossRef]
46. Murata, M. Browning and pigmentation in food through the Maillard reaction. Glycoconj. J. 2020, 1–10. [CrossRef] [PubMed]47. Mofokeng, J.P.; Luyt, A.S.; Tábi, T.; Kovács, J. Comparison of injection moulded, natural fibre-reinforced composites with PP and
PLA as matrices. J. Thermoplast. Compos. Mater. 2012, 25, 927–948. [CrossRef]48. Muthuraj, R.; Misra, M.; Mohanty, A.K. Biodegradable biocomposites from poly (butylene adipate-co-terephthalate) and
miscanthus: Preparation, compatibilization, and performance evaluation. J. Appl. Polym. Sci. 2017, 134, 45448. [CrossRef]49. Cichosz, S.; Masek, A. Thermal Behavior of Green Cellulose-Filled Thermoplastic Elastomer Polymer Blends. Molecules 2020,
25, 1279. [CrossRef]50. Kim, H.S.; Yang, H.S.; Kim, H.J.; Lee, B.J.; Hwang, T.S. Thermal properties of agro-flour-filled biodegradable polymer bio-
composites. J. Therm. Anal. Calorim. 2005, 81, 299–306. [CrossRef]51. Yang, S.; Tang, Y.; Wang, J.; Kong, F.; Zhang, J. Surface treatment of cellulosic paper with starch-based composites reinforced with