Module -7 Properties of Fourier Series and Complex Fourier Spectrum. Objective:To understand the change in Fourier series coefficients due to different signal operations and to plot complex Fourier spectrum. Introduction: The Continuous Time Fourier Series is a good analysis tool for systems with periodicexcitation. Understanding properties of Fourier series makes the work simple in calculating the Fourier series coefficients in the case when signals modified by some basic operations. Graphical representation of a periodic signal in frequency domain represents Complex Fourier Spectrum. Description: Properties of continuous- time Fourier series The Fourier series representation possesses a number of important properties that are useful for various purposes during the transformation of signals from one form to other . Some of the properties are listed below. [x 1 (t) and x 2 (t)] are two periodic signals with period T and with Fourier series coefficients C n and D n respectively. 1) Linearity property The linearity property states that, if x 1 (t) C n and x 2 () D n then Ax 1 (t)+Bx 2 (t) AC n +BD n proof: From the definition of Fourier series, we have FS[Ax 1 (t)+Bx 2 (t)]= 1 [1 + 2 ]− 0 0 +0 =( 1 1 − 0 0 +0 )+ ( 1 2 − 0 ) 0 +0 =AC n +BD n or proved 2) Time shifting property The time shifting property states that,if x(t) C n then x(t-t 0 ) − 0 0 C n proof: From the definition of Fourier series, we have x(t)=∞ =−∞ 0 x(t-t 0 )=∞ =−∞ 0 (− 0 ) =[∞ =−∞ − 0 ]0 =FS -1 [C n − 0 ] Ax 1 (t)+Bx 2 (t) AC n +BD n x(t-t 0 ) − 0 0 C n
Transcript
Module -7
Properties of Fourier Series and Complex Fourier Spectrum.
Objective:To understand the change in Fourier series coefficients due to different signal
operations and to plot complex Fourier spectrum.
Introduction:
The Continuous Time Fourier Series is a good analysis tool for systems with
periodicexcitation. Understanding properties of Fourier series makes the work simple in
calculating the Fourier series coefficients in the case when signals modified by some basic
operations.
Graphical representation of a periodic signal in frequency domain represents Complex
Fourier Spectrum.
Description:
Properties of continuous- time Fourier series
The Fourier series representation possesses a number of important properties
that are useful for various purposes during the transformation of signals from one form to other .
Some of the properties are listed below.
[x1(t) and x2(t)] are two periodic signals with period T and with Fourier series
coefficients Cn and Dn respectively.
1) Linearity property
The linearity property states that, if
x1(t)𝐹𝑠 Cn and x2 (𝑡)
𝐹𝑠 Dn
then Ax1(t)+Bx2(t) 𝐹𝑠 ACn+BDn
proof: From the definition of Fourier series, we have
FS[Ax1(t)+Bx2(t)]=1
𝑇 [𝐴𝑥1 𝑡 + 𝐵𝑥2 𝑡 ]𝑒−𝑗𝑛𝜔0𝑡𝑑𝑡𝑡0+𝑇
𝑡0
=𝐴(1
𝑇 𝑥1 𝑡 𝑒
−𝑗𝑛𝜔0𝑡𝑑𝑡𝑡0+𝑇
𝑡0)+ 𝐵(
1
𝑇 𝑥2 𝑡 𝑒
−𝑗𝑛𝜔0𝑡𝑑𝑡)𝑡0+𝑇
𝑡0
=ACn+BDn
or proved
2) Time shifting property
The time shifting property states that,if
x(t)𝐹𝑠 Cn
then x(t-t0)𝐹𝑠 𝑒−𝑗𝑛𝜔0𝑡0Cn
proof: From the definition of Fourier series, we have
x(t)= 𝐶𝑛∞𝑛=−∞ 𝑒𝑗𝑛 𝜔0𝑡
x(t-t0)= 𝐶𝑛∞𝑛=−∞ 𝑒𝑗𝑛 𝜔0(𝑡−𝑡0)
= [𝐶𝑛∞𝑛=−∞ 𝑒−𝑗𝑛𝜔0𝑡]𝑒𝑗𝑛 𝜔0𝑡
=FS-1
[Cn𝑒−𝑗𝑛𝜔0𝑡]
Ax1(t)+Bx2(t)𝐹𝑠 ACn+BDn
x(t-t0)𝐹𝑠 𝑒−𝑗𝑛𝜔0𝑡0Cn
Or proved
3) Time reversal property
The time reversal property states that,if
x(t)𝐹𝑠 Cn
then x(-t)𝐹𝑠 C-n
proof: From the definition of Fourier series, we have
x(t)= 𝐶𝑛∞𝑛=−∞ 𝑒𝑗𝑛 𝜔0𝑡
x(-t)= 𝐶𝑛∞𝑛=−∞ 𝑒𝑗𝑛 𝜔0(−𝑡)
substituting n = -p in the right hand side, we get
x(-t)= 𝐶−𝑝−∞𝑝=∞ 𝑒𝑗 (−𝑝)𝜔0(−𝑡) = 𝐶−𝑝
∞𝑝=−∞ 𝑒𝑗𝑝 𝜔0𝑡
substituting p = n , we get
x(-t)= 𝐶−𝑛∞𝑛=−∞ 𝑒𝑗𝑛 𝜔0𝑡 = FS
-1[C-n]
proved
4) Time scaling property
The time scaling property states that , if
x(t)𝐹𝑠 Cn
then x(𝛼t)𝐹𝑠 Cn with ω0→𝛼ω0
proof: From the definition of Fourier series, we have
x(t)= 𝐶𝑛∞𝑛=−∞ 𝑒𝑗𝑛 𝜔0𝑡
x(𝛼t)= 𝐶𝑛∞𝑛=−∞ 𝑒𝑗𝑛 𝜔0𝛼𝑡= 𝐶𝑛
∞𝑛=−∞ 𝑒𝑗𝑛 (𝜔0𝛼)𝑡= FS
-1[Cn]
where ω0→𝛼ω0.
proved.
5) Time differential property
The time differential property states that, if
x(t)𝐹𝑠 Cn
then 𝑑𝑥 (𝑡)
𝑑𝑡
𝐹𝑠 jnω0Cn
proof: From the definition of Fourier series, we have
x(t)= 𝐶𝑛∞𝑛=−∞ 𝑒𝑗𝑛 𝜔0𝑡
Differentiating both sides with respect to t, we get 𝑑𝑥 (𝑡)
𝑑𝑡= 𝐶𝑛
𝑑(𝑒 𝑗𝑛 𝜔0𝑡)
𝑑𝑡∞𝑛=−∞ = 𝐶𝑛(jnω0)∞
𝑛=−∞ 𝑒𝑗𝑛 𝜔0𝑡
= 𝐶𝑛(jnω0)∞𝑛=−∞ 𝑒𝑗𝑛 𝜔0𝑡 = FS
-1[jnω0Cn]
Proved.
6) Time integration property
x(-t)𝐹𝑠 C-n
x(𝛼t)𝐹𝑠 Cn with fundamental frequency of 𝛼ω0
𝑑𝑥 (𝑡)
𝑑𝑡
𝐹𝑠 jnω0Cn
The time integration property states that,
if x(t)𝐹𝑠 Cn
then 𝑥 𝜏 𝑑𝜏𝑡
−∞
𝐹𝑆
𝐶𝑛
𝑗𝑛 𝜔0 (if C0 = 0)
proof: From the definition of Fourier series, we have
x(t)= 𝐶𝑛∞𝑛=−∞ 𝑒𝑗𝑛 𝜔0𝑡
𝑥 𝜏 𝑑𝜏𝑡
−∞ = [ 𝐶𝑛
∞𝑛=−∞ 𝑒𝑗𝑛 𝜔0𝜏]𝑑𝜏
𝑡
−∞
Interchanging the order of integration and summation, we get
𝑥 𝜏 𝑑𝜏𝑡
−∞ = 𝐶𝑛
∞𝑛=−∞ 𝑒𝑗𝑛 𝜔0𝜏𝑑𝜏
𝑡
−∞
= 𝐶𝑛∞𝑛=−∞ [
𝑒 𝑗𝑛 𝜔0𝜏
𝑗𝑛 𝜔0 ] −∞
𝑡
= (𝐶𝑛
𝑗𝑛 𝜔0)∞
𝑛=−∞ 𝑒𝑗𝑛 𝜔0𝑡 = FS-1
[𝐶𝑛
𝑗𝑛 𝜔0]
Proved.
7) Convolution theorem or property
The convolution theorem or property states that , The Fourier series of the
convolution of two time domain functions x1(t) and x2(t) is equal to the multiplication of their
Fourier series coefficients, i.e.”Convolution of two functions in time domain is equivalent to
multiplication of their Fourier coefficients in frequency domain”.
The convolution property states that,if
x1(t)𝐹𝑠 Cn and x2 (𝑡)
𝐹𝑠 Dn
then x1(t)*x2(t) 𝐹𝑠 TCnDn
proof: From the definition of Fourier series, we have
FS[x1(t)*x2(t)]=1
𝑇 [x1(t) ∗ x2(t)]𝑡0+𝑇
𝑡0𝑒−𝑗𝑛𝜔0𝑡𝑑𝑡 =
1
𝑇 [x1(t) ∗ x2(t)]𝑇
0𝑒−𝑗𝑛𝜔0𝑡𝑑𝑡
But from the convolution integral for a periodic signal, we have
x1(t) ∗ x2(t)= x1(τ) ∗ x2(t − τ)𝑇
0𝑑𝜏 or x1(t) ∗ x2(t)= x1(t − τ) ∗ x2(τ)
𝑇
0𝑑𝜏
Substituting back, we get
FS[x1(t)*x2(t)] =1
𝑇 ( x1(τ) ∗ x2(t − τ)
𝑇
0𝑑𝜏)
𝑇
0𝑒−𝑗𝑛𝜔0𝑡𝑑𝑡
Interchanging the order of integration, we get
FS[x1(t)*x2(t)] =1
𝑇 x1(τ)[ x2(t − τ)
𝑇
0
𝑇
0𝑒−𝑗𝑛𝜔0𝑡𝑑𝑡] 𝑑𝜏
Substituting t-𝛕 =t' in RHS, we have dt=dt'. Substituting back, we get
FS[x1(t)*x2(t)] =1
𝑇 x1(τ)[ x2(t′)
𝑇−τ
−τ
𝑇
0𝑒−𝑗𝑛 𝜔0(𝑡 ′ +τ)𝑑𝑡′] 𝑑𝜏
=T(1
𝑇 x1(τ)𝑒−𝑗𝑛𝜔0𝑡𝑑𝛕𝑇
0) (
1
𝑇 x1(t′)𝑒−𝑗𝑛𝜔0𝑡′𝑑t′𝑇
0)
=T(Cn)(Dn)
0 to T or –𝛕 to T-𝛕 or t0 to t0+T will have the same period.
Proved.
𝑥 𝜏 𝑑𝜏𝑡
−∞
𝐹𝑆
𝐶𝑛
𝑗𝑛 𝜔0 , C0 = 0
x1(t)*x2(t)𝐹𝑠 TCnDn
8) Modulation or Multiplication property
The Modulation or Multiplication property states that,if
x1(t)𝐹𝑠 Cn and x2 (𝑡)
𝐹𝑠 Dn
then x1(t)x2(t) 𝐹𝑠 𝐶𝑙𝐷𝑛−𝑙
∞𝑙=−∞
proof: From the definition of Fourier series, we have
FS[x1(t)x2(t)]= 1
𝑇 x1 t x2 t 𝑡0+𝑇
𝑡0𝑒−𝑗𝑛𝜔0𝑡𝑑𝑡
=1
𝑇 x1 t ( 𝐶𝑙𝑒
𝑗𝑛 𝜔0𝑡∞𝑙=−∞ )
𝑡0+𝑇
𝑡0𝑒−𝑗𝑛𝜔0𝑡𝑑𝑡
=1
𝑇 x1 t ( 𝐶𝑙𝑒
−𝑗 (𝑛−𝑙)𝜔0𝑡∞𝑙=−∞ )
𝑡0+𝑇
𝑡0𝑑𝑡
Interchanging the order of integration and summation, we have
FS[x1(t)x2(t)]= 𝐶𝑙∞𝑙=−∞ (
1
𝑇 x1 t 𝑒−𝑗 (𝑛−𝑙)𝜔0𝑡𝑡0+𝑇
𝑡0𝑑𝑡) = 𝐶𝑙𝐷𝑛−𝑙
∞𝑙=−∞
Proved.
9) Conjugation and Conjugate symmetry property
If x(t)𝐹𝑠 Cn
Then the Conjugation property states that
x*(t)
𝐹𝑠 𝐶−𝑛
∗ [for complex x(t)]
proof: Conjugation property
From the definition of Fourier series, we have
FS[x*(t)]=
1
𝑇 x ∗ (t)𝑡0+𝑇
𝑡0𝑒−𝑗𝑛𝜔0𝑡𝑑𝑡=(
1
𝑇 x(t)𝑡0+𝑇
𝑡0𝑒𝑗𝑛 𝜔0𝑡𝑑𝑡)*
=(1
𝑇 x(t)𝑡0+𝑇
𝑡0𝑒−𝑗 (−𝑛)𝜔0𝑡𝑑𝑡)*
=[C-n]*
Proved.
10) Parseval’s Relation or Theorem or property
If x1(t)𝐹𝑠 Cn [for complex x1(t)]
And x2 (𝑡)𝐹𝑠 Dn [for complex x2(t)]
Then, the parsevals relation states that 1
𝑇 x1 t x2
∗ t 𝑡0+𝑇
𝑡0𝑑𝑡= Cn
∞𝑛=−∞ 𝐷𝑛
∗ [for complex x1(t) and x2(t)]
And parseval’s identity states that 1
𝑇 ⎹x(t)⎸2𝑡0+𝑇
𝑡0𝑑𝑡 = ⎹Cn⎸
2∞𝑛=−∞ if x1(t) = x2(t) = x(t)
Proof: parsevals relation
LHS =1
𝑇 x1 t x2
∗ t 𝑡0+𝑇
𝑡0𝑑𝑡 =
1
𝑇 ( 𝐶𝑛𝑒
𝑗𝑛 𝜔0𝑡∞𝑛=−∞ )
𝑡0+𝑇
𝑡0𝑥2∗𝑑𝑡
Interchanging the order of integration and summation in the RHS , we have 1
𝑇 x1 t x2
∗ t 𝑡0+𝑇
𝑡0𝑑𝑡 = 𝐶𝑛
∞𝑛=−∞ (
1
𝑇 x2
∗ t 𝑒𝑗𝑛 𝜔0𝑡𝑡0+𝑇
𝑡0𝑑𝑡)
= 𝐶𝑛∞𝑛=−∞ (
1
𝑇 x2 t 𝑒−𝑗𝑛𝜔0𝑡𝑡0+𝑇
𝑡0𝑑𝑡)*
= Cn∞𝑛=−∞ [Dn]∗
x1(t)x2(t)𝐹𝑠 𝐶𝑙𝐷𝑛−𝑙
∞𝑙=−∞
x*(t)
𝐹𝑠 𝐶−𝑛
∗
Proved
Parseval’s identity
If x1(t) = x2(t) = x(t), then the relation changes to
1
𝑇 x t x∗ t 𝑡0+𝑇
𝑡0𝑑𝑡= Cn
∞𝑛=−∞ 𝐶𝑛
∗
Since ⎹x(t)⎸2= x t x∗ t and ⎹Cn⎸2= Cn𝐶𝑛
∗ , substituting these values in above equation, we get
Proved.
Complex Fourier Spectrum
The Fourier spectrum of a periodic signal x(t) is a plot of its Fourier coefficients versus
frequency ω. It is in two parts : (a) Amplitude spectrum and (b) phase spectrum. The plot of the
amplitude of Fourier coefficients verses frequency is known as the amplitude spectra, and the
plot of the phase of Fourier coefficients verses frequency is known as phase spectra. The two
plots together are known as Fourier frequency spectra of x(t).This type of representation is also
called frequency domain representation. The Fourier spectrum exists only at discrete frequencies
nωo, where n=0,1,2,….. Hence it is known as discrete spectrum or line spectrum. The envelope
of the spectrum depends only upon the pulse shape, but not upon the period of repetition.
The trigonometric representation of a periodic signal x(t) contains both sine and cosine
terms with positive and negative amplitude coefficients (an and bn) but with no phase angles.
The cosine representation of a periodic signal contains only positive amplitude
coefficients with phase angle θn. Therefore, we can plot amplitude spectra(An versus ω)and phase
spectra (θn versus ω). Since, in this representation, Fourier coefficients exist only for positive
frequencies, this spectra is called single-sided spectra.
The exponential representation of a periodic signal x(t) contains amplitude coefficients
Cn Which are complex. Hence, they can be represented by magnitude and phase. Therefore, we
can plot two spectra, the magnitude spectrum(⎹Cn⎸versus ω) and phase spectrum ( 𝐶𝑛 versus ω).
The spectra can be plotted for both positive and negative frequencies.Henceit is called two-sided
spectra.
The below figure (a) represents the spectrum of a trigonometric Fourier series extending
from 0 to∞,producing a one-sided spectrum as no negative frequencies exist here. The figure (b)
represents the spectrum of a complex exponential Fourier series extending from -
∞𝑡𝑜∞,producing a two-sided spectrum.
The amplitude spectrum of the exponential Fourier series is symmetrical Fourier series is
symmetrical about the vertical axis. This is true for all periodic functions.
1
𝑇 x1 t x2
∗ t 𝑡0+𝑇
𝑡0𝑑𝑡= Cn
∞𝑛=−∞ 𝐷𝑛
∗
1
𝑇 ⎹x(t)⎸2𝑡0+𝑇
𝑡0𝑑𝑡 = ⎹Cn⎸
2∞𝑛=−∞
Fig: Complex frequency spectrum for (a) Trigonometric Fourier series and (b) complex
exponential Fourier series.
If Cn is a general complex number, then
Cn = ⎹Cn⎸𝑒𝑗 𝜃𝑛
C-n = ⎹Cn⎸𝑒−𝑗𝜃𝑛
Cn = ⎹C-n⎸
The magnitude spectrum is symmetrical about the vertical axis passing
through the origin, and the phase spectrum is antisymmetrical about the vertical axis passing
through the origin. So the magnitude spectrum exhibits even symmetry and phase spectrum
exhibits odd symmetry.
When x(t) is real , then C-n=𝐶𝑛∗, the complex conjugate of Cn.
Solved Problems:
Problem 1: Show that the magnitude spectrum of every periodic function is symmetrical about
the vertical axis passing through the origin and the phase spectrum is antisymmetrical about the
vertical axis passing through the origin.
Solution: The coefficient Cn of exponential Fourier series is given by
Cn = 1
𝑇 𝑥 𝑡 𝑒−𝑗𝑛𝜔0𝑡𝑑𝑡
T
2
−𝑇
2
)
And C-n = 1
𝑇 𝑥 𝑡 𝑒𝑗𝑛 𝜔0𝑡𝑑𝑡
T
2
−𝑇
2
)
It is evident from these equations that the coefficients Cn and C-n are complex conjugate of each
other , that is
Cn= 𝐶𝑛∗
Hence ⎹Cn⎸=⎹C−n⎸
It, therefore, follows that the magnitude spectrum is symmetrical about the vertical axis
passing through the origin, and hence is an even function of ω.
If Cn is real, then C-n is also real and Cn is equal to C-n. is complex, let
Cn=⎹Cn⎸ejθn
then C-n=⎹Cn⎸e−jθn
The phase of Cn is θn ;however , the phase of C-n is−θn .Hence , it is obvious that the phase
spectrum is antisymmetrical, and the magnitude spectrum is symmetrical about the vertical axis
passing through the origin.
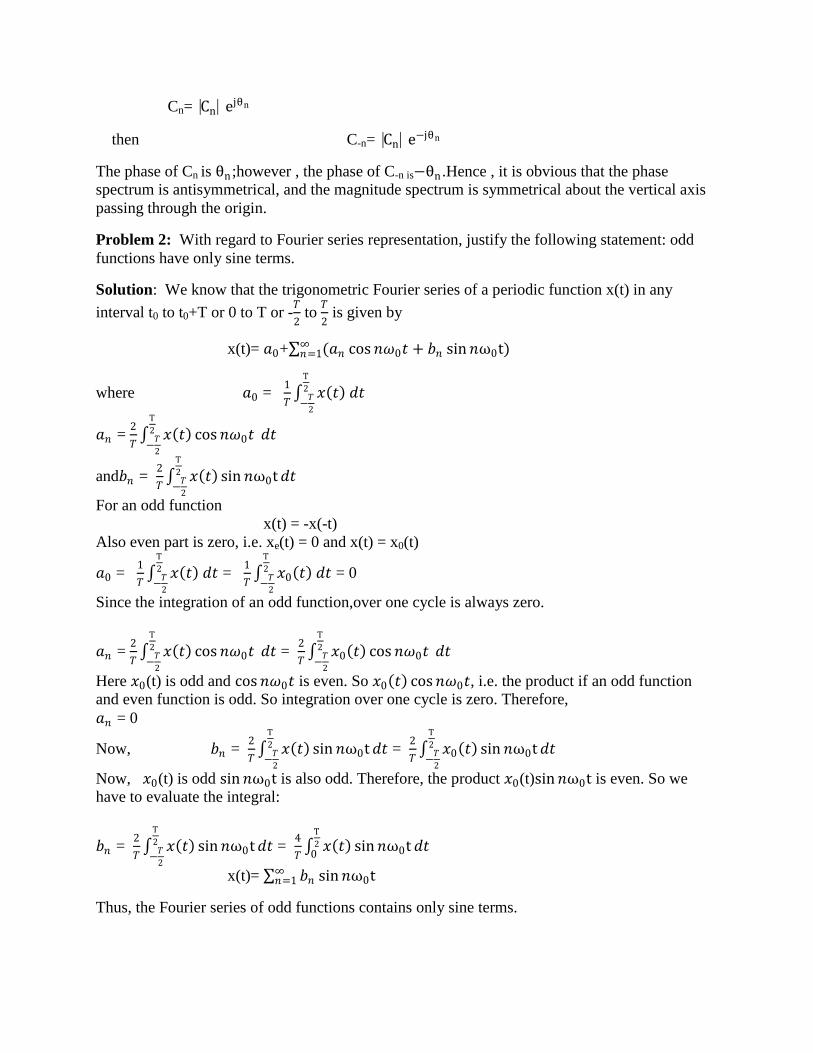
Problem 2: With regard to Fourier series representation, justify the following statement: odd
functions have only sine terms.
Solution: We know that the trigonometric Fourier series of a periodic function x(t) in any
interval t0 to t0+T or 0 to T or -𝑇
2 to
𝑇
2 is given by
x(t)= 𝑎0+ (𝑎𝑛 cos𝑛𝜔0𝑡∞𝑛=1 + 𝑏𝑛 sin𝑛ω0t)
where 𝑎0 = 1
𝑇 𝑥 𝑡 𝑑𝑡
T
2
−𝑇
2
𝑎𝑛 = 2
𝑇 𝑥 𝑡 cos𝑛𝜔0𝑡 𝑑𝑡
T
2
−𝑇
2
and𝑏𝑛 = 2
𝑇 𝑥 𝑡 sin 𝑛ω0t𝑑𝑡
T
2
−𝑇
2
For an odd function
x(t) = -x(-t)
Also even part is zero, i.e. xe(t) = 0 and x(t) = x0(t)
𝑎0 = 1
𝑇 𝑥 𝑡 𝑑𝑡
T
2
−𝑇
2
= 1
𝑇 𝑥0 𝑡 𝑑𝑡
T
2
−𝑇
2
= 0
Since the integration of an odd function,over one cycle is always zero.
𝑎𝑛 = 2
𝑇 𝑥 𝑡 cos𝑛𝜔0𝑡 𝑑𝑡
T
2
−𝑇
2
= 2
𝑇 𝑥0 𝑡 cos𝑛𝜔0𝑡 𝑑𝑡
T
2
−𝑇
2
Here 𝑥0(t) is odd and cos 𝑛𝜔0𝑡 is even. So 𝑥0 𝑡 cos𝑛𝜔0𝑡, i.e. the product if an odd function
and even function is odd. So integration over one cycle is zero. Therefore,
𝑎𝑛 = 0
Now, 𝑏𝑛 = 2
𝑇 𝑥 𝑡 sin 𝑛ω0t𝑑𝑡
T
2
−𝑇
2
= 2
𝑇 𝑥0 𝑡 sin 𝑛ω0t𝑑𝑡
T
2
−𝑇
2
Now, 𝑥0(t) is odd sin𝑛ω0t is also odd. Therefore, the product 𝑥0(t)sin𝑛ω0t is even. So we
have to evaluate the integral:
𝑏𝑛 = 2
𝑇 𝑥 𝑡 sin𝑛ω0t𝑑𝑡
T
2
−𝑇
2
= 4
𝑇 𝑥 𝑡 sin𝑛ω0t𝑑𝑡
T
20
x(t)= 𝑏𝑛 sin𝑛ω0t∞𝑛=1
Thus, the Fourier series of odd functions contains only sine terms.
Problem3: With regard to Fourier series representation, justify the following statement: Even
functions have no sine terms.
Solution: We know that the trigonometric Fourier series of a periodic function x(t) in any
interval t0 to t0+T or 0 to T or -𝑇
2 to
𝑇
2 is given by
x(t)= 𝑎0+ (𝑎𝑛 cos𝑛𝜔0𝑡∞𝑛=1 + 𝑏𝑛 sin𝑛ω0t)
where 𝑎0 = 1
𝑇 𝑥 𝑡 𝑑𝑡
T
2
−𝑇
2
𝑎𝑛 = 2
𝑇 𝑥 𝑡 cos𝑛𝜔0𝑡 𝑑𝑡
T
2
−𝑇
2
and 𝑏𝑛 = 2
𝑇 𝑥 𝑡 sin 𝑛ω0t𝑑𝑡
T
2
−𝑇
2
For an even function
x(t) = x(-t)
Also odd part is zero, i.e. x(t) = xe(t)
𝑎0 = 1
𝑇 𝑥 𝑡 𝑑𝑡
T
2
−𝑇
2
= 1
𝑇 𝑥𝑒 𝑡 𝑑𝑡
T
2
−𝑇
2
= 2
𝑇 𝑥 𝑡 𝑑𝑡
T
20
𝑎𝑛 = 2
𝑇 𝑥 𝑡 cos𝑛𝜔0𝑡 𝑑𝑡
T
2
−𝑇
2
= 2
𝑇 𝑥𝑒 𝑡 cos𝑛𝜔0𝑡 𝑑𝑡
T
2
−𝑇
2
𝑥𝑒(t) is even and also cos 𝑛𝜔0𝑡 is even. So, the product 𝑥𝑒(t)cos𝑛𝜔0𝑡 is even. So we have to
evaluate the integral:
𝑎𝑛 = 2
𝑇 𝑥𝑒 𝑡 cos𝑛𝜔0𝑡 𝑑𝑡
T
2
−𝑇
2
= 4
𝑇 𝑥 𝑡 cos𝑛𝜔0𝑡 𝑑𝑡
T
20
𝑏𝑛 = 2
𝑇 𝑥 𝑡 sin𝑛ω0t𝑑𝑡
T
2
−𝑇
2
= 2
𝑇 𝑥𝑒 𝑡 sin 𝑛ω0t𝑑𝑡
T
2
−𝑇
2
Here 𝑥𝑒(t) is even sin𝑛ω0tand is odd. So, the product 𝑥𝑒 𝑡 sin 𝑛ω0t is odd. Thus, the integral
over one complete cycle is zero.
𝑏𝑛 = 0
x(t)= 𝑎0+ 𝑎𝑛 cos𝑛𝜔0𝑡∞𝑛=1
Thus, the Fourier series of even functions contains no sine terms.
Problem 4: With regard to Fourier series representation, justify the following statement:
Functions with half wave symmetry have only odd harmonics.
Solution: We know that the trigonometric Fourier series of a periodic function x(t) in any
interval t0 to t0+T or 0 to T or -𝑇
2 to
𝑇
2 is given by
x(t)= 𝑎0+ (𝑎𝑛 cos𝑛𝜔0𝑡∞𝑛=1 + 𝑏𝑛 sin𝑛ω0t)
where 𝑎0 = 1
𝑇 𝑥 𝑡 𝑑𝑡
T
2
−𝑇
2
𝑎𝑛 = 2
𝑇 𝑥 𝑡 cos𝑛𝜔0𝑡 𝑑𝑡
T
2
−𝑇
2
and 𝑏𝑛 = 2
𝑇 𝑥 𝑡 sin 𝑛ω0t𝑑𝑡
T
2
−𝑇
2
For a half wave symmetric function,
x(t) = -x(t±𝑇
2)
Therefore, 𝑎0 = 0
𝑎𝑛 = 2
𝑇 𝑥 𝑡 cos𝑛𝜔0𝑡 𝑑𝑡
T
0
= 2
𝑇[ 𝑥 𝑡 cos𝑛𝜔0𝑡 𝑑𝑡
T
20
+ 𝑥 𝑡 cos𝑛𝜔0𝑡 𝑑𝑡T𝑇
2
]
To have the limits of second integration also from 0 to T/2 , change the variable t by t + (T/2) in
the second integration.
𝑎𝑛 =2
𝑇[ 𝑥 𝑡 cos𝑛𝜔0𝑡 𝑑𝑡
T
20
+ 𝑥 𝑡 +T
2 cos𝑛𝜔0(𝑡 +
T
2) 𝑑𝑡
T
20
]
But x(t) = -x(t±𝑇
2)
𝑎𝑛 = 2
𝑇[ 𝑥 𝑡 cos𝑛𝜔0𝑡 𝑑𝑡
T
20
+ −𝑥 𝑡 cos(𝑛𝜔0𝑡 + 𝑛π) 𝑑𝑡T
20
]
= 2
𝑇[ 𝑥 𝑡 cos𝑛𝜔0𝑡 − 𝑥 𝑡 cos(𝑛𝜔0𝑡 + 𝑛π)] 𝑑𝑡
T
20
𝑎𝑛 = 0 𝑓𝑜𝑟 𝑒𝑣𝑒𝑛 𝑛
4
𝑇 𝑥 𝑡 cos𝑛𝜔0𝑡
T
20
𝑓𝑜𝑟 𝑜𝑑𝑑 𝑛
Now,
𝑏𝑛 = 2
𝑇 𝑥 𝑡 sin𝑛ω0t𝑑𝑡
T
20
= 2
𝑇[ 𝑥 𝑡 sin𝑛ω0t𝑑𝑡
T
20
+ 𝑥 𝑡 sin 𝑛ω0t𝑑𝑡T𝑇
2
]
To have the limits of second integration also from 0 to T/2 change the variable t by t + (T/2) in
the second integration.
𝑏𝑛 = 2
𝑇[ 𝑥 𝑡 sin𝑛ω0t𝑑𝑡
T
20
+ 𝑥 𝑡 +𝑇
2 sin𝑛ω0(t +
T
2)𝑑𝑡
T
20
]
But x(t) = -x(t±𝑇
2)
𝑏𝑛 = 2
𝑇[ 𝑥 𝑡 sin𝑛ω0t𝑑𝑡
T
20
+ −𝑥 𝑡 sin(𝑛ω0t + nπ)𝑑𝑡T
20
]
= 2
𝑇[ 𝑥 𝑡 sin𝑛ω0t𝑑𝑡
T
20
- 𝑥 𝑡 sin𝑛ω0t cos nπ) 𝑑𝑡T
20
]
𝑏𝑛 = 0 𝑓𝑜𝑟 𝑒𝑣𝑒𝑛 𝑛
4
𝑇 𝑥 𝑡 sin𝑛ω0t
T
20
𝑓𝑜𝑟 𝑜𝑑𝑑 𝑛
Thus, the Fourier series of half wave symmetric function consists of only odd harmonics.
Problem 5: Draw the complex fourier spectrum of given figure.
Solution: It is a plot between Cn and nω0 = ω. As Cn is real, only amplitude plot is sufficient.
The amplitude versus frequency plot, called the amplitude spectrum.
To draw the frequency spectrum,
x(t) = 2𝐴
𝜋 +
A
π[ −1 n
2n+1+
−1 n +1
2n−1]ej2nt∞
𝑛=−∞𝑛≠0
exponential Fourier series coefficients
C0 = 2𝐴
𝜋
C1= 2𝐴
3𝜋
C2= 2𝐴
15𝜋
C3= 2𝐴
35𝜋
Problem 6: For the periodic gate function shown in below figure, plot the magnitude and phase
spectra.
Solution: Amplitude and phase spectra are shown in below figures respectively.
Example 7: Find the complex exponential Fourier series and the trigonometric Fourier series of
unit impulse train δT(t) shown in bellow figure.
Solution: The periodic waveform shown in above figure with period T can be expressed as
x(t) = δT(t) = 𝛿(𝑡 − 𝑛𝑇)∞𝑛=−∞
Let t0= -𝑇
2
So t0+T = - 𝑇
2
In one period, only 𝛿(t) exists.
Fundamental frequency ω0 = (2𝜋/T)
Cn =1
𝑇 𝑥(𝑡)𝑒−𝑗𝑛𝜔0𝑡
𝑡0+𝑇
𝑡0
𝑑𝑡
=1
𝑇 𝛿(t) 𝑒−𝑗𝑛 𝜔0𝑡𝑑𝑡
T
2
−𝑇
2
= 1
𝑇e0 =
1
𝑇
Cn= 1
𝑇
The exponential Fourier series is
x(t)= 𝐶𝑛∞𝑛=−∞ 𝑒𝑗𝑛 𝜔0𝑡 =
1
𝑇∞𝑛=−∞ 𝑒𝑗𝑛 (
2π
T)𝑡
=1
𝑇 𝑒𝑗𝑛
2π
T 𝑡∞
𝑛=−∞
To get the trigonometric Fourier coeifficients , we have
𝑎0 = C0= 1
𝑇
𝑎𝑛 = 2
𝑇 𝑥 𝑡 cos𝑛𝜔0𝑡 𝑑𝑡
T
0 =
2
𝑇 δ 𝑡 cos𝑛𝜔0𝑡 𝑑𝑡
T
0 =
2
𝑇
𝑏𝑛 = 2
𝑇 𝑥 𝑡 sin𝑛ω0t𝑑𝑡
T
0 =
2
𝑇 𝑥 𝑡 sin𝑛ω0t𝑑𝑡
T
0 = 0
Therefore , the trigonometric Fourier series is
x(t) +𝑎0 + 𝑎𝑛cos𝑛𝜔0𝑡∞𝑛=1 + 𝑏𝑛 sin𝑛ω0t =
1
𝑇 +
2
𝑇 cos𝑛𝜔0𝑡
∞𝑛=1
The complex Fourier series coefficients are
Cn= 1
𝑇 for all n
The magnitude and phase spectrum are
⎹Cn⎸= ⎹1
𝑇⎸for all n
𝐶𝑛 = 0o for all n
The frequency spectra are plotted in bellow figure.
Problem 8: Find the Fourier series of the signal x(t)=e
-t with T = 1 sec as shown in bellow
figure. Draw its magnitude and phase spectra.
𝛿(t)= 1 at t = 0
= 0 elsewhere
Solution: Given signal x(t)=e
-t
Period T = 1 sec
Fundamental frequency ω0 =2𝜋
𝑇 =
2𝜋
1 =2𝜋
The exponential Fourier series is
Cn =1
𝑇 𝑥(𝑡)𝑒−𝑗𝑛𝜔0𝑡𝑇
0𝑑𝑡 =
1
1 e−t𝑒−𝑗𝑛 2𝜋𝑡1
0𝑑𝑡
= 𝑒−(1+𝑗𝑛 2𝜋)𝑡1
0𝑑𝑡 = [
𝑒−(1+𝑗𝑛 2𝜋 )𝑡
−(1+𝑗𝑛 2𝜋) ]0
1
= 𝑒−(1+𝑗𝑛 2𝜋 )−1
−(1+𝑗𝑛 2𝜋) =
1−𝑒−1𝑒−𝑗𝑛 2𝜋
(1+𝑗𝑛 2𝜋) =
1−𝑒−1
(1+𝑗𝑛 2𝜋)
x(t)= 𝐶𝑛∞𝑛=−∞ 𝑒𝑗𝑛 𝜔0𝑡 = (
1−𝑒−1
1+𝑗𝑛 2𝜋)∞
𝑛=−∞ 𝑒𝑗𝑛 2𝜋𝑡
The spectra are shown in bellow figure.
Problem 9: Obtain the exponential Fourier Series for the wave form shown in below figure.
Also draw the frequency spectrum.
Solution: The periodic waveform shown in fig with a period T= 2π can be expressed as:
x(t) = A 0 ≤ t ≤ π
−A π ≤ t ≤ 2π
Let
t0 = 0, t0+T = 2π
and Fundamental frequency ⍵0=2π
T =
2π
2π =1
Exponential Fourier series
C0 = 1
T x(t)
T
0 dt
= 1
2π Aπ
0 dt +
1
2π −A
2π
π dt = 0
Cn = 1
T x(t)e−jn⍵0tT
0 dt
= 1
2π Ae−jntπ
0 dt +
1
2π −Ae−jnt2π
π dt
= −A
j2nπ (−1)n − 1 − 1 − (−1)n = −j
A
2nπ
Cn = −j
2A
πn for odd n
0 for even n
∴ x(t) = C0+ Cnejn⍵0t∞n=−∞
n≠0 = −j
A
2nπejnt∞
n=−∞
C0 = 0, C-1 = C1 = 2𝐴
𝜋, 𝐶−3 = C3 =
2𝐴
3𝜋, 𝐶−5 = C5=
2𝐴
5𝜋
The frequency spectrum is shown in the below figure.
Problem10: Find the exponential Fourier series and plot the frequency spectrum for the full
wave rectified sine wave given in below figure
Solution: The waveform shown in fig can be expressed over one period(0 to π) as:
x(t) = A sin ⍵t where ⍵= 2π
2π =1
because it is part of a sine wave with period = 2π
x(t) = A sin ⍵t 0≤ t ≤ π
The full wave rectified sine wave is periodic with period T = π
Let
t0 = 0, t0+T = 0+π = π
and Fundamental frequency ⍵0=2π
T =
2π
π = 2
The exponential Fourier series is
x(t) = Cnejn⍵0t∞n=−∞ = Cnej2nt∞
n=−∞
where Cn = 1
T x(t)e−jn⍵0tT
0 dt
= 1
π A sin t e−j2ntπ
0 dt =
A
π sin t e−j2ntπ
0 dt
= A
j2π
ej 1−2n t−e0
j 1−2n −
e−j 1−2n t−e0
−j 1−2n
∴Cn = 2A
π(1−4n2)
C0 = 1
T x(t)
T
0 dt
= 1
π Aπ
0 sin t dt =
A
π − cos 𝑡 0
𝜋 = 2A
π
The exponential Fourier series is given by
x(t) = 2A
π(1−4n2)ej2nt∞
n=−∞ = 2A
π +
2A
π ∞
n=−∞n≠0
ej2nt
1−4n2
C0 = 2𝐴
𝜋, C-1 = C1 =
2𝐴
3𝜋, 𝐶−2 = C2 = −
2𝐴
15𝜋, 𝐶−3 = C3 = −
2𝐴
35𝜋
The frequency spectrum is shown in the below figure.
Assignment Problems:
1. Find the trigonometric Fourier series for the periodic signal x(t) shown in figure below. Also
draw the frequency spectrum.
2. Find the trigonometric Fourier series for the periodic signal x(t) shown in figure below. Also
draw the frequency spectrum.
3. Compute the exponential Fourier series of the signal shown in figure below. Also draw the
frequency spectrum.
4. Find the exponential series of the signal shown in the figure below. Also draw the frequency
spectrum.
5. Find the trigonometric Fourier series of x(t) =t2 over the interval (-1, 1).
6. Find the Fourier series for the periodic signal x(t) =t2 for 0 ≤ 𝑡 ≤ 1, so that it repeats every 1
sec.
7. Determine the time signal corresponding to the magnitude and phase spectra shown in below
figure with ⍵o = 𝜋.
Figure (a) Magnitude and (b) Phase spectra
8. Determine the Fourier series representation for x(t) = 2 sin(2𝜋𝑡 − 3)+sin6𝜋𝑡. 9. Find the complex exponential Fourier series coefficient of the signal x(t) = 3cos 4⍵0t. Also
draw the frequency spectrum.
10. Find the complex exponential Fourier series coefficient of the signal x(t) = 2cos 3⍵0t. Also
draw the frequency spectrum.
Simulation:
MATLAB can be used to find and plot the exponential Fourier series of a periodic function.
Using the symbolic math toolbox, we can perform the integrations necessary to find the
coefficients Fn.
Exponential Fourier Series
For the waveform, f(t), shown below:
we can write the exponential Fourier Series expansion as:
𝑓 𝑡 = 𝐹𝑛𝑒𝑗𝑛 𝜔𝑜 𝑡
∞
𝑛=−∞
Where
The Fn are complex coefficients. Thus, when we plot them we need to plot the magnitude
andphase separately. In Matlab we use the “abs” function to find the magnitude and “angle” to
findthe phase angle. The following Matlab statements show one method for obtaining these
plots:
Program
clc;clear all; close all; n=-10:10; Fn=(1./(j*n*2*pi)).*(4*exp(j*n*2*pi/7)+ 2*exp(-j*n*12*pi/7)-6*exp(-