Page 1
1
PROPERTIES OF STEEL FIBER MORTAR AND CONCRETE
BY
Amartey, Yusuf Dada PH.D. (CIVIL ENGINEERING) A.B.U.
(PhD/Eng./25591/2000-2001)
A thesis submitted to the Postgraduate School, Ahmadu Bello University, Zaria, in fulfillment of the requirement for the award of a degree of Doctor of Philosophy in
Civil Engineering.
Department of Civil Engineering Ahmadu Bello University,
Samaru - Zaria.
August, 2008
Page 2
2
DECLARATION
I, Yusuf Dada Amartey, hereby declare that this thesis contains the report of my research
works and has not been presented in this form in any previous application for the award of
a higher degree. All relevant information from other sources has been duly acknowledged
by means of references.
------------------------------ -------------------- Yusuf Dada AMARTEY Date
Page 3
3
CERTIFICATION
This thesis titled “Properties of Steel Fibre Mortar and Concrete” by Amartey, Yusuf Dada,
meets the regulations governing the award of the Degree of the Doctor of Philosophy(Civil
Engineering) of Ahmadu Bello University, Zaria, Nigeria; and is approved for its
contribution to knowledge and literary presentation.
----------------------------- -------------------- Engr. (Dr) S.P. Ejeh Date Chairman-Supervisory Committee. ----------------------------- -------------------- Prof. K.J. Osinubi Date Member Supervisory Committee ----------------------------- -------------------- Dr. I. Abubakar Date Member Supervisory Committee ----------------------------- -------------------- Engr. (Dr) S.P. Ejeh Date Head of Civil Engineering ----------------------------- -------------------- Prof. S. K. Nkom Date Dean, Postgraduate School
Page 4
4
DEDICATION
This Thesis is dedicated to my wife, Maryam Amartey,
And
My children; Muhammad Amartey, Hajara Amartey, Rukkayya Amartey, And
Musa Amartey,
For their love, patience, and understanding.
Page 5
5
ACKNOWLEDGEMENT
Praise be to ALLAH, the Elevated, for the success of this thesis and ask for bountifully
reward all those who have undertaken or participated in it no matter how subtle a way.
My heartfelt gratitude goes to my supervisor, Dr. Stephen Pinder Ejeh, for his patience,
concern, encouragement, advice, and guidance throughout this research period, his Fatherly
role has been of great inspiration to me.
Special thanks to Prof. K.J Osinubi and Dr. I. Abubakar, members of my supervisory
committee. I sincerely appreciate all the advice and support you provided.
Many thanks to my loving and wonderful Dad (BABA), for the encouragement and the
never wavering support through this life.
Brother; Bimbo, I appreciate your support and encouragement.
To all my friends (so numerous to mention) and members of Department of Civil
Engineering , Ahmadu Bello University, Zaria, for the various roles they played in this
work, I thank you all.
Most of all, to all my teachers, I sincerely appreciate you all for showing me the excitement
of learning.
I shall like to acknowledge the ABU MacArthur Foundation Project Grant for the
Dissertaion Completio Grant.
Finally,
May we all share in ALLAH’S blessings. Ameen.
Page 6
6
ABSTRACT
Steel fibre mortar and concrete are composite materials made with introduction of steel
fibres into cement-based materials within certain percentage of fibre. Steel fibre mortar and
concrete had improved properties when compared to plain mortar or concrete. In this work;
three types of fibres namely - Circular Steel fibres (CSF), Rectangular Steel Fibres (RSF)
and Steel Shaving Steel Fibres (CHSF) were investigated as composite materials. The
following percentage were used in the mix - one – half percent, one percent, one and half
percent and two percentage volume dosage rate of each steel fibre with a control mix
(without fibre). Various tests like slump, compacting factor, flexural strength, compressive
strength and beam deflections were performed on the samples produced to determine the
mechanical properties of these composites.
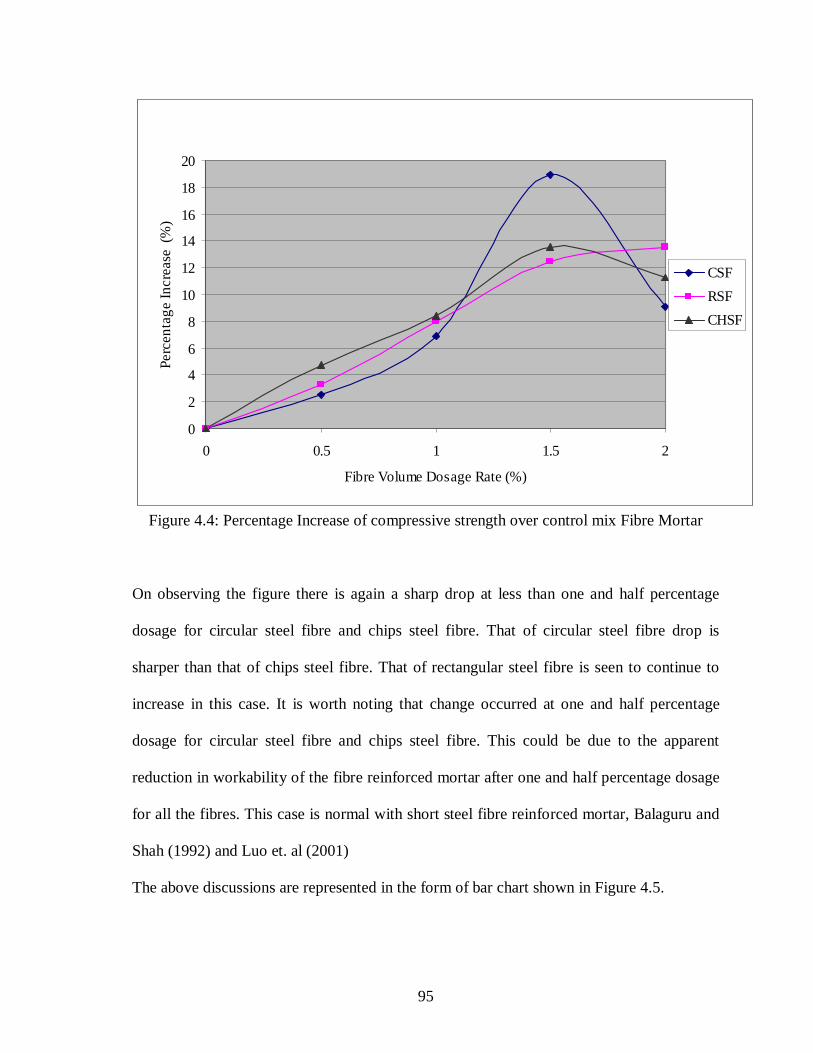
It was observed that, one and half percentage of fibre in concrete is a critical percentage,
the compressive strength, flexural strength were improved in mortar specimens and the
compressive, tensile and flexural strength were also improved in concrete for Circular Steel
fibres (CSF) and Rectangular Steel Fibres (RSF) while Steel Shaving Steel Fibres (CHSF)
had a decrease as the fibre volume increased above one and half percentage. Workability,
(slump and compacting factor) decrease with an increase in steel fibre percentage.
Relationships were also established between compressive strength of mortar and concrete
and spit tensile and flexural strength of steel fibre mortar and concrete specimens.
Page 7
7
TABLE OF CONTENTS
Contents Pages
Title page i
Declaration ii
Certification iii
Dedication iv
Acknowledgement v
Abstract vi
Table of Contents vii
List of Figures xi
List of Tables xiii
List of Plates
Chapter One: Introduction 1
1.1 Preamble 1
1.2 Research Aim and Objectives 2
1.3 Scope and Methodology 2
1.4 Research Limitation 3
1.5 Research Outcomes 3
Page 8
8
Chapter Two: Literature Review 4
2.1 Types of Fibres 5
2.1.1 Steel Fibres 8
2.1.2 Shape and Geometry of Steel Fibres 8
2.1.3 Durability of Steel Fibres 9
2.2 Glass Fibres 10
2.3 Synthetic Fibres 10
2.4 Other Types of Fibres 11
2.4.1 Asbestos Fibres 11
2.4.2 Natural Fibres 12
2.4.3 Carbon Fibres 12
2.5 Advantages and Limitations of Fibre Reinforced Concrete (FRC) 13
2.6 Field Performance of Fibre Reinforced Concrete (FRC) 16
2.7 Historical Development in Fibre Reinforced Concrete (FRC) 17
2.8 Previous Investigation in to Fibre Reinforcement 19
2.8.1 Fibre Effects and Parameters on the Behavious of FRC 19
2.8.2 Different types of Fibres in Fibre Reinforced Concrete 23
2.8.3 Usage of Fibres with Conventional Steel Reinforcement 24
2.8.4 Other Applications and Test Methods on FRC 26
2.8.5 Guides and Practice of Fibre Reinforced Concrete 29
2.9 Shape, Geometry and Distribution of Fibre Reinforced Concrete 31
2.10 Interaction between Fibres and Concrete Matrix 33
2.11 Critical Fibre Volume Dosage 37
2.12 Efficiency of Fibre Reinforcement 39
Page 9
9
2.12.1 Length Efficiency 40
2.12.1 Fibre Orientation 43
2.13 Prediction of the Behaviours and Properties of FRC 45
Chapter Three: Experimentations 51
3.1 Preamble 51
3.2 Materials 51
3.2.1 Fine Aggregate (Sand) 52
3.2.2 Coarse Aggregate/ Stones 52
3.2.3 Cement 53
3.2.4 Water 54
3.2.5 Fibres 54
3.3 Steel Fibre Mortar/Concrete Tests 56
3.3.1 Steel Fibre Mortar Cube Tests 57
3.3.2 Steel Fibre Mortar Beam Flexural Tests 59
3.3.3 Workability Test 62
3.4 Steel Fibre Concrete Cube Test 65
3.5 Steel Fibre Concrete Tensile Strength 67
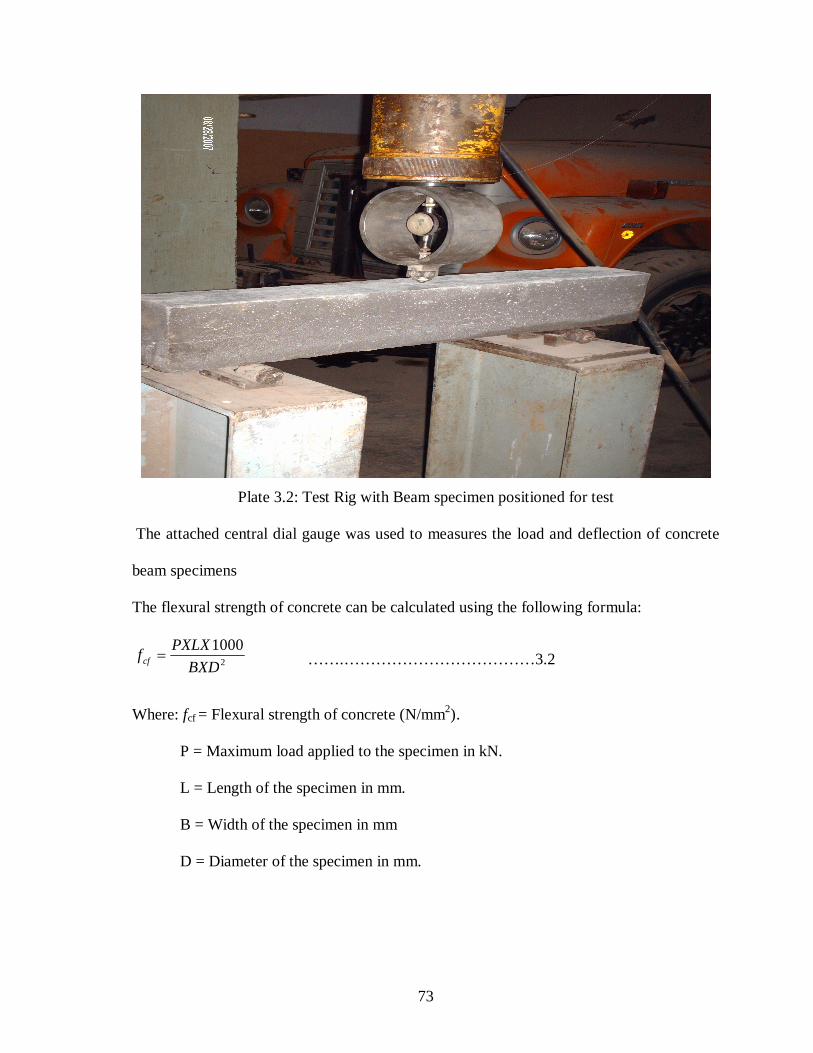
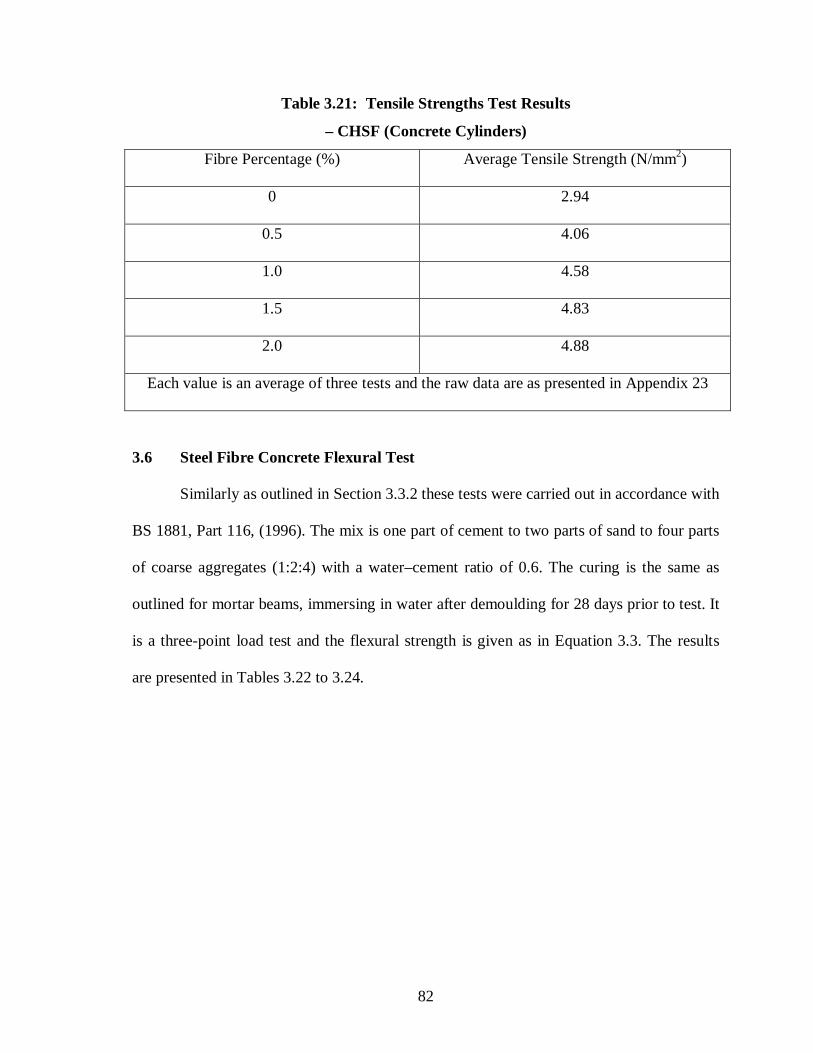
3.6 Steel Fibre Concrete Flexural Test 69
3.7 Steel Fibre Concrete Flexural Deflection 71
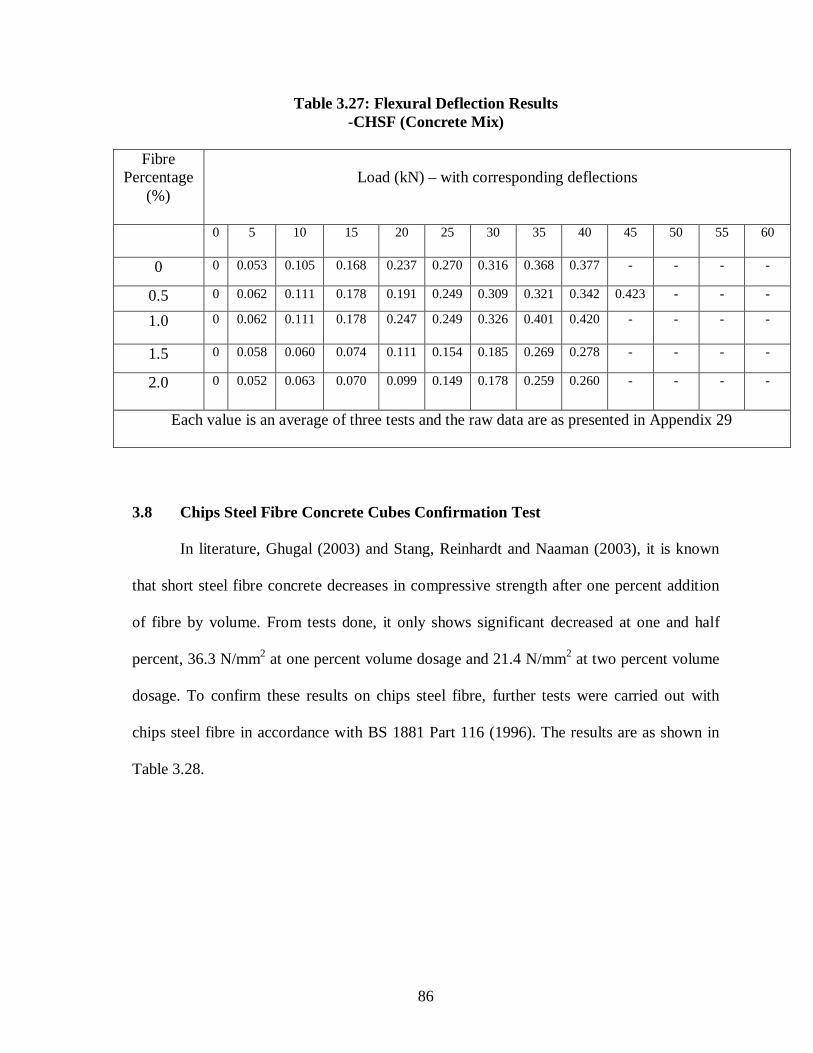
3.8 Chips Steel Fibre Concrete Cubes Confirmation Test 73
Chapter Four 75
4.0 Analysis and Discussion of Results 75
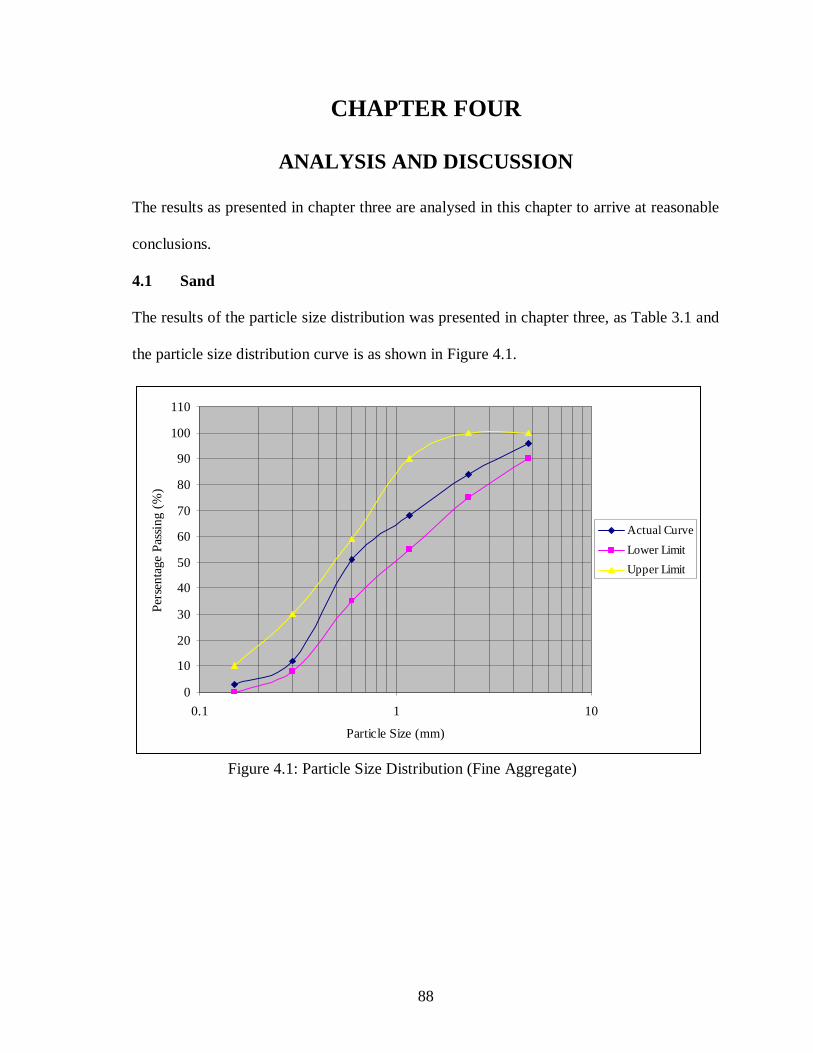
4.1 Sand 75
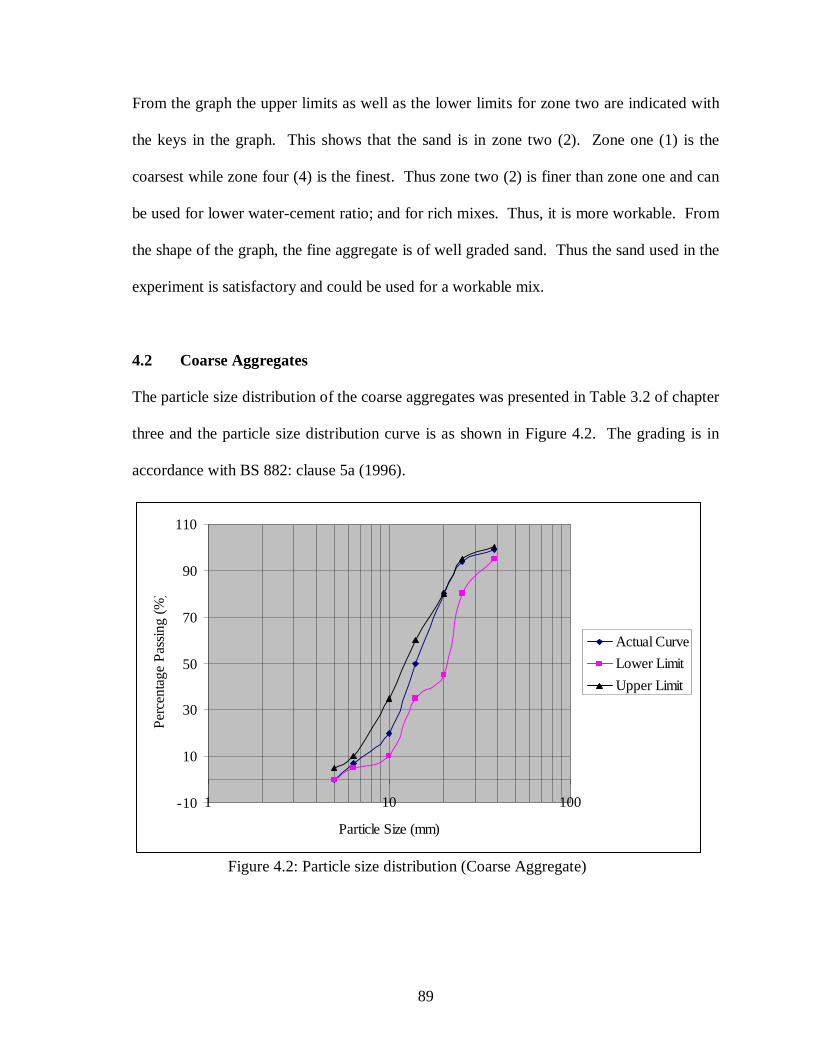
4.2 Coarse Aggregates 76
Page 10
10
4.3 Cement 77
4.4 Water 78
4.5 Fibres 78
4.6 Steel Fibre Mortar 78
4.6.1 Steel Fibre Mortar Cube 79
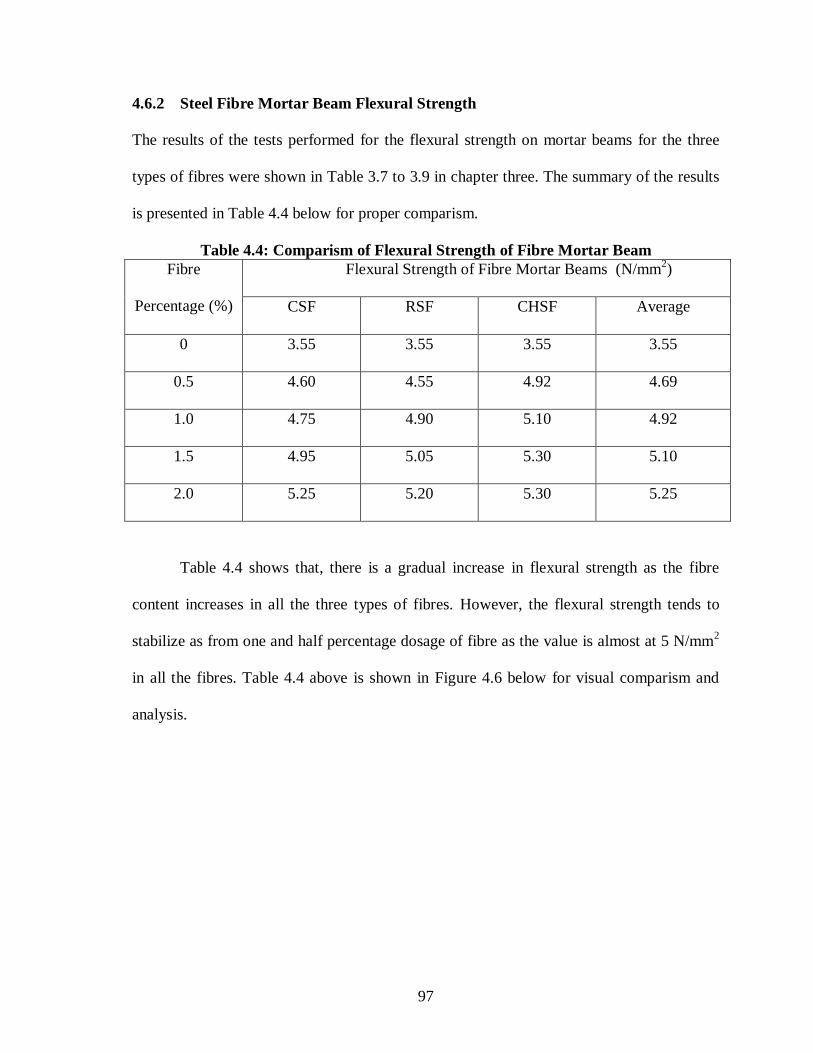
4.6.2 Steel Fibre Mortar Beam Flexural Strength 84
4.7 Workability of Steel Fibre Concrete 88
4.7.1 Slump Test 88
4.7.2 Compacting Factor Test 91
4.8 Steel Fibre Concrete Cube 95
4.9 Steel Fibre Concrete Cylinder Split Tests [Tensile] 98
4.10 Steel Fibre Concrete Beam Flexural Strength 102
4.11 Load/Deflection Response 106
4.12 Chips Steel Fibre Concrete Cubes Tests 113
4.13 Prediction Model for Strengths of Steel Fibre Composites. 116
4.14 Relationships between Compressive, Tensile and Flexural
Steel Fibre Mortar and Concrete 125
4.15 Toughness of Steel Fibre Concrete 132
Chapter Five: Conclusions and Recommendations 134
5.1 Preambles 134
5.2 Conclusions 134
5.3 Recommendations 137
References 138
Appendices 147
Page 11
11
LIST OF FIGURES
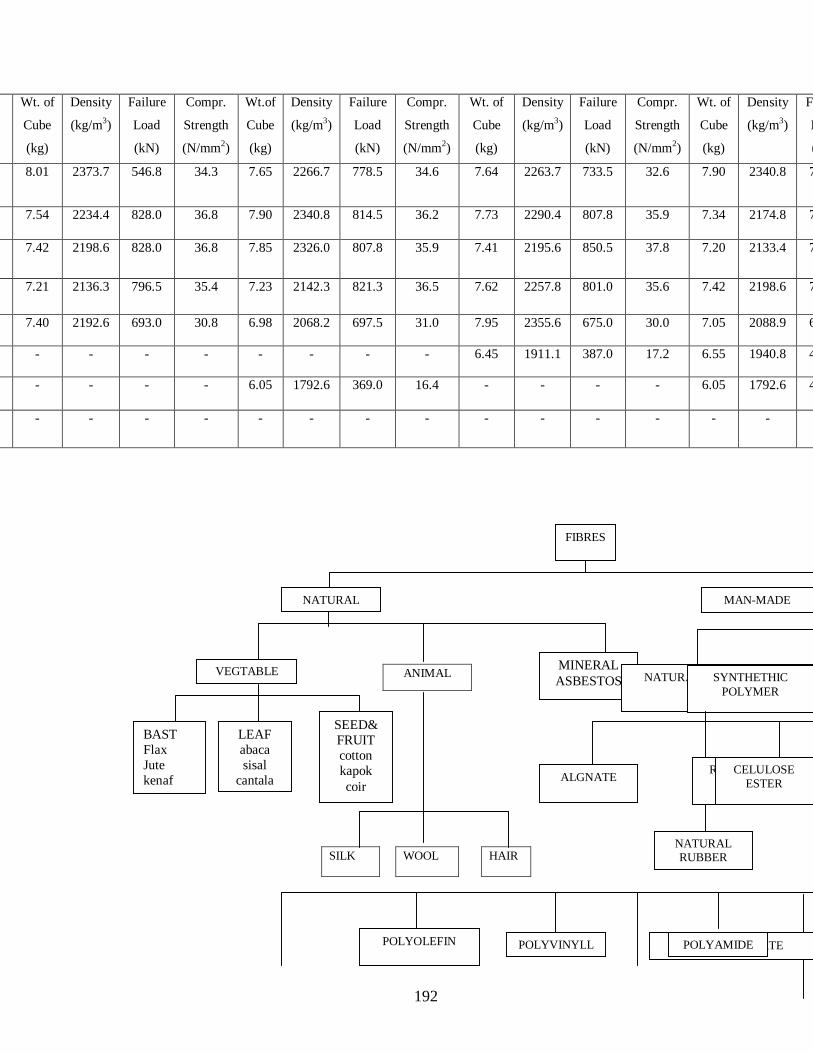
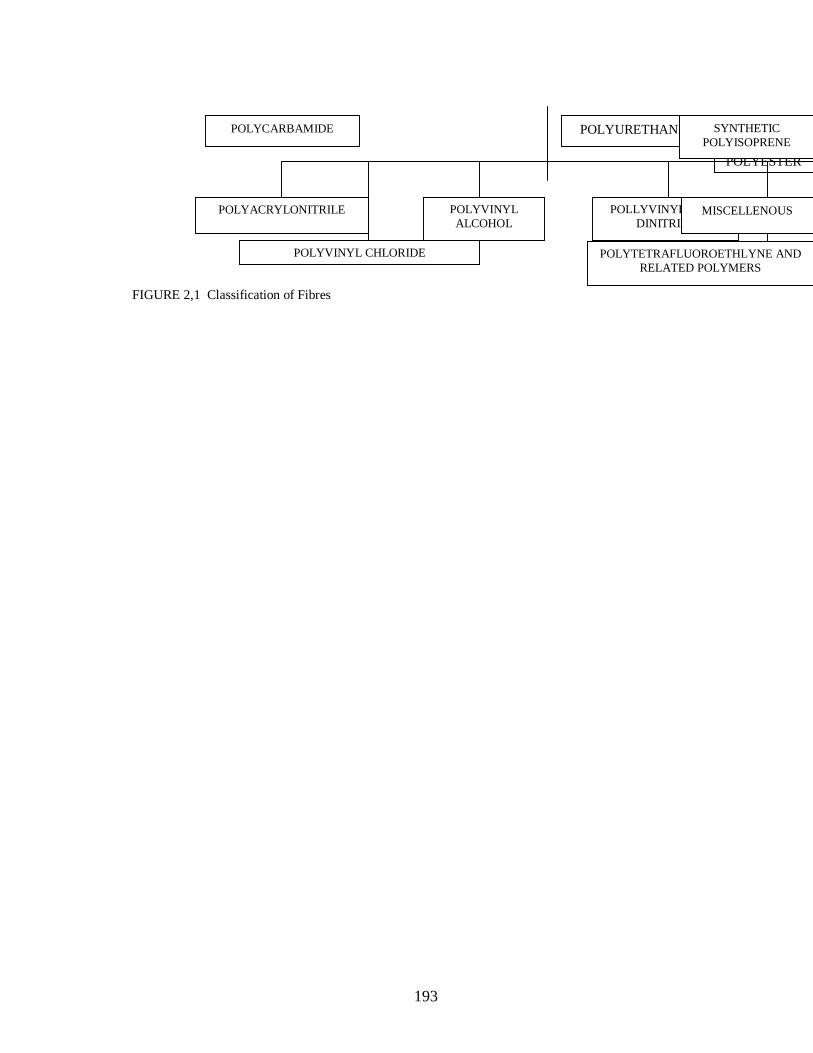
Figure 2.1: Classification of Fibres 7
Figure 2.2: Different types and Geometry of Steel Fibres. 9
Figure 2.3: Comparison of cracks with and without Fibre reinforced. 15
Figure 3.4: Classification of fibre arrangement in 1, 2 and 3 dimensional. 33
Figure 2.5: Pullout geometry to simulate the interaction between
Fibres and cement. 34
Figure 2.6: Interaction of fibre-uncracked matrix. 36
Figure 2.7: Interaction of fibre-cracked matrix. 37
Figure 2.8: Definition of critical length: 41
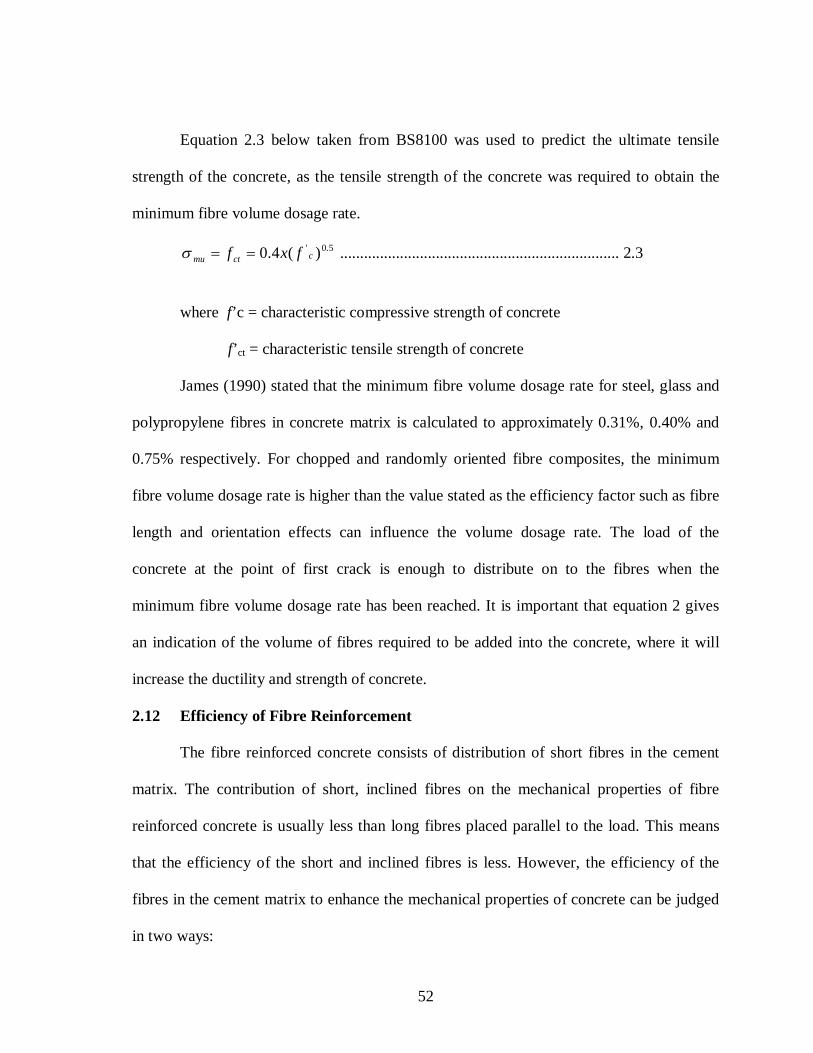
Figure 2.9: The intersection of an oriented fibre across a crack with an angle. 44
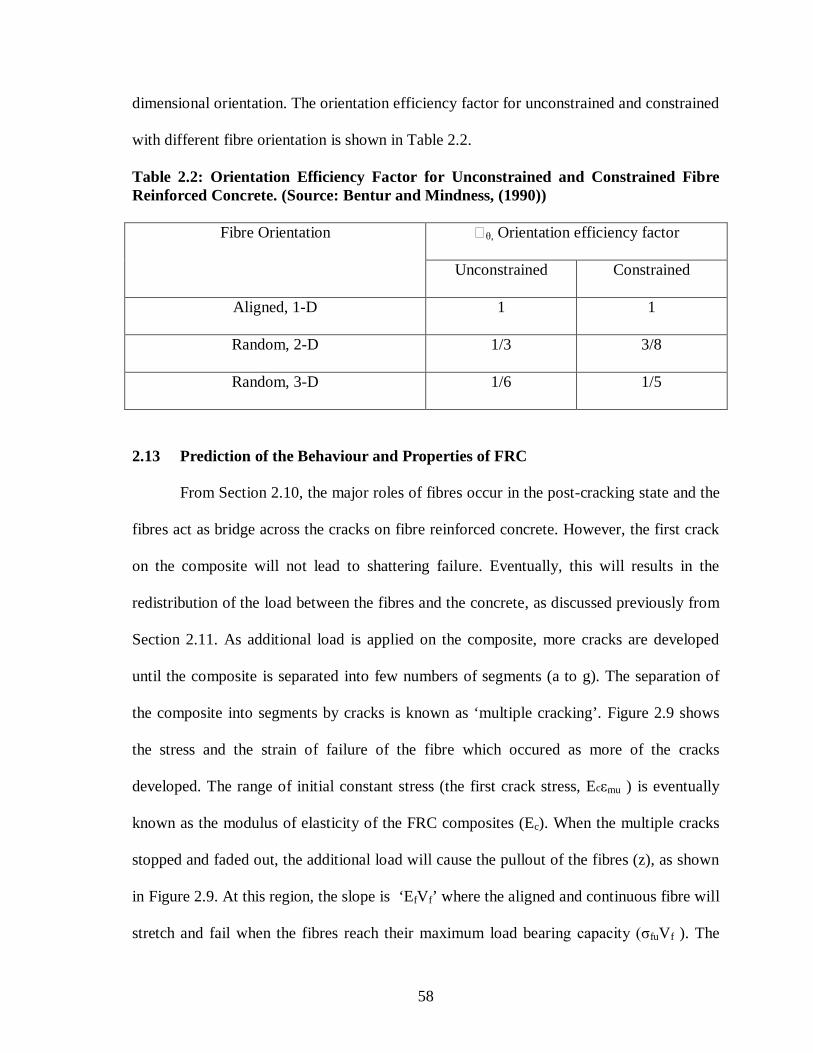
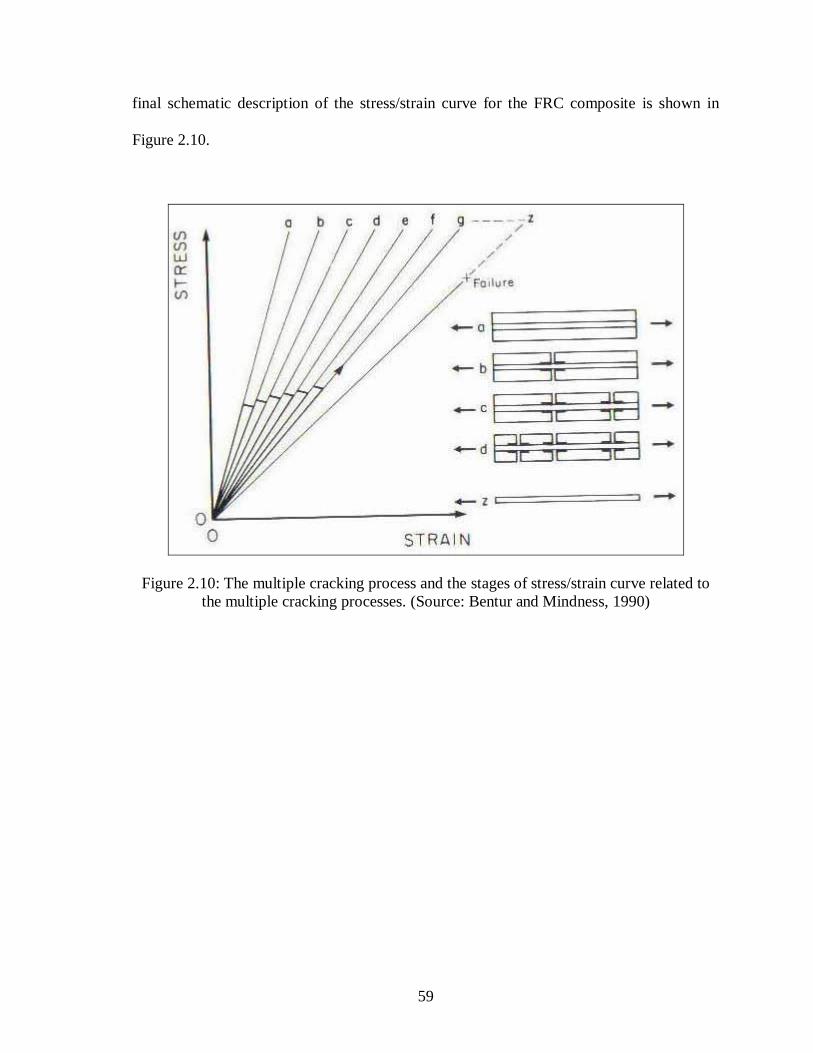
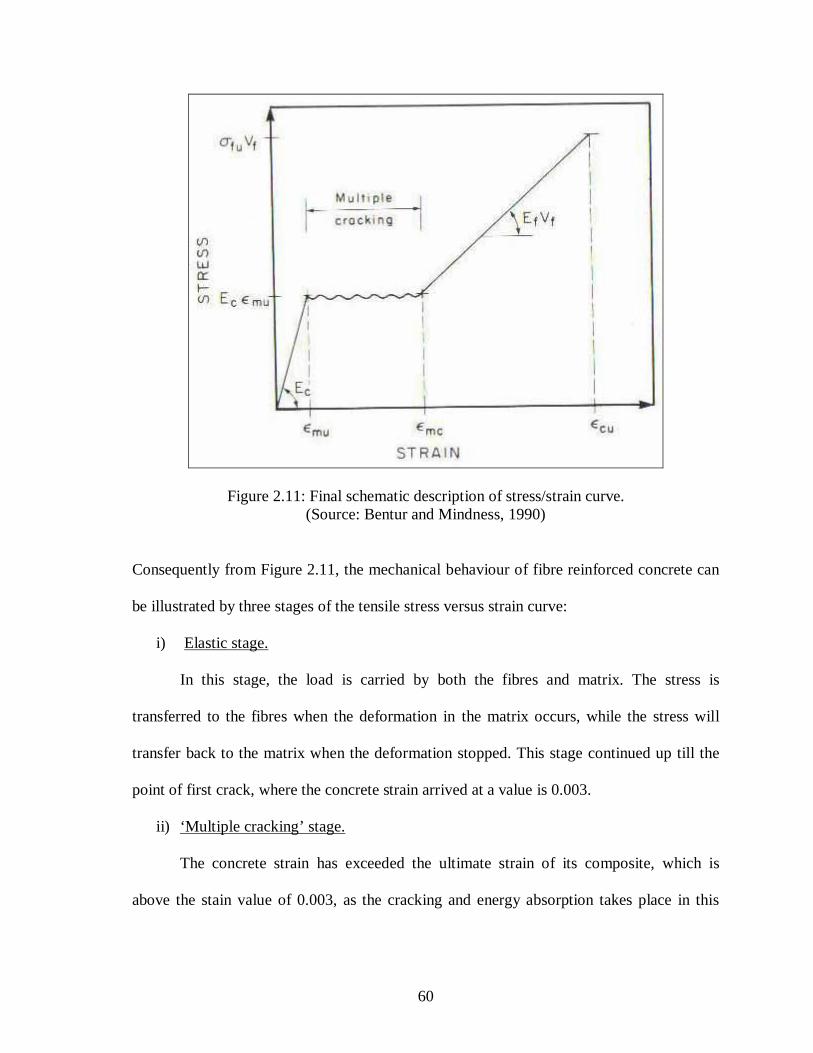
Figure 2.10: The multiple cracking process and the stages of stress/strain
Curve related to the multiple cracking processes. 46
Figure 2.11: Final schematic description of stress/strain curve. 47
Figure 2.12: The parallel model of ‘rule of mixture’. 49
Figure 4.1: Particle Size Distribution (Fine Aggregate) 75
Figure 4.2: Particle size distribution (Coarse Aggregate) 76
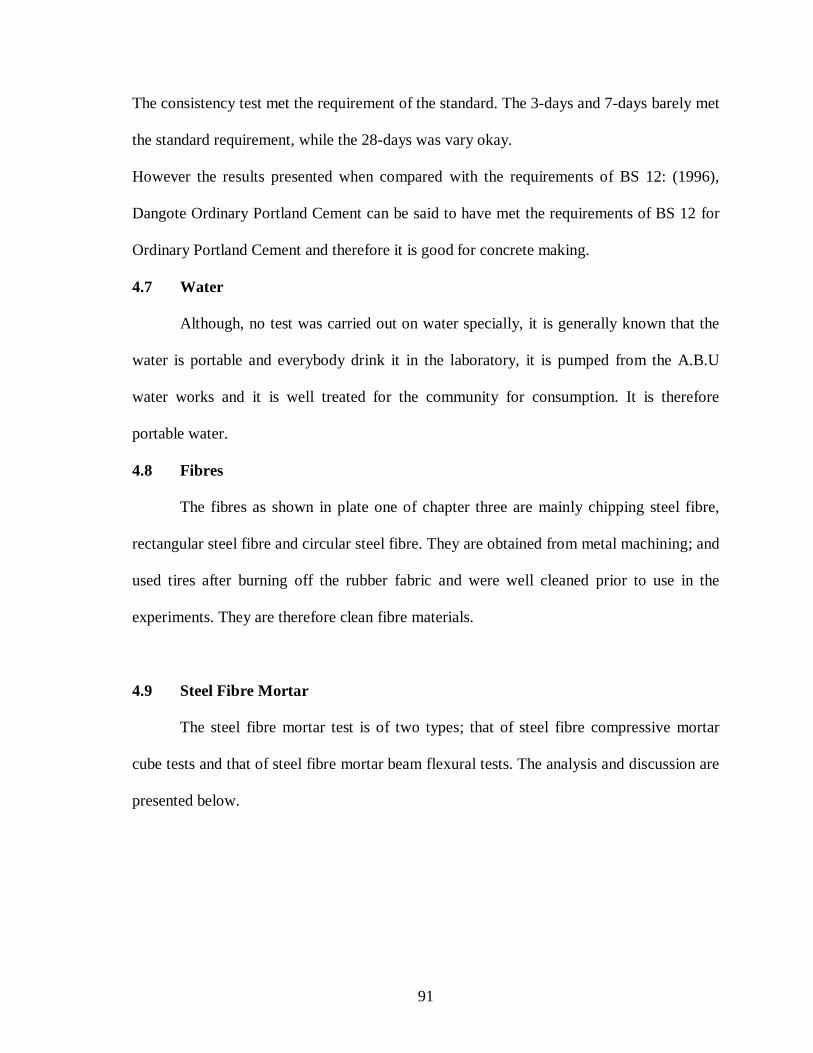
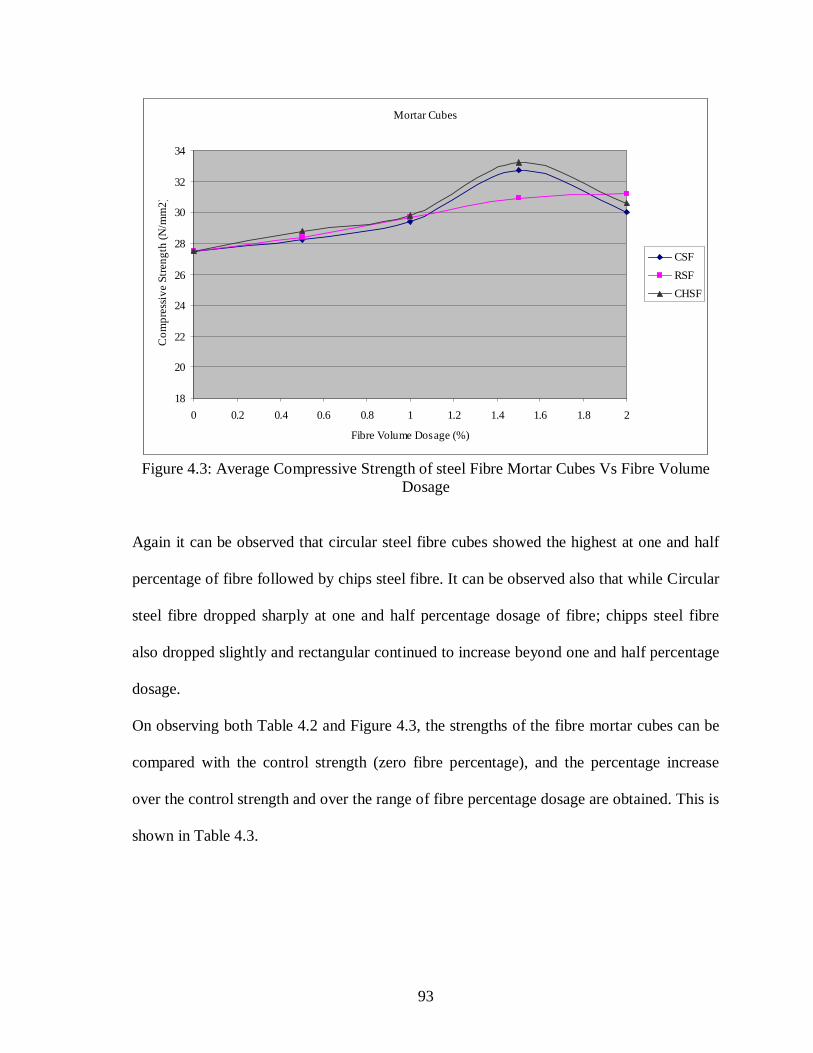
Figure 4.3: Compressive Strength of Mortar Cubes Vs Fibre Volume Dosage 80
Figure 4.4: Percentage Increase of compressive strength over to control 82
Figure 4.5: Compressive Strength Increase over Control 83
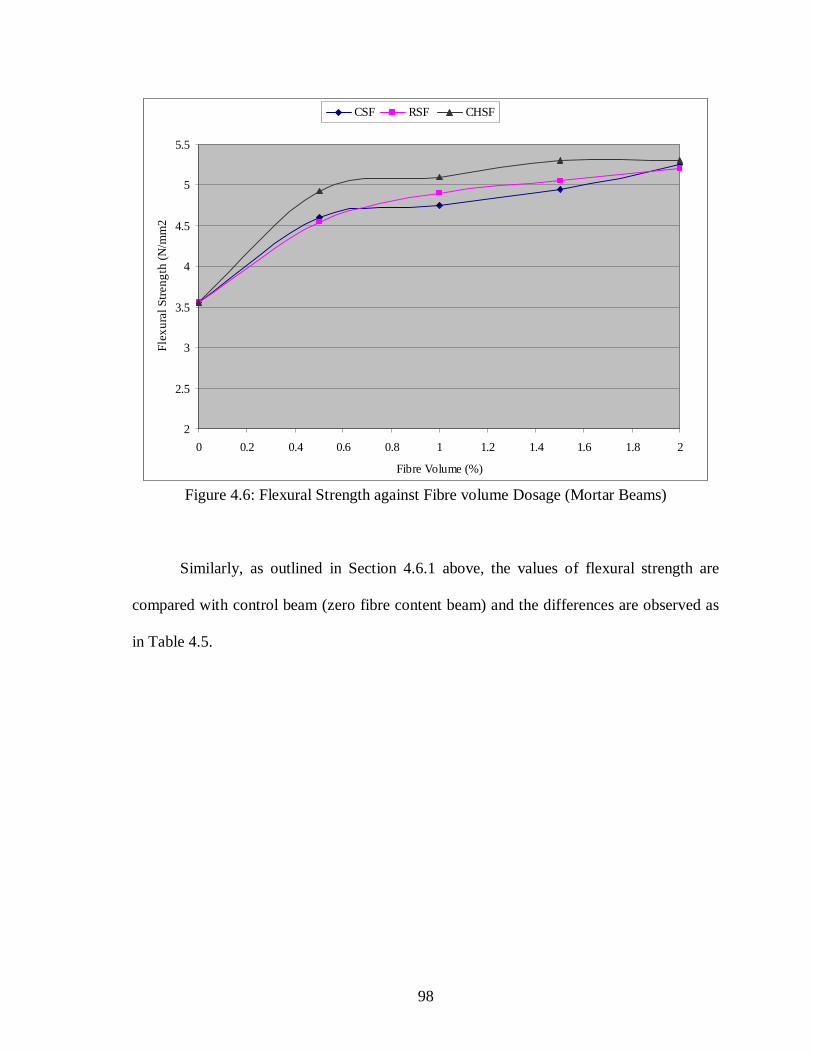
Figure 4.6: Flexural Strength against Fibre volume Dosage 85
Figure 4.7: Flexural Strength Increase over Control 87
Figure 4.8: Percentage Increase of Flexural strength over to control mix 87
Figure 4.9: Average Slump Height vs. Fibre Dosage for all Fibres 89
Page 12
12
Figure 4.10: Percentage Difference of Slump Height vs. Fibre Dosage 91
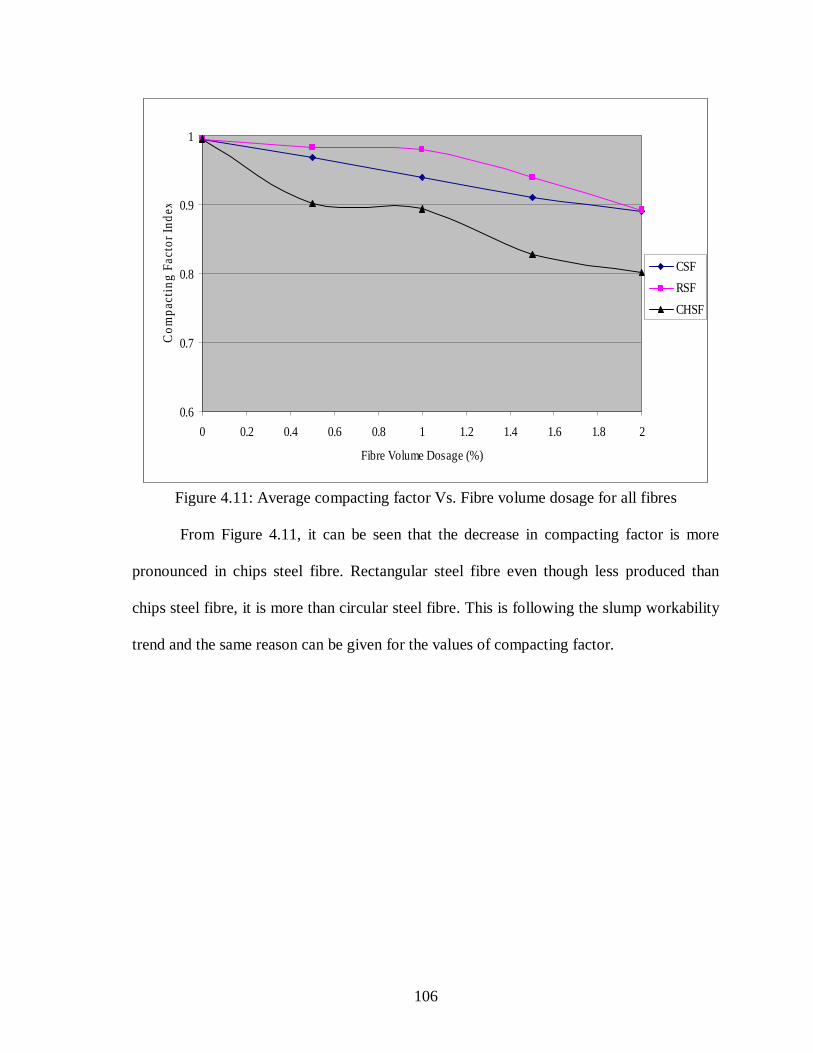
Figure 4.11: Average compacting factor Vs. Fibre dosage for all fibres 93
Figure 4.12: Percentage Difference of Compacting Factor vs. Fibre Volume. 95
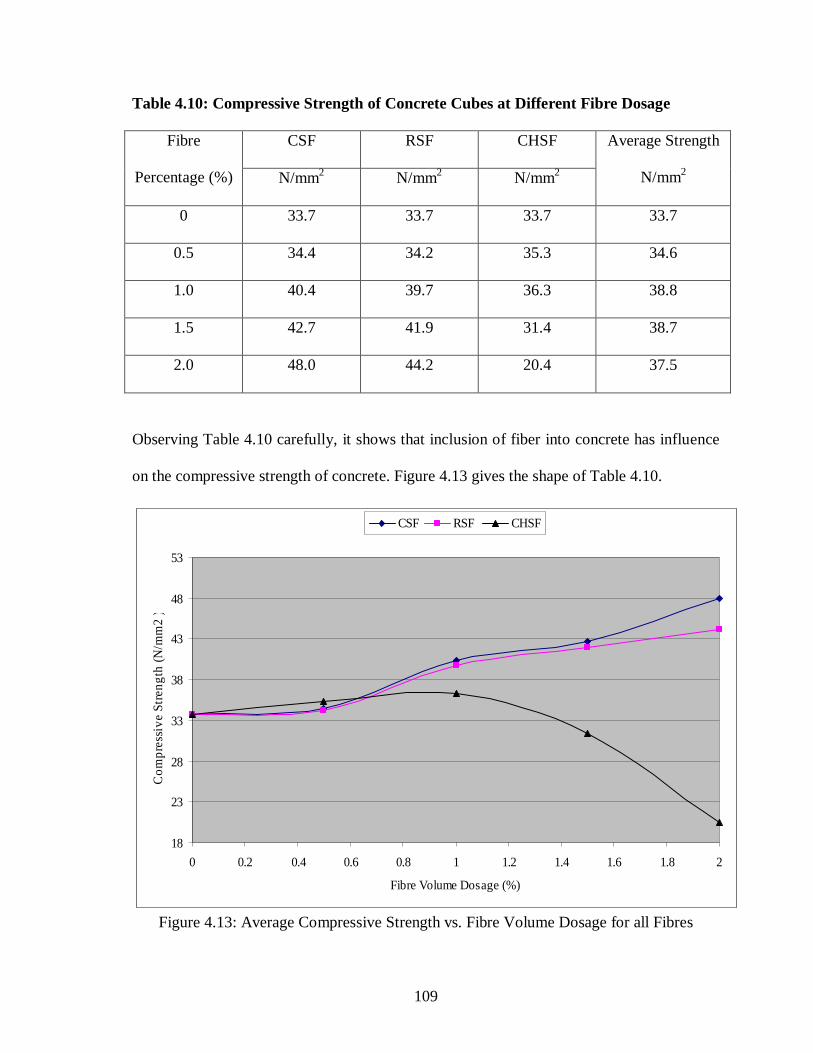
Figure 4.13: Average Compressive Strength vs. Fibre Volume Dosage 96
Figure 4.14: Average Tensile Strength vs. Fibre Volume Dosage 99
Figure 4.15: Percentage difference of tensile strength vs. fibre volume 100
Figure 4.16: Tensile Strength Increase over Control 101
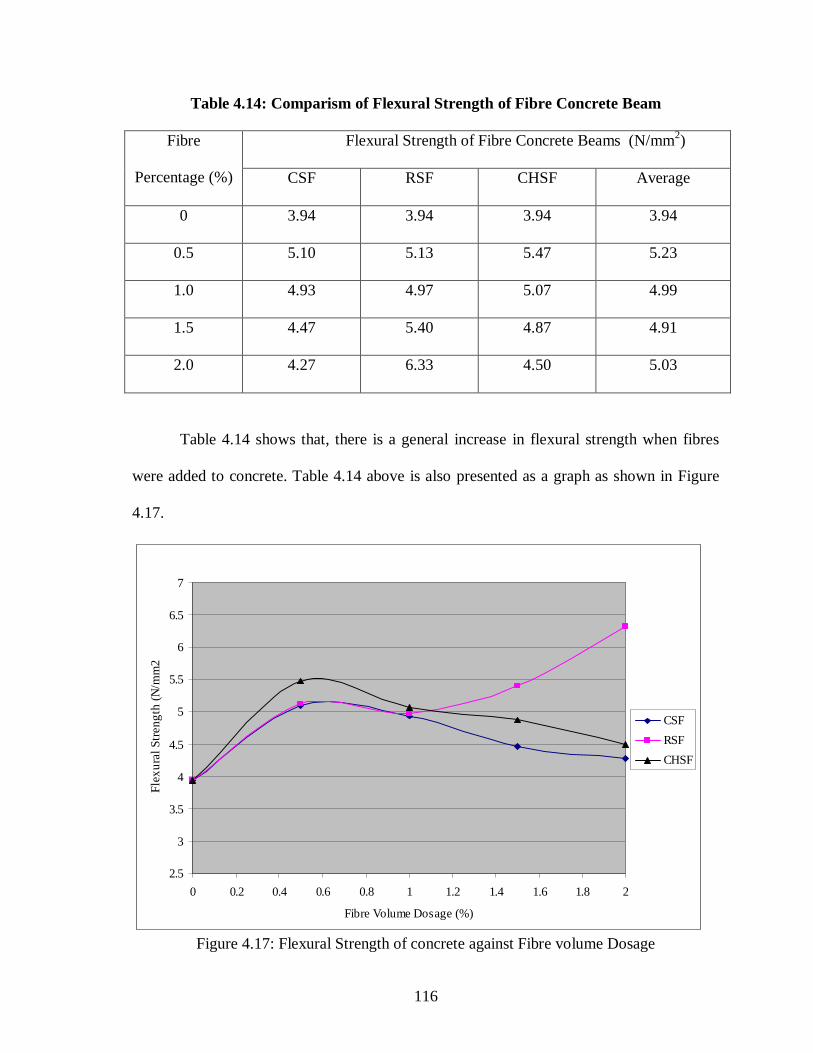
Figure 4.17: Flexural Strength of concrete against Fibre volume Dosage 103
Figure 4.18: Percentage Increase of Flexural strength over control mix 105
Figure 4.19: Flexural Strength Increase over Control 105
Figure 4.20: Load/Deflection Curve for CSF at Different Dosage 108
Figure 4.21: Load/Deflection Curve for RSF at Different Dosage 108
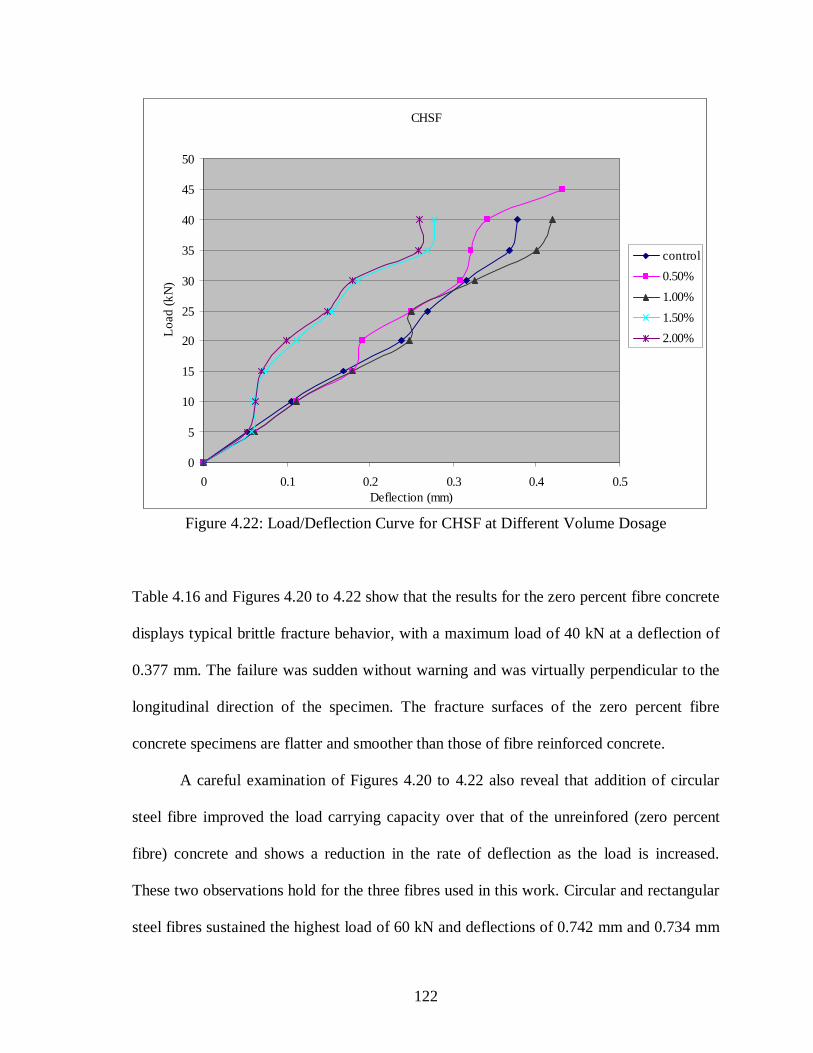
Figure 4.22: Load/Deflection Curve for CHSF at Different Dosage 109
Figure 4.23: Load vs. displacement graph at 0.5% volume dosage 110
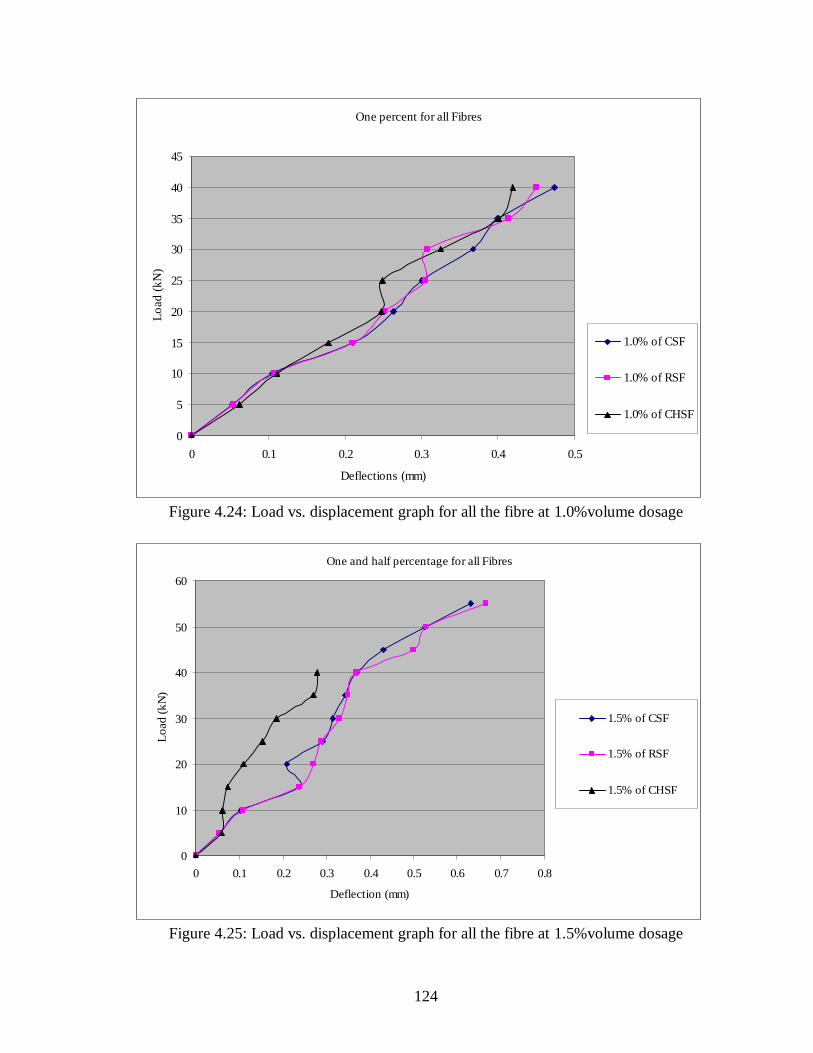
Figure 4.24: Load vs. displacement graph at 1.0% volume dosage 111
Figure 4.25: Load vs. displacement graph at 1.5% volume dosages 111
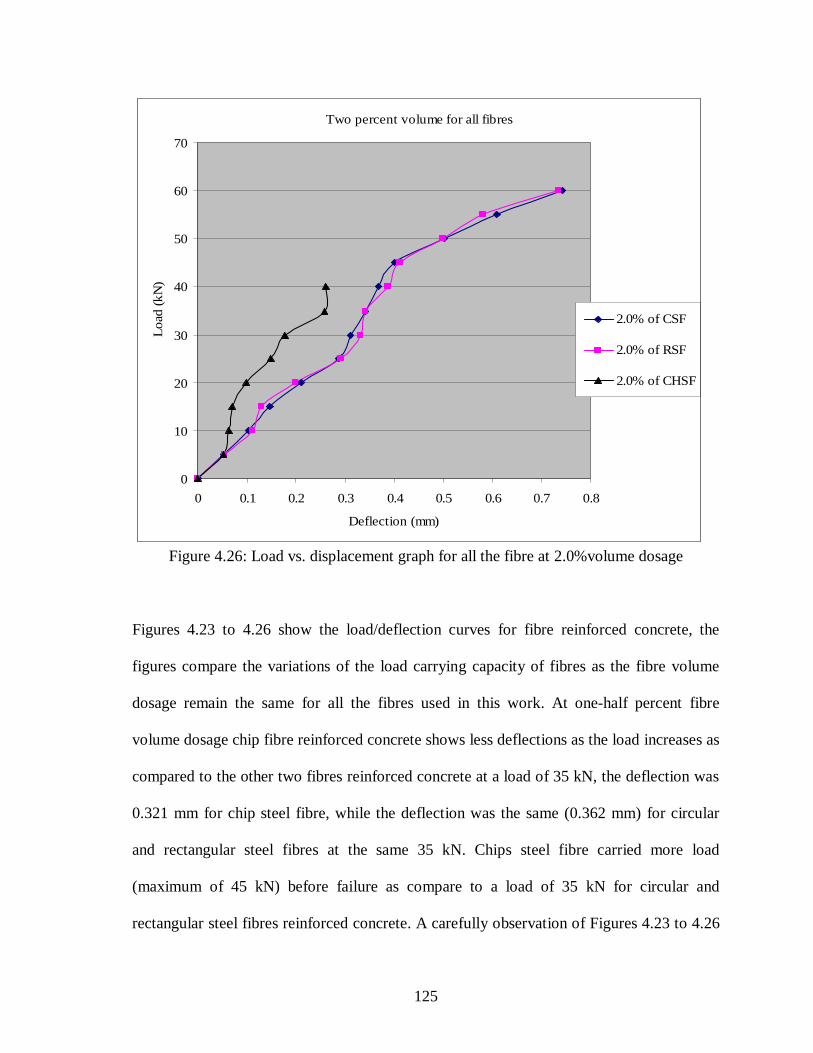
Figure 4.26: Load vs. displacement graph at 2.0%volume dosage 112
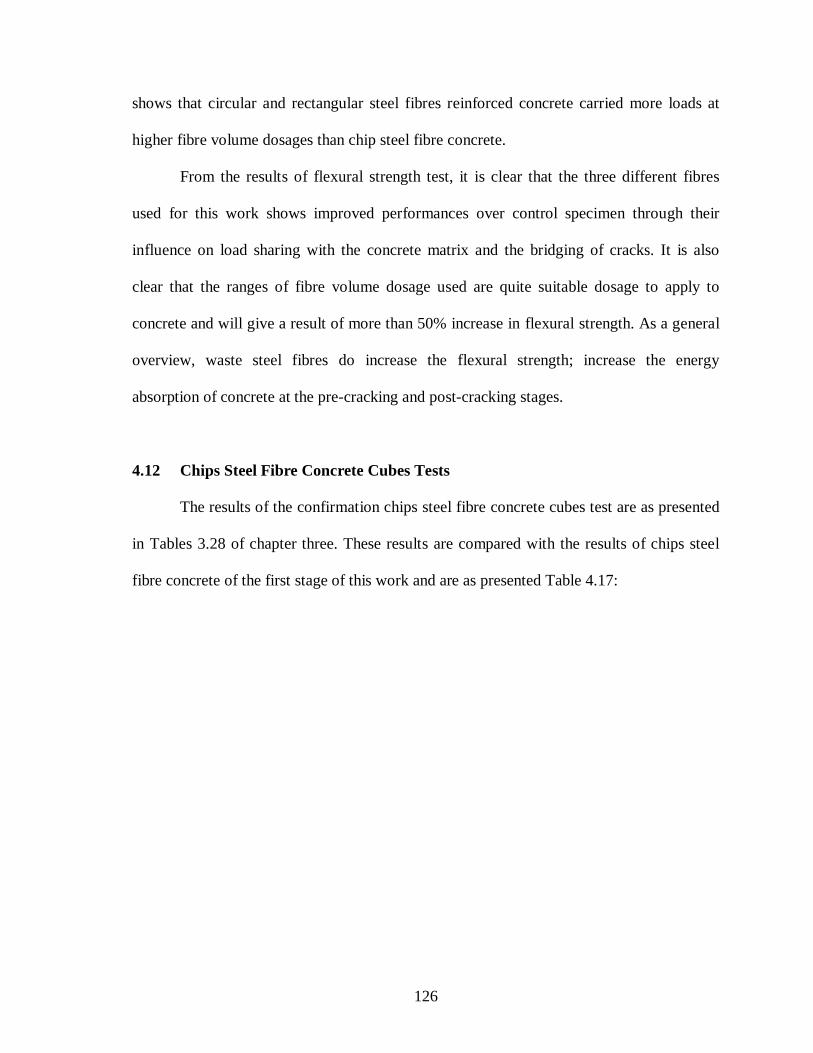
Figure 4.27: Compressive strength of chips steel fibre 115
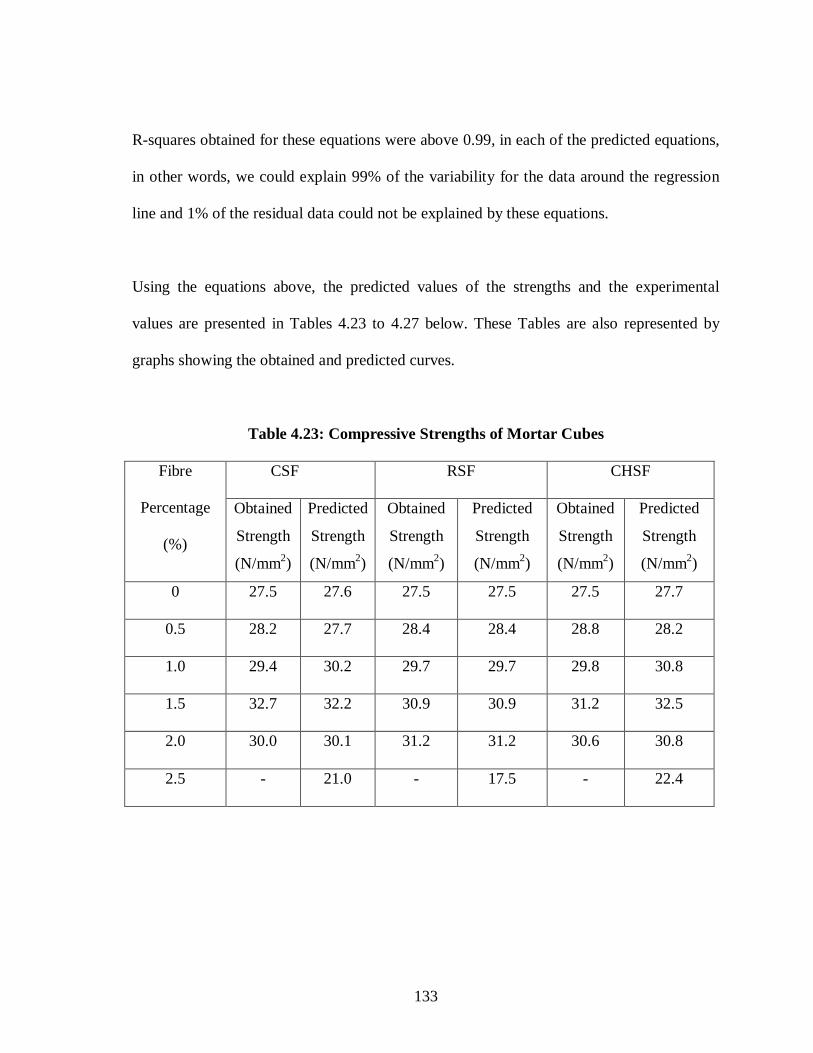
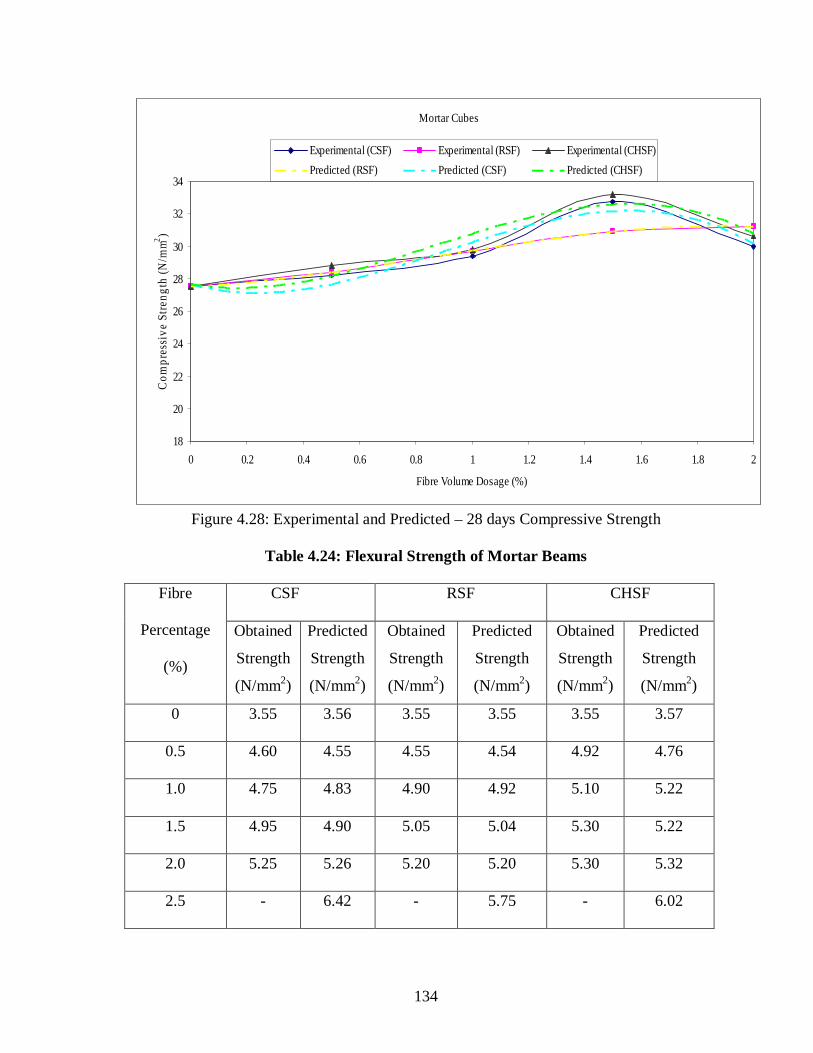
Figure 4.28: Experimental and Predicted – 28 days Compressive Strength 121
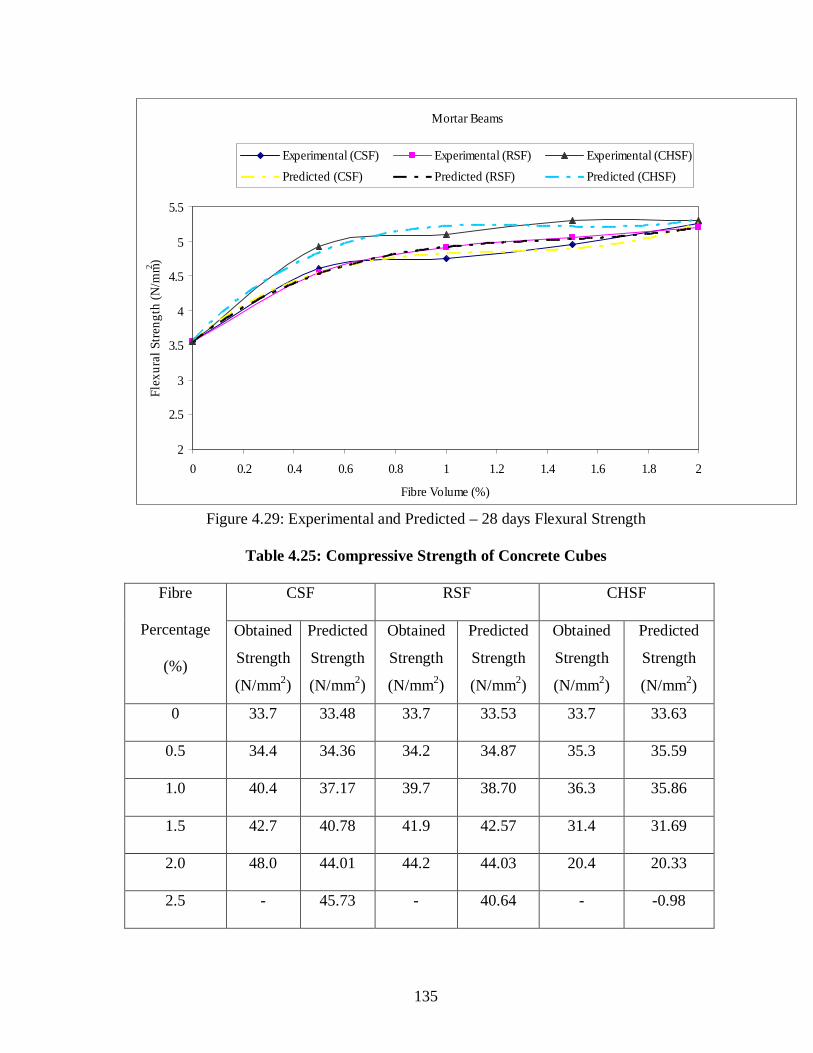
Figure 4.29: Experimental and Predicted – 28 days Flexural Strength 122
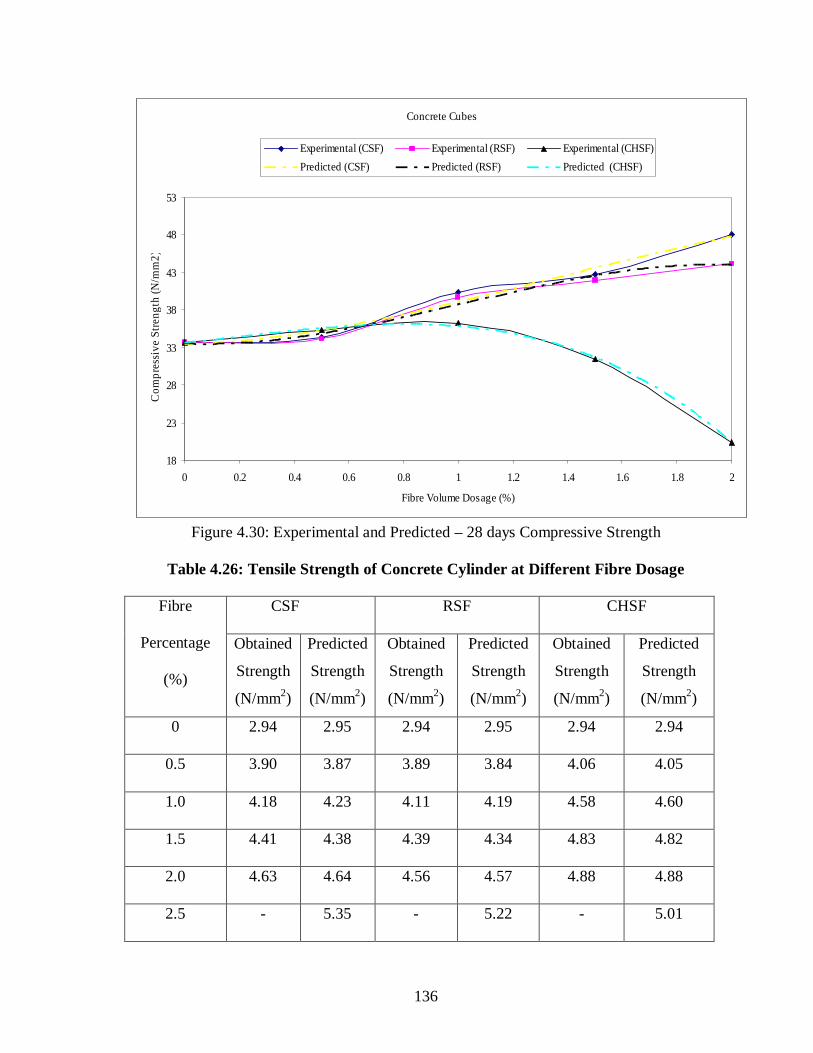
Figure 4.30: Experimental and Predicted – 28 days Compressive Strength 123
Figure 4.31: Experimental and Predicted – 28 days Tensile Strength 124
Figure 4.32: Experimental and Predicted – 28 days Compressive Strength 125
Page 13
13
LIST OF TABLES
Table 2.1: Typical Properties of Some Fibres 6
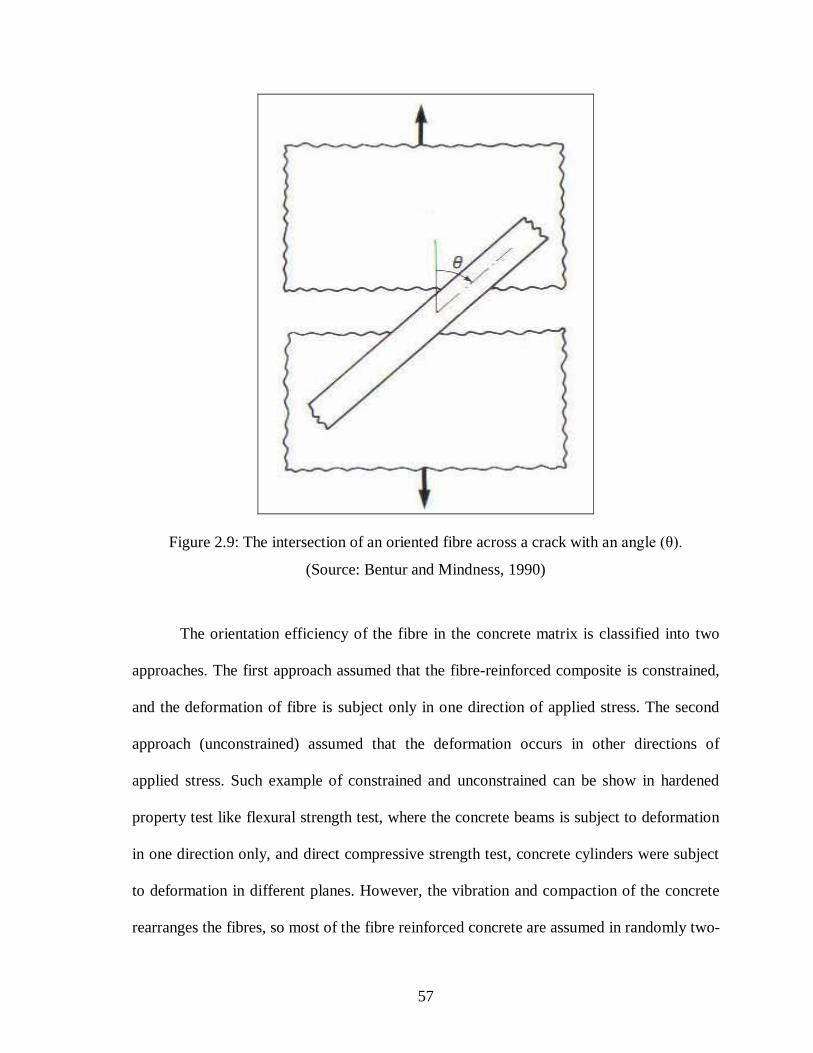
Table 2.2: Orientation Efficiency Factor for Unconstrained and
Constrained FRC. 45
Table 3.1: Sieve Analysis Result for Fine Aggregate 52
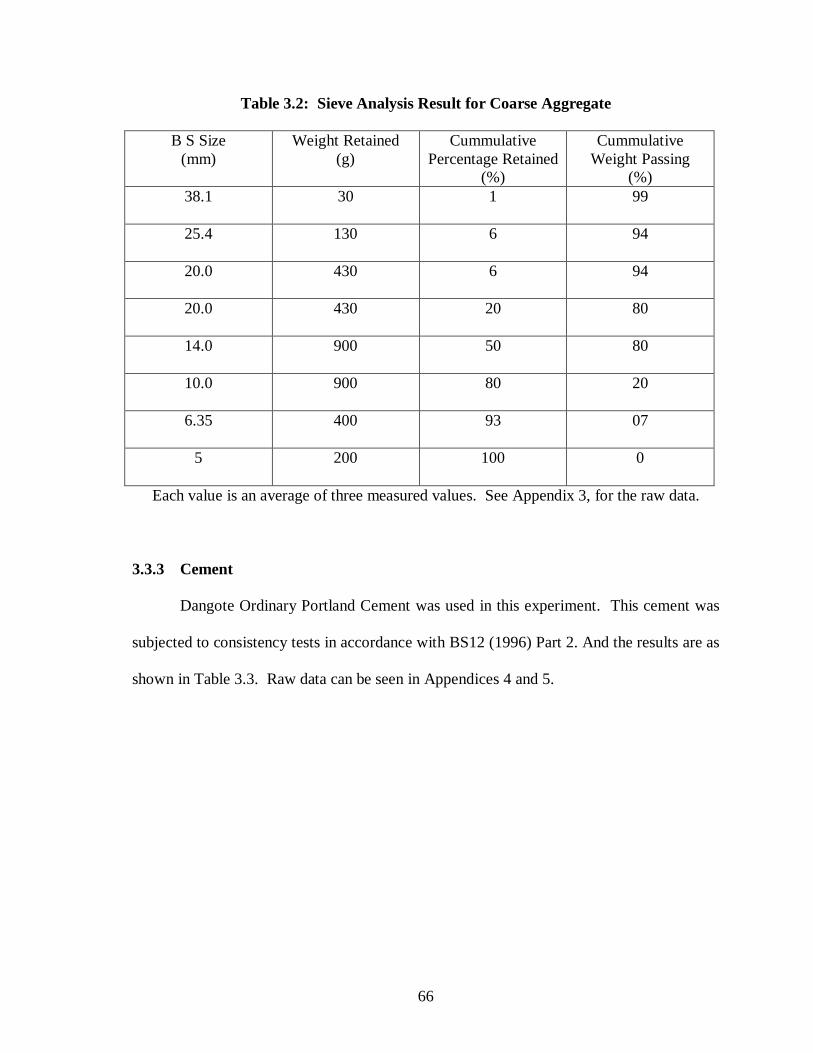
Table 3.2: Sieve Analysis Result for Coarse Aggregate 53
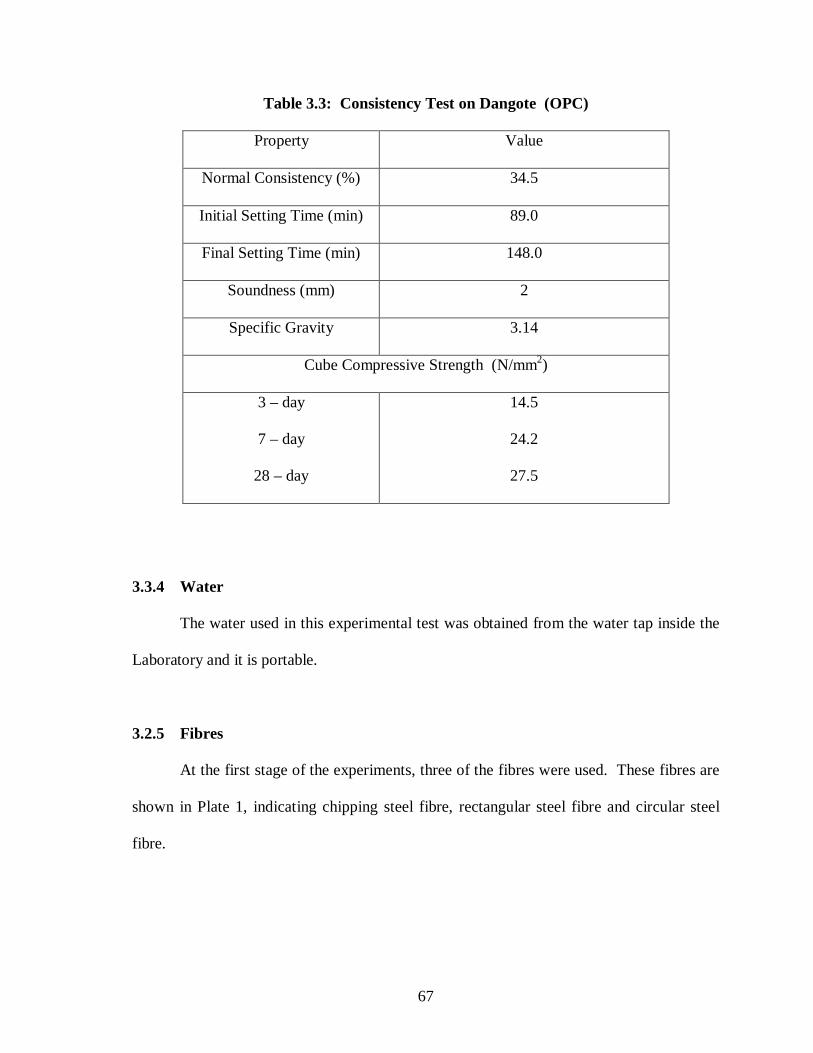
Table 3.3: Consistency Test on Dangote (OPC) 54
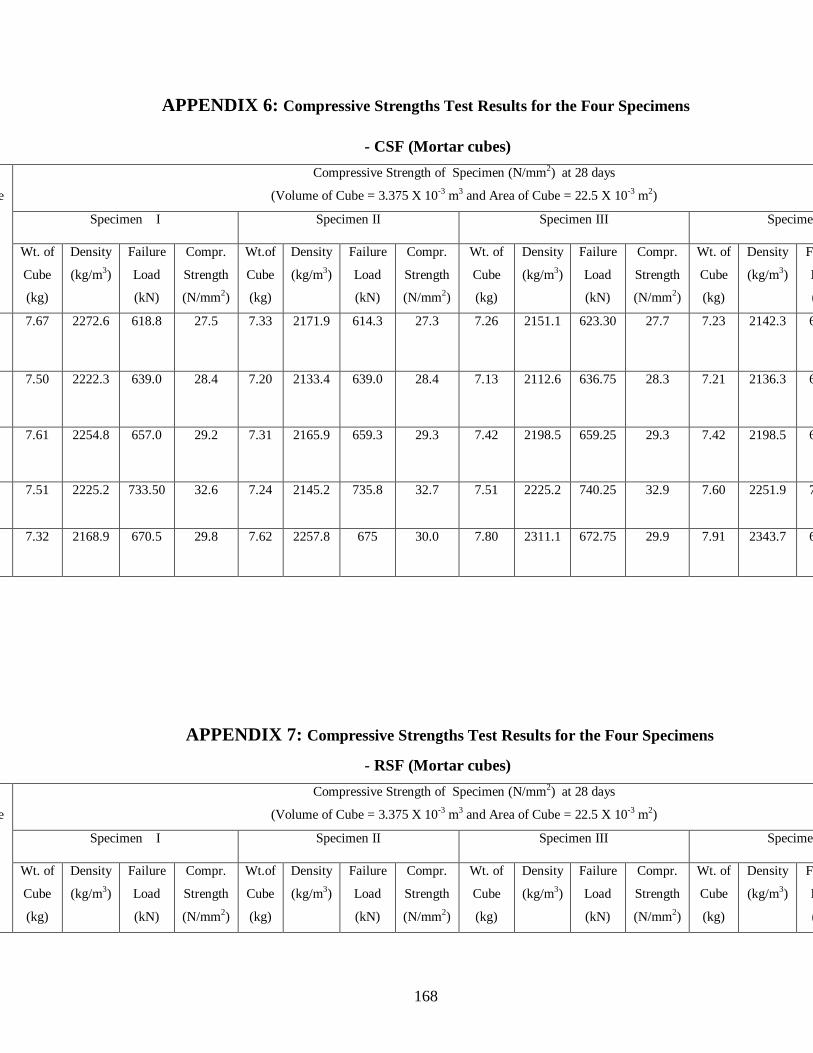
Table 3.4: Compressive Strengths Test Results – CSF (Mortar Cubes) 58
Table 3.5: Compressive Strengths Test Results – RSF (Mortar Cubes) 58
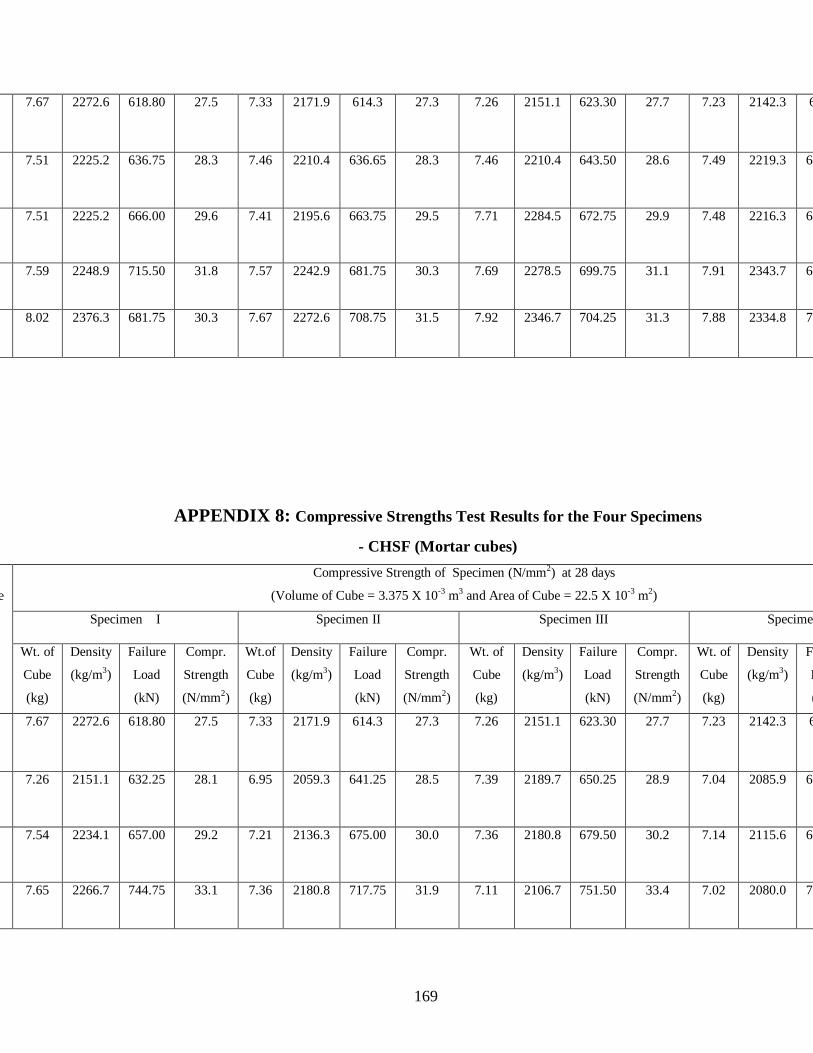
Table 3.6: Compressive Strengths Test Results – CHSF (Mortar Cubes) 59
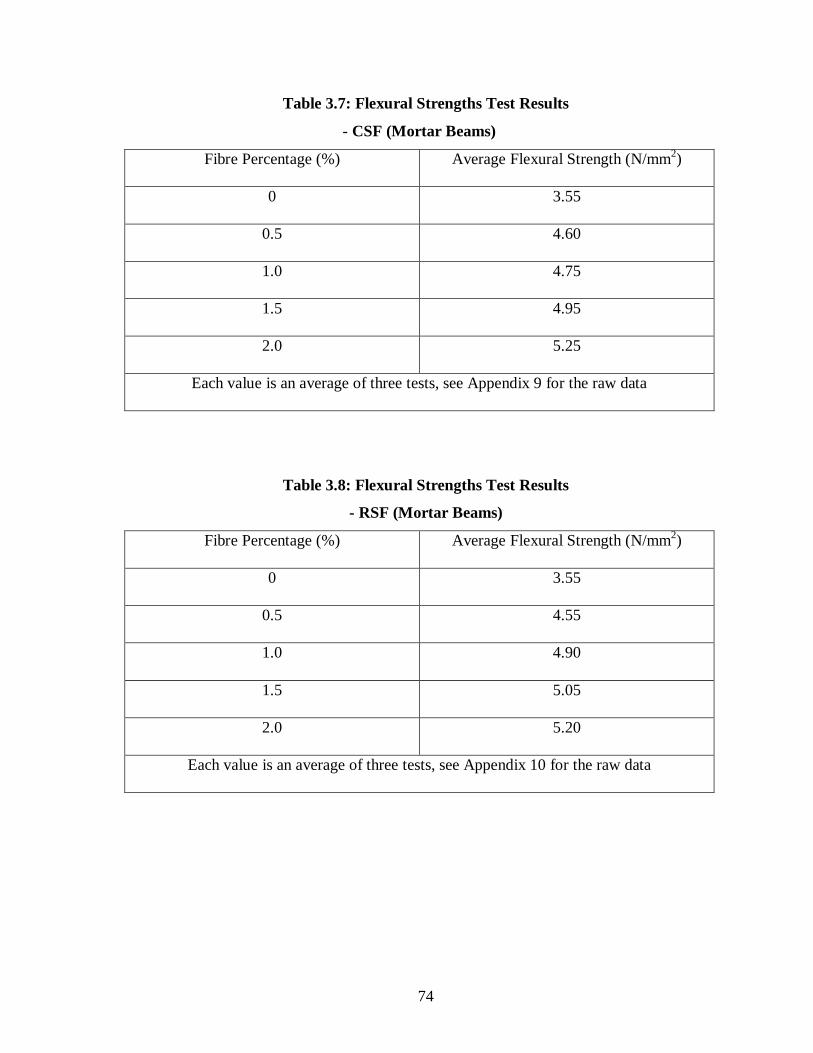
Table 3.7: Flexural Strengths Test Results - CSF (Mortar Beams) 61
Table 3.8: Flexural Strengths Test Results- RSF (Mortar Beams) 61
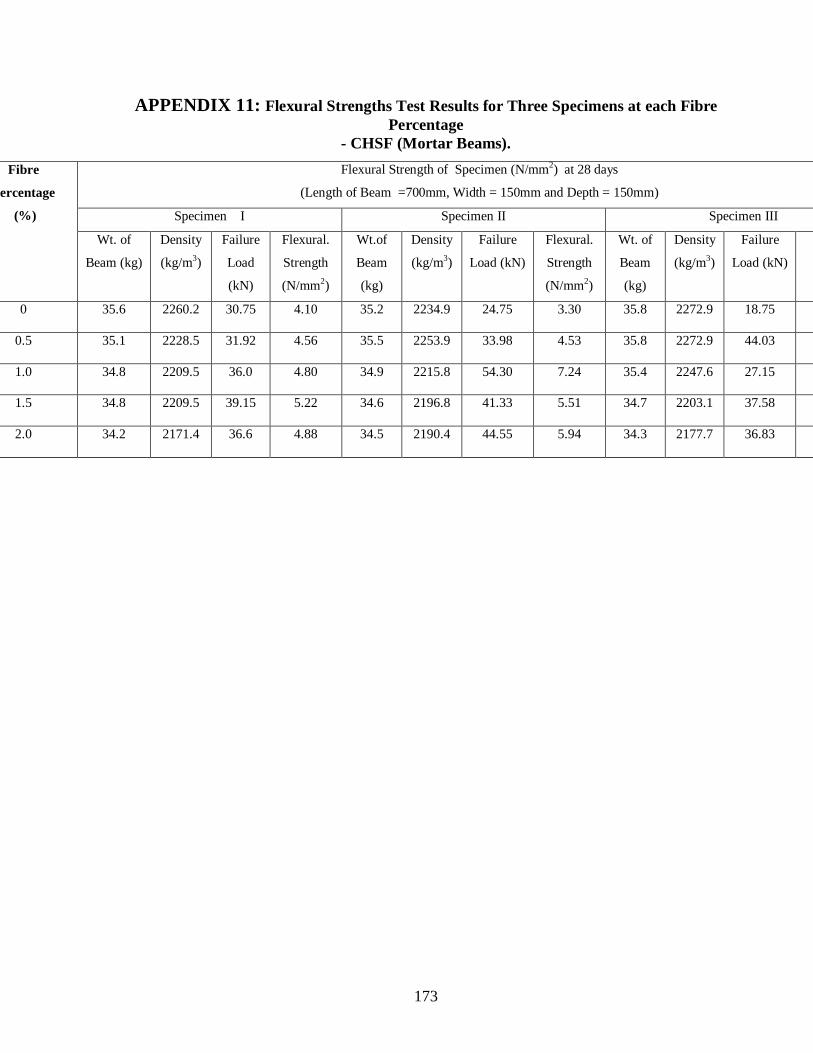
Table 3.9: Flexural Strengths Test Results - CHSF (Mortar Beams) 62
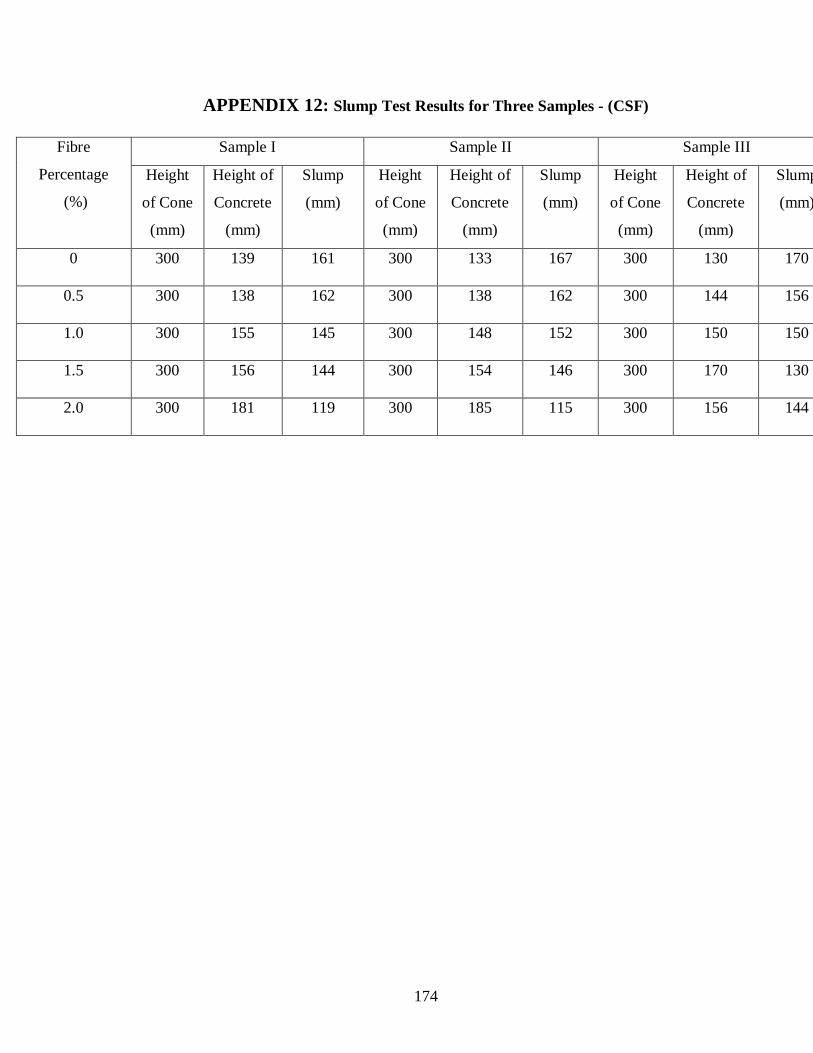
Table 3.10: Slump Test Results – CSF (Concrete Mix) 63
Table 3.11: Slump Test Results - RSF (Concrete Mix) 63
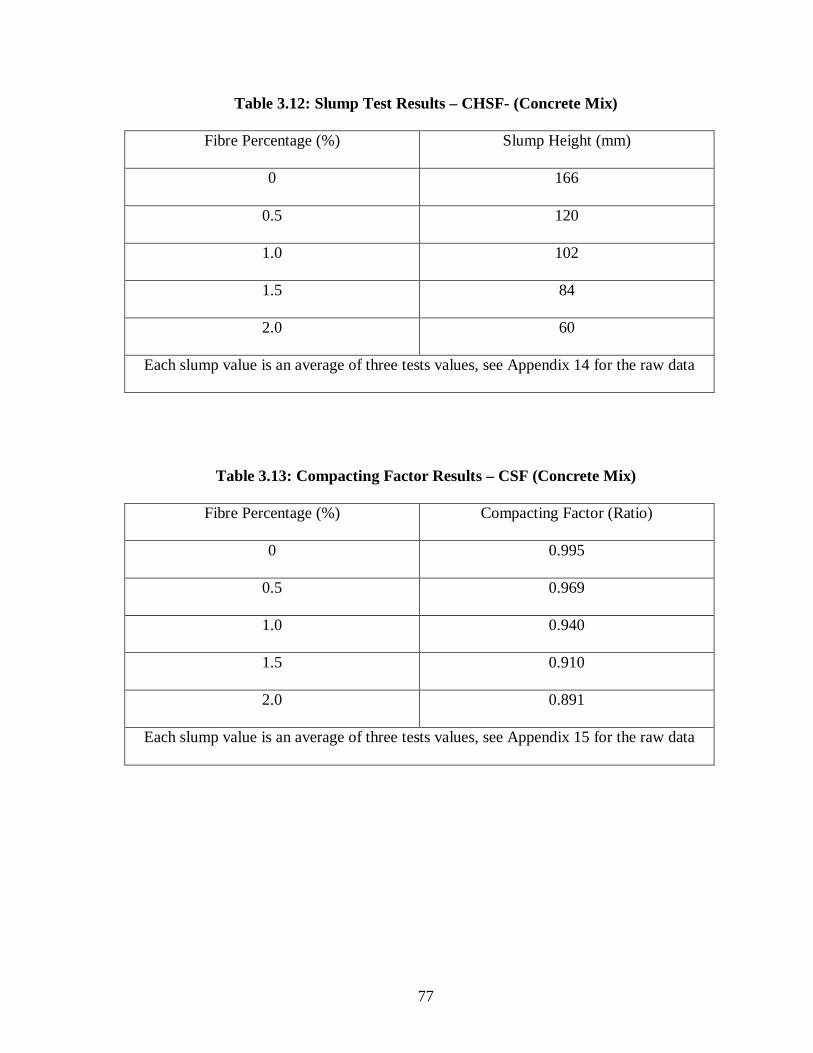
Table 3.12: Slump Test Result – CHSF (Concrete Mix) 64
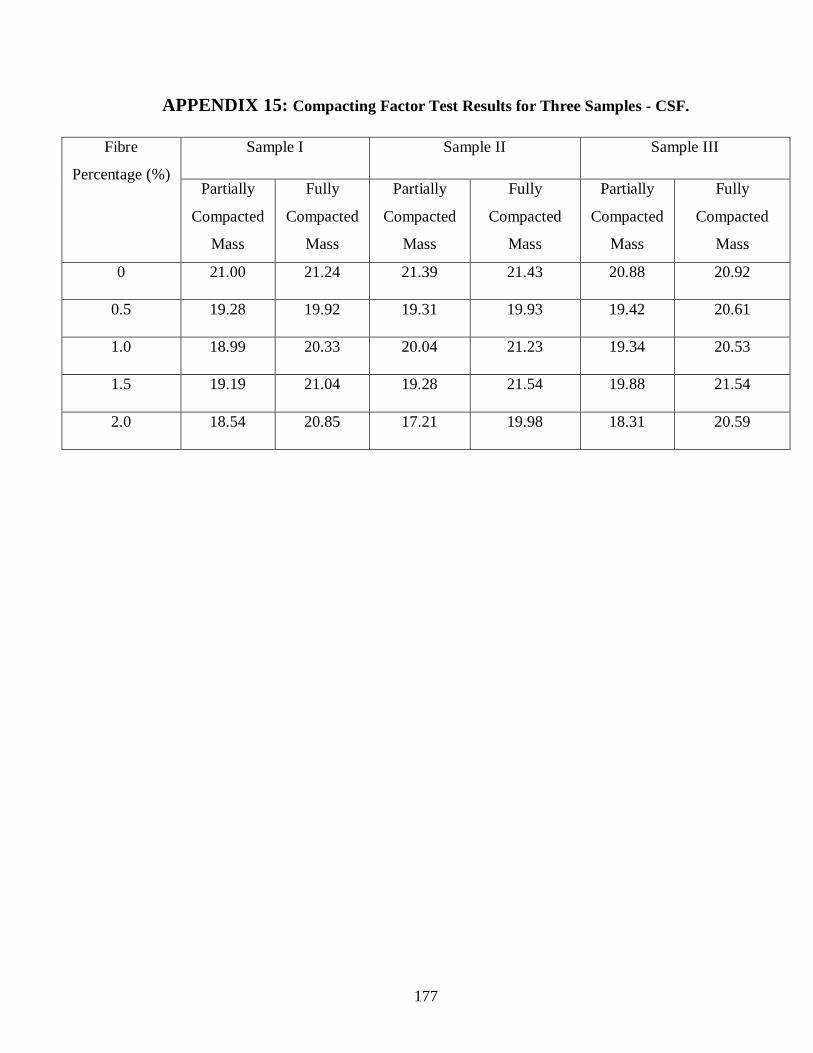
Table 3.13: Compacting Factor Results – CSF (Concrete Mix) 64
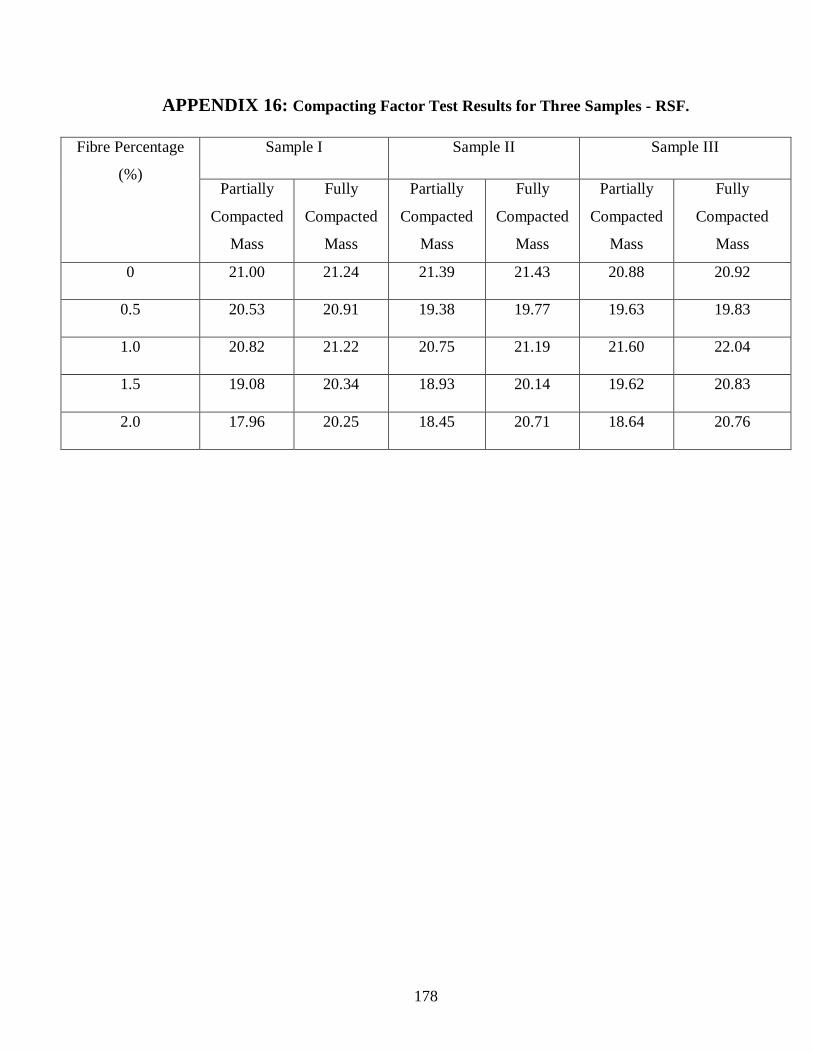
Table 3.14: Compacting Factor Results – RSF (Concrete Mix) 65
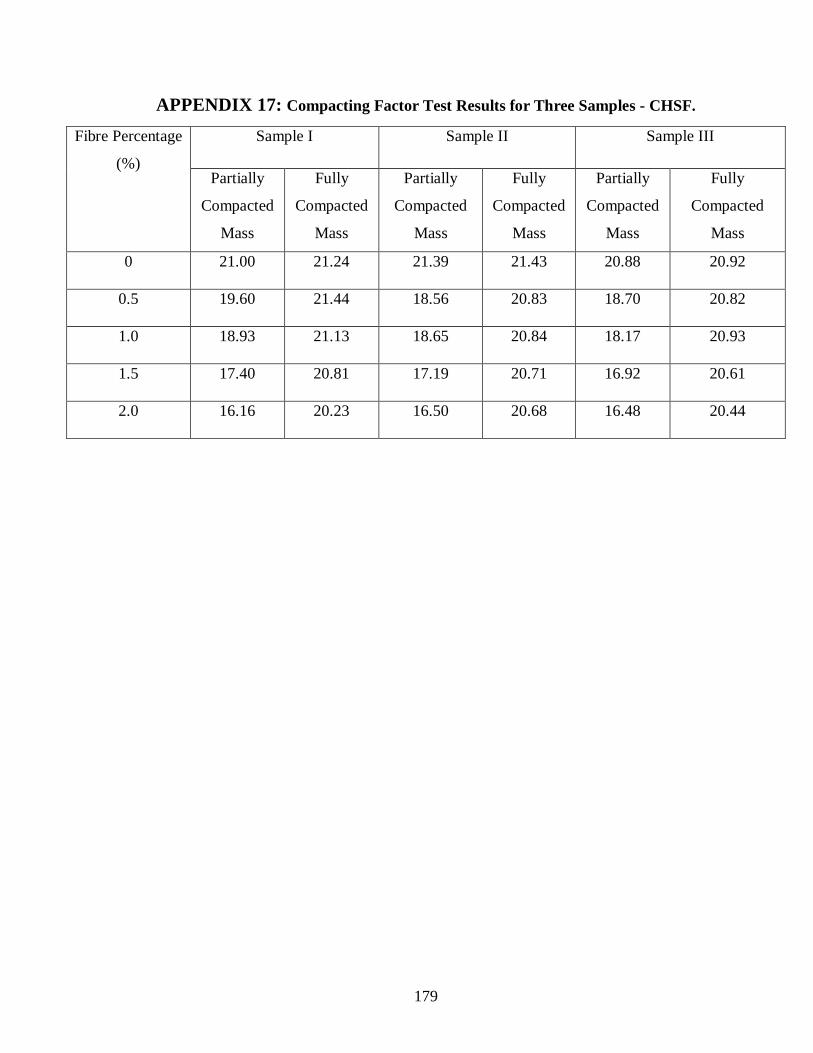
Table 3.15: Compacting Factor Results – CHSF (Concrete Mix) 65
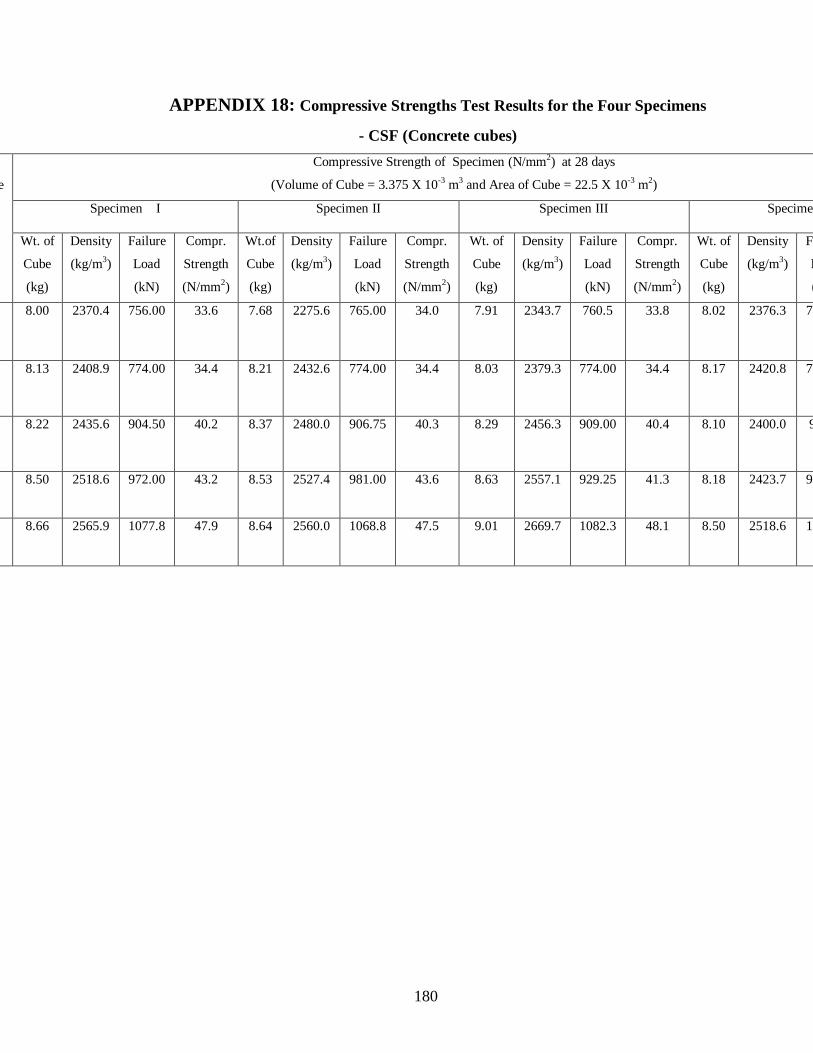
Table 3.16: Compressive Strengths Test Results– CSF (Mortar Cubes) 66
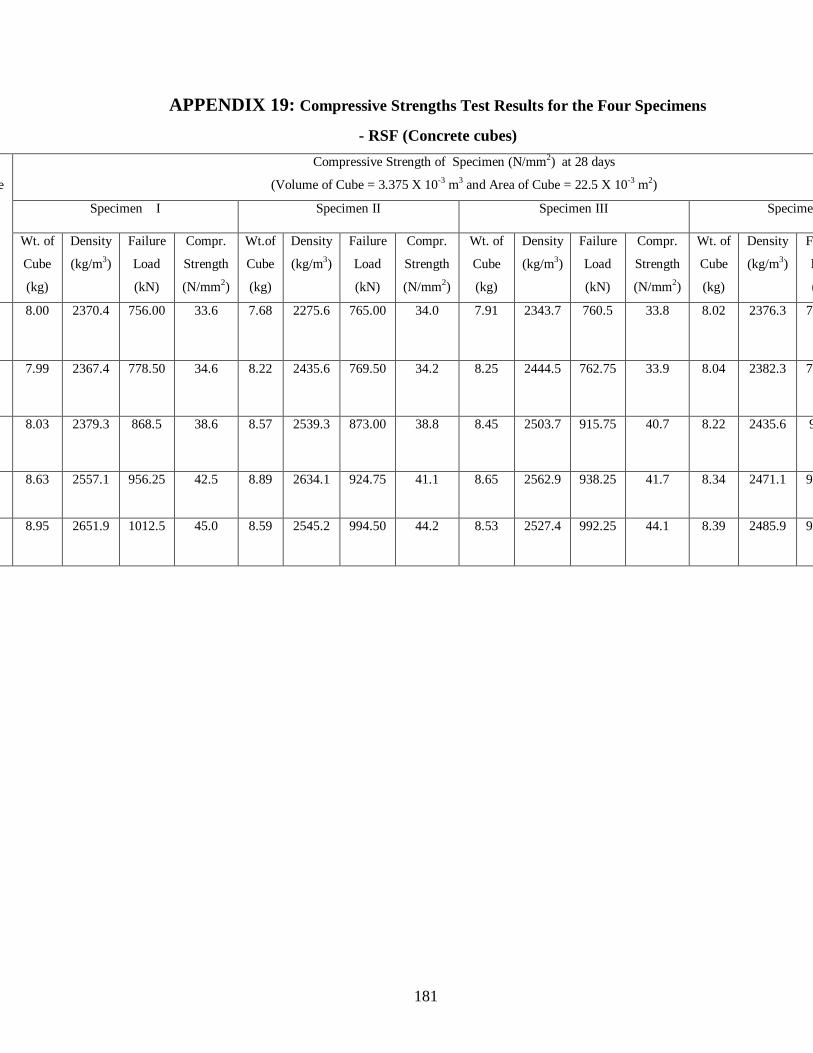
Table 3.17: Compressive Strengths Test Results – RSF (Concrete Cubes) 66
Table 3.18 Compressive Strengths Test Results – CHSF (Concrete Cubes) 67
Table 3.19: Tensile Strengths Test Results – CSF (Mortar Cubes) 68
Page 14
14
Table 3.20: Tensile Strengths Test Results -RSF (Concrete Cubes) 68
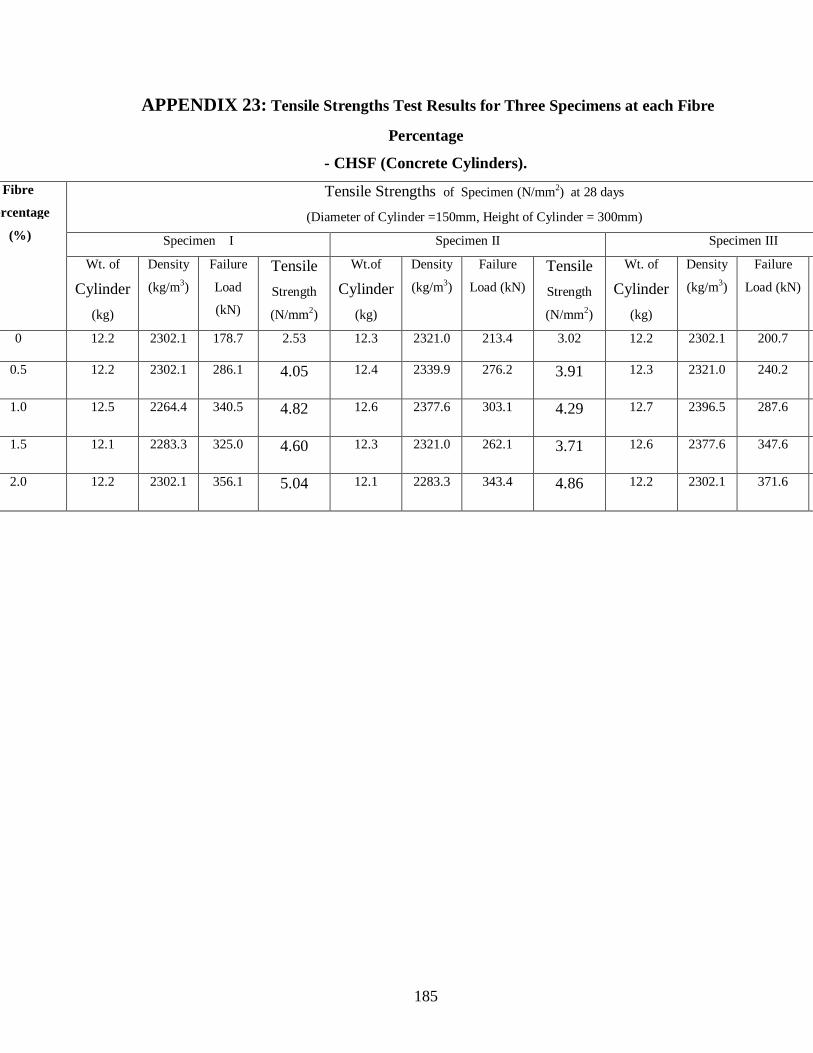
Table 3.21: Tensile Strengths Test Results – CHSF (Concrete Cubes) 69
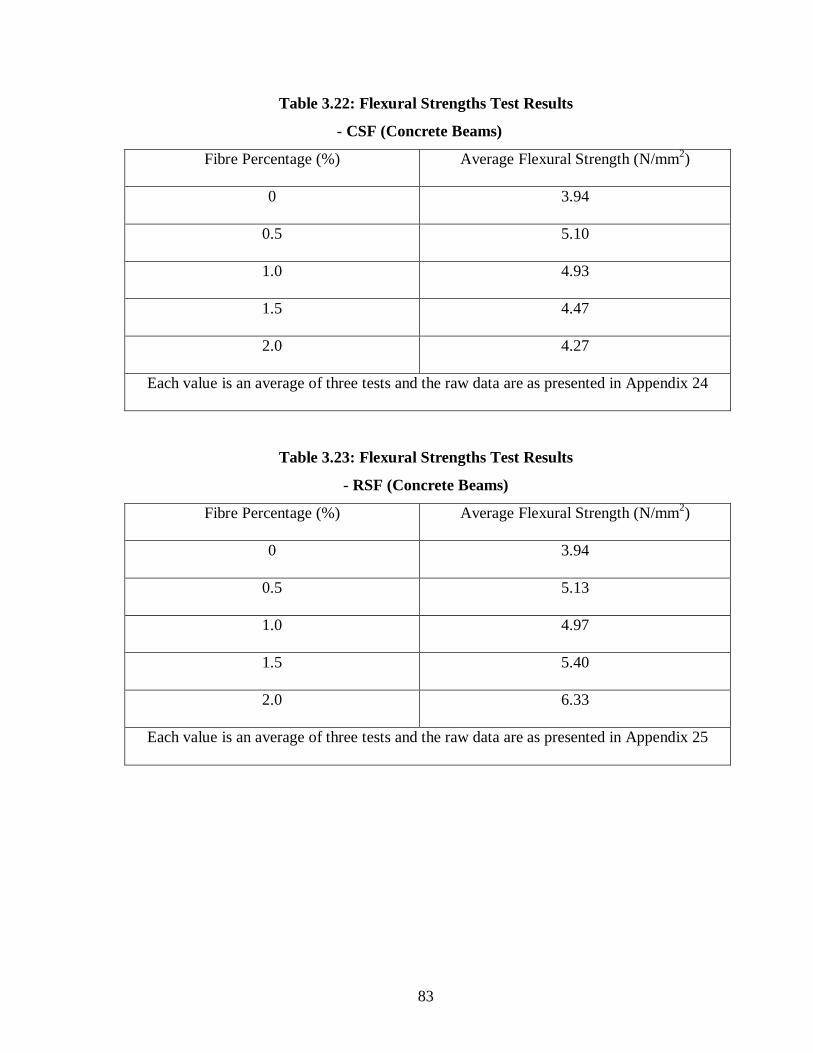
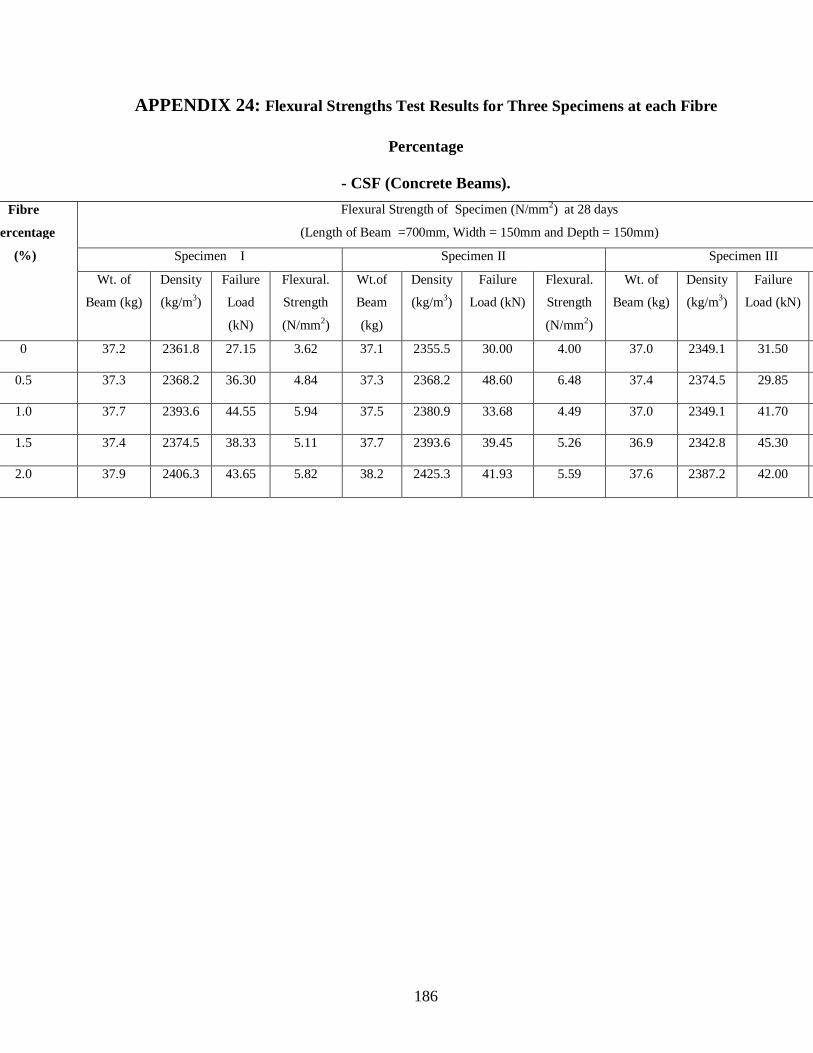
Table 3.22: Flexural Strengths Test Results -CSF (Concrete Beams) 70
Table 3.23: Flexural Strengths Test Results- RSF (Concrete Beams) 70
Table 3.24: Flexural Strengths Test Results - CHSF (Concrete Beams) 71
Table 3.25: Flexural Deflection Results -CSF (Concrete Mix) 72
Table 3.26: Flexural Deflection Results RSF (Concrete Mix) 72
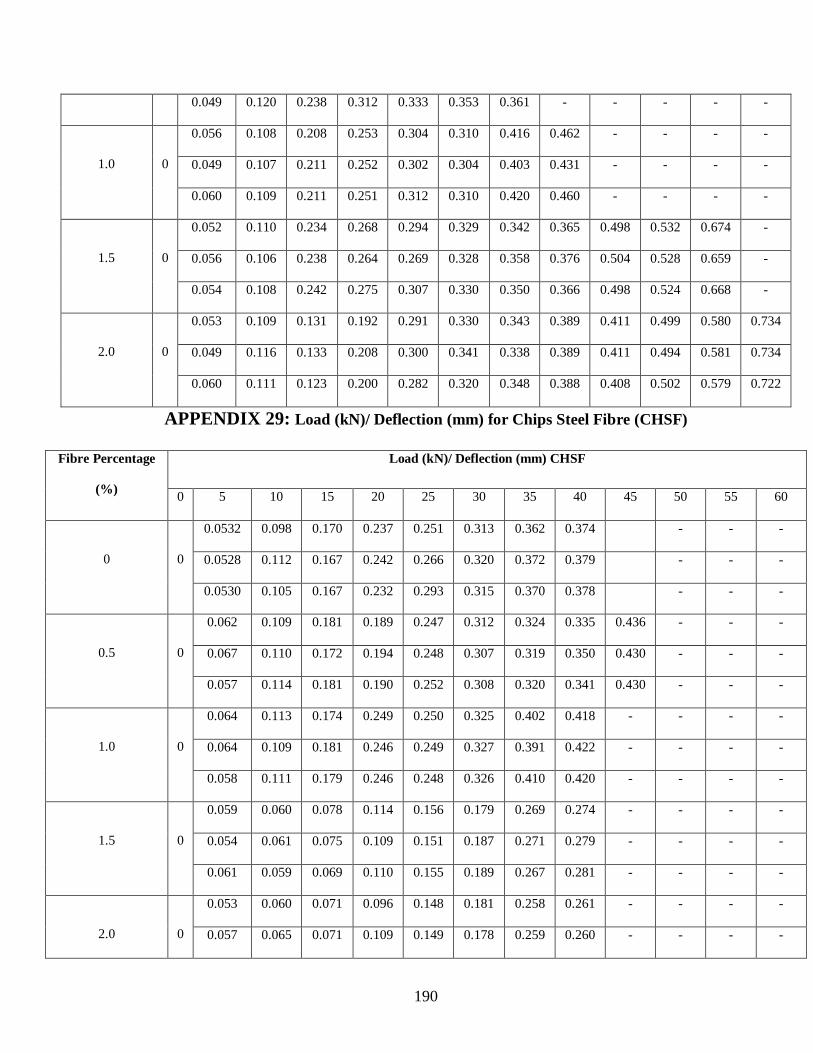
Table 3.27: Flexural Deflection Results CHSF (Concrete Mix) 73
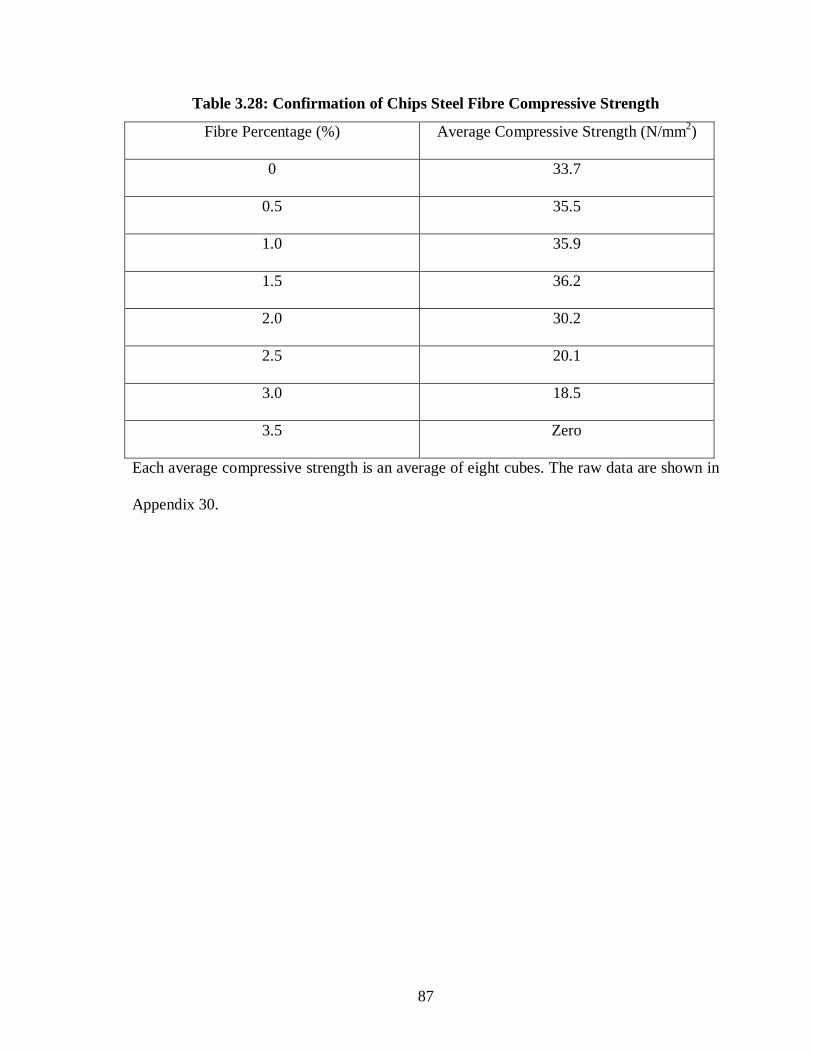
Table 3.28: Confirmation of Chips Steel Fibre Compressive Strength 74
Table 4.1: Comparison of the Properties of Dangote (OPC) with the
Requirements of BS 12 (1986) 77
Table 4.2: Compressive Strength of Mortar Cubes at Different Fibre Dosage 79
Table 4.3: Fibre Mortar Cubes Compressive Strengths Increase over Control 81
Table 4.4: Comparism of Flexural Strength of Fibre Mortar Beam 84
Table 4.5: Increase in Flexural Strength at Different Fibre Volume Dosage 86
Table 4.6: Comparism of Slump Test Results for Fibre Concrete 88
Table 4.7: Percentage Decrease in Slump of Steel Fibre Concrete 90
Table 4.8: Comparism of Compacting Factor Test Results for Fibre Concrete 92
Table 4.9: Compacting Factor Decrease from Control Value 94
Table 4.10: Compressive Strength of Concrete Cubes at Different Fibre Dosage 96
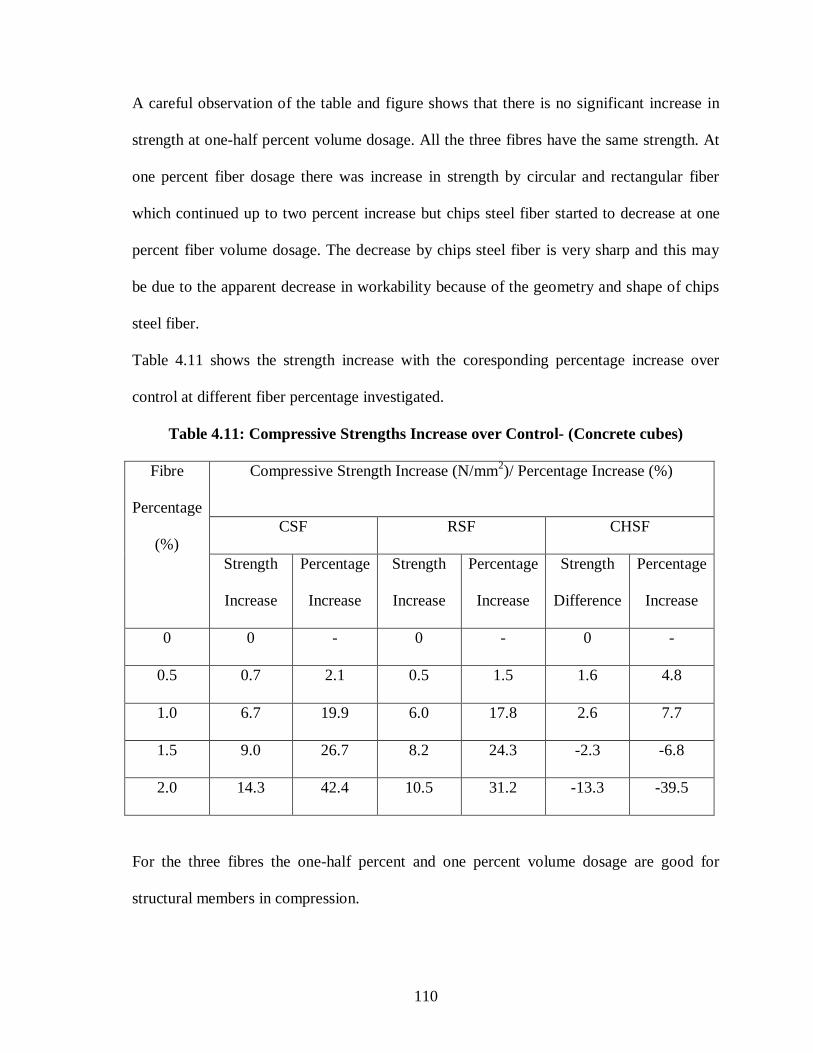
Table 4.11: Compressive Strengths Increase over Control- (Concrete Cubes) 97
Table 4.12: Tensile Strength of Concrete Cylinder at Different Fibre Dosage 98
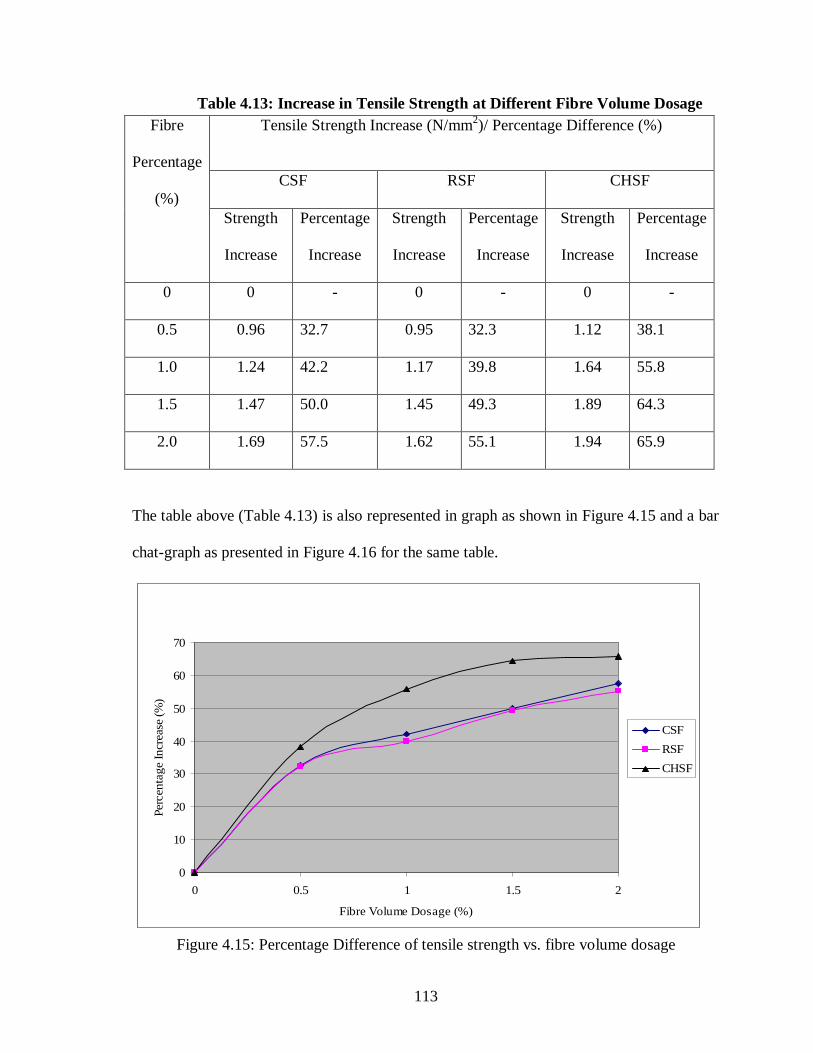
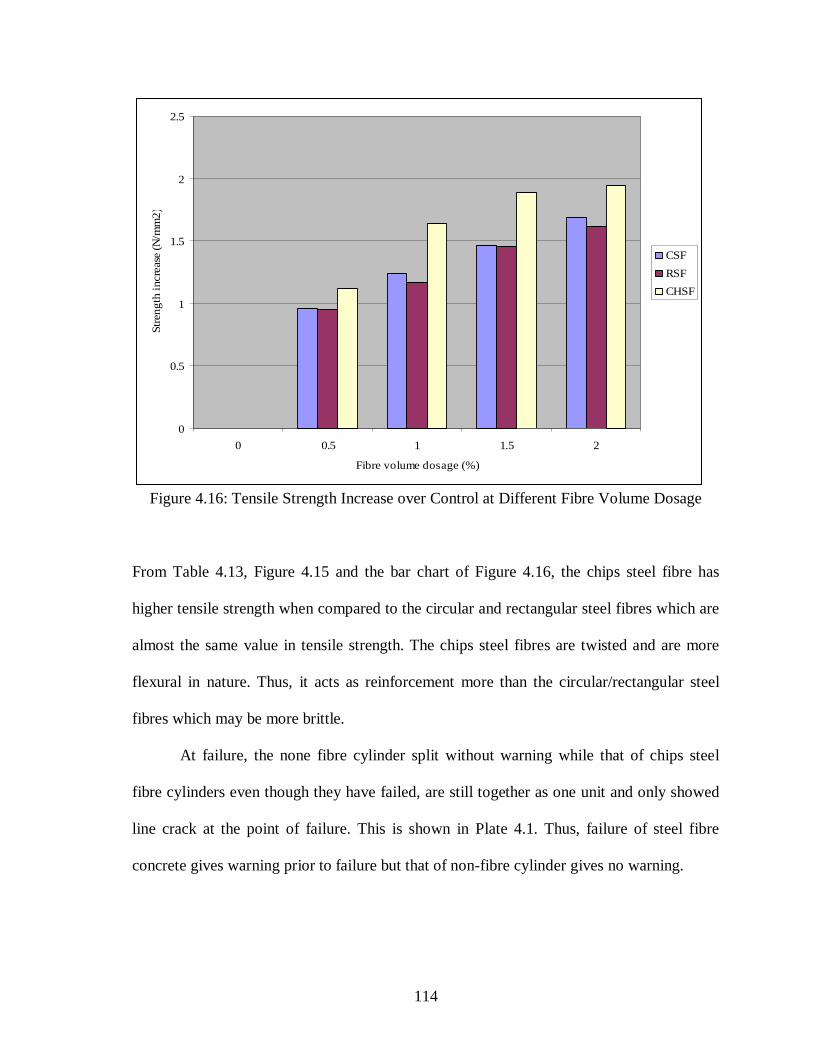
Table 4.13: Increase in Tensile Strength at Different Fibre Volume Dosage 100
Table 4.14: Comparism of Flexural Strength of Fibre Concrete Beam 103
Page 15
15
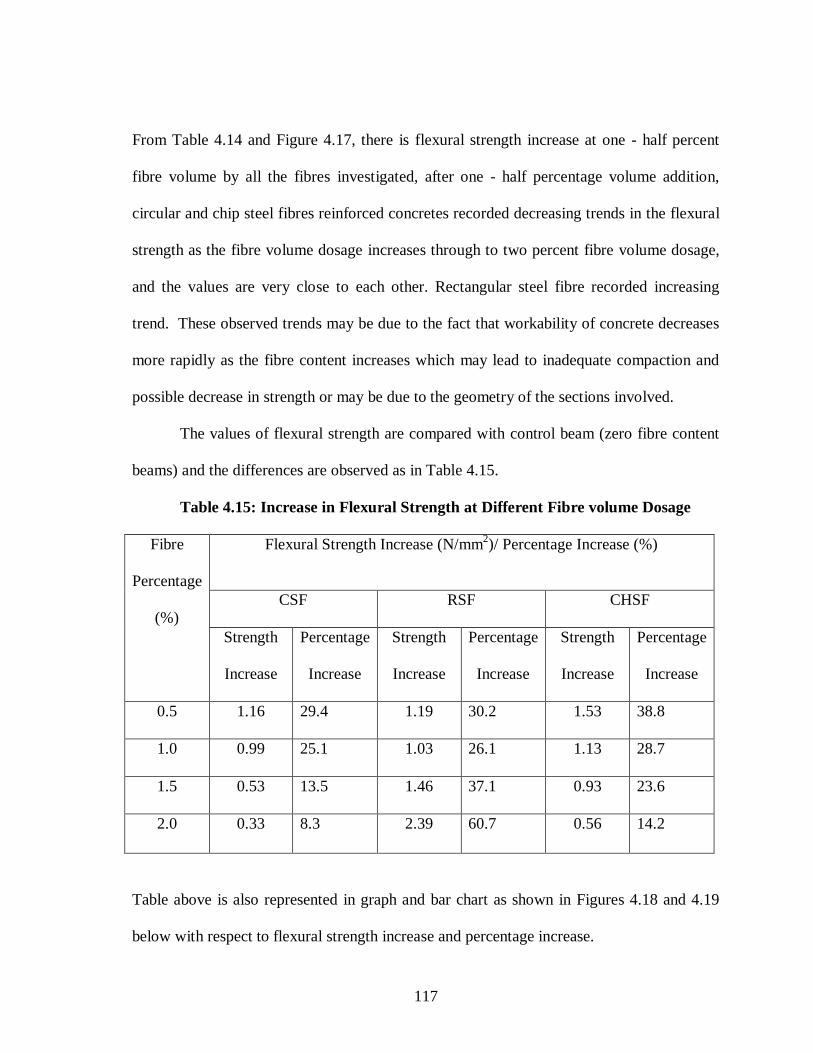
Table 4.15: Increase in Flexural Strength at Different Fibre Volume Dosage 104
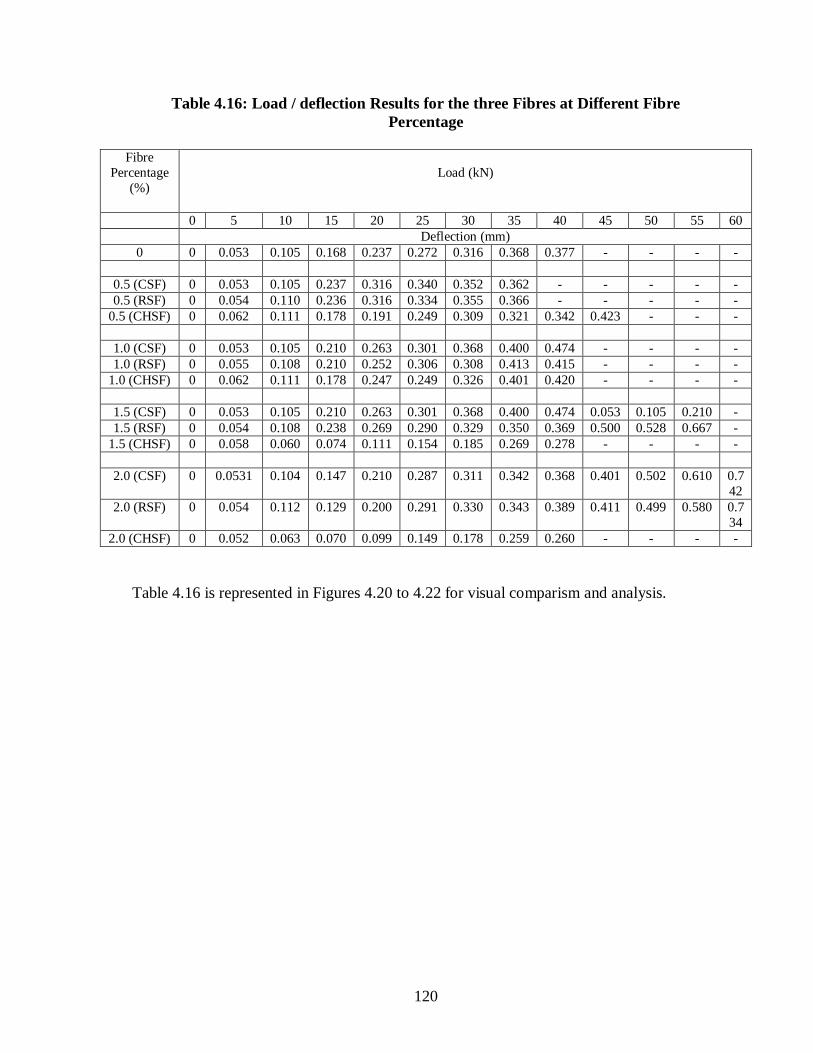
Table 4.16: Load / Deflection Results for the Three Fibres 107
Table 4.17: Compressive Strength of Chips Steel Fibre Concrete Cubes 114
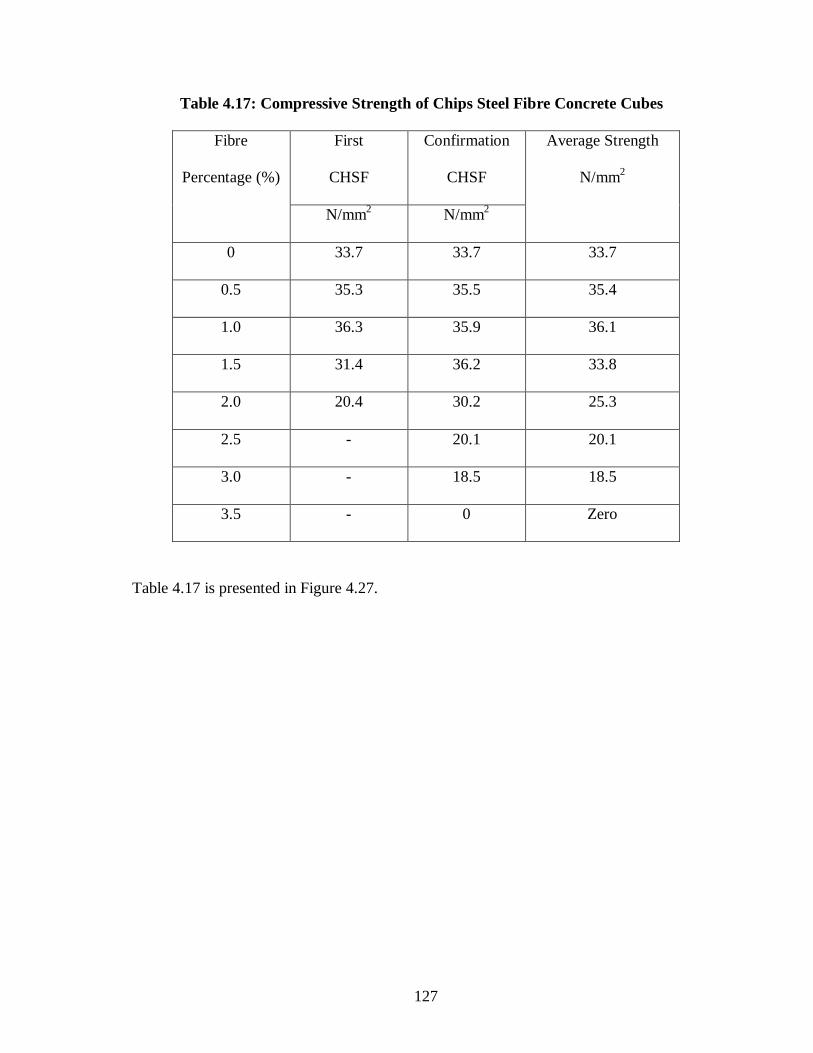
Table 4.18: Coefficients for Mortar Cubes 117
Table 4.19: Coefficients for Mortar Beams 117
Table 4.20: Coefficients for Concrete Cubes 117
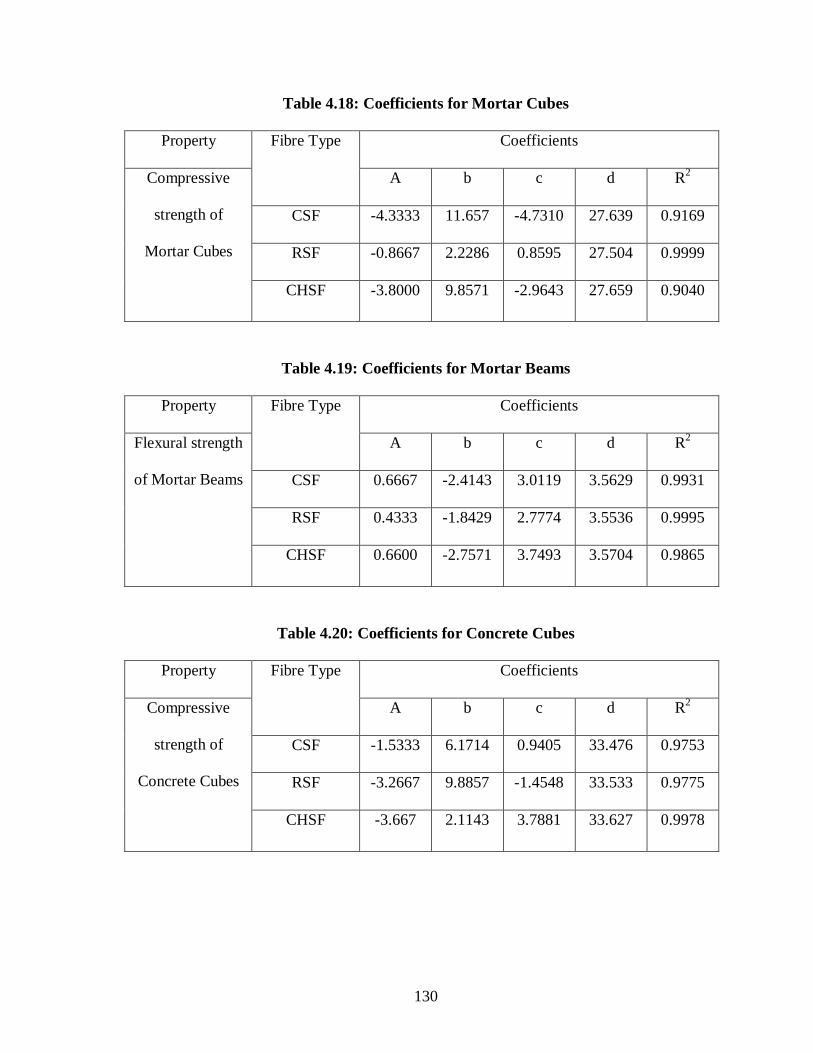
Table 4.21: Coefficients for Concrete Cylinders 118
Table 4.22: Coefficients for Concrete Beams 118
Table 4.23: Compressive Strengths of Mortar Cubes 120
Table 4.24: Flexural Strength of Mortar Beams 121
Table 4.25: Compressive Strength of Concrete Cubes 122
Table 4.26: Tensile Strength of Concrete Cylinder at Different Fibre Dosage 123
Table 4.27: Flexural Strength of Concrete Beams at Different Fibre Dosage 124
Table 4.28: Experimental and Estimated Values of Mortar Beam
Flexural Strength – CSF 127
Table 4.29: Experimental and Estimated Values of Mortar Beam
Flexural Strength – RSF 127
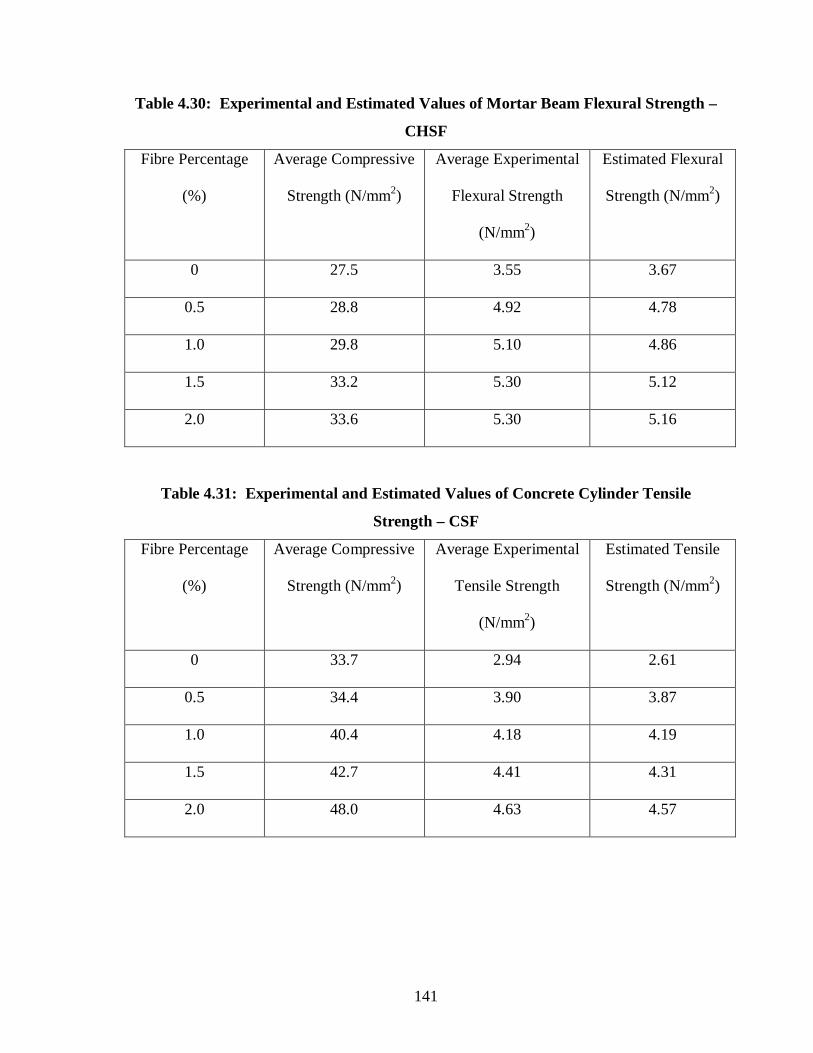
Table 4.30: Experimental and Estimated Values of Mortar Beam
Flexural Strength – CHSF 128
Table 4.31: Experimental and Estimated Values of Concrete Cylinder
Tensile Strength – CSF 128
Table 4.32: Experimental and Estimated Values of Concrete Cylinder
Tensile Strength – RSF 129
Table 4.33: Experimental and Estimated Values of Concrete Cylinder
Tensile Strength – CHSF 129
Table 4.34: Experimental and Estimated Values of Concrete Beam
Flexural Strength – CSF 130
Page 16
16
Table 4.35: Experimental and Estimated Values of Concrete Beam
Flexural Strength – RSF 130
Table 4.36: Experimental and Estimated Values of Concrete Beam
Flexural Strength – CHSF 131
Table 4.37: Toughness Index for Steel Fibre Concrete Beam – CSF 132
Table 4.38: Toughness Index for Steel Fibre Concrete Beam – RSF 132
Table 4.39: Toughness Index for Steel Fibre Concrete Beam – CHSF 133
List of Plates
Plate 3.1: The three types of waste fibres used in this work 55
Plate 3.2: Test Rig with Beam specimen positioned for test 60
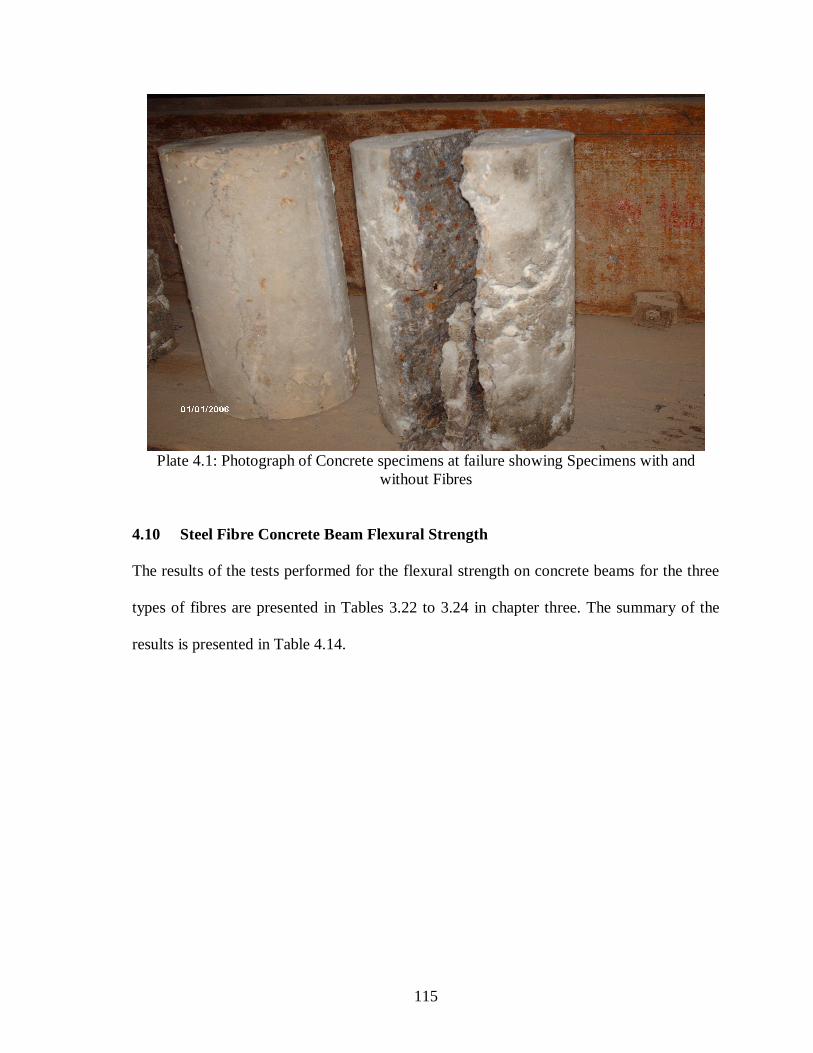
Plate 4.1: Photograph of concrete specimens at failure showing
specimens with and without fibres 102
0
Page 17
17
CHAPTER ONE
INTRODUCTION
1.1 Preamble
Concrete is acknowledged to be a relatively brittle material when subjected to normal
stresses and impact loads, where tensile strength is only approximately one tenth of its
compressive strength Neville, (1997). As a result of these characteristics, plain
concrete members cannot support such loads and stresses that are usually imposed on
structural elements. Historically, concrete members are reinforced with continuous
reinforcing bars to withstand tensile stresses and compensate for the lack of ductility
and tensile strength. Steel reinforcement was adopted to overcome high potentially
tensile stresses and shear stresses at critical location in concrete members.
Steel fibre mortar or concrete is either mortar or concrete where some percentages of
steel fibres are introduced into the mortar or concrete. Steel fibre mortar or concrete in
general has specialized properties that enhances resistance to impact, abrasives,
improves brittleness, good resistance to vibration loads and has high durability Lees
(2001) and Ghagal (2003).
In the early days of fibre concrete (FC), it was only used for pavement and industrial slabs.
But recently, applications of fibre-reinforced concrete have wide variety of usage in
structures such as heavy-duty pavement, airplane runways, industrial slabs, etc.
In this work, the properties of steel fibre mortar and concrete are the major point of
investigation.
Page 18
18
1.2 Research Aim and Objectives:
The aim of this work is to carry out a study on steel fibres mortar and concrete and that
would provide the needed improvement in the mechanical properties of steel fibre mortar
and concrete. This will aid in a better understanding of the properties of steel fibres mortar
or concrete and would enable one make use of the steel fibre mortar or concrete in
structures.
The objectives and scope will include:
(a) Conduct a comprehensive literature review in order to determine the current state of
the art regarding steel fibre reinforced concrete.
(b) Sourcing and processing of steel fibre.
(c) Evaluation of the strength properties of cubes compressive strength, beams flexural
strength and cylinders split tensile strength.
(d) Development of model equations for the prediction of the strength properties of
steel fibre mortar and concrete composite.
1.3 Scope and Methodology
The work in this thesis covers the following properties of steel fibre mortar and concrete
Workability
Compressive strength of mortar and concrete
Flexural strength of mortar and concrete
Flexural deflection of concrete beams
Tensile strength of concrete
Page 19
19
The methodology involves intensive literature review followed by an experimental set up in
accordance with codes and standards to determine the above properties, analysis of the
obtained results to arrive at a reasonable conclusion.
1.4 Research Limitation
The work covers only three types of fibres like Circular steel fibre (CSF),
Rectangular steel fibre (RSF) obtained from burnt tyres and chips steel fibres (CHSF)
which is a waste from Armaco Steel Company, Kaduna, in Kaduna State. It does not touch
the aspect of polymer fibres, natural fibres and any other synthetics fibres.
1.5 Research Outcomes
The results shows that there is increase in compressive strength as the fibre
percentage increases up to a critical percentage of one and half percentage. There is a
decrease in workability of concrete as the steel fibre increases and good improvement on
flexural and tensile strengths of steel fibre mortar and concrete.
Page 20
20
CHAPTER TWO
LITERATURE REVIEW
Historically, fibres have been used to reinforce brittle materials since ancient times;
straws were used to reinforce plaster and asbestos fibres have also been used to reinforce
Portland cement, Shah and Rangan (1970). Patents was granted since the turn of the 19th
century for the various methods of incorporating wire segments or metal chips into concrete,
Romualdi and Batson (1963). The low tensile strength and brittle character of concrete have
been by-passed by the use of reinforcing rods in the tensile zone of the concrete since the
middle of the nineteenth century. The reinforcing rods would carry the tension, and the
metal's ductile nature could be utilised in making the composite more ductile.
Around 1920, Griffith's observations on rupture and flow in solids gave insight to the
understanding of brittle matrix fracture. Griffith observed that the actual load-carrying
capacity of an isotropic material was many times less than the theoretical strength it should
have, based on its molecules' bond strengths. Griffith postulated this weakness was due to the
presence of inherent discontinuities or flaws in the material.
Romualdi and Batson (1963) applied Griffith's postulation on brittle fracture of
concrete. They hypothesized that the addition of closely spaced wire reinforcement would
increase the strength of concrete by "arresting" any crack growth, thereby preventing several
cracks from coalescing into a failure plane.
Page 21
21
2.1 Types of Fibres
The pioneering work of Romualdi and Mandel (1964) on random fibres has been
followed with considerable enthusiasm in exploring the potentials of various types of fibres in
a low-modulus matrix, and these has resulted in a good understanding of the fibre composite
behaviour. Figure 2.1 shows the broad classification of fibres. Most of the fibres used for
construction purposes are found under the natural fibres. However, because of the cheap and
availability of some vinyl polymers and waste like fibres, many of these are also been used in
civil engineering applications, Table 2.1.
Fibres vary in types, geometry, properties and availability in construction industry.
Most common types of fibres are steel fibres, glass fibres, and polypropylene fibres.
Their usages may alter in concrete for different applications and the applications mostly
depend and are adopted on properties, effectiveness, cost and availability. Special types of
fibres such as carbon, and kevlar, natural fibres, mineral fibres, and asbestos fibres may be
used in harsh environment. These differences and usage of fibres depend on the
requirements, behaviour and properties for a concrete, allowing the increase in the explicit
effects and mechanical properties. Fibre geometry varies from hooked end fibres, deformed
fibres, deformed wires, fibre mesh, wave-cut fibres, large end fibres with different types
and geometries.
Page 22
22
Table 2.1: Typical Properties of Some Fibres (ACI , 1993).
Type of fibre Tensile Young’s Ultimate Specific Strength Modulus Elongation Gravity N/mm2 103 N/mm2 Percent
Acrylic 207-414 2.07 25-45 1.10
Asbestos 552-966 82.8-138 ≈0.6 3.20
Cotton 414-690 4.83 3-10 1.50
Glass 1035-3795 69 1.5-3.5 2.50
Nylon (high tenacity) 759-828 4.14 16-20 1.10
Polyester (high tenacity) 724.5-862.5 8.28 11.13 1.40
Polyethylene 690 0.14-0.41 10 0.95
Polypropylene 552-759 3.45 25 0.90
Rayon (high tenacity) 414-621 6.90 10-25 1.50
Rock Wool (Scandinavian) 483-759 69-117.3 0.6 2.70
Steel 276-2760 200.10 0.5-35 7.80
Page 23
23
2.1.1 Steel Fibres
Steel fibres are widely used in civil engineering applications and concrete
reinforcement, due to its relative availability, reasonable cost and better experience in its
application with conventional steel reinforcement. Bentur and Mindness (1990) stated that
the early research and studies on fibre reinforced concrete in 1950’s to 1960’s mainly were
on the behaviour of steel fibre reinforced concrete. Steel fibres greatly increase toughness
of concrete, which primarily is used for crack and shrinkage controls, to serve as secondary
reinforcement for pavements, slabs, pipes, channel and tunnels, Elvery and Samarai,
(1975). Its potential improvements are to increase toughness, minimize cracking due to
temperature changes and increase resistance due to extreme loading and environmental
effects such as impact, abrasion, blasting and fatigue. Furthermore, steel fibre reinforced
concrete greatly reduces the potential for fractures and spalling.
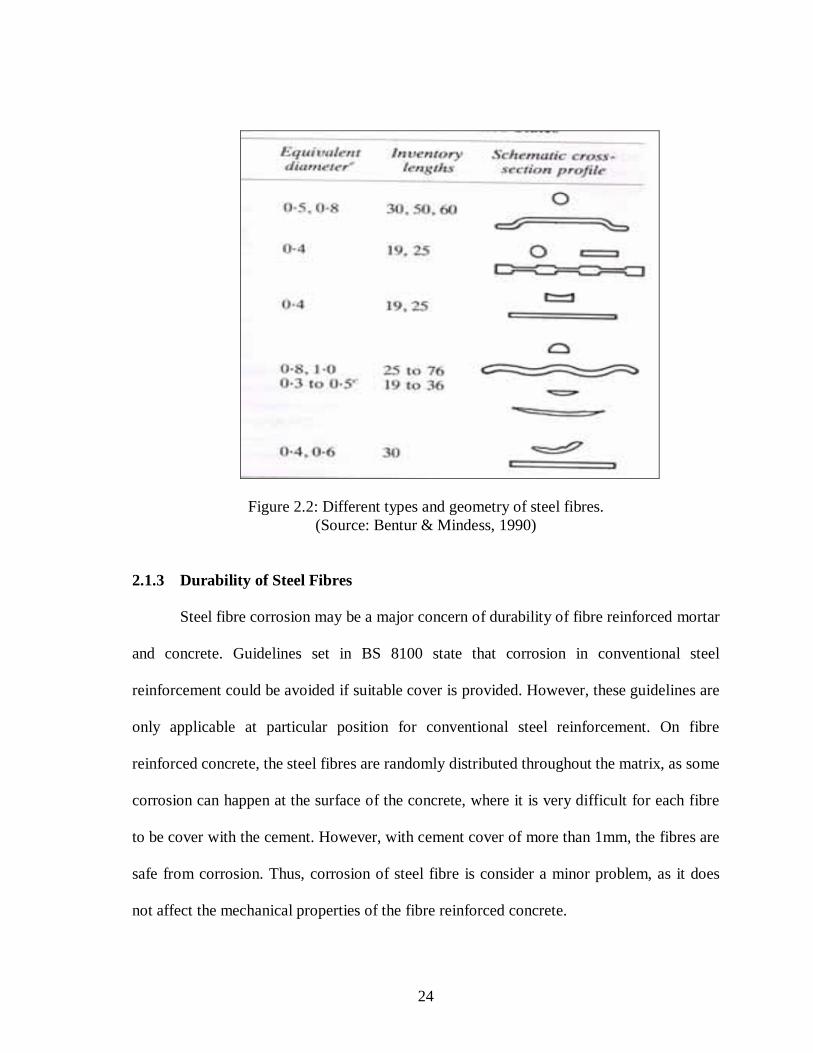
2.1.2 Shape and Geometry of Steel Fibres
Cross sectional dimensions of typical steel fibre of range from 0.5mm to 1mm thick,
0.25mm to 0.90mm wide, with diameter range of 0.25mm to 0.75mm, where created in
various form of geometry. Steel fibres were produced in steel sheet form, through the
process of cutting steel sheets. Depending on the geometry desired, steel fibres are crimped
and construct to deformed, end flat and enlarged end shapes. Using similar process,
chopped drawn wire shape of steel fibres has been produced. Steel fibres with hooked and
wave shapes have been produced and well-known in use for construction industry
currently. These different geometries and shapes of steel fibres are widely used in industry
to fulfill the desirable behaviour and properties requirement of concrete. Figure 2.2 below
shows some deformed fibres that are available.
Page 24
24
Figure 2.2: Different types and geometry of steel fibres. (Source: Bentur & Mindess, 1990)
2.1.3 Durability of Steel Fibres
Steel fibre corrosion may be a major concern of durability of fibre reinforced mortar
and concrete. Guidelines set in BS 8100 state that corrosion in conventional steel
reinforcement could be avoided if suitable cover is provided. However, these guidelines are
only applicable at particular position for conventional steel reinforcement. On fibre
reinforced concrete, the steel fibres are randomly distributed throughout the matrix, as some
corrosion can happen at the surface of the concrete, where it is very difficult for each fibre
to be cover with the cement. However, with cement cover of more than 1mm, the fibres are
safe from corrosion. Thus, corrosion of steel fibre is consider a minor problem, as it does
not affect the mechanical properties of the fibre reinforced concrete.
Page 25
25
2.2 Glass Fibres
Soviet research in late 1950’s explored the low alkali properties of glass fibres in
cement system, which had low value of pH. Until 1960’s, glass fibres were classified as
possible reinforcement to high pH value cement systems only, James, (1990). Glass fibre is
a strong, lightweight material, which has tremendous fracture toughness, posses high
tensile (280 to 3500N/mm2) and modulus of elasticity (3.1 to 3.5 kN/m2) in high alkaline
cement systems.
2.3 Synthetic Fibres
In recent years, synthetic fibres have become more attractive for reinforcement of
cement and concrete material. According to James (1990), Shell Chemical Company started
the investigation on the use of polypropylene fibres in concrete around 1965. The
developments of synthetic fibres were successfully utilized in bonding and reinforcement in
cement matrix, James, (1990) and Zaher and Bayomy, (1999). Synthetic fibres have very
high tensile strength, but these fibres can be differentiated into two categories, either by
high or low modulus of elasticity, Synthetic industries concrete company, (2000). Most of
the synthetic fibres in use fall in the categories of low modulus of elasticity, such as
polypropylene, polyester, polyethylene, and nylon. The main advantages of these fibres are
alkali resistance, high melting point (up to 165oC) and low cost of the raw material.
Disadvantages are poor fire resistance, poor bond with cement matrix and sensitive to
sunlight and oxygen. Low modulus of elasticity synthetic fibres shows its usefulness in
increasing the toughness and shrinkage cracking in concrete. However, they seem less
applicable in increasing the flexural strength and ductility of concrete, Bentur et. al, (1990)
and Lees and Burgoyne, (2000).
Page 26
26
2.4 Other types of Fibres
The above three types of fibres are the most commonly used fibres in the industry
and constructions today. There are more types of fibres in used, but their applications are
limited. Such limitation of these fibres may be due to non availability in the current market,
high costs of material or less effectiveness in the fibre reinforced composite. However,
these fibres may have some advantages over steel, glass and synthetic fibres. These other
types of fibres include: Asbestos fibres, Natural fibres, and Carbon fibres, etc.
2.4.1 Asbestos Fibres
Asbestos fibres are made of natural crystalline fibrous minerals. Asbestos/cement
was the first fibre-reinforced composite in modern times, and are still in use more than any
other fibre-reinforced materials.
Asbestos fibres relatively have high modulus of elasticity and strength, which
permits effective dispersion of large fibre volume and enhance the bond with cement
matrixes. These fibres are utilized with fibre-reinforced materials and are suitable in low
cost housing and infrastructure.
2.4.2 Natural Fibres
These are the oldest form of fibre-reinforced composites, using fibres such as straw
and horse hair in structures. Recently, with modern technology, natural fibres have been
extracted economically from various vegetable and animal, such as jute, bamboo and wool.
These fibres requires low amount of energy to extract. Relatively, they have limited use due
to high water absorption and low tensile strength compared to steel and synthetic fibres.
Page 27
27
Primary problem with these fibres are their tendency to fragment in an alkaline
environment. Special treatments for this problem is by using admixtures to improve their
durability and making concrete less alkaline, and allowing these fibres to increase its
strength. These natural fibre-reinforced composites are commonly uses for thin sheet and
cement products, as well as the application for cement cladding.
2.4.3 Carbon Fibres
Carbon fibres have limited use in cementitious material, because of its high cost in
mid 1980’s, but recently, low cost carbon fibres have been manufactured using petroleum
and coal pitch. The two processes of making carbon fibres involve heat treatments of
various grade of carbon in chemicals and these fibres find their applications as substitute to
cement-based pipe and wood in structures. Carbon fibres have specialized applications in
improving tensile and flexural strength. Typically, they have an elastic modulus as high as
steel, yet they are very light. Its common uses are applications in sheeting and wrap as
externally reinforced degrading concrete structures. Properties of carbon fibres composite
which are greatly increased are strengths, chemical stability and stiffness. There are several
precursors for production of carbon fibres. Carbon fibres are produced through controlled
oxidation, orientation of graphitic crystallites, carbonization and stretching from carbon
precursors. These precursors include polyacrylonitrile (PAN), cellulose fibres, pitch
precursors, non-heterocyclic aromatic polymers, aromatic heterocyclic polymers, linear
polymers and coal James, (1990).
Page 28
28
2.5 Advantages and Limitations of Fibre Reinforced Concrete (FRC)
Fibres, which are randomly distributed throughout the concrete, can overcome
cracks and control shrinkage more effectively. These materials have outstanding
combinations of strength and energy absorption capacity. In general, the fibre
reinforcement is not a substitution for conventional steel reinforcement. The fibres and steel
reinforcement have their own role in concrete technology. Therefore, in many applications
both fibres and continuous reinforcing steel bars can be use together.
However, fibres are not efficient in withstanding the tensile stresses compare to
conventional steel reinforcement. But, fibres are more closely spaced than steel
reinforcement, which is better in controlling crack and shrinkage. Consequently,
conventional steel reinforcement are used to increase the load bearing capacity of concrete
member; while fibres are more effective in crack control.
Due to these differences, there are particular applications that fibres reinforcement are
advantageous than conventional steel reinforcement. These include:
Fibres comprise as ‘primary reinforcement’, in which the conventional steel
reinforcement cannot be utilized. The fibre concentrations are comparatively high in
thin sheet materials, normally exceeding 5% by volume, acts to increase toughness
and strength of mortar or concrete.
Fibres can be components to withstand locally high loads or deformations, which
are applies to structures like precast piles, precast walls, blast resistant structures or
sewer tunnel and linings.
Applications that control cracks persuaded by temperature and humidity, such as
pavements and slabs, where fibres acts as ‘secondary reinforcement’.
Page 29
29
The use of steel bars and wire mesh require unnecessary labor and material costs for
structural concrete. With replacement of randomly distributed short fibres as an alternative
reinforcement, this will significant reduce both labour and material costs, greatly reduce
construction and project time.
Fibres substantially reduce formation of plastic shrinkage and settlement; enable the
concrete to develop its full potential long-term strength in application to structural and
providing solution to exceed and meet their performance and economical prospect.
Additionally, fibres provide an effective secondary reinforcement for shrinkage and
crack width control. Macro-cracks and potential problems are prevented and blocked when
micro-cracks intersect fibres as concrete hardens and shrink. Effects of crack control
reinforcement by additional of fibres in concrete is shown in figure 2.3 below.
Without fibre-reinforced With fibre-reinforced
Figure 2.3: Comparison of cracks with and without Fibre reinforced. (Source: Fibremesh, 1989)
Benefits of using fibre-reinforced concrete are:
Page 30
30
Increase impact and shatter resistance, fatigue endurance and shear strength of
concrete.
Requires no special equipments to install reinforcement.
Increase crack resistance, long-term ductility, energy absorption capacity and
toughness of concrete.
Reduce labor and material costs in concrete applications.
Provides multi-directional concrete reinforcement.
Compatible with admixtures, all types of cement and concrete mixtures.
Reduce plastic shrinkage and crack width formation.
Restrictions and limitations of using fibre-reinforced concrete are:
Control crack as result of external stresses.
Reduction in curling and creep.
Justification for a reduction in the size of support columns.
Higher structural strength development.
Replacement of any moment for structural steel reinforcement.
Decreasing the thickness of slab on grade.
Although short fibres cannot completely replace conventional steel reinforcement, they
create supplementary reinforcement use to achieve increase in strength, higher ductility,
greater shrinkage, crack control, fatigue, impact and abrasion resistance. However,
development and advances in technologies has led to the discovery of more effects for
fibres behaviour and mechanical properties of concrete.
Page 31
31
2.6 Field Performance of Fibre Reinforced Concrete
Concrete is the most common material used in construction field Hoff, (1975). Fibre
reinforced concrete used in slab and pavement applications, general performed well than
plain concrete that has the same thickness, concrete flexural strength and foundation
subgrade condition. The performance of fibre reinforced concrete in the construction
industry is wide, which includes industrial development, light commercial structures,
residential, precast, shotcrete and transportation field.
2.7 Historical Development in Fibre Reinforced Concrete
The concept of using fibres in a brittle matrix was first recorded with the ancient
Egyptians who used hair from animals and straw from grass as reinforcement for mud
bricks and walls in housing. This dates back to 1500 B.C. Balaguru and Shah, (1992). At
the same time period, straws were used to reinforce sun-baked bricks for a 57 m high hill of
‘Aqar Quf’, which is located near Baghdad. It is not until the 1900’s that asbestos fibres
were developed, manufactured and widely used to augment mechanical properties of
cement matrix as described by Bentur and Mindess (1990).
Balaguru and Shah (1992) reported that the modern developments of using only straight
steel fibres began in the early 1960’s. But now, wide ranges of other types of fibres are
used in cement matrices. Construction industries in many countries have led the
development of conventional fibres such as steel, stainless steel and glass; where new types
of fibres such as kevlar and carbon; and several low modulus fibres, such as man made
fibres (polypropylene, nylon) or natural fibres (jute, sisal, bamboo and wood pulp) are also
coming up, they are varies in their properties, cost and effectiveness Table 2.1. They may
be produce as bundled of filaments or fibrillated films, or may be used as mats or woven
Page 32
32
fabrics Bentur et. al, (1990). Primarily, the fibres used in modern industries are
discontinuous fibres. Development of concrete with modified polymer fibres systems
increases the explicit effects and mechanical properties of concrete.
In the early stage of fibre development, steel and glass fibres with geometry of
straight and smooth were used, as these fibres improve the ductility, flexural strength and
fracture toughness of concrete matrix. The primary factors that controlled this composition
were fibre volume fraction and length/diameter (aspect ratio). However, the problems faced
were difficulty in mixing and workability. Balaguru and Shah (1992) reported that fibres
that are long and at higher volume fractions were found to ball up during the mixing
process. The process called ‘balling’ occurs, causes the concrete to become stiff and there is
a reduction in workability with increase in volume dosage of fibres. This has a tendency to
influence the quality of concrete and strength. For more than 40 years now, discovery and
acceptance of reinforcement and fibres for enhancement of concrete properties has rapidly
increased for use in concrete industries, research and development. Numerous types of
fibres have successfully been adapted in different applications of concrete. Technological
advancement has bought forward the development of fibres with different geometric shapes
and properties to expand the benefits of fibres in concrete structures. New manufacturing
techniques and applications on fibres for concrete have been developed. These introduced
various aspects of fibre reinforced concrete and introduced them into the market
worldwide.
All these fibres with more complicated geometric, shape and sizes have developed,
mainly to modify each of their mechanical bonding with cement matrix. When fibre is
Page 33
33
added to a concrete mix, each and every individual fibre receives a coating of cement paste.
Modification of fibre geometry includes hooked end fibres, deformed fibres, deformed
wires, fibre mesh, wave cut fibres, large end fibres. This increases bonding without
increasing the length and minimize chemical interaction between fibres and the cement
matrices. This also modifies and enhances the mechanical properties and behaviour of
concrete in its applications.
Fibres can be use with admixtures such as superplasticizer, air entraining agents, set
retarding, set-accelerating admixtures and all types of cement and concrete mixture, these
produce special types of concrete with desired characteristics in fresh and hardened
concrete, Newman, (1965). They increase workability, accelerate and retard rate of
hydration of cements, and resistance to freeze and thaw conditions. They provided a
significant improvement to the fibre-reinforced concrete used in the fields.
2.8 Previous Investigation in to Fibre Reinforcement
It has been known that fibre-reinforced concrete had been used in the early
years of structural building. Between the years from 1960 to 2000, many researches
have been carried out and quite a number of investigations have been performed on
fibre-reinforced concrete. The use of randomly distributed fibre reinforcement can
be considered to be a lucrative method of providing higher structural strengths to
concrete structures, pavements and etc. However, stresses caused by shrinkage to
concrete itself historically has been a problem to control because of their
unpredictable and irregular occurrence.
2.8.1 Fibre Effects and Parameters on Behaviour of Fibre Reinforced Concrete
Page 34
34
Fibre reinforced concrete was successfully used in a variety of engineering
applications, because of its satisfactory and outstanding performance in the industry and
construction field. However, most engineers and researchers do not fully understand how
and why the fibres perform so successfully. So, to recognize the usage of fibres in concrete,
in these last four decades, most of the researches were done on mechanical behaviour of
fibre reinforced concrete and the fibres itself.
The fibre reinforced concrete in many applications is subject primarily to bending
rather than axial loading, as this indicates the performance in flexure. Johnson (1982) and
Troxell el al (1968) conducted tests by determining the factors influencing the flexural
strength measurement of fibre reinforced concrete. They proposed that such parameters that
affect the performance of the flexural strength were the loading mode in flexure,
specimen’s size, shape and span, fibre length, dimension of fibres and fibre volume
fraction.
After 10 years, Johnson and SkarendahI (1992) and Stang (1992) conducted similar
tests by examining beams (150 x 100 x 750 mm) under a three point loading with different
types of steel fibres in amounts from 30 to 100 kg/m3. They concluded that the first-crack
strength primarily depends on the matrix characteristic, while secondary crack depends on
fibre parameters such as type, size and amount. At the post cracking state, the toughness of
concrete depends on the fibre type, amount and fibre aspect ratio. However, Tat et al (1998)
reported that the higher fibre concentration and longer fibres lead to better performance
while bond stress between the matrix and fibres is a major influence to the flexural strength
of fibre reinforced concrete.
Banthia and Dubey (2000) used residual strength test method (RSTM) to measure
the flexural toughness of fibre-reinforced concrete in terms of its post peak residual
Page 35
35
strength, which was investigated. This method has the ability to identify the influence of
different fibre characteristics such as type, length configuration, volume fraction, geometry,
and the modulus of elasticity. The results were based on two sets of testing. Test of set I
clearly stated that fibrillated polypropylene fibres provided a better toughness than
monofilament polypropylene fibres. Test of set 2 noted that hooked-end steel fibres had a
better toughening strength than crimped steel fibres in fibre-reinforced concrete.
Some investigations were based on the effect of fibre content and damaging load on
fibre reinforced concrete stiffness. Patton and Whittaker (1983) investigated steel fibre
content for dependence of modulus of elasticity and correlation changes on damage due to
load. They found out that there was approximately 3.3 percent increase over the modulus of
elasticity of plain concrete for every 1.0% increase in fibre content by volume.
Furthermore, the investigation showed that degeneration of stiffness started at
approximately 30 percent of the ultimate load before the first visible crack appeared.
Rossi et al (1987) and Wafa and Nick (2004), analysed the effects of steel fibres on
cracking at both local level (behaviour of steel fibres) and global level (behaviour of the
fibre/cement composite) and showed that they were dependant on each other. The results of
this analysis showed that 1.0% volume content of steel fibres could replace approximately
0.15% of flexural steel reinforcement. With the same fibre material, there was difference in
behaviour of fibre reinforced concrete if the geometry of the fibres were different.
Barros and Figueiras (1999) used two types of steel fibres in fibre reinforced
concrete for their research. These two fibres had similar tensile strength; however, their
aspect ratio was different. Two tests were conducted: uniaxial compression tests and three-
point loading flexural tests. They noted that increase in fibre percentage will significantly
improve the load carrying capacity and decreased the crack opening and crack spacing.
Page 36
36
Furthermore, the higher fibre aspect ratio of steel fibres exhibited an ultimate load twice the
ultimate load of the other steel fibres.
There are relation between the flexural strength with the compressive strength and
tensile strength of the concrete. Dwarakanath and Nagaraj (1991) predicted flexural
strength of steel fibre concrete by these parameters such as direct tensile strength, split
cylinder strength and cube compressive strength. The experimental test results and the
determination of direct tensile strength for the composite from the results was reflected by
the combined effects of fibre volume and ratio of length and diameter parameters in steel
fibre reinforced concrete.
Investigation showed that the toughness of fibre reinforced concrete increase rapidly
than plain concrete. Trottier et al (1994) investigated the toughness of fibre reinforced
concrete by using different geometry of steel fibres, which included hooked end, crimped
circular, crimped crescent and twin cone end steel fibres. One fibre volume fraction
(40kg/m3) was used throughout the research. The test included compressive strength test
and flexural strength test, with measurement of deformation of specimen as the load is
applied. They found out that fibres brought significant improvement in the toughness and
energy absorption capacity of concrete. Based on four fibre geometries, fibres with
deformations only at end appeared more effective than those with deformations over the
entire length.
Within the same period Chen et al (1994) conducted similar test (toughness
concept) to Trottier et al (1994), by determining the first crack and flexural toughness of
steel fibre reinforced concrete using steel fibres with different dimensions. The research
used hooked end steel fibre with 30 mm long and 0.5 mm in diameter. The investigation
showed that all toughness parameter were affected by the width of the beam, even the depth
Page 37
37
and span were unchanged. Furthermore, the specimen size not only influenced toughness,
but also affects stress and deflection at first crack and ultimate flexural strength.
2.8.2 Different types of Fibres in Fibre Reinforced Concrete
There has been discussion on some usage of the different geometries of fibres in
concrete, but the researches in this section have been based on the behaviour and
mechanical properties of other types of fibres (material) that are used in concrete. Nanni et.
al (1992) conducted an investigation on the use of newly developed aramid fibres for the
reinforcement of Portland cement based concrete. The aramid fibres were produced in
chopping a bundle made of epoxy-impregnated braided into aramid filaments. In this
investigation, the behaviour of reinforced concrete of aramid fibres was compared to steel
fibres and polypropylene fibres. Beams of 100 x 100 x 350 mm were tested under four
point flexural loading. It was found that aramid fibres acted similar to steel fibres and is
superior to polypropylene fibres. They concluded that aramid fibres were lacking in
corrosion problems while having a higher performance than polypropylene fibres.
However, the use of aramid fibres was not very economical.
Wang et. al (2000) applied recycled fibres as reinforcement in concrete. The
recycled fibres included tire cords/wires, carpet fibres, feather fibres, wood fibres from
paper waste and high-density polyethylene. The research conducted was based on
shrinkage, durability and toughness characteristics test. The results of each test showed that
recycled fibres can effectively improve the toughness shrinkage and durability
characteristics of concrete. Wang et. al (2000) recommended and encouraged the use of low
cost fibre for reinforcement which could lead to improved infrastructure with better
Page 38
38
durability and reliability, as these applications will reduced solid waste from industrials
and the environment.
Perry (2003) used large and small synthetic fibres to reinforced external pavements.
He reported that the abrasion of pavement surface when in use, do exposed the steel fibres,
creating health and safety hazards. Two tests were done. First test method conducted in a
smaller area of external concrete pavement and compares the evaluation of steel fibre
(hooked end, 60mm long) at a dosage of 30kg/m3 and synthetic fibres (50mm long) at a
dosage of 6.9 kg/m3. Flexural strength and flexural toughness test were conducted as
second test under three-point loading. The results of flexural test demonstrated that the steel
fibre reinforced concrete has an equivalent flexural strength ratio of 53%, while synthetic
fibre reinforced concrete was recorded as 78%. On the external concrete pavement, steel
fibre has an equivalent flexural strength ratio of 20% and synthetic fibre was 41%. Perry
(2003) concluded that synthetic fibre could provide concrete with the same level and even
more of post-crack performance than steel fibres.
2.8.3 Usage of Fibres with Conventional Steel Reinforcement
The use of fibres also can be applied with the conventional steel reinforcement.
Swamy and Sa’ad (1981) had done an investigation on deformation and ultimate strength of
flexural in the reinforced concrete beams under four point loading with the usage of steel
fibres, which consists of 15 beams (dimensions of 130 x 203 x 2500 mm) with same steel
reinforcement (2Y-10 top bar and 2Y- 12 bottom bar) and variables of fibres volume
fraction (0%, 0.5% and 1.0%). They concluded that fibres were effective in resisting
deformation at all stage of loading from first crack to failure and also very effective in
increasing the flexural stiffness at the failure stage of the beams. Furthermore, this
Page 39
39
investigation showed that steel fibres prevented any advancing cracks and increased the
ductility and post-cracking stiffness of the beam right till to failure.
Similar crack behaviour investigations, which were based on combination of 5 full
scales reinforced concrete beams (350 x 200 x 3600 mm) with steel fibres (volume fraction
of 0.38% and 0.56%) were done by Vandewalle (2000). In this investigation, the
experimental results and theoretical predictions on the crack widths were compared.
Vandewalle (2000) also concluded that the addition of steel fibres decreases the crack
spacing and crack width. However, he reported that prediction of crack widths stated in
Eurocode 2 on the combination of fibres with conventional steel reinforcement
overestimated measured values. Thus, he established a simple empirical expression on the
final crack spacing of steel fibre reinforced member.
Sener et. al (2002) calibrated the size effect of the 18 concrete beams under four-
point loading. The beams thickness were uniform at 40 mm and length of 800 mm, but the
height of the beams were varied at 40 mm, 80 mm and 160 mm. The results show that as
height of the beam increased, the ultimate flexural strength increased. Also, the bending
failure in fibre reinforced concrete exhibits a greater size effect and higher brittleness than
concrete containing no fibres.
Most of the investigation of steel fibre reinforced concrete was based on flexural
strength and crack width. In Singapore, Tan et, al (1993) conducted some investigation on
the shear behaviour of steel fibre reinforced concrete. Six simply supported I-beams were
tested under two-point loading with hooked steel fibres of 30mm long and 0.5mm diameter,
as the fibre volume fraction increased every 0.25% from 0% to 1.0%. This investigation
confirmed that the shear strength increased as much as 70 percent by adding small
quantities of steel fibres (1.0%) into ordinary reinforced concrete.
Page 40
40
2.8.4 Other Applications and Test Methods on Fibre Reinforced Concrete
Most of the investigations on fibre reinforced concrete have been base on the basic
mechanical properties and behaviour. However, the investigations and researches of fibre
reinforced concrete can be extented further to other types of structures and applications.
Sanjuan et. al (1998) investigated the effect of polypropylene fibre reinforced mortars on
steel reinforcement corrosion induced by carbonation. In this investigation, crack control by
fibres in plastic state mortars and crack evolution with time was studied. Furthermore, the
influence of crack width on steel bar corrosion induced by carbonation was also monitored.
The objective of the investigation is to assess the effectiveness of polypropylene fibre as
secondary reinforcement to delay the initiation of reinforcement corrosion induced by
carbonation. The fresh polypropylene fibre reinforced mortar was cast into a cylindrical
ring and a solid cube of 70 mm (containing 5 steel reinforcement bars) located inside the
mortar. They found that polypropylene fibres were able to control crack width in
inadequately cured mortars and the addition of fibres reduced the corrosion rate on the steel
reinforcement. However, there is no relationship between the corrosion rate and crack
width.
Gupta et. al (2000) conducted impact test on fibre reinforced wet mix. It is known
that shotcrete is often subjected to impact and dynamic load. Ten different commercially
available shotcrete fibres were investigated in wet-mix shotcrete. The ten fibres included:
four deformed steel fibres, two straight polypropylene fibres, one crimped polypropylene
fibre, the straight carbon microfibres and one deformed polyvinyl alcohol (PVA) fibre. The
mixes were shot onto wooden forms (600 x 500 x 100 mm) with fibre volume fraction of
10 to 60 kg/m3. The result showed that fibre reinforcement in wet-mix shotcrete improved
the energy absorption and toughness under impact loading. However, the improvement did
Page 41
41
not happen under static conditions. Furthermore, Gupta et. al (2000) concluded that wet-
mix shotcrete is highly sensitive to the rate at which load is applied.
Luo et. al (2001) conducted test on the mechanical properties and resistance against
impact on steel fibre reinforced high-performance concrete. Five different geometry of
fibres were included; steel-sheet-cut fibres and steel-ingot-milled fibres with four fibre
volume fractions (4%, 6%, 8% and 10%) were applied into the mix. Beams (100 x 100 x
400 mm) and cubes (100 x 100 mm) were cast. The investigation showed that increase in
fibre percentage improved the mechanical properties, and the peak compressive strength
and flexural strength reached 140 N/mm2 and 80 N/mm2, respectively. This showed an
increase of 61% and 774% compared to specimens containing no fibres. The impact test,
showed that the specimens containing no fibres were smashed up and steel fibre reinforced
high-performance concrete were kept intact with some radial cracks developed in front
faces and minor cracks in side faces.
Fatigue is an important consideration with regard to the durability of thin concrete
repairs. Repeated loading and restrained shrinkage can cause damages and debonding of
repair layer. Mailhot et. al (2001) and Kesse and Lees (2007), all studied the flexural
fatigue behaviour of steel fibre reinforced concrete by conducting series of flexural fatigue
test (under three point-loading) with volume dosage of 40 kg/m3. Three different types of
steel fibres (hooked, nail-anchored and crimped) and two-water/cement ratios (0.35 and
0.45) were applied into the mix design. Six slabs (125 x 425 x 500 mm) were made with
each batch. The tests were carried out at three different repeated stress levels: 85, 75 and
70% of the first crack strength. The survival life under repeated loadings was defined as the
difference between the number of cycles at failure and number of cycles at onset of the first
crack. The investigations found that the specimen with fibres exceeded 80% of the overall
Page 42
42
life cycle, while survival life of specimen containing no fibre were extremely short, and the
parameters affecting this were water/cement ratio and type of fibres used.
In the last two decades, steel fibres have replaced the conventional reinforcement in
industrial ground floors Chen (2004), Vandewalle (2000) and Wafa and Nick (2004),
although, in Nigeria, wire meshes are used. Research and practice have shown that steel
fibre reinforcement is more efficient and economical for industrial floors. Experimental
comparative done on ground slabs by Chen (2004), investigated the strength of 15 steel
fibre reinforced and plain concrete ground slabs. The slabs were 2 x 2 x 0.12 m, reinforced
with hooked end steel fibres and mill cut steel fibres. All slabs were centrally loaded using
hydraulic and electric pump through 100 x 100 mm steel plate. He concluded that the load
bearing capacity of concrete could be effectively increased when the slabs are reinforced
with steel fibres. In addition, he also indicated that the energy absorption capacity of steel
fibre reinforced concrete specimens can be used in assessing the effect on the load carrying
capacity of steel fibre reinforced concrete ground slabs.
2.8.5 Guides and Practice of Fibre Reinforced Concrete
As discuss above, the fibre reinforced concrete have been so successfully used in
the construction industries, in developed countries. However, there is no standards for the
practices and a few engineers generally accepted the practice of fibre reinforced concrete
and in developing countries it is still a new idea. Thus, this obstructs the understanding of
the fibres and probably tends to discourage potential users from specifying on fibres. To
overcome this problem, guide, good practice and awareness must be provided and applied
to fibre reinforced concrete.
Page 43
43
A report prepared by ACI Committee 544 (1993), gave guidance on specifying,
mixing, placing and finishing of fibre reinforced concrete. The guide emphasized the
difference between conventional concrete and fibre reinforced concrete and methods to deal
with them. The report warned that calcium chloride should not be added with fibre
reinforced concrete, but recommended the usage of water reducing and air-entraining
admixtures with fibres. Furthermore, ACI Committee 544 (1993) suggested that fibres must
be stored properly in other to prevent deterioration. The fibres have a tendency to protrude
sharp corners, as this can be hazardous to personnel. The guide suggested the sharp corners
should be chamfered.
The guide by ACI Committee (1984) suggested methods of adding the fibres into
the fresh concrete mix as these methods provide good dispersion of fibres and prevent
clumping (balling). The first method is that fibre can be added last into the fresh concrete
mix, while second method is that fibres were mix with the aggregates before the addition of
water into the mixer. All fibres must be clumping free (as rain of individual fibres) during
the addition of fibres into the mixer. Furthermore, the guide stated that balling may occurs
if the fibre volume fraction is more than 2% or even 1% with high aspect ratio and the other
reason was the clumping of fibres before and during adding the fibres. On placing
consideration, the fibre tends to be stiff and not workable. The recommendation is that
vibration must be done to improve the placability. Again, the guide specified water/cement
ratio must be in the range of 0.40 to 0.65.
Furthermore, the guide by ACI Committee (1993) specified the transporting and
placing of fibre reinforced concrete with conventional equipment must be properly
designed, maintained and clean. If pumping were used on transporting fibre reinforced
concrete, some important point were suggested by the guide, 1) the pump must be capable
Page 44
44
of handling the volume and pressure required, 2) the diameter of pump hose must be at
least 150 mm wide and 3) avoid flexible hose if possible. However, the guide did not
suggest any special attention on the finishing, but it indicated that overwork on the surface
could result in bringing excessive fines and bleeding. The guide also indicated that curing
of fibre reinforced concrete is same as conventional concrete.
Dunstan et. al (1986) recommended that the key to good practice dealing with fibre
reinforced concrete and fibres are emphasis on the manufacture, design and constructional
guides, as all materials used for engineering or building purpose, quality and design are
interdependent. Failure in performing adequately in practice will results customer
dissatisfaction, inadequately quality control and potential of defect appear on structure.
2.9 Shape, Geometry and Distribution of the Fibres in Concrete Matrix
The influences of fibres on fibre reinforced concrete are the shape, geometry and
mechanical properties of fibres and the dispersion of fibres in the cementitious matrix. The
knowledge of the fibre properties is important for design purpose. James (1990) stated that
the high ratios of fibre modulus of elasticity have direct influences to the matrix modulus of
elasticity where this facilitates the stress transfer from the matrix to the fibre. Fibre with a
higher tensile strength is essential for the reinforcing action. Furthermore, fibres that have
large values of failure strain will tend to have high extended or prolongation in the
composites. The most common types of fibres are steel fibres and polymers fibres, due to
low cost and their availability. However, other types of fibres may be used in the concrete
composites depending on the needs. The properties and types of fibres are shown in Table
1. Properties of cement matrix are also included in the table.
Page 45
45
James (1990) stated that having a lower Poisson’s ratio prevented such problems on fibre-
matrix interface associated with the fibre debonding. Furthermore, Riley and Reddaway
(1968) stated that most fibres have surface flaws, due to handling, processing and
manufacturing, as these surface defects can affect the strength properties of the composite.
Such presence of flaws was varies by fibre length and diameter, which acts to strength
reduction of fibre reinforced concrete. Additionally, the tensile strength of the fibres
decreases when the fibre length increases James, (1990).
Each type of fibre can be categorized into two groups:
• Discrete monofilaments, which fibres are separated one from another (e.g. steel)
• Bundles of filaments, which all the fibres assemblies together, as each with a diameter of
10µm or less. Majority of man made fibres, such as inorganic fibres (e.g. glass), organic
fibres (e.g. carbon, kevlar) and natural fibres (e.g. asbestos) all belong to this categories.
The monofilaments fibres due to their uniform improvement were commonly used in
structural concrete to enhance the fibre-matrix interaction through mechanical anchoring
Bundled fibres usually do not break up into separate filaments, as they maintain their
bundled nature in the cement matrix.
The reinforcing arrays of fibres are in two different ways: Continuous reinforcement
and Discrete short fibres. The continuous reinforcements are usually in the form of long
fibres, which are incorporated into the matrix in the methods of filament winding or layers
of fibre mats. However, discrete short fibres with a length approximately 50mm or less are
incorporated into the matrix by the methods of spraying and mixing. The reinforcing arrays
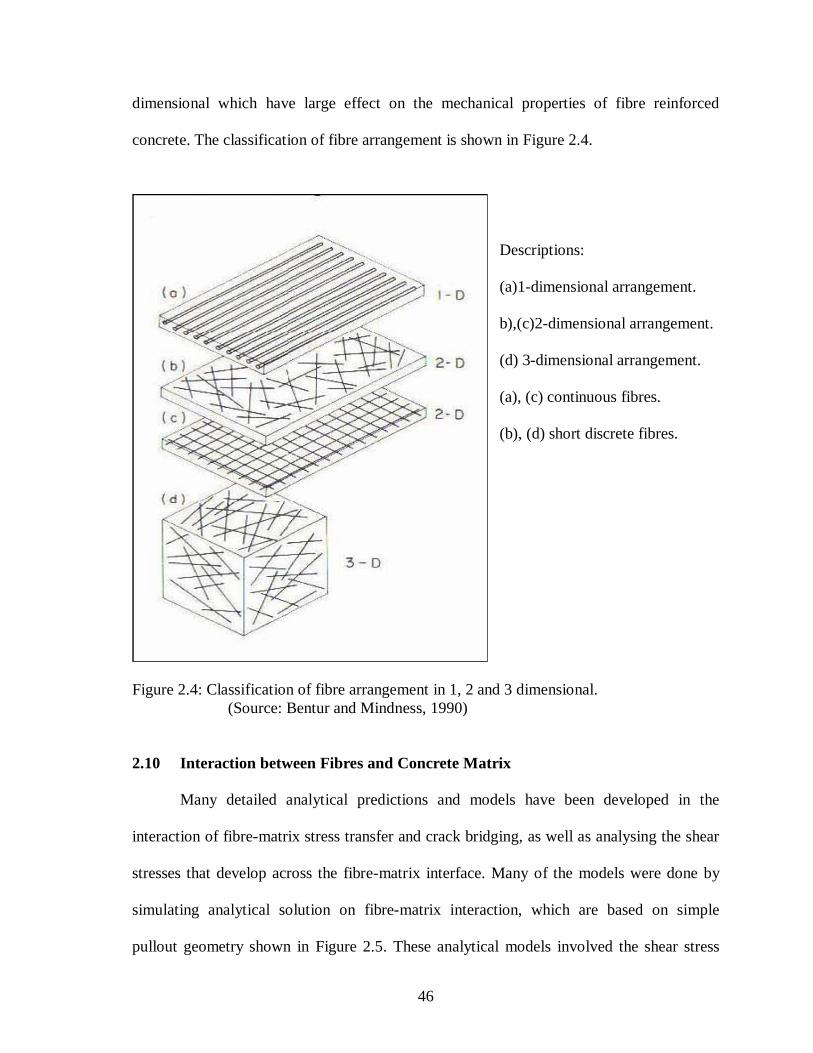
are classified accounting to the distribution of fibres in the matrix as 1-, 2- or 3-
Page 46
46
dimensional which have large effect on the mechanical properties of fibre reinforced
concrete. The classification of fibre arrangement is shown in Figure 2.4.
Descriptions:
(a)1-dimensional arrangement.
b),(c)2-dimensional arrangement.
(d) 3-dimensional arrangement.
(a), (c) continuous fibres.
(b), (d) short discrete fibres.
Figure 2.4: Classification of fibre arrangement in 1, 2 and 3 dimensional.
(Source: Bentur and Mindness, 1990)
2.10 Interaction between Fibres and Concrete Matrix
Many detailed analytical predictions and models have been developed in the
interaction of fibre-matrix stress transfer and crack bridging, as well as analysing the shear
stresses that develop across the fibre-matrix interface. Many of the models were done by
simulating analytical solution on fibre-matrix interaction, which are based on simple
pullout geometry shown in Figure 2.5. These analytical models involved the shear stress
Page 47
47
and frictional stress which were developed between the fibre and cement matrix, offering
predictions on the efficiency of short, randomly oriented fibres in the concrete matrix. The
effectiveness of fibres in the mechanical properties of the fibre reinforced concrete is
influenced in two ways:
• Processes where load is transferred from the cement matrix to the fibres, and
• The bridging effect of the fibres in the concrete when the concrete cracks.
Figure 2.5: Pullout geometry to simulate the interaction between fibres and cement matrix. (Source: Bentur and Mindness, 1990)
The stress transfer effects must be considered in both pre-cracking case and post cracking
case for the brittle fibre reinforced concrete, as the processes of stress transfer are different
in these two cases. Such understanding of mechanisms for the stress transfer permits the
prediction of stress/strain curve on the fibre reinforced composite, the mode of fracture and
Page 48
48
a basis for developing performance on the composite with the modification of the
interaction of fibre-cement matrix.
In uncracked state of the fibre-cement matrix, the major mechanism is that the load
is transferred from the matrix to the fibre in the elastic stress stage. This means that the
strain (longitudinal displacement) of the fibre and the matrix at the interface are almost the
same. The stress that developed at the interface, which need to distribute the external load
between the fibres and the matrix is shear stress. This is required in order for these two
strains to remain same, where the elastic moduli of these two components are different. The
elastic shear transfer was used in the prediction of limit of proportionality, modulus of
elasticity, elastic stress/strain behaviour and determination of the first crack stress of the
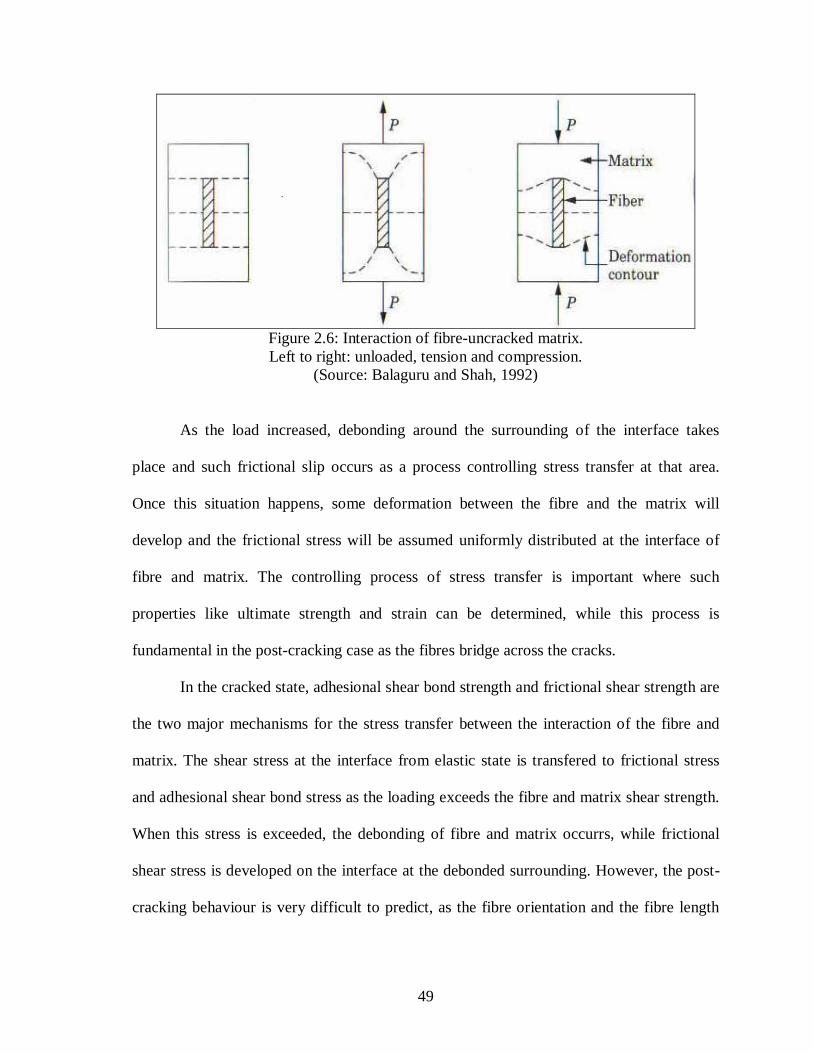
fibre-matrix composite. However, the elastic shear stress distribution and deformation
along the interaction of fibre and matrix was not consistent (Figure 2.6).
A simple fibre-matrix system containing one single fibre is shown in Figure 2.6.
Under unloaded stage, stresses in the fibre and the matrix were assumed to zero. The stress
and deformation of the fibre and matrix was remaining same. When a load was applied,
either by tension or compression, some of the load was transferred to the fibre along its
surface. This means that the stiffness of the fibre and the matrix are different as shear stress
develops on the surface of the fibre. The deformation and interaction of fibre-matrix when
tension and compression are exerted, is also shown in Figure 2.6.
Page 49
49
Figure 2.6: Interaction of fibre-uncracked matrix. Left to right: unloaded, tension and compression.
(Source: Balaguru and Shah, 1992)
As the load increased, debonding around the surrounding of the interface takes
place and such frictional slip occurs as a process controlling stress transfer at that area.
Once this situation happens, some deformation between the fibre and the matrix will
develop and the frictional stress will be assumed uniformly distributed at the interface of
fibre and matrix. The controlling process of stress transfer is important where such
properties like ultimate strength and strain can be determined, while this process is
fundamental in the post-cracking case as the fibres bridge across the cracks.
In the cracked state, adhesional shear bond strength and frictional shear strength are
the two major mechanisms for the stress transfer between the interaction of the fibre and
matrix. The shear stress at the interface from elastic state is transfered to frictional stress
and adhesional shear bond stress as the loading exceeds the fibre and matrix shear strength.
When this stress is exceeded, the debonding of fibre and matrix occurrs, while frictional
shear stress is developed on the interface at the debonded surrounding. However, the post-
cracking behaviour is very difficult to predict, as the fibre orientation and the fibre length
Page 50
50
efficiency start to participate in the behaviour of the concrete. A further description of the
stress transfer between the fibre and matrix composite is shown in Figure 2.7.
Once the matrix containing the fibres cracks at a certain stage when it is loaded with
tension force, the load is carried on to the fibres across the cracks and spread from one side
of the matrix to the other. This interaction of fibre-matrix on cracked condition based on
tension is shown in Figure 2.7.
Figure 2.7: Interaction of fibre-cracked matrix.
(Source: Balaguru and Shah, 1992)
2.11 Critical Fibre Volume Dosage
The load bearing capacity of a fibre reinforced concrete depends on the volume
dosage rate applied into the concrete matrix. In fibre cement composite, the failure strain of
fibre is normally greater than the failure strain of the concrete. To prevent the failure of
fibre, the load bearing capacity of the fibre must be greater than the load applied on the
concrete when the first crack appears. This assumes that the concrete does not contribute
any further strength beyond the point of first crack, as the load is fully transferred to the
fibre. Furthermore, the fibres are able to carry more load, resulting in the ultimate strength
of the fibre cement composite been higher than the matrix strength itself. An equation for
Page 51
51
minimum fibre volume dosage rate, Vcr, has been developed which is to equal the load
bearing capacity of the fibre/cement composite and the fibre load bearing capacity.
The minimum or critical fibre volume dosage rate, Vcr, that needs to be added into
concrete for its loading bearing capacity or to sustain the load after the concrete occurs is
given as (James, 1990):
)( ,fufumu
mucrV
……………………………………………… 2.1
where Vcr, = critical/minimum fibre volume dosage
σmu = ultimate tensile strength of the concrete
σfu = ultimate tensile strength of the fibre
σ’fu = stress on the fibres when concrete fails at its first crack
BS8110 (1997) stated that the strain of the concrete (ultimate concrete strain) at the
point of first crack is 0.003. If the strain on the concrete and the fibre is assumed to be
same.
The stress in the fibre at the point of first crack can be taken as the product of the ultimate
strain of the concrete and the modulus of elasticity of fibre. The above equation 2.1 can be
rearranged as:
)( custfumu
mucr E
V
…………………………………………… 2.2
where Est = modulus of elasticity of the steel
εcu = ultimate strain of concrete = 0.003
Page 52
52
Equation 2.3 below taken from BS8100 was used to predict the ultimate tensile
strength of the concrete, as the tensile strength of the concrete was required to obtain the
minimum fibre volume dosage rate.
5.0' )(4.0 cctmu fxf ...................................................................... 2.3
where f’c = characteristic compressive strength of concrete
f’ct = characteristic tensile strength of concrete
James (1990) stated that the minimum fibre volume dosage rate for steel, glass and
polypropylene fibres in concrete matrix is calculated to approximately 0.31%, 0.40% and
0.75% respectively. For chopped and randomly oriented fibre composites, the minimum
fibre volume dosage rate is higher than the value stated as the efficiency factor such as fibre
length and orientation effects can influence the volume dosage rate. The load of the
concrete at the point of first crack is enough to distribute on to the fibres when the
minimum fibre volume dosage rate has been reached. It is important that equation 2 gives
an indication of the volume of fibres required to be added into the concrete, where it will
increase the ductility and strength of concrete.
2.12 Efficiency of Fibre Reinforcement
The fibre reinforced concrete consists of distribution of short fibres in the cement
matrix. The contribution of short, inclined fibres on the mechanical properties of fibre
reinforced concrete is usually less than long fibres placed parallel to the load. This means
that the efficiency of the short and inclined fibres is less. However, the efficiency of the
fibres in the cement matrix to enhance the mechanical properties of concrete can be judged
in two ways:
Page 53
53
i) The property enhancement in the strength of the concrete, and
ii) The property enhancement in the toughness of the concrete.
These effects on the properties of concrete are depending on the fibre length, the orientation
of fibres distributed in the concrete and the shear bond strength of the fibre/cement
composite. All of these three factors are not independent as the effects on the fibre length
and orientation are largely extended to the bond between the fibre and cement matrix.
In most of the engineering applications, the fibre efficiencies are expressed in terms
of efficiency factor, which values are from 0 to 1, Bentur et. al, (1990). The efficiency
factor was used to express the load applied on the ratio between the reinforcing effect on
the short inclined fibres and the continuous fibres aligned parallel. Determination of
efficiency can be obtained by empirical or analytical calculations on the factors for length
efficiency ηl, and orientation efficiency η ,.
2.12.1 Length Efficiency
The effects of length of the fibre can be analysed by the mechanisms of stress
transfer on the performance of the concrete, which has been explained in Section 2.5. The
critical length parameter, lc, can be defined as the minimum fibre length which is needed to
build up stress or load in the fibre from the frictional and shear stress transfer to it; which is
equal to its failure strength (load). The definition of the critical length of fibre is shown in
Figure 2.8 Bentur et. al, (1990). In Figure 2.8, curve 1 represents frictional stress transfer
mechanism and curve 2 represents an elastic stress transfer mechanism. For curve 1, the
fibre length is less than the critical length, where there is not sufficient embedded length to
produce a stress equal to the fibre strength. If the length of the fibre exceeds lc, the stress on
most of the fibres will reach its yield strength, as this is shown on the curve 2. The critical
length of a fibre can be calculated as James, (1990,):
Page 54
54
........2fdflc ………………………………………………………… 2. 4
where df = fibre diameter
σf = ultimate strength of the fibre
τ = interfacial bond strength
Although the interfacial bond strength depends on the strength of the concrete and the
bonding type of the fibre, but Balaguru and Mindness (1992) stated that it can be taken
approximately as 1N/mm2.
Figure 2.8: Definition of critical length: (a) Frictional stress distribution on fibres. (b) Intersection of fibre breaking load Pu, with pullout load versus embedded length.
(Source: Bentur and Mindness, 1990)
The stress in the fibre is not constant along the entire length for discontinuous
fibres. However, the stress developed linearly at the end of the fibre with a distance half of
the fibre length, which is shown on Figure 2.8. But in most of the fibre reinforced concrete,
the fibres are not placed and aligned parallel to the direction of applied stress. This shows
Page 55
55
that the fibres are not fully effective in the strengthening for fibre reinforced concrete.
Furthermore, fibre placed perpendicular to the applied stress tends to have less or even no
effect in the increasing strength of fibre reinforced concrete.
Equation 2.4 is the accurate method to describe the required length for the fibre to
transfer load, but there are other indications of efficiency factor on the load applied to the
fibre, which is the length to diameter ratio or fibre aspect ratio of the fibre. The length to
diameter ratio is a simplified way to estimate the effectiveness of fibre to transfer the load.
As the diameter of the fibre is larger, more loads can be transferred on to the fibres. Similar
to length to diameter ratio, the fibre aspect ratio shows that the more surface of the fibre is
in contact with the concrete matrix, the greater the load can be transferred to the fibre.
The length efficiency factors are used for the prediction of the properties of fibre
reinforced concrete in pre-cracking and post-cracking state. The length efficiency factors,
which take account of the critical fibre length on both pre-crack and post crack state, are
shown by the following equation (Bentur et. al, 1990):
Pre-cracking state:
fu
muc
ll
2
11 …………………………………………….2.5
Post-cracking state:
llc 11 for l>> 2lc ……….2.6
for l<< 2lc ………2.7
where η1 = length efficiency factor,
llc
41
1
Page 56
56
lc = critical fibre length (obtained from Equation 2.4),
εmu = strain of the fibre (the point of first crack),
l = embedded length of fibre in the cement matrix,
εfu = ultimate strain of the fibre.
2.12.2 Fibre Orientation
If all fibres were placed parallel to the direction of applied stress, the orientation
efficiency is unity James, (1990) and Murdock et al (1968). However, fibres in the concrete
matrix is randomly distributed, where the orientation of the fibre is unpredictable within the
concrete with either in one, two or three-dimensional arrays. In such distributions, some of
the fibres are placed at an angle (θ) to the load orientation or applied stress, this is shown
on Figure 2.9. It shows that fibre at an angle can carried less load to those fibre placed
parallel to the load direction by using vector analysis in the components of x, y and z.
Furthermore, fibres at an inclined angle to the load direction carry more bending stress
during the bridging a crack and decreases the fibre efficiency in carrying load applied to the
concrete.
Page 57
57
Figure 2.9: The intersection of an oriented fibre across a crack with an angle (θ).
(Source: Bentur and Mindness, 1990)
The orientation efficiency of the fibre in the concrete matrix is classified into two
approaches. The first approach assumed that the fibre-reinforced composite is constrained,
and the deformation of fibre is subject only in one direction of applied stress. The second
approach (unconstrained) assumed that the deformation occurs in other directions of
applied stress. Such example of constrained and unconstrained can be show in hardened
property test like flexural strength test, where the concrete beams is subject to deformation
in one direction only, and direct compressive strength test, concrete cylinders were subject
to deformation in different planes. However, the vibration and compaction of the concrete
rearranges the fibres, so most of the fibre reinforced concrete are assumed in randomly two-
Page 58
58
dimensional orientation. The orientation efficiency factor for unconstrained and constrained
with different fibre orientation is shown in Table 2.2.
Table 2.2: Orientation Efficiency Factor for Unconstrained and Constrained Fibre Reinforced Concrete. (Source: Bentur and Mindness, (1990))
�θ, Orientation efficiency factor Fibre Orientation
Unconstrained Constrained
Aligned, 1-D 1 1
Random, 2-D 1/3 3/8
Random, 3-D 1/6 1/5
2.13 Prediction of the Behaviour and Properties of FRC
From Section 2.10, the major roles of fibres occur in the post-cracking state and the
fibres act as bridge across the cracks on fibre reinforced concrete. However, the first crack
on the composite will not lead to shattering failure. Eventually, this will results in the
redistribution of the load between the fibres and the concrete, as discussed previously from
Section 2.11. As additional load is applied on the composite, more cracks are developed
until the composite is separated into few numbers of segments (a to g). The separation of
the composite into segments by cracks is known as ‘multiple cracking’. Figure 2.9 shows
the stress and the strain of failure of the fibre which occured as more of the cracks
developed. The range of initial constant stress (the first crack stress, Ecεmu ) is eventually
known as the modulus of elasticity of the FRC composites (Ec). When the multiple cracks
stopped and faded out, the additional load will cause the pullout of the fibres (z), as shown
in Figure 2.9. At this region, the slope is ‘EfVf’ where the aligned and continuous fibre will
stretch and fail when the fibres reach their maximum load bearing capacity (σfuVf ). The
Page 59
59
final schematic description of the stress/strain curve for the FRC composite is shown in
Figure 2.10.
Figure 2.10: The multiple cracking process and the stages of stress/strain curve related to the multiple cracking processes. (Source: Bentur and Mindness, 1990)
Page 60
60
Figure 2.11: Final schematic description of stress/strain curve. (Source: Bentur and Mindness, 1990)
Consequently from Figure 2.11, the mechanical behaviour of fibre reinforced concrete can
be illustrated by three stages of the tensile stress versus strain curve:
i) Elastic stage.
In this stage, the load is carried by both the fibres and matrix. The stress is
transferred to the fibres when the deformation in the matrix occurs, while the stress will
transfer back to the matrix when the deformation stopped. This stage continued up till the
point of first crack, where the concrete strain arrived at a value is 0.003.
ii) ‘Multiple cracking’ stage.
The concrete strain has exceeded the ultimate strain of its composite, which is
above the stain value of 0.003, as the cracking and energy absorption takes place in this
Page 61
61
stage. When the stress continues to increase between the fibres and matrix, formation of
fine cracks are developed.
iii) Post-multiple cracking stage.
In this stage, the matrix no longer carries the load, and the stress is transferred to
the bridging fibres, as the pullout and stretch occurred in fibres.
Many models and analytical predictions are used to predict the modulus of elasticity, the
first crack stress and strain from the shape of the tensile stress/strain curve. In such models
and predictions, attention was given to the energy involved in the failure fracture of the
fibre reinforced concrete composite, and this attention comprised of composite materials
approach, facture mechanics and multiple cracking.
The ‘rule of mixtures’ based on the composite material approach, was shown by
models of the composite in Figure 2.11. Bentur and Mindness (1990) stated that the ‘rule of
mixtures’ for the properties of the composite are equal to the weight average of the
properties of each individual components. The components such as modulus of elasticity
and strength are valid when these two components are in the elastic stage.
Hence, the ‘rule of mixtures’ can only applied at the pre-cracking stage of the fibre
reinforced concrete composite. However, the prediction of the components by ‘rule of
mixtures’ takes the effect of the fibre length efficiency and fibre orientation efficiency. The
prediction of modulus of elasticity, (Ec) and first crack tensile stress of the composite, (σmu)
were developed by Bentur and Mindness (1990), while the first crack flexural stress, σf was
developed by Namy (2001). Through these predictions, these rules were able to apply into
the concrete design and have a better utilisation and advantages of fibre reinforced
concrete.
Page 62
62
Figure 2.12: The parallel model of ‘rule of mixture’.
(Source: Bentur and Mindness, 1990) Modulus of Elasticity:
Ec = ‘Em Vm’ (matrix) + ‘η1ηθ Ef Vf’ (fibre) …………………………2.8
where Ec = modulus of elasticity of the fibre reinforced composite
Em = modulus of elasticity of the matrix
Vm = volume fraction of the matrix
ηl = fibre length efficiency factor
ηθ = fibre orientation efficiency factor
Ef = modulus of elasticity of fibre
Vf = volume fraction of the fibre
First crack tensile stress:
σmu = ‘σ’mu Vm’ (matrix) + ‘ηl ηθ σ’f Vf’ (fibre) ……………………………2.9
where σmu = first crack tensile strength of the fibre reinforced composite
σ’mu = tensile strength of the matrix at point of first crack
σ’f = tensile strength of the fibre at point of first crack
Page 63
63
First crack flexural stress (modulus of rupture):
σf = ‘0.843 frVm’ (matrix) + ‘425 Vf (l/df)’ (fibre) …………………………..2.10
where σf = first crack flexural strength of the fibre reinforced composite
fr = stress in the matrix (modulus of rupture of the plane concrete)
l/df = fibre aspect ratio (ratio of length to diameter)
Page 64
64
CHAPTER THREE
EXPERIMENTATION
3.2 Preamble
This chapter gives the details of the experiments performed starting with materials
used in the experiments. About two hundred and sixty specimens including mortar cubes,
concrete cubes, mortar beams, concrete cylinders and concrete beams were tested to
determine the properties of steel fibre mortar and concrete.
All the experiments were performed in accordance with the respective Codes and
Standards in the Heavy Structural Laboratory of the Department of Civil Engineering,
Ahmadu Bello University, Samaru, Zaria. The results are as presented below in this
chapter.
3.2 Materials
The materials used in this experiment include the following: sand, coarse
aggregates, cements and fibres. The fibres are of three types namely circular steel fibre
(CSF), rectangular steel fibre (RSF) and chips shaving steel fibre (CHSF).
Page 65
65
3.2.1 Fine Aggregate (Sand)
The sand used in this experiment was clean river sand obtained locally from
Samaru, Zaria. It was subjected to particle size distribution tests in accordance with BS 812
(1985) : Part 103.1, Clause 5b The results are as presented in Table 3.1 below.
Table 3.1: Sieve Analysis Result for Fine Aggregate
B S Size (mm)
Weight Retained (g)
Cummulative Percentage Retained
(%)
Cummulative Weight Passing
(%) 4.75 40 4 96
2.36 150 16 84
1.18 124 32 68
600µm 175 49 51
300µm 387 88 12
150µm 90 97 3
Each value is an average of three test values. See the Appendix 2 for the raw data.
3.3.2 Coarse Aggregate/ Stones
The coarse aggregate is also subjected to particle size distribution test in accordance
with BS 812 (1985). Part 103.1 and the results are presented in Table 3.2.
Page 66
66
Table 3.2: Sieve Analysis Result for Coarse Aggregate
B S Size (mm)
Weight Retained (g)
Cummulative Percentage Retained
(%)
Cummulative Weight Passing
(%) 38.1 30 1 99
25.4 130 6 94
20.0 430 6 94
20.0 430 20 80
14.0 900 50 80
10.0 900 80 20
6.35 400 93 07
5 200 100 0
Each value is an average of three measured values. See Appendix 3, for the raw data.
3.3.3 Cement
Dangote Ordinary Portland Cement was used in this experiment. This cement was
subjected to consistency tests in accordance with BS12 (1996) Part 2. And the results are as
shown in Table 3.3. Raw data can be seen in Appendices 4 and 5.
Page 67
67
Table 3.3: Consistency Test on Dangote (OPC)
Property Value
Normal Consistency (%) 34.5
Initial Setting Time (min) 89.0
Final Setting Time (min) 148.0
Soundness (mm) 2
Specific Gravity 3.14
Cube Compressive Strength (N/mm2)
3 – day
7 – day
28 – day
14.5
24.2
27.5
3.3.4 Water
The water used in this experimental test was obtained from the water tap inside the
Laboratory and it is portable.
3.2.5 Fibres
At the first stage of the experiments, three of the fibres were used. These fibres are
shown in Plate 1, indicating chipping steel fibre, rectangular steel fibre and circular steel
fibre.
Page 68
68
Plate 3.1: The three types of waste fibres used in this work
To be able to study effectively the properties of waste steel fibre reinforced concrete. Three
types of locally available industrial waste fibres from two main sources were used. See
Plate 3.1. They are:
1. Circular Section Steel Fibres (CSF): These fibres are gotten from used cars tires
after burning off the rubber fabric and cutting or chopping the wire into lengths of
fibres. These fibres are smooth straight fibres with an average diameter of 1.1mm,
and a tensile strength of 700-800 N/mm2.
2. Rectangular Section Steel Fibres (RSF): These fibres are gotten from used tires
after burning off the rubber fabric and cutting or chopping the wire into lengths of
fibres like CSF. These fibres are smooth straight fibres with typical cross section
Page 69
69
ranging from 0.85mm to 1mm thickness by 0.85 to 1.14mm width.
3. Steel Shavings (Chips): These are waste steel materials from metal machining,
generally having a rough surface, toothed edges, and twisted sections. These fibres
are obtained by cutting the shavings into proper lengths. It was found that the
shavings could be stronger than the original steel, with a typical tensile strength of
1,200 N/mm2 whereas the tensile strength of steel was 700 N/mm2.The steel
shaving fibers used in this work has the following dimensions: 40-50 mm in length
and 0.8-1.0 mm in equivalent diameter (Plate 3.1).
3.4 Steel Fibre Mortar/Concrete Tests
The tests involved mixing the three types of fibres in mortar and concrete to
determine their effect on the mortar and concrete materials. There are control mixes where
no fibres are added to both mortar and concrete. The mortar mix is one part cement to two
part sand (1:2) and the concrete mix is one part cement to two part sand and four part
coarse aggregate (1:2:4) with percentages by volume of each fibre ranging from 0.5, 1.0,
1.5 to 2.0 See Appendix 1 for sample calculations. Confirmation tests were also carried out
to confirm the literature as well as the obtained results in the case of chip steel fibre.
Page 70
70
3.3.2 Steel Fibre Mortar Cube Tests
The mix ratio is as earlier stated with various percentages of the three fibres as
indicated above.
The test on mortar cubes were performed in accordance with BS 1881 Part 4 (1988)
and the result are presented below in Tables 3.4 to 3.6. In addition to control mortar cubes,
sixteen mortar cubes were produced for each type fibre and cured for 28 days inside water
prior to test.
The compressive strength of concrete can be calculated using the following formula
Neville, (1996) below:
APXcf 1000' ………………………………….……………….3.1
Where: f’’c = Compressive strength of concrete (N/mm2).
P = Maximum load applied to the specimen in kN.
A = Cross sectional area of the specimen (mm2).
The test results are as shown in Tables 3.4 to 3.6:
Page 71
71
Table 3.4: Compressive Strengths Test Results
– CSF (Mortar Cubes)
Fibre Percentage (%) Average Compressive Strength (N/mm2)
0 27.5
0.5 28.2
1.0 29.4
1.5 32.7
2.0 30.0
Each value is an average of four tests, see Appendix 6 for the raw data
Table 3.5: Compressive Strengths Test Results
– RSF (Mortar Cubes)
Fibre Percentage (%) Average Compressive Strength (N/mm2)
0 27.5
0.5 28.4
1.0 29.7
1.5 30.9
2.0 34.2
Each value is an average of four tests, see Appendix 7 for the raw data
Page 72
72
Table 3.6: Compressive Strengths Test Results
– CHSF (Mortar Cubes)
Fibre Percentage (%) Average Compressive Strength(N/mm2)
0 27.5
0.5 28.8
1.0 29.8
1.5 33.2
2.0 33.6
Each value is an average of four tests, see Appendix 8 for the raw data
3.3.2 Steel Fibre Mortar Beam Flexural Tests
Using same ratio as mortar cubes above, a mortar beam of length of 750 millimeters
with a cross-section of 150 x150 millimeters were produced and cured for 28 days in water.
For each type of fibre, twelve number beams were produced apart from the control beams
which are of zero fibre. The curing was under normal laboratory temperature. Considering
the three fibres and the number of percentage, a total of 39 mortar beams including control
were produced. All beam tests were performed in accordance with BS1881 Part 116 (1996).
The results are presented in Tables 3.7 to 3.9 below. The flexural test was three-point load
test and the arrangement is as shown in Plate 3.2.
Page 73
73
Plate 3.2: Test Rig with Beam specimen positioned for test
The attached central dial gauge was used to measures the load and deflection of concrete
beam specimens
The flexural strength of concrete can be calculated using the following formula:
…….………………………………3.2
Where: fcf = Flexural strength of concrete (N/mm2).
P = Maximum load applied to the specimen in kN.
L = Length of the specimen in mm.
B = Width of the specimen in mm
D = Diameter of the specimen in mm.
2
1000BXD
PXLXfcf
Page 74
74
Table 3.7: Flexural Strengths Test Results
- CSF (Mortar Beams)
Fibre Percentage (%) Average Flexural Strength (N/mm2)
0 3.55
0.5 4.60
1.0 4.75
1.5 4.95
2.0 5.25
Each value is an average of three tests, see Appendix 9 for the raw data
Table 3.8: Flexural Strengths Test Results
- RSF (Mortar Beams)
Fibre Percentage (%) Average Flexural Strength (N/mm2)
0 3.55
0.5 4.55
1.0 4.90
1.5 5.05
2.0 5.20
Each value is an average of three tests, see Appendix 10 for the raw data
Page 75
75
Table 3.9: Flexural Strengths Test Results
- CHSF (Mortar Beams)
Fibre Percentage (%) Average Flexural Strength (N/mm2)
0 3.55
0.5 4.92
1.0 5.10
1.5 5.30
2.0 5.30
Each value is an average of three tests, see Appendix 11 for the raw data
3.5.3 Workability Test
One of the ways of measuring the workability of concrete is by the use of slumps
and compacting factor tests. These two measures are used indirectly to assess workability.
The mix ratio used are one part of cement to two part of sand and four parts of coarse
aggregate (1:2:4) with water-cement ratio of 0.6. In addition to the control mix without
fibre, various percentages of fibre ranging from 0.5, 1.0, 1.5, and 2.0 were used to produce
a concrete of mix ratio as indicated above. After mixing the fresh concrete the slump tests
as well as the compacting factor tests were performed in accordance with BS1881 Part 102
and Part 103 (1996) for slump and compacting factors test respectively. These results are
as presented in Tables 3.10 to 3.12 for slump tests and 3.13 to 3.15 for compacting factor
test.
Page 76
76
Table 3.10: Slump Test Result – CSF (Concrete Mix)
Fibre Percentage (%) Slump Height (mm)
0 166
0.5 160
1.0 149
1.5 140
2.0 126
Each slump value is an average of three tests values, see Appendix 12 for the raw data
Table 3.11: Slump Test Result - RSF (Concrete Mix)
Fibre Percentage (%) Slump Height (mm)
0 166
0.5 159
1.0 157
1.5 130
2.0 120
Each slump value is an average of three tests values, see Appendix 13 for the raw data
Page 77
77
Table 3.12: Slump Test Results – CHSF- (Concrete Mix)
Fibre Percentage (%) Slump Height (mm)
0 166
0.5 120
1.0 102
1.5 84
2.0 60
Each slump value is an average of three tests values, see Appendix 14 for the raw data
Table 3.13: Compacting Factor Results – CSF (Concrete Mix)
Fibre Percentage (%) Compacting Factor (Ratio)
0 0.995
0.5 0.969
1.0 0.940
1.5 0.910
2.0 0.891
Each slump value is an average of three tests values, see Appendix 15 for the raw data
Page 78
78
Table 3.14: Compacting Factor Results – RSF (Concrete Mix)
Fibre Percentage (%) Compacting Factor index
0 0.995
0.5 0.984
1.0 0.980
1.5 0.940
2.0 0.892
Each slump value is an average of three tests values, see Appendix 16 for the raw data
Table 3.15: Compacting Factor Results – CHSF (Concrete Mix)
Fibre Percentage (%) Compacting Factor index
0 0.995
0.5 0.901
1.0 0.894
1.5 0.829
2.0 0.801
Each slump value is an average of three tests values, see Appendix 17 for the raw data
3.6 Steel Fibre Concrete Cube Test
Concrete cubes were cast using the same mix used for the slump test as well as the
compacting factor test and were vibrated using laboratory vibrating table for one minute.
This test was performed to find the increase and differences of strength according for the
increasing percentage of fibre in the concrete. For each type of fibre, sixteen cubes each
Page 79
79
were produced in addition to control cubes, and were all cured in water for 28 days in the
laboratory atmosphere prior to crushing. The results are presented below in Tables 3.16 to
3.18.
Table 3.16: Compressive Strengths Test Results
– CSF (Concrete Cubes)
Fibre Percentage (%) Average Compressive Strength (N/mm2)
0 33.7
0.5 34.4
1.0 40.4
1.5 42.7
2.0 48.0
Each value is an average of four tests values, see Appendix 18 for the raw data
Table 3.17: Compressive Strengths Test Results – RSF (Concrete Cubes)
Fibre Percentage (%) Average Compressive Strength (N/mm2)
0 33.7
0.5 34.2
1.0 39.7
1.5 41.9
2.0 44.2
Each value is an average of four tests values, see Appendix 19 for the raw data
Page 80
80
Table 3.18: Compressive Strengths Test Results
– CHSF (Concrete Cubes)
Fibre Percentage (%) Average Compressive Strength(N/mm2)
0 33.7
0.5 35.3
1.0 36.3
1.5 31.4
2.0 20.4
Each value is an average of four tests values, see Appendix 20 for the raw data
3.7 Steel Fibre Concrete Tensile Strength
An indirect way of testing for concrete tensile strength was by applying tension in the
form of splitting on a cylinder suggested by Fernando Carneiro, a Brazilian. About thirty
nine concrete cylinders were produced using the various percentage range of fibres as
earlier indicated and were subjected to splitting tests in accordance with BS 1881 Part 116,
(1996). The results are as presented in Tables 3.19 to 3.21. Each value in the Table below is
an average of three cylinder tests.
Page 81
81
Table 3.19: Tensile Strengths Test Results
– CSF (Concrete Cylinders)
Fibre Percentage (%) Average Tensile Strength (N/mm2)
0 2.94
0.5 3.90
1.0 4.18
1.5 4.41
2.0 4.63
Each value is an average of three tests and the raw data are as presented in Appendix 21
Table 3.20: Tensile Strengths Test Results – RSF (Concrete Cylinders)
Fibre Percentage (%) Average Tensile Strength (N/mm2)
0 2.94
0.5 3.89
1.0 4.11
1.5 4.39
2.0 4.56
Each value is an average of three tests and the raw data are as presented in Appendix 22
Page 82
82
Table 3.21: Tensile Strengths Test Results
– CHSF (Concrete Cylinders)
Fibre Percentage (%) Average Tensile Strength (N/mm2)
0 2.94
0.5 4.06
1.0 4.58
1.5 4.83
2.0 4.88
Each value is an average of three tests and the raw data are as presented in Appendix 23
3.6 Steel Fibre Concrete Flexural Test
Similarly as outlined in Section 3.3.2 these tests were carried out in accordance with
BS 1881, Part 116, (1996). The mix is one part of cement to two parts of sand to four parts
of coarse aggregates (1:2:4) with a water–cement ratio of 0.6. The curing is the same as
outlined for mortar beams, immersing in water after demoulding for 28 days prior to test. It
is a three-point load test and the flexural strength is given as in Equation 3.3. The results
are presented in Tables 3.22 to 3.24.
Page 83
83
Table 3.22: Flexural Strengths Test Results
- CSF (Concrete Beams)
Fibre Percentage (%) Average Flexural Strength (N/mm2)
0 3.94
0.5 5.10
1.0 4.93
1.5 4.47
2.0 4.27
Each value is an average of three tests and the raw data are as presented in Appendix 24
Table 3.23: Flexural Strengths Test Results
- RSF (Concrete Beams)
Fibre Percentage (%) Average Flexural Strength (N/mm2)
0 3.94
0.5 5.13
1.0 4.97
1.5 5.40
2.0 6.33
Each value is an average of three tests and the raw data are as presented in Appendix 25
Page 84
84
Table 3.24: Flexural Strengths Test Results
- CHSF (Concrete Beams)
Fibre Percentage (%) Average Flexural Strength (N/mm2)
0 3.94
0.5 5.47
1.0 5.07
1.5 4.87
2.0 4.50
Each value is an average of three tests and the raw data are as presented in Appendix 26
3.7 Steel Fibre Concrete Flexural Deflection
The experimental set up for the flexural measurement is shown in Plate 3.2 above. A total
number of 39 beams (ie 3 beams for each fibre volume content) measuring 750 mm X 150
mm X 150 mm were cast using wooden moulds. The moulds were oiled before casting to
allow for easy removal of specimens. Vibration and compaction was done using a vibrating
table. The beams were demoulded within 24hours and cured in water for 28 days before
allowing for surface drying. The specimens were tested using a test frame jacking system at
the Civil Engineering Department laboratory of Ahmadu Bello University, Zaria.
The deflections were measured using dial gauges. The loads were applied in increments of
5 kN. Throughout the testing, at each interval the formation of crack was observed. The
results are as shown in Tables 3.25 to 3.27. The values are average.
Page 85
85
Table 3.25: Flexural Deflection Results -CSF (Concrete Mix)
Fibre
Percentage (%)
Load (kN) – with Corresponding Deflections
0 5 10 15 20 25 30 35 40 45 50 55 60
0 0 0.053 0.105 0.168 0.237 0.272 0.316 0.368 0.377 - - - -
0.5 0 0.053 0.105 0.237 0.316 0.340 0.352 0.362 - - - - -
1.0 0 0.053 0.105 0.210 0.263 0.301 0.368 0.400 0.474 - - - -
1.5 0 0.053 0.105 0.210 0.263 0.301 0.368 0.400 0.474 0.053 0.105 0.210
2.0 0 0.0531
0.104 0.147 0.210 0.287 0.311 0.342 0.368 0.401 0.502 0.610 0.742
Each value is an average of three results and the raw data are as presented in Appendix 27
Table 3.26: Flexural Deflection Results -RSF (Concrete Mix)
Fibre
Percentage (%)
Load (kN) – with Corresponding Deflections
0 5 10 15 20 25 30 35 40 45 50 55 60
0 0 0.053 0.105 0.168 0.237 0.272 0.316 0.368 0.377 - - - -
0.5 0 0.054 0.110 0.236 0.316 0.334 0.355 0.366 - - - - -
1.0 0 0.055 0.108 0.210 0.252 0.306 0.308 0.413 0.415 - - - -
1.5 0 0.054 0.108 0.238 0.269 0.290 0.329 0.350 0.369 0.500 0.528 0.667 -
2.0 0 0.054 0.112 0.129 0.200 0.291 0.330 0.343 0.389 0.411 0.499 0.580 0.734
Each value is an average of three tests and the raw data are as presented in Appendix 28
Page 86
86
Table 3.27: Flexural Deflection Results -CHSF (Concrete Mix)
Fibre
Percentage (%)
Load (kN) – with corresponding deflections
0 5 10 15 20 25 30 35 40 45 50 55 60
0 0 0.053 0.105 0.168 0.237 0.270 0.316 0.368 0.377 - - - -
0.5 0 0.062 0.111 0.178 0.191 0.249 0.309 0.321 0.342 0.423 - - -
1.0 0 0.062 0.111 0.178 0.247 0.249 0.326 0.401 0.420 - - - -
1.5 0 0.058 0.060 0.074 0.111 0.154 0.185 0.269 0.278 - - - -
2.0 0 0.052 0.063 0.070 0.099 0.149 0.178 0.259 0.260 - - - -
Each value is an average of three tests and the raw data are as presented in Appendix 29
3.8 Chips Steel Fibre Concrete Cubes Confirmation Test
In literature, Ghugal (2003) and Stang, Reinhardt and Naaman (2003), it is known
that short steel fibre concrete decreases in compressive strength after one percent addition
of fibre by volume. From tests done, it only shows significant decreased at one and half
percent, 36.3 N/mm2 at one percent volume dosage and 21.4 N/mm2 at two percent volume
dosage. To confirm these results on chips steel fibre, further tests were carried out with
chips steel fibre in accordance with BS 1881 Part 116 (1996). The results are as shown in
Table 3.28.
Page 87
87
Table 3.28: Confirmation of Chips Steel Fibre Compressive Strength
Fibre Percentage (%) Average Compressive Strength (N/mm2)
0 33.7
0.5 35.5
1.0 35.9
1.5 36.2
2.0 30.2
2.5 20.1
3.0 18.5
3.5 Zero
Each average compressive strength is an average of eight cubes. The raw data are shown in
Appendix 30.
Page 88
88
CHAPTER FOUR
ANALYSIS AND DISCUSSION
The results as presented in chapter three are analysed in this chapter to arrive at reasonable
conclusions.
4.1 Sand
The results of the particle size distribution was presented in chapter three, as Table 3.1 and
the particle size distribution curve is as shown in Figure 4.1.
0
10
20
30
40
50
60
70
80
90
100
110
0.1 1 10
Particle Size (mm)
Pers
enta
ge P
assin
g (%
)
Actual CurveLower LimitUpper Limit
Figure 4.1: Particle Size Distribution (Fine Aggregate)
Page 89
89
From the graph the upper limits as well as the lower limits for zone two are indicated with
the keys in the graph. This shows that the sand is in zone two (2). Zone one (1) is the
coarsest while zone four (4) is the finest. Thus zone two (2) is finer than zone one and can
be used for lower water-cement ratio; and for rich mixes. Thus, it is more workable. From
the shape of the graph, the fine aggregate is of well graded sand. Thus the sand used in the
experiment is satisfactory and could be used for a workable mix.
4.2 Coarse Aggregates
The particle size distribution of the coarse aggregates was presented in Table 3.2 of chapter
three and the particle size distribution curve is as shown in Figure 4.2. The grading is in
accordance with BS 882: clause 5a (1996).
-10
10
30
50
70
90
110
1 10 100
Particle Size (mm)
Perc
enta
ge P
assin
g (%
)
Actual CurveLower LimitUpper Limit
Figure 4.2: Particle size distribution (Coarse Aggregate)
Page 90
90
The results show that the size is of nominal size of 40 to 50 mm. The graph shows the
upper and lower limits of this size. The maximum nominal size is however 38.5
millimeters. The graph indicates a well graded aggregate. Thus the coarse aggregate is
satisfactory.
4.3 Cement
The physical and consistency tests results on Dangote Portland cement used in this
experiment are given in Table 3.3 in chapter three. Table 4.1 gives the same results and it
is compared with the requirements of BS 12, (1984) and NIS II (1974).
Table 4.1: Comparison of the Properties of Dangote Ordinary Portland Cement with
the Requirements of BS 12 (1996)
Property Value BS 12 (1996) Requirements
and NIS II (1974).
Normal Consistency (%) 34.5 25 – 35
Initial Setting Time (min) 89.0 > 45
Final Setting Time (min) 148.0 < 600
Soundness (mm) 2 < 10
Specific Gravity 3.14
Cube Compressive Strength (N/mm2)
3 – day
7 – day
28 – day
14.5
24.2
27.5
> 14
> 25
> 25
Page 91
91
The consistency test met the requirement of the standard. The 3-days and 7-days barely met
the standard requirement, while the 28-days was vary okay.
However the results presented when compared with the requirements of BS 12: (1996),
Dangote Ordinary Portland Cement can be said to have met the requirements of BS 12 for
Ordinary Portland Cement and therefore it is good for concrete making.
4.7 Water
Although, no test was carried out on water specially, it is generally known that the
water is portable and everybody drink it in the laboratory, it is pumped from the A.B.U
water works and it is well treated for the community for consumption. It is therefore
portable water.
4.8 Fibres
The fibres as shown in plate one of chapter three are mainly chipping steel fibre,
rectangular steel fibre and circular steel fibre. They are obtained from metal machining; and
used tires after burning off the rubber fabric and were well cleaned prior to use in the
experiments. They are therefore clean fibre materials.
4.9 Steel Fibre Mortar
The steel fibre mortar test is of two types; that of steel fibre compressive mortar
cube tests and that of steel fibre mortar beam flexural tests. The analysis and discussion are
presented below.
Page 92
92
4.6.1 Steel Fibre Mortar Cube
The results of the steel fibre mortar cubes are as presented in Tables 3.4 to 3.6 of
chapter three and the summary of the results are presented in Table 4.2.
Table 4.2: Compressive Strength of Mortar Cubes at Different Fibre Dosage
CSF RSF CHSF Fibre
Percentage (%) N/mm2 N/mm2 N/mm2
Average Strength
N/mm2
0 27.5 27.5 27.5 27.5
0.5 28.2 28.4 28.8 28.5
1.0 29.4 29.7 29.8 29.6
1.5 32.7 30.9 31.2 32.3
2.0 30.0 31.2 30.6 30.6
Observing the results in Table 4.2, it can be seen that there is a gradual increase of strength
with respect to increase in fibre percentages in all types of fibres. The strength is the same
in all types of fibres except as from one and half percentage of fibre dosage; when different
fibres began to manifest different strengths. As from this dosage, the highest strength was
32.7 N/mm2 for circular steel fibre (CSF); followed by chips steel fibre (CHSF) with
strength of 31.2 N/mm2 and rectangular steel fibre (RSF) with 30.9 N/mm2. At two
percentage fibre dosage, the highest strength was that of rectangular steel fibre, followed by
chips steel fibre (CHSF) and circular steel fibre (CSF) having the least strength of the three.
The results in Table 4.2 are represented in Figure 4.3 below showing the strength of fibre
mortar cubes against the fibre percentage by volume.
Page 93
93
Mortar Cubes
18
20
22
24
26
28
30
32
34
0 0.2 0.4 0.6 0.8 1 1.2 1.4 1.6 1.8 2
Fibre Volume Dosage (%)
Com
pres
sive
Stre
ngth
(N/m
m2)
CSFRSF CHSF
Figure 4.3: Average Compressive Strength of steel Fibre Mortar Cubes Vs Fibre Volume
Dosage
Again it can be observed that circular steel fibre cubes showed the highest at one and half
percentage of fibre followed by chips steel fibre. It can be observed also that while Circular
steel fibre dropped sharply at one and half percentage dosage of fibre; chipps steel fibre
also dropped slightly and rectangular continued to increase beyond one and half percentage
dosage.
On observing both Table 4.2 and Figure 4.3, the strengths of the fibre mortar cubes can be
compared with the control strength (zero fibre percentage), and the percentage increase
over the control strength and over the range of fibre percentage dosage are obtained. This is
shown in Table 4.3.
Page 94
94
Table 4.3: Fibre Mortar Cubes Compressive Strengths Increase over Control- Mortar cubes
Compressive Strength Increase (N/mm2)/ Percentage Increase (%)
CSF RSF CHSF
Fibre
Percentage
(%) Strength
Increase
(N/mm2)
Percentage
Increase
(%)
Strength
Increase
(N/mm2)
Percentage
Increase
(%)
Strength
Increase
(N/mm2)
Percentage
Increase
(%)
0 0 - 0 - 0 -
0.5 0.7 2.5 0.9 3.3 1.3 4.7
1.0 1.9 6.9 2.2 8.0 2.3 8.4
1.5 5.5 18.9 3.4 12.4 5.7 13.5
2.0 2.5 9.1 3.7 13.5 3.1 11.3
The Table above is also represented in a graph as shown in Figure 4.4 below with respect to
percentage increase.
Page 95
95
0
2
4
6
8
10
12
14
16
18
20
0 0.5 1 1.5 2
Fibre Volume Dosage Rate (%)
Perc
enta
ge In
crea
se (
%)
CSFRSF CHSF
Figure 4.4: Percentage Increase of compressive strength over control mix Fibre Mortar
On observing the figure there is again a sharp drop at less than one and half percentage
dosage for circular steel fibre and chips steel fibre. That of circular steel fibre drop is
sharper than that of chips steel fibre. That of rectangular steel fibre is seen to continue to
increase in this case. It is worth noting that change occurred at one and half percentage
dosage for circular steel fibre and chips steel fibre. This could be due to the apparent
reduction in workability of the fibre reinforced mortar after one and half percentage dosage
for all the fibres. This case is normal with short steel fibre reinforced mortar, Balaguru and
Shah (1992) and Luo et. al (2001)
The above discussions are represented in the form of bar chart shown in Figure 4.5.
Page 96
96
Figure 4.5: Compressive Strength Increase over Control at Different Fibre Volume Dosage
The highest increase in compressive strength occurred at one and half percentage dosage
for CSF and CHSF.
The decrease in strength by chips steel fibre may be due to the decrease in workability as
the fibre content increases and according to work by Luo et al (2001). The compressive
strength of high-performance cement base materials only increased by about forty percent
over control at a steel fibre content of between one-half percentage to one and half
percentage of fibre volume dosages. This is shown by the results of circular, rectangular
and chips steel fibre mortar cube strengths.
Page 97
97
4.6.2 Steel Fibre Mortar Beam Flexural Strength
The results of the tests performed for the flexural strength on mortar beams for the three
types of fibres were shown in Table 3.7 to 3.9 in chapter three. The summary of the results
is presented in Table 4.4 below for proper comparism.
Table 4.4: Comparism of Flexural Strength of Fibre Mortar Beam Flexural Strength of Fibre Mortar Beams (N/mm2) Fibre
Percentage (%) CSF RSF CHSF Average
0 3.55 3.55 3.55 3.55
0.5 4.60 4.55 4.92 4.69
1.0 4.75 4.90 5.10 4.92
1.5 4.95 5.05 5.30 5.10
2.0 5.25 5.20 5.30 5.25
Table 4.4 shows that, there is a gradual increase in flexural strength as the fibre
content increases in all the three types of fibres. However, the flexural strength tends to
stabilize as from one and half percentage dosage of fibre as the value is almost at 5 N/mm2
in all the fibres. Table 4.4 above is shown in Figure 4.6 below for visual comparism and
analysis.
Page 98
98
2
2.5
3
3.5
4
4.5
5
5.5
0 0.2 0.4 0.6 0.8 1 1.2 1.4 1.6 1.8 2
Fibre Volume (%)
Flex
ural
Stre
ngth
(N/m
m2)
CSF RSF CHSF
Figure 4.6: Flexural Strength against Fibre volume Dosage (Mortar Beams)
Similarly, as outlined in Section 4.6.1 above, the values of flexural strength are
compared with control beam (zero fibre content beam) and the differences are observed as
in Table 4.5.
Page 99
99
Table 4.5: Increase in Flexural Strength at Different Fibre volume Dosage
Flexural Strength Difference (N/mm2)/ Percentage Difference (%)
CSF RSF CHSF
Fibre
Percentage
(%) Strength
Increase
Percentage
Increase
Strength
Increase
Percentage
Increase
Strength
Increase
Percentage
Increase
0 0 - 0 - 0 -
0.5 1.05 29.6 1.00 28.2 1.37 38.6
1.0 1.20 33.8 1.35 38.0 1.55 43.7
1.5 1.40 39.4 1.50 42.2 1.75 49.3
2.0 1.70 48.0 1.65 46.5 1.75 49.3
The table above is also represented in bar chart and graphs as shown in Figures 4.7 and 4.8
below with respect to flexural strength increase and percentage increase
Page 100
100
0
0.2
0.4
0.6
0.8
1
1.2
1.4
1.6
1.8
2
0 0.5 1 1.5 2
Fibre Percentage (%)
Incr
ease
in F
lexu
ral S
treng
th (N
/mm
2)
CSF RSF CHSF
Figure 4.7: Flexural Strength Increase over Control at Different Fibre Volume Dosage
0
10
20
30
40
50
60
0 0.2 0.4 0.6 0.8 1 1.2 1.4 1.6 1.8 2
Fibre Volume Dosage (%)
Perc
enta
ge D
iffer
ence
(%)
CSF RSF CHSF
Figure 4.8: Percentage Increase of Flexural strength over to control mix Fibre Mortar
Page 101
101
A study of Table 4.5 and Figures 4.7 and 4.8 show that chips steel fibre has the highest
increase in flexural strength when compared with the other two fibre reinforced mortar
beams at all the fibre volume dosage investigated. There is an appreciable increase of the
flexural strength of chips steel fibre at one-half percentage of fibre dosage. This increase
decreases with an increase in the fibre volume dosage when Figure 4.7 is considered. They
tend to be equal at high fibre dosage.
4.7 Workability of Steel Fibre Concrete
4.7.1 Slump Test
The results of the slump test performed on concrete mixes for the three fibres are as
presented in Tables 3.10 to 3.12 in chapter three. A summary of the results are presented in
Table 4.6 for comparism.
Table 4.6: Comparism of Slump Test Results for Fibre Concrete Slump test Results for all Fibre Concrete (mm) Fibre
Percentage (%) CSF RSF CHSF Average
0 166 166 166 166
0.5 160 159 120 146
1.0 149 157 102 136
1.5 140 130 84 118
2.0 126 120 60 102
From Table 4.6, it can be observed that there is a continuous decrease in slump with an
increase in percentage of fibre. The decrease is more pronounced in the case of chips steel
fibre where at two percent fibre dosage, the value of slump for chips steel fibre is one-half
Page 102
102
of that of circular and rectangular steel fibres of the same dosage. The decrease in slump as
the percentages increases can be attributed to the mix being stiff as more fibre is added.
Secondly the sharp decrease in chips steel fibre can be said to be as a result of geometry
(wave cut geometry and tough-like edges).
0
20
40
60
80
100
120
140
160
180
0 0.2 0.4 0.6 0.8 1 1.2 1.4 1.6 1.8 2
Fibre Volume Dosage (%)
Slum
p H
eigh
t (m
m)
CSFRSF CHSF
Figure 4.9: Average Slump Height vs. Fibre Volume Dosage for all Fibres
Table 4.6 is represented in graph as shown in Figure 4.9 above. The same trend as
discussed above is displayed in the figure.
Considering the slump at zero fibre percentage as a base, the difference in slumps for the
various fibres are obtained as shown in Table 4.7.
Page 103
103
Table 4.7: Percentage decrease in slump of Steel Fibre Concrete
CSF RSF CHSF Fibre
Percentage
(%) Decrease
in Slump
(mm)
Percentage
Decrease
(%)
Decrease
in Slump
(mm)
Percentage
Decrease
(%)
Decrease
in Slump
(mm)
Percentage
Decrease
(%)
0.5 -6 4 -7 4 -46 28
1.0 -17 10 -9 5 -64 39
1.5 -26 16 -36 22 -82 49
2.0 -40 24 -46 28 -106 64
Observing carefully Table 4.7, the highest percentage decrease in slump is 24 percent for
circular steel fibre, 28 percent for rectangular steel fibre, 64 percent for chips steel fibre.
Obviously, it is easier for a concrete to be more workable with circular cross-section,
followed by rectangular cross-section and certainly more difficult with wave-cut, tough-like
end section. Thus it is an issue of geometry in the above case. Thus, the issue of decrease in
slump is as a result of stiff mix of concrete and geometry of the steel fibre. Table 4.7 is
represented in a graph as Figure 4.10.
Page 104
104
0
10
20
30
40
50
60
0 0.2 0.4 0.6 0.8 1 1.2 1.4 1.6 1.8 2
Fibre Volume Dosage (%)
Perc
enta
ge D
rop
(%)
CSF RSF CHSF
Figure 4.10: Percentage Difference of Slump Height vs. Fibre Volume Dosage
The slumps obtained from all the fibre concrete mix were considered satisfactory; since the
values fall within medium to high degree of workability (50 mm to 175 mm) of Neville,
(1997). Judging from the difference in slump; it is clear that workability of concrete with
fibre is less than that without fibres and if fibre volume dosage increased, a lower
workability of concrete would occur.
4.7.2 Compacting Factor Test
The results of the Compacting factor test performed on concrete mixes for the three
fibres are as presented in Tables 3.13 to 3.15 in chapter three. A summary of the results is
presented in Table 4.8 below for comparism.
Page 105
105
Table 4.8: Comparism of Compacting Factor Test Results for Fibre Concrete Compacting factor test results for all Fibre Concrete Fibre
Percentage (%) CSF RSF CHSF
0 0.995 0.995 0.995
0.5 0.969 0.984 0.901
1.0 0.940 0.980 0.894
1.5 0.910 0.940 0.829
2.0 0.891 0.892 0.801
Table 4.8 shows that there is a general decrease in compacting factor value when fibre
dosage increased. The general decrease with increase in fibre percentage tends to be
uniform with all the type of fibres. To confirm this, the zero fibre – control result is used as
a base and the general decrease in percentage are compared as shown in table 38. Table 4.8
is shown in Figure 4.11.
Page 106
106
0.6
0.7
0.8
0.9
1
0 0.2 0.4 0.6 0.8 1 1.2 1.4 1.6 1.8 2
Fibre Volume Dosage (%)
Com
pact
ing
Fact
or In
dex
CSFRSF CHSF
Figure 4.11: Average compacting factor Vs. Fibre volume dosage for all fibres
From Figure 4.11, it can be seen that the decrease in compacting factor is more
pronounced in chips steel fibre. Rectangular steel fibre even though less produced than
chips steel fibre, it is more than circular steel fibre. This is following the slump workability
trend and the same reason can be given for the values of compacting factor.
Page 107
107
Table 4.9: Compacting Factor Decrease from Control Value
CSF RSF CHSF Fibre
Percentage
(%) Decrease
from Control Value
Percentage Decrease
(%)
Decrease from
Control Value
Percentage Decrease
(%)
Decrease from
Control Value
Percentage Decrease
(%)
0.5 -0.026 3 -0.011 1 -0.094 9
1.0 -0.055 6 -0.015 2 -0.101 10
1.5 -0.085 9 -0.055 6 -0.166 12
2.0 -0.104 10 -0.103 10 -0.194 19
From observation of Table 4.9, the circular and rectangular steel fibre concretes
have decrease in compacting factor to a maximum of ten percent. This can be said to be
almost negligible. However, the maximum for chips steel fibre concrete is in the tune of 20
percent. The same reason give earlier can be attributed to this behaviour. Table 38 is
represented in a graph as Figure 4.12.
Page 108
108
Compacting Factor
0
2
4
6
8
10
12
14
16
18
20
0 0.2 0.4 0.6 0.8 1 1.2 1.4 1.6 1.8 2
Fibre Volume Dosage (%)
Perc
enta
ge D
ecre
ase
(%)
CSF RSF CHSF
Figure 4.12: Percentage Difference of Compacting Factor vs. Fibre Volume Dosage.
4.8 Steel Fibre Concrete Cube
The results of the steel fibre concrete cubes are as presented in Tables 3.16 to 3.18
of chapter three and the summary of the results are presented in Table 4.10.
Page 109
109
Table 4.10: Compressive Strength of Concrete Cubes at Different Fibre Dosage
CSF RSF CHSF Fibre
Percentage (%) N/mm2 N/mm2 N/mm2
Average Strength
N/mm2
0 33.7 33.7 33.7 33.7
0.5 34.4 34.2 35.3 34.6
1.0 40.4 39.7 36.3 38.8
1.5 42.7 41.9 31.4 38.7
2.0 48.0 44.2 20.4 37.5
Observing Table 4.10 carefully, it shows that inclusion of fiber into concrete has influence
on the compressive strength of concrete. Figure 4.13 gives the shape of Table 4.10.
18
23
28
33
38
43
48
53
0 0.2 0.4 0.6 0.8 1 1.2 1.4 1.6 1.8 2
Fibre Volume Dosage (%)
Com
pres
sive
Stre
ngth
(N/m
m2
)
CSF RSF CHSF
Figure 4.13: Average Compressive Strength vs. Fibre Volume Dosage for all Fibres
Page 110
110
A careful observation of the table and figure shows that there is no significant increase in
strength at one-half percent volume dosage. All the three fibres have the same strength. At
one percent fiber dosage there was increase in strength by circular and rectangular fiber
which continued up to two percent increase but chips steel fiber started to decrease at one
percent fiber volume dosage. The decrease by chips steel fiber is very sharp and this may
be due to the apparent decrease in workability because of the geometry and shape of chips
steel fiber.
Table 4.11 shows the strength increase with the coresponding percentage increase over
control at different fiber percentage investigated.
Table 4.11: Compressive Strengths Increase over Control- (Concrete cubes)
Compressive Strength Increase (N/mm2)/ Percentage Increase (%)
CSF RSF CHSF
Fibre
Percentage
(%) Strength
Increase
Percentage
Increase
Strength
Increase
Percentage
Increase
Strength
Difference
Percentage
Increase
0 0 - 0 - 0 -
0.5 0.7 2.1 0.5 1.5 1.6 4.8
1.0 6.7 19.9 6.0 17.8 2.6 7.7
1.5 9.0 26.7 8.2 24.3 -2.3 -6.8
2.0 14.3 42.4 10.5 31.2 -13.3 -39.5
For the three fibres the one-half percent and one percent volume dosage are good for
structural members in compression.
Page 111
111
Again the increase in compressive strength of fibre concrete cube over control cubes are
uniform between one-half to one percent fibre dosage of values ranging between 3 – 4
percent for all the three types of fibres. As from one and half to two percentage fibre
dosage, each fibre start manifesting different behaviour with circular steel fibre and chips
steel fibre having their percentage dropped at two percentage fibre dosage, same reason can
be attributed to this.
4.9 Steel Fibre Concrete Cylinder Split Tests [Tensile]
The results of the steel fibre concrete cylinder split tests are as presented in Tables
3.25 to 3.27 of chapter three and the summary of the results are presented in Table 4.12 for
comparison purposes.
Table 4.12: Tensile Strength of Concrete Cylinder at Different Fibre Dosage
CSF RSF CHSF Fibre
Percentage (%) N/mm2 N/mm2 N/mm2
Average Strength
N/mm2
0 2.94 2.94 2.94 2.94
0.5 3.90 3.89 4.06 3.95
1.0 4.18 4.11 4.58 4.29
1.5 4.41 4.39 4.83 4.54
2.0 4.63 4.56 4.88 4.69
Table 4.12 above is represented in Figure 4.14 below for visual comparism and analysis.
Page 112
112
1.5
2
2.5
3
3.5
4
4.5
5
5.5
0 0.5 1 1.5 2Fibre Volume Dosage (%)
Tens
ile S
treng
th (N
/mm
2)
CSFRSFCHSF
Figure 4.14: Average Tensile Strength vs. Fibre Volume Dosage for all Fibres
From the Table 4.12 and Figure 4.14 above, there is a gradual increase and
improvement in the tensile strength of steel fibre concrete with increase in steel fibre
dosage. However, the increase between one-half to one and half fibre percentage dosage is
gradual and not much, though at two percent there is a slight increase or improvement on
the former gradual increase between one-half and one and half dosage. Thus, steel fibre in
concrete improves the tensile strength of concrete.
Using the control tensile strength as a base, the difference between the various
dosage of steel fibre with their corresponding tensile strength are compared and is as shown
in Table 4.13.
Page 113
113
Table 4.13: Increase in Tensile Strength at Different Fibre Volume Dosage Tensile Strength Increase (N/mm2)/ Percentage Difference (%)
CSF RSF CHSF
Fibre
Percentage
(%) Strength
Increase
Percentage
Increase
Strength
Increase
Percentage
Increase
Strength
Increase
Percentage
Increase
0 0 - 0 - 0 -
0.5 0.96 32.7 0.95 32.3 1.12 38.1
1.0 1.24 42.2 1.17 39.8 1.64 55.8
1.5 1.47 50.0 1.45 49.3 1.89 64.3
2.0 1.69 57.5 1.62 55.1 1.94 65.9
The table above (Table 4.13) is also represented in graph as shown in Figure 4.15 and a bar
chat-graph as presented in Figure 4.16 for the same table.
0
10
20
30
40
50
60
70
0 0.5 1 1.5 2
Fibre Volume Dosage (%)
Perc
enta
ge In
crea
se (%
)
CSFRSFCHSF
Figure 4.15: Percentage Difference of tensile strength vs. fibre volume dosage
Page 114
114
0
0.5
1
1.5
2
2.5
0 0.5 1 1.5 2
Fibre volume dosage (%)
Stre
ngth
incr
ease
(N/m
m2)
CSFRSF CHSF
Figure 4.16: Tensile Strength Increase over Control at Different Fibre Volume Dosage
From Table 4.13, Figure 4.15 and the bar chart of Figure 4.16, the chips steel fibre has
higher tensile strength when compared to the circular and rectangular steel fibres which are
almost the same value in tensile strength. The chips steel fibres are twisted and are more
flexural in nature. Thus, it acts as reinforcement more than the circular/rectangular steel
fibres which may be more brittle.
At failure, the none fibre cylinder split without warning while that of chips steel
fibre cylinders even though they have failed, are still together as one unit and only showed
line crack at the point of failure. This is shown in Plate 4.1. Thus, failure of steel fibre
concrete gives warning prior to failure but that of non-fibre cylinder gives no warning.
Page 115
115
Plate 4.1: Photograph of Concrete specimens at failure showing Specimens with and
without Fibres
4.10 Steel Fibre Concrete Beam Flexural Strength
The results of the tests performed for the flexural strength on concrete beams for the three
types of fibres are presented in Tables 3.22 to 3.24 in chapter three. The summary of the
results is presented in Table 4.14.
Page 116
116
Table 4.14: Comparism of Flexural Strength of Fibre Concrete Beam
Flexural Strength of Fibre Concrete Beams (N/mm2) Fibre
Percentage (%) CSF RSF CHSF Average
0 3.94 3.94 3.94 3.94
0.5 5.10 5.13 5.47 5.23
1.0 4.93 4.97 5.07 4.99
1.5 4.47 5.40 4.87 4.91
2.0 4.27 6.33 4.50 5.03
Table 4.14 shows that, there is a general increase in flexural strength when fibres
were added to concrete. Table 4.14 above is also presented as a graph as shown in Figure
4.17.
2.5
3
3.5
4
4.5
5
5.5
6
6.5
7
0 0.2 0.4 0.6 0.8 1 1.2 1.4 1.6 1.8 2
Fibre Volume Dosage (%)
Flex
ural
Stre
ngth
(N/m
m2)
CSFRSF CHSF
Figure 4.17: Flexural Strength of concrete against Fibre volume Dosage
Page 117
117
From Table 4.14 and Figure 4.17, there is flexural strength increase at one - half percent
fibre volume by all the fibres investigated, after one - half percentage volume addition,
circular and chip steel fibres reinforced concretes recorded decreasing trends in the flexural
strength as the fibre volume dosage increases through to two percent fibre volume dosage,
and the values are very close to each other. Rectangular steel fibre recorded increasing
trend. These observed trends may be due to the fact that workability of concrete decreases
more rapidly as the fibre content increases which may lead to inadequate compaction and
possible decrease in strength or may be due to the geometry of the sections involved.
The values of flexural strength are compared with control beam (zero fibre content
beams) and the differences are observed as in Table 4.15.
Table 4.15: Increase in Flexural Strength at Different Fibre volume Dosage
Flexural Strength Increase (N/mm2)/ Percentage Increase (%)
CSF RSF CHSF
Fibre
Percentage
(%) Strength
Increase
Percentage
Increase
Strength
Increase
Percentage
Increase
Strength
Increase
Percentage
Increase
0.5 1.16 29.4 1.19 30.2 1.53 38.8
1.0 0.99 25.1 1.03 26.1 1.13 28.7
1.5 0.53 13.5 1.46 37.1 0.93 23.6
2.0 0.33 8.3 2.39 60.7 0.56 14.2
Table above is also represented in graph and bar chart as shown in Figures 4.18 and 4.19
below with respect to flexural strength increase and percentage increase.
Page 118
118
Concrete Beams
0
10
20
30
40
50
60
70
0 0.5 1 1.5 2
Fibre volume dosage (%)
Perc
enta
ge In
crea
se (%
)
CSFRSFCHSF
Figure 4.18: Percentage Increase of Flexural strength over to control mix Fibre concrete
0
0.5
1
1.5
2
2.5
3
0 0.5 1 1.5 2
Fibre Volume Dosage (%)
Flex
ural
Stre
ngth
Incr
ease
(N/m
m2 )
CSFRSF CHSF
Figure 4.19: Flexural Strength Increase over Control at Different Fibre Volume Dosage
Page 119
119
Observing the results in Table 4.14 and Figure 4.18 through to Figure 4.19, it can be seen
that there is increase in flexural strength of concrete beams when different types of fibres
are added to concrete. The control (zero percent fibre) had a flexural strength of 3.55
N/mm2. Rectangular steel fibre recorded the highest increase in flexural strength of 61
percent at two percent fibre volume; which is 2.39 N/mm2 over control.
A study of Table 4.14, Figures 4.18 and 4.19 shows that all the steel fibres have increase in
flexural strength when compared with the control.
4.11 Load/deflection Response
The results of the load – deflection response from the test performed on all fibre
reinforced concrete beams under one point load were presented in Tables 3.21 to 3.23 of
chapter three, the summary of the results are presented in Table 4.16 below for comparison
purposes.
Page 120
120
Table 4.16: Load / deflection Results for the three Fibres at Different Fibre Percentage
Fibre
Percentage (%)
Load (kN)
0 5 10 15 20 25 30 35 40 45 50 55 60 Deflection (mm) 0 0 0.053 0.105 0.168 0.237 0.272 0.316 0.368 0.377 - - - -
0.5 (CSF) 0 0.053 0.105 0.237 0.316 0.340 0.352 0.362 - - - - - 0.5 (RSF) 0 0.054 0.110 0.236 0.316 0.334 0.355 0.366 - - - - -
0.5 (CHSF) 0 0.062 0.111 0.178 0.191 0.249 0.309 0.321 0.342 0.423 - - -
1.0 (CSF) 0 0.053 0.105 0.210 0.263 0.301 0.368 0.400 0.474 - - - - 1.0 (RSF) 0 0.055 0.108 0.210 0.252 0.306 0.308 0.413 0.415 - - - -
1.0 (CHSF) 0 0.062 0.111 0.178 0.247 0.249 0.326 0.401 0.420 - - - -
1.5 (CSF) 0 0.053 0.105 0.210 0.263 0.301 0.368 0.400 0.474 0.053 0.105 0.210 - 1.5 (RSF) 0 0.054 0.108 0.238 0.269 0.290 0.329 0.350 0.369 0.500 0.528 0.667 -
1.5 (CHSF) 0 0.058 0.060 0.074 0.111 0.154 0.185 0.269 0.278 - - - -
2.0 (CSF) 0 0.0531 0.104 0.147 0.210 0.287 0.311 0.342 0.368 0.401 0.502 0.610 0.742
2.0 (RSF) 0 0.054 0.112 0.129 0.200 0.291 0.330 0.343 0.389 0.411 0.499 0.580 0.734
2.0 (CHSF) 0 0.052 0.063 0.070 0.099 0.149 0.178 0.259 0.260 - - - - Table 4.16 is represented in Figures 4.20 to 4.22 for visual comparism and analysis.
Page 121
121
CSR
0
10
20
30
40
50
60
70
0 0.1 0.2 0.3 0.4 0.5 0.6 0.7 0.8 0.9 1Deflection (mm)
Load
(kN
)
Control (0%)0.50%1.00%1.50%2.00%
Figure 4.20: Load/Deflection Curve for CSF at Different Volume Dosage
RSF
0
10
20
30
40
50
60
70
0 0.1 0.2 0.3 0.4 0.5 0.6 0.7 0.8
Deflection (mm)
Load
(kN
) Control (0%)0.50%
1.00%1.50%2.00%
Figure 4.21: Load/Deflection Curve for RSF at Different Volume Dosage
Page 122
122
CHSF
0
5
10
15
20
25
30
35
40
45
50
0 0.1 0.2 0.3 0.4 0.5Deflection (mm)
Load
(kN
)
control0.50%1.00%1.50%2.00%
Figure 4.22: Load/Deflection Curve for CHSF at Different Volume Dosage
Table 4.16 and Figures 4.20 to 4.22 show that the results for the zero percent fibre concrete
displays typical brittle fracture behavior, with a maximum load of 40 kN at a deflection of
0.377 mm. The failure was sudden without warning and was virtually perpendicular to the
longitudinal direction of the specimen. The fracture surfaces of the zero percent fibre
concrete specimens are flatter and smoother than those of fibre reinforced concrete.
A careful examination of Figures 4.20 to 4.22 also reveal that addition of circular
steel fibre improved the load carrying capacity over that of the unreinfored (zero percent
fibre) concrete and shows a reduction in the rate of deflection as the load is increased.
These two observations hold for the three fibres used in this work. Circular and rectangular
steel fibres sustained the highest load of 60 kN and deflections of 0.742 mm and 0.734 mm
Page 123
123
respectively before failure begins; this was at two percent fibre volume dosage. This shows
an increase in maximum load of about 50% over the maximum load carried by the control
specimen. The improved load carrying capacity of all the fibre reinforced concrete (
circular, rectangular and chips steel fibres ) as shown in Figures 4.20 to 4.22 over the
unreinforced concrete are basically due to the bridging effect of the fibres in the concrete
and the interaction between fibres and concrete.
Table 4.16 also shows and compared the load-deflection characteristics of the three types of
steel fibres at the same fibre percentage. This is also represented in graphs below as Figures
4.23 to 4.26.
Half percent of all Fibres
0
5
10
15
20
25
30
35
40
45
50
0 0.1 0.2 0.3 0.4 0.5Deflection(mm)
Load
(kN
)
0.5% of CSF
0.5% of RSF
0.5% of CHSF
Figure 4.23: Load vs. displacement graph for all the fibre at 0.5%volume dosage
Page 124
124
One percent for all Fibres
0
5
10
15
20
25
30
35
40
45
0 0.1 0.2 0.3 0.4 0.5
Deflections (mm)
Load
(kN
)
1.0% of CSF
1.0% of RSF
1.0% of CHSF
Figure 4.24: Load vs. displacement graph for all the fibre at 1.0%volume dosage
One and half percentage for all Fibres
0
10
20
30
40
50
60
0 0.1 0.2 0.3 0.4 0.5 0.6 0.7 0.8
Deflection (mm)
Load
(kN
)
1.5% of CSF
1.5% of RSF
1.5% of CHSF
Figure 4.25: Load vs. displacement graph for all the fibre at 1.5%volume dosage
Page 125
125
Two percent volume for all fibres
0
10
20
30
40
50
60
70
0 0.1 0.2 0.3 0.4 0.5 0.6 0.7 0.8
Deflection (mm)
Load
(kN
)
2.0% of CSF
2.0% of RSF
2.0% of CHSF
Figure 4.26: Load vs. displacement graph for all the fibre at 2.0%volume dosage
Figures 4.23 to 4.26 show the load/deflection curves for fibre reinforced concrete, the
figures compare the variations of the load carrying capacity of fibres as the fibre volume
dosage remain the same for all the fibres used in this work. At one-half percent fibre
volume dosage chip fibre reinforced concrete shows less deflections as the load increases as
compared to the other two fibres reinforced concrete at a load of 35 kN, the deflection was
0.321 mm for chip steel fibre, while the deflection was the same (0.362 mm) for circular
and rectangular steel fibres at the same 35 kN. Chips steel fibre carried more load
(maximum of 45 kN) before failure as compare to a load of 35 kN for circular and
rectangular steel fibres reinforced concrete. A carefully observation of Figures 4.23 to 4.26
Page 126
126
shows that circular and rectangular steel fibres reinforced concrete carried more loads at
higher fibre volume dosages than chip steel fibre concrete.
From the results of flexural strength test, it is clear that the three different fibres
used for this work shows improved performances over control specimen through their
influence on load sharing with the concrete matrix and the bridging of cracks. It is also
clear that the ranges of fibre volume dosage used are quite suitable dosage to apply to
concrete and will give a result of more than 50% increase in flexural strength. As a general
overview, waste steel fibres do increase the flexural strength; increase the energy
absorption of concrete at the pre-cracking and post-cracking stages.
4.12 Chips Steel Fibre Concrete Cubes Tests
The results of the confirmation chips steel fibre concrete cubes test are as presented
in Tables 3.28 of chapter three. These results are compared with the results of chips steel
fibre concrete of the first stage of this work and are as presented Table 4.17:
Page 127
127
Table 4.17: Compressive Strength of Chips Steel Fibre Concrete Cubes
First
CHSF
Confirmation
CHSF
Fibre
Percentage (%)
N/mm2 N/mm2
Average Strength
N/mm2
0 33.7 33.7 33.7
0.5 35.3 35.5 35.4
1.0 36.3 35.9 36.1
1.5 31.4 36.2 33.8
2.0 20.4 30.2 25.3
2.5 - 20.1 20.1
3.0 - 18.5 18.5
3.5 - 0 Zero
Table 4.17 is presented in Figure 4.27.
Page 128
128
15
20
25
30
35
40
0 0.5 1 1.5 2 2.5 3 3.5
Fibre Volume Dosage (%)
Com
pres
sive
Stre
ngth
(N/m
m2)
CHSFConf. CHSF
Figure 4.27: Compressive strength of chips steel fibre cubes
A careful observation of Table 4.17 and Figure 4.27 show that there was increase in
compressive strength of chips steel fibre from zero percent to one and half percent for the
confirmation test and there was increase up to only one percent fibre volume for the first
test. The highest compressive strength 36.3 N/mm2 occurred at one percent fibre volume
for the first test and dropped to the lowest of 20.4 N/mm2 at two percent fibre dosage. For
the confirmation chips fibre test, the highest compressive strength is 36.2 N/mm2 at one
percent fibre dosage and dropped to zero at three and half percent fibre dosage. The
confirmation results confirm the earlier test results of compressive strength of chips steel
fibre concrete. This drop in compressive strength of chips steel fibre concrete as the fibre
volume dosage increases is as a result of drop in workability as the fibre volume dosage
increases. For example, as the fibre volume dosage increased above two percent, the
Page 129
129
workability decreased to a level that full compaction could not be achieved and this lead to
a further drop in strength as shown in Table 45 and Figure 4.27.
4.13 Prediction Model for Strengths of Steel Fibre Composites.
In developing the 28-day strengths prediction model of the fibre reinforced mortar and
concrete specimens, the influence of the fibre volume dosage on the strength properties are
considered.
The statistical package in EXCEL MICROSOFT OFFICE 2005 was used for developing
the prediction model. This package was used to predict the models by generating curves
and equations that would best fit the experimental data. A comparison is also made between
the experiment data and data generated by the prediction model.
The results obtained from the test performed on mortar and concrete specimens and the
graphs of these results are shown earlier in chapter three and four. The generation of fitting
curves and equations using Microsoft Excel Package can be represented by a general
polynomial equation of the form:
dcxbxaxF x 23)( ………………………………………4.1
Where F(x) is the strength at a curing age of 28 days and a, b, c and d are coefficients and x
is the fibre percentage.
Using the statistical package in EXCEL MICROSOFT OFFICE 2005, the coefficients a, b,
c and d; the coefficient of determinations (R2) are obtained for all the strength data in
chapter three. The coefficients a, b, c and d and the coefficient of determinations (R2) are
shown in tables below:
Page 130
130
Table 4.18: Coefficients for Mortar Cubes
Property Coefficients Fibre Type
A b c d R2
CSF -4.3333 11.657 -4.7310 27.639 0.9169
RSF -0.8667 2.2286 0.8595 27.504 0.9999
Compressive
strength of
Mortar Cubes
CHSF -3.8000 9.8571 -2.9643 27.659 0.9040
Table 4.19: Coefficients for Mortar Beams
Property Coefficients Fibre Type
A b c d R2
CSF 0.6667 -2.4143 3.0119 3.5629 0.9931
RSF 0.4333 -1.8429 2.7774 3.5536 0.9995
Flexural strength
of Mortar Beams
CHSF 0.6600 -2.7571 3.7493 3.5704 0.9865
Table 4.20: Coefficients for Concrete Cubes
Property Coefficients Fibre Type
A b c d R2
CSF -1.5333 6.1714 0.9405 33.476 0.9753
RSF -3.2667 9.8857 -1.4548 33.533 0.9775
Compressive
strength of
Concrete Cubes
CHSF -3.667 2.1143 3.7881 33.627 0.9978
Page 131
131
Table 4.21: Coefficients for Concrete Cylinders
Property Coefficients Fibre Type
A b c d R2
CSF 0.4467 -1.7771 2.6126 2.9484 0.9971
RSF 0.4133 -1.6686 2.4938 2.9537 0.9918
Tensile strength
of concrete
cylinders
CHSF 0.2667 -1.4886 2.8805 2.9437 0.9996
Table 4.22: Coefficients for Concrete Beams
Property Coefficients Fibre Type
A b c d R2
CSF 1.0600 -4.0400 4.0050 3.9450 0.9962
RSF 1.2333 -3.6800 3.6217 3.9690 0.9801
Flexural strength
of Concrete
Beams
CHSF 1.1733 -4.5486 4.6838 3.9757 0.9340
The coefficients above are use to generate predicting equations that will best fit the
experimental curves. The equations are shown below:
Using the coefficients in Table 4.18, the equations for the compressive strength of mortar
cubes are:
F(CSF) = -4.3333x3 + 11.657x2 – 4.731x + 27.639………………………..4.2
F(RSF) = -0.8667x3 + 2.2286x2 + 0.8595x + 27.504…………… ………..4.3
F(CHSF) = -3.8x3 + 9.8571x2 – 2.9643x + 27.659…………….…………...4.4
Page 132
132
Using the coefficients in Table 4.19, the equations for the flexural strength of mortar beams
are:
F(CSF) = 0.6667x3 – 2.4143x2 + 3.0119x + 3.5629………………………4.5
F(RSF) = 0.4333x3 – 1.8429x2 + 2.7774x + 3.5536……………….. …….4.6
F(CHSF) = 0.66x3 – 2.7571x2 + 3.7493x + 3.5704…………………. ……4.7
Using the coefficients in Table 4.20, the equations for the compressive strength of concrete
cubes are:
F(CSF) = -1.5333x3 + 6.1714x2 – 0.9405x + 33.476………………… ….4.8
F(RSF) = -3.2667x3 + 9.8857x2 – 1.4548x + 33.533………………… ….4.9
F(CHSF) = -3.6667x3 + 2.1143x2 + 3.7881x + 33.627……………………4.10
Using the coefficients in Table 4.21, the equations for the tensile strength of concrete
cylinders are:
F(CSF) = 0.4467x3 – 1.7771x2 + 2.6126x + 2.9484………………………4.11
F(RSF) = 0.4133x3 – 1.6686x2 + 2.4938x + 2.9537………………………4.12
F(CHSF) = 0.2667x3 – 1.4886x2 + 2.8805x + 2.9437………………… ….4.13
Using the coefficients in Table 4.22, the equations for the flexural strength of concrete
beams are:
F(CSF) = 1.06x3 – 4.04x2 + 4.005x + 3.945……………..………………...4.14
F(RSF) = 1.2333x3 – 3.68x2 + 3.6217x + 3.969……………….…… …….4.15
F(CHSF) = 1.1733x3 – 4.5486x2 + 4.6838x + 3.9757…………….… …….4.16
Page 133
133
R-squares obtained for these equations were above 0.99, in each of the predicted equations,
in other words, we could explain 99% of the variability for the data around the regression
line and 1% of the residual data could not be explained by these equations.
Using the equations above, the predicted values of the strengths and the experimental
values are presented in Tables 4.23 to 4.27 below. These Tables are also represented by
graphs showing the obtained and predicted curves.
Table 4.23: Compressive Strengths of Mortar Cubes
CSF RSF CHSF Fibre
Percentage
(%)
Obtained
Strength
(N/mm2)
Predicted
Strength
(N/mm2)
Obtained
Strength
(N/mm2)
Predicted
Strength
(N/mm2)
Obtained
Strength
(N/mm2)
Predicted
Strength
(N/mm2)
0 27.5 27.6 27.5 27.5 27.5 27.7
0.5 28.2 27.7 28.4 28.4 28.8 28.2
1.0 29.4 30.2 29.7 29.7 29.8 30.8
1.5 32.7 32.2 30.9 30.9 31.2 32.5
2.0 30.0 30.1 31.2 31.2 30.6 30.8
2.5 - 21.0 - 17.5 - 22.4
Page 134
134
Mortar Cubes
18
20
22
24
26
28
30
32
34
0 0.2 0.4 0.6 0.8 1 1.2 1.4 1.6 1.8 2
Fibre Volume Dosage (%)
Com
pres
sive
Stre
ngth
(N/m
m2 )Experimental (CSF) Experimental (RSF) Experimental (CHSF)Predicted (RSF) Predicted (CSF) Predicted (CHSF)
Figure 4.28: Experimental and Predicted – 28 days Compressive Strength
Table 4.24: Flexural Strength of Mortar Beams
CSF RSF CHSF Fibre
Percentage
(%)
Obtained
Strength
(N/mm2)
Predicted
Strength
(N/mm2)
Obtained
Strength
(N/mm2)
Predicted
Strength
(N/mm2)
Obtained
Strength
(N/mm2)
Predicted
Strength
(N/mm2)
0 3.55 3.56 3.55 3.55 3.55 3.57
0.5 4.60 4.55 4.55 4.54 4.92 4.76
1.0 4.75 4.83 4.90 4.92 5.10 5.22
1.5 4.95 4.90 5.05 5.04 5.30 5.22
2.0 5.25 5.26 5.20 5.20 5.30 5.32
2.5 - 6.42 - 5.75 - 6.02
Page 135
135
Mortar Beams
2
2.5
3
3.5
4
4.5
5
5.5
0 0.2 0.4 0.6 0.8 1 1.2 1.4 1.6 1.8 2
Fibre Volume (%)
Flex
ural
Stre
ngth
(N/m
m2 )Experimental (CSF) Experimental (RSF) Experimental (CHSF)Predicted (CSF) Predicted (RSF) Predicted (CHSF)
Figure 4.29: Experimental and Predicted – 28 days Flexural Strength
Table 4.25: Compressive Strength of Concrete Cubes
CSF RSF CHSF Fibre
Percentage
(%)
Obtained
Strength
(N/mm2)
Predicted
Strength
(N/mm2)
Obtained
Strength
(N/mm2)
Predicted
Strength
(N/mm2)
Obtained
Strength
(N/mm2)
Predicted
Strength
(N/mm2)
0 33.7 33.48 33.7 33.53 33.7 33.63
0.5 34.4 34.36 34.2 34.87 35.3 35.59
1.0 40.4 37.17 39.7 38.70 36.3 35.86
1.5 42.7 40.78 41.9 42.57 31.4 31.69
2.0 48.0 44.01 44.2 44.03 20.4 20.33
2.5 - 45.73 - 40.64 - -0.98
Page 136
136
Concrete Cubes
18
23
28
33
38
43
48
53
0 0.2 0.4 0.6 0.8 1 1.2 1.4 1.6 1.8 2
Fibre Volume Dosage (%)
Com
pres
sive
Stre
ngth
(N/m
m2)
Experimental (CSF) Experimental (RSF) Experimental (CHSF)Predicted (CSF) Predicted (RSF) Predicted (CHSF)
Figure 4.30: Experimental and Predicted – 28 days Compressive Strength
Table 4.26: Tensile Strength of Concrete Cylinder at Different Fibre Dosage
CSF RSF CHSF Fibre
Percentage
(%)
Obtained
Strength
(N/mm2)
Predicted
Strength
(N/mm2)
Obtained
Strength
(N/mm2)
Predicted
Strength
(N/mm2)
Obtained
Strength
(N/mm2)
Predicted
Strength
(N/mm2)
0 2.94 2.95 2.94 2.95 2.94 2.94
0.5 3.90 3.87 3.89 3.84 4.06 4.05
1.0 4.18 4.23 4.11 4.19 4.58 4.60
1.5 4.41 4.38 4.39 4.34 4.83 4.82
2.0 4.63 4.64 4.56 4.57 4.88 4.88
2.5 - 5.35 - 5.22 - 5.01
Page 137
137
1.5
2
2.5
3
3.5
4
4.5
5
5.5
0 0.2 0.4 0.6 0.8 1 1.2 1.4 1.6 1.8 2Fibre Volume Dosage (%)
Tens
ile S
treng
th (N
/mm
2)
Experimental (CSF) Experimental (RSF) Experimental (CHSF)Predicted (CSF) Predicted (RSF) Predicted (CHSF)
Figure 4.31: Experimental and Predicted – 28 days Tensile Strength
Table 4.27: Flexural Strength of Concrete Beams at Different Fibre Dosage
CSF RSF CHSF Fibre
Percentage
(%)
Obtained
Strength
(N/mm2)
Predicted
Strength
(N/mm2)
Obtained
Strength
(N/mm2)
Predicted
Strength
(N/mm2)
Obtained
Strength
(N/mm2)
Predicted
Strength
(N/mm2)
0 3.94 3.95 3.94 3.97 3.94 3.98
0.5 5.10 5.07 5.13 5.01 5.47 5.33
1.0 4.93 4.97 4.97 5.14 5.07 5.28
1.5 4.47 4.44 5.40 5.28 4.87 4.73
2.0 4.27 4.28 6.33 6.36 4.50 4.54
2.5 - 5.27 - 9.29 - 5.59
Page 138
138
Concrete Beams
2.5
3
3.5
4
4.5
5
5.5
6
6.5
7
0 0.2 0.4 0.6 0.8 1 1.2 1.4 1.6 1.8 2
Fibre Volume Dosage (%)
Flex
ural
Stre
ngth
(N/m
m2)
Experimental (CSF) Experimental (RSF) Experimental (CHSF)Predicted (CRF) Predicted (RSF) Predicted (CHSF)
Figure 4.32: Experimental and Predicted – 28 days Compressive Strength
Plots of samples of the matching curves for the prediction and experimental results are
shown in Figures 4.28 to 4.32. The smooth lines are the experimental, while the dotted lines
are the predicted.
4.14 Relationships between Compressive, Tensile and Flexural Strengths of Steel
Fibre Mortar and Concrete.
There is no direct proportionality (relationship) between compressive strength and
tensile and flexural strengths of mortar or concrete, but generally, as the compressive
strength increases, the flexural and tensile strengths also increases at a decreasing rate for
plain concrete, Neville (1997), Mehta and Monteiro (1993), and Sullivan (2001).
The tensile strength of plain concrete is usually taken to be about one-tenth of its
Page 139
139
compressive strength, Neville (1997) and Murdock and Blackledge, (1968). In general, as a
guide, the indirect tensile strength of concrete may be taken as cuf45.0 Nmm2, where fcu
is the cube compressive strength and the flexural strength may be taken as cuf70.0
Nmm2. In this work, the following relationship could be established between compressive
strength and tensile and flexural strengths of steel fibre mortar and concrete and these
relationships are as stated below:
1. The relationship between compressive strength of mortar cubes and flexural
strength of mortar beam could be taken as cuf89.0 N/mm2, ( ie fcr = cuf89.0 )
where fcu is the cube compressive strength and fcr is flexural strength. Using this
established relationship, the experimental and estimated values of mortar beam
flexural strength are shown in Table 4.28 to 4.30.
2. The relationship between compressive strength of concrete cube and tensile strength
of concrete cylinder could be taken as cuf66.0 N/mm2, ( ie fct = cuf66.0 ),
where fcu is the cube compressive strength and fcr is the tensile strength. Using this
established relationship, the experimental and estimated values of concrete tensile
strength are shown in Table 4.31 to 4.33
3. The relationship between compressive strength of concrete cube and flexural
strength of concrete beam could be taken as cuf85.0 N/mm2, ( ie fct = cuf85.0 ),
where fcu is the cube compressive strength and fcr is flexural strength. Using this
established relationship, the experimental and estimated values of concrete tensile
strength are shown in Table 4.34 to 4.36.
Page 140
140
Table 4.28: Experimental and Estimated Values of Mortar Beam Flexural Strength –
CSF
Fibre Percentage
(%)
Average Compressive
Strength (N/mm2)
Average Experimental
Flexural Strength
(N/mm2)
Estimated Flexural
Strength (N/mm2)
0 27.5 3.55 3.67
0.5 28.2 4.60 4.73
1.0 29.4 4.75 4.82
1.5 32.7 4.95 5.09
2.0 30.0 5.25 4.87
Table 4.29: Experimental and Estimated Values of Mortar Beam Flexural Strength –
RSF
Fibre Percentage
(%)
Average Compressive
Strength (N/mm2)
Average Experimental
Flexural Strength
(N/mm2)
Estimated Flexural
Strength (N/mm2)
0 27.5 3.55 3.67
0.5 28.4 4.55 4.74
1.0 29.7 4.90 4.85
1.5 30.9 5.05 4.95
2.0 34.2 5.20 5.21
Page 141
141
Table 4.30: Experimental and Estimated Values of Mortar Beam Flexural Strength –
CHSF
Fibre Percentage
(%)
Average Compressive
Strength (N/mm2)
Average Experimental
Flexural Strength
(N/mm2)
Estimated Flexural
Strength (N/mm2)
0 27.5 3.55 3.67
0.5 28.8 4.92 4.78
1.0 29.8 5.10 4.86
1.5 33.2 5.30 5.12
2.0 33.6 5.30 5.16
Table 4.31: Experimental and Estimated Values of Concrete Cylinder Tensile
Strength – CSF
Fibre Percentage
(%)
Average Compressive
Strength (N/mm2)
Average Experimental
Tensile Strength
(N/mm2)
Estimated Tensile
Strength (N/mm2)
0 33.7 2.94 2.61
0.5 34.4 3.90 3.87
1.0 40.4 4.18 4.19
1.5 42.7 4.41 4.31
2.0 48.0 4.63 4.57
Page 142
142
Table 4.32: Experimental and Estimated Values of Concrete Cylinder Tensile
Strength – RSF
Fibre Percentage
(%)
Average Compressive
Strength (N/mm2)
Average Experimental
Tensile Strength
(N/mm2)
Estimated Tensile
Strength (N/mm2)
0 33.7 2.94 2.61
0.5 34.2 3.89 3.86
1.0 39.7 4.11 4.16
1.5 41.9 4.39 4.27
2.0 44.2 4.56 4.39
Table 4.33: Experimental and Estimated Values of Concrete Cylinder Tensile
Strength – CHSF
Fibre Percentage
(%)
Average Compressive
Strength (N/mm2)
Average Experimental
Tensile Strength
(N/mm2)
Estimated Tensile
Strength (N/mm2)
0 33.7 2.94 2.61
0.5 35.3 4.06 3.92
1.0 36.3 4.58 3.97
1.5 31.4 4.83 3.70
2.0 20.4 4.88 2.98
Page 143
143
Table 4.34: Experimental and Estimated Values of Concrete Beam Flexural Strength
– CSF
Fibre Percentage
(%)
Average Compressive
Strength (N/mm2)
Average Experimental
Flexural Strength
(N/mm2)
Estimated Flexural
Strength (N/mm2)
0 33.7 3.94 4.06
0.5 34.4 5.10 4.99
1.0 40.4 4.93 5.40
1.5 42.7 4.47 5.55
2.0 48.0 4.27 5.89
Table 4.35: Experimental and Estimated Values of Concrete Beam Flexural Strength
– RSF
Fibre Percentage
(%)
Average Compressive
Strength (N/mm2)
Average Experimental
Flexural Strength
(N/mm2)
Estimated Flexural
Strength (N/mm2)
0 33.7 3.94 4.06
0.5 34.2 5.13 4.97
1.0 39.7 4.97 5.36
1.5 41.9 5.40 5.50
2.0 44.2 6.33 5.65
Page 144
144
Table 4.36: Experimental and Estimated Values of Concrete Beam Flexural Strength
– CHSF
Fibre Percentage
(%)
Average Compressive
Strength (N/mm2)
Average Experimental
Flexural Strength
(N/mm2)
Estimated Flexural
Strength (N/mm2)
0 33.7 3.94 4.06
0.5 35.3 5.47 5.05
1.0 36.3 5.07 5.12
1.5 31.4 4.87 4.76
2.0 20.4 4.50 3.84
Observing Tables 4.28 to 4.36 above, it could be said that the established relationships gave
very close estimate to the experimental values.
Page 145
145
4.15 Toughness of Steel Fibre Concrete
The change in flexural toughness was quantified using the toughness index
according to ASTM C 1018-97, (1998). The index is the area under the flexural test curve
and could be calculated using the expression I10 / I5, where I10 is the deflection at 10 kN and
I5 is the deflection at 5 kN. Using the above expression, the toughness indies for the
different types of fibres and at the different percentages investigated are presented in Table
4.37 to 4.39:
Table 4.37: Toughness Index for Steel Fibre Concrete Beam – CSF
Fibre Percentage
(%)
I10 I5 Toughness Index
0 0.105 0.053 1.981
0.5 0.105 0.053 1.981
1.0 0.105 0.053 1.981
1.5 0.105 0.053 1.981
2.0 0.104 0.0531 1.977
Table 4.38: Toughness Index for Steel Fibre Concrete Beam – RSF
Fibre Percentage
(%)
I10 I5 Toughness Index
0 0.105 0.053 1.981
0.5 0.110 0.054 2.037
1.0 0.108 0.055 1.964
1.5 0.108 0.054 2.00
2.0 0.112 0.054 2.074
Page 146
146
Table 4.39: Toughness Index for Steel Fibre Concrete Beam – CHSF
Fibre Percentage
(%)
I10 I5 Toughness Index
(J)
0 0.105 0.053 1.981
0.5 0.111 0.062 1.790
1.0 0.111 0.062 1.790
1.5 0.060 0.058 1.034
2.0 0.063 0.052 1.212
The toughness index values as shown above for the three fibres were insensitive to the fibre
dosage rate for circular steel fibres (CSF) and rectangular steel fibres (RSF), but chips steel
fibres (CHSF) was sensitive to increase in fibre dosage rate and at higher fibre dosage rate
the toughness decreases as shown in Table 4.39. The toughness index for CSF and RSF can
be said to be approximately 2.0 J. Where as that of chips steel fibre beam decreases with
increase in fibre dosage as earlier said from 1.981 to 1.212 with an average value of 1.56.
Thus, that of chip steel fibre is about 78 percent of circular and rectangular steel fibres.
From mere observation and feeling of the fibres, these values are true to some extent.
Page 147
147
CHAPTER FIVE
CONCLUSION AND RECOMMENDATION
5.1 Preambles
From the analyses and discussions in chapter four resulting from test results of
chapter three, the following conclusions and recommendations can be made.
5.2 Conclusions
1. The fine aggregate (sand) used in the research work is of well graded sand and
in zone two of the four zones of fine aggregate zones.
2. The coarse aggregate used is also well graded aggregates with nominal size of
38.5 millimeters.
3. The Dangote cement used satisfies all the standard requirements for Ordinary
Portland Cement and is good for concrete making.
4. Three types of fibres namely; Circular steel fibres, rectangular steel fibres and
chipping steel fibres were used for this research work. They were properly
cleaned and can be said to be a clean fibre materials.
5. The compressive strength of the mortar cubes increased uniformly with increase
in fibre dosage up to one and half percentage dosage, when different fibres
began to manifest different compressive strengths.
6. As from one and half percentage fibre dosage the compressive strength of
mortar cubes dropped except that of rectangular steel fibre which increased
slightly as the fibre dosage increased.
7. The dosage of one and half percentage of steel fibre is a critical dosage for
mortar compressive strength.
Page 148
148
8. The value of the steel fibre mortar flexural strength tends to stabilize towards a
value around 5 N/mm2 at one and half percentage dosage – the critical dosage.
9. The chips steel fibre (CHSF) showed the highest increase in flexural strength
and all strengths tend to converge at higher values above one and half
percentage dosage.
10. The three fibres used showed a decrease in slump value with an increase in steel
fibre dosage.
11. The chips steel fibre (CHSF) has lower values of slump when compared to the
rest two types of fibres.
12. The decrease in slump in the steel fibre concrete for all the three types of fibres
are as a result of stiff mixes and geometry of the various fibres.
13. Steel fibre concrete has lower workability than ordinary concrete.
14. There is generally a uniform decrease in compacting factor of steel fibre
concrete with an increase in fibre dosage.
15. The percentage decrease in compacting factor of steel fibre concrete can be up
to 20 percent with respect to chips steel fibre concrete as the dosage of fibre
increases.
16. One and half percentage fibre dosage was also a critical fibre dosage for steel
fibre concrete compressive strength.
17. All the three types of fibres used improved the tensile strength of concrete as the
fibre volume dosage increased.
18. The chips steel fibre (CHSF) concrete has higher tensile strength than
rectangular (RSF) and circular (CSF) steel fibre concrete.
Page 149
149
19. In tensile strength tests, the steel fibre concrete (all three types) gave warning
prior to failure but non-steel fibre concrete failed without warning.
20. One-half percentage fibre dosage is a critical point for steel fibre concrete
flexural strength.
21. There was a reduction in deflection of concrete beams (prism) as the fibre
dosage increased for in all the three types of fibre used.
22. The circular steel fibre concrete and the rectangular steel fibre concrete carried
more loads at higher fibre volume dosage than the chips steel fibre concrete at
the same beam deflection.
23. Fifteen equations estimating the 28- day strength of steel fibre mortar and
concrete specimens were generated. This accurately predicted the 28 – days
strength. It also predicted the deflection very well.
24. There are established relationships between the compressive strength of steel
fibre mortar and flexural strength of steel fibre mortar and relationships between
the compressive strength of concrete and tensile and flexural strengths of
concrete.
25. All the established relationships gave good estimate of the experimental results.
26. The toughness index was insensitive to the increase in fibre volume dosage rate
in circular and rectangular steel fibres, but toughness index decreased as the
fibre dosage increased in chips steel fibre (CHSF).
Page 150
150
5.3 Recommendations:
Based on the scope and the results of this study the following are recommended for
further research.
i. There is need to investigate the effect of chemical admixtures on the workability
of the fresh fibre reinforced concrete, which may reduce the problem of
workability at high fibre volume dosage.
ii. The combination of short steel fibres may tend to provide more efficient
mechanical properties of concrete. Further investigation should be carried out by
combination of different types of short steel fibres into mortar and concrete
mixes.
iii. To widen the use of fibre reinforced concrete, different or more complicated
geometry of fibres can be used to investigate the effects of the fibres on the
fresh and hardened concrete.
iv. The properties of fibre reinforced mortar and concrete may be different at
various temperatures. Test on freeze – thawing conditions are recommended.
v. Further confirmatory tests on the areas already investigated in this work should
be studied.
Page 151
151
REFERENCES
1. ACI Committee 544, (1993): “Guide for Specifying, Mixing, Placing, and Finishing
Steel Fibre Reinforced Concrete”, ACI Journal, Volume 81, Number 2, March-
April 1984, p.140-147.
2. Agarwal, B.D., Broutman, L.J., (1980) “Analysis and Performance of Fiber
Composites”, John Wiley & Sons, New York, 1980
3. Allen, H.G., “Glass-Fiber Reinforced Cement, Strength and Stiffness,” CIRIA
Report 55, September, 1975.
4. American Society for Testing and Materials, (1986) “Standard Method of Test for
Splitting Tensile Strength of Cylindrical Concrete Specimens” (ASTM C496-86),
Philadelphia.
5. ASTM C1018-97 (1998) “Standard Test Method for Flexural Toughness and First
Crack Strength of Fibre-Reinforced Concrete”, West Conshohocken, PA.
6. ASTM C78-94 (1998) “Standard Test Method for Flexural Strength of Concrete”,
West Conshohocken, PA.
7. ASTM C39-96 (1998) “Standard Test Method for Compressive Strength of
Cylindrical Concrete Specimens”, West Conshohocken, PA.
8. ASTM C192 (1998) “Standard Practice for Making and Curing Test Specimens in
the Laboratory”, West Conshohocken, PA.
9. Balaguru P.N. and Shah S.P., (1992). Fiber-Reinforced Cement Composites,
McGraw-Hill Inc., New York, United State of America.
Page 152
152
10. Banthia N. and Dubey A.,(2000). “Measurement of Flexural Toughness of Fibre-
Reinforced Concrete Using Technique – Part 2: Performance of Various
Composites”, ACI Materials Journal, Volume 97, Number 1.
11. Barros J.A.O. and Figueiras J.A., (1999). “Flexural Behaviour of SFRC: Testing
and Modeling”, Journal of Materials in Civil Engineering, Volume 11, Number 4,
November 1999, p.331-338.
12. Bentur A. and Mindess S., (1990). “Fibre Reinforced Cementitious Composites”,
Elsevier Science Publishing Ltd., New York, United State of America.
13. British Standard Institution, BS 812: Part 101, (1984). “Guide to Sampling and
Testing Aggregates” British Standard online at bsonlinetechindex.co.uk
14. British Standard Institution, BS 812: 103, (1985). “Methods for determination of
Particle Size Distribution”, British Standard online at bsonlinetechindex.co.uk
15 British Standard Institution, BS 12:, (1971). “Ordinary and Rapid Hardening
Portland Cement”, British Standard online at bsonlinetechindex.co.uk
16. British Standard Institution, BS 1881: 102, (1996). “Testing Concrete. Method for
Determination of Slump Test”, British Standard online at bsonlinetechindex.co.uk
17. British Standard Institution, BS 1881: 103, (1996). “Testing Concrete. Method for
Determination of Compacting Factor Test”, British Standard online at
bsonlinetechindex.co.uk
18. British Standard Institution, BS 1881: 108, (1996). “Testing Concrete. Method for
making Test Cubes from Fresh Concrete”, British Standard online at
bsonlinetechindex.co.uk
Page 153
153
19. British Standard Institution, BS 1881: 116, (1996). “Testing Concrete. Method for
Determination of Compressive Strength of Concrete Cubes”, British Standard
online at bsonlinetechindex.co.uk
20. British Standard Institution, BS 8110: 1, (1997). “Structural Use of Concrete Part 1:
Code of Practice for Design and Construction.” British Standard online at
bsonlinetechindex.co.uk
21. Chen L., Mindness S. and Morgan D. R., (1994). “Specimen Geometry and
Toughness of Steel-Fiber-Reinforced Concrete”, Journal of Material in Civil
Engineering, Volume 6, Number 4, February 1994, p.529-541.
22. Chen S., (2004). “Strength of Steel Fibre Reinforced Concrete Ground Slabs”,
Structures and Buildings, Issue SB2, April 2004, p.157-163.
23. Dunstan I. and Swamy R. N., (1986). “Fibre Reinforced Cement and Concrete:
Research into Practice”, Rilem Symposia FRC-86 Symposium.
24. Dwarakanath H.V. and Nagaraj T.S., (1991). “Comparative Study of Predictions of
Flexural Strength of Steel Fiber Concrete”, ACI Materials Journal, Volume 88,
Number 73.
25. Eldin, N. N., and Senouci, A. B., (1993) ‘‘Rubber-Tire Particles as Concrete
Aggregate.’’ Journal of Material in Civil Engineering, ASCE, 5(4), 478–496.
26. Elvery, R. H., and Samarai, M.A., “Reduction of Shrinkage Cracking in Reinforced
Concrete due to the Inclusion of Steel Fibers,” Fiber-reinforced Cement and
Concrete, RILEM Symposium, 1975, pp. 149-159.
27. Epps, J. A., (1994). ‘‘Uses of Recycled Rubber Tires in Highways’’ Synthesis of
Highway Practice 198, Transportation Research Board, National, 1994.
Page 154
154
28. Fibremesh, (1989). “Fibremesh Micro-Reinforcement System, Synthetic
Industries”, Fibremesh Division, TN, United State of America.
29. Ghugal Y.M. (2003). “Effects of Steel Fibres on various Strength of Concrete”,
Indian Concrete Institute Journal 4, 23 – 29.
30. Ghugal Y.M (2006). “Performance of Alkali – Resistant Glass Fibre Reinforced
Concrete”, Journal of Reinforced Plastics and Composites, 25, 617 – 630, SAGE
Publications, USA
31. Gupta P., Banthia N., and Yan C., (2000). “Fibre Reinforced Wet-Mix Shotcrete
under Impact”, Journal of Materials in Civil Engineering, Volume 12, Number 1,
February 2000, p.81-90.
32. Hoff, G. C., (1975). “The use of Fiber Reinforced Concrete in Hydraulic Structures
and Marine Environments,” Fiber reinforced Cement and Concrete, RILEM
Symposium, pp. 395-407, Construction Press Ltd.
33. James J. Beaudoin, (1990). “Handbook of Fibre-Reinforced Concrete: Principles,
Properties, Development and Applications”, Noyes Publications, New Jersey,
United State of America.
34. Johnston C. D., (1982). “Steel Fibre Reinforced and Plain Concrete: Factors
influencing Flexural Strength Measurement”, ACI Journal, Volume 79, Number
14, March-April 1982, p.131-138.
35. Johnston C. D. and Skarendahl A., (1992). “Comparative Flexural Performance
Evaluation of Steel Fibre-Reinforced Concretes According to ASTM C1018 shows
Importance of Fibre Parameters”, Materials and Structures, Volume 25, Number
148, May 1992, p.191-200
Page 155
155
36. Kesse, G.K. and Lees, J.M. (2007) "Experimental Behaviour of Reinforced
Concrete Beams Strengthened with Prestressed CFRP Shear Straps", ASCE Journal
of Composites for Construction
37. Lees J.M. (2001). "Fibre-reinforced Polymers in Reinforced and Prestressed
Concrete Applications: Moving Forward", Progress in Structural Engineering and
Materials, v. 3, no. 2, April/June, pp. 122-131. ISSN 1365-0556
38. Lees, J.M. and Burgoyne C.J. (2000). "Analysis of Concrete Beams with Partially-
Bonded Composite Reinforcement", ACI Structural Journal, v. 97, No. 2, March-
April, pp. 252-258. ISSN 0889-3241
39. Luo X., Sun W. and Chan S. Y. N., (2001). “Steel fibre Reinforced High
Performance Concrete: a Study on the Mechanical Properties and Resistance against
Impact”, Materials and Structures, Volume 34, Number 237, April 2001, p.144-
149.
40. Mailhot T., Bissonnette B., Saucier F. and Pigeon M., (2001). “Flexural Fatigue
Behaviour of Steel Fibre Reinforced Concrete before and after Cracking”,
Materials and Structures, Volume 34, Number 240, July 2001, p.351-359.
41. Mehta, P. K., and Monteiro, P. J. M.,(1993): “Concrete Structure, Properties, and
Materials”, 2ndEd., Prentice-Hall, Englewood Cliffs, N.J., 1993
42. Murdock L.J. and Blackledge G.F., (1968). “Concrete Materials and Practice”,
London EDWARD ARNOLD (Publishers) Ltd., N. Ireland.
Page 156
156
43. Nanni A., and ACSE, (1992). “Properties of Aramid-Fibre Reinforced Concrete and
SIFCON”, Journal of Materials in Civil Engineering, Volume 4, Number 1,
February 1992, p.1-13.
44. Nawy, E.G., (2001). “Fundamental of High Strength Performance Concrete”,
Second Eedition, John Wiley and Sons Inc, Canada.
45. Newman K., (1965). “Properties of concrete, Structural Concrete”, 2, No.11,
Sept/Oct, 1965, Reinforced Concrete Association.
46. Neville A.M., (1997). “Properties of Concrete”, John Wiley & sons Inc., New York,
United State of America.
47. NIS II (1974). “Specification for Cement”, Nigeria Industrial Standard, Federal
Ministry of Industries, Victoria Island, Lagos.
48. Novocon, (2000). “Synthetic Industries”, SI Concrete System, viewed 30 August
2005, <http://www.novocon.com>
49. Patton M. E. and Whittaker W. L., (1983). “Effects of Fibre Content and Damaging
Load on Steel Fibre Reinforced Concrete Stiffness”, ACI Journal, Volume 80,
Number 1, January-February 1983, p.13-16.
50. Perry B., (2003), “Reinforcing External Pavements with both Large and Small
Synthetic fibres”, Concrete online, September 2003, , p.46-47.
51. Rapoport, J, Aldea, C, Shah, S., Ankenman, B. and Karr, A., (2001): “Permeability
of cracked steel fibre-reinforced concrete”, Technical Report Number 115, National
Institute of Statistical Sciences, USA
52. Riley, V.R. and Reddaway, J.L., (1968). “Tensile Strength and Failure Mechanics
of Fibre Composites”, Journal of Materials Science.
Page 157
157
53. Romualdi J.P and Mandel J.A (1964). “Tensile Strength of Concrete Affected by
Uniformly Distributed Closely Spaced Short Lengths of Wire Reinforcement” ACI
Journal, Jun, Vol. 61, No. 6, pp. 657-671
54. Rossi P., Acker P. and Malier Y., (1987): “Effect of Steel Fibres at two different
stages: the Material and the Structure”, Materials and Structures, Volume 20, p.436-
439.
55. Sanjuan M.A., Andrade C, and Bentur A., (1998), “Effect of Polypropylene Fibre
Reinforced Mortars on Steel Reinforcement Corrosion Induced by Carbonation”,
Materials and Structures, Volume 31, Number 209, June 1998, p.343-349.
56. Sener S., Begimgil M. and Belgin C., (2002). “Size Effect on Failure of Concrete
Beams with and without Steel Fibers”, Journal of Materials in Civil Engineering,
Volume 14, Number 5, September-October 2002, p436-440.
57. Shah S. P,and Rangan B. V. (1970). “Effect of Reinforcement on Ductility of
Concrete”. Journal of Structural Engineering, Jun, Vol. 96, No. ST6, pp. 1167-1184.
58. Stang, H. (1992) “Evaluation of Properties of Cementitious Fiber Composite
Materials”, High Performance Fiber Reinforced Cement Composites, Vol. 1. (eds)
H.W. Reinhardt and A.E. Naaman. E & FN Spon, London, 1992. pp. 388–406.
59. Sullivan B.W., (2001)., “Part C: Concrete Technology”, CIV2605 Construction
Engineering, DEC, Toowoomba, Australia.
60. Swamy R.N. and Sa’ad A. Al-Ta’an, (1981). “Deformation and Ultimate Strength
in Flexure of Reinforced Concrete Beams Made with Steel Fibre Concrete”, ACI
Material, Volume 78, Number 5, September-October 1981, p.395-405.
Page 158
158
61. Synthetic Industries Concrete Company, (2000). “Synthetic Industries”, SI Concrete
System, viewed 30 August 2005, <http://www.novocon.com>
62. Tan K.H., Murugappan K., and Paramasivam P., (1993). “Shear Behavior of Steel
Fibre Reinforced Concrete Beams”, ACI Structural Journal, Volume 90, Number 1,
January- February 1993, p.3-11.
63. Tat-Seng Lok, ASCE, and Jin-Song Pei, (1998). “Flexural Behaviour of Steel Fibre
Reinforced Concrete”, Journal of Materials, Volume 10, Number 2, May 1998,
p.86- 97.
64. Trottier J. and Banthia N., (1994). “Toughness Characterization of Steel-Fiber
Reinforced Concrete”, Journal of Materials in Civil Engineering, Volume 6,
Number 2, May 1994, p.264-289.
65. Troxell G.E., Davis H.E. and Kelly J.W., (1968). “Composition and Properties Of
Concrete”, McGraw-Hill Inc., New York, United State of America.
66. U.S. Environmental Protection Agency et al,(1993). “Scrap Tire Technology and
Markets” Noyes Data Corporation, NJ 1993.
67. Wafa L and Nick E. (2004). “An Investigation into the Use of Fibres in Concrete
Industrial Ground-Floor Slabs”. School of the Build Environment, Liverpool John
Moores University, Liverpool,L3 3AF. [email protected]
68. Wang Y., Wu H. C. and Victor C. Li, (2000). “Concrete Reinforcement with
Fibres”, Journal of Materials in Civil Engineering, Volume 12, Number 4,
November 2000, p.314-319.
69. Vandewalle L., (2000). Cracking Behaviour of Concrete Beams Reinforced with
Combination of Ordinary Reinforcement and Steel Fibres, Materials and Structures,
Volume 33, Number 227, April 2000, p.164-170.
Page 159
159
70. Zaher, K. K., Bayomy, F. M., (1999). “Rubberized Portland Cement Concrete”
Journal of Materials in Civil Engineering, Vol. 11, No. 3, 1999, pp. 206-213.
APPENDICES
Page 160
160
APPENDIX 1: SAMPLE DETAILED CALCULATION OF QUANTITIES OF
MATERIALS FOR ONE MORTAR BEAM AND ONE CONCRETE BEAM
i) DETAILED CALCULATION OF QUANTITIES OF MATERIALS FOR
ONE MORTAR BEAM
Sample detailed calculation of quantities of materials for one mortar beam, at a prescribed
mix of one part cement to two parts sand (1:2) and a water cement ratio of 0.56.
The Dimensions of one beam are length = 700mm Width = 150mm and Depth = 150mm
Volume of beam = (700 X 150 X 150) X 10-9m3
= 15.75 X 10⁻³m3
Assuming a density of mortar = 2100 Kg m-3
Mass = Volume X Density.
Mass of one mortar beam = 15.75 X 10⁻³m3 X 2100 Kg m-3
= 33.075 Kg
Considering 10% shrinkage and waste
ie mass of one mortar beam = 33.075 + 33.075 x10/100
= 33.075 + 3.3075 = 36.45kg
Taking a mortar mix of 1:2 and a water cement ratio of 0.56 ie Total ratio = 3
Mass of cement = 1/3 X 36.45kg = 12.13kg
Mass of sand = 2/3 X 36.45kg = 24.26kg
Mass of water = 0.56 X 12.13kg = 6.063kg
Mass of steel fibre at 0.5% by fibre volume dosage for one mortar beam
Total volume of beam = 15.75 X 10⁻³m3
0.5% of total volume of beam = 15.75 X 10⁻³m3 X 0.5/100
Page 161
161
Mass of fibre at 0.5% = 15.75 X 10⁻³m3 X 0.5/100 X7.8 kg
= 0.61g
Mass of steel fibre at 1.0% by fibre volume dosage for one mortar beam
Total volume of beam = 15.75 X 10⁻³m3
1.0% of total volume of beam = 15.75 X 10⁻³m3 X 1.0/100
Mass of fibre at 0.5% = 15.75 X 10⁻³m3 X 1.0/100 X7.8 kg
= 1.23g
Mass of steel fibre at 1.50% by fibre volume dosage for one mortar beam
Total volume of beam = 15.75 X 10⁻³ m3
1.50% of total volume of beam = 15.75 X 10⁻³m3 X 1.5/100
Mass of fibre at 0.5% = 15.75 X 10⁻³ m3 X 1.5/100 X7.8 kg
= 1.84 g
Mass of steel fibre at 2.0% by fibre volume dosage for one mortar beam
Total volume of beam = 15.75 X 10⁻³ m3
2.0% of total volume of beam = 15.75 X 10⁻³m3 X 2.0/100
Mass of fibre at 0.5% = 15.75 X 10⁻³m3 X 2.0/100 X7.8 kg
= 2.46g
ii) DETAILED CALCULATION OF QUANTITIES OF MATERIALS FOR
ONE CONCRETE BEAM
Detailed calculation of quantities of materials for one concrete beam, at a prescribed mix of
one part cement to two parts sand to four parts coarse (1:2:4) and a water cement ratio of
0.60.
The Dimensions of one beam are length = 700mm Width = 150mm and Depth = 150mm
Page 162
162
Volume of beam = (700 X 150 X 150) X 10-9m3
= 15.75 X 10⁻³m3
Assuming a density of concrete = 2400 Kg m-3
Mass = Volume X Density.
Mass of one concrete beam = 15.75 X 10⁻³m3 X 2400 Kg m-3
= 37.80Kg
Considering 10% shrinkage and waste
ie mass of one concrete beam = 37.80 + 37.80 x10/100
= 37.80 + 3.78 = 41.58kg
Taking a concrete mix of 1:2:4 and water cement ratio of 0.60. Total ratio = 7
Mass of cement = 1/7 X 41.58kg = 5.94kg
Mass of sand = 2/7 X 41.58kg = 11.88kg
Mass of coarse = 4/7 X 41.58kg = 23.76kg
Mass of water = 0.60 X 5.94kg = 3.56kg
Mass of steel fibre at 0.5% fibre volume dosage for one concrete beam
Total volume of beam = 15.75 X 10⁻³m3
0.5% of total volume of beam = 15.75 X 10⁻³m3 X 0.5/100
Mass of steel fibre at 0.5% = 15.75 X 10⁻³m3 X 0.5/100 X 7.8 kg
= 0.61g
Mass of steel fibre at 1.0% by fibre volume dosage for one concrete beam
Total volume of beam = 15.75 X 10⁻³m3
1.0% of total volume of beam = 15.75 X 10⁻³m3 X 1.0/100
Mass of steel fibre at 1.0% = 15.75 X 10⁻³m3 X 1.0/100 X 7.8 kg
= 1.23g
Page 163
163
Mass of steel fibre at 1.5% by fibre volume dosage for one mortar beam
Total volume of beam = 15.75 X 10⁻³m3
1.50% of total volume of beam = 15.75 X 10⁻³m3 X 1.5/100
Mass of fibre at 0.5% = 15.75 X 10⁻³m3 X 1.5/100 X 7.8 kg
= 1.84g
Mass of steel fibre at 2.0% by fibre volume dosage for one mortar beam
Total volume of beam = 15.75 X 10⁻³m3
0.5% of total volume of beam = 15.75 X 10⁻³m3 X 2.0/100
Mass of fibre at 0.5% = 15.75 X 10⁻³m3 X 2.0/100 X 7.8 kg
= 2.46g
APPENDIX 2: - SIEVE ANALYSIS FOR FINE AGGREGATE SAMPLES:
TOTAL WEIGHT OF AGGREGATE: 1KG
Weight Retained (g)
Percentage Retained
Cumulative Percentage Passing
Cumulative Percentage Retained
BS
Sieve size
S1 S2 S3 S1 S2 S3 S1 S2 S3 S1 S2
4.75mm 20 40 60 2.0 4.0 6.0 98.0 96.0 94.0 2.0 4.0
2.36mm 95 120 250 9.5 12.0 25.0 88.5 84.0 69.0 11.5 6.0
1.18mm 210 60 100 21.0 6.0 10.0 67.5 78.0 59.0 32.5 22.0
600 µm 270 140 115 27.0 14.0 11.5 40.5 64.0 47.5 59.5 36.0
Page 164
164
300 µm 360 450 350 36.0 45.0 35.0 4.5 19.0 12.5 95.5 81.0
150µm 20 160 90 2.0 16.0 9.0 2.5 3.0 3.5 97.5 97.0
SAMPLE 1 (S1), SAMPLE 2 (S2) AND SAMPLE 3 (S3)
Page 165
165
APPENDIX 3: SIEVE ANALYSIS FOR COARSE AGGREGATE SAMPLES TOTAL WEIGHT OF AGGREGATE: 3KG
Weight Retained
(Kg)
Percentage Retained
Cumulative Percentage Passing
Cumulative Percentage Retained
BS
eve size (mm)
S1 S2 S3 S1 S2 S3 S1 S2 S3 S1 S2
38.1 - 0.1 - - 3.3 - 100 96.7 100 - 3.3
25.4 0.1 0.3 - 3.3 10.0 - 96.7 86.7 100 3.3 13.3
20.0 0.5 0.5 0.3 16.7 16.7 10.0 80.0 70.0 90.0 20.0 30.0
14.0 1.1 0.9 0.7 36.7 30.0 23.3 43.4 40.0 66.7 56.6 60.0
10.0 0.8 0.7 1.2 26.7 23.3 40.0 16.7 16.7 26.7 83.3 83.0
6.35 0.4 0.3 0.5 13.3 10.0 16.7 3.37 6.7 10.0 96.3 93.0
5.00 0.1 0.2 0.3 2.7 6.7 10.0 0.0 0.0 0.0 99.3 99.7
SAMPLE 1 (S1) SAMPLE2 (S2) AND SAMPLE3 (S3)
APPENDIX 4: CONSISTENCY TEST ON DANGOTE (OPC)
Value Property
Sample I Sample II Sample III Average
Normal Consistency (%) 33.5 35.0 35.0 34.5
Initial Setting Time (min) 99.0 94.0 74.0 89.0
Page 166
166
Final Setting Time (min) 149.0 139.0 156.0 148.0
Soundness (mm) 1.80 1.95 2.25 2
Specific Gravity 3.12 3.24 3.06 3.14
Page 167
167
APPENDIX 5: Compressive Strengths Test Results for Dangote cement
- (Mortar cubes) Compressive Strength of Specimen (N/mm2) at 28 days
(Volume of Cube = 3.375 X 10⁻³ m3 and Area of Cube = 22.5 X 10⁻³ m2)
Specimen I Specimen II Specimen III
Fibre
Percentage
(%)
Wt. of
Cube
(kg)
Density
(kg/m3)
Failure
Load
(kN)
Compr.
Strength
(N/mm2)
Wt.of
Cube
(kg)
Density
(kg/m3)
Failure
Load
(kN)
Compr.
Strength
(N/mm2)
Wt. of
Cube
(kg)
Density
(kg/m3)
Failure
Load
(kN)
Compr.
Strength
(N/mm2)
3 – days 7.19 2130.4 303.8 13.5 7.08 2097.8 348.8 15.5 7.04 2086.0 326.3 14.5
7- days 7.11 2106.7 477.0 21.2 7.16 2121.5 562.5 25.0 7.02 2080.0 596.3 26.5
28 – days 7.02 2080.0 585.0 26.0 7.13 2112.6 697.5 31.0 6.94 2056.3 573.8 25.5
Page 168
168
APPENDIX 6: Compressive Strengths Test Results for the Four Specimens
- CSF (Mortar cubes) Compressive Strength of Specimen (N/mm2) at 28 days
(Volume of Cube = 3.375 X 10⁻³ m3 and Area of Cube = 22.5 X 10⁻³ m2)
Specimen I Specimen II Specimen III Specimen IV
Percentage
Wt. of
Cube
(kg)
Density
(kg/m3)
Failure
Load
(kN)
Compr.
Strength
(N/mm2)
Wt.of
Cube
(kg)
Density
(kg/m3)
Failure
Load
(kN)
Compr.
Strength
(N/mm2)
Wt. of
Cube
(kg)
Density
(kg/m3)
Failure
Load
(kN)
Compr.
Strength
(N/mm2)
Wt. of
Cube
(kg)
Density
(kg/m3)
Failure
Load
(kN)
7.67 2272.6 618.8 27.5 7.33 2171.9 614.3 27.3 7.26 2151.1 623.30 27.7 7.23 2142.3 618.8
7.50 2222.3 639.0 28.4 7.20 2133.4 639.0 28.4 7.13 2112.6 636.75 28.3 7.21 2136.3 618.8
7.61 2254.8 657.0 29.2 7.31 2165.9 659.3 29.3 7.42 2198.5 659.25 29.3 7.42 2198.5 661.5
7.51 2225.2 733.50 32.6 7.24 2145.2 735.8 32.7 7.51 2225.2 740.25 32.9 7.60 2251.9 735.7
7.32 2168.9 670.5 29.8 7.62 2257.8 675 30.0 7.80 2311.1 672.75 29.9 7.91 2343.7 668.3
APPENDIX 7: Compressive Strengths Test Results for the Four Specimens
- RSF (Mortar cubes) Compressive Strength of Specimen (N/mm2) at 28 days
(Volume of Cube = 3.375 X 10⁻³ m3 and Area of Cube = 22.5 X 10⁻³ m2)
Specimen I Specimen II Specimen III Specimen IV
Percentage
Wt. of
Cube
(kg)
Density
(kg/m3)
Failure
Load
(kN)
Compr.
Strength
(N/mm2)
Wt.of
Cube
(kg)
Density
(kg/m3)
Failure
Load
(kN)
Compr.
Strength
(N/mm2)
Wt. of
Cube
(kg)
Density
(kg/m3)
Failure
Load
(kN)
Compr.
Strength
(N/mm2)
Wt. of
Cube
(kg)
Density
(kg/m3)
Failure
Load
(kN)
Page 169
169
7.67 2272.6 618.80 27.5 7.33 2171.9 614.3 27.3 7.26 2151.1 623.30 27.7 7.23 2142.3 618.8
7.51 2225.2 636.75 28.3 7.46 2210.4 636.65 28.3 7.46 2210.4 643.50 28.6 7.49 2219.3 641.25
7.51 2225.2 666.00 29.6 7.41 2195.6 663.75 29.5 7.71 2284.5 672.75 29.9 7.48 2216.3 686.25
7.59 2248.9 715.50 31.8 7.57 2242.9 681.75 30.3 7.69 2278.5 699.75 31.1 7.91 2343.7 690.75
8.02 2376.3 681.75 30.3 7.67 2272.6 708.75 31.5 7.92 2346.7 704.25 31.3 7.88 2334.8 70
APPENDIX 8: Compressive Strengths Test Results for the Four Specimens
- CHSF (Mortar cubes) Compressive Strength of Specimen (N/mm2) at 28 days
(Volume of Cube = 3.375 X 10⁻³ m3 and Area of Cube = 22.5 X 10⁻³ m2)
Specimen I Specimen II Specimen III Specimen IV
Percentage
Wt. of
Cube
(kg)
Density
(kg/m3)
Failure
Load
(kN)
Compr.
Strength
(N/mm2)
Wt.of
Cube
(kg)
Density
(kg/m3)
Failure
Load
(kN)
Compr.
Strength
(N/mm2)
Wt. of
Cube
(kg)
Density
(kg/m3)
Failure
Load
(kN)
Compr.
Strength
(N/mm2)
Wt. of
Cube
(kg)
Density
(kg/m3)
Failure
Load
(kN)
7.67 2272.6 618.80 27.5 7.33 2171.9 614.3 27.3 7.26 2151.1 623.30 27.7 7.23 2142.3 618.8
7.26 2151.1 632.25 28.1 6.95 2059.3 641.25 28.5 7.39 2189.7 650.25 28.9 7.04 2085.9 639.00
7.54 2234.1 657.00 29.2 7.21 2136.3 675.00 30.0 7.36 2180.8 679.50 30.2 7.14 2115.6 672.75
7.65 2266.7 744.75 33.1 7.36 2180.8 717.75 31.9 7.11 2106.7 751.50 33.4 7.02 2080.0 726,75
Page 170
170
7.74 2293.4 681.75 30.3 7.19 2130.4 681.75 30.3 7.30 2162.9 693.00 30.8 7.09 2100.8 684.00
Page 171
171
APPENDIX 9: Flexural Strengths Test Results for Three Specimens at each Fibre
Percentage
- CSF (Mortar Beams). Flexural Strength of Specimen (N/mm2) at 28 days
(Length of Beam =700mm, Width = 150mm and Depth = 150mm)
Specimen I Specimen II Specimen III
Fibre
Percentage
(%)
Wt. of
Beam (kg)
Density
(kg/m3)
Failure
Load
(kN)
Flexural.
Strength
(N/mm2)
Wt.of
Beam
(kg)
Density
(kg/m3)
Failure
Load (kN)
Flexural.
Strength
(N/mm2)
Wt. of
Beam
(kg)
Density
(kg/m3)
Failure
Load (kN)
0 35.6 2260.2 30.75 4.10 35.2 2234.9 24.75 3.30 35.8 2272.9 18.75
0.5 34.7 2203.1 33.75 4.50 35.6 2260.2 36.75 4.90 35.3 2241.2 31.50
1.0 35.7 2266.6 35.25 4.70 35.6 2260.2 34.50 4.60 35.7 2266.6 36.00
1.5 35.6 2260.2 35.18 4.69 35.8 2272.9 38.33 5.11 36.0 2285.6 37.58
2.0 35.7 2266.6 46.05 6.14 35.9 2279.3 35.40 4.72 36.4 2311.0 35.93
Page 172
172
APPENDIX 10: Flexural Strengths Test Results for Three Specimens at each Fibre Percentage
- RSF (Mortar Beams). Flexural Strength of Specimen (N/mm2) at 28 days
(Length of Beam =700mm, Width = 150mm and Depth = 150mm)
Specimen I Specimen II Specimen III
Fibre
Percentage
(%)
Wt. of
Beam (kg)
Density
(kg/m3)
Failure
Load
(kN)
Flexural.
Strength
(N/mm2)
Wt.of
Beam
(kg)
Density
(kg/m3)
Failure
Load
(kN)
Flexural.
Strength
(N/mm2)
Wt. of
Beam
(kg)
Density
(kg/m3)
Failure
Load (kN)
0 35.6 2260.2 30.75 4.10 35.2 2234.9 24.75 3.30 35.8 2272.9 18.75
0.5 35.3 2241.2 30.45 4.06 35.2 2234.9 31.05 4.14 35.0 2222.2 40.95
1.0 35.6 2260.2 34.73 4.63 35.5 2253.9 38.40 5.12 35.1 2228.5 30.75
1.5 35.9 2279.3 37.50 5.00 36.1 2292.0 37.65 5.02 35.6 2260.2 38.40
2.0 36.1 2292.0 37.43 4.99 36.5 2317.4 31.20 4.16 36.2 2298.3 50.25
Page 173
173
APPENDIX 11: Flexural Strengths Test Results for Three Specimens at each Fibre Percentage
- CHSF (Mortar Beams). Flexural Strength of Specimen (N/mm2) at 28 days
(Length of Beam =700mm, Width = 150mm and Depth = 150mm)
Specimen I Specimen II Specimen III
Fibre
Percentage
(%)
Wt. of
Beam (kg)
Density
(kg/m3)
Failure
Load
(kN)
Flexural.
Strength
(N/mm2)
Wt.of
Beam
(kg)
Density
(kg/m3)
Failure
Load (kN)
Flexural.
Strength
(N/mm2)
Wt. of
Beam
(kg)
Density
(kg/m3)
Failure
Load (kN)
0 35.6 2260.2 30.75 4.10 35.2 2234.9 24.75 3.30 35.8 2272.9 18.75
0.5 35.1 2228.5 31.92 4.56 35.5 2253.9 33.98 4.53 35.8 2272.9 44.03
1.0 34.8 2209.5 36.0 4.80 34.9 2215.8 54.30 7.24 35.4 2247.6 27.15
1.5 34.8 2209.5 39.15 5.22 34.6 2196.8 41.33 5.51 34.7 2203.1 37.58
2.0 34.2 2171.4 36.6 4.88 34.5 2190.4 44.55 5.94 34.3 2177.7 36.83
Page 174
174
APPENDIX 12: Slump Test Results for Three Samples - (CSF)
Sample I Sample II Sample III Fibre
Percentage
(%)
Height
of Cone
(mm)
Height of
Concrete
(mm)
Slump
(mm)
Height
of Cone
(mm)
Height of
Concrete
(mm)
Slump
(mm)
Height
of Cone
(mm)
Height of
Concrete
(mm)
Slump
(mm)
0 300 139 161 300 133 167 300 130 170
0.5 300 138 162 300 138 162 300 144 156
1.0 300 155 145 300 148 152 300 150 150
1.5 300 156 144 300 154 146 300 170 130
2.0 300 181 119 300 185 115 300 156 144
Page 175
175
APPENDIX 13: Slump Test Results for Three Samples - (RSF)
Sample I Sample II Sample III Fibre
Percentage
(%)
Height
of Cone
(mm)
Height of
Concrete
(mm)
Slump
(mm)
Height
of Cone
(mm)
Height of
Concrete
(mm)
Slump
(mm)
Height
of Cone
(mm)
Height of
Concrete
(mm)
Slump
(mm)
0 300 139 161 300 133 167 300 130 170
0.5 300 139 161 300 140 160 300 144 156
1.0 300 131 169 300 146 154 300 152 148
1.5 300 180 120 300 167 133 300 163 137
2.0 300 181 139 300 180 120 300 179 121
Page 176
176
APPENDIX 14: Slump Test Results for the Samples - (CHSF)
Sample I Sample II Sample III Fibre
Percentage
(%)
Height
of Cone
(mm)
Height of
Concrete
(mm)
Slump
(mm)
Height
of Cone
(mm)
Height of
Concrete
(mm)
Slump
(mm)
Height
of Cone
(mm)
Height of
Concrete
(mm)
Slump
(mm)
0 300 139 161 300 133 167 300 130 170
0.5 300 182 118 300 169 131 300 189 111
1.0 300 200 100 300 191 109 300 203 97
1.5 300 210 90 300 217 83 300 221 79
2.0 300 244 66 300 219 81 300 257 43
Page 177
177
APPENDIX 15: Compacting Factor Test Results for Three Samples - CSF.
Sample I Sample II Sample III Fibre
Percentage (%) Partially
Compacted
Mass
Fully
Compacted
Mass
Partially
Compacted
Mass
Fully
Compacted
Mass
Partially
Compacted
Mass
Fully
Compacted
Mass
0 21.00 21.24 21.39 21.43 20.88 20.92
0.5 19.28 19.92 19.31 19.93 19.42 20.61
1.0 18.99 20.33 20.04 21.23 19.34 20.53
1.5 19.19 21.04 19.28 21.54 19.88 21.54
2.0 18.54 20.85 17.21 19.98 18.31 20.59
Page 178
178
APPENDIX 16: Compacting Factor Test Results for Three Samples - RSF.
Sample I Sample II Sample III Fibre Percentage
(%) Partially
Compacted
Mass
Fully
Compacted
Mass
Partially
Compacted
Mass
Fully
Compacted
Mass
Partially
Compacted
Mass
Fully
Compacted
Mass
0 21.00 21.24 21.39 21.43 20.88 20.92
0.5 20.53 20.91 19.38 19.77 19.63 19.83
1.0 20.82 21.22 20.75 21.19 21.60 22.04
1.5 19.08 20.34 18.93 20.14 19.62 20.83
2.0 17.96 20.25 18.45 20.71 18.64 20.76
Page 179
179
APPENDIX 17: Compacting Factor Test Results for Three Samples - CHSF. Sample I Sample II Sample III Fibre Percentage
(%) Partially
Compacted
Mass
Fully
Compacted
Mass
Partially
Compacted
Mass
Fully
Compacted
Mass
Partially
Compacted
Mass
Fully
Compacted
Mass
0 21.00 21.24 21.39 21.43 20.88 20.92
0.5 19.60 21.44 18.56 20.83 18.70 20.82
1.0 18.93 21.13 18.65 20.84 18.17 20.93
1.5 17.40 20.81 17.19 20.71 16.92 20.61
2.0 16.16 20.23 16.50 20.68 16.48 20.44
Page 180
180
APPENDIX 18: Compressive Strengths Test Results for the Four Specimens
- CSF (Concrete cubes) Compressive Strength of Specimen (N/mm2) at 28 days
(Volume of Cube = 3.375 X 10⁻³ m3 and Area of Cube = 22.5 X 10⁻³ m2)
Specimen I Specimen II Specimen III Specimen IV
Percentage
Wt. of
Cube
(kg)
Density
(kg/m3)
Failure
Load
(kN)
Compr.
Strength
(N/mm2)
Wt.of
Cube
(kg)
Density
(kg/m3)
Failure
Load
(kN)
Compr.
Strength
(N/mm2)
Wt. of
Cube
(kg)
Density
(kg/m3)
Failure
Load
(kN)
Compr.
Strength
(N/mm2)
Wt. of
Cube
(kg)
Density
(kg/m3)
Failure
Load
(kN)
8.00 2370.4 756.00 33.6 7.68 2275.6 765.00 34.0 7.91 2343.7 760.5 33.8 8.02 2376.3 749.25
8.13 2408.9 774.00 34.4 8.21 2432.6 774.00 34.4 8.03 2379.3 774.00 34.4 8.17 2420.8 771.75
8.22 2435.6 904.50 40.2 8.37 2480.0 906.75 40.3 8.29 2456.3 909.00 40.4 8.10 2400.0 913.5
8.50 2518.6 972.00 43.2 8.53 2527.4 981.00 43.6 8.63 2557.1 929.25 41.3 8.18 2423.7 965.25
8.66 2565.9 1077.8 47.9 8.64 2560.0 1068.8 47.5 9.01 2669.7 1082.3 48.1 8.50 2518.6 1071.0
Page 181
181
APPENDIX 19: Compressive Strengths Test Results for the Four Specimens
- RSF (Concrete cubes) Compressive Strength of Specimen (N/mm2) at 28 days
(Volume of Cube = 3.375 X 10⁻³ m3 and Area of Cube = 22.5 X 10⁻³ m2)
Specimen I Specimen II Specimen III Specimen IV
Percentage
Wt. of
Cube
(kg)
Density
(kg/m3)
Failure
Load
(kN)
Compr.
Strength
(N/mm2)
Wt.of
Cube
(kg)
Density
(kg/m3)
Failure
Load
(kN)
Compr.
Strength
(N/mm2)
Wt. of
Cube
(kg)
Density
(kg/m3)
Failure
Load
(kN)
Compr.
Strength
(N/mm2)
Wt. of
Cube
(kg)
Density
(kg/m3)
Failure
Load
(kN)
8.00 2370.4 756.00 33.6 7.68 2275.6 765.00 34.0 7.91 2343.7 760.5 33.8 8.02 2376.3 749.25
7.99 2367.4 778.50 34.6 8.22 2435.6 769.50 34.2 8.25 2444.5 762.75 33.9 8.04 2382.3 765.00
8.03 2379.3 868.5 38.6 8.57 2539.3 873.00 38.8 8.45 2503.7 915.75 40.7 8.22 2435.6 922.5
8.63 2557.1 956.25 42.5 8.89 2634.1 924.75 41.1 8.65 2562.9 938.25 41.7 8.34 2471.1 960.75
8.95 2651.9 1012.5 45.0 8.59 2545.2 994.50 44.2 8.53 2527.4 992.25 44.1 8.39 2485.9 996.75
Page 182
182
APPENDIX 20: Compressive Strengths Test Results for Four Specimens at
each Fibre Percentage
- CHSF (Concrete cubes) Compressive Strength of Specimen (N/mm2) at 28 days
(Volume of Cube = 3.375 X 10⁻³ m3 and Area of Cube = 22.5 X 10⁻³ m2)
Specimen I Specimen II Specimen III Specimen IV
Percentage
Wt. of
Cube
(kg)
Density
(kg/m3)
Failure
Load
(kN)
Compr.
Strength
(N/mm2)
Wt.of
Cube
(kg)
Density
(kg/m3)
Failure
Load
(kN)
Compr.
Strength
(N/mm2)
Wt. of
Cube
(kg)
Density
(kg/m3)
Failure
Load
(kN)
Compr.
Strength
(N/mm2)
Wt. of
Cube
(kg)
Density
(kg/m3)
Failure
Load
(kN)
8.00 2370.4 756.00 33.6 7.68 2275.6 765.00 34.0 7.91 2343.7 760.50 33.8 8.02 2376.3 749.25
7.74 2293.4 774.00 34.4 7.87 2331.9 756.00 33.6 8.23 2438.5 785.25 34.9 7.88 2334.8 810.00
8.11 2402.9 785.25 34.9 8.09 2397.1 801.00 35.6 8.34 2471.1 798.75 35.5 8.20 2429.7 834.75
7.89 2337.80 726.75 32.3 7.90 2340.77 729.00 32.4 8.03 2379.89 697.50 31.0 8.04 2382.25 679.50
8.04 2382.3 454.5 20.2 7.88 2334.84 479.25 21.3 7.92 2346.70 474.75 21.1 7.96 2358.55 454.50
Page 183
183
APPENDIX 21: Tensile Strengths Test Results for Three Specimens at each Fibre
Percentage
- CSF (Concrete Cylinders). Tensile Strengths of Specimen (N/mm2) at 28 days
(Diameter of Cylinder =150mm, Height of Cylinder = 300mm)
Specimen I Specimen II Specimen III
Fibre
Percentage
(%)
Wt. of
Cylinder
(kg)
Density
(kg/m3)
Failure
Load
(kN)
Tensile
Strength
(N/mm2)
Wt.of
Cylinder
(kg)
Density
(kg/m3)
Failure
Load (kN)
Tensile
Strength
(N/mm2)
Wt. of
Cylinder
(kg)
Density
(kg/m3)
Failure
Load (kN)
0 12.2 2302.1 178.7 2.53 12.3 2321.0 213.3 3.02 12.2 2302.1 200.7
0.5 11.9 2245.5 218.3 3.09 12.4 2339.9 358.9 5.08 12.6 2377.6 264.2
1.0 12.4 2339.9 348.3 4.93 12.4 2339.9 244.5 3.46 12.3 2321.0 344.1
1.5 12.5 2264.4 320.1 4.53 12.3 22321.0 299.6 4.24 12.8 2415.4 308.7
2.0 12.4 2339.9 299.6 4.24 12.5 2264.4 320.8 4.54 13.1 2471.9 253.6
APPENDIX 22: Tensile Strengths Test Results for Three Specimens at each Fibre
Percentage
- RSF (Concrete Cylinders). Tensile Strengths of Specimen (N/mm2) at 28 days
(Diameter of Cylinder =150mm, Height of Cylinder = 300mm)
Specimen I Specimen II Specimen III
Fibre
Percentage
(%)
Wt. of
Cylinder
(kg)
Density
(kg/m3)
Failure
Load
(kN)
Tensile
Strength
(N/mm2)
Wt.of
Cylinder
(kg)
Density
(kg/m3)
Failure
Load (kN)
Tensile
Strength
(N/mm2)
Wt. of
Cylinder
(kg)
Density
(kg/m3)
Failure
Load (kN)
Page 184
184
0 12.2 2302.1 178.7 2.53 12.3 2321.0 213.4 3.02 12.2 2302.1 200.7
0.5 12.4 2339.9 229.6 3.25 12.1 2283.3 315.8 4.47 12.4 2339.9 185.1
1.0 12.2 2302.1 315.8 4.47 12.4 2339.9 316.5 4.48 12.4 2339.9 304.5
1.5 12.4 2339.9 228.2 3.23 12.9 2434.2 295.3 4.18 12.5 2264.4 298.1
2.0 12.8 2415.4 286.1 4.05 13.2 2490.8 285.4 4.04 13.0 2453.1 335.6
Page 185
185
APPENDIX 23: Tensile Strengths Test Results for Three Specimens at each Fibre
Percentage
- CHSF (Concrete Cylinders).
Tensile Strengths of Specimen (N/mm2) at 28 days
(Diameter of Cylinder =150mm, Height of Cylinder = 300mm)
Specimen I Specimen II Specimen III
Fibre
Percentage
(%)
Wt. of
Cylinder
(kg)
Density
(kg/m3)
Failure
Load
(kN)
Tensile
Strength
(N/mm2)
Wt.of
Cylinder
(kg)
Density
(kg/m3)
Failure
Load (kN) Tensile
Strength
(N/mm2)
Wt. of
Cylinder
(kg)
Density
(kg/m3)
Failure
Load (kN)
0 12.2 2302.1 178.7 2.53 12.3 2321.0 213.4 3.02 12.2 2302.1 200.7
0.5 12.2 2302.1 286.1 4.05 12.4 2339.9 276.2 3.91 12.3 2321.0 240.2
1.0 12.5 2264.4 340.5 4.82 12.6 2377.6 303.1 4.29 12.7 2396.5 287.6
1.5 12.1 2283.3 325.0 4.60 12.3 2321.0 262.1 3.71 12.6 2377.6 347.6
2.0 12.2 2302.1 356.1 5.04 12.1 2283.3 343.4 4.86 12.2 2302.1 371.6
Page 186
186
APPENDIX 24: Flexural Strengths Test Results for Three Specimens at each Fibre
Percentage
- CSF (Concrete Beams). Flexural Strength of Specimen (N/mm2) at 28 days
(Length of Beam =700mm, Width = 150mm and Depth = 150mm)
Specimen I Specimen II Specimen III
Fibre
Percentage
(%)
Wt. of
Beam (kg)
Density
(kg/m3)
Failure
Load
(kN)
Flexural.
Strength
(N/mm2)
Wt.of
Beam
(kg)
Density
(kg/m3)
Failure
Load (kN)
Flexural.
Strength
(N/mm2)
Wt. of
Beam (kg)
Density
(kg/m3)
Failure
Load (kN)
0 37.2 2361.8 27.15 3.62 37.1 2355.5 30.00 4.00 37.0 2349.1 31.50
0.5 37.3 2368.2 36.30 4.84 37.3 2368.2 48.60 6.48 37.4 2374.5 29.85
1.0 37.7 2393.6 44.55 5.94 37.5 2380.9 33.68 4.49 37.0 2349.1 41.70
1.5 37.4 2374.5 38.33 5.11 37.7 2393.6 39.45 5.26 36.9 2342.8 45.30
2.0 37.9 2406.3 43.65 5.82 38.2 2425.3 41.93 5.59 37.6 2387.2 42.00
Page 187
187
APPENDIX 25: Flexural Strengths Test Results for Three Specimens at each Fibre Percentage
- RSF (Concrete Beams). Flexural Strength of Specimen (N/mm2) at 28 days
(Length of Beam =700mm, Width = 150mm and Depth = 150mm)
Specimen I Specimen II Specimen III
Fibre
Percentage
(%)
Wt. of
Beam (kg)
Density
(kg/m3)
Failure
Load
(kN)
Flexural.
Strength
(N/mm2)
Wt.of
Beam
(kg)
Density
(kg/m3)
Failure
Load (kN)
Flexural.
Strength
(N/mm2)
Wt. of
Beam
(kg)
Density
(kg/m3)
Failure
Load (kN)
0 37.2 2361.8 27.15 3.62 37.1 2355.5 30.00 4.00 37.0 2349.1 31.50
0.5 36.9 2342.8 37.05 4.94 37.4 2374.5 39.60 5.28 37.1 2355.5 38.78
1.0 37.4 2374.5 36.90 4.92 37.2 2361.8 39.00 5.20 37.5 2380.9 35.93
1.5 37.8 2399.9 43.95 5.86 37.5 2380.9 40.58 5.41 38.0 2412.6 36.98
2.0 37.9 2406.3 47.85 6.38 38.0 2412.6 46.20 6.16 38.1 2418.9 48.38
APPENDIX 26: Flexural Strengths Test Results for Three Specimens at each Fibre
Percentage
- CHSF (Concrete Beams). Flexural Strength of Specimen (N/mm2) at 28 days
(Length of Beam =700mm, Width = 150mm and Depth = 150mm)
Specimen I Specimen II Specimen III
Fibre
Percentage
(%)
Wt. of
Beam (kg)
Density
(kg/m3)
Failure
Load
(kN)
Flexural.
Strength
(N/mm2)
Wt.of
Beam
(kg)
Density
(kg/m3)
Failure
Load (kN)
Flexural.
Strength
(N/mm2)
Wt. of
Beam
(kg)
Density
(kg/m3)
Failure
Load (kN)
0 37.2 2361.8 27.15 3.62 37.1 2355.5 30.00 4.00 37.0 2349.1 31.50
Page 188
188
0.5 36.9 2342.8 40.65 5.42 36.9 2342.8 45.75 6.10 37.0 2349.1 36.68
1.0 37.3 2368.2 36.08 4.81 37.2 2361.8 41.18 5.49 37,5 2380.9 36.83
1.5 36.8 2336.4 42.08 5.61 36.6 2323.7 51.45 6.86 36.9 2342.8 38.55
2.0 37.0 2349.1 40.13 5.35 36.6 2323.7 45.68 6.09 36.8 2336.4 37.95
Page 189
189
APPENDIX 27: Load (kN)/ Deflection (mm) for Circular Steel Fibre (CSF) Load (kN)/ Deflection (mm) CSF Fibre Percentage
(%) 0 5 10 15 20 25 30 35 40 45 50 55 60
0.0532 0.098 0.170 0.237 0.251 0.313 0.362 0.374 - - - -
0.0528 0.112 0.167 0.242 0.266 0.320 0.372 0.379 - - - -
0
0
0.0530 0.105 0.167 0.232 0.293 0.315 0.370 0.378 - - - -
0.0552 0.106 0.236 0.319 0.340 0.348 0.354 - - - - -
0.0540 0.104 0.238 0.313 0.339 0.352 0.372 - - - - -
0.5
0
0.0498 0.105 0.237 0.318 0.343 0.356 0.360 - - - - -
0.0536 0.106 0.212 0.268 0.297 0.371 0.404 0.474 - - - -
0.053 0.103 0.211 0.262 0.305 0.367 0.401 0.476 - - - -
1.0
0
0.0524 0.106 0.207 0.259 0.301 0.366 0.395 0.472 - - - -
0.0525 0.101 0.239 0.271 0.284 0.320 0.343 0.371 0.436 0.525 0.631 -
0.0540 0.099 0.237 0.267 0.294 0.316 0.339 0.370 0.428 0.523 0.627 -
1.5
0
0.0528 0.112 0.235 0.272 0.295 0.309 0.344 0.363 0.432 0.530 0.638 -
0.0529 0.101 0.150 0.213 0.289 0.318 0.339 0.369 0.397 0.502 0.616 0.745
0.0534 0.105 0.142 0.216 0.287 0.310 0.336 0.368 0.402 0.499 0.614 0.734
2.0
0
0.0530 0.106 0.149 0.201 0.285 0.305 0.351 0.367 0.404 0.505 0.600 0.747
APPENDIX 28: Load (kN)/ Deflection (mm) for Rectangular Steel Fibre (RSF)
Load (kN)/ Deflection (mm)RSF Fibre
Percentage
(%)
0
5
10
15
20
25
30
35
40
45
50
55
60
0.0532 0.098 0.170 0.237 0.251 0.313 0.362 0.374 - - - -
0.0528 0.112 0.167 0.242 0.266 0.320 0.372 0.379 - - - -
0
0
0.0530 0.105 0.167 0.232 0.293 0.315 0.370 0.378 - - - -
0.056 0.106 0.235 0.321 0.340 0.359 0.370 - - - - -
0.5
0 0.057 0.104 0.235 0.315 0.329 0.353 0.367 - - - - -
Page 190
190
0.049 0.120 0.238 0.312 0.333 0.353 0.361 - - - - -
0.056 0.108 0.208 0.253 0.304 0.310 0.416 0.462 - - - -
0.049 0.107 0.211 0.252 0.302 0.304 0.403 0.431 - - - -
1.0
0
0.060 0.109 0.211 0.251 0.312 0.310 0.420 0.460 - - - -
0.052 0.110 0.234 0.268 0.294 0.329 0.342 0.365 0.498 0.532 0.674 -
0.056 0.106 0.238 0.264 0.269 0.328 0.358 0.376 0.504 0.528 0.659 -
1.5
0
0.054 0.108 0.242 0.275 0.307 0.330 0.350 0.366 0.498 0.524 0.668 -
0.053 0.109 0.131 0.192 0.291 0.330 0.343 0.389 0.411 0.499 0.580 0.734
0.049 0.116 0.133 0.208 0.300 0.341 0.338 0.389 0.411 0.494 0.581 0.734
2.0
0
0.060 0.111 0.123 0.200 0.282 0.320 0.348 0.388 0.408 0.502 0.579 0.722
APPENDIX 29: Load (kN)/ Deflection (mm) for Chips Steel Fibre (CHSF)
Load (kN)/ Deflection (mm) CHSF Fibre Percentage
(%) 0 5 10 15 20 25 30 35 40 45 50 55 60
0.0532 0.098 0.170 0.237 0.251 0.313 0.362 0.374 - - -
0.0528 0.112 0.167 0.242 0.266 0.320 0.372 0.379 - - -
0
0
0.0530 0.105 0.167 0.232 0.293 0.315 0.370 0.378 - - -
0.062 0.109 0.181 0.189 0.247 0.312 0.324 0.335 0.436 - - -
0.067 0.110 0.172 0.194 0.248 0.307 0.319 0.350 0.430 - - -
0.5
0
0.057 0.114 0.181 0.190 0.252 0.308 0.320 0.341 0.430 - - -
0.064 0.113 0.174 0.249 0.250 0.325 0.402 0.418 - - - -
0.064 0.109 0.181 0.246 0.249 0.327 0.391 0.422 - - - -
1.0
0
0.058 0.111 0.179 0.246 0.248 0.326 0.410 0.420 - - - -
0.059 0.060 0.078 0.114 0.156 0.179 0.269 0.274 - - - -
0.054 0.061 0.075 0.109 0.151 0.187 0.271 0.279 - - - -
1.5
0
0.061 0.059 0.069 0.110 0.155 0.189 0.267 0.281 - - - -
0.053 0.060 0.071 0.096 0.148 0.181 0.258 0.261 - - - -
2.0
0 0.057 0.065 0.071 0.109 0.149 0.178 0.259 0.260 - - - -
Page 191
191
0.049 0.064 0.068 0.092 0.150 0.175 0.266 0.259 - - - -
APPENDIX 30: Compressive Strengths Test Results for Confirmation
Specimens at each Fibre Percentage
- CHSF (Concrete Cubes) Compressive Strength of Specimen (N/mm2) at 28 days
(Volume of Cube = 3.375 X 10⁻³ m3 and Area of Cube = 22.5 X 10⁻³ m2)
Specimen I Specimen II Specimen III Specimen IV
Percentage
Wt. of
Cube
(kg)
Density
(kg/m3)
Failure
Load
(kN)
Compr.
Strength
(N/mm2)
Wt.of
Cube
(kg)
Density
(kg/m3)
Failure
Load
(kN)
Compr.
Strength
(N/mm2)
Wt. of
Cube
(kg)
Density
(kg/m3)
Failure
Load
(kN)
Compr.
Strength
(N/mm2)
Wt. of
Cube
(kg)
Density
(kg/m3)
Failure
Load
(kN)
7.42 2198.6 753.8 33.5 8.11 2402.9 742.5 33.0 7.76 2299.3 760.5 33.8 7.95 2355.6 774.0
7.32 2168.9 792.0 35.2 8.04 2382.3 805.5 35.8 7.81 2314.1 774.0 34.4 7.23 2142.3 798.8
8.15 2414.9 821.3 36.5 7.94 2352.6 794.3 35.3 7.32 2168.9 805.5 35.8 7.43 2201.5 794.3
7.80 2311.1 857.3 38.1 7.58 2245.9 810.0 36.0 7.35 2177.8 828.0 36.8 7.90 2340.8 821.3
7.50 2222.3 675.0 30.0 7.15 2118.6 690.8 30.7 7.05 2088.9 672.8 29.9 6.90 2044.5 661.5
7.12 2109.7 436.5 19.4 6.87 2035.6 533.3 23.7 - - - - - -
- - - - 6.89 2041.5 463.50 20.6 - - - - - -
- - - - - - - - - - - - - -
Compressive Strengths Test Results for Confirmation Specimens at each Fibre
Percentage
- CHSF (Concrete Cubes) Compressive Strength of Specimen (N/mm2) at 28 days
(Volume of Cube = 3.375 X 10⁻³ m3 and Area of Cube = 22.5 X 10⁻³ m2) Percentage
Specimen V Specimen VI Specimen VII Specimen VIII
Page 192
192
Wt. of
Cube
(kg)
Density
(kg/m3)
Failure
Load
(kN)
Compr.
Strength
(N/mm2)
Wt.of
Cube
(kg)
Density
(kg/m3)
Failure
Load
(kN)
Compr.
Strength
(N/mm2)
Wt. of
Cube
(kg)
Density
(kg/m3)
Failure
Load
(kN)
Compr.
Strength
(N/mm2)
Wt. of
Cube
(kg)
Density
(kg/m3)
Failure
Load
(kN)
8.01 2373.7 546.8 34.3 7.65 2266.7 778.5 34.6 7.64 2263.7 733.5 32.6 7.90 2340.8 751.5
7.54 2234.4 828.0 36.8 7.90 2340.8 814.5 36.2 7.73 2290.4 807.8 35.9 7.34 2174.8 769.5
7.42 2198.6 828.0 36.8 7.85 2326.0 807.8 35.9 7.41 2195.6 850.5 37.8 7.20 2133.4 760.5
7.21 2136.3 796.5 35.4 7.23 2142.3 821.3 36.5 7.62 2257.8 801.0 35.6 7.42 2198.6 780.8
7.40 2192.6 693.0 30.8 6.98 2068.2 697.5 31.0 7.95 2355.6 675.0 30.0 7.05 2088.9 670.5
- - - - - - - - 6.45 1911.1 387.0 17.2 6.55 1940.8 452.3
- - - - 6.05 1792.6 369.0 16.4 - - - - 6.05 1792.6 416.3
- - - - - - - - - - - - - -
ANIMAL
SILK WOOL HAIR
FIBRES
NATURAL MAN-MADE
VEGTABLE MINERAL ASBESTOS
BAST Flax Jute kenaf
LEAF abaca sisal
cantala
SEED& FRUIT cotton kapok coir
NATURAL REGENERATED POLYMER
SYNTHETHIC POLYMER
ALGNATE REGENERATED CELULOSE
NATURAL RUBBER
CELULOSE ESTER
POLYVINYLL
POLYOLEFIN POLYCARBONATE POLYAMIDE
Page 193
193
FIGURE 2,1 Classification of Fibres
POLYURETHANE
POLYESTER
SYNTHETIC POLYISOPRENE
POLYCARBAMIDE
POLYACRYLONITRILE
POLYVINYL CHLORIDE
POLLYVINYLIDENE DINITRILE
POLYVINYL ALCOHOL
POLYSTRYENE MISCELLENOUS
POLYTETRAFLUOROETHLYNE AND RELATED POLYMERS