60
Properties of Thermistors Used in Geothermal Investigations and Preparation of Thermistor Cables Used in Geothermal Investigations GEOLOGICAL SURVEY BULLETIN 1203-B, C

Properties of Thermistors Used in Geothermal Investigations andPreparation of Thermistor Cables Used in Geothermal Investigations
GEOLOGICAL SURVEY BULLETIN 1203-B, C


.loo)
Properties of Thermistors Used in Geothermal InvestigationsBy EUGENE C. ROBERTSON, RUDOLPH RASPET, JOEL H. SWARTZ, and MAJOR E. LILLARD
Preparation of Thermistor Cables Used in Geothermal InvestigationsBy RUDOLPH RASPET, JOEL H. SWARTZ, MAJOR E. LILLARD, and EUGENE C. ROBERTSON
EXPERIMENTAL AND THEORETICAL GEOPHYSICS
GEOLOGICAL SURVEY BULLETIN 1203-B,C
UNITED STATES GOVERNMENT PRINTING OFFICE, WASHINGTON : 1966

UNITED STATES DEPARTMENT OF THE INTERIOR
STEWART L. UDALL, Secretary
GEOLOGICAL SURVEY
William T. Pecora, Director
For sale by the Superintendent of Documents, U.S. Government Printing Office Washington, D.C. 20402 - Price 25 cents (paper cover)

Properties of Thermistors Used in Geothermal InvestigationsBy EUGENE C. ROBERTSON, RUDOLPH RASPET, JOEL H. SWARTZ, and MAJOR E. LILLARD
EXPERIMENTAL AND THEORETICAL GEOPHYSICS
GEOLOGICAL SURVEY BULLETIN 1203-B
A study of the precision, sensitivity, and stability of thermistors in temperature measurement


CONTENTS
PageAbstract_ ________-________-___-___________________--__---_--___- BlIntroduction. _____________________________________________________ 2Characteristics of thermistors_____________---______----_--------__-- 4
Manufacture. _________________________________________________ 4Dependence of resistance on temperature.________________________ 6Dependence of resistance on pressure___________________________ 9
Temperature measurements with thermistors________________________ 10Precision of measurement_____________________________________ 10Temperature of ice baths for thermistor cables____________________ 12
Thermistor stability.______________________________________________ 14Drift of thermistors in cables_________________________-_--_------ 14Laboratory studies of thermistor drift___-___________-----_-_---_- 19Drift of thermistors held at constant temperature ___-_____---__-- 21Drift rates at various temperatures_________________---------___- 22Possible explanations of thermistor drift.__________________---__-- 23
Simplified method for conversion of resistance to temperature.__________ 26References _ _____________________________________________________ 32
ILLUSTRATIONS
FIGURE 1. Log resistance versus temperature for a thermistor of No. 1
2. Graph of change in mean apparent temperature of thermistor cables against time between ice-point calibrations.-- ______
3. Histogram of thermistor drift. ____________________________4. Graph of drift rates of seven thermistors. __________________5. Graph showing parallelism and approximate range of curves of
log resistance versus reciprocal temperature for type-17A thermistors. __________________________________________
Page
B8
151824
27
TABLES
Page TABLE 1. Interpolation errors in four equations for temperature-resistance
relations of thermistors.________________________________ B72. Pressure coefficients of resistance of thermistors at several tem-
peratures______________________________________________ 93. Statistical summary of resistances at the ice point of five therm
istors and a platinum thermometer_______________________ 11
m

IV CONTENTS
PageTABLE 4. Temperature of ice baths measured with a platinum ther
mometer, and pertinent data for 28 thermistor cables-________ B135. Drift at the ice point of 411 thermistors in 15 cables._________ 166. Summary of nine thermistor-stability studies.--_____________ 207. Mean drift rates of seven thermistors at five temperatures over
a 13-year period_________________________________ _ 238. Master table for conversion of thermistor resistance to tem
perature.._______________ ______________________ 289. Determination of temperature corrections for thermistor 4550__ 31

EXPERIMENTAL AND THEORETICAL GEOPHYSICS
PROPERTIES OF THERMISTORS USED IN GEOTHERMALINVESTIGATIONS
By EUGENE C. KOBERTSON, KUDOLPH KASPET, JOEL H. SWARTZ, andMAJOR E. LILLARD
ABSTRACT
Thermistors are small rugged beads, disks, or rods of sintered oxides, which can be used to measure temperature with a precision of ±0.01°C with a simple four-dial Wheatstone bridge. Thermistors of number 1 material have a spinel crystal structure, the approximate formula being Ni0 .6Mn^4Mn+2O4. Thermistors of this material generally are used in temperature sensing, and those with a nominal resistance of 1,000 ohms at 20°C have a negative temperature coefficient of resist ance of about 5 percent per deg C at that temperature. Most thermistors differ in resistance and in change of resistance with temperature and so are not inter changeable.
An empirical adaptation of the equation for electrical resistivity of semicon ductors fits the resistance-temperature data for thermistors very well:
R=A exp
where R is resistance, in ohms; Tis temperature, in degrees Celsius; and A, B, and C are constants. For this equation, interpolations between 15°C intervals are good to ±0.01°C. The effect of pressure on thermistor resistance is negative and very small, about 10~7 bar"1 ; at the bottom of a 3,000-meter hole, in a logging cable, a thermistor (nominally 50,000 ohms at 20°C) would have a change of resistance of 0.1 ohm, equivalent to + 0.0002°C, due to the pressure of the water column in the hole.
In a separate study of precision of measurement, a platinum thermometer was used to determine the absolute temperature of 23 carefully made ice baths (nomi nally at 0°C), and the mean was + 0.0004° C, the standard deviation being 0.0014°C. These values constitute, respectively, the systematic and the random errors of both the thermometer measurements and the bath temperatures. Five thermistors in the same baths showed a standard deviation of temperature meas urement of 0.003°C; however, the coherent variation of the resistances of all five thermistors from bath to bath shows that relative-temperature measurements with thermistors can inherently be as precise as ± 0.0001° C.
In the calibrations of 41 thermistor cables at the ice point (0°C) in a large box, the mean temperature as measured by the platinum thermometer was 0.0018° C, and the standard deviation was 0.0031°C. Thermistors in cables can be accu rately calibrated in such baths.
Bl

B2 EXPERIMENTAL AND THEORETICAL GEOPHYSICS
During 15 years of geothermal studies by the Geological Survey, many mul- tithermistor cables have been recalibrated two or three times at the ice point. These fairly precise data give a quantitative measure of thermistor drift, ob served as a secular increase of resistance, which is equivalent to a decrease in apparent temperature: the mean drift for 613 pairs of readings of disk thermistors in 15 cables was 3.8X10"3 deg C per mo, and the standard deviation was 5.1X10~3 deg C per mo; 32 aberrant readings were excluded. The results of nine studies, by other men, of the stability of bead and disk thermistors show in general a similar increase of resistance with time; heating to 150° or 200°C shocks thermistors badly, and cooling to 79° C disturbs them beyond further usefulness. Thermistors held within 0.5°C of a constant temperature drift very little; two separate studies for 8- and 9-year periods show a drift <0.3X10~3 deg C per mo. The drift rate varies with temperature; the mean rate for seven disk thermistors over a 13-year period at 30°C was found to be 2.5XKT3 deg C per mo, and at +30°C the rate was 4.2X10"3 deg C per mo.
Thermistor drift is ascribed principally to diffusion of impurity ions resulting from passage of the electric measuring current; other causes may be change in the oxidation state of some of the manganese atoms, mechanical shock, thermal shock, or disordering of atoms in the crystal structure.
A simplified method for converting resistance to temperature is described; it utilizes a master table and individual thermistor correction tables; the method is easy to use in the field, inasmuch as the arithmetical calculations are simply made.
INTRODUCTION
Temperature measurement with semiconducting, thermally sensi tive resistors, or thermistors, has become increasingly widespread since 1950, although thermistors have been used since 1940 for temper ature compensation in telephone and other electrical circuits (Sillars, 1942). The results of 15 years experience in the use of thermistors as temperature-sensing elements in geophysical work of the Geological Survey are analyzed in this report. The physical properties, precision, and stability, and the installation, use, and reliability of thermistors are discussed in the light of this experience.
The use of thermistors in cables for measuring temperatures in drill holes was initiated and developed in 1949 by J. H. Swartz (1954). Since then, thermistor cables have been used in many places to meas ure subsurface temperatures: MacCarthy (1952), Brewer (1958), Lachenbruch and Brewer (1959), and Greene, Lachenbruch, and Brewer (1960) studied temperature problems due to permafrost at several locations on the Arctic Slope; Swartz (1958) used thermistor cables to determine temperatures in deep drill holes on Eniwetok and Bikini atolls and Kilauea volcano in Hawaii; Miller (1958) studied ice temperature and glacier flow in southeastern Alaska. LaFond (1962) used thermistors to determine temperatures of the sea near the surface; Kevelle and Maxwell (1952) measured heat flow through the ocean floor; Von Herzen (1962) measured ocean-floor

PROPERTIES OF THERMISTORS B3
temperature gradients with four thermistors in a Wheatstone bridge; Lachenbruch (1957) used a thermistor probe to measure thermal conductivity. Other applications of thermistor cables to determine terrestrial heat flow were described by Misener, Thompson, and Uffen (1951),Misener,Bremner,and Hodgson (1956), Horai (1959),Chadwick (1956), Newstead and Beck (1953), Cooper and Jones (1959), Bullard (I960), Garland and Lennox (1962), Beck (1962), Saull, Clark, Doig, and Butler (1962), Diment and Robertson (1963), Sass and LeMarne (1963), Diment and Werre (1964), and Diment and Weaver (1964).
Measurement of thermal conductivity of rock in place with a thermistor cable in a borehole was described by Beck, Jaeger, and Newstead (1956). Techniques of temperature measurement in boreholes with thermistor cables and cable fabrication were described by Lachenbruch, Brewer, Greene, and Marshall (1962), Misener and Beck (1960), and Beck (1963). Comprehensive discussions of the characteristics of thermistors were given by Becker, Green, and Pearson (1946) and Nielsen (1959). The electrical circuits used with thermistors in measuring temperature were described by Swartz (1954) and Droms (1962); use of thermistors for measurement of very low temperatures was discussed by Sachse (1962).
The principal advantages of using thermistors in measuring temperatures in the earth are that (1) they have a large change of resistance with temperature (ohms per ohm per deg C), 10 times that of metals; (2) they are available in a wide range of resistances, from 10 to 107 ohms at 25°C, for optimum matching to the measuring circuit to eliminate large corrections for lead or contact resistances;(3) their resistance is a function of the absolute temperature, and thus the need for a junction at a reference temperature is eliminated;(4) they are little affected by the usual chemical and physical condi tions of the environment; (5) they are small; (6) they are mechanically rugged.
A primary consideration of this paper is the stability of thermistors, that is, the change of the temperature-resistance relation with time. In ordinary use, thermistors are subject to an inherent, apparently unavoidable, secular drift, although if they are held at a constant temperature, the drift seems to be very greatly reduced. Calibration and ice-point recalibration data are the basis for discussion of this drift.
We are grateful to A. H. Lachenbruch and W. H. Diment for many helpful additions and improvements on techniques, data, and inter pretations, and we appreciate the skillful preparation of thermistor assemblies and careful assistance of Everett Saunders in many parts of this investigation.
781-990 66 2

B4 EXPERIMENTAL AND THEORETICAL GEOPHYSICS
CHARACTERISTICS OF THERMISTORS
MANUFACTURE
The manufacture of thermistors was observed in five commercial plants by one of the authors (Raspet), and the conclusion was reached that the fabrication of thermistor bodies is about the same in each. Therefore, the following description of processing may be considered as generally applicable.
The raw material for thermistor bodies is prepared by calcining at 800°C the chemically pure carbonates of nickel, manganese, and cobalt. Thermistors of No. 1 material are made by mixing 20 per cent (by weight) nickel oxide with 80 percent manganese oxide, and adding a small amount of a volatile binder; No. 2 material contains 67 percent No. 1 material and 33 percent cobalt oxide. Inasmuch as the No. 2 material is less sensitive to temperature change than the No. 1, few thermistors of No. 2 composition are used. Hereafter, the characteristics of thermistors made from No. 1 material only are described.
The mixed calcined powder is compacted under high pressure into a pellet of disk or ball shape, and the pellet is then fired at 1,300°C for 10 hours. Before sintering, when the pellet is in the green state, it has a density of about 3.0 g per cm3 and a porosity of about 20 percent; after sintering it has a density of 4.95 ±0.05 g per cm3 and a porosity of about 3.0 percent. The grain size of the finished thermistor is 0.1 to 10 microns.
As a result of solid diffusion during the sintering process, the thermistor material acquires the crystal structure of spinel with a cell size close to that of magnetite (Mary E. Mrose, unpub. data, 1960). The resulting thermistor compound has a calculated composition of Nio.6Mn+2o.4Mn2+304 . The sintering is a complex process and must be done in an oxidizing atmosphere to obtain both valence states of manganese and thereby to obtain the stable spinel compound.
Three types of thermistors are commercially available: beads, disks, and rods. In bead thermistors, two separated platinum wire leads are fabricated directly through the bead by sintering the cal cined oxides around them; bead thermistors are usually finished by coating with glass. Electrical connections are made to the flat ends of the disk and rod thermistors by first painting them with a silver- and-glass paste and firing at 800°C for 1 hour. A spot of low-melting silver-alloy solder is alloyed to the paste, and then tin-coated copper wire leads are inserted into the molten solder. The bond of the wire leads and solder to the thermistor body will withstand a pull of 500
PROPERTIES OF THERMISTORS B5
psi. The cylindrical surfaces are cleaned of paste in a centerless grinder by a very fine abrasive.
Preliminary stabilization of the thermistors is accomplished at the factory by aging at 110° to 150°C for 1 to 4 weeks, or by self- heating with a low electric current for 1 week. This aging tends to reduce subsequent increase of resistance (secular drift).
The type-17A thermistor, manufactured by Western Electric Co. was used by the Geological Survey in the present investigation, and most of the data were taken on thermistors of this type. Equivalent thermistors of similar size and characteristics are made by other com panies, such as General Electric Co. (Metallurgical Products Dept.), Fenwal, Inc., Victory Engineering Corp., Gulton Industries, Inc., and Yellow Springs Instrument Co. The 17A is a disk, 5mm in diameter and 1 mm thick; it is large enough to manipulate easily without being too bulky after installation inside a cable. The 17A has worked well in cables, withstanding the mechanical handling of the cable when stretched in a hole and when flexed in coiling on a reel.
In measuring resistance of the 17 A, a portable four-dial Wheats tone bridge is ordinarily used in the range 10,000 to 1,000 ohms, (equiva lent to 20° to +25°C); current in the bridge circuit is limited to 150 jua to minimize self-heating in the thermistor; about 1 milliwatt of power must be dissipated. With the usual self-contained galva nometer (sensitivity of 4 /xa per mm), the precision is about 1 ohm (equivalent to 0.02°C at +25°C). An improved precision to 0.1 ohm (0.002°C) can be attained with a five-dial Wheatstone bridge by using (1) an amplifier ahead of a low-sensitivity galvanometer, (2) a sensitive null indicator, or (3) an external galvanometer having a sensitivity of 0.05 /xa per mm.
As with most other semiconductors, thermistors have a large nega tive temperature coefficient of resistance. For the 17A thermistor, made of No. 1 material, the coefficient is 4.4 percent per deg C at +30°C (total resistance, 800 ohms), and is 6.5 percent per deg C at 30°C (total resistance, 18,000 ohms).
The resistances of the 17A thermistors may differ considerably at the same temperature. For example, two thermistors might differ by 1,000 ohms at 30°C and 50 ohms at +30°C, each resistance equiva lent to >1°C; also, their changes of resistance with temperature would differ widely. Therefore, each thermistor requires a separate calibra tion. It is possible to obtain two or more thermistors with nearly matching resistance-to-temperature conversions (matching to ±0.1°C) at a somewhat greater cost, and for many purposes these are useful, especially if separate calibrations need not be made.

B6 EXPERIMENTAL AND THEORETICAL GEOPHYSICS
DEPENDENCE OF RESISTANCE ON TEMPERATURE
Thermistors, like other semiconductors, have an electrical conduc tivity approaching that of a metal at high temperatures and are nearly insulating at low temperatures. The dependence of conductivity a-, (ohm-cm)"1 , on absolute temperature Tin degrees Kelvin, is commonly expressed by
<r=A(T) exp (-AE/2kT) (1)
in which A(T) is a slowly varying function of temperature, AE is an energy term, and k is the Boltzmann constant (8.625X10" 5 ev per deg K). This relation is explained for elements like Si and Ge and for compounds like InSb, GaAs, and A1P in terms of their band struc ture, that is, their electron energy spectrum. The valence band is separated from the conduction band by an energy gap AE; the number of electrons excited across the gap AE is proportional to the exponen tial term in equation 1. The electrical conductivity of these semicon ductors is equal to the number of free electrons and holes times their mobilities and times their charges.
Unfortunately, the spinel semiconductors, including thermistors, do not have the simple band structure of the metallic semiconductors, and furthermore the intrinsic electrical properties of the spinels are difficult to measure accurately; their theoretical characteristics are therefore not so well understood. A review of the theory on semi conducting compounds was given by Mooser (1960). Sillars (1942) discussed the use of some semiconducting ionic and electronic metallic oxides as temperature-sensing elements; Becker, Green, and Pearson (1946) discussed the properties and uses of semiconductors and thermistors.
The following empirical equations, modeled after equation 1, have been found to fit the measurements made on thermistors. Because the resistance, rather than the conductivity or resistivity, is measured, the expressions are inverted and multiplied by a form factor to relate resistance to temperature for any given thermistor. The logarithmic form is also given because it is commonly used in calculations.
Exponential form Logarithmic form
R=Aexp(BT-1) log R=A'+B' T~l (2)R=AT~C exp (BT~1} log R=A'-C\og T+B'T'1 (3)R=A exp [B(T+C)-1} log R=Af +Bf (T+0)~l (4)£=exp (AT+BT-1) log B=Af T+Bf T~ 1 (5)
where A, A', B, B', and (7 are constants; R is resistance, in ohms; T is temperature, in degrees Kelvin. Equation 2 is merely equation 1 inverted, assuming A(T) to be a constant. Equation 3, containing three constants, was proposed by Becker, Green, and Pearson (1946).

PROPERTIES OF THERMISTORS B7
Equation 5 is the result of an empirical search for a two-constant relation by William H. Diment (unpub. data, 1962). Equation 4 was developed in 1949 by one of the authors (J. H. Swartz, 1954), and independently by Bosson, Gutmann, and Simmons (1950); in this equation, T may be measured in degrees Celsius with no difference from measurements in degrees Kelvin except in the numerical value of C.
The measured value for the resistance of a thermistor is compared in table 1 with the values calculated according to equations 2 through 5. These data are from 21 calibrations quoted by Bosson, Gutmann, and Simmons (1950) and are used because they permit a severe test of the relative accuracy of the four equations to be made for the rather large temperature interval of 200°C. The large change of resistance in this interval is shown by the curve in figure 1.
As shown in table 1, equation 4 fits the calibration data best, and has been used by the Geological Survey in preparing temperature- resistance conversion tables. In general, interpolations by equation 4 are made at 1° intervals between calibrations at 30°, 15°, 0°, + 15°, and +30°C. A comparison between resistances interpolated by equation 4 and observations at the midtemperatures, 22.5°, 7.5°, +7.5°, and +22.5°C, was made for 30 calibrations; the mean interpolation error of resistance (calibrated calculated) converted to equivalent temperature was 0.031°C, and the standard deviation was 0.017°C. Inasmuch as this error includes errors of measurement, the deviation of calculated from observed values may be somewhat less. The curve of equation 4 deviates from a straight line by about 0.01°C as a maximum for 1° intervals; therefore, linear interpolation in 1° intervals is generally acceptable.
TABLE 1. Interpolation errors in four equations for temperature-resistance relationsof thermistors
Equation
2 _ ............3. -. 4 _ _ ....... __ ...5 _ _ ___ .....
Resistance « at 296.35°K (ohms)
Calculated
36, 771 44,276 45,142 41,432
Observed
45,383 45,383 45,383 45,383
Equation error
Resistance error
(observed minus calcu lated value,
in ohms)
+8,612 +1, 107
+241 +3,951
Equivalent temperature
error (observed
minus calcu lated value,
in°C)
-4.4 -.57 -.12
-2.0
i Calculated and observed resistances at 296.35°K are based on data on a thermistor of No. 1 material from Bosson, Qutmann, and Simmons (1950, table 1); the calculated resistances were obtained from the equations whose constants were determined from the following observations: 10,558,700 ohms at 204.71°K, 4,761.1 ohms at 357.16°K, and 1,177.6 ohms at 407.17°K.

B8 EXPERIMENTAL AND THEORETICAL GEOPHYSICS
10 7
10'
ozul Oz <- 10 5 v> 1ULUce
10'
50 + 1500 +50 +100 TEMPERATURE, IN DEGREES C
FIGURE 1. Log resistance versus temperature for a thermistor of No. 1 material. After Bosson, Gutmann, and Simmons (1950, table 1).
Temperature versus resistance curves for many thermistors were observed to be enough alike in shape and absolute values of coor dinates to suggest that a calibration curve for one thermistor might serve as a master curve from which resistance-temperature conversions
PROPERTIES OF THERMISTORS B9
for other thermistors might be obtained. A simplified method for conversion of resistance to temperature is described on page B26. Table 8 is useful for thermistors (like the 17A) whose resistance at 0°C is about 3,000 ohms; with carefully determined corrections, con versions made by use of the table, especially in measuring temperature differences over a few degrees, are accurate to ±0.01°C in the tem perature range 30° to +30°C.
DEPENDENCE OF RESISTANCE ON PRESSURE
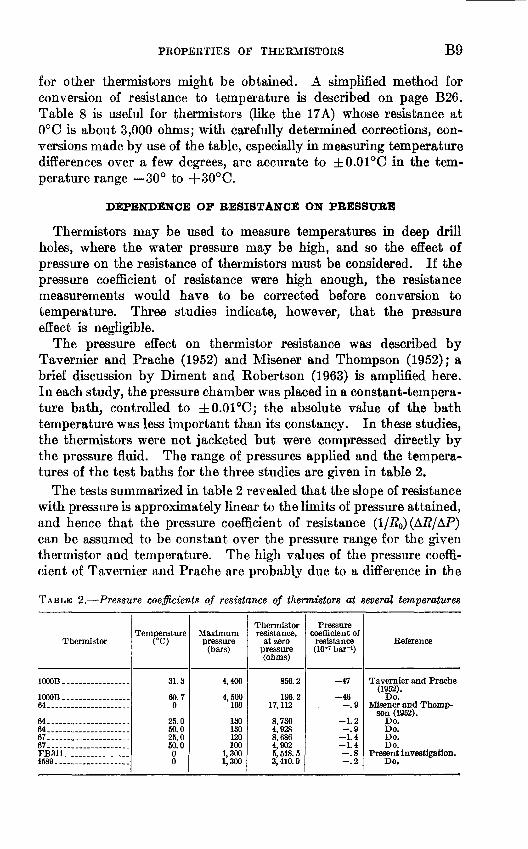
Thermistors may be used to measure temperatures in deep drill holes, where the water pressure may be high, and so the effect of pressure on the resistance of thermistors must be considered. If the pressure coefficient of resistance were high enough, the resistance measurements would have to be corrected before conversion to temperature. Three studies indicate, however, that the pressure effect is negligible.
The pressure effect on thermistor resistance was described by Tavernier and Prache (1952) and Misener and Thompson (1952); a brief discussion by Diment and Robertson (1963) is amplified here. In each study, the pressure chamber was placed in a constant-tempera ture bath, controlled to ±0.01°C; the absolute value of the bath temperature was less important than its constancy. In these studies, the thermistors were not jacketed but were compressed directly by the pressure fluid. The range of pressures applied and the tempera tures of the test baths for the three studies are given in table 2.
The tests summarized in table 2 revealed that the slope of resistance with pressure is approximately linear to the limits of pressure attained, and hence that the pressure coefficient of resistance (1/JS0) (A5/AP) can be assumed to be constant over the pressure range for the given thermistor and temperature. The high values of the pressure coeffi cient of Tavernier and Prache are probably due to a difference in the
TABLE 2. Pressure coefficients of resistance of thermistors at several temperatures
Thermistor
1000B ___ . __
1000B -.... _ . __ .64. ....................
64.....................64 ___ . _______ ....67..... _ .. _ ..... _67.. ___ ..............FB311...... _ ........4589.... _ . ___ .....
TemperatureCO)
31.3
69.70
25.050.025.050.000
Maximumpressure
(bars)
4,400
4,500100
130130120100
1,3001,300
Thermistorresistance,
at zeropressure(ohms)
856.2
196.217, 112
8,7304,9288,6864,9025, 518. 53, 410. 9
Pressurecoefficient of
resistance(10-" bar-»)
-47
-46-.9
-1.2 9
-1.4-1.4-.8-.2
Reference
Tavernier and Prache(1952).
Do.Misener and Thomp
son (1952).Do.Do.Do.Do.
Present investigation.Do.

BIO EXPERIMENTAL AND THEORETICAL GEOPHYSICS
physical characteristics of their thermistor, which was manufactured in France; it may have been somewhat less dense, that is, less com pacted in the processing, than the American-made thermistors of the other two studies, and therefore may have been more susceptible to a pressure effect. (Misener and Thompson used type-12A rod thermis tors made by Western Electric Co. The present authors used a glass-enclosed bead thermistor, serial No. FB311, type GB32P22, made by Fenwal Co., and a disk thermistor, serial No. 4589, type 17A, made by Western Electric Co.) The broad differences in the pressure coefficients probably reflect differences in manufacture, but the small differences, as between runs of thermistors 64 and 67, may be due to the unsteady thermal condition inside the pressure chamber when resistances were measured: at least 2 hours are required for the adia- batic heat produced by raising (or lowering) the pressure 500 bars to be dissipated and for the temperature to return to within 0.02°C of a steady state. There is a suggestion from the results of Tavernier and Prache and of Misener and Thompson that for a given thermistor, the pressure coefficient is nearly constant over a temperature range of 50°C.
It is apparent that the pressure effect on the resistance of a thermistor is very small. For example, at the bottom of a 3,000-meter hole in the earth, the water pressure would be about 300 bars and the temperature about 85°C; a thermistor with a nominal resistance of 50,000 ohms at 20°C would therefore have a change of resistance due to the pressure of 0.1 ohms, or an equivalent temperature change of +0.0002°C. The following changes in resistance permit a com parison of the temperature effect with the pressure effect, between 3,000 and 3,001 meters depth: the resistance of this thermistor would decrease 3.2 ohms owing to an assumed geothermal gradient of 20°C per km, and would decrease 10~ 5 ohm owing to the pressure gradient of 100 bars per km.
TEMPERATURE MEASUREMENTS WITH THERMISTORS
PRECISION OF MEASUREMENT
A special study was made of the precision of temperature measure ments by thermistors and by the platinum thermometer used in ail calibrations; the electrical circuits are described in Raspet, Swartz, Lillard, and Robertson (1966). The measurements, hi turn, depend on the reliability of the operating procedures and the precision of the Wheatstone and Mueller bridges, and these methods and charac teristics also were evaluated.
The resistance of the platinum thermometer and the resistances of five thermistors were examined in replicate ice baths, made in a Dewar flask, and carefully prepared with shaved ice and distilled

PROPERTIES OF THERMISTORS Bll
water. Observations were made each working day, 5 days per week, for 6 weeks, from April 14 to May 25, 1960; 30 sets of measurements in all were taken. The platinum thermometer was calibrated by the National Bureau of Standards on June 24, 1960, and by the Geological Survey in a triple-point cell on August 17, 1963.
The five thermistors chosen were placed in glass tubes, which were partly filled with kerosene and closed with sealing wax. Four were type 17A thermistors: two of these, serial Nos. 154 and 1421, had been well calibrated and used as secondary standards; one of the other two, serial No. 20, was old, and the second one, serial No. 4151, was new. A small glass-enclosed bead thermistor, type 23A, serial No. B36, was also used.
Instruments were cleaned and standard procedures were arranged before the study began. In the operation of the Wheatstone bridge, the bridge current was allowed to pass continuously through the thermistor circuit while the bridge was being balanced, to avoid operator differences and to insure that any static charges would leak off. A careful manipulation procedure for the Mueller bridge was worked out. All contacts in the bridges and at the connections were cleaned.
A statistical summary of the observations is given in table 3. The range of fluctuation of thermistor resistances is less than 0.1 percent of the total, which although not large, is significant in many uses of thermistors. The question arises, then, whether the fluctuations are inherent in the thermistors themselves or in the measurements. Although the resistance of a given thermistor varies randomly from bath to bath, all the thermistors in a given bath on a given day showed concordant departures in direction and amount from those of the preceding or succeeding days. It thus appears that the variation is in large part in the instrumentation and the human operations, and is external to the thermistors.
TABLE 3. Statistical summary of resistances at the ice point of five thermistors anda platinum thermometer
Thermistor: 154-.. ____ .....1421--. ___ .. ......20-. . 4151-- B36-
Platinum thermometer: 231... __ ... __ ..
Observa tions
30 30 30 30 30
23
Resistance (ohms)
Eange
3, 327. 6 to 3, 329. 7 3, 247. 6 to 3, 250. 4 3, 226. 7 to 3, 230. 1 3,390.9 to 3, 393.1 4, 618. 1 to 4, 620. 6
25. 4689 to 25. 4694
Mean
3, 329. 0 3, 249. 3 3, 228. 8 3,392.2 4, 619. 1
2 25. 46924
Standard deviation
0.40 .48 .57 .58 .76
.00014
Temperature equivalent to standard deviation
(°C)i
0.0024 .0029 .0034 .0035 .0029
.0014
1 An approximate conversion factor for thermistors at 0°C is 170 ohms per deg C, and for the platinum thermometer the conversion factor is 0.1015 ohms per deg O.
2 Equivalent temperature, +0.0004°C.781-990 66 3

B12 EXPERIMENTAL AND THEORETICAL GEOPHYSICS
The temperatures of small ice baths can be duplicated to ±0.0002°C, if prepared correctly (Thomas, 1941), but the platinum-thermometer results showed a larger variation in this study. To test whether this variation was due to use of tap water for the ice in the first baths, the ice in later baths was made from distilled water; however, the same fluctuations occurred both in the platinum-thermometer measure ments and in the concordant departures of resistance of all the therm istors. A systematic error of +0.0004°C and a random error of 0.0014°C are implied by the results. These errors can be assigned as the accuracy and the precision of the platinum thermometer and the ice bath as a combined system.
The possibility was also considered that variation of the ambient room temperature might affect the resistances of the lead wires and resistors in the bridges, so the temperature fluctuations in the room and inside the Mueller bridge were recorded; however, they could not be correlated with the thermistor fluctuations. Apparently, the observed variation of resistance of the thermistors is due to instru mental and operator error, and, being random errors, the standard deviations in table 3 represent the precision of measurement. It appears that the thermistors are inherently very good relative-tem perature sensing elements, probably precise to ± 0.0001°C, although such precision would require considerable improvement in measure ment techniques.
TEMPERATURE OF ICE BATHS FOR THERMISTOR CABLES
After installation of thermistors in a multiconductor cable, it is standard practice by the Geological Survey to recalibrate the thermis tors by placing the thermistor-bearing part of the cable in an ice bath made in a 6-cubic-foot box. The calibration procedure is de scribed by Raspet, Swartz, Lillard, and Robertson (1966).
After the cable in an ice bath reaches a thermal steady state, the temperature is found to be surprisingly constant, both at different places in the same bath and in successive baths. This constancy is shown in any one bath by placing the platinum thermometer in several locations in it, after first inserting an aluminum probe in the ice to make a hole for the glass tube of the thermometer. Temperatures taken at different locations vary by <0.002°C.
The temperatures of 41 different ice baths, as determined with a platinum thermometer, are given in table 4. Bath temperatures frequently are slightly below 0°C, probably because of salt, dissolved air, or other contamination in the ice, despite the great care in prepara tion. The standard deviation for the bath temperatures would be only 0.0012°C if two seemingly anomalous low temperatures, 0.008° and 0.011°C, are omitted. It is apparent from the mean and stand-
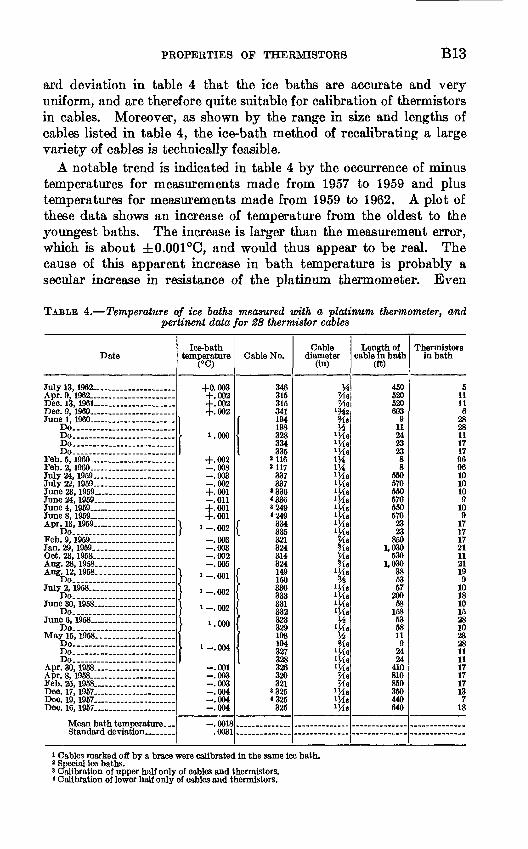
PROPERTIES OF THERMISTORS B13
ard deviation in table 4 that the ice baths are accurate and very uniform, and are therefore quite suitable for calibration of thermistors in cables. Moreover, as shown by the range in size and lengths of cables listed in table 4, the ice-bath method of recalibrating a large variety of cables is technically feasible.
A notable trend is indicated in table 4 by the occurrence of minus temperatures for measurements made from 1957 to 1959 and plus temperatures for measurements made from 1959 to 1962. A plot of these data shows an increase of temperature from the oldest to the youngest baths. The increase is larger than the measurement error, which is about ±0.001°C, and would thus appear to be real. The cause of this apparent increase in bath temperature is probably a secular increase in resistance of the platinum thermometer. Even
TABLE 4. Temperature of ice baths measured with a platinum thermometer, and pertinent data for 28 thermistor cables
Date
July 13, 1962.....................Apr. 9, 1962 ___ . __ . _ . .....Dec. 13, 1961 ____________Dec. 9, 1960 __________ ....June 1, 1960 ____________
Do............ ...........Do.... ...................Do....... .... ...............Do.... ............. ......
Feb. 5, 1960 ___________ ..Feb. 2, 1960 __ . _______ . ...July 24, 1959 .....................July 22, 1959 ________ ......June 23, 1959 __ . _______ ..June 24, 1959 __________ ..June 4, 1959 ____________June 8, 1959 ____________Apr. 13, 1959 .....................
Do.... ...................Feb. 9, 1959 ..._..................Jan. 29, 1959 _________ . ...Oct. 23, 1958 -.--_ . - ._._-.Aug. 28, 1958... .................Aug. 12, 1958...... ..... ......
Do __________ . __ ..July 2, 1958. __ . _____ ... ...
Do.... ...... ...........June 30, 1958 ____________
Do-. . --_ ......
Do....... ...................May 15, 1958... _________
Do. Do. ....... ... .......Do.. .................
Apr. 30, 1958 ......... .........Apr. 8, 1958 ____________Feb. 25, 1958 __ . _________._..._Dec. 17, 1957 ______ . _ ... ...Dec. 19, 1957 _________ _________Dec. 16, 1957 ._..................
Ice-bath temperature (°C)
+0.003+.002+.002+.002
i.OOO
+.002-.008-.003-.002+.001-.011+.001+.001
} » -. 002-.003-.003-.002-.005
} ' -. 001
1 UU*
} 1 -.002
} i.OOO
1-.004
-.001-.003-.003-.004-.004-.004
-.0018.0031
Cable No.
346315315341194198
I 328334335
»1163117
337337
^336*3368249*249
f 334\ 335
321324314324
f 149\ 150f 3301 333
331332323329198194327328326320321
8325*325
325
Cable diameter
(in)
HMe 7A,
134204.
Vi'MeILf.'Me
mm'Me'He'Me»H«'Me%'Me'MeWKMeMeMe'Me%'Me
ILf.'Me'Me
'MeHMe'Me
'Me'MeMeMe
lLf ftlVf«'Me
Length of cable in bath
(ft)
450520520603
91124232388
550570550570550570
2323
8501,030
5301,030
385357
20958
158535811
92424
410810850350440640
Thermistors in bath
511116
282811171796961010109
109
171717211121199
10181015281028281111171717137
18
' Cables marked off by a brace were calibrated in the same ice bath.2 Special ice baths.3 Calibration of upper half only of cables and thermistors.4 Calibration of lower half only of cables and thermistors.

B14 EXPERIMENTAL AND THEORETICAL GEOPHYSICS
with gentle handling, there is some shaking of the delicate wire coil of the thermometer, a very small cold working, and a consequent very slight increase of resistance (J. L. Riddle, National Bureau of Stand ards, oral commun., 1960). The slope of the regression line fitted to the data in table 4 is -f0.0014°C per yr, or + 1.4X10"4 ohms per yr if converted to thermometer resistance. This value is corroborated over the same 5-year period by two calibrations of the thermometer by the National Bureau of Standards in 1956 and 1960 and by one made by the Geological Survey in 1962 using a triple-point cell. If the bath-temperature data were corrected for this effect, the standard deviation would be greatly decreased.
THERMISTOR STABILITY
DRIFT OF THERMISTORS IN CABLES
Thermistors of all makes and types are well known to have a secular increase of resistance, which results in a decrease of apparent tempera ture with time. As this apparent temperature drift affects all read ings, it is important to determine how large this drift is, so that it can be recognized and corrected for where necessary. Successive calibra tions of thermistor cables by the Geological Survey over a 10-year period permit estimates to be made of the rate of thermistor drift.
The absolute temperature of each ice bath in which cables are placed is within ±0.005°C of 0°C, as shown in table 4; hence it is feasible to find the change in resistance between two ice-point calibra tions for each thermistor in a cable, and thereby learn the amount of drift over the period between calibrations. A summary of such data, together with pertinent information on the cables, is given in table 5. All thermistors were type 17A. There were 32 usable pairs of ice- point determinations and 645 pairs of thermistor readings for these cables. The time interval between ice points ranged from 1 month to 4% years, the mean being 21 months.
The resistance changes of the thermistors from one ice-point cal ibration to the next have been converted to equivalent changes of temperature in table 5 in order to put all thermistors on a similar and more understandable basis. However, it should be remembered that it is the change in absolute resistance at the ice-point that is observed. (An approximate conversion factor at 0°C for 17A therm istors is 170 ohms per deg C.) Thermistor resistance which be comes higher, upon conversion, will show a change to a lower tem perature because of the inverse relationship; this change is seen as a fall in the converted temperature from the first ice-point to the second. For each cable listed in table 5, the mean drift per month and the standard deviation were calculated for the thermistors in each cable; 32 aberrant changes were discarded. The mean tern-

PROPERTIES OF THERMISTORS B15
perature change of all the thermistors in each cable is plotted in figure 2 against the number of months between ice-points. There is an obvious decrease in the observed apparent temperature with time, although the points have a wide scatter.
The data for each thermistor were reduced to temperature drift per month, classified at intervals of 5X10~3 deg C per mo, and then plotted as the histogram of figure 3. The class of 0 to 5X10~3 deg C per mo includes 480 values, or 75 percent of the total 645. The preponderance of values in this range indicates that the drift of 17A thermistors in cables in ordinary use is very uniform. Ex cluding 32 aberrant pairs, the mean drift for 613 pairs of thermistor
o -lCOLU LU CC
LUQ
I2-2
-3
2-4 <
-5
10 20 30 40
TIME, IN MONTHS
50 60
FIGURE 2. Change in mean apparent temperature of thermistor cables against time between ice-point calibrations.

B16 EXPERIMENTAL AND THEORETICAL GEOPHYSICS
I
I
8aO60 3
1
|tor drift
1£}E^
|
1 O
Thermistor
hermistor
f
1
o
W)
£
TJ
.a ft
1§S^lira-d
c3 1
CDbO
«
"^/-»5"
§.
acing (ft)
ftto
|8
1
M
eJ£ S£!C3 O
rH rH
CO
1o~
7OS
1
^OrH«0,N
OO"*COO rH
rHO^<NCO
(N Ttf "# CO 00
1 1 1
OOiOOU5(N
1 7777OOOOO
"tfCOOCOOO
rH rH O 1
1 J +^
Ot*t*t*<*
rH 0 ^CO
I>COOOOCO
00000000oooo(N
OOOOO 00 00 0 (N
1 1 1 1 1 1 1 1 1 1 1 1 1 1 1 1 1 1
r- rH rH rH p;
1 1 1 1 1 1 1 1 1
CO (N (N rH (NCOIN
XO r-lrHO (N
s ^7 7
rHOOSt-0 (NO^WrH
rH "tf CO rH I> T(H SO "*
Ot-^^00 THOOUSO^
(N(N(N(NU5 COrHTt<rHCO
III 1 1 1 1 1
NNU5COO O^^rHt^
77 '7 7 ' 7 ' 'ooooo ooooo
TlHrHrHOO rH 00 CO O O
rH rH (N rH rH I 1 rH
1 1+ 1 1 ' ' 1
ThTlHOOCO <N(N<NOCO
COCO COCOCO
(N(N<N(N<N <N<N<N
0000000000 000000 OOOOO OOO>CUi
<N<N
0000000000 OOOOOOUSUi C<l (N
1 1 1 1 1 1 1 1 1 1 1 1 1 1 1 1 1 1
H-3 4-> -f3 _ _ 4-> _ ^^QQQQQQ ^^^QQ^ (NINrHrHrH (N (N (N rH (N
i i i i i i i i i
OOI>l>.I> t>l>l>0000
rHCO CO rHINCO
r-^-us o co rH COIN£8« S 7T? 8?i i ' + ' ' ' L T7 isous">
rHrHO "3 O SO (N "tf <N U5
COO COOO COrHI>rHO
00 «t- COO UJINrHUSTh
i rH 00 CO ^ "^ *O O (N 001 ! | ,H , , rH !
OU50 0 t^lN^OOO
rHO>O COO <NI>rHCOCO
1 '7 77. 7 '7 ' 7ooo oo o oooo
Tt<>OOS * rHOOThSO
+7 'Y 777+7IOU500 U5O COrH(NrHU5
^ ^^ ^^ *^ rH 00 *O CO Oi (T^ <N"tf (N (N(NU5(N(N
OOI>00 >CO OOOI>OU5 (N (N rH (N rH rH rH rH
U5U5 U5 U5 (N (N(N (N
0 OOOOO
ooooo ooo ooooo o ooooo0 000001>
0! 0! ""C ""C Q "^ Q ""C 0 Q! rHr-ffi COrH CdrHNrHrH
OOO OrH rHrHrH(NC<l

PROPERTIES OF THERMISTORS B17
1~'4-4- 'oT
r-ToO
<N 1-co
<NrH
°l 1
I
rH
TT»0
1COrH
1
1><N(O "tfdoo'
*O i* 00 O <N rH O5
O 1>1>06 rH OONrH rH I (N I II
I I ' I ' ' '
O O O O O O O
f +l'rH ? f
IO
rH rH
OrH
O IO
O0
rH~
T (M
rH <N CO
00 rHO if}
<NrH (N
00 rH O rH <N<NrH rH
<NOO <N U51O
000 0 IO O O C^
c<fc<f
+: +: _ -W DO 00 T OQ
rH rH Pd rH
<N<N<N (MCO CO CO CO
00
cocorHrH
l>l>rHrH
COCO
O O *= +3
(N(M
IOIO rH rH
-1- +: CO CO rHrH
Th'lO COCO COCO

B18 EXPERIMENTAL AND THEORETICAL GEOPHYSICS
500
400
300
o 200
100
I I I I I I I I I I I I I I I I I I I I I I I I 1 M I I I I I I I II II I I I
ThiiiDipiiiiiinp<-100 -50 0 +50 > + 100
RATE OF TEMPERATURE CHANGE, IN 10~ 3 DEGREES C PER MONTH
FIGURE 3. Thermistor drift for 645 pairs of thermistor readings classified statis tically at intervals of 5X10~3 deg C per mo.
readings is 3.8X1CT3 deg C per mo, and the standard deviation is 5.1X10"3 deg C per mo. This mean drift, which is equivalent to about 0.05°C per yr, or +8 ohms per yr, is plotted as the dashed line on figure 2.
In a large majority of the determinations reported in table 5 the secular drift of thermistors was observed to be an increase in resistance, equivalent to a decrease in apparent temperature. In figure 3, most of the 21 small thermistor changes, <15X10~3 deg C per mo, on the positive side of the histogram can be discounted because the change was near the limit of measurement error, although a few of the changes cannot be so explained. Two large changes, +37X10"3 and

PROPERTIES OF THERMISTORS B19
+ 50X10"3 deg C per mo (fig. 3), are for thermistors in cable 321, which was roughly handled in the field; moderate-resistance electrical shorts in the lead wires probably developed owing to moisture and abrasion of the insulation of the copper leads. A defective thermistor in cable 314 is assumed to be the reason for the +100X10"3 deg C per mo drift observed. The large negative values do not have obvious explanations. The high positive drift values of other investi gators (table 6) seem to be caused by subjecting the thermistors to high temperatures or to rough handling. Therefore, it appears that in ordinary use, thermistor drift usually occurs as an increase in re sistance between calibrations at a given temperature.
LABORATORY STUDIES OF THERMISTOR DRIFT
The results of some previous laboratory investigations of thermistor stability are listed in table 6. They agree with the general conclusions found in our study of thermistors in cables (table 5; figs. 2, 3) that thermistors of all types show some drift, and that usually the drift is to ward a higher resistance, or equivalently toward a lower temperature.
Thermistor drift can be greatly reduced by annealing at about 100°C. Becker, Green, and Pearson (1946, p. 717-718) showed that after 2 weeks of aging at 105°C, %-inch disk thermistors of both material No. 1 and material No. 2 were stablized and had a drift of about 4X10~3 deg C per mo thereafter. This effect of annealing was corroborated by Nielsen (1959, p. 22-28). Several manufacturers now anneal or preage their thermistors as a general procedure to improve their drift characteristics.
On the other hand, the results of an investigation by Droms (1962, table 2) show that annealing at a temperature >100°C can disturb thermistors; for 3 months, he held half of his laboratory study group of eight types of thermistors at 100°C and the other half at 200°C; both groups changed, but the latter group had much larger resistance changes. Similar results were found by Swartz and Raspet (1961, figs. 2, 3) for thermistors subjected to 130°C for 1 hour; they found that from an initial drift of 70X10"3 deg C per mo, the rate after 1 year had slowed to 10X10~3 deg C per mo, after 2 years to 4X10~3 deg C per mo, and after 4 years to 3X10~3 deg C per mo. They found also that cold shock at 79°C disturbs thermistors very badly, sometimes beyond further use.
Bead thermistors are protected by a glass coating, so they might be expected to have a lower drift rate than the unprotected disk thermis tors, both in the field and in the laboratory; apparently, however, the glass makes only a small difference, if any. Two bead thermistors studied by Beck (1956, fig. 1) were used in the field for borehole logging and their average drift rates were 140X10"3 and 210X10"3
781-99$ 66 4

B20 EXPERIMENTAL AND THEORETICAL GEOPHYSICS
g '§ir»
Ǥ
Bp
<ll a
a s0? G3
g rtS -2
-
on
I | W.H?5
7o o o o o o
o oCDOOrH rH rH O
I IN.- CO I i-l'+ I ' I
I
O O
S Sco
33oo
I I
tO ^- r-l O5 O COC
I \% IP'£rC |I-H i c^ «~"i «^*
idsIlsBE"_gsS-2SS
gl 3-S
2 |^^ll B*5
PROPERTIES OF THERMISTORS B21
deg C per mo; the higher rate apparently was caused by an exposure to sunlight. Two bead thermistors studied by Diment (unpub. data, 1964) had drift rates of 11X10~3 and 3X10~3 deg C per mo after8- and 11-months field use in logging cables.
In his laboratory study, Nielsen (1959, fig. 10) found that his bead thermistors were well stabilized by heat treating; the drift rate was between 1X10~3 and 5X10~3 deg C per mo after 1 year. Com parisons of these data with those in table 5 suggest that glass-covered bead and the unprotected disk thermistors have similar drift rates, although some bead thermistors seem to have lower rates.
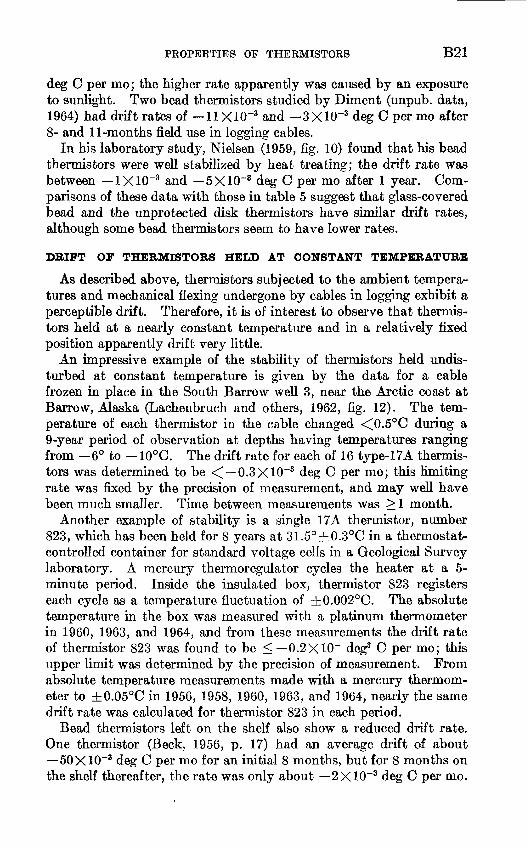
DRIFT OF THERMISTORS HELD AT CONSTANT TEMPERATURE
As described above, thermistors subjected to the ambient tempera tures and mechanical flexing undergone by cables in logging exhibit a perceptible drift. Therefore, it is of interest to observe that thermis tors held at a nearly constant temperature and in a relatively fixed position apparently drift very little.
An impressive example of the stability of thermistors held undis turbed at constant temperature is given by the data for a cable frozen in place in the South Barrow well 3, near the Arctic coast at Barrow, Alaska (Lachenbruch and others, 1962, fig. 12). The tem perature of each thermistor in the cable changed <0.5°C during a9-year period of observation at depths having temperatures ranging from 6° to 10°C. The drift rate for each of 16 type-17A thermis tors was determined to be < 0.3X10"3 deg C per mo; this limiting rate was fixed by the precision of measurement, and may well have been much smaller. Time between measurements was > 1 month.
Another example of stability is a single 17A thermistor, number 823, which has been held for 8 years at 31.5°±0.3°C in a thermostat- controlled container for standard voltage cells in a Geological Survey laboratory. A mercury thermoregulator cycles the heater at a 5- minute period. Inside the insulated box, thermistor 823 registers each cycle as a temperature fluctuation of ±0.002°C. The absolute temperature in the box was measured with a platinum thermometer in 1960, 1963, and 1964, and from these measurements the drift rate of thermistor 823 was found to be < 0.2X10"" deg3 C per mo; this upper limit was determined by the precision of measurement. From absolute temperature measurements made with a mercury thermom eter to ±0.05°C in 1956, 1958, 1960, 1963, and 1964, nearly the same drift rate was calculated for thermistor 823 in each period.
Bead thermistors left on the shelf also show a reduced drift rate. One thermistor (Beck, 1956, p. 17) had an average drift of about 50X10"3 deg C per mo for an initial 8 months, but for 8 months on the shelf thereafter, the rate was only about 2X10~3 deg C per mo.

B22 EXPERIMENTAL AND THEORETICAL GEOPHYSICS
Two bead thermistors (Diment, unpub. data, 1964) drifted at 0.3X.10"3 and 1.1X10"3 deg C per mo for a 2-year period on the shelf.
Apparently, if a thermistor is held practically undisturbed and at a nearly constant temperature, there will be only a very small drift of the resistance of the thermistor with time, a characteristic worth consideration if a thermistor is to be used under such conditions.
DRIFT BATES AT VARIOUS TEMPERATURES
The drift rate of thermistors as a function of temperature was studied for one thermistor by Beck (1956, table 2) over the tempera ture range 5° to 32°C. For a given time lapse, the drift rate is higher for the higher temperature, although the temperature effect is small compared to the total drift rate:
Thermistor drift rate Time period (mo) Temperature (°C) (10~3 deg Cper mo)
5_____.___._____.__.____.. 5.27 -134.05______.___.___________ 18.31 -138.0
!!___________________________ 14.09 -140.0!!_______________________ 30.89 -142.715_________________________ 14.22 -120.015._________________________ 30.84 -122.717_ _____ ________________ 11.71 -142.417_________________.____ 32.24 -147.6
In the study by Droms (1962, table 2), 19 thermistors were held at 100°C and 19 at 200°C, and both sets were recalibrated at 0°C and at 50°C after 51 days and after 91 days. The thermistors drifted at widely varying rates, both positive and negative, from very little to highs of 0.6°C per mo at 50°C and 1.8°C per mo at 0°C. The scatter is too great for any uniformity to be discerned. A group of thermistors held at the temperatures 0°, 10°, 20°, 30°, and 40°C by Staley (1952, table 4) exhibited such a wide and random scatter, from 54X10"3 to +28X10~3 deg C per mo, that no conclusion on the dependence of drift rate on temperature is feasible; no explanation is available for the high drift rates, unusual in the 0° to 40 °C range.
When thermistors were first used by the Geological Survey in 1949, seven were set aside and calibrated carefully for use as secondary standards, in lieu of a platinum thermometer, and the calibration data on these is pertinent. Four of them, Nos. 124, 125, 127, and 128, were installed in the bath in which all cable thermistors have since been calibrated, and they have been cycled between 30°C and +30°C in about 250 calibration runs during the last 15 years. Three other thermistors, Nos. 154, 1421, and 1422, were put in glass tubes, which were partly filled with kerosene and closed with sealing wax; these thermistors were set aside for use in occasional ice baths and for other purposes.

PROPERTIES OF THERMISTORS B23
Each of these seven thermistors was calibrated by the National Bureau of Standards, on October 26, 1951, at five temperatures, 30°, 15°, 0°, +15°, and +30°C; two later calibrations were made on six of these thermistors by the Geological Survey at the same temperatures on October 27, 1956, and on July 8, 1964. During the intervals between calibrations the thermistors changed in resistance by amounts which on the average increased with increasing temperature. Resistances were converted to temperature in order to have a uni form basis for comparison among the data. The two sets of drift rates calculated for the two periods between the three calibrations are plotted separately in figure 4. The magnitude of the drift rate tends to increase with increasing temperature, but there is considerable variation among the thermistors, one even taking on a slightly posi tive drift rate. Neither the continued temperature cycling of the bath thermistors nor the desultory temperature cycling of the tubed thermistors seem to have widely differing effects on the drift rates.
The mean drift rate and standard deviation at each temperature for the seven thermistors for the 13-year period is given in table 7; these mean drift rates are also plotted at the bottom in figure 4. Although the trend to larger drift rates with higher temperature is evident, the difference over the 60° temperature range is not great on the average. The temperature effect on the drift rate should be recognized and taken into account, however, because the effect on some thermistors can be large.
TABLE 7. Mean drift rates of seven thermistors at five temperatures over a 13-year period (Oct. 26, 1951-July 8, 1964)
Temperature (°C)
-30 -15
0 +15 +30
Mean drift rate Standard deviation
(10~3 deg C per mo)
-2.52 -3.05 -3.32 -3.76 -4.22
1.26 1.88 2.19 2.63 2.92
POSSIBLE EXPLANATIONS OF THERMISTOR DRIFT
Causes of thermistor drift may be chemical attack from a potting compound, mechanical shock, thermal shock, chemical deterioration by oxidation by diffusion or by electrolysis, and combinations of these causes. Although thermistors have been on the market a long time, their manufacture and, presumably, their composition and physical properties have not been changed during this period (G. L. Oddy, Western Electric Co., oral commun., 1959), Therefore, the reasons

B24 EXPERIMENTAL AND THEORETICAL GEOPHYSICS
0
-5
0
-5
crUJ 1 /-,o_ 10
UJ cQ -5
m +1
o -5o
tr<Q_Q- _ i
-5
No 124
No 125
No 127
No 128
No 154
No 1422
Mean
I I I I I
-30 -15 0 +15 +30
CALIBRATION TEMPERATURE, IN DEGREES C
FIGURE 4. Drift rates of seven thermistors at five temperatures between 30° and +30°C from 1951 to 1956 (solid lines) and from 1956 to 1964 (dashed lines).

PROPERTIES OF THERMISTORS B25
for secular drift of resistance should be the same in all thermistors, and comparisons may logically be made between them.
Direct chemical attack may be considered first. Fluids such as kerosene, which contains 0.1 to 1 percent sulfur, could permeate and attack the silver flash coating, because the porosity of a thermistor body is about 3 percent; or a chemical curing agent in the potting compound could attack the silver. Neither of these possibilities, however, explains the drift of the glass-coated bead thermistors immersed in such fluids (table 6). Staley (1952, p. 70) found that the drift of laboratory thermistors was the same as that of thermistors exposed to the weather, and concluded that weathering was not a cause of drift in his rod thermistors.
The five thermistors used in the study of precision of measurement (table 3) were tested for possible effects of mechanical shock. While in their glass tubes, each was tapped sharply 20 times against the edge of a table, almost hard enough to break the glass, but there was no measureable effect on their resistances. Inasmuch as a force of several hundred pounds per square inch is required to pull the copper wire leads from a thermistor, the mechanical bonding is good. Cables 315 and 321 were both subjected to rough handling in the field, and the insulation was abraded in many places, but despite this, the resulting drift of then* thermistors is not excessive. It thus appears that mechanical shock alone causes only a small part of the drift.
The effects of shock from heating or cooling on thermistor stability were demonstrated by Swartz and Raspet (1961) and by others (table 6). The very low drift rate in thermistors held at constant tempera ture and measured at >1-month intervals is discussed an page B21.
It is possible that the original sintering in each thermistor does not oxidize the manganese to the exact stoichiometric proportions of atoms with +2 and +3 valence; passage of electric current or heating im posed later would tend to stabilize the oxidation states and, presuma bly, to produce a lower conductivity. The passage of the electric current or heating might cause some disordering of atoms in the crystal grains and possibly produce a higher resistance.
Removal of impurity atoms by electrolysis could affect the resis tivity. The conduction of an electric current by a semiconducting material is presumed to occur by migration of electrons, holes, and ions, depending on the impurity content and type and on the tempera ture. An irreversible change of the crystal structural arrangement of atoms to a higher resistance state might be the cause of the thermistor drift. Thermistor raw materials are not highly purified, and one mechanism for rearrangement of atoms is the lattice diffusion of impurity ions, mobilized by direct electric current passing through the material.

B26 EXPERIMENTAL AND THEORETICAL GEOPHYSICS
Wenden (1957), in a study of this diffusion phenomenon in single- crystal quartz, found that there is a logarithmic change of resistivity with time, in which a rapid initial change is followed by a long-term (Yt to 40 days) decelerating increase of resistivity (amounting com monly to two orders of magnitude); Wenden attributed this conduc tion change to an electrolysis of impurity ions in the quartz. (There is a succeeding long-term steady-state conduction arising from elec trolysis of the silicon and oxygen atoms in the quartz.) He suggested that the impurity ions become irreversibly trapped in lattice defects or migrate to the sample surface, plate out, and thus become unavailable to act as charge carriers. A similar mechanism of impurity conduction could be the cause of the increase in resistivity of thermistors with time. This explanation tends to be supported in that thermistors which are not subjected very often to electric current have a low drift rate compared with that of thermistors in cables, which are subjected quite often to electric current.
As the resistance change per unit time (that is, the drift) is very small in proportion to the total resistance of the thermistor, the processes causing drift, whether electrolysis, oxidation, ordering, diffusion, or something else, seem to affect only a small proportion of atoms in the whole thermistor body. Electrolysis (Wenden, 1957), oxidation, disordering, and diffusion are accelerated by an increase in tempera ture, so the annealing heat treatment given to thermistors to age and stabilize them would speed up these processes.
SIMPLIFIED METHOD FOR CONVERSION OF RESISTANCE TO TEMPERATURE
The calibration curves of reciprocal temperature versus log resist ance for different 17A thermistors are very similar in curvature and not very different in magnitude, as shown in figure 5. Most curves for 17A thermistors fall within the upper and lower curves shown in the figure. Coordinate differences are small and change smoothly and slowly with temperature. Because of this close parallelism, a simple master table for all thermistors can be used to convert resistance to temperature instead of a separate table for each thermistor. The conversion of the resistance reading to temperature for a given thermistor can be easily accomplished by obtaining a trial temperature value from the master table and then correcting this value to the actual temperature of the thermistor.
The resistance-to-temperature calibrations, at 30°, 15°, 0°, + 15°, and +30°C, of thermistor 4249 were found to vary uni formly and were used to construct a master table. The calibration

PROPERTIES OF THERMISTORS B27
3X10 4
o <3X10 3
4X10 2
I I
+ 30°C I
+ 15"C 0°C -15°CI
-30°C
3.3 3.4 3.5 3.6 3.7 3.8 3.9
RECIPROCAL TEMPERATURE, IN 10" 3 DEGREES
4.0
KELVIN
4.1
FIGURE 5. Parallelism and approximate range of curves of log resistance versus reciprocal temperature for type-l7A thermistors.
technique is described by Raspet, Swartz, Lillard, and Robertson (1966); temperatures are accurate to ±0.005°C, and relative resist ances are accurate to 1 part in 10s. The calibration data for thermistor 4249 were fitted to Swartz's (1954) equation, log R=A+B(T+(T)-1 ) where R is resistance, in ohms; Tis temperature, in degrees Celsius; and A, B, and C are constants. Using the proper constants in the equation, resistance-temperature values were calculated for integral degrees between 30° and +40°C; the values were then smoothed by the difference method. Linear interpolations to 0.1°C were made and proportional parts to 0.01°C were calculated throughout; the results are given in table 8. In determining temperature differences <C5°C, the uncertainty inherent in the table is estimated to be ±0.01°C.

B28 EXPERIMENTAL AND THEORETICAL GEOPHYSICS
TABLE 8. Master table for conversion of thermistor resistance to temperature
&.R (0)
968675645343322111
908070605040302010
83.774.465.155.846.537.227.918.69.3
78.169.460.752.143.434.726.017.48.7
72.964.856.748.640.532.424.316.28.1
68.160.653.045.437.930.322.715.17.6
63.657.649.542.435.428.221.214.17.1
E(a)
17, 516. 017,409.017, 302. 017, 195. 017, 088. 016,982.016, 875. 016,768.016, 661. 016, 554. 016, 447. 0
16,347.016, 248. 016, 148. 016,049.015,949.015,849.015, 750. 015, 650. 015, 551. 015, 451. 0
15,358.015, 265. 015, 172. 015, 079. 014,986.014, 893. 014, 800. 014, 707. 014, 614. 014, 521. 0
14, 434. 014,347.014,261.014, 174. 014, 087. 014,000.013, 913. 013, 827. 013,740.013, 653. 0
13,572.013, 491. 013, 410. 013,329.013,248.013, 167. 013, 086. 013, 005. 012, 924. 012,843.0
12, 768. 012, 692. 012, 616. 012, 540. 012, 465. 012, 389. 012,313.012, 238. 012, 162. 012, 086. 0
12, 016. 011,945.011, 874. 011,803.011, 733. 011, 662. 011,591.011, 521. 011, 450. 011, 379. 0
T (°C)
-30.00-29.90-29.80-29. 70-29.60-29.50-29.40-29.30-29.20-29. 10-29.00
-28.90-28.80-28.70-28.60-28.50-28.40-28.30-28.20-28.10-28.00
-27.90-27.80-27. 70-27.60-27.50-27.40-27. 30-27. 20-27. 10-27.00
-26.90-26. 80-26.70-26.60-26. 50-26.40-26.30-26. 20-26. 10-26.00
-25. 90-25.80-25.70-25.60-25. 50-25.40-25.30-25. 20-25. 10-25.00
-24.90-24.80-24. 70-24.60-24.50-24.40-24.30-24.20-24.10-24.00
-23.90-23.80-23.70-23.60-23.50-23.40-23.30-23.20-23.10-23.00
AR(Q)
59.552.946.339.733.126.419.813.26.6
55.749.543.337.131.024.818.612.46.2
52.146.340.534.728.923.217.411.65.8
48.843.437.932.527.121.716.310.85.4
45.740.635.630.525.420.315.210.25.1
42.838.133.328.623.819.014.39.54.7
40.235.731.326.822.317.813.48.94.5
R (Q)
11,379.011,313.011,247.011, 181. 011, 115. 011, 049. 010, 982. 010,917.010, 850. 010, 784. 010, 718. 0
10, 656. 010, 594. 010, 533. 010,471.010, 408. 010,347.010, 285. 010, 223. 010, 161. 010, 099. 0
10, 041. 09,983.09,926.09, 868. 09, 810. 09, 752. 09, 694. 09, 636. 09, 578. 09, 520. 2
9,466.09, 411. 89,357.69, 303. 49, 249. 29, 195. 09, 140. 89, 086. 69, 032. 48,978.1
8,927.38, 876. 58, 825. 78, 774. 98, 724. 18,673.38, 622. 58, 671. 18,520.98,470.2
8,422.68, 375. 08,327.48, 279. 88, 232. 28, 184. 68, 137. 08, 089. 48, 041. 87,994.1
7,949.47,904.77,860.07,815.37,770.67, 725. 97, 681. 27,636.57, 591. 87, 547. 5
T(°C)
-23.00-22.90-22.80-22. 70-22.60-22.50-22. 40-22. 30-22.20-22. 10-22.00
-21.90-21.80-21.70-21.60-21.50-21.40-21. 30-21.20-21. 10-21. 00
-20.90-20.80-20.70-20.60-20.50-20.40-20.30-20.20-20. 10-20.00
-19.90-19.80-19.70-19.60-19.50-19.40-19.30-19.20-19. 10-19.00
-18. 90-18.80-18. 70-18.60-18.50-18,40-18.30-18.20-18. 10-18.00
-17.90-17. 80-17. 70-17.60-17.50-17.40-17.30-17.20-17. 10-17.00
-16. 90-16.80-16. 70-16.60-16.50-16.40-16. 30-16.20-16. 10-16.00
AJJ(Q)
37.733.529.325.121.016.812.68.44.2
35.431.527.523.619.715.711.87.93.9
33.229.625.622.218.514.811.17.43.7
31.227.824.320.817.413.910.46.93.5
29.326.122.819.616.313.09.86.53.3
27.624.521.518.415.312.39.26.13.1
25.933.120.217.314.411.58.65.82.9
R(Q)
7,547.57,505.67, 463. 77, 421. 87, 379. 97,338.07, 296. 17, 254. 27,212.37, 170. 47, 128. 5
7, 089. 27,049.87, 010. 56, 971. 26,931.96, 892. 56, 853. 26, 813. 96, 774. 56, 735. 2
6, 698. 36, 661. 46,624,56, 587. 66, 550. 76, 513. 86, 476. 96,440.06, 403. 16, 365. 8
6, 331. 16, 296. 46. 261. 76, 227. 06, 192. 36,157.66, 122. 96, 088. 26, 053. 56, 018. 7
5,986.15, 953. 55, 920. 95,888.35, 855. 75, 823. 15, 790. 55, 757. 95, 725. 35,692.6
5,661.95, 631. 35,600.65, 570. 05, 539. 35, 508. 65,478.05, 447. 35, 416. 75,386.0
5,357.25, 328. 35, 299. 55, 270. 75, 241. 95, 213. 05, 184. 25, 155. 45, 126. 55,097.7
T (°C)
-16.00-15.90-15.80-15. 70-15.60-15. 50-15.40-15.30-15.20-15. 10-15.00
-14. 90-14. 80-14. 70-14.60-14.50-14. 40-14.30-14.20-14. 10-14.00
-13.90-13. 80-13. 70-13. 60-13.50-13. 40-13.30-13. 20-13. 10-13.00
-12.90-12.80-12. 70-12.60-12.50-12.40-12.30-12. 20-12. 10-12.00
-11.90-11.80-11.70-11.60-11. 50-11.40-11.30-11.20-11. 10-11.00
-10. 90-10.80-10.70-10.60-10.50-10.40-10. 30-10. 20-10. 10-10.00
-9.90-9.80-9.70-9.60-9.50-9.40-9.30-9.20-9.10-9.00
AR(Q)
24.427.419.016.313.610.98.15.42.7
23.020.417.915.312.810.27.75.12.6
21.619.216.814.412.09.67.24.82.4
20.418.115.813.611.39.06.84.52.3
19.217.014.912.810.78.56.44.32.1
20.118.116.014.012.010.08.04.02.0
17.015.113.211.39.57.65.73.81.9
R(Q)
5,097.75, 070. 65, 043. 45, 016. 34, 989. 24, 962. 14,934.94,907.84,880.74, 853. 54,826.4
4,800.94,775.44, 749. 84, 724. 34, 698. 84,673.34, 647. 84,622.24, 596. 74, 571. 2
4, 547. 24, 523. 24, 499. 14, 475. 14, 451. 14, 427. 14,403.14, 379. 04, 355. 04, 331. 0
4, 308. 44, 285. 84, 263. 14, 240. 54, 217. 94, 195. 34, 172. 74, 150. 04, 127. 44,104.8
4, 083. 54, 062. 24, 040. 94, 019. 63, 998. 33, 977. 03, 955. 73,934.43, 913. 13, 891. 8
3, 871. 73, 851. 73,831.63, 811. 63, 791. 53, 771. 43, 751. 43, 731. 33, 711. 33,691.2
3, 672. 33, 653. 43,634.33, 615. 63,596.73, 577. 83,558.93,540.03, 521. 13, 502. 2
T(°C)
-9.00-8.90-8.80-8.70-8.60-8.50-8.40-8.30-8.20-8.10-8.00
-7.90-7.80-7.70-7.60-7.50-7.40-7.30-7.20-7.10-7.00
-6.90-6.80-6.70-6.60-6.50-6.40-6.30-6.20-6.10-6.00
-5.90-5.80-5.70-5.60-5.50-5.40-5.30-5.20-5.10-5.00
-4.90-4.80-4.70-4.60-4.50-4.40-4.30-4.20-4.10-4.00
-3.90-3.80-3.70-3.60-3.50-3.40-3.30-3.20-3.10-3.00
-2.90-2.80-2.70-2.60-2.50-2.40-2.30-2.20-2.10-2.00

PROPERTIES OF THERMISTORS B29
TABLE 8. Master table for conversion of thermistor resistance to temperature Continued
AR (0)
16.014.212.510..78.97.15.33.61.8
15.113.411.810.18.46.75.03.41.7
1.63.24.86.37.99.5
11.112.714.3
1.53.04.55.67.59.0
10.512.013.5
1.42.84.25.67.18.59.9
11.312.7
1.32.74.05.36.78.09.3
10.712.0
1.32.53.85.06. 37.68.8
11.312.6
R(0)
3,502.23, 484. 43, 466. 63,448.73, 430. 93, 413. 13, 395. 33, 377. 53,359.63, 341. 83, 324. 0
3, 307. 23, 290. 43, 273. 63,256.83, 240. 03,223.23,206.43, 189. 63, 172. 83, 156. 0
3, 140. 23, 124. 33, 108. 53, 092. 63, 076. 83, 060. 93, 045. 13, 029. 23, 013. 42, 997. 5
2,982.62,967.62, 952. 72, 937. 72, 922. 82,907.82, 892. 92, 877. 92, 863. 02, 848. 0
2, 833. 92, 819. 82, 805. 72,791.62, 777. 52, 763. 32, 749. 22, 735. 12, 721. 02,706.9
2, 693. 62, 680. 22, 666. 92,653.62,640.32,626.92, 613. 62,600.32,586.92, 573. 6
2, 561. 02,548.42, 535. 82, 523. 22,510.62, 498. 02, 485. 42, 472. 82,460.22,447.6
T(°C)
-2.00-1.90-1.80-1.70-1.60-1.50-1.40-1.30-1.20-1.10-1.00
-0.90-0.80-0.70-0.60-0.50-0.40-0.30-0.20-0.10
0.00
+0.10+0.20+0.30+0.40+0.50+0.60+0.70+0.80+0.90+1.00
+1.10+1.20+1.30+1.40+1.50+1.60+1.70+1.80+1.90+2.00
+2.10+2.20+2.30+2.40+2.50+2.60+2.70+2.80+2.90+3.00
+3.10+3.20+3.30+3.40+3.50+3.60+3.70+3.80+3.90+4.00
+4.10--4. 20--4. 30--4. 40--4. 50--4. 60--4. 70--4. 80--4. 90--5. 00
AR(0)
1.22.43.64.86.07.18.39.5
10.7
1.12.33.44.55.66.87.99.0
10.1
1.12.13.24.35.36.47.58.59.6
1.02.03.04.05.06.07.18.19.1
1.01.92.93.84.85.76.77.68.6
0.91.82.73.64.55.46.37.28.1
0.91.72.63.44.35.16.06.87.7
R(S3)
2,447.62,435.72, 423. 82, 411. 92, 400. 02, 388. 12,376.12, 364. 22, 352. 32, 340. 42, 328. 5
2, 317. 22, 306. 02, 294. 72,283.52, 272. 22, 260. 92, 249. 72, 238. 42,227.22, 215. 9
2, 205. 32, 194. 62, 184. 02, 173. 32, 162. 72, 152. 02, 141. 42, 130. 72, 120. 12,109.4
2,099.32, 089. 22, 079. 22, 069. 12, 059. 02, 048. 92, 038. 82, 028. 82,018.72,008.6
1,999.11, 989. 51, 978. 01,970.41,960.91, 951. 41,941.81,932.31, 922. 71, 913. 2
1,904.21, 895. 11, 886. 11, 877. 01, 868. 01,859.01, 849. 91,840.91, 831. 81, 822. 8
1,814.31,805.71, 797. 21, 788. 61,780.11, 771. 51,763.01,754.41,745.91,737.3
T(°C)
+5.00+5.10+5.20+5.30+5.40+5.50+5.60+5.70+5.80+5.90+6.00
+6.10
K.20.30
+6.40+6.50+6.60+6.70+6.80+6.90+7.00
+7.10+7.20+7.30+7.40+7.50+7.60+7.70+7.80+7.90+8.00
+8.10+8.20+8.30+8.40+8.50+8.60+8.70+8.80+8.90+9.00
+9.10+9.20+9.30+9.40+9.50+9.60+9.70+9.80+9.90
+10.00
+10. 10- -10. 20--10.30--10.40- -10. 50--10.60- -10. 70+10.80+10.90+11.00
+11. 10--11.20--11.30- -11. 40--11.50--11.60--11.70+11.80+11.90+12.00
AR(Q)
0.81.62.43.24.14.95.76.57.3
0.81.52.33.13.84.65.46.16.9
0.71.52.22.93.64.45.15.86.5
0.71.42.12.83.44.14.85.56.2
0.71.32.02.63.33.94.65.25.9
0.61.21.92.53.13.74.35.05.6
0.61.11.82.42.93.54.14.75.3
R(Q)
1,737.31,729.21, 721. 11,713.01, 704. 91, 696. 81,688.71, 680. 61, 672. 51, 664. 41, 656. 3
1,648.61,640.91, 633. 31, 625. 61,617.91, 610. 21,602.51, 594. 91, 587. 21, 579. 5
1, 572. 21, 565. 01,557.71,550.41, 543. 21,535.91, 528. 61, 521. 31, 514. 1
1, 506. 76
1, 499. 871, 492. 971, 486. 081, 479. 191,472.301, 465. 401, 458. 511, 451. 621, 444. 721, 437. 83
1, 431. 291, 424. 761, 418. 221, 411. 681, 405. 151, 398. 611, 392. 071,385.531,379.001,372.46
1, 366. 261,360.061,353.861,347.661,341.461,335.261, 329. 061, 322. 861, 316. 661, 310. 46
1,304.581,298.691, 292. 811, 286. 931, 281. 051, 275. 161,269.281,263.401,257.511, 251. 63
T(°C)
+12. 00+12. 10+12. 20+12.30+12.40+12. 50+12.60+12.70+12. 80+12. 90+13.00
+13. 10+13.20+13.30+13.40+13.50+13.60+13. 70+13.80+13.90+14.00
+14. 10+14.20+14.30+14. 40+14. 50+14.60+14. 70+14. 80+14. 90+15. 00
+15. 10+15.20+15.30+15.40+15. 504-15.60+15. 70+15. 80+15.90+16.00
+16. 10+16.20+16. 30+16.40+16.50+16. 60+16.70+16. 80+16.90+17.00
+17. 10+17.20+17.30+17.40+17. 50+17.60+17.70+17. 804-17. 90+18.00
+18. 10+18.20+18. 304-18. 40+18. 50+18.60+18.70hl8. 80
+18.90K9.00
AR(Q)
0.61.11.72.22.83.43.94.55.0
0.51.11.62.12.73.23.74.24.8
0.51.01.52.02.53.03.54.04.5
0.51.01.41.92.42.93.43.84.3
0.50.91.41.82.32.73.23.64.1
0.430.871.301.732.172.603.033.473.90
0.410.821.231.652.062.472.893.303.71
R(Q)
1,251.631,246.041,240.461,234.871, 229. 291, 223. 701, 218. 111, 212. 531,206.941, 201. 361, 195. 77
1, 190. 471, 185. 161, 179. 861,174.551, 169. 251, 163. 951, 158. 641,153.341, 148. 031, 142. 73
1, 137. 691, 132. 641, 127. 611, 122. 571,117.531, 112. 481, 107. 441, 102. 401,097.361, 092. 32
1, 087. 531,082.741, 077. 951,073.161, 068. 371, 063. 571,058.781, 053. 991, 049. 201,044.41
1, 039. 851, 035. 301, 030. 741,026.191, 021. 631,017.071, 012. 521, 007. 961,003.41
998.85
994.52990.18985.85981.51977.18972.85968.51964.18959.84955:51
951. 39947.26943.14939. 01934.89930.76926.64922.51918. 39914.26
T(°C)
+19.00+19. 10- -19. 20--19.30--19.40--19.50--19.60+19. 70+19.80+19.90+20.00
+20.10+20.20+20.30+20.40+20.50+20.60+20. 70+20. 80+20.90+21.00
+21. 10+21.20+21.30+21.40+21. 50+21. 60+21.70+21. 80+21.90+22.00
+22.104-22.20+22.30+22.40+22. 50+22.60+22.70+22.80+22.90+23.00
+23.104-23.20+23.30+23.40+23.50+23.60J-23.70J-23.80+23.90+24.00
+24.10+24.20--24.30--24.40--24.50
-24.60--24.70
-24.80--24.90
-25.00
+25.10+25.20+25.30 J-25.40+25.50+25.60+25. 70+25.80+25.90+26.00

B30 EXPERIMENTAL AND THEORETICAL GEOPHYSICS
TABLE 8. Master table for conversion of thermistor resistance to temperature Continued
A.R (0)
0.390.791.181.571.962.362.753.143.54
0.370.751.121.501.872.252.622.993.37
0.360.711.071.431.782.142.502.853.21
0.340.681.021.361.702.042.382.723.06
RW
914. 26910. 33906.40902. 47898.54894. 62890. 69886.76882.83878. 90874.97
871. 23867.49863.74860.00856. 26852. 52848.78845.03841.29837. 55
833. 98830. 42826.85823. 29819. 72816. 15812. 59809.02805.46801.89
798. 49795. 05791. 69788.29784.89781. 48778. 08774.68771.28767. 88
T(°C)
+26. 00+26.10+26. 20+26.30+26.40+26.50+26.60+26.70+26.80+26.90+27.00
+27.10+27.20+27. 30+27. 40+27.50+27.60+27. 70+17.80+27.90+28.00
+28. 10+28.20+28.30+28.40+28. 50+28.60+28.70+28.80+28.90+29.00
+29.10+29.20+29.30+29.40+29.50+29.60+28.70+29.80+29.90+30.00
A.R(n)
0.320.650.971.301.621.952.272.592.92
0.310.620.931.241.551.862.172.482.79
0.300.590.871.181.481.772.072.362.66
0.280.560.851.131.411.691.982.262.54
R(S3)
767. 88764.64761.39758. 15754.91751. 67748. 42745. 18741.94738. 69735. 45
732.35729.26726. 16723.07719.97716. 87713. 78710. 68707. 59704.49
701.53698. 58695. 62692. 67689.71686.75683.80680.84677. 89674.93
672. 11669.28666.46663.63660.81657.99655. 16652.34649.51646.69
T(°C)
+30. 00+30.10+30.20+30. 30+30. 40+30. 50+30. 60+30. 70+30. 80+30. 90+31.00
+31. 10+31.20+31.30+31.40+31.50+31.60+31. 70+31.80+31. 90+32.00
+32. 10+32.20+32.30+32.40+32. 50+32.60+32. 70+32.80+32. 90+33. 00
+33. 10+33. 20+33.30+33. 40+33.50+33.60+33. 70+33.80+33.90+34.00
A.R(n)
0.270.540.811.081.351.621.892.162.43
0.260.520.771.031.291.551.812.062.32
0.250.490.740.991.231.481.731.982.22
0.240.470.710.951.181.421.651.892.13
R(0)
646.69643.99641.29638.59635.89633.20630. 50627.80625. 10622.40619. 70
617. 12614. 54611. 96609.38606.80604.21601.63599. 05596.47593. 89
591. 42588.95586.48584. 01581.55579. 08576. 61574. 14571. 67569.20
566.84564.47562. 11559. 74557.38555. 02552.65550. 29547.92545.56
T(°C)
+34. 00+34. 10+34. 20+34.30+34. 40+34. 50+34. 60+34. 70+34.80+34.90+35.00
+35. 10+35.20+35.30+35.40+35. 50+35.60+35. 70+35.80+35.90+36.00
+36. 10+36.20+36. 30+36.40+36.50+36.60+36. 70+36.80+36.90+37. 00
+37. 10+37. 20+37. 30+37. 40+37. 50+37.60+37. 70+37.80+37.90+38.00
Atf(0)
0.230.450.680.911.131.361.581.812.04
0.220.430.650.871.081.301.521.741.95
R(Q)
545. 56543.30541. 03538.77536.51534.25531.98529.72527.46525. 19522.93
520.76518.59516.42514. 25512. 09509.92507. 75505. 58503.41501.24
T(°C)
+38.00+38. 10+38.20+38.30+38.40+38.50+38.60+38.70+38.80+38.90+39. 00
+39. 10+39. 20+39.30+39. 40+39.50+39.60+39. 70+39.80+39.90+40.00
A correction table for a given thermistor can be determined from its calibration data and the master table as follows: The resistance of the thermistor at each calibration point is converted to a trial temperature from the master table, and the difference of this trial temperature from the thermistor's calibration temperature (measured with the platinum thermometer) is calculated. A smooth curve is drawn through values of this difference plotted against the calibration temperature; the corrections can be taken from the curve. The corrections rarely change more than 0.01°C over 1° intervals, hence corrections in a temperature range of a few degrees are easily tab ulated and applied.
As an example to clarify the calculation procedure, observations and calculations on thermistor 4550 can be examined. The pertinent data are listed hi table 9. Calibration measurements are tabulated in columns 1 and 2; trial conversions of thermistor resistance to

PROPERTIES OF THERMISTORS B31
temperature are in column 3; temperature differences between data in columns 1 and 3 are given in column 4. Data in column 4 were plotted, and the smoothed data from the curve are given in column 5 for the nominal temperatures in column 6; corrections would be closer if listed at 1° intervals of nominal temperature.
TABLE 9. Determination of temperature corrections for thermistor 4650
(I)Platinum-
thermometertemperature(°C)
-30.31
-14.99
-.01
+15. 07
+30.04
(2) Thermistor resistance
(ohms)
18,214
7, 258. 9
3, 219. 1
1, 531. 1
781. 79
(3) Temperature
from master table(°C)
-30. 61
-15.32
-.38
+14. 66
+29. 58
m (4)Temperature difference(D-(3)(°C)
+0.30
.33
.37
.41
.46
m (5) *Temperature correction
(°C)
+0.30.31.32.33.34.35.37.38.39.41.43.44.46
(6) Nominal
temperature(°C)
-30-25-20-15-10 5
0+5
+10+15+20+25+30
As an example of the use of the data in table 9, let us assume that thermistor 4550 has been installed in a cable and has been lowered to some depth in a drill hole, at which the resistance is measured to be 3,991.7 ohms. This resistance includes of course that of both the thermistor and its circuit. If the lead wire resistance is 2.3 ohms, then the thermistor resistance will be 3,989.4 ohms. For this re sistance, the trial temperature from the master table, table 8, will be between 4.40° and 4.50°C. The thermistor resistance is 12.4 ohms greater than that for 4.40°C, and in the AR column, this difference is nearest that corresponding to 0.06°C; the trial temperature therefore is 4.46°C. Note that the hundredth digit, the 6, is determined by inspection of the one-tenth digit in the T column; thus the space of another column is saved. The applicable correction from column 5 of table 9 is +0.35°C; adding algebraically, the temperature equivalent to the hypothetical resistance reading is -4.11°C.
As another example, if the thermistor resistance reading (corrected for lead resistance) were 2,051.5 ohms, the corresponding trial tem perature from table 8 would be between +8.50° and +8.60°C. The thermistor resistance is 7.5 ohms less than that for +8.50°C, and this difference is near the &R value for 0.07°C. The trial tem perature then is +8.57°C. Applying the correction of +0.39°C from table 9, the actual temperature is +8.96°C.

B32 EXPERIMENTAL AND THEORETICAL GEOPHYSICS
REFERENCES
Beck, A. E., 1956, The stability of thermistors: Jour. Sci. Instruments, v. 33,p. 16-17.
1962, Terrestrial flow of heat near Flin Flon, Manitoba: Nature, v. 195,no. 4839, p. 368-369.
1963, Lightweight borehole temperature measuring equipment for resistance thermometers: Jour. Sci. Instruments, v. 40, no. 9, p. 452-454.
Beck, A. E., Jaeger, J. C., and Newstead, G., 1956, The measurement of the ther mal conductivities of rocks by observations in boreholes: Australian Jour. Physics, v. 9, no. 2, p. 286-296.
Becker, J. A., Green, C. B., and Pearson, G. L., 1946, Properties and uses of ther mistors thermally sensitive resistors: Am. Inst. Elec. Engineers Trans., v. 65, p. 711-725.
Bosson, G., Gutmann, F., and Simmons, L. M., 1950, A relationship between resistance and temperature of thermistors: Jour. Applied Physics, v. 21, p. 1267-1268.
Brewer, M. C., 1958, Some results of geothermal investigations of permafrost in northern Alaska: Am. Geophys. Union Trans., v. 39, no. 1, p. 19-26.
Bullard, E. C., 1960, Measurement of temperature gradient in the earth, in Runcorn, S. K., ed., Methods and techniques in geophysics: New York, Inter- science Publishers, v. 1, p. 1-9.
Chadwick, P., 1956, Heat flow from the earth at Cambridge: Nature, v. 178, no. 4524, p. 105-106.
Cooper, L. R., and Jones, C., 1959, The determination of virgin strata temper atures from observations in deep survey boreholes: Royal Astron. Soc. Geo phys. Jour., v. 2, p. 116-131.
Diment, W. H., and Robertson, E. C., 1963, Temperature, thermal conductivity, and heat flow in a drilled hole near Oak Ridge, Tennessee: Jour. Geophys. Research, v. 68, no. 17, p. 5035-5047.
Diment, W. H., and Weaver, J. D., 1964, Subsurface temperatures and heat flow in the AMSOC core hole near Mayaguez, Puerto Rico, in Burk, C. A., ed., A study of serpentinite: The AMSOC core hole near Mayaguez, Puerto Rico: Natl. Acad. Sci.-Natl. Research Council Pub. 1188, p. 75-91.
Diment, W. H., and Werre, R. W., 1964, Terrestrial heat flow near Washington: Jour. Geophys. Research, v. 69, no. 10, p. 2143-2149.
Droms, C. R., 1962, Thermistors for temperature measurements, in Am. Inst. Physics, Temperature, its measurement and control in science and industry: New York, Reinhold Publishing Corp., v. 3, pt. 1, p. 339-346.
Garland, G. D., and Lennox, D. H., 1962, Heat flow in western Canada: Royal Astron. Soc. Geophys. Jour., v. 6, p. 245-262.
Greene, G. W., Lachenbruch, A. H., and Brewer, M. C., 1960, Some thermal effects of a roadway on permafrost, in Short papers in the geological sciences: U.S. Geol. Survey Prof. Paper 400-B, p. B141-B144.
Horai, Ki-iti, 1959, Terrestrial heat flow at Hitachi, Ibaraki Prefecture, Japan: Earthquake Research Institute Bull., v. 37, p. 571-592.
Lachenbruch, A. H., 1957, A probe for measurement of thermal conductivity of frozen soils in place: Am. Geophys. Union Trans., v. 38, no. 5, p. 691-697.
Lachenbruch, A. H., and Brewer, M. C., 1959, Dissipation of the temperature effect of drilling a well in Arctic Alaska: U.S. Geol. Survey Bull. 1083-C, p. 73-109.

PROPERTIES OF THERMISTORS B33
Lachenbruch, A. H., Brewer, M. C., Greene, G. W., and Marshall, B. V., 1962, Temperatures in permafrost, in Am. Inst. Physics, Temperature, its measure ment and control in science and industry: New York, Reinhold Publishing Corp., v. 3, pt. 1, p. 791-803.
LaFond, E. C., 1962, Temperature structure of the upper layer of the sea and its variation with tune, in Am. Inst. Physics, Temperature, its measurement and control in science and industry: New York, Reinhold Publishing Corp., v. 3, pt. 1, p. 751-767.
MacCarthy, G. R., 1952, Geothermal investigations on the Arctic slope of Alaska: Am. Geophys. Union Trans., v. 33, no. 4, p, 589-593.
Miller, Maynard M., 1958, Phenomena associated with the deformation of a glacier bore-hole: Internat. Geod. Geophys. Union, Assoc. Sci. Hydrology Assembly, Toronto, 1957, v. 4, p. 437-452.
Misener, A. D., and Beck, A. E., 1960, The measurement of heat flow over land, in Runcorn, S. K., ed., Methods and techniques in geophysics: New York, Interscience Publishers, v. 1, p. 10-61.
Misener, A. D., Bremner, P. C., and Hodgson, J. H., 1956, Heat flow measure ments in permafrost at Resolute Bay, Northwest Territories: Royal Astron. Soc. Canada Jour., v. 50, no. 1, p. 14-24.
Misener, A. D., and Thompson, L. G. D., 1952, The pressure coefficient of resist ance of thermistors: Canadian Jour. Technology, v. 30, p. 89-94.
Misener, A. D., Thompson, L. G. D., and Uffen, R. J., 1951, Terrestrial heat flow in Ontario and Quebec: Am. Geophys. Union Trans., v. 32, no. 5, p. 729-738.
Mooser, E., 1960, Semiconducting compounds: Science, v. 132, no. 3436, p. 1285- 1291.
Muller, R. H., and Stolten, H. J., 1953, Use of thermistors in precise measure ment of small temperature differences: Anal. Chemistry, v. 25, no. 7, p. 1103- 1106.
Newstead, G., and Beck, A. E., 1953, Borehole temperature measuring equip ment and the geothermal flux in Tasmania: Australian Jour. Physics, v. 6, p. 480-489.
Nielsen, K. E. C., 1959, Temperature measurements with thermistors in concrete: Swedish Cement and Concrete Research Inst. Bull., no. 34, 44p.
Raspet, Rudolph, Swartz, J. H., Lillard, M. E., and Robertson, E. C., 1966, Preparation of thermistor cables used in geothermal investigations: U.S. Geol. Survey Bull. 1203-C, p. C1-C11.
Revelle, R. R. D., and Maxwell, A. E., 1952, Heat flow through the floor of the eastern North Pacific Ocean: Nature, v. 170, no. 4318, p. 199-202.
Sachse, H. B., 1962, Measurement of low temperatures with thermistors, in Am. Inst. Physics, Temperature, its measurement and control in science and industry: New York, Reinhold Publishing Corp., v. 3, pt. 2, p. 347-359.
Sass, J. H., and LeMarne, A. E., 1963, Heat flow at Broken Hill, New South Wales: Royal Astron. Soc. Geophys. Jour., v. 7, no. 4, p. 477-489.
Saull, V. A., Clark, T. H., Doig, R. P., and Butler, R. B., 1962, Terrestrial heat flow in the St. Lawrence Lowland of Quebec: Canadian Inst. Mining Metal lurgy Trans., v* 65, p. 63-66.
Sillars, R. W., 1942, Materials and devices of falling resistance-temperature characteristic: Jour. Sci. Instruments, v. 19, no. 6, p. 81-84.
Staley, R. C., 1952, Performance characteristics of Sanborn rod thermistors: Am. Meteorol. Soc. Bull., v. 33, no. 2, p. 67-72.

B34 EXPERIMENTAL AND THEORETICAL GEOPHYSICS
Swartz, J. H., 1954, A geothermal measuring circuit: Science, v. 120, no. 3119,p. 573-574.
1958, Geothermal measurements on Eniwetok and Bikini Atolls, U.S. Geol.Survey Prof. Paper, 260-U, p. 711-739.
Swartz, J. H., and Raspet, R., 1961, Thermal shock and its effect on thermistordrift: Nature, v. 190, no. 4779, p. 875-878.
Tavernier, Paul, and Prache, Pierre, 1952, Influence de la pression sur la re'sistivite'd'une thermistance: Jour. Physique et Radium, v. 13, p. 423-426.
Thomas, James L., 1941, Reproducibility of the ice point, in Am. Inst. Physics,Temperature, its measurement and control in science and industry: NewYork, Reinhold Publishing Corp., p. 159-161.
Von Herzen, R. P., 1962, Measurement of heat flow through the ocean floor, inAm. Inst. Physics, Temperature, its measurement and control in science andindustry: New York, Reinhold Publishing Corp., v. 3, pt. 1, p. 769-777.
Wenden, H. E., 1957, Ionic diffusion and the properties of quartz, the directcurrent resistivity: Am. Mineralogist, v. 42, no. 11-12, p. 859-888.

Preparation of Thermistor Cables Used in Geothermal InvestigationsBy RUDOLPH RASPET, JOEL H. SWARTZ, MAJOR E. LILLARD, and EUGENE C. ROBERTSON
EXPERIMENTAL AND THEORETICAL GEOPHYSICS
GEOLOGICAL SURVEY BULLETIN 1203-C
Thermistor calibration and fabrication of multithermistor cables for temperature logging


CONTENTS
PageAbstract .-__-___-_.___________________________._ ClIntroduction-- _-.______________________________.__ 1Calibration. __________._____.__________________ 2
Constant-temperature bath for thermistors_______________________ 2Ice-point calibrations of thermistor cables________________________ 5
Thermistor cables.________________________________________________ 7Construction ________________________________________________ 7Use and care._______________________________________________ 10
References _____________________________________________________ 11
ILLUSTRATIONS
Page FIGURE 1. Sketch of bath for calibration of thermistors in the range 30°
to +70°C___-__-_-________-_______ ______________-__--. C32. Diagram of thermistor and platinum-thermometer circuits.. __ 43. Diagrammatic cut-away section of a thermistor installation in
a multiconductor cable________________________________ 8in


EXPERIMENTAL AND THEORETICAL GEOPHYSICS
PREPARATION OF THERMISTOR CABLES USED IN GEOTHERMAL INVESTIGATIONS
By RUDOLPH RASPET, JOEL H. SWARTZ, MAJOR E. LILLARD, and EUGENE C. ROBERTSON
ABSTRACT
Each thermistor that is used for temperature measurement must be calibrated in the temperature range of interest because the resistances of thermistors and their rates of change with temperature vary, and they are not interchangeable for precise measurements. In the calibration procedure used by the Geological Survey, the resistance of each thermistor is measured in a bath controlled to ±0.002°C, at temperatures of 30°, -15°, 0°, +15°, and +30°C, which are determined to 0.001°C with a platinum thermometer. The resistance bridges and the platinum thermometer used in the calibration have been calibrated by the National Bureau of Standards.
Useful procedures for installation and later recalibration of thermistors in multiconductor cables, used in logging temperatures of drill holes, have been developed by the Geological Survey. Installation of thermistors in cables requires care in each operation: opening the insulation, proper identification of conductors, making the electrical connections, potting the thermistors, and sealing the cable opening and ends against moisture. Alternatively, individual metallic or plastic pods may be built into the cable to contain the thermistors.
Calibrations of thermistors in a cable are checked after installation by putting the whole cable in an ice bath, a fairly easy way to attain a fixed temperature, reliably found to be within ± 0.01° C of 0°C.
Determinations of temperature in boreholes can be made quickly and in expensively with thermistors because their resistances are measured easily with a portable resistance bridge, and their small size permits easy and effective installa tion in a cable. Fabrication procedures of the Geological Survey for mounting and inserting thermistors at intervals in a multiconductor cable have been used successfully for thermistor logging cables as much as 5,000 feet long.
INTRODUCTION
In general, no two commercial thermistors of any particular type have the same resistance at a given temperature nor do they have the same change of resistance with temperature. Therefore, each thermistor should be calibrated before it is put in a cable, and the Geological Survey, has developed a procedure for the calibration of
Cl

C2 EXPERIMENTAL AND THEORETICAL GEOPHYSICS
thermistors at five temperatures. After the thermistors are installed in a cable, a fairly easy calibration check can be made at the ice point (0°C) by immersing the thermistors and the adjacent length of cable in a box of shaved melting ice. Details of this procedure are described herein.
Details of installing thermistors in multiconductor cables are not widely known and are given here. Such cables can sometimes be more useful than single thermistor cables, especially for dry holes where measurement of the steady-state temperature requires a long wait. The methods of handling, shipping, and care of thermistor cables are listed also.
The authors express their deep appreciation for the assistance with their problems in thermometry received from J. L. Riddle, R. E. Wilson, and H. F. Stimson of the National Bureau of Standards.
CALIBRATION
CONSTANT-TEMPERATURE BATH FOR THERMISTORS
Each thermistor is in general calibrated, in a Geological Survey laboratory, at five temperatures: 30°, 15°, 0°, +15°, and +30°C. This calibration is done in a precisely controlled temperature bath, a drawing of which is shown in figure 1. The bath is patterned after one used by the National Bureau of Standards (Scott, 1941). A 1-gallon Dewar flask with a 6-inch mouth is mounted inside an insulated ply wood and aluminum box. During each calibration, the space between the inner and outer aluminum containers is filled with pieces of dry ice (solid CO2) to attain temperatures below 0°C and to provide a steady heat sink at all calibration temperatures. To improve thermal coupling, the space between the flask and the dry-ice chamber is filled with isopropyl alcohol.
Inside the flask and suspended from the laminated-plastic-board cover are the thermistor mounting frame and the stirring mechanism (fig. 1). Each thermistor is mounted between an outer laminated- plastic ring, 3 inches in diameter, and the middle ring of brass, which serves as the common electrical return. One blank circuit affords a lead correction. The frame has a capacity of 56 thermistors; identi fication control is maintained by assigning a serial number to each thermistor and coding the positions on the rings. The thermistors are connected to the measuring circuits through a 58-conductor cable The Dewar flask is filled with silicone fluid (Dow Corning 200), which has high resistivity and low viscosity (10 centistokes) over a wide temperature range. The impeller which stirs the silicone fluid is externally driven through a belt and pulley system.
Two heater coils are wound on laminated-plastic webs attached to a 4 ̂ -inch-diameter hollow aluminum cylinder (fig. 1), which is sus-

PREPARATION OF THERMISTOR CABLES C3
58-conductor cable
0-ring
Temperature controlling thermistor
Laminated- plastic- board rings having- binding posts connected to 58-conductor cable
Hollowaluminumcylinder
Laminated- plastic-board webs
Dewar flask
Aluminum divider
Aluminum tank
Styrofoam insulation
Thermistor
Brass ring serving as common electrical return
Thermistor
Heater wires
Dry ice
Plywood box
Isopropyl alcohol
FIGURE 1. Bath for calibration of thermistors in the range 30° to -f 70°C.
pended from the cover. The temperature of the bath is held constant by heating the coils enough to counter the cooling of the dry ice outside the Dewar flask. To steady the overall heat exchange fur ther, the interwall space of the flask is evacuated to 0.1 mm of mercury. All openings are gasketed, like the 0-ring seal between the cover and the Dewar flask; the gaskets prevent the entrance of moisture, which could cause an electrical short circuit.
The bath temperature is kept constant to ±0.002°C. Coarse adjustments of the heater current are made manually. The fine control is done automatically by an electronic circuit: a thermistor in the bath, connected to one arm of a direct-current bridge, senses the temperature, and a manually adjustable arm of the bridge permits
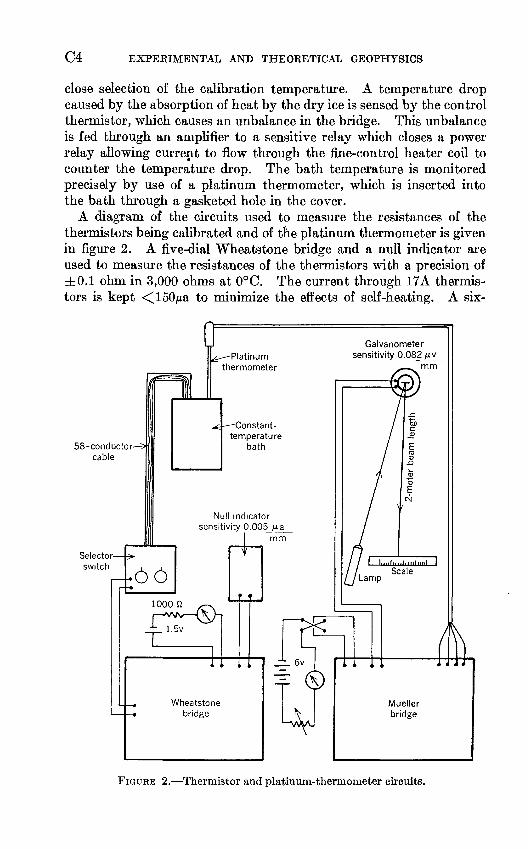
C4 EXPERIMENTAL AND THEORETICAL GEOPHYSICS
close selection of the calibration temperature. A temperature drop caused by the absorption of heat by the dry ice is sensed by the control thermistor, which causes an unbalance in the bridge. This unbalance is fed through an amplifier to a sensitive relay which closes a power relay allowing current to flow through the fine-control heater coil to counter the temperature drop. The bath temperature is monitored precisely by use of a platinum thermometer, which is inserted into the bath through a gasketed hole in the cover.
A diagram of the circuits used to measure the resistances of the thermistors being calibrated and of the platinum thermometer is given in figure 2. A five-dial Wheats tone bridge and a null indicator are used to measure the resistances of the thermistors with a precision of ±0.1 ohm in 3,000 ohms at 0°C. The current through 17A thermis tors is kept <O50/za to minimize the effects of self-heating. A six-
tr
58-conductor cable
Ti^~
^
^,-^-Platinum thermometer
Constant- temperature
bath
Null indicator sensitivity 0.005j*a
mm
Galvanometer sensitivity 0.082jxy_
mm
Wheatstone bridge
FIGURE 2. Thermistor and platinum-thermometer circuits.

PREPARATION OF THERMISTOR CABLES C5
dial Mueller bridge and a sensitive galvanometer are used to measure the platinum-thermometer resistance, from which the bath tempera ture can be determined with an accuracy of ±0.001°C. Both bridges and the platinum thermometer have been calibrated by the National Bureau of Standards. A description of the precision of the platinum thermometer is given by Robertson, Raspet, Swartz, and Lillard (1966).
The thermistor resistances, bath temperature, time, and pertinent remarks are recorded during each calibration. Two calibrations of each thermistor are made, at least 1 month apart; the second calibra tion makes it possible to cull out an abnormal thermistor (one having large calibration resistance changes), of which there is about 1 in every 50.
ICE-POINT CALIBRATIONS OF THERMISTOR CABLES
It can be expected that each thermistor's individual calibration is valid after installation in a cable, but a check calibration is advisable. Single-thermistor probes can be recalibrated at various temperatures in a suitable bath, but multithermistor cables are usually recali brated at 0°C in a large ice bath. It is standard practice in the Geological Survey that cables be recalibrated after field use; aberrant or damaged thermistors can thus be located and replaced.
Multiconductor thermistor cables are calibrated most easily and accurately in a bath of melting ice, at 0°C, the ice point, for the fol lowing reasons: (1) Preparation of the ice bath is inexpensive, (2) the ice bath is easily prepared with only a few necessary precautions, and (3) the ice point is constant and closely reproducible if the bath is properly prepared. By this calibration, the thermistor resistances reveal any installation or handling damage and should corroborate the preinstallation calibration at 0°C, usually within ±0.01°C.
The method recommended for making an ice bath is that used by the National Bureau of Standards, described by Busse (1941, p. 241). A large clear block of ice is obtained from a commercial ice company and cut into hand-size chunks to fit into a commercial ice shaver. Ice containing impurities, mostly dissolved air which is indicated by a frosted appearance, is chipped off to leave only clear ice; each chunk is then washed in tapwater and in distilled water. Before use, the ice shaver, trays, and the ice-bath box are rinsed with distilled water also. Before being placed in the bath, the cable should be carefully cleaned by scrubbing with detergent and water, rinsing with a stream of tapwater, and then rinsing with distilled water. As a further precaution, rubber gloves may be used in handling ice and cable to prevent contamination with salt from the hands, but this precaution probably is unnecessary.

C6 EXPERIMENTAL AND THEORETICAL GEOPHYSICS
A bath container, \% by \% by 3 feet, is big enough to contain about 500 feet of )2-inch cable and the ice. It can be made of wood, which gives better thermal insulation than metal; it is made water tight by calking and coating inside with heavy asphalt paint. If the part of the cable containing thermistors is too long or too bulky, half of the thermistor section can be calibrated on one day, and the remaining half on the following day.
In preparing the bath, a 3-inch layer of shaved ice is packed on the bottom of the box, and the cable is coiled on the ice layer in such a way that the thermistors are placed near the center area and the remainder of the cable is along the sides of the box. The thermistor sections should be at least 3 inches away from any other part of the cable; usually, a length of cable containing three thermistors can be suitably coiled on one ice layer. Shaved ice is packed around and between coils of the cable, a new 3-inch layer of ice is put in, and the same procedure is repeated until a length of cable well beyond the last thermistor is in the box.
Shaved ice alone does not maintain a uniform temperature; the ice particles must be thermally coupled, and therefore two or three times during the bath preparation a small amount of distilled water must be sprayed in. The proper water saturation is determined by a simple empirical test: a rod is pressed with only forearm leverage into the shaved ice, and at proper saturation, a bluish color appears in the compressed ice.
After the ice bath is prepared, 2 hours are allowed to elapse before the first set of measurements is made; at this time, generally, the cable temperature is within 0.01°C of that of the bath. The bath and cable arrive within 0.001 °C of a thermal steady state after 4 to 6 hours, for a K-inch cable. Excess water may need to be drawn off and melted ice replaced after 4 hours.
Measurements of the thermistor and platinum-thermometer resist ances are made with the same bridge circuits shown in figure 3; use of the platinum thermometer is described below. The bridge current for 17A thermistors should be limited to 150 /za both in the laboratory and in the field to minimize self-heatine. Lead-wire resistances must be subtracted from the total resistance of each thermistor before converting resistance to temperature; for this purpose the test lead wire resistance is used to determine the correction for each thermistor lead. (See Swartz, 1954, for description of the circuit and the test- lead correction.)
For multithermistor cables in the field, a method devised by Diment (in Diment and Kobertson, 1963, p. 5039-5040) provides calibrations of thermistors relative to each other over the temperature range of interest. The resistance of each thermistor can be read at the same

PREPARATION OF THERMISTOR CABLES C7
depth in a thermally stable drill hole, and the converted temperatures can be compared; if the thermistors are evenly spaced, by moving the cable one interval, measurements can be made for all but one therm istor at depth positions previously occupied by other thermistors. The process may be repeated to get several duplicate measurements, which can be analyzed for the best correlations and appropriate corrections. Another method is to compare the temperatures meas ured at specific depths with two cables. For many heat-flow studies, such relative calibrations are adequate.
THERMISTOR CABLES
CONSTRUCTION
The fabrication of a cable with only one thermistor is usually done by placing the thermistor in one end of a short metal probe. The probe may be attached to the cable by vulcanizing a shoulder onto the insulation and clamping the probe on the shoulder; for short cables, the probe may be clamped directly onto the cable. The probe is sealed with 0-rings or tape. Construction details of such a single- thermistor probe were given by Misener and Beck (1960).
The installation of thermistors in a multiconductor cable is not difficult, but it is tune consuming because the thermistors must be handled carefully to avoid detaching their copper lead wires and must be installed properly to cushion them and to seal them off from water when the cable is used. In Geological Survey practice, in a 30-con- ductor cable, 28 thermistors would be installed; two conductors are needed for a common lead and for measuring a typical lead resist ance. (See Swartz, 1954.) The conductors of the cable are all soldered together at the bottom end, covered, and a 30-contact connector is wired to the top end. A watertight metallic cover should be fitted over the top connector to protect it against the entrance of moisture and dirt during use in the field.
Before installation, positions for the thermistors should be measured off and marked on the cable. A short slit is then cut in the cable jacket at each desired location, and a piece of the jacket is cut away to make room for the thermistor, as shown in figure 3. The proper conductor under the insulation is located (usually by a color code) and cut, and the thermistor leads are attached to the conductor ends with squeeze-type, solderless connectors. Solder is avoided because it strain hardens easily and breaks quickly on flexing. Insulating tubing, an inner length of glass-fiber tubing and an outer one of plastic tubing, is slipped over the thermistor and the leads before the second joint is made, and is used to cushion and insulate the thermistor. The tubing then is filled with silicone rubber or some other insulating

o OP
Sili
cone
-rub
ber
P°t
ting
Com
| nd
Insu
latin
g tu
bin
g
The
rmis
tor
/
, Par
t of
jac
ket
cut
ou
t
Pla
stic
or
self-
vulc
aniz
ing-
ru
bber
sea
ling
tap
eLi
nen
cord
Cabl
e ja
cket
' C
ondu
ctor
s
FIG
UR
E 3. C
ut-
away
sec
tion
of
a th
erm
isto
r in
stal
lati
on i
n a
mul
tico
nduc
tor
cabl
e.
o o oo M O
PREPARATION OF THERMISTOR CABLES C9
flexible potting compound, and the whole is tied with linen cord into a compact joint.
The joint is pushed down inside the cable, and the opening is covered by wrapping with tape. If the cable jacket is natural rubber, two layers of self-vulcanizing cold-setting rubber tape are wrapped on, and after setting, several layers of rubber tape are wound over it. If the cable jacket is plastic, five to seven layers of plastic tape are wound tightly over the joint. Such a cold-sealed joint does not disturb the thermistor calibration and is adequate for most uses, but if the joint may be subjected to high water pressure or to heavy abrasive wear, a vulcanized-rubber joint should be considered. The principal disadvantage is that the temperature of vulcanization (about 130°C) is so high that the thermistor calibration may be considerably disturbed. Swartz and Easpet (1961) found that the disturbance took the form of an initial offset of about -f 0.2°C in the apparent temperature at the ice point, with an increase in the rate of thermistor drift. After 4 months, the apparent ice-point temperature had returned to 0°C, but the drift rate continued to be greater than normal though gradually decreasing for 1^ years, after which the drift con tinued at the normal rate, about 4X10~3 deg C per mo.
The resistance of each conductor is measured before the thermistors are installed to obtain the basis for the lead-resistance correction. The lead resistance must be subtracted from the total measured resistance to obtain the resistance of the thermistor. Swartz (1954) showed that for any temperature of the lead, the lead correction is simply the ratio of the given thermistor-lead resistance to the test-lead resistance, as measured before thermistor installation, multiplied by the test-lead resistance observed in the field.
To check each thermistor circuit, that is, to identify the conductor and thermistor, each joint can be chilled through the cable with ice and the deflection of the galvanometer in the thermistor bridge circuit observed. Watertightness in a cable can be tested by inspecting for bubbles when it is subjected to an internal pressure of air at about 20 psi while it is under water; alternatively, a high-voltage spark tester can be used.
Another method of installing thermistors in a multiconductor cable (Lachenbruch and others, 1962, p. 793) is to put each one in a stainless- steel or plastic pod, installed by the cable manufacturer. This method has the advantage that the thermistors can be removed fairly easily for recalibration in the temperature range of interest, although the bulk of the pods may prove troublesome in getting the cable in and out of a hole.

CIO EXPERIMENTAL AND THEORETICAL GEOPHYSICS
USE AND CARE
Certain precautions in the preparation and handling of a completed cable should be taken to insure best results. For example, the con nector at the end of the cable which plugs into the measurement circuit should be protected from moisture and dust; otherwise high- resistance short circuits may develop. It is helpful to have a multi- lead connector of the Military Specification (MS) type, which has a packing gland at the cable entrance. A dust cover for the connector can be made with an 0-ring seal; one design is a long aluminum cup with two outer rods to clamp it in place.
For shipping or for use as a reel, a wooden spool may need to be constructed. The core diameter of the spool should not be so small that the thermistor installations are flexed too sharply; a 14-inch- diameter core seems to provide good rigidity and is not too large for short cables. The capacity (O) of the reel, in feet, can be calculated quite closely by the following formula:
where, d is the cable diameter, L is the inside distance between spool ends, RI is the core radius, and Rz is the outside-spool radius, all dimensions in inches. In shipping a spool by commercial carrier a layer of cardboard should be wrapped over the top cable layers and the whole finished with a wood cover nailed to the spool ends, to protect the cable adequately.
At the well site, a pulley of a maximum practicable diameter should be used in lowering the cable into the well to prevent undue flexing of the thermistor pods as they ride over the pulley; most thermistor pods and taped installations are about 6 inches long, so a 12-inch- diameter pulley is adequate. Mechanical damage to the jacket can be avoided by covering or smoothing sharp ends of well casings, sharp pulley edges, or any sharp corners. The cable should not be left lying on the ground where it can be damaged by traffic or can be exposed to the hot sun (which changes the resistance-to-temp erature calibration).
For measurements in the field, the current passing through the thermistor should be held at 150 /ia to keep self -heating to a minimum. In using a portable four-dial Wheatstone bridge, a 1%-volt cell with a 1000-ohm resistor in series provides an acceptable current under normal conditions of measurement. A simple test for self-heating can be made by balancing the bridge, opening the current circuit for a short time, and closing the bridge circuit again; if the galvanom eter deflects and then slowly returns to balance, some self-heating is occurring.
PREPARATION OF THERMISTOR CABLES Cll
Despite care in handling, a few thermistors of the group in a multi- conductor cable occasionally experience a small upset of the temper- ature-to-resistance calibration. It is possible not only to identify anomalous thermistor data but to retrieve most of the measurements despite such upsets by using Diment's method of in-hole calibration (Diment and Eobertson, 1963, p. 5039-5040).
Normally, the equation of Swartz (1954) equation 4 of Robertson, Easpet, Swartz, and Lillard (1966) is used for converting resistance to temperature. In the field, the method of master and correction tables (Robertson and others, 1966) for conversion of resistance to temperature is easily used; fewer reference tables are needed and no calculator is required as when separate conversion tables are compiled for each thermistor. Another simplification to speed up conversions can be used for long-term cable installations in which the resistances measured are in a small range; conversion tables can be calculated listing the resistances at 1-ohm intervals and the corresponding temp eratures opposite; such a table is useful for a single-thermistor cable, also.
REFERENCES
Busse, Johanna, 1941, Liquid-in-glass thermometers, in Am. Inst. Physics, Temperature, its measurement and control in science and industry: New York, Reinhold Publishing Corp., p. 228-255.
Diment, W. H., and Robertson, E. C., 1963, Temperature, thermal conductivity, and heat flow in a drilled hole near Oak Ridge, Tennessee: Jour. Geophys. Research, v. 68, no. 17, p. 5035-5047.
Lachenbruch, A. H., Brewer, M. C., Greene, G. W., and Marshall, B. V., 1962, Temperatures in permafrost, in Am. Inst. Physics, Temperature, its measure ment and control in science and industry: New York, Reinhold Publishing Corp., v. 3, pt. 1, p. 791- 803.
Misener, A. D., and Beck, A. E., 1960, The measurement of heat flow over land, in Runcorn, S. K., ed., Methods and techniques in geophysics: New York, Interscience Publishers, v. 1, p. 10-61.
Robertson, E. C., Raspet, Rudolph, Swartz, J. H., and Lillard, M. E., 1966, Properties of thermistors used in geothermal investigations: U.S. Geol. Survey Bull. 1203-B, p. B1-B34.
Scott, R. S., 1941, The calibrations of thermocouples at low temperatures, in Am. Inst. Physics, Temperature, its measurement and control in science and industry: New York, Reinhold Publishing Corp., p. 206-218.
Swartz, J. H., 1954, A geothermal measuring circuit: Science, v. 120, no. 3119, p. 573-574.
Swartz, J. H., and Raspet, Rudolph, 1961, Thermal shock and its effect on therm istor drift: Nature, v. 190, no. 4779, p. 875-878.
U.S. GOVERNMENT PRINTING OFFICE:1966