Properties, Recycling and Alternatives to PE Bags An Interactive Qualifying Project Report Submitted to the Faculty of Worcester Polytechnic Institute In partial fulfillment of the requirements for the Degree of Bachelor of Science By: Andrew Camann Kirk Dragsbaek Stanley Krol Jack Sandgren David Song Approved by: Professor Satya Shivkumar, Project Advisor
Transcript
Properties, Recycling and Alternatives to PE Bags
An Interactive Qualifying Project Report
Submitted to the Faculty of
Worcester Polytechnic Institute
In partial fulfillment of the requirements for the
Degree of Bachelor of Science
By:
Andrew Camann
Kirk Dragsbaek
Stanley Krol
Jack Sandgren
David Song
Approved by:
Professor Satya Shivkumar, Project Advisor
1
Abstract
Plastic bags are widely used and approximately 380 billion bags are used annually in the
United States alone. Only one percent of these bags are properly recycled. This presents a
major problem because typical plastic bags can end up taking over 1000 years to degrade in
landfills. The goal of this project was to gain an understanding of the widespread use of plastic
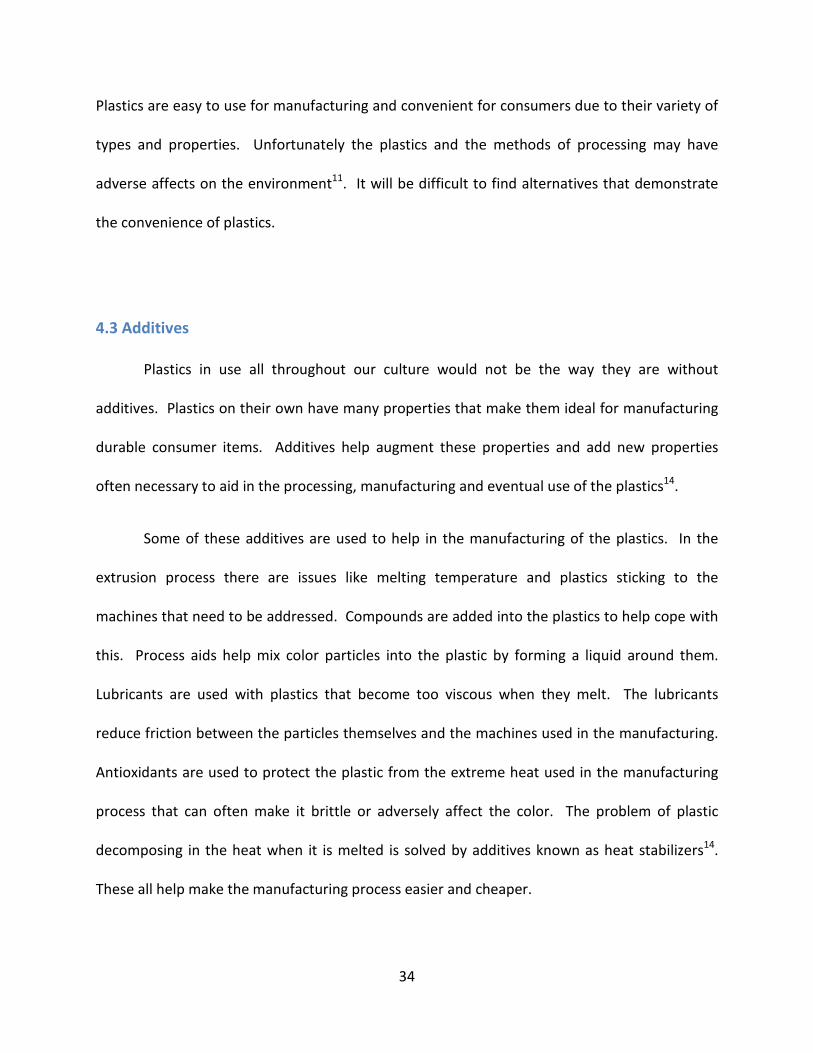
bags, the issues concerning their disposal and the alternatives that exist. Background
information on the manufacturing process and consumer use of plastic was collected through
extensive research. To gain an understanding of public perception on current plastic bags and
possible alternatives, consumers were surveyed online and outside of grocery stores.
Mechanical properties of a variety of common plastic bags and biodegradable alternatives were
evaluated using tensile testing. Accelerated aging through intense heat was used to analyze the
difference in mechanical properties before and after degradation under ambient conditions for
equivalent times of two years. Further information on the manufacturing and disposal
processes was gathered through site visits and interviews. The various methods employed led
to the conclusion that plastic bags are so widely used because of their exceptional mechanical
properties and cheap production costs. Through testing, it was concluded that both PE and
biodegradable bags lost about 50% of their original mechanical strength. The biodegradable
bags were in the furnace for about one seventh of the time as the PE bags, yet display a similar
loss in mechanical strength. There are alternatives with similar mechanical properties that
degrade faster, and the major difference is cost of production. The surveys showed that 91% of
the public believes that there are environmental problems associated with polyethylene bags
and is willing to use alternatives. However, the cost of the degradable bags is the main
concern. Companies are continuing to reduce production costs of alternative bags, but
currently the best solution is to promote awareness and prevent excessive use of polyethylene
bags. The findings of this project can serve as a starting point for potential changes in current
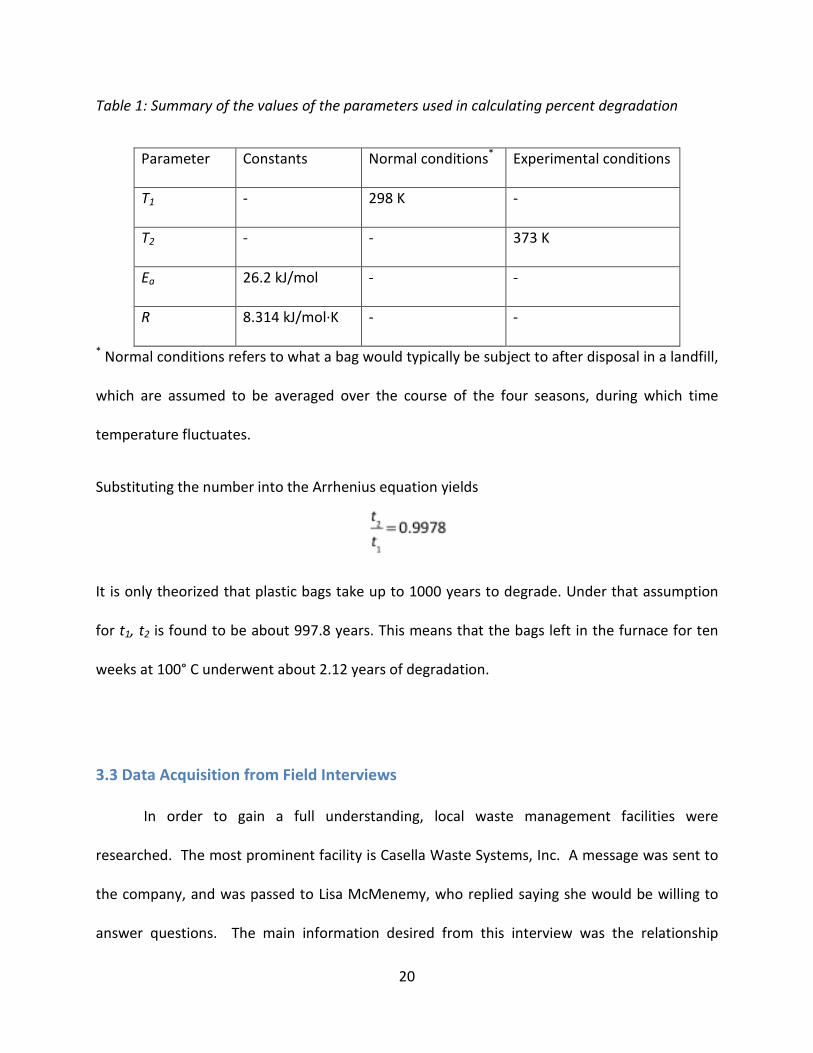
A 0.2% rule was used to determine the yield strength. After calculating the modulus as
the slope of the linear region at the beginning of the curve, a line of the form
y = m*x + b Equation 9
was superimposed on the stress-strain curve. The intersection of this line and the σ-ε curve is
the yield strength. The 0.2% rule means the superimposed line crosses the strain axis at 0.02,
which corresponds to a 0.2% increase in length.
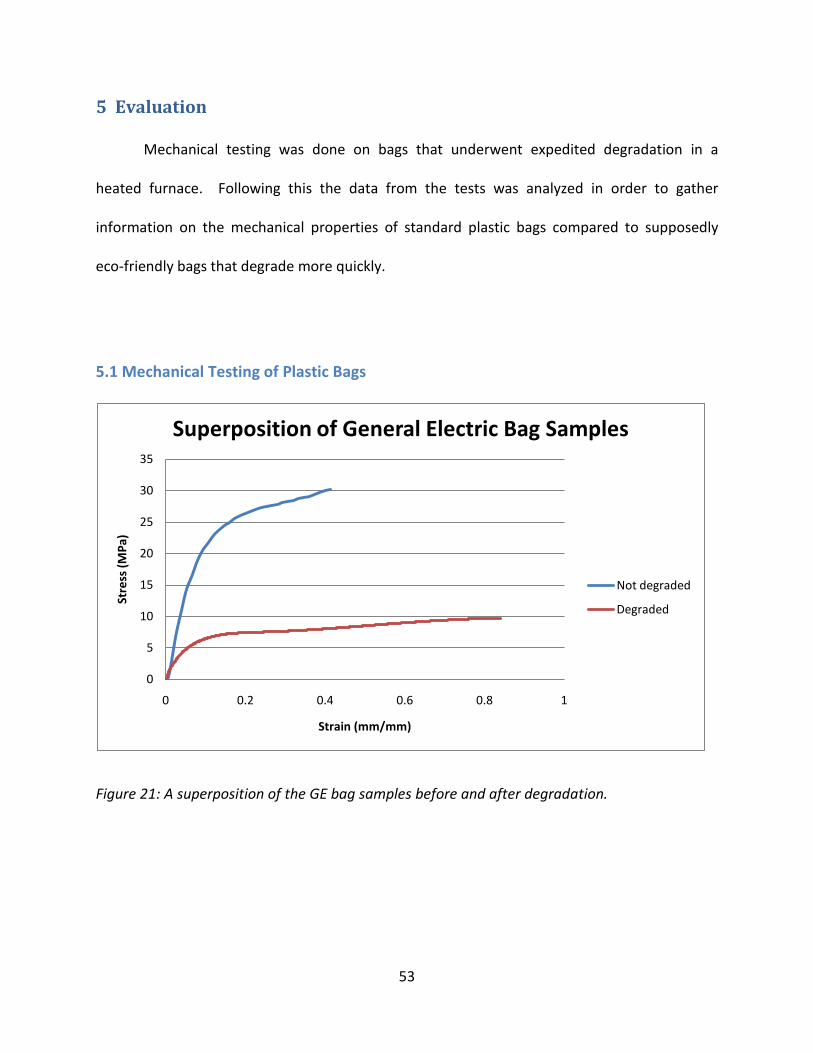
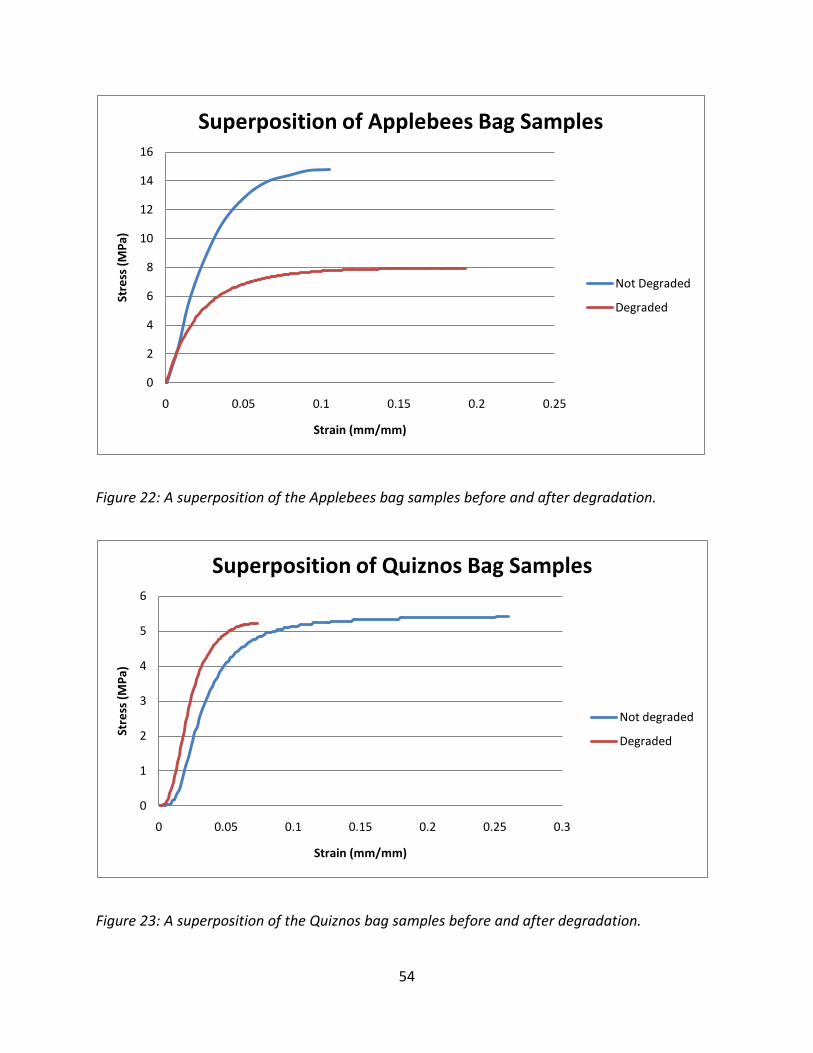
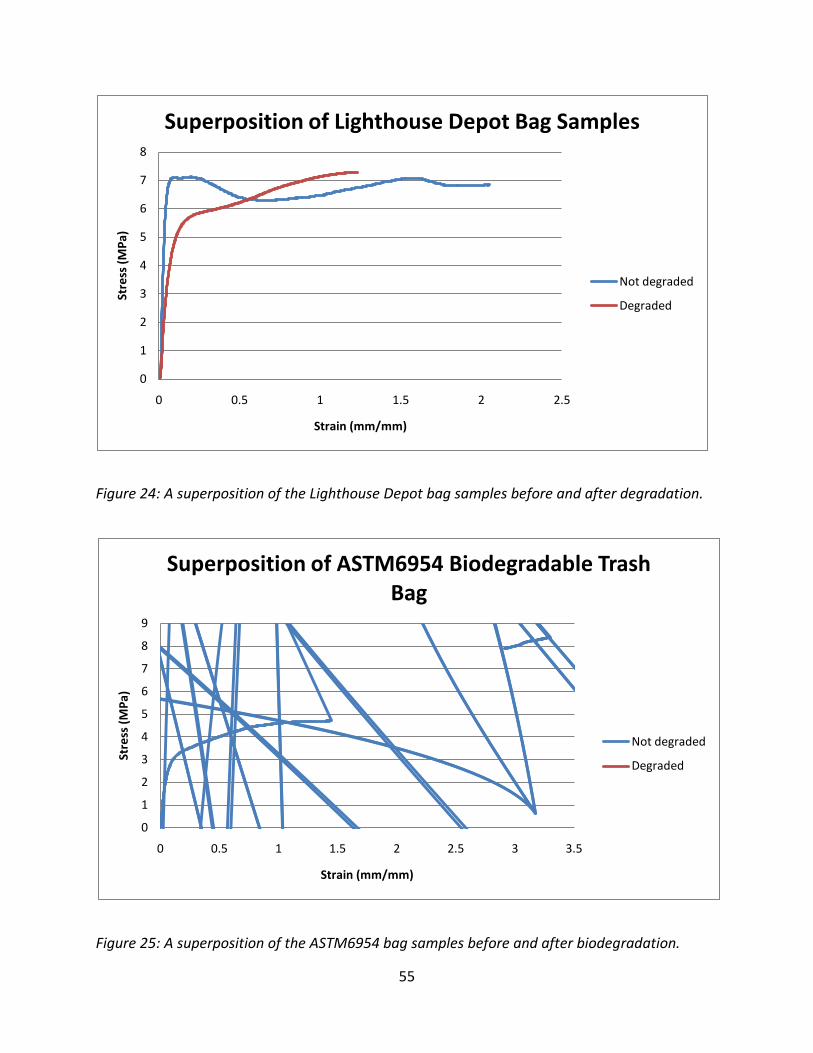
The modulus of elasticity decreased for all the bag samples after a degradation period of
ten weeks, with the exception of the Quiznos bag. The yield strength also decreased for all the
degraded samples, again with the exception of the Quiznos bag. The Tensile strength decreased
in all the bags after degradation, with the exception of the Lighthouse Depot bag. The
ASTM6400 Weak Biodegradable Sample 2 was much weaker than the non-biodegraded sample,
because after removing the degraded sample from the furnace, there was a visible hole in the
plastic. This severely decreased the tensile strength for that sample. A video of this particular
test may be found in Appendix A. The tensile strength for the GE, Applebees and Worcester
trash bag greatly diminished after 10-weeks of degradation. For example, the GE bag had a
60
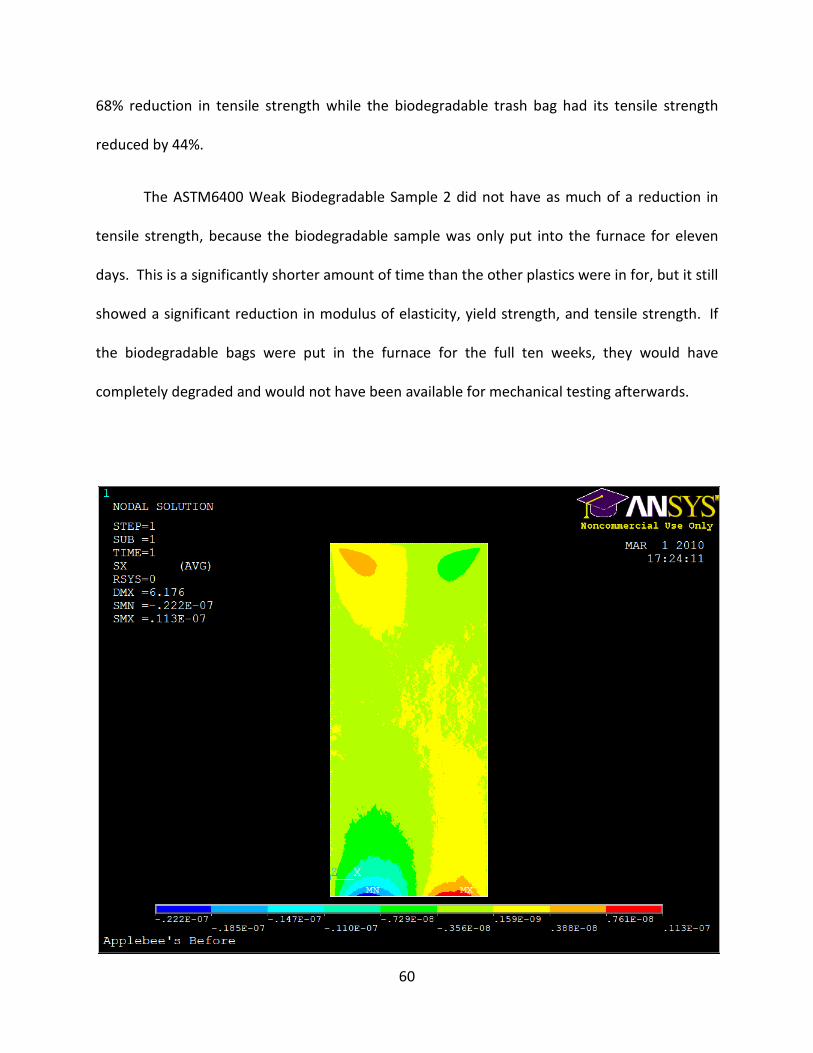
68% reduction in tensile strength while the biodegradable trash bag had its tensile strength
reduced by 44%.
The ASTM6400 Weak Biodegradable Sample 2 did not have as much of a reduction in
tensile strength, because the biodegradable sample was only put into the furnace for eleven
days. This is a significantly shorter amount of time than the other plastics were in for, but it still
showed a significant reduction in modulus of elasticity, yield strength, and tensile strength. If
the biodegradable bags were put in the furnace for the full ten weeks, they would have
completely degraded and would not have been available for mechanical testing afterwards.
61
Figure 27: Finite element analysis of a plastic bag sample.
Figure 28: Finite element analysis of a plastic bag sample.
Finite element analysis was performed on two plastic bag samples, before and after
their aging periods in the furnace. Figure 24 shows the stress diagram. The Applebee’s bag was
chosen because it had the highest elastic modulus, while the weak biodegradable bag was
chosen for its low elastic modulus, so the extremes could be compared. Figure 25 shows the
test of a BioBag. In each figure, the red and blue areas show the highest stress concentrations
in the sample. The different signs of the stress are a result of the force being in two different
directions, and a figure showing the absolute stress values would simply show red spots in the
62
corners. The numbers do not vary much between figures, but this is because of the
configuration of the Instron machine. The machine operates to preserve a constant strain
throughout the stretching, so there are varying loads on each sample, which is why the figures
all appear to be very similar. The other figures are shown in Appendix A.
The mechanical testing of the bags showed that aging a plastic bag will significantly
reduce its tensile strength. The plastic bags that were in the furnace for ten weeks showed
considerable reductions in their mechanical properties, while the ASTM standard biodegradable
bags showed similar decreases after only being in the furnace for eleven days. The test results
demonstrated that the biodegradable bags indeed do degrade at a much faster rate than
regular plastic bags.
63
6 Public Perception
Surveys were conducted with consumers at supermarkets as well as online to
understand what the public perception of plastic bags and possible alternatives is. This was
done to understand if there is perception that there is a problem and how open people are to
possible solutions.
6.1 Survey results
Survey Results
As described in Section 3.1, the Chi Square value was calculated for each question on
the survey. For clarity, the application of the formula is shown as it applies to each question.
Figure 29: Pie Chart of Question 1. Do you think that the current plastic bags are bad for the
environment?
Yes
No
64
Figure 30: Pie Chart of Question 2. How do you dispose of plastic bags when you are finished
using them?
Figure 31: Pie Chart of Question 3. If retailers rewarded you for reusing bags instead of using
new ones, would you be more inclined to reuse old bags?
Put them in the trash
Recycle
Reuse around the house, etc
Other
Yes
No
65
Figure 32: Pie Chart of Question 4. If an alternative bag were offered, would you use that
instead?
Figure 33: Pie Chart of Question 5. How much would you be willing to pay for new plastic bags?
Yes
No
None
1 to 10 cents
10 to 20 cents
20 to 30 cents
66
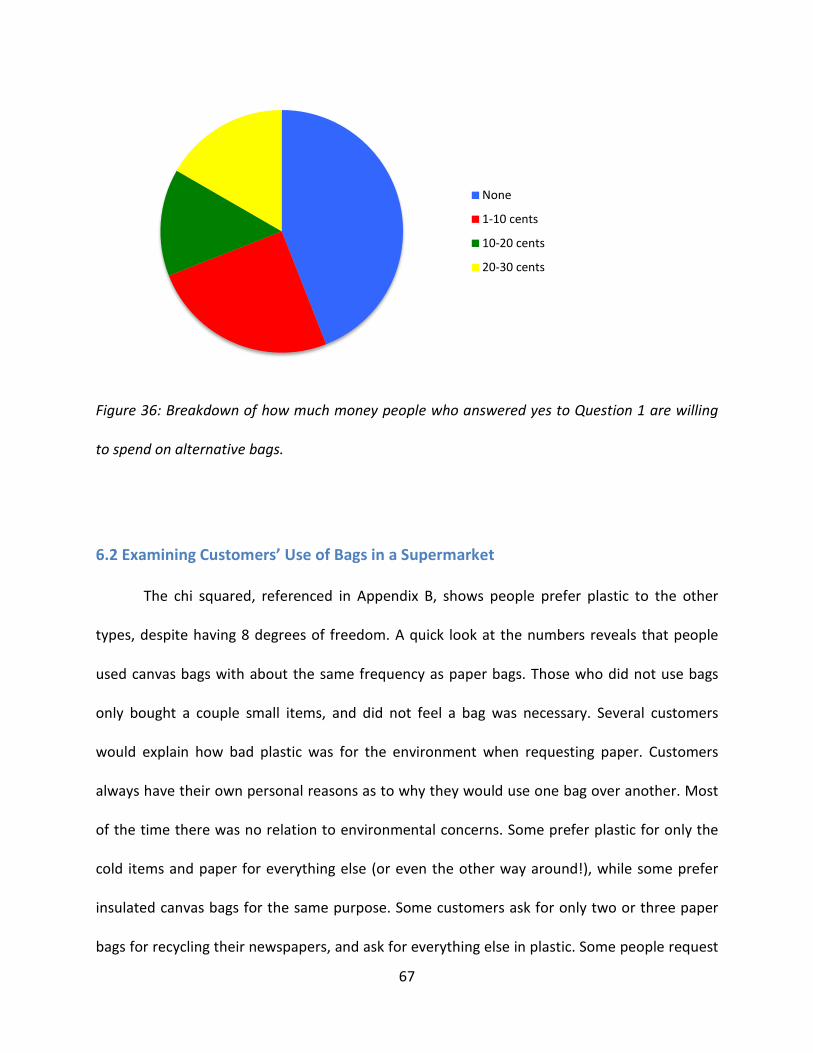
Figure 34: Pie Chart of Question 6. How much would you be willing to pay for alternative bags?
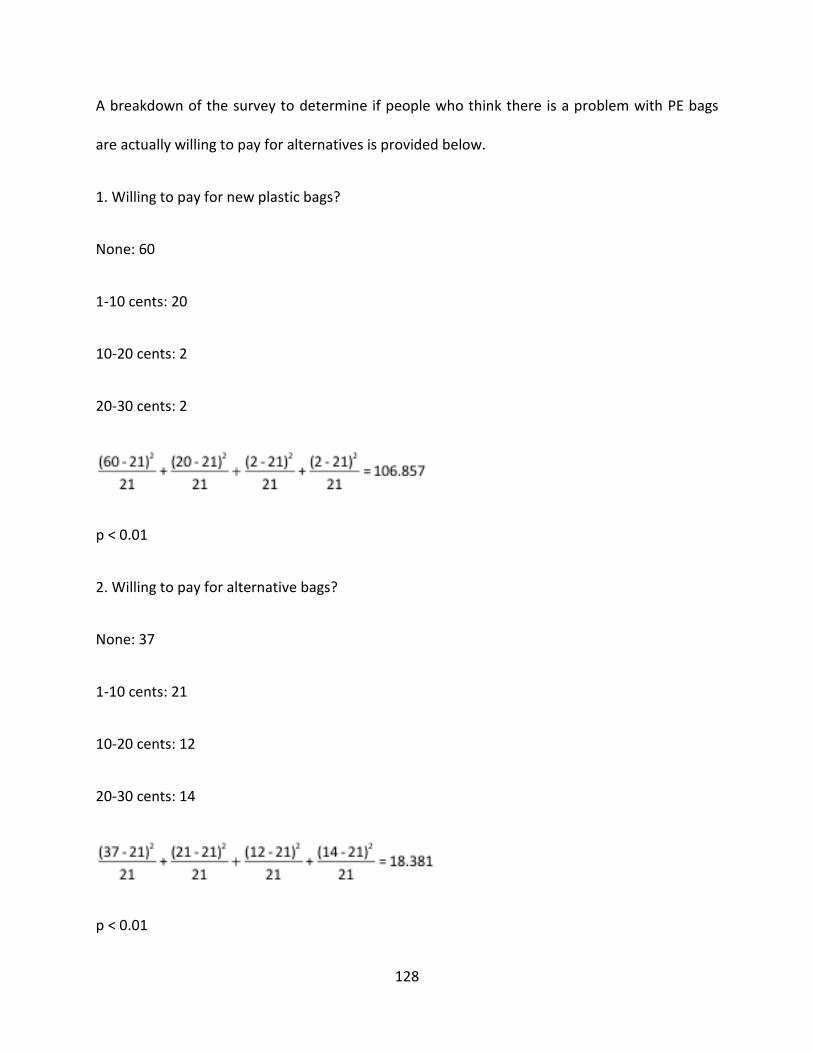
One of the questions that arose out of the survey was: Do those who think plastic bags
are a problem really think this or do they just claim to be “green?” We decided to figure this out
by looking at individual responses to the questions, particularly, how much people would be
willing to spend on plastic bags versus alternative bags. The data is presented below:
Figure 35: Breakdown of how much money people who answered yes to Question 1 on the
survey are willing to spend on plastic bags.
None
1 to 10 cents
10 to 20 cents
20 to 30 cents
None
1-10 cents
10-20 cents
20-30 cents
67
Figure 36: Breakdown of how much money people who answered yes to Question 1 are willing
to spend on alternative bags.
6.2 Examining Customers’ Use of Bags in a Supermarket
The chi squared, referenced in Appendix B, shows people prefer plastic to the other
types, despite having 8 degrees of freedom. A quick look at the numbers reveals that people
used canvas bags with about the same frequency as paper bags. Those who did not use bags
only bought a couple small items, and did not feel a bag was necessary. Several customers
would explain how bad plastic was for the environment when requesting paper. Customers
always have their own personal reasons as to why they would use one bag over another. Most
of the time there was no relation to environmental concerns. Some prefer plastic for only the
cold items and paper for everything else (or even the other way around!), while some prefer
insulated canvas bags for the same purpose. Some customers ask for only two or three paper
bags for recycling their newspapers, and ask for everything else in plastic. Some people request
None
1-10 cents
10-20 cents
20-30 cents
68
paper for heavy items and plastic for light items. Despite a wide range of reasons for bag
choice, most would consistently try to use fewer bags. If a customer felt that too little was in a
bag, he/she would take those items out and put them in another bag with more things. Usually
this happened with eggs or bread, where the customer would be fine with easily crushed items
being on top of heavier things.
Figure 37: Preference in bag choice shows that more than half of the customers used plastic. It should be noted that zero customers reused plastic or paper in this sample.
One surprising result is, despite how liberal and “green” the residents of Newton try to
be (which is backed up by the survey results), over half of the customers still used plastic bags.
Often, customers leave their political views out of grocery shopping and just pick whichever bag
plastic
paper
both
reused plastic
reused paper
reused both
canvas
no bag
69
is most convenient. This alternative method of data collection to determine bag preference
allows for less biased results.
6.3 Comparison of Original Surveys to Other Published Surveys
The Centre for Design at RMIT in Australia conducted a study on the impacts of
degradable plastic bags in Australia. The results of this survey showed that in Australia, 16% of
plastic shopping bags are reused, 13% are reused as bin liners, and 14% of the bags are
recycled23. These results differ from the results of the survey conducted in Worcester, which
concluded that 66% of bags are reused around the house as opposed to 16%, and 20% of
participants claimed to recycle plastic bags as opposed to 14% of the Australian survey takers.
Los Angeles County’s Plastic Bag Working Group also studied plastic bags and their
impacts on the environment. Through surveying of recycling and materials recovery facilities,
the group discovered that about 90% of plastic carry out bags that are taken to these facilities
are not recycled, but are actually taken to landfills. This is due to the fact that plastic bags are
often very contaminated, since people usually use them to line garbage bags, and the higher
contamination makes the quality of the plastic resin much lower. Bags are also contaminated
when they come into contact with other contaminants in collection bins. Plastic bags also have
the tendency to jam machines, which is another reason they are often not recycled24.
A survey that was conducted in the United Kingdom showed that most adults in the UK
would be willing to pay for alternatives to plastic shopping bags. Of the participants in the
survey, 14% would be willing to pay at least £2 for a reusable woven shopping bag that would
70
last up to a year. 64% responded saying they were willing to pay between 50p and £1, and 11%
would be willing to pay only 20p. For bags that would last about 10 trips to the store, 61% of
survey takers expressed willingness to pay between 5p and 10p for the bags25.
About 66% of the survey takers re-use plastic bags, 23% already use the sturdy reusable
bags, and 11% admitted to throwing plastic bags away. About 61% of adults who took the
survey feel that supermarkets should stop supplying free plastic bags, but the rest of the
participants disagree. People in favor of free plastic bags feel that way because they feel that
customers have a right to free bags, and that customers should not be penalized for forgetting
to bring bags25.
These results show that the public is generally beginning to accept the idea of paying
extra to use environmentally friendly bags. The 11% that admitted to throwing plastic bags in
the trash is about the same as the 13% of the participants in the Worcester survey who
admitted to doing the same. This is a relatively low number, which is good news, but ideally it
would be lower, and in order to decrease the amount of people who throw plastic bags in the
trash, it is necessary to increase public awareness of the issue.
An interesting point is that some of the UK survey participants pointed out that
customers should not be penalized if they forget to bring bags to the store. This applies to the
idea of stores no longer offering free bags to customers. It is an often overlooked fact, but if
the only option was to bring bags, this could lead to problems because not everyone would
always remember to bring a bag. About a third of the UK survey takers were opposed to the
possibility of no longer supplying free bags. This number can be compared to the 48% of the
Worcester survey takers, who said they would not be willing to pay at all for alternative bags.
71
This is further evidence that a large downside to biodegradable alternatives is the higher cost,
and they would be much more practical if the price per bag could be reduced.
A recycling awareness survey was conducted in London, and the numbers show that
awareness has increased over the course of four years. Table 14 shows the increase in the
amount of materials recycled from the year 2000 to 2004. In both years, the majority of houses
recycle twice a week, but in 2004, the results are much more skewed towards twice a week,
with a decrease in the other frequencies of recycling.
Table 14: Recycling activity between years 2000 and 200426.
Table 15 analyzes the reasons for not recycling. In 2004, a large majority of the
population did not recycle because they were unaware of recycling services. However, in 2004,
the number of households unaware of recycling services had dramatically decreased.
72
Table 15: Reasons for not recycling26.
The methods of recycling have changed during these four years, as shown in table 16. In
2000, most recyclables were in open carrier bags, but in 2004 the vast majority of recyclable
materials were placed in recycling bins. This increase is most likely due to an increase in
recycling awareness, and more efforts from the recycling services to take more materials.
Table 16: Recycling methods26.
The survey results show that most of the public is aware of the potential problems
presented by plastic bags. The results also demonstrate that a fair amount of the participants
73
would be willing to pay a small fee for alternative bags if such a system was introduced. The
amount of participants open to paying for alternatives is larger than the amount open to paying
for current plastic bags.
74
7 Alternatives
Possible alternative plastic bags are on the market due to belief that current plastic bags
are damaging to the environment. Many of these alternatives focus on decreasing the time it
takes bags to degrade by either altering the material or putting in additives to increase the
speed of degradation. Many of these alternatives and their properties were researched
through online resources and journal articles. Two samples were also gathered and tested
alongside current plastic bags.
7.1 Biodegradable Polymers
There are a number of biodegradable alternatives already on the market that consumers
can use instead of polyethylene plastic bags. Biodegradation is a natural process of degrading
complex organic compounds by microorganisms, such as bacteria, into simpler and smaller
organic compounds. These compounds are mineralized and redistributed through elemental
cycles in the biosphere of the microorganisms27. The International Organization for Standards
(ISO) and the American Society for Testing Materials (ASTM) have created their own definitions
for biodegradable plastics, which are listed below:
ISO 472: 1988—A plastic designed to undergo a significant change in its chemical
structure under specific environmental conditions resulting in a loss of some properties
that may vary as measured by standard test methods appropriate to the plastics and
application in a period of time that determines its classification. The change in chemical
75
structure results from the action of naturally occurring microorganisms.
ASTM sub-committee D20.96 proposal—Degradable plastics are plastic materials that
undergo bond scission in the backbone of a polymer through chemical, biological and/or
physical forces in the environment at a rate which leads to fragmentation or disintegra-
tion of the plastics27.
Two techniques of measuring biodegradability are commonly used. The first is a very
simple process; samples are placed in composting conditions, and then weighed after a certain
amount of time. The final weight is compared to the initial weight to give an idea of how much
material has degraded. The other test method determines a biodegradability coefficient
through testing. In this process, reaction rate constants are determined by varying incubation
temperature and C/N ratios28.
Biodegradable plastic bags can degrade in under two years so they are an intelligent
alternative to polyethylene plastic bags found in all grocery stores, which can last in landfills for
hundreds of years. Some of these biodegradable polymers include polymers with hydrolyzed
backbones natural occurring polymers and blends of biodegradable and non-degradable
polymers.
Polymers with hydrolyzed backbones are susceptible to biodegradation27. The only
high-weight molecular polyesters that are biodegradable are the aliphatic polyesters. It’s been
found that polyesters with medium sized monomers, from C6 – C12 in size, can be readily
degraded by fungi27. Synthetic polymers of this size with flexible polymer chains can be
76
degraded because the polymers can fit into the enzyme activation sites of these fungi. Enzyme
activated degradation will not occur for rigid and bulky polymers because the large side chains
block binding to the enzyme activation sites.
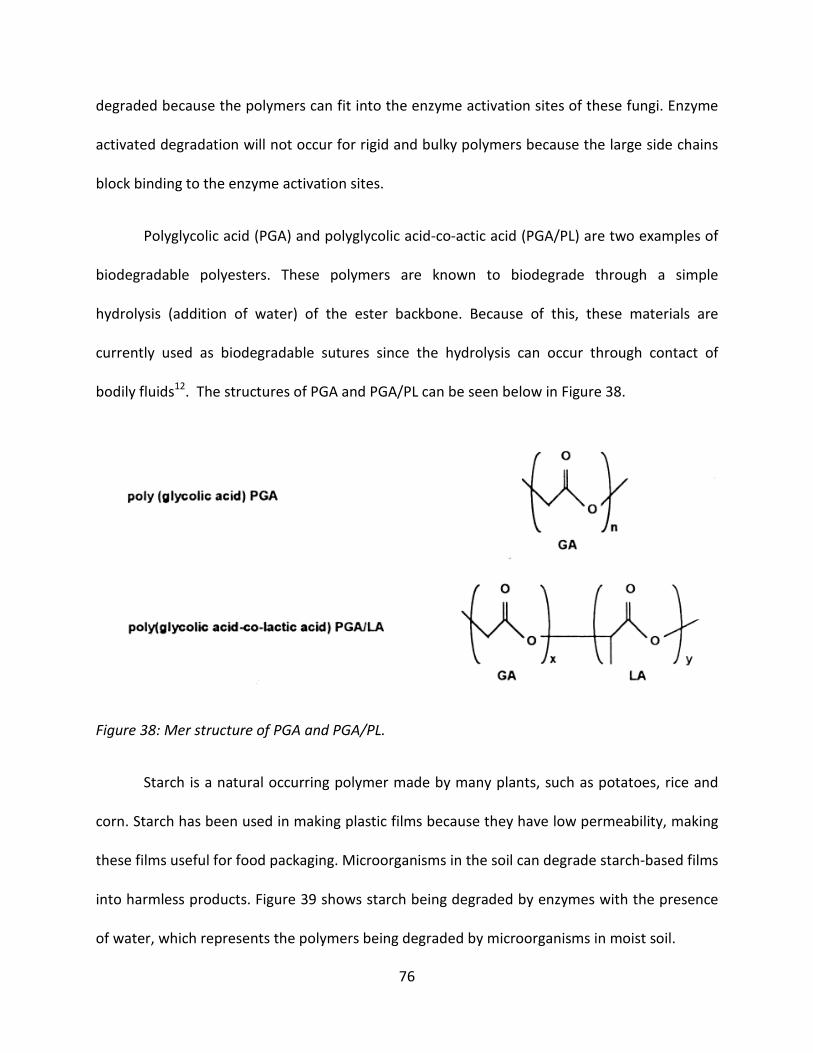
Polyglycolic acid (PGA) and polyglycolic acid-co-actic acid (PGA/PL) are two examples of
biodegradable polyesters. These polymers are known to biodegrade through a simple
hydrolysis (addition of water) of the ester backbone. Because of this, these materials are
currently used as biodegradable sutures since the hydrolysis can occur through contact of
bodily fluids12. The structures of PGA and PGA/PL can be seen below in Figure 38.
Figure 38: Mer structure of PGA and PGA/PL.
Starch is a natural occurring polymer made by many plants, such as potatoes, rice and
corn. Starch has been used in making plastic films because they have low permeability, making
these films useful for food packaging. Microorganisms in the soil can degrade starch-based films
into harmless products. Figure 39 shows starch being degraded by enzymes with the presence
of water, which represents the polymers being degraded by microorganisms in moist soil.
77
Figure 39: Starch polymer broken down.
One issue with starch-based products is that at high temperatures ~150°C the glucose
links start to break apart. At temperatures of ~250°C, the starch collapses because of all the
energy. Another issue with starch polymers is at low temperatures, a phenomenon known as
retrogradation occurs12. Retrogradation is the reorganization of hydrogen bonds and an
aligning of the molecular chain due to cooling. This phenomenon makes the resulting starch-
based films very brittle. Because of these weaknesses, fully starch-based films are not the best
biodegradable polymers to completely replace polyethylene.
Blending of starch and polyethylene has received a lot of attention for possible
applications in the waste disposal of polyethylene-based plastics. The theory behind the
blending is that if there is enough of the biodegradable polymer, once it is removed by
microorganisms in a waste disposal environment, such as a landfill, the remaining polymers
should lose its polymer integrity and disintegrate12. Granular starch has been used to form
these types of blended polymers. In an environment containing microorganisms, the exposed
78
starch granules on the surface of the blended polymer material can be enzymatically broken
down. When the starch is fully ingested by the microorganisms, the sample will start to
disintegrate. This effect only occurs for samples containing 30% by volume or greater of starch,
but the large amount of starch will cause the plastic or film created to have less tensile
strength. Table 17 shows a discussion of different biodegradable categories.
Table 17: Descriptions of Biodegradable Categories.
79
7.2 Commercialization of Alternatives
One issue we are faced with between LDPE plastic bags and their alternatives is their
respective environmental impacts. Since it takes about 1000 years for a LDPE bag to completely
degrade, they have a negative impact on the environment. Newly developed alternatives
degrade much faster. The following is Greenpeace’s definition of a biodegradable material:
Materials made from naturally occurring or biologically produced polymers are the only truly
biodegradable ‘plastics’ available. Since living things construct these materials, living things can
metabolize them29.
By Greenpeace’s definition, a biodegradable material must be made from biological
material or manufactured through a biological process. However, this is not entirely true. The
biodegradability of a polymer is actually a direct consequence of antioxidants added during the
manufacturing process29. One study removed this antioxidant (butylated hydroxytoluene, a fat-
soluble organic compound) from sample polyethylene films and found that, under the same
conditions, the film biodegraded rapidly in the presence of bacteria, while the sample with the
antioxidant remained completely inert to the bacteria29. On the same note, natural polymers
are not always more biodegradable than synthetic polymers. Commercial thermoplastic
polymers (non-biodegradable) have become essential to the packaging and foodstuffs industry.
The fact that they are hydrophobic and biologically inert makes them perfect for such uses 29.
Another way to make a plastic biodegradable is to add an ultraviolet light absorber. This makes
plastic biodegrade when exposed to sunlight1. Figure 40 depicts polyethylene plastic bags that
are not able to be broken down into smaller parts in nature.
80
Hydrocarbon polymer plastics are a viable source of energy generation. Through the
incineration of such a polymer, the amount of calorific energy produced is close to that of fuel
oil. Through this process, these polymers replace the fossil fuels that would otherwise be used,
ultimately reducing the CO2 pollution of our atmosphere. Also, the thermal energy given off by
the incineration of these polymers is the same as that used in their manufacturing. This is the
most ecologically acceptable waste-to-energy process for these polymers29.
Figure 40: The negative impact of plastic bags on the environment is illustrated in the above
picture 30.
An example of a reusable bag is the Ecosilk Bag®. They are reusable bags that consist of
100% recycled parachute silk32. They are used until they wear down (around 5 years). When
they reach the end of their useful lives, they can then be returned to the manufacturer for
81
credit toward future orders. From here, they are sent to a recycling plant and recycled into
building material31.
Figure 41: Ecosilk bags33.
BioGroupUSA’s BioBag® is a 100% biodegradable and compostable plastic bag. They
conform to ASTM D6400-99. It is made with Novamont’s starch-based Mater-Bi®. Mater-Bi® is
a blend of starch-based polymer and polyesters from vegetable oil. Chemical additives are not
used to enhance decomposition, like many biodegradable bag34. They will decompose in
compost within 45 days, leaving behind no harmful effects. They also biodegrade in both salt
and fresh water, within 14 months35.
82
Figure 42: BioBag, 100% compostable and 100% biodegradable36.
GP Plastics Corporation’s PolyGreen newspaper bags are biodegradable and
environmentally friendly. They completely biodegrade within three years in landfills and after
only a few months in nature37. This is made possible by an additive called PDQ-H. This non-
toxic agent allows microbes to eat and break down the plastic. These new newspaper sleeves
only cost a fraction of a cent more than their non-biodegradable predecessors. Newspaper
publishers currently using this product include The New York Times, USA Today, and the Boston
Globe38.
Although not being used to make plastic bags today, a biodegradable polymer, Polylactic
acid (PLA), is a good candidate for use in future plastic bags. It is currently used in plastic
applications such as biomedical products, disposable eatery, and packaging. Polylactic acid is a
vegetable-based bioplastic, a byproduct of cornstarch or sugarcanes. It only takes 45-60 days
to biodegrade when exposed to temperatures between 122˚F and 145˚F. The most likely
reason this bioplastic is not currently being used to manufacture plastic bags is that its
recyclability is unproven.
83
Thermoplastic starch (TPS) biodegradable plastics are starch-based plastics. Starch-
based polymers typically have starch contents ranging from 10% to 90%. Higher starch content
will result in a more biodegradable plastic. TPS biodegradable plastics have a starch content
greater than 70%39. This type of plastic is currently being used to manufacture the BioBag, a
100% biodegradable and compostable plastic bag. It is the first bag derived from corn to reach
national distribution. They decompose in compost in 10-45 days. They even biodegrade in salt
and fresh water within 14 months35.
Another starch-based biodegradable plastic used to make plastic bags is the starch
synthetic aliphatic polyester blend. These bags are made up of 50% synthetic polyester and
50% starch. Buried in soil, they completely biodegrade within eight weeks39.
Organic bags made from materials such as cotton and hemp are good options. They
cost more than LDPE bags, but they last longer and are more stylish. They also biodegrade
within five to six months.
84
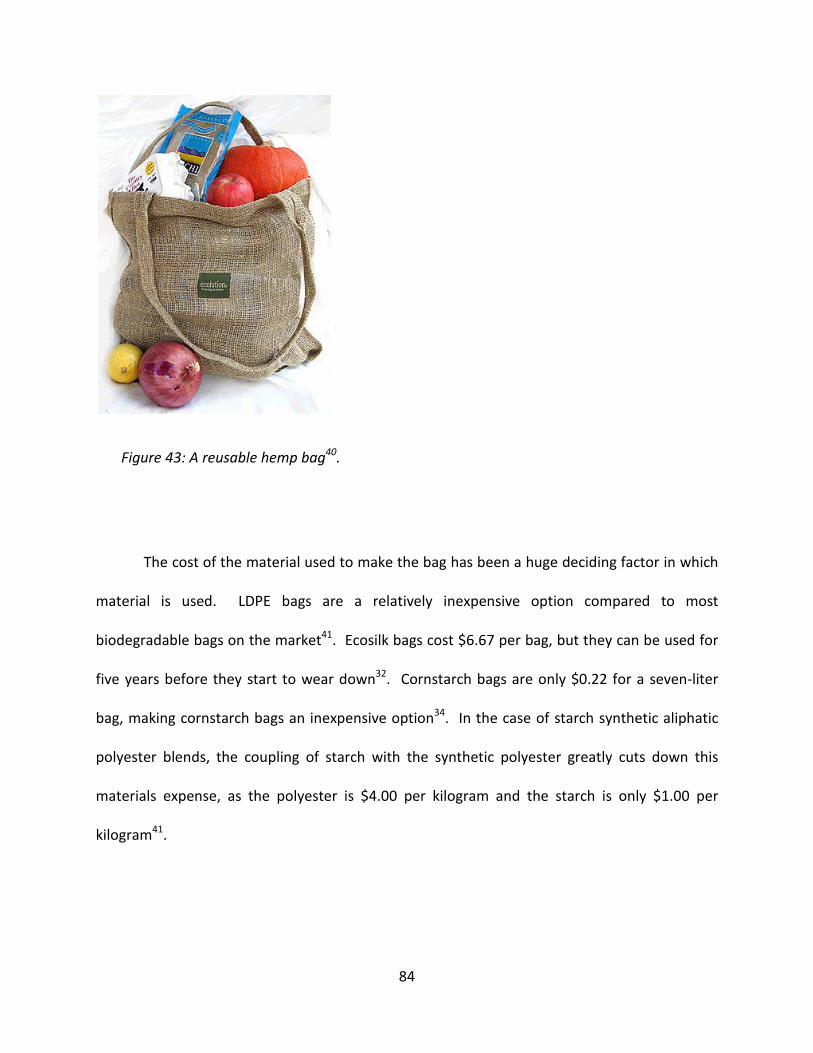
Figure 43: A reusable hemp bag40.
The cost of the material used to make the bag has been a huge deciding factor in which
material is used. LDPE bags are a relatively inexpensive option compared to most
biodegradable bags on the market41. Ecosilk bags cost $6.67 per bag, but they can be used for
five years before they start to wear down32. Cornstarch bags are only $0.22 for a seven-liter
bag, making cornstarch bags an inexpensive option34. In the case of starch synthetic aliphatic
polyester blends, the coupling of starch with the synthetic polyester greatly cuts down this
materials expense, as the polyester is $4.00 per kilogram and the starch is only $1.00 per
kilogram41.
85
7.3 Paper vs. Plastic
Paper bags and plastic bags are both detrimental to our environment. The
manufacturing process for a paper bag is actually less environmentally friendly than that of a
plastic bag. In fact, it requires four times the amount of energy to manufacture a paper bag
than it does to manufacture a plastic bag and twice the energy to recycle a pound of paper than
to recycle a pound of plastic42. The production of a paper bag uses up more energy and creates
more air pollution than the production of a plastic bag. In 1999, the amount of paper bags used
by the United States, alone, required the cutting down of 14 million trees. Paper bags take up
more space in landfills than plastic bags. In today’s landfill, paper bags and plastic bags actually
decompose at the same rate43.
Figure 44: Paper versus Plastic44.
86
7.4 Biodegradable Films for Food Packaging
The primary concern of food packaging is to preserve and protect raw foods from
oxidative agents and microorganisms in order to extend their shelf-life. Petrochemical based
plastics, such as polyethylene and polyesters gave been used as packaging material because of
their good tensile strength and the ability to block oxidative agents. The wide use of synthetic
packaging films leads to a serious ecological problem because of their non-degradability45. The
commonly used packaging films are shown in Table 18.
Table 18: Packaging films commonly used45
It would be impossible to replace all of these commonly used films, but replacing even a
few can help save the depleting petroleum resource. Good food packaging film prerequisites
are listed below:
1. Allow for a slow but controlled respiration (reduced O2 absorption) of the commodity;
2. Allow for a selective barrier to gases (CO2) and water vapor;
3. Creation of a modified atmosphere with respect to internal gas composition, thus regulating
the ripening process and leading to shelf-life extension;
4. Lessening the migration of lipids—of use in confectionery industry;
5. Maintain structural integrity (delay loss of chlorophyll) and improve mechanical handling;
87
6. Serve as a vehicle to incorporate food additives (flavor , colors, antioxidants, antimicrobial
agents), and
7. Prevent (or reduce) microbial spoilage during extended storage46.
The prerequisites listed above can be met by making composite polymers whose
amount of biodegradable polymer composition can vary from one food to another. Two types
of biomolecules hydrocolloids and lipids are used in combination for the preparation of
biodegradable packaging films. Hydrocolloids, such as Jell-O or agar, are hydrophilic so they are
poor moisture barriers but with the addition of a lipid, they can become good moisture barriers.
One example of a biodegradable film is the mixture of starch, which is hydrophilic with
the hydrophobic plastic matrix. Addition of natural polymers like starch into polyethylene
creates starch-LDPE films containing up to 30% starch. These films have been shown to be
biodegradable upon composting. These starch-LDPE films fit perfectly into the ecosystem
because of their total biodegradability. A number of aerobic and anaerobic microorganisms
have been identified for biodegradation and the carbon cycle involving biopolymer degradation
can be seen in Figure 45.
88
Figure 45: Carbon cycle of biopolymers.
Research on biodegradable plastics based on starch began in the 1970s and continues in
various labs. Technologies have been developed for continuous production of extrusion blown
films to containing 50% or more of starch mixed with polymers and water sensitivity of such
films have been reduced by lamination with polyvinyl chloride47. Combination of urea with
polyols provides better plasticization of starch with good quality films. To increase compatibility
of hydrophilic starch with the plastic matrix, starch granules can be surface treated with
silanes48. Pro-oxidants can also be added to enhance oxidative degradation of the synthetic
polymer. Pectin is a complex anionic polysaccharide, which can be fully (high methoxy pectin)
or partially (low methoxy pectin) esterified. Plasticized blends of citrus pectin and high amylase
starch can give strong flexible films which are thermally stable up to 180°C45.
89
Synthetic polymers are gradually being replaced by biodegradable materials. Bilayer and
multicomponent films with good mechanical properties still need to be developed. Innovative
techniques of food preservation and biodegradability needs to be developed and adopted in
order to better the waste management process45.
90
8 Case Studies in Usage Reduction and Banning of Plastic Bags
Currently, there are many supermarkets and governments looking into policies to either
reduce or fully ban the use of PE bags. This chapter examines multiple case studies, and in
particular, what policies/programs were used and the outcomes.
8.1 ASDA
There is much action being taken in the United Kingdom to reduce usage of
polyethylene plastic bags. The Waste and Resources Action Programme (WRAP) specializes in
raising awareness concerning use of raw materials, and works with businesses the public to
encourage reuse in order to reduce waste49. In 2009, WRAP compiled data of bag usage by the
British population since dating back to 2006, and concluded the following, summarized in the
table below50:
Table 19: Summary of PE bag usage in the UK between 2006 and 200950
Year Bag Usage (millions) Percent Difference from 2006
2006 1330.8 -
2008 984.8 -26%
2009 638.8 -48%
The reduction in bags used between 2006 and 2008 was given as 346 million, a 26%
decrease, and a 48% reduction between 2006 and 2009, from which the number of bags used
can be calculated. This has largely been a voluntary effort by retailers, with encouragement
91
through governmental funding to promote consumers to change bag usage habits. Such an
endeavor is no easy task, says British Resource Consortium (BRC) Director General Stephen
Robertson. Quickly changing customer habits on a large scale is not easy. However, it shows a
large commitment by customers, who have switched to bags for life and cut bag usage. Retail
staff and supermarkets also deserve credit, as they have had to endure the costs to help this
happen. This voluntary approach is very successful and can lead to better-informed customers
and lasting positive change50.
There are other examples of efforts to reduce plastic bag use in the UK. In 2008, ASDA,
a British version of Wal-Mart, led an effort to encourage customers to purchase reusable bags
for life. The campaign, called “Saving the Planet One Bag at a Time51”, intended to give
consumers more bag choices at the checkout and hide PE bags from view, discouraging their
use. Promotions for the initiative appeared in print, television, and ASDA stores, as can be seen
in Figure 46 on the next page:
92
Figure 46: Easily visible in-store displays of ASDA's "Saving the Planet One Bag at a Time"
program encourage people to reuse bags51.
ASDA altered its bags by increasing recycled content, and decreasing size and thickness. In
2008, 250 tons of plastic bags were recycled and reduced usage by over 500 million bags51.
ASDA continued its campaign into 2009 by initiating efforts to further raise awareness of
alternative bags and encourage consumers to reuse them. Slogans such as “ASDA, Saving You
Money Everyday” and “Don’t forget to reuse your bags!51” increase exposure of the campaign.
Customers often have to wait in line at the checkout for several minutes, and as a result, ASDA
has installed signs on registers to remind people one last time during their trip to the store to
invest in reusable bags.
93
8.2 Sainsbury’s
Britain’s third largest supermarket chain, Sainsbury’s, wanted to implement methods of
reducing plastic bag use, and has surveyed its customers to figure out why they do not reuse
bags they already have. As a result of the research, two interesting figures were found. First,
73% of customers want to be rewarded for reusing bags; however, about 50% would forget to
bring them in to the store52. Therefore, the supermarket has initiated a three-part plan to
encourage more people to change their bag usage habits. The first part is called ‘Remind’ that
involves displays throughout the stores reminding people to reuse bags and buy reusable ones,
sometimes called “bags for life.” In addition, thousands of cashiers were trained to offer bags
for life for those who did not bring their own. The second part is called ‘Reward,’ in which
customers are given so-called Nectar Points for buying reusable bags and reusing old plastic
bags through the Nectar Point Reward52 program. Since its inception, over 300 million points
have rewarded. These points resemble electronic money that may be spent on an online
Nectar store for various household items, entertainment, and even vacations. The final aspect
of the program is called ‘Remove.’ In October 20084, Sainsbury’s stopped providing free PE
bags in all of its supermarkets. Its convenient stores continue to offer them, but are hidden
from view so that customers do not immediately think to use them. More durable and reusable
bags are encouraged, and though they cost money, will be replaced for free upon wearing out.
Some examples are shown in the figure 46 on the next page.
94
Figure 47: A variety of reusable bags are in use at Sainsbury's to reduce PE bag consumption53.
These bags are made of various materials, such as 100% recycled plastic, plastic bottles, and
jute53. The jute plant has an external bark, under which fibers may be extracted and processed
into a yarn via prolonged submersion in water and separation from roots. They are spun into
yarn, and can be woven into interlocking structures as a final product54. The bag with the label
“I stow away” can be folded into a compact form that can easily fit into cargo pockets,
pocketbooks, etc. This makes it more likely that customers will use them when shopping
because they will already have the bags with them when in the store.
Sainsbury’s is a prime example of successful business-customer interaction to achieve
some change. Through research and action, the supermarket chain has managed to raise
95
awareness of the PE bag issue and millions of customers have adopted new practices
concerning their bag use.
8.3 Tesco
Tesco, a British supermarket and merchandise giant, has programs similar to Sainsbury’s
to reduce PE bag use. In August 2006, Tesco introduced its Green Clubcard Points program,
which rewards customers for reusing bags. In three years, over three billion52 bags have been
saved as a result of this program. Similar to Sainsbury’s, there is extensive use of in-store
displays reminding customers to reuse and recycle, as can be seen in Figure 48.
Figure 48: Eye-catching signs raise awareness and encourage people to reuse bags, reminding
them of the environmental benefits52.
96
Tesco has also introduced a new plastic bag with additives approved by the US Food and
Drug Administration and European Union Scientific Committee on Food. Oxo-biodegradable
chemicals are added that promote degradation into smaller pieces. Oxo-biodegradation is the
process by which ultraviolet (UV) and oxidative processes initiate a decrease in the molecular
weight of the plastic55. Once the bag has transformed into smaller pieces, micro-organisms
digest the plastic as food, leaving behind H2O, CO2, trace salts, and biomass56. Oxo-
biodegradable materials constitute 1-3% by weight of the plastic being used55. Figures of
Tesco’s new bags are shown below in figures 49 and 50.
Figure 49: Tesco's new bags shown during three stages of oxo-biodegradation. The bags are
capable of degrading in 60 days56.
97
Figure 50: Tesco bag after some degradation. At this stage, micro-organisms process the rest of
the bag, leaving behind no harmful byproducts56.
Tesco also has a delivery service that gives out even more points than shopping in
stores. Groceries and other products are delivered to the customer, and no bags are used in
this process. It is reported that about half of Tesco’s customers utilize its delivery option52.
It should come as no surprise that large corporations implementing such extensive
programs can be costly, both in planning and execution, yet the dedication toward raising
awareness about the PE bag issue shows that people are serious about solving the problem.
98
8.4 Waitrose
Waitrose is one other supermarket in the United Kingdom that tried new programs to
encourage reusable bag use. It ran a three-month trial period in early 2008 in four stores52
before expanding the program to all of its stores. The goals were similar to those of ASDA and
Tesco: hide PE bags from view, offer cheap “bags for life” (shown in figure 42) to customers,
and ask if customers need bags. Waitrose noticed about an 1100% increase52 in sales of bags for
life, followed by a decline as customers started reusing them. At the same time, PE bag usage
dropped by around 45%-50% as customers used alternative bags. Similar to Tesco, customers
reported a tendency to forget to bring their reusable bags into the store, which prompted signs
reminding customers to bring in their bags. This program was successful during the trial period
in the four stores, so Waitrose decided to extend the program to more than 200 of its stores.
Figure 51: Waitrose reusable bags are large and durable enough to hold many groceries52.
99
8.5 Australia
Several of Australia’s states have either implemented or are in the process of
implementing plastic bag bans. Motivation for this comes about from the success of Ireland’s
PlasTax, a tax imposed on all PE bags that resulted in a 90% decrease in bag use57 there.
Additionally, other problems have been observed that have prompted action. These include
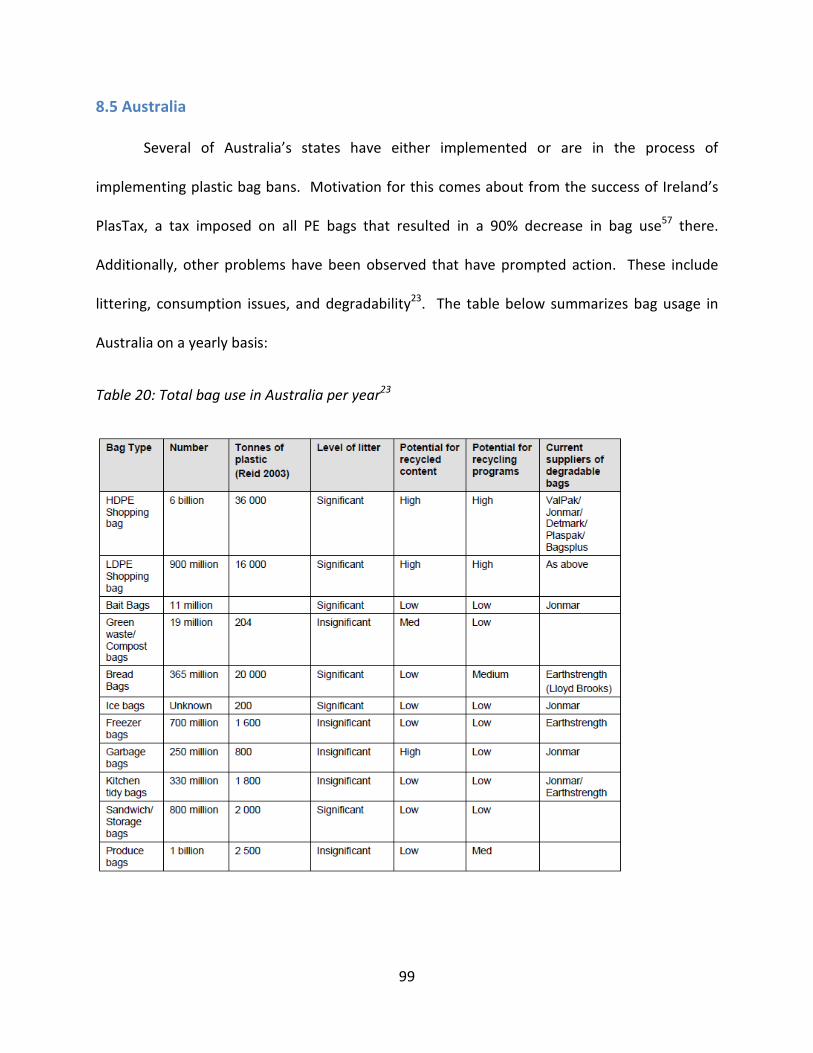
littering, consumption issues, and degradability23. The table below summarizes bag usage in
Australia on a yearly basis:
Table 20: Total bag use in Australia per year23
100
Approximately three percent58 of bags were recycled in 2001 and 2002, while almost all
the rest eventually ended up in a landfill, either after some or no reuse. It is estimated that 50-
80 million are littered from either waste activities or from personal use57. The shape of PE bags
makes them suitable to be blown away, which is one reason why they end up as litter. These
are a several reasons why Australian governments wanted to study ways of reducing bag use to
reduce waste and raise awareness of the environmental impact of PE bags. Over the last few
years, efforts have been made to accomplish this through bans on PE bags.
South Australia began its official plastic bag ban in May 2009. It was the first state of
Australia50 to do so, and hopes to set an example for the rest of the nation. The four-month
process required the state government to aid retailers in making a transition from PE bags to
reusable bags. As a result of this ban, South Australia hopes to eliminate around 400 million50
bags from landfills every year.
A progress report six months after the ban took effect already shows positive results. By
late 2009, 200 million PE bags59 had already been saved from use, which is about 800 tons60.
Nine in ten shoppers bring reusable bags with them to stores, which is up from six in ten before
the ban was enacted. To enforce the ban, retailers may be charged a $5000 fine for offering PE
bags and suppliers a $20,000 fine. South Australia did not wish to be the only state to ban
plastic bags, and hoped others would adopt similar bans.
In 2010, The Northern Territory plans to phase out PE bags from use in conjunction with
its climate change legislation. Jay Weatherill, Australia’s Environment and Conservation
Minister has commended the Northern Territory for following in South Australia’s footsteps on
101
a PE bag ban: He appreciates that the Northern Territory Government has recognized that
South Australia’s ban on PE bags has so far succeeded. He also commends their decision to
follow South Australia’s lead on reducing the amount of plastic bags going to litter and landfill.
South Australia will continue to encourage other States to push for a national ban on PE bags14.
8.6 Ireland
Driven by pollution to its coastline and negative impact on tourism, Ireland introduced
in March 2002 a “PlasTax”—a mandatory 20-cent tax on all PE bags used for purchases in
Ireland. Ireland’s plastic bag consumption per person per year dropped from 328 to 21 (a 95%
decrease) in less than one year24. Nearly all Irish now carry reusable bags, not wanting to pay
to tax when shopping. This type of tax has therefore changed consumers’ habits, which has
helped reduce the number of bags that litter the land. Robert Bateman, the president of
Roplast Industries, a company north of San Francisco that makes both plastic and reusable
bags, says charging for bags has some benefits because they are used more responsibly. For
example, one may be able to use two bags instead of six2. This responsible use is what the taxes
aim for – using fewer new bags each time one goes to the store will ultimately reduce bag
consumption.
However, not all are too quick to join the cause. The American Plastics Council claims
that a similar PE bag tax “would cost tens of thousands of jobs and result in an increase in
energy consumption, pollution, landfill space, and grocery prices as store owners increase
reliance on more expensive paper bags as an alternative2.”
102
8.7 San Francisco
In March 2007, San Francisco became the first city in the United States to ban plastic
bags. All supermarkets that generate $2 million or more would have three options:
• Biodegradable that mention “green cart compostable” and “reusable” and have a solid
green line around the entire bag.
• Paper bags that mention “reusable” and “recyclable” and contain at least 40% recycled
content.
• Reusable cloth bags at least 2.5 millimeters thick24.
One year later, San Francisco extended this ban to pharmacy chains with over five stores
located in the city. Fines were implemented to enforce this policy – $100 for the first offense,
$200 for the second, and $500 for the third and all following offenses for the same year61.
It is estimated that approximately 127 million plastic bags were saved from use by the
ban, a number based on 2006 statistics, which indicate that supermarkets supplied 70% of the
181 million bags from that year62.
Despite the ban, Roplast experienced an increase in business. This is largely due to the
fact that it does not make standard polyethylene bags. It specializes in making thicker, stronger
bags, holding five to six times as much as original ones. Due to their strength, they are also
reusable. In the long run, these can cut plastic use63. Roplast also offers biodegradable bags
that conform to the ASTM6400 standard for biodegradation64. Roplast’s wide range5 of
reusable bag options has made it a popular supplier of bags in San Francisco.
103
Figure 52: One of Roplast's many thick, reusable bags64.
8.8 Walmart
Together with the Environmental Defense Fund, Walmart has announced a plan to
reduce plastic bag waste by 33% by 2013, or about 135 million pounds of waste. Walmart’s
senior vice president for sustainability Matt Kistler claims that by offering improved recycling
options and reusable bags, plastic waste will be cut by about 9 billion pounds65. There will be
economic as well as environmental benefits of these efforts. California would save $25 million
per year on disposing plastic bags to landfills.
104
Figure 53: One style of Walmart's new reusable bags that discourages excess use of bags65.
Walmart’s three-part plan encourages reducing the plastic content in its bags, reusing
bags to prevent unnecessary consumption of new ones, and recycling of unwanted bags.
Between 2007 and 2008, it is estimated that enough reusable bags have been sold to decrease
PE bag usage by one billion65.
One key issue to consider with degradable and biodegradable bags is their ability to
degrade in landfills. Most “include a flexible membrane (geomembrane) overlaying two feet of
compacted clay soil lining the bottom and sides of the landfill, protect groundwater and the
underlying soil from leachate releases66.” This means that landfills have a solid boundary that
prevents any material from entering or leaving. This has the advantage of helping to protect
the local environment; however, it also limits natural processes such as oxo-degradation and
photo-degradation. Many alternative types of plastic bags that are being introduced as a result
105
of these new policies, including PE bags with additives to increase degradation, depend on
these processes. Therefore, when they end up in a landfill, they may not be able to degrade as
quickly as advertised. Despite this, many of the efforts that have been made to reduce bag use
have succeeded in doing so. Millions of people have changed their shopping habits to use fewer
bags and reuse any new ones they obtain, and as a result, billions of bags have been saved from
entering landfills.
106
9 Discussion
Through the use of surveys and interviews, information on public perception and issues
concerning recycling was extracted. There are various policies on recycling that were
researched, and discussion on their effectiveness is presented in this chapter.
9.1 Survey Discussion
It is evident from looking at the p-value for each question in our consumer survey that
there is a strong statistical significance at the five percent (α = 0.05) level. This means the
results are not random; we conclude that people do indeed care about the plastic bag issue and
that they do consider alternative types of bags when shopping.
The results of the first question clearly indicate that people think the current plastic bag
poses a problem to the environment. This is tied to the second question as well, which indicates
that 86% of people try to reuse or recycle plastic bags. Therefore, we have extracted what we
intended from these questions: we have found that peoples’ opinions on plastic bags affect
what they do with bags after using them.
The results of the third question suggest that if stores rewarded customers for reusing
their own bags, customers would do so. This is important because as more stores implement
policies toward the use and reuse of plastic bags, customers will make more of an effort to save
plastic.
Our results for the fourth question suggest that people would prefer an alternative bag
to the current plastic bag if that were offered at a store.
107
Questions five and six were meant to gage how much people would be willing to spend
on polyethylene bags and alternatives, and the Chi Square tests suggest that people are
generally unwilling to pay for any type of bag. However, looking at basic trends in the responses
for these questions suggests that people are more willing to pay for alternatives than plastic
bags.
One important aspect to consider when performing Chi Squared analyses is that it does
not provide us with any reasoning behind the responses. For example, from Question 3 we do
not know if people will try to reuse their plastic bags to cut down on consumption or just
because they can save some money. In addition, our results for Question 4 suggest that people
prefer alternatives, but we cannot say for sure if this is because people are trying to save the
environment, or because these bags might be stronger and more convenient to use.
Referring to Figures 9 and 10, both p-values suggest that people are strongly against
having to pay for any type of bag. This could mean that peoples’ negative opinions on plastic
bags are just a result of hype over environmental issues. If people truly believed plastic bags
posed a problem and were willing to do something about it, they would be willing to have to
pay for new bags from the stores.
9.2 Local Policy Discussion
The Mass DEP partnered with large group of Massachusetts supermarkets known as the
MFA or Massachusetts food association in an effort to cut down on plastic bag usage by 33% by
the year 2013. This voluntary program is in reaction to the common occurrence of plastic bags
108
frequently being used only once and thrown away. Grocery stores distribute over 1.5 billion
paper and plastic bags annually. Efforts are being made by the grocery stores to be less
wasteful in the distribution of the plastic bags. Education of store employees on the
environmental effects of the bags as well as ways to be more frugal is part of this solution.
Other aspects of the program include pushing reusable bags as well as the reuse of plastic bags
through the use of customer incentives. Part of the goal of the program is also to increase the
number of bags used that are made from recycled material or biodegradable materials. Stores
across the state are also putting plastic bag recycling machines next to current bottle and can
machines that are already in place. MFA president Christopher Flynn portrayed his optimism
when he said "Reducing paper and plastic bag use in our state is not only good for the
environment, but good for business," said MFA President Christopher Flynn. "We expect this
incentive-based, voluntary approach to maintain a balance between environmental
stewardship and consumer choice67."
Worcester along with local towns Shrewsbury and Grafton as well as other cities across
Massachusetts and the country are adopting PAYT, which stands for “Pay As You Throw”. This
means that residents have to pay extra for city trash bags and that garbage will only be
accepted in these bags. This program is motivated in two different ways. By charging for trash
bags the city raises money to offset the cost of waste removal. By charging people to get rid of
trash the program also hopes to motivate people to recycle more68.
Recycling in Worcester has also become easier due to a partnership with Casella Waste
Systems. Casella uses a system called zero-sort recycling. This system makes it so that
109
homeowners don’t have to sort their recycling at the curb. All recycling is put together in bins
at the curbs. This makes it easier for people to recycle which should in turn increase the
amount recycling. The system also reduces waste removal costs for the city. The zero sort
system works because Casella sorts the recycling at their plant in Auburn. A system of filters
and human workers sort the recycling into various categories. Large cardboard is filtered out
first after the trash is picked out by workers. Following this, glass is sorted out and as well as
paper. Newspaper is filtered out after this. Following this, the metal and plastic containers are
sorted out by a large magnet. The last step is to sort the plastic containers by type68.
Shrewsbury also uses the PAYT program to increase recycling. Shrewsbury requires
more sorting than Worcester but is still fairly easy as Shrewsbury only requires the separation
of paper from the other recyclable material. All plastics numbered 1-7 are accepted and put
together at the curb. The town of Shrewsbury website encourages homeowners to compost
leaves and yard waste69.
Grafton is currently implementing the PAYT program and anticipates a 20% reduction in
trash disposal costs with current costs being around $500,000. The cost of recycling will stay
the same and the town only has to pay for the cost of hauling recyclables and not the cost of
disposing them70.
More information could be gathered about these programs by talking to local officials.
Interviews were conducted with an official involved in the West Boylston solid waste program
as well as a representative from Casella.
110
9.3 Interviews with Local Officials
Interviews were conducted to obtain first-hand information from knowledgeable
individuals. The benefit of personal interviews is that the questions can be tailored to extract
the exact information desired. For example, in the interview conducted with a member of a
solid waste advisory team, the questions pertained to public perception of plastic bags, as well
as how that specific town handles the disposal of plastic bags. In the interview conducted with
a staff member of a local waste management plant, the questions were engineered to obtain
more general information about plastic disposal, such as how much of the total solid waste is
plastic, and what a waste management plant would do with plastic bags. Interviews would also
serve as a means to find out the general problems behind plastic bags, and how those problems
can be solved.
An interview of Judy Doherty was conducted via email. She is a chairperson of the West
Boylston Solid Waste Advisory Team. The purpose of the interview was to gather information
pertaining to local plastic bag policies and local disposal of plastic bags. Through the interview,
it was determined that in West Boylston waste management services recycle plastics with any
of the 7 recycling numbers. Although Ms Doherty is unsure why plastic bags cannot be
recycled, she did point out that they may be taken back to the stores where they originated.
Ms. Doherty added that some stores offer money as a reward to customers who return plastic
bags. With PAYT, the town charges $0.50 for small (15-gallon) bags and $1.00 for large (33-
gallon) bags, thus reducing excessive use of plastic bags, and in the end, this cuts disposal costs.
The full interview can be found in Appendix C.
111
This program is used to limit the population’s use of plastic bags in an attempt to reduce
the amount of plastic used and to reduce the costs of disposal. West Boylston launched this
program in the summer of 2009 with the intent of saving money. The money made by bag sales
goes towards the costs of waste disposal. Over the past five years, costs of waste disposal have
risen by 68%, and West Boylston’s costs of waste management reached over $400,000 a year;
picking up a bag of trash costs the town $2.38 on average71. The Solid Waste Advisory Team
hopes to save about $120,000 annually after starting the PAYT program. The PAYT program is
currently used by over 125 municipalities in Massachusetts, including Sutton, Upton, Clinton,
Shrewsbury, Northborough and Worcester. Shrewsbury has lowered trash by 40% using
PAYT72.
In the second interview, municipal development representative for Casella Recycling
Lisa McMenemy was contacted. Casella Recycling is a waste management plant known for its
recent Zero-Sort policy. This policy makes it easier for the population, since they do not have to
separate roadside recyclables. The company is also one of New England’s largest landfill
operators.
For this particular interview, the questions were engineered to make it possible to
extract information regarding the relationships between plastic and waste management plants.
This includes the amount of plastic sent to the plant as well as the general cost to maintain a
plant that processes plastics.
According to Ms. McMenemy, the Charlestown facility received 9,661 tons of plastic in
2009, none of which was plastic bags. The material is baled, and then sold to a mill. The mill
112
then processes the material; most mills have different processes, but in general, the material is
shredded, cleaned and then melted.
Casella accepts plastics that belong to any of the seven recycling codes at their two
Massachusetts plants. However they cannot accept plastic bags in their residential mix because
the bags damage and jam the equipment. If Casella received a bulk of only plastic bags, they
could be processed, but if the bags are mixed with anything, they cannot be processed. Ms.
McMenemy also made it clear that plastics take more money and energy to process. The fact
that plastics are less efficient than other materials in terms of processing is a downside, and it
would be beneficial to figure out a more cost and energy effective way of processing plastic
bags. The full interview can be found in Appendix C.
113
10 Conclusions
• It is estimated that between 500 billion to 1 trillion bags are used worldwide every year.
Of these bags, most are made of LDPE. This is due to their excellent mechanical
properties and low manufacturing costs. They have the tensile strength and ductility to
be the material of choice for numerous packaging applications. Mechanical testing
shows that typical bags have a tensile strength ranging from 6 MPa to 30 MPa.
Polyethylene’s chemical inertness ensures that it will not interfere with the packaging
process.
• From the surveys, it is apparent that most of the public is aware of the potential
problems behind plastic shopping bags. About 52% of survey takers demonstrated a
readiness to pay a small fee for alternative bags. About 28% of participants would be
willing to pay for new plastic bags, which shows that charging for plastic bags would
decrease excessive use. These numbers illustrate that the public would rather be paying
for alternative bags than for polyethylene shopping bags.
• Additives can be used to enhance a plastic’s ability to degrade, and they can be used in
combination with degradation inducers such as ultraviolet radiation, composting and
thermal degradation. These combinations can greatly increase the rate of degradation
of a plastic, but the costs must be taken into account.
• The pay-as-you-throw program is currently one of the better methods as far as
increasing awareness and decreasing excessive use of garbage bags. The municipalities
that have adopted this program have seen a significant decrease in the amount of
garbage generated, and the program also has the benefit of increasing revenue to the
114
town. This revenue can be used to improve waste services, so the program has more
than one benefit.
• Worcester in particular has decreased the amount of trash collected and increased the
amount of recycling including plastic bags due to its use of the pay as you throw
program and its partnership with Casella which used zero sort recycling.
• From the tensile testing that was conducted, it is clear that available biodegradable
bags, Go Green bags and BioBags, have adequate tensile strength when compared to
elastic moduli than others, but this meant they were more rigid which lead to a lower
strain at fracture. For example, Applebee’s bags have a tensile strength of about 14.7
MPa with a strain of 0.1 at fracture, while BioBags have a tensile strength of about 7.4
MPa with a strain of 1.4 at fracture. In general, the biodegradable bags have sufficient
mechanical properties, but these properties are more sensitive environmental elements
such as heat and humidity.
• Many of the case studies examined were on rather small scales with respect to global
policies, but the changes taking place now are only affecting small regions of the world.
In order to make a global impact on bag reduction, the types of policies described in the
case studies must be adopted worldwide. It will require the cooperation among
governments, corporations, and the people. This will be a long-term change, and will
take time to achieve.
• Any long-term changes in what types of bags are used at the checkout will not come
about soon. There is still much to be done as far as lowering manufacturing costs,
115
increasing public awareness, and legislating policies requiring new bags. This will involve
the work of many people and could take years to finalize.
• There are many things that can be done in the short-term to cut back on unnecessary
bag use. This begins with public awareness – making sure people understand that PE
bags may be reused and recycled when done. As was seen in the chapter on case
studies, retailers would often place signs throughout their stores reminding people of
the environmental impacts of bags and to reuse their bags instead of letting them go to
landfills or litter.
With research, there is potential for changes in current bag use and future material
options. As manufacturing processes are refined and costs lowered, these new materials may
be introduced into the mainstream, possibly replacing polyethylene bags.
116
References
[1] Lajeunesse, Sara. "C&EN: WHAT'S THAT STUFF? PLASTIC BAGS." Chemical & Engineering News 82 (2004).
[2] Roach, John. "Are Plastic Grocery Bags Sacking the Environment?" National Geographic. 2 Sept 2003 <http://news.nationalgeographic.com/news/2003/09/0902_030902_plasticbags.html>
[4] "Plastic Properties of High Density Polyethylene (HDPE)." DynaLab Corp. <http://www.dynalabcorp.com/technical_info_hd_polyethylene.asp>.
[5] Shah, Aamer Ali, et al. "Biological Degradation of Plastics: A Comprehensive Review." Biotechnology Advances (2008).
[6] Singh, Baljit, and Nishma Sharma. "Mechanistic Implications of Plastic Degradation." Polymer Degradation and Stability (2008).
[7] Costello, Ken. "Polymer Tutorial." Chemistryland. October 30, 2007. <http://www.chemistryland.com/PolymerPlanet/Polymers/PolymerTutorial.htm>.
[8] Howard, Brian Clark. "What do Recycling Symbols on Plastics Mean?" thedailygreen (2008).
[9] Peacock, Andrew J. Handbook of Polyethylene: Structures, Properties, and Applications. New York: Marcel Dekker, 2000.
[10] "Chain configuration - Introduction to polymers." The Open University. <http://openlearn.open.ac.uk/mod/resource/view.php?id=196631>.
[11] "Plastics Division : Life Cycle of a Plastic Product Production." 2/4/2010 <http://www.americanchemistry.com/s_plastics/doc.asp?CID=1571&DID=5972#production>.
[12] "Polyethylene - Low Density (LDPE) Uses and Market Data." Chemical Industry News & Intelligence .
[15] Bauman, Valerie. "Toxins’ Long-Term Effects on Humans Will be Studied - the Boston Globe." Boston Globe2009, <http://www.boston.com/news/science/articles/2009/12/28/toxins_long_term_effects_on_humans_will_be_studied/> Science: 2/4/2010.
[16] Lapidos, Juliet. "Will My Plastic Bag Still be here in 2507?" Slate Magazine 2007.
[17] Watson, Tom. "Where can we Put all those Plastics?" The Seattle Times 2007.
[18] "Plastics Recycling Information Sheet." (2006) <http://www.wasteonline.org.uk/resources/InformationSheets/Plastics.htm>.
[19] Subramanian, P. M. "Plastics Recycling and Waste Management in the US." Resources, Conservation and Recycling (2000).
[20] Mohee, R., et al. "Biodegradability of biodegradable/degradable Plastic Materials Under Aerobic and Anaerobic Conditions." Waste Management (2008).
[21] Derraik, J. "The Pollution of the Marine Environment by Plastic Debris: A Review " Marine pollution bulletin 44.9 (2002): 842 - 852. DOI.
[22] James, Michael C. et al. "Leatherback Turtles: The Menace of Plastic." Marine pollution bulletin 58.2 2/24/2010.
[23] The Impacts of Degradable Plastic Bags in Australia. Melbourne, Victoria: Department of the Environment and Heritage.
[24] Plastic Bag Working Group. An Overview of Carryout Bags in Los Angeles County. Los Angeles:, 2007.
[25] Benjamin, Alison. "Public Prepared to Pay for Plastics, Survey shows." guardian.co.uk (2007).
[26] Robinson, Guy M., and Adam D. Read. "Recycling Behaviour in a London Borough: Results from Large-Scale Household Surveys." Resources, Conservation and Recycling (2005).
[27] Chandra, R., and Renu Rustgi. "Biodegradable Polymers." 23 (1998): 1273-335.
[28] Mohee, R., and G. Unmar. "Determining Biodegradability of Plastic Materials Under Controlled and Natural Composting Environments." Waste Management (2007).
[30] Katy. "The Time Has Come To Stop Using Plastic Bags." the non-consumer advocate. 6/20 2008. <http://thenonconsumeradvocate.com/2008/06/the-time-has-come-to-stop-using-plastic-bags/>
[31] "Ecosilk Bags Australia - Fashion, Shopping, Recyclable Bags." <http://www.ecosilkbags.com.au/ecosilk/ecosilk1.html>
[32] Whelan, Susan. "Review: Ecosilk Bags Australia: Environmentally-Friendly Alternative to Plastic Shopping Bags." 4/10/2008 2008. <http://reducing-waste.suite101.com/article.cfm/review_ecosilk_bags_australia>
[33] "Drawstring Bags." The Bag Ladies of Seattle. <http://order.bagladiesofseattle.com/drawstringbags-3.aspx>
[37] Galbraith, Kate. "Cheap Green: Reusing Plastic Bags - Green Inc. Blog - NYTimes.Com." The New York Times (2008) <http://greeninc.blogs.nytimes.com/2008/11/14/cheap-green-reusing-plastic-bags/>
[38] Wenzel, Elsa. "Plastic Bags Built to be Yesterday's News." cnet (2008)
[40] K, Jessie. "How to be Environmentally Friendly While Grocery Shopping." eHow. <http://www.ehow.com/how_4859995_environmentally-friendly-grocery-shopping.html>
[41] Butler, Nina Bellucci. "What's in Store for Plastic Bags?" Resource Recycling (2007).
[42] Food Marketing Institute (FMI). "Plastic Grocery Bags - Challenges and Opportunities." (2008)
[43] "Paper Vs. Plastic Bags." Lincoln Park Zoo (2006)
[44] Koss, Mike. "Aeropodcast #84: Paper or Plastic." Aeropause. 6/4 2009. <http://www.aeropause.com/2009/06/aeropodcast-84-paper-or-plastic>.
[45] R.N. Tharanathan. "Biodegradable Films and Composite Coatings: Past, Present and Future." Trends in Food Sciences & Technology 14 (2003): 71-78.
[46] Kader, A. A. "Modified Atmosphere Packaging of Fruits and Vegetables." Critical Reviews in Food Science and Nutrition 28 (1989): 1-30.
[47] Shogren, R. L., G. F. Fanta, and W. M. Doane. "Development of Starch Based Plastics - a Reexamination of Selected Polymer Systems in Historical Perspective." Staerke 44 (1993): 276-280.
[48] Doane, W. M. "USDA Research on Starch-Based Biodegradable Plastics." Staerke 44 (1992): 293-295.
[49] "WRAP: Material Change for a Better Environment." (2010) <http://www.wrap.org.uk/index.html>
[50] Ferre, James. SA Plastic Bag Ban Begins Next Week. Australian Food News
[51] Reducing Carrier Bag use. Waste and Resources Action Programme, 2009.
[52] Beale, Richard. Carrier Bag Case Studies. Waste and Resources Action Programme, 2009.
[58] "Plastic Bag Ban." Government of South Australia. 2008. <http://www.zerowaste.sa.gov.au/About.mvc/PlasticBags>
[59] Drake, Isobel. Plastic Bag Ban Hailed a Success by SA Government. Australian Food News
[60] Weatherill, Jay. "South Australia’s Plastic Bag Ban Crosses the Border."
[61] Plastic Bag Reduction Ordinance. San Francisco Government, (2007).
[62] Eskenazi, Joe. "Baggage." 5 Jan 2009
[63] Gorn, David. "San Francisco Plastic Bag Ban Interests Other Cities." National Public Radio
[64] Biodegradable/Compostable Film and Bags. Roplast Industries.
[65] "Walmart Sets Goal to Reduce its Global Plastic Shopping Bag Waste by One-Third." Walmart. 25 Sept 2008. <http://walmartstores.com/FactsNews/NewsRoom/8628.aspx>
[66] "Landfills." Environmental Protection Agency. 24 Feb 2010 2010. <http://www.epa.gov/osw/nonhaz/municipal/landfill.htm>
[67] "State Environmental Officals Announce Agreement With Supermarket Association to Cut Down Disposable Bags." 2/24/2010 <http://www.mass.gov/dep/public/press/0309plas.htm>
[68] "Trash & Recycling | City of Worcester, MA." 2/24/2010 <http://www.ci.worcester.ma.us/dpw/trash-recycling/>
[69] "Town of Shrewsbury." 2/24/2010 <http://www.shrewsbury-ma.gov/egov/apps/directory/list.egov?path=divs&action=256&fDD=15-256>
[70] "Town of Grafton - Pay As You Throw" 2/24/2010 <http://www.grafton-ma.gov/Public_Documents/GraftonMA_DPW/sanitation&recycling/PAYT>
[71] ---. "Trash Cost FAQ." Town of West Boylston. <http://www.westboylston.com/Pages/WBoylstonMA_BComm/swatdir/trashcostsfaq>
[72] Solid Waste Advisory Team. "How Will West Boylston's Green Bag Program Work?" Town of West Boylston. <http://www.westboylston.com/Pages/WBoylstonMA_BComm/swatdir/QandAHandout-PAYT.pdf>