28
Property/Casualty InsuranceCompany Insolvencies A PUBLIC POLICY PAPER September 2010 American Academy of Actuaries Property/Casualty Financial Soundness/Risk Management Committee
1850 M Street NW, Suite 300Washington, D.C. 20036
202-223-8196FAX 202-872-1948www.actuary.org
Property/Casualty InsuranceCompany Insolvencies
A P u b l i c P o l i c y P A P e r
September 2010
American Academy of ActuariesProperty/Casualty
Financial Soundness/Risk Management Committee

Property/Casualty Insurance Company Insolvencies
September 2010
Developed by the
Financial Soundness/Risk Management Committee of the American Academy of Actuaries
The American Academy of Actuaries is a professional association with over 17,000 members, whose mission is to assist public policymakers by providing leadership,
objective expertise, and actuarial advice on risk and financial security issues. The Academy also sets qualification, practice, and professionalism standards
for actuaries in the United States.

2010 Financial Soundness/Risk Management Committee
Debbie Rosenberg, Chairperson
Shawna Ackerman Bob Aldorisio Kevin Bingham Sarah Fore Jeff Kadison Mary D. Miller Christopher Ritter Joanne Spalla David Spiegler
1850 M Street N.W., Suite 300 Washington, D.C. 20036-5805
TABLE OF CONTENTS
Introduction........................................................................................................................1
Historical Perspective ........................................................................................................2
Scope of the Current Research .........................................................................................4
Summary of Observations.................................................................................................5
1. A Retrospective Look at the 30 Companies With the Greatest Loss Reserve
Development in 2002 from 2001 Losses ....................................................................6
General Observations...............................................................................................7
The Best of Those Companies With Adverse Loss Reserve Development.............8
Those Companies No Longer Actively Writing ......................................................8
Special Cases ...........................................................................................................9
Additional Discussion............................................................................................10
Conclusions............................................................................................................11
2. The Companies With the Highest Loss Reserve Development Based on 2008
Data ............................................................................................................................12
Reserve Developments—Financial Data ...............................................................12
The 2008 Top 30....................................................................................................14
The Appointed Actuary and the SAO....................................................................14
Areas of Continued Interest ...................................................................................16
3. Insolvent Property Casualty Companies 2005-2009..........................................16
Observations ..........................................................................................................17
General Comments.................................................................................................17
Future Steps ...........................................................................................................18
Appendix 1 ........................................................................................................................19
Appendix 2 ........................................................................................................................20
Appendix 3 ........................................................................................................................23


1
PROPERTY/CASUALTY INSURANCE COMPANY INSOLVENCIES
Introduction
The Property/Casualty (P/C) Financial Soundness/Risk Management Committee (FSRM) of the
American Academy of Actuaries1 is charged with providing actuarial support, advice, and
communications on topics that involve the soundness and risk management of P/C insurance.
Since 2003, members of the Casualty Practice Council have researched the effects of loss reserve
development in the P/C industry. This discussion is a product of ongoing research by committee
members seeking to explore the role that the development of losses plays in the insolvencies of
P/C insurance companies.
The Academy, through its Committee on Property and Liability Financial Reporting (COPLFR),
issued two such studies in the 1990s. In each of the previous studies, COPLFR requested that
chief examiners of the various insurance departments in states where the insolvent companies
were domiciled complete a questionnaire for each of the insolvent companies.
The three main conclusions of the first study, Study of Insurance Company Insolvencies from
1969-1987 to Measure the Effectiveness of Casualty Loss Reserve Opinions, issued in 1990,
were as follows:
1. The most common cited principal cause of insolvency was “under-reserving.”
“Under-reserving” was noted in 58% of the insolvencies for which causes were
identified. “Mismanagement” was the second most frequently identified cause of
insolvency cited in 41% of the responses.
2. Many of the loss reserve opinions for companies subsequently declared insolvent
were qualified or conditioned in some manner.
3. In the majority of insolvencies studied, no loss reserve opinion was rendered (81 of
105 cases).
1 The American Academy of Actuaries (“Academy”) is a 17,000-member professional association whose mission is to serve the public on behalf of the U.S. actuarial profession. The Academy assists public policymakers on all levels by providing leadership, objective expertise, and actuarial advice on risk and financial security issues. The Academy also sets qualification, practice, and professionalism standards for actuaries in the United States.
2
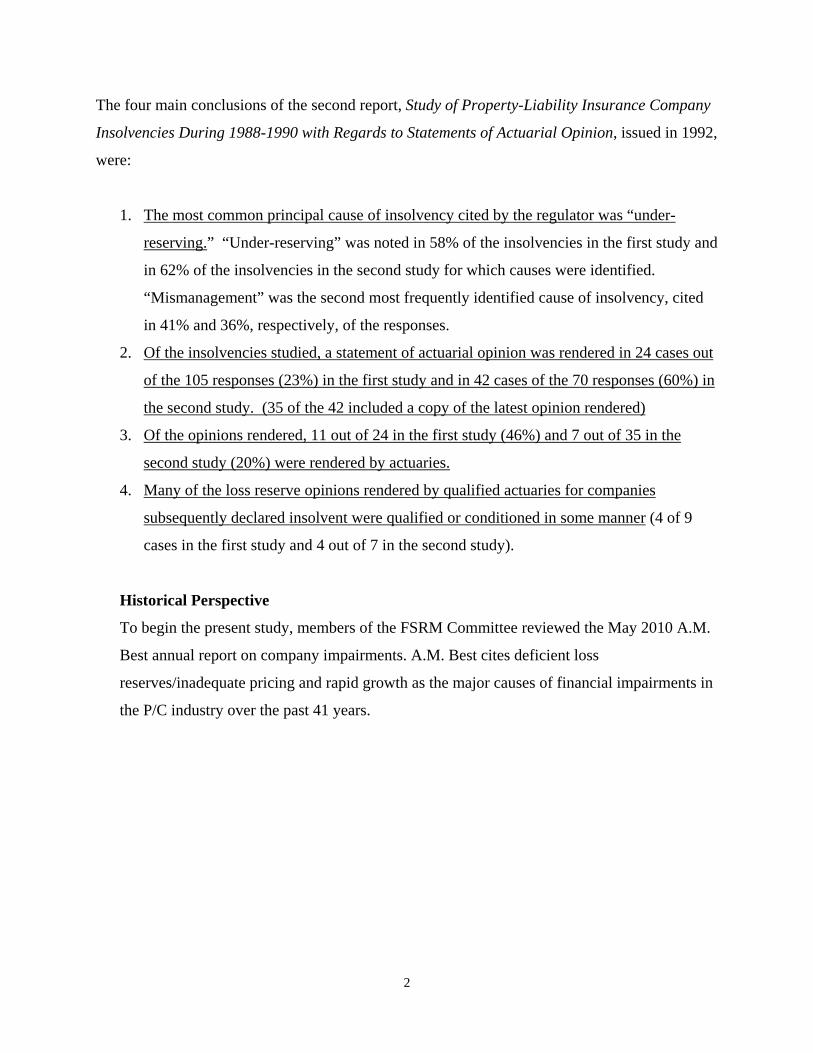
The four main conclusions of the second report, Study of Property-Liability Insurance Company
Insolvencies During 1988-1990 with Regards to Statements of Actuarial Opinion, issued in 1992,
were:
1. The most common principal cause of insolvency cited by the regulator was “under-
reserving.” “Under-reserving” was noted in 58% of the insolvencies in the first study and
in 62% of the insolvencies in the second study for which causes were identified.
“Mismanagement” was the second most frequently identified cause of insolvency, cited
in 41% and 36%, respectively, of the responses.
2. Of the insolvencies studied, a statement of actuarial opinion was rendered in 24 cases out
of the 105 responses (23%) in the first study and in 42 cases of the 70 responses (60%) in
the second study. (35 of the 42 included a copy of the latest opinion rendered)
3. Of the opinions rendered, 11 out of 24 in the first study (46%) and 7 out of 35 in the
second study (20%) were rendered by actuaries.
4. Many of the loss reserve opinions rendered by qualified actuaries for companies
subsequently declared insolvent were qualified or conditioned in some manner (4 of 9
cases in the first study and 4 out of 7 in the second study).
Historical Perspective
To begin the present study, members of the FSRM Committee reviewed the May 2010 A.M.
Best annual report on company impairments. A.M. Best cites deficient loss
reserves/inadequate pricing and rapid growth as the major causes of financial impairments in
the P/C industry over the past 41 years.

3
While an impaired company may not necessarily be declared insolvent, the causes of
impairments are often precursors to insolvencies. Impairment rates also are highly correlated
with underwriting performance, as illustrated in the following graph:
Reprinted with permission of the A.M. Best Company.
Reprinted with permission of the A.M. Best Company.

4
A.M. Best also looks at how the rate of impairment correlates with the economic climate.
Sharply rising inflation and interest rates tend to correlate with an increase in the number of
impairments.
Scope of the Current Research
Since the last Academy report was issued in 1992, the science of enterprise risk management
(ERM) has evolved, and the risk-focused surveillance framework has been introduced to provide
tools for early identification of troubled companies. The FSRM committee determined this
would be an ideal time to revisit the issue of company insolvencies, with an eye toward
achieving the following goals:
To determine if inadequate loss reserves still would be identified as the primary cause of
insolvencies. When loss reserves are found to be deficient, an insurer must increase
reserves, thereby depleting its capital and surplus.
To assess what role the SAO has played in helping to mitigate P/C insurer insolvencies.
The SAO has been in effect for nearly 30 years and has undergone significant changes
over that time.
Shaded areas represent official recessions. Reprinted with permission of the A.M. Best Company.

5
To examine these issues, the FSRM Committee chose to examine the problem through the
following means:
Revisiting companies that experienced the largest loss reserve development in the early
2000s to assess how they fared and to identify some of the distinguishing characteristics
that allowed some to survive while others failed;
Establishing a current listing of companies with significant loss reserve development to
try to identify the cause or causes of this problem, leveraging available company data in
conjunction with the SAOs;
Researching recent insurer insolvencies to identify the underlying causes, including how
well SAOs worked to distinguish these companies prior to insolvency.
Summary of Observations
Based on the results of these analyses, the FSRM Committee concluded that underreserving, by
itself, is not the leading cause of insolvency. This is consistent with current ERM theory, which
encourages each company to develop its own ERM culture using an individual assessment of all
functional areas and determining how those areas relate to company solvency. Although the
FSRM Committee identified deficient loss reserves/inadequate pricing, rapid growth, and alleged
fraud as major causes of insolvency, there does not appear to be one primary cause. Where
multiple causes of insolvency are listed, it is not clear that any one cause is independent of the
others. For example, mismanagement often is cited as the cause of insolvency—but
mismanagement can manifest itself in many ways, including deficient loss reserves and
inadequate pricing.
A retrospective look at the status of the 30 companies that were identified as having the
greatest deficiencies in their 2001 loss reserves as of year-end 2002 resulted in the
following observations:
1. Of these companies, 80 percent are actively writing today and are not in financial
difficulty.
2. Most of the companies either were very large or were subsidiaries of very large
companies.
6
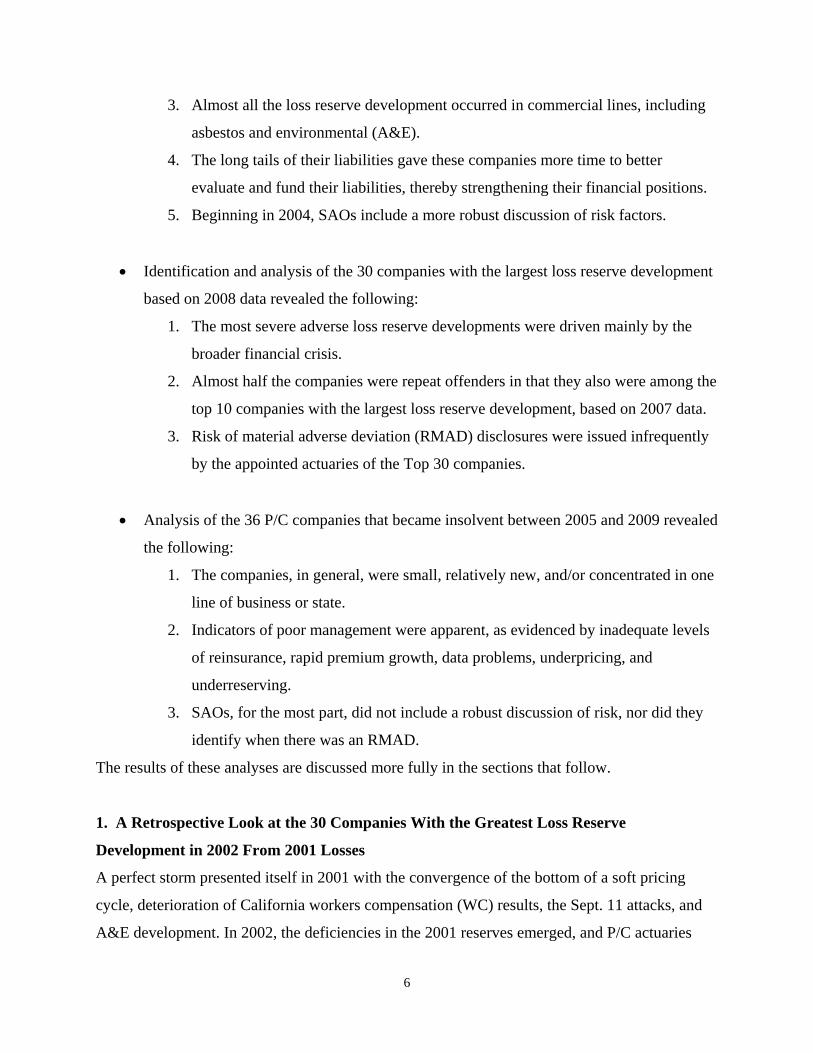
3. Almost all the loss reserve development occurred in commercial lines, including
asbestos and environmental (A&E).
4. The long tails of their liabilities gave these companies more time to better
evaluate and fund their liabilities, thereby strengthening their financial positions.
5. Beginning in 2004, SAOs include a more robust discussion of risk factors.
Identification and analysis of the 30 companies with the largest loss reserve development
based on 2008 data revealed the following:
1. The most severe adverse loss reserve developments were driven mainly by the
broader financial crisis.
2. Almost half the companies were repeat offenders in that they also were among the
top 10 companies with the largest loss reserve development, based on 2007 data.
3. Risk of material adverse deviation (RMAD) disclosures were issued infrequently
by the appointed actuaries of the Top 30 companies.
Analysis of the 36 P/C companies that became insolvent between 2005 and 2009 revealed
the following:
1. The companies, in general, were small, relatively new, and/or concentrated in one
line of business or state.
2. Indicators of poor management were apparent, as evidenced by inadequate levels
of reinsurance, rapid premium growth, data problems, underpricing, and
underreserving.
3. SAOs, for the most part, did not include a robust discussion of risk, nor did they
identify when there was an RMAD.
The results of these analyses are discussed more fully in the sections that follow.
1. A Retrospective Look at the 30 Companies With the Greatest Loss Reserve
Development in 2002 From 2001 Losses
A perfect storm presented itself in 2001 with the convergence of the bottom of a soft pricing
cycle, deterioration of California workers compensation (WC) results, the Sept. 11 attacks, and
A&E development. In 2002, the deficiencies in the 2001 reserves emerged, and P/C actuaries

7
were criticized for either getting the reserves wrong or failing to insist that management book
stronger reserves. Of the $23 billion in adverse loss reserve development that emerged in 2002
on 2001 reserves, nearly $18.5 billion (80 percent) was in the 30 companies that had the highest
dollar amount of adverse development. For this section, the committee looked back at those 30
companies and reviewed their opinions and financial results for the years leading up to the 2002
development, as well as what has transpired since then. See Appendix 1.
General Observations
By 2002, the Casualty Actuarial and Statistical Task Force2 of the National Association of
Insurance Commissioners (NAIC) already had begun work on modifying the actuarial opinion
instructions after the introduction of Actuarial Standard of Practice (ASOP) No. 36, Statements
of Actuarial Opinion Regarding Property/Casualty Loss and Loss Adjustment Expense Reserves.
The revisions to the instructions were effective for year-end 2004 opinions. While there were
some high-quality opinions prior to 2004, the revised instructions appear to have triggered a
more rigorous discussion of risks in opinions issued in 2004 and later. Signers now were required
to indicate whether there was an RMAD, to identify those risk factors, and to define what they
considered to be material. Before 2004, signers only were required to comment if they believed
there was a risk of insolvency.
Some additional observations:
Of the 30 companies, 22 were rated A or better by A.M. Best, including 11 that were
rated A++.
Only 12 of the 30 opinions in 2001 indicated the presence of an RMAD. Yet 27 of the 30
experienced adverse deviation greater than 10 percent of surplus in 2002. Through 2008,
all 30 experienced development greater than 10 percent of surplus on the 2001 reserves.
Three of the companies experienced significant adverse development related to personal
lines, mostly due to mold. The majority of the development was due to WC, medical
professional liability, and A&E.
2 At the time, the Casualty Actuarial and Statistical Task Force was known as the Casualty Actuarial Task Force.

8
In 2001, nine opinions were signed by consultants. Three of the nine contained RMAD
statements. The other 21 were signed by company actuaries. Nine of these had RMAD
statements. Since these 21 companies were generally larger companies, there were a
greater percentage of company actuaries signing the SAO. Consultants had a lower
percentage of RMADs than company actuaries.
The $23 billion of adverse development was only 6 percent of the total industry surplus
of $378 billion—but the $18.4 billion for these 30 companies was 23 percent of their
surplus. Subsequent development in nine of the 30 companies is greater than their 2001
surplus. In other words, if they had known and booked the true ultimate value of their
reserves in 2001, they would have been insolvent. While it is not possible to calculate
accurately a revised risk-based capital (RBC), at least an additional 11 companies would
have been in some type of RBC action level, had they known and booked their ultimate
reserves.
Six of the companies on the list were reinsurers.
In the sections that follow, the 30 companies will be discussed individually in more detail.
The Best of Those Companies With Adverse Loss Reserve Development
Three companies made the list simply due to their size.
Their 2002 development was less than 10 percent of their 2001 surplus.
They are still large active participants in the market, although one has since been
acquired by another company.
Their surplus is equal to or greater than their surplus in 2001.
Their RBC ratios in 2008 were 400 percent, 500 percent, and 600 percent.
Although their 2001 reserves continued to develop adversely, their recent reserve
positions appear quite stable.
Two of the three indicated an affirmative RMAD in 2008.
Those Companies No Longer Actively Writing
Six of the companies either are no longer writing business or are not writing the same
type of business they were writing in 2001. While one of the six was quite large if
9
measured by its 2001 surplus, the others were five of the smallest companies that made
the list.
Of the three reinsurers in this category, one has been in runoff since October 2002. The
2002 SAO contained an affirmative RMAD, as has every opinion since then. While it has
been close to insolvency in the past, the company appears to have stabilized. The actuary
wrote a good discussion of risk factors in the SAO.
The other two reinsurers in this category are members of the same group of companies
and were purchased by another reinsurer in 2006. At that time, one of the companies
ceased to exist as a separate entity. It had affirmative RMADs throughout our review
period with good discussions of risk factors. It was largely an excess reinsurer that
suffered heavy adverse development from 2002 until its end in 2006. The second
reinsurer in this group also has had robust descriptive SAOs and RMADs since 2000. It is
in runoff as a reinsurer, but continues to write primary business. The company had
several parental infusions of capital prior to its acquisition in 2006.
The most distressed company was insolvent by the end of 2002, and it was put into
liquidation in 2003. The 2001 SAO is the only pre-insolvency SAO available. It was a
reasonable opinion with little or no discussion of any risk factors, except to state that the
RBC was below the authorized control level (ACL). There was no affirmative RMAD
stated in the SAO by the consulting actuary.
One company was already in runoff before 2001. The company was technically insolvent
but had a parental agreement and retroactive reinsurance in place. Its liabilities were
largely A&E. The SAOs had good discussions of risk from the company actuary,
including affirmative RMAD statements.
The final company, no longer actively writing, has been in runoff since 2002. Neither the
2000 nor 2001 SAOs indicated that the company was experiencing any difficulties. The
RBC fell from 486 in 2001 to 114 in 2002. There has been an affirmative RMAD each
year since 2002.
Special Cases
Two of the companies are state WC funds. One has had an affirmative RMAD since
2000 and the other has had an affirmative RMAD since 2002. Based on subsequent
10
runoff, one would have been insolvent in 2001. One has been exempt from RBC during
the period; the other has a 650 RBC score. While one SAO has a reasonable discussion
of risks, the other is less descriptive.
The third company in this category is a medical professional liability writer in New
York. It is subject to specific New York regulatory requirements regarding rates and
solvency. While technically insolvent, its opinions have had affirmative RMADs and
good risk discussions each year since 2000.
A fourth company in this category is a company that writes only homeowners’ insurance.
The company has a strong parent, but, in 2002, its one-year development was 350
percent of the prior year’s reserves. Since then, it has experienced favorable
development on what was largely a Texas mold reevaluation. The company’s 2001 SAO
included an affirmative RMAD statement and a good discussion of risks. The company
has not had an affirmative RMAD since 2004 and has stabilized and been profitable
since that time.
For a discussion of the companies analyzed on the basis of the NAIC group to which they belong,
see Appendix 2.
Additional Discussion
As shown on the next page in Table A, the loss reserve development of the worst 30 companies
drives total development for the industry each year. Of the 30 companies described in this
section, 16 were among the worst 30 in 2003, and 18 were on the list in 2004. Fourteen of the
2002 companies were on the list in 2003 and 2004. Twenty of the companies on the list in 2003
were also on the list in 2004.

11
TABLE A
Calendar
Year All Companies
(Billions) Worst 30(Billions)
2002 $23.1 $18.4
2003 13.8 13.5
2004 10.1 13.4
2005 1.0 20.2
2006 -6.7 4.5
2007 -8.3 4.8
2008 -1.8 14.9
Table B shows the average RBC for the industry and for the worst 30 companies in each year.
TABLE B
Conclusions:
Of the 30 companies, 80 percent are actively writing today and are not in financial
difficulty.
Most of the companies either were very large or were subsidiaries of very large
companies.
Almost all the development occurred in commercial lines, including A&E.
Calendar Year
All Companies Worst 30
2002 457 301
2003 492 342
2004 523 296
2005 556 372
2006 610 464
2007 624 422
12
The long tail of their liabilities gave these companies more time to recover and strengthen
their financial positions. Smaller companies with shorter tail lines have an immediate
demand for cash outlay and, therefore, do not have the option to seek capital infusions,
exit troublesome lines of business, implement rate increases, or pursue merger
opportunities
SAOs, beginning in 2004, include a more robust discussion of risk factors.
2. The Companies With the Highest Loss Reserve Development Based On 2008 Data
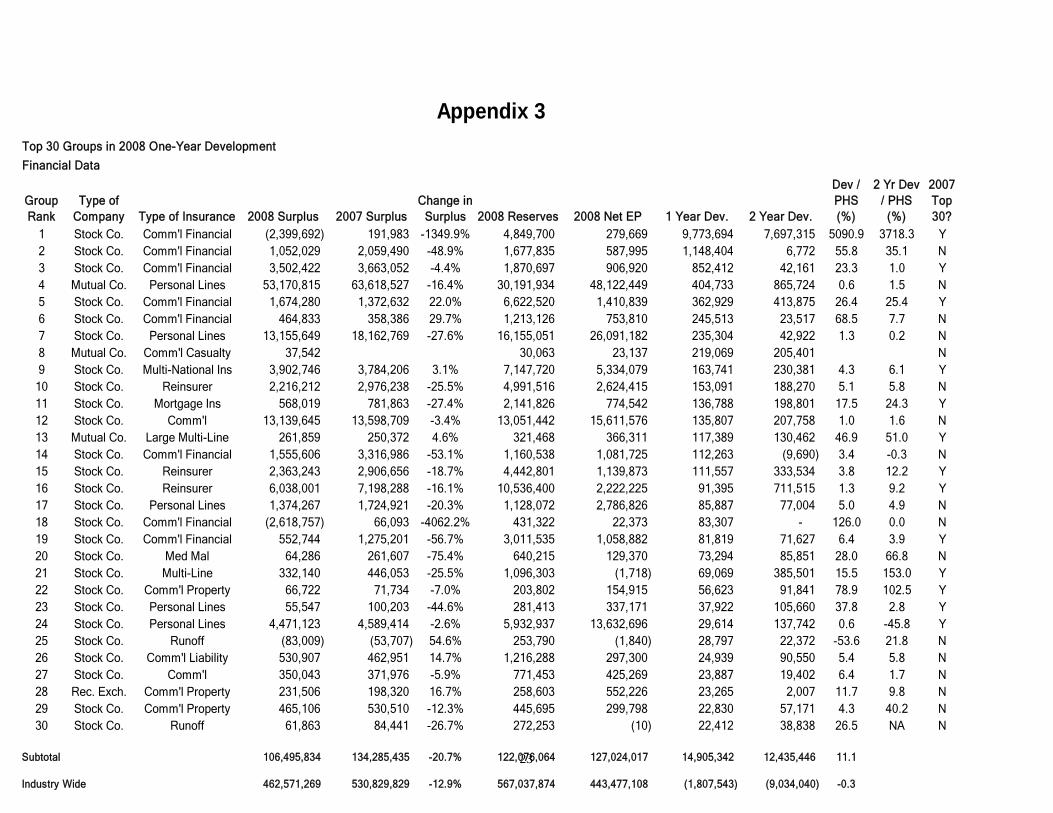
This analysis updates the prior studies of loss reserve development in the P/C insurance industry.
Using 2008 financial statement data, the FSRM committee identified the 30 companies driving
the largest loss reserve development and labeled this group the Top 30. The Top 30 is defined as
those companies that reported the largest one-year development statistic (in raw dollars), as
reported on a company’s Schedule P. Selecting this statistic in this manner naturally predisposes
the Top 30 to be populated almost exclusively by larger companies. In addition to reviewing the
financial data affected by loss reserving, the FSRM Committee also looked at the SAOs to see
how accurately they identified companies in possible distress. See Appendix 3.
This research has been compiled using publicly available data on companies that have
contributed to loss reserve development over the past few years. The goals of this research
include gaining a greater understanding of the occurrence and magnitude of material adverse loss
reserve developments in the industry, the role of the SAO, and the role of the actuary in general.
Reserve Developments—Financial Data
In the early part of the past decade, material loss reserve developments experienced across the
P/C industry drew the scrutiny of industry observers. In the years 2002 to 2004 alone, overall
loss reserve developments accounted for a deterioration of more than $40 billion in industry
surplus, as shown in Table A on Page 11. The source of individual company developments
varied, but the prevailing factor was material increases in asbestos reserves. It appears from
13
available data that 30 percent to 35 percent of more than $40 billion came from increases in these
reserves attributed to accidents occurring years or even decades earlier. In addition to asbestos, a
number of other lines contributed to these earlier developments, including medical professional
liability, WC, high excess liability insurance, and long-tailed casualty reinsurance. During this
time period, many insurers enjoyed a hard insurance market (i.e., a period of rising prices), in
which favorable underwriting results helped members of company management to strengthen
reserves and shore up their balance sheets.
Since that time, however, company loss reserves have not developed as adversely as previously
observed. From 2006 to 2008, industry development was favorable. The relative infrequency of
material increases in asbestos liabilities played a significant role in this positive shift in prior-
year loss reserve development.
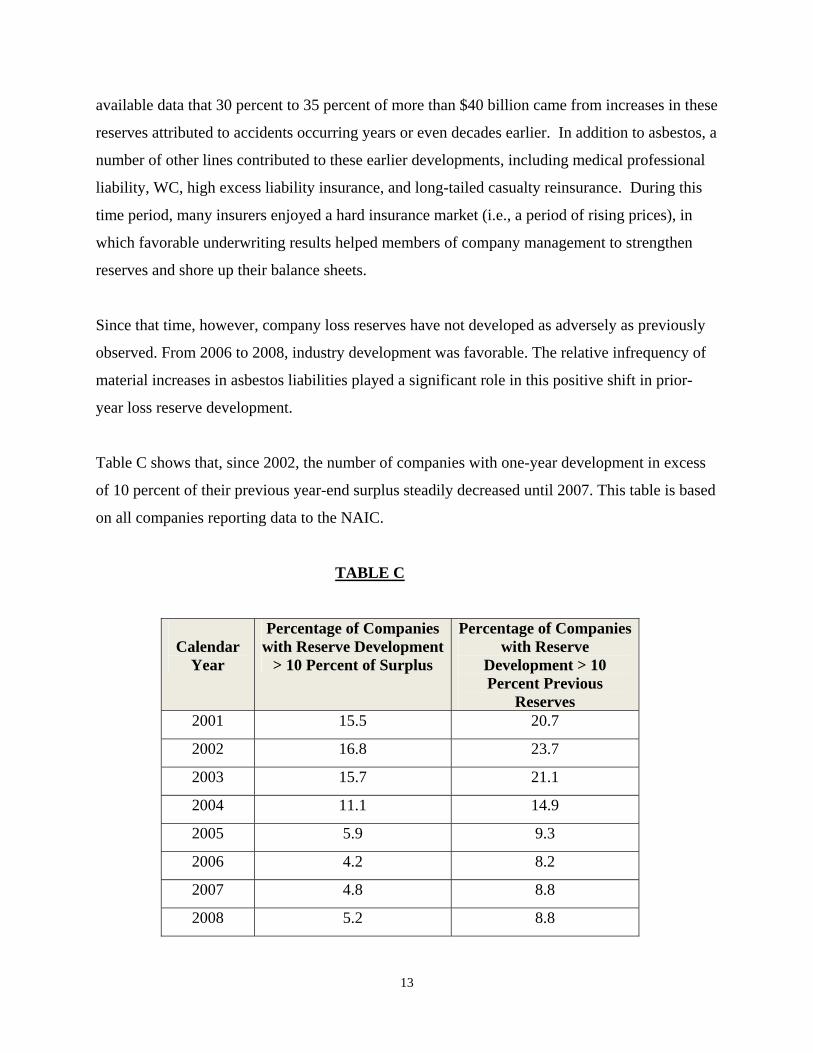
Table C shows that, since 2002, the number of companies with one-year development in excess
of 10 percent of their previous year-end surplus steadily decreased until 2007. This table is based
on all companies reporting data to the NAIC.
TABLE C
Calendar
Year
Percentage of Companies with Reserve Development
> 10 Percent of Surplus
Percentage of Companies with Reserve
Development > 10 Percent Previous
Reserves 2001 15.5 20.7
2002 16.8 23.7
2003 15.7 21.1
2004 11.1 14.9
2005 5.9 9.3
2006 4.2 8.2
2007 4.8 8.8
2008 5.2 8.8
14
The table above also shows the proportion of companies that experienced one-year development
in excess of 10 percent of the previous year’s reserves. It also provides some perspective on the
proportion of companies that are subject to the one-year-development IRIS test, triggered only
when a company’s development exceeds 20 percent of the previous year’s surplus. This table
also provides perspective on the potential variability of the reported loss reserves for each
company in the industry.
In 2008, the most severe adverse loss reserve developments were driven mostly by the broader
financial crisis. The development is attributable to a small number of insurers that wrote
mortgage insurance and financial products. Although the rest of the industry had fairly low
adverse development, the small number of insurers affected by the 2008 meltdown in the
housing and credit markets became new members of the Top 30 list. Similar to the asbestos
liabilities earlier in the decade, the emergence of these reserves can be viewed as a unique event
for the P/C industry.
The 2008 Top 30
One must look closely at the actual companies that make the list to avoid making inaccurate
inferences. Many companies in the 2008 Top 30 were from the financial products group
described above. In fact, five of the top six companies in the 2008 Top 30 made the list because
of unique developments in financial products and mortgage guaranty insurance. In addition, three
members were large personal-lines companies that experienced minor loss-reserve developments
when measured as a percentage of their surplus. Because of their overall size, the dollar amount
of adverse development was large, resulting in their placement in the Top 30. Beyond these
unique situations, however, the FSRM Committee was able to identify 13 companies that were
repeat offenders from the 2007 Top 30.
The Appointed Actuary and the SAO
The role of the appointed actuary, actuarial practice, and the SAO were also of great interest to
the committee. Members reviewed the SAOs prepared for each of the large companies for these

15
Top 30 companies, tracking important data about the company, its affiliation, and the actuary
who signed the SAOs. The FSRM Committee also noted information about the actuary’s
relationship with the company or its auditor and whether the actuary had replaced a previous
appointed actuary.
The FSRM Committee found that eight of the companies in the Top 30 had appointed actuaries
who were employees of the company. This is a result of the fact that the Top 30 were identified
as those companies with the largest dollars of loss reserve development. This naturally led to the
identification of companies that are large enough to employ actuaries full time to sign their
SAOs. Of the 22 consultants retained by companies in the Top 30, 11 worked for the firm that
also performed the audit of the company.
Specific focus was placed on the RMAD disclosure, which has been a requirement of actuaries
since 2004. Affirmative RMAD disclosures appear infrequently among the appointed actuaries
serving the Top 30. In 2008, only 19 of the Top 30 (63 percent) indicated affirmative RMADs
for those companies with large loss reserve developments. In 2006, only nine of the companies
with large developments in the Top 30 (30 percent) had an affirmative RMAD. The percentage
of groups in the Top 30 with RMADs has increased only gradually over the years, with the
maximum frequency approximating 75 percent of the Top 30 groups. The number of SAOs with
affirmative RMADs is lower than the FSRM Committee would have expected, given that the
Top 30 is a group of companies that, by definition, have exhibited material loss reserve
development. Because a materiality standard is selected by the appointed actuary, not every
actuary will agree as to what constitutes a material deviation. In addition, large companies can be
included in the list even when their development is less than 10 percent of surplus. Even with all
these considerations, however, the FSRM Committee believes continued research and guidance
for the actuarial profession is necessary to address the fact that a large percentage of Top 30
companies lacked affirmative RMADs just a few years before experiencing material loss reserve
development.
16
Areas of Continued Interest
In future years, the FSRM Committee plans to expand its review of companies. The FSRM
Committee aims to expand the field of companies by observing financial and SAO data from
companies with significant loss reserve development ratios (to surplus). It is likely this will
enable FSRM Committee members to observe smaller to mid-sized companies that have
experienced material developments.
The committee also would like to continue to monitor the prevalence of affirmative RMADs
among those companies that have material development and subsequently have become impaired
because of loss reserve developments.
3. Insolvent Property Casualty Companies 2005-2009
Financial data and SAOs, when available, were reviewed for 36 companies that were declared
insolvent between 2005 and 2009. This information was reviewed for each of the five years prior
to the company’s year of insolvency. Several common themes emerged in the study of these
companies. The majority of the companies was small, relatively new, and/or was concentrated in
one line of business and/or state. The review of financial data for many of the companies showed
evidence of poor management and decisionmaking, including little or no reinsurance, inadequate
reinsurance for the amount of risk, very rapid premium growth, significant adverse development,
inadequate pricing, and potentially serious data problems.
Out of the five years of data for the 36 companies, a little more than half of the opinions (89)
were available for review. One opinion was qualified; the rest stated that reserves were
reasonable. An affirmative RMAD disclosure was included in 43 of these opinions and 33 noted
that there was no RMAD. The remaining opinions either were silent regarding RMAD or the
wording was such that it was not possible to determine with certainty whether there was an
RMAD. There were some cases in which surplus was depleted entirely due to adverse
development over a short time period (one to two calendar years), but the actuary did not
mention that there was an RMAD. In one of these cases, the actuary explicitly stated that there
was not an RMAD. As stated earlier in this report, beginning in 2004, signers of SAOs were

17
required to provide an RMAD comment that includes their definition of material. Before 2004,
appointed actuaries were required to comment only if there was an RMAD. The materiality
standard used in the majority of the opinions was between 5 percent and 20 percent of surplus.
Only eight of the reviewed opinions had a standard measured as a percentage of reserves.
Most of the companies’ opinions lacked comments about risk factors. There were several
examples in which there was significant risk, but there was no comment in the SAO. In the
actuaries’ defense, some of the items noted above as poor management and decisionmaking
could have been described as outside the scope of what the actuary should include in his/her
comments. One particular multi-state, multi-line company had poor loss ratios in the late 1990s
and improving loss ratios thereafter. There was some adverse development from the A&E
reserves, and the company entered and exited lines of business quickly (for example, it appears
that the company wrote WC only in 2002). The reviewed SAOs included an affirmative RMAD
statement but did not discuss any of the risk factors, such as the poor loss ratios, entering and
leaving lines of business very quickly, etc.
Observations:
Many of the insolvent companies were small, relatively new, and mono-line and/or
mono-state.
Reasons for most of the insolvencies could be classified as poor management and/or
decisionmaking.
Many of the opinions did not adequately disclose companies’ major risk factors.
RMAD disclosures were questionable.
General Comments:
The introduction of the SAO raised the standard for appointed actuaries.
The SAO is a living document that has undergone many changes in response to
developments over the years.
18
While the SAO, by itself, cannot prevent insolvencies, it can help identify those
companies and/or categories of companies that could be in trouble.
Access to the SAOs has become easier over the years, enabling actuaries to aggregate
information for the industry as whole.
Several actuarial organizations are involved in providing continuing education
opportunities on the topic of SAOs. Such opportunities include COPLFR’s annual
practice note, the Effective Loss Reserve Opinion Seminar, and the Casualty Loss
Reserve Seminar.
Regulators employ SAOs as one of their primary tools in assessing the solvency and
vulnerability of the companies under their domain.
Future Steps:
Periodic studies of the causes of P/C company insolvencies should be undertaken to
provide insight into the drivers of insolvencies and how they evolve over time.
Future studies should include ERM methodologies to help identify those companies with
significant insurance risk, including underwriting, reserving, and operational risk.
Data gleaned from SAOs should be aggregated and reviewed to determine their
effectiveness, including discussions of risk factors and RMAD definitions.
The effectiveness of the SAO is directly related to the efforts undertaken to ensure that actuaries
are familiar with the SAO requirements and to ensure that actuarial reports adhere to both the
spirit and the letter of the SAO instructions. Extra vigilance in times of economic turmoil may go
a long way to help identify companies that are at risk of insolvency.

19
Company NameSource of
Adv. Dev't
One-Year Dev't (000)
Two-year Dev't (000)
2002 Surplus (000)
2001 Surplus (000)
One-Year Dev't as %
of 2001 Surplus
2001 Dev't thru 2009
(000)
2001 Dev't since 2002
(000)RMAD in SAO
2002 Total Reserves Loss and LAE (000)
American Rein Co R 2,220,824 2,662,169 2,230,032 2,643,094 84.02% -1,564,934 -3,785,758 Yes 7,309,153Employers Reins Corp R 1,883,350 1,886,799 4,431,736 4,857,911 38.77% 5,034,835 3,151,485 Yes 5,665,420Columbia Ins Co SS 1,115,786 847,985 3,997,187 4,075,309 27.38% 1,549,293 433,507 1,844,401National Union Fire Ins Co Of Pit ts D&O 1,011,189 1,167,409 5,885,057 6,410,712 15.77% 6,205,708 5,194,519 Yes 5,477,821Travelers Cas & Surety Co ASB 992,548 947,200 2,572,746 2,998,765 33.10% 2,264,320 1,271,772 7,903,103American Home Assur Co 954,209 1,105,147 2,883,305 3,518,539 27.12% 5,876,896 4,922,687 Yes 5,242,722Travelers Ind Co ASB 811,357 770,188 3,963,326 3,824,743 21.21% 2,661,811 1,850,454 6,390,271Century Ind Co A&E 757,943 935,351 25,000 150,561 503.41% 1,518,554 760,611 Yes 2,277,859Allstate Ins Co A&E 752,544 778,816 13,760,543 13,772,727 5.46% 2,613,180 1,860,636 13,317,572Lumbermens Mut Cas Co Mold 733,358 893,054 696,846 1,266,575 57.90% 926,173 192,815 7,309,153Zurich American Ins Co WC 723,792 1,131,490 2,617,850 2,421,276 29.89% 5,210,582 4,486,790 7,116,657Ge Reins Corp * * R 710,260 749,588 623,413 735,050 96.63% 1,798,221 1,087,961 Yes 1,575,797State Compensation Ins Fund WC 651,469 331,093 1,449,361 1,431,382 45.51% 4,298,797 3,647,328 Yes 9,837,966US Fidelity & Guaranty Co ASB 488,260 268,875 1,798,445 1,859,633 26.26% 462,040 -26,220 Yes 2,412,088Federal Ins Co ASB 405,625 221,189 4,451,016 3,526,320 11.50% 1,740,627 1,335,002 7,685,188State Ins Fund WC 393,416 181,141 1,134,405 1,172,033 33.57% 1,339,125 945,709 7,035,395General Rein Corp R 389,514 1,521,581 4,095,127 3,737,764 10.42% -2,094,406 -2,483,920 Yes 12,291,641Liberty Mut Ins Co OTLB 385,224 1,458,294 4,007,749 4,476,207 8.61% 3,846,178 3,460,954 9,335,887Medical Liability Mut Ins Co MM 318,165 294,967 993,042 1,428,745 22.27% 348,761 30,596 Yes 3,241,702Transatlantic Rein Co R 293,540 448,091 1,545,944 1,401,055 20.95% 2,475,797 2,182,257 2,917,147State Farm Lloyds HO 289,788 153,247 587,203 82,740 350.24% 244,049 -45,739 691,056Fremont Ind Co * WC 280,121 370,589 -290,610 36,904 759.06% Inactive Inactive 1,168,633Commerce & Industry Ins Co 266,080 307,213 962,877 976,982 27.23% 1,796,369 1,530,289 1,441,532Gerling Global Reins Corp Of Ameri WC, R 248,794 355,710 288,507 522,707 47.60% 449,507 200,713 Yes 1,142,070Phoenix Ins Co ASB 243,712 232,584 771,327 818,785 29.77% 556,071 312,359 1,728,614Standard Fire Ins Co ASB 236,190 225,405 741,652 854,883 27.63% 538,276 302,086 1,675,300Mid-Century Ins Co EQ 231,998 429,601 513,595 508,877 45.59% 1,215,809 983,811 1,107,779St Paul Fire & Marine Ins Co MM 226,942 969,372 4,925,779 4,142,586 5.48% 2,703,818 2,476,876 Yes 9,399,286Farmers Ins Exch HO 214,093 60,848 2,045,064 1,969,553 10.87% 1,434,205 1,220,112 2,953,363Factory Mut Ins Co A&E 207,818 37,952 1,933,030 1,781,683 11.66% 719,544 511,726 1,264,879
18,437,909 21,742,948 75,640,557 77,404,101Industry Totals 23,046,147 32,185,730 378,474,577 378,531,136
Lines of Business: R WCSS HO
* latest available statement 2002 D&O EQ* * latest available statement 2006 ASB MM
A&E OTLB
Appendix 1

20
Appendix 2
Group A
This group had five companies on the original list of 30. They are part of an intercompany pool.
After 2002, the group also acquired one of the first three companies discussed in the section
above. While none of the companies would have been insolvent, four subsequently have
experienced adverse development of 35 percent to 55 percent of their 2002 surplus and likely
would have been in some RBC action category. The fifth company, also acquired after 2002, has
experienced adverse development of less than 20 percent of its 2002 surplus and would not have
been in an RBC action level. Since 2005, they all have experienced favorable development, and
all have RBCs in the 500 percent to 600 percent range or higher. Their SAOs have had
affirmative RMAD statements from 2001 forward, except the fifth company, which had one with
extensive discussions of risk factors. These companies have grown in premium volume and
surplus and have generally experienced positive net income. All have had positive underwriting
income since 2006. All of the companies listed A&E as the primary source of their adverse
development.
Group B
In this group of three companies, two fall into one subgroup and the third stands on its own. The
subgroup with two companies has had the same actuary throughout our review period. There was
no mention of an RMAD prior to 2004, and, since then, the actuary has stated that there is no
RMAD, using a materiality standard of 25 percent of surplus. The discussion of risks offers little
beyond the basic required information. The companies have experienced underwriting losses
most years and persistent adverse development. One company would have been insolvent and the
other would have been in an RBC action level had they initially booked the full amount of their
subsequent development.
The third company had three different actuaries over this time span. The company generally has
suffered underwriting losses and would have been insolvent in 2001, based on the subsequent
loss reserve development of more than 200 percent of surplus. There is no mention of an RMAD
prior to the 2004 requirement, and, since then, the actuaries have said there is no RMAD using a
materiality standard of 10 percent of surplus. There was a reasonable discussion of risks in the

21
2001 SAO, but, beginning in 2002, the SAO was less robust, and it has weakened over time. The
2008 opinion had a much more thorough discussion of risks than its predecessor. The company’s
RBC has been below 400 percent throughout our review period.
Group C
This is another group that includes a reinsurer and three primary companies. The reinsurer has
had two SAO signers. Based on the development to date, all three primary companies would
have been insolvent in 2001, and the reinsurer would have been in an RBC action level. All of
the primary companies have had affirmative RMAD statements throughout the review period,
but the discussion of risks has been brief. The reinsurer has had an affirmative RMAD since
2003. The materiality threshold has been 20 percent of surplus for the primary companies and 25
percent for the reinsurer. The companies write mainly liability lines and have experienced both
premium and surplus growth. Their results have been more stable since 2005.
Group D
The final group consists of a primary company and a large reinsurer. The primary insurer is a
large insurer, and its inclusion on the list was attributed to the assumption of a stop-loss contract
from affiliates. The company has never had an affirmative RMAD statement, and its RBC has
never been below 400 percent. Since 2002, its development has been less than 15 percent of the
2002 surplus. The reinsurer fell into an RBC action level in 2001 and stayed there through 2003.
The company’s subsequent development on the 2001 and 2002 reserves has been favorable, but
that has been distorted by a reinsurance agreement that ceded approximately half of its reserves.
Otherwise, it would have experienced additional adverse development. The SAO did not address
the cession. The reinsurer has had an affirmative RMAD each year based on a 5 percent of
surplus standard. This RMAD might not provide meaningful information for a large reinsurer for
which a 5 percent swing would likely be within a reasonable range of results.
Others
The final three companies include two large insurers and one large reinsurer. The first large
insurer is a subsidiary of a large group that writes mainly commercial lines business. The SAO
included a reasonable discussion of risk factors, but did not have an affirmative RMAD

22
statement until 2004. The 2001 runoff would have placed the company at an RBC action level,
while the 2002 runoff would have been close to the action-level threshold. It is possible that the
parent company would have intervened, as the group is rated A++ by A.M. Best. Development
since 2005 has been favorable. A&E reserves were identified as a significant contributor to its
adverse development. Since 2002, the company’s surplus has nearly tripled, and its RBC is now
at 500 percent.
The other large primary insurer is also a subsidiary of a larger group. The company’s RBC never
slipped below 300 percent and the runoff of the 2002 reserves has been a comparatively modest
12 percent of surplus. The company did not have an RMAD statement prior to 2004, and, since
2004, it has stated that there was not an RMAD based on a materiality threshold of 3 percent to 5
percent of surplus. The company’s runoff would not indicate it would ever have been impaired or
in an RBC action level. A&E is cited as a major contributor to its adverse development in 2002.
The company has experienced small favorable development each year since 2004.
The final company is a large reinsurer that had the largest adverse development during 2002 on
the 2001 reserves. That development put it at an RBC action level from which it recovered
slowly over the next two years. It then appears that the company entered some sort of
reinsurance agreement that increased its RBC to over 400 percent, where it remains today.
23
Top 30 Groups in 2008 One-Year Development
Financial Data
Group Rank
Type of Company Type of Insurance 2008 Surplus 2007 Surplus
Change in Surplus 2008 Reserves 2008 Net EP 1 Year Dev. 2 Year Dev.
Dev / PHS (%)
2 Yr Dev / PHS (%)
2007 Top 30?
1 Stock Co. Comm'l Financial (2,399,692) 191,983 -1349.9% 4,849,700 279,669 9,773,694 7,697,315 5090.9 3718.3 Y2 Stock Co. Comm'l Financial 1,052,029 2,059,490 -48.9% 1,677,835 587,995 1,148,404 6,772 55.8 35.1 N3 Stock Co. Comm'l Financial 3,502,422 3,663,052 -4.4% 1,870,697 906,920 852,412 42,161 23.3 1.0 Y4 Mutual Co. Personal Lines 53,170,815 63,618,527 -16.4% 30,191,934 48,122,449 404,733 865,724 0.6 1.5 N5 Stock Co. Comm'l Financial 1,674,280 1,372,632 22.0% 6,622,520 1,410,839 362,929 413,875 26.4 25.4 Y6 Stock Co. Comm'l Financial 464,833 358,386 29.7% 1,213,126 753,810 245,513 23,517 68.5 7.7 N7 Stock Co. Personal Lines 13,155,649 18,162,769 -27.6% 16,155,051 26,091,182 235,304 42,922 1.3 0.2 N8 Mutual Co. Comm'l Casualty 37,542 30,063 23,137 219,069 205,401 N9 Stock Co. Multi-National Ins 3,902,746 3,784,206 3.1% 7,147,720 5,334,079 163,741 230,381 4.3 6.1 Y
10 Stock Co. Reinsurer 2,216,212 2,976,238 -25.5% 4,991,516 2,624,415 153,091 188,270 5.1 5.8 N11 Stock Co. Mortgage Ins 568,019 781,863 -27.4% 2,141,826 774,542 136,788 198,801 17.5 24.3 Y12 Stock Co. Comm'l 13,139,645 13,598,709 -3.4% 13,051,442 15,611,576 135,807 207,758 1.0 1.6 N13 Mutual Co. Large Multi-Line 261,859 250,372 4.6% 321,468 366,311 117,389 130,462 46.9 51.0 Y14 Stock Co. Comm'l Financial 1,555,606 3,316,986 -53.1% 1,160,538 1,081,725 112,263 (9,690) 3.4 -0.3 N15 Stock Co. Reinsurer 2,363,243 2,906,656 -18.7% 4,442,801 1,139,873 111,557 333,534 3.8 12.2 Y16 Stock Co. Reinsurer 6,038,001 7,198,288 -16.1% 10,536,400 2,222,225 91,395 711,515 1.3 9.2 Y17 Stock Co. Personal Lines 1,374,267 1,724,921 -20.3% 1,128,072 2,786,826 85,887 77,004 5.0 4.9 N18 Stock Co. Comm'l Financial (2,618,757) 66,093 -4062.2% 431,322 22,373 83,307 - 126.0 0.0 N19 Stock Co. Comm'l Financial 552,744 1,275,201 -56.7% 3,011,535 1,058,882 81,819 71,627 6.4 3.9 Y20 Stock Co. Med Mal 64,286 261,607 -75.4% 640,215 129,370 73,294 85,851 28.0 66.8 N21 Stock Co. Multi-Line 332,140 446,053 -25.5% 1,096,303 (1,718) 69,069 385,501 15.5 153.0 Y22 Stock Co. Comm'l Property 66,722 71,734 -7.0% 203,802 154,915 56,623 91,841 78.9 102.5 Y23 Stock Co. Personal Lines 55,547 100,203 -44.6% 281,413 337,171 37,922 105,660 37.8 2.8 Y24 Stock Co. Personal Lines 4,471,123 4,589,414 -2.6% 5,932,937 13,632,696 29,614 137,742 0.6 -45.8 Y25 Stock Co. Runoff (83,009) (53,707) 54.6% 253,790 (1,840) 28,797 22,372 -53.6 21.8 N26 Stock Co. Comm'l Liability 530,907 462,951 14.7% 1,216,288 297,300 24,939 90,550 5.4 5.8 N27 Stock Co. Comm'l 350,043 371,976 -5.9% 771,453 425,269 23,887 19,402 6.4 1.7 N28 Rec. Exch. Comm'l Property 231,506 198,320 16.7% 258,603 552,226 23,265 2,007 11.7 9.8 N29 Stock Co. Comm'l Property 465,106 530,510 -12.3% 445,695 299,798 22,830 57,171 4.3 40.2 N30 Stock Co. Runoff 61,863 84,441 -26.7% 272,253 (10) 22,412 38,838 26.5 NA N
Subtotal 106,495,834 134,285,435 -20.7% 122,076,064 127,024,017 14,905,342 12,435,446 11.1
Industry Wide 462,571,269 530,829,829 -12.9% 567,037,874 443,477,108 (1,807,543) (9,034,040) -0.3
Appendix 3


