DRAFT, 10-15-06 DO NOT CIRCULATE OR CITE A Comparison of Non-Traditional vs. Traditional Measures of Success for Underrepresented Minority Students Samuel J. Agronow, Ph.D., Coordinator Admissions Research and Evaluation, Student Affairs University of California, Office of the President This paper follows up on research conducted by Agronow, Freelon, and Levitan (2005) while at UC Berkeley and some additional work by Agronow (2005) using UC systemwide data. These two studies focused on a comparison of “traditional” academic outcomes (e.g., grades, persistence, graduation) versus non-traditional outcomes (e.g., leadership in college, academic engagement, civic engagement, career plans). While neither study specifically examined how ethnic groups fared on these measures, they did examine some proxies for ethnicity, specifically success of Eligibility in Local Context (ELC) students from low Academic Performance Index (API) high schools and success of students admitted to Berkeley via the “Augmented Review” process. The results of these analyses would lead one to believe that underrepresented ethnic minorities would fare well on some of the non-traditional measures while faring less well on traditional academic outcomes. The research model in Agronow, Freelon, and Levitan (2005) encompassed a broad definition of success, examining more than traditional outcomes in a cohort of Berkeley students that first enrolled as freshmen in 1999-00. Most prediction studies focus on college GPA, persistence, and graduation rates. In defining success, this study also included grades in different academic disciplines, measures of student leadership in campus life, selected responses from student surveys, including academic engagement and other engagement measures from the University of California Undergraduate Experience Survey (UCUES), and data on employment and career plans from the campus’s Career Center exit survey. The 1999-00 Berkeley cohort study also included a wide variety of predictors. Traditional inputs used to predict college outcomes are typically tied directly to a student’s academic performance in high school. These measures include high school GPA, class rank in high school, and SAT scores. However, consistent with UC Berkeley’s “comprehensive review” of applications, other, less quantifiable, measures of student achievement considered in the admission process may also prove to be important predictors of success. In the comprehensive review process, admissions officers evaluate a student’s grades and test scores in the context of their school environment, home life, extra-curricular activities, work, and other key information gleaned from the student’s application. This study was able to employ such qualitative data about freshmen designated as Previously Unrecorded Variables – PUVs. PUVs were originally developed for a separate study evaluating equity in Berkeley’s admission process, conducted on a sample of Berkeley’s fall 2004-05 freshman applicants (Hout, 2005). The variables coded for both the 1999-00 and 2004- 05 studies include participation and/or leadership in extra-curricular activities, the degree to which students have overcome obstacles to academic achievement, and summary judgments about whether the student made contributions to their school or community and/or is likely to make significant contributions to campus life (see Appendix A). A model Agronow, et al. used to explain the relationships of PUVs to academics in high school, academic engagement in college, academics in college, and success in career/community was: 1
Transcript
DRAFT, 10-15-06 DO NOT CIRCULATE OR CITE
A Comparison of Non-Traditional vs. Traditional Measures of Success for Underrepresented Minority Students
Samuel J. Agronow, Ph.D., Coordinator
Admissions Research and Evaluation, Student Affairs University of California, Office of the President
This paper follows up on research conducted by Agronow, Freelon, and Levitan (2005) while at UC Berkeley and some additional work by Agronow (2005) using UC systemwide data. These two studies focused on a comparison of “traditional” academic outcomes (e.g., grades, persistence, graduation) versus non-traditional outcomes (e.g., leadership in college, academic engagement, civic engagement, career plans). While neither study specifically examined how ethnic groups fared on these measures, they did examine some proxies for ethnicity, specifically success of Eligibility in Local Context (ELC) students from low Academic Performance Index (API) high schools and success of students admitted to Berkeley via the “Augmented Review” process. The results of these analyses would lead one to believe that underrepresented ethnic minorities would fare well on some of the non-traditional measures while faring less well on traditional academic outcomes. The research model in Agronow, Freelon, and Levitan (2005) encompassed a broad definition of success, examining more than traditional outcomes in a cohort of Berkeley students that first enrolled as freshmen in 1999-00. Most prediction studies focus on college GPA, persistence, and graduation rates. In defining success, this study also included grades in different academic disciplines, measures of student leadership in campus life, selected responses from student surveys, including academic engagement and other engagement measures from the University of California Undergraduate Experience Survey (UCUES), and data on employment and career plans from the campus’s Career Center exit survey. The 1999-00 Berkeley cohort study also included a wide variety of predictors. Traditional inputs used to predict college outcomes are typically tied directly to a student’s academic performance in high school. These measures include high school GPA, class rank in high school, and SAT scores. However, consistent with UC Berkeley’s “comprehensive review” of applications, other, less quantifiable, measures of student achievement considered in the admission process may also prove to be important predictors of success. In the comprehensive review process, admissions officers evaluate a student’s grades and test scores in the context of their school environment, home life, extra-curricular activities, work, and other key information gleaned from the student’s application. This study was able to employ such qualitative data about freshmen designated as Previously Unrecorded Variables – PUVs. PUVs were originally developed for a separate study evaluating equity in Berkeley’s admission process, conducted on a sample of Berkeley’s fall 2004-05 freshman applicants (Hout, 2005). The variables coded for both the 1999-00 and 2004-05 studies include participation and/or leadership in extra-curricular activities, the degree to which students have overcome obstacles to academic achievement, and summary judgments about whether the student made contributions to their school or community and/or is likely to make significant contributions to campus life (see Appendix A). A model Agronow, et al. used to explain the relationships of PUVs to academics in high school, academic engagement in college, academics in college, and success in career/community was:
1
DRAFT, 10-15-06 DO NOT CIRCULATE OR CITE
PUVs -Spark –or- Obstacles
The researchers tested this model in a variety of ways. Two are shown in Figure 1 and Figure2 below:
FIGURE 1 Path Coefficients Predicting GPA at Graduation and Seeking Advanced Degree from PUV Obstacles to Achievement Prior to Enrollment and High School GPA
via Course Disengagement in College
Bolded coefficients are statistically significant at p <.05 Italicized coefficient is near significance at p <.07
FIGURE 2
Path Coefficients Participation in College Leadership and Seeking Advanced Degree from PUV High School Activities/Leadership and High School GPA
via Community Service-Leadership in College
Bolded coefficients are statistically significant at p <.05 Italicized coefficient is near significance at p <.10
High School GPA (unweighted)
PUV –Obstacles ( - = More, + = Fewer)
Course Disengagement
GPA at Graduation
Seek Advanced Degree -.032
+.244
-.082
-.192 -.213
-.072
+.057
-.020
+.061+.159
High School GPA (unweighted)
PUV-Activities-Leadership ( - = More Lead, + = Less Lead)
Community Service- Leadership
Participation in College Leadership Activities
Seek Advanced Degree
-.279
+.022
-.151
+.034 +.733
+.066
+.006
-.020
+.018-.054
Academic Success in High School
Engagement in College UCUES Academic Success
in College
Success in Career/Community
2
DRAFT, 10-15-06 DO NOT CIRCULATE OR CITE
The researchers concluded that the previously unrecorded variables (PUVs) Berkeley uses in its admission process did add a little to the prediction of traditional outcomes (e.g., GPA at graduation), and some non-traditional outcomes (e.g, campus leadership). But they appear to play a bigger role in predicting measures of "engagement" or “disengagement" in college. These engagement factors, in turn, add to the prediction of both traditional outcomes (e.g., GPA) and non-traditional outcomes (e.g., campus leadership, seeking an advanced degree after college). This suggests that circumstances in high school (e.g., obstacles to achievement) that these PUVs measure do not preordain a particular outcome in college, but rather can affect that outcome through student choices made while in college. It is possible that both faculty and student affairs professionals could influence these relationships by focusing on the circumstances by which students engage or disengage in academic and co-curricular activities. Not examined in these “path analyses” were results pertaining specifically for underrepresented minorities. However, in an addendum to Agronow, et al, reported by Flacks, Castillo, Agronow, and Brown (2005), students admitted to Berkeley via “augmented review” scored much higher on UCUES measures of engagement than students admitted through the regular process. “Augmented Review” admits, limited to about 6% of Berkeley’s admit pool, are students who have a characteristics that would suggest they would be successful at Berkeley even if they score lower on high school academic indicators than regular campus admits. Underrepresented students comprise a higher than average percentage of Augmented Review admits. Another relevant finding reported in Flacks, et al. using UC Santa Barbara data, students who scored high on faculty interaction tended to come from the lowest and highest quartiles of high school academic achievement. Again, ethnicity was not specifically examined in these analyses. In a study using UC systemwide data, Agronow (2005), examined traditional measures (GPAs) vs. non-traditional measures of “success” (UCUES factors) for students admitted as Eligible in the Local Context (ELC) from Low vs. High API schools. Agronow found that ELCs from low API schools did not have as high UC GPAs as those who were NOT ELC but were from high API or private schools. But with respect to course disengagement, a measure of “academic diligence,” students from low API high schools were more likely to disengage academically, but ELCs were less likely to disengage, regardless of API level. i.e., Academic diligence was high among ELCs, even those from low API schools. Since ELCs from low API schools will have a higher that average percentage of underrepresented minority students it would be useful to determine if similar findings would be observed for underrepresented students in general. RESEARCH MODEL:
In this analysis data from the two sources described above, Berkeley and UCOP, are reanalyzed specifically focusing on a comparison of four ethnic groups: African Americans, Chicano-Latinos, Asian Americans, and Whites.1 Moderator or control variables are used to refine the relationships between ethnic group and the non-traditional and traditional variables.
1 Another underrepresented group, American Indian/Alaskan Native was not included in these comparisons due to numbers that were too small for analysis.
3
DRAFT, 10-15-06 DO NOT CIRCULATE OR CITE
Berkeley 1999-00 Freshman Entrants Data Set: The Berkeley data set employed in the current analysis was collected on a cohort of freshmen first enrolling at Berkeley in Fall term 1999 or Spring term 2000. This 1999-00 data file contains many more admission input and outcome measures than is usual for studies of this type. In addition to the typical demographic variables, grades in high school and test scores, the file contains a number of other variables used in the Berkeley admission process. e.g. Percentile Ranks within High School (statistics akin to “class ranks”) on SAT, high school GPA, and courses taken; AP Test scores; a school’s Academic Performance Index (API); and factor scores from "Previously Unrecorded Variables" (PUVs) - qualitative data on the UC Admission application that is not typically quantified, including information from the admission essay, academic honors and awards, and work experience (see Appendix A and Appendix B). The outcome variables analyzed in the current analysis were UCB GPA after one year, UCB GPA at graduation (or last term attended), graduation in five years/retention in 6 years, percent of students failing at least one course, leadership - as measured by accepting responsibility for organizing campus student groups (from Berkeley’s Dean of Students data base), and a number of factor scores from the 2003 University of California Undergraduate Experience Survey (UCUES). The UCUES variables analyzed are factor scores measuring engagement in research/creative projects, academic/other skills developed in college, faculty engagement, course disengagement/academic diligence, community service/leadership, and career engagement/preparation, (see Appendix C for description of the UCUES items included in each of the factor scores). This cohort of freshmen completed UCUES in their fourth (senior) year. UCUES 2003 Systemwide Data Set: The UCUES data set employed in these analyses encompasses undergraduates enrolled on all UC campuses in Winter or Spring term 2003. Traditional admission input variables, demographic variables, Eligible in Local Context (ELC) status, grades in high school or community college, test scores, and high school characteristics are available for all students in this file regardless of whether they responded to UCUES. UCUES was administered in Winter/Spring term 2003 to random samples of 2,000 students from each of the eight UC undergraduate campuses. Of this sample of 16,000, 6,658 or 42% participated. Individual campus response rates ranged from 32% to 54%. The UCUES variables employed in the analyses are, as in the Berkeley file, factor scores measuring engagement in research/creative projects, academic/other skills developed in college, faculty engagement, course disengagement/academic diligence, community service/leadership, and career engagement/preparation (see Appendix C). UC GPA in UC college courses collected at the time of the survey administration is utilized as a “traditional” outcome measure. To be more comparable with the analyses reported from the Berkeley data set, analyses from this UCOP data set are restricted to those entering UC originally as freshmen.
4
DRAFT, 10-15-06 DO NOT CIRCULATE OR CITE
RESULTS: Table 1 shows results utilizing the UCUES 2003 systemwide data file, providing UC GPA and UCUES factor scores (multiplied by 100) by four ethnic groups for freshman entrants into the UC system. Table 2a and 2b provide similar information for the 1999-00 cohort of Berkeley freshman entrants. In addition, Tables 2a/b show additional outcomes regarding GPA, graduation, and leadership from Berkeley’s Dean of Students data base, for all freshmen regardless of whether they responded to UCUES. Table 2b provides results only for those 1999-00 freshmen who completed UCUES in Spring term 2003. The academic characteristics of UCUES respondents are better than those of the total class shown in Table 2a partly because these students, completing UCUES, have survived into their senior year and perhaps, are a little more “engaged” in their education. Notably the “gap” between underrepresented minorities (African Americans and Chicano/Latinos) and Whites and Asians is reduced on the academic measures for those completing the survey. The tables show, as expected, that underrepresented students score lower on traditional measures than whites or Asians. However, underrepresented students in both the UC and the Berkeley data sets score higher than whites or Asians on UCUES measures of academic/other skills development (including critical thinking, written, oral presentation, and interpersonal skills), and community service/leadership. Differences in “leadership” for African Americans are especially notable in the Berkeley data base, where according to Berkeley’s Dean of Student records, a significantly higher percentage of African Americans accepted responsibility for organizing student groups. On the other hand, underrepresented students score consistently lower than whites and Asians on career engagement and preparation.
Table 1 UC GPA and UCUES Factor Scores by Ethnic Group
UCUES MEAN Factor Scores x 100: + = Above Average; 0 = Average; - = Below Average
African American
Chicano-Latino Asian White
Stat. Sig.
Number of Freshman Entrants in Winter/Spring 2003 298 1,426 4,089 4,002
Number in Responding to UCUES 92 541 1,850 1,773
Response Rate 30.9% 37.9% 45.2% 44.3%
Mean UC GPA in Winter-Spring Term 2003 (ALL) 2.79 2.80 2.94 3.11 p < .001
Mean UC GPA in Winter/Spring Term 2003 (UCUES Respondents ONLY)
2.90 2.87 3.01 3.19 p < .001
UCUES Factor: Mean Engagement in Research/Creative Projects
13 1 6 -9 p < .001
UCUES Factor: Mean Academic/Other Skills Developed in College
19 19 -8 7 p < .001
UCUES Factor: Mean Faculty Engagement 5 -7 -25 8 p < .001
UCUES Factor : Mean Course Disengagement-Academic Diligence
12 7 11 -3 p < .001
UCUES Factor: Mean Community Service/Leadership 38 15 0 -8 p < .001 UCUES Factor: Mean Career Engagement/Preparation -6 -16 3 2 p < .001
5
DRAFT, 10-15-06 DO NOT CIRCULATE OR CITE
Table 2a UC Berkeley GPAs, Graduation, and Leadership by Ethnic Group
1999-00 Berkeley Freshman Entrants (All)
All UC Berkeley Freshman Entrants Ethnic Group
Factor African
American Chicano-
Latino Asian White Stat. Sig.
Number of Freshman Entrants in 1999-00 Cohort 141 406 2,038 1,379 Mean UC GPA after 1 Year (ALL Freshmen) 2.79 2.91 3.12 3.24 p < .001 Mean UC GPA at Graduation or latest (ALL Freshmen) 2.89 3.08 3.21 3.33 p < .001
Percent Failing at Least One Berkeley Course (All) 66.7% 51.0% 34.4% 29.2% p < .001
Percent Graduating in Five Years or Still Enrolled (All) 72.3% 75.6% 89.7% 86.2% p < .001 Percent Accepting Responsibility for Organizing Student Groups - Dean of Student’s Data Base (All) 37.6% 26.6% 26.9% 23.8% p < .004
Table 2b UC Berkeley GPAs, Graduation, Leadership, and UCUES Factor Scores by Ethnic Group
1999-00 Berkeley Freshman Entrants who Completed UCUES in 2003 (Senior Year)
UC Berkeley Freshman Entrants Completing UCUES Ethnic Group
UCUES MEAN Factor Scores x 100: + = Above Average; 0 = Average; - = Below Average
African American
Chicano-Latino Asian White
Stat. Sig.
Number of Freshman Entrants in 1999-00 Cohort 141 406 2,038 1,379 Number in Responding to UCUES in 2003 29 121 760 510 Response Rate 20.6% 29.8% 37.3% 37.0% Mean UC GPA after 1 Year (UCUES Respondents) 2.82 3.02 3.18 3.28 p< .001 Mean UC GPA at Graduation or latest (UCUES Respondents) 2.98 3.15 3.28 3.39 p< .001
Percent Failing at Least One Berkeley Course (UCUES respondents)) 69.0% 45.5% 28.3% 25.1% p< .001
Percent Graduating in Five Years or Still Enrolled (UCUES Respondents) 96.6% 90.1% 96.6% 95.3% p< .014
Percent Accepting Responsibility for Organizing Student Groups - Dean of Student’s Data Base (UCUES Respondents))
51.7% 31.4% 29.3% 26.9% p< .032
UCUES Factor: Mean Engagement in Research/Creative Projects
-42 10 -2 -2 Not Sig.
UCUES Factor: Mean Academic/Other Skills Developed in College
UCUES Factor : Mean Course Disengagement-Academic Diligence
27 7 8 -10 p< .007
UCUES Factor: Mean Community Service/Leadership 79 -8 9 -14 p< .001 UCUES Factor: Mean Career Engagement/Preparation -26 -24 14 -12 p< .001
6
DRAFT, 10-15-06 DO NOT CIRCULATE OR CITE
There are some other ethnic differences in Tables 1 and 2a/b of interest. For example, Asians score lower than other groups on faculty engagement while African Americans score the highest. African Americans and Asians score highest on course disengagement (skipping class, not completing assignments, etc., see Appendix C), while whites score the lowest (i.e., report they are more likely to come to class or complete assignments). It is possible that these findings might be explained by other variables, like academic success. Tables 3 and 4 examine the data by weighted/capped high school GPA in the 2003 systemwide data base. Students in the top third of high school GPA distribution also have the highest UC GPAs (Table 3). Moreover, the mean UC GPA for underrepresented students is closer to that of whites and Asians. Of special interest, however, are differences among ethnic groups in a UCUES factor not observed in Tables 1 and 2a/b. Specifically, engagement in research/creative projects is higher for underrepresented students than for Asians or whites. Table 4 shows data for the lowest third of enrolled students on weighted/capped high school GPA. Underrepresented students have lower UC GPAs than whites and Asians, but still report higher scores on skills developed while in college and higher scores in leadership/community service than whites or Asians. Also differences among the four ethnic groups on course disengagement and career preparation are no longer statistically significant.
Table 3 UC GPA and UCUES Factor Scores by Ethnic Group
Winter/Spring 2003 Enrolled Systemwide (Freshman Entrants) TOP Third of Enrolled Freshmen on Weighted/Capped High School GPA (3.91 or Higher)
All UC Freshman Entrants
Ethnic Group UCUES MEAN Factor Scores x 100: + = Above Average; 0 = Average; - = Below Average
African American
Chicano-Latino Asian White
Stat. Sig.
Number of Freshman Entrants in Winter/Spring 2003 46 330 1,364 1,521
Number in Responding to UCUES 16 135 691 754
Response Rate 34.8% 40.9% 50.7% 49.6%
Mean UC GPA in Winter-Spring Term 2003 (ALL) 3.10 3.02 3.20 3.30 p < .001
Mean UC GPA in Winter/Spring Term 2003 (UCUES Respondents ONLY)
3.23 3.07 3.23 3.35 p < .001
UCUES Factor: Mean Engagement in Research/Creative Projects
30 18 13 -5 p < .002
UCUES Factor: Mean Academic/Other Skills Developed in College
-7 16 -14 0 p < .002
UCUES Factor: Mean Faculty Engagement 15 -8 -33 3 p < .001
UCUES Factor : Mean Course Disengagement-Academic Diligence
26 -5 -4 -18 p < .021
UCUES Factor: Mean Community Service/Leadership 107 22 10 -2 p < .016 UCUES Factor: Mean Career Engagement/Preparation -8 -15 15 9 p < .001
7
DRAFT, 10-15-06 DO NOT CIRCULATE OR CITE
Table 4 UC GPA and UCUES Factor Scores by Ethnic Group
Winter/Spring 2003 Enrolled Systemwide (Freshman Entrants) BOTTOM Third of Enrolled Freshmen on Weighted/Capped High School GPA (3.54 or Less)
All UC Freshman Entrants Ethnic Group
UCUES MEAN Factor Scores x 100: + = Above Average; 0 = Average; - = Below Average
African American
Chicano-Latino Asian White
Stat. Sig.
Number of Freshman Entrants in Winter/Spring 2003 298 1,426 4,089 4,002
Number in Responding to UCUES 92 541 1,850 1,773
Response Rate 30.9% 37.9% 45.2% 44.3%
Mean UC GPA in Winter-Spring Term 2003 (ALL) 2.79 2.80 2.94 3.11 p < .001
Mean UC GPA in Winter/Spring Term 2003 (UCUES Respondents ONLY)
2.90 2.87 3.01 3.19 p < .001
UCUES Factor: Mean Engagement in Research/Creative Projects
13 1 6 -9 p < .012
UCUES Factor: Mean Academic/Other Skills Developed in College
19 19 -8 7 p < .002
UCUES Factor: Mean Faculty Engagement 5 -7 -25 8 p < .001
UCUES Factor : Mean Course Disengagement-Academic Diligence
12 7 11 -3 Not Sig.
UCUES Factor: Mean Community Service/Leadership 38 15 0 -8 p < .001 UCUES Factor: Mean Career Engagement/Preparation -6 -16 3 2 Not Sig.
One question that may be asked from the data reported above is why underrepresented groups report greater skill development and greater leadership than other groups? The Previously Unrecorded Variables (PUVs) in the Berkeley data set, collected from the undergraduate admission application, can be used to help answer this question. Table 5 shows that African Americans and Chicano/Latinos have higher scores on the PUV factor “obstacles” to success than Asians or whites. This finding is consistent with a greater percentage of these underrepresented groups coming from low income and/or first generation college families, and having lower high school GPAs and SAT scores. In contrast, African Americans and Chicano/Latinos are also rated higher than Asians and whites on the PUV factor of “spark, spunk, passion, maturity, and likeliness to contribute to the campus community.” Surprisingly, underrepresented students have LOWER scores on participation/leadership in extracurricular activities compared to whites, and, especially, to Asians. This score, however, may reflect “participation” more than it does “leadership”. Those with “obstacles” may be less likely to the have time or the interest to engage in a large number of activities while in high school.
8
DRAFT, 10-15-06 DO NOT CIRCULATE OR CITE
Table 5 Factor Scores on Previously Unrecorded Variables (PUVs) and Other Measures on Collected on
UC Application for Admission by Ethnic Group 1999-00 Berkeley Freshman Entrants (All)
UC Berkeley Freshman Entrants Completing UCUES
Ethnic Group PUV MEAN Factor Scores x 100: + = Above Average; 0 = Average; - = Below Average
African American
Chicano-Latino Asian White
Stat. Sig.
Number of Freshman Entrants in 1999-00 Cohort 141 406 2,038 1,379 PUV Factor: Spark, Spunk, Passion, Maturity, Likely to Contribute to Campus Life
17 12 -6 1 p< .001
PUV Factor: Participation or Leadership in Activities -12 -12 5 -3 p< .003
PUV Factor : Have significant personal, social, family obstacles that can affect academic success
62 51 4 -23 p< .001
PUV Factor: Other academic achievements -5 25 -7 -2 p< .001 Percent First Generation College Students 58.4% 37.2% 24.8% 13.5% p < .001 Percent Under $30,000 Parent Income 35.2% 40.9% 26.1% 10.6% p < .001 Mean Weighted-Capped High School GPA 3.64 3.96 4.22 4.12 p < .001 Mean Unweighted High School GPA 3.34 3.59 3.77 3.70 p < .001
Mean SAT I Total Score 1066 1157 1323 1319 p< .001
Mean SAT II Writing Score 533 573 636 656 p< .001
Table 6 provides data that show which factors, including the PUVs, predict skills development in college by ethnic group. Due to small numbers, African Americans are combined with Chicano/Latinos in this analysis. Prediction of skills development is better for African American-Chicano/Latinos than for Asians or whites. Also the PUVs, especially achievement (other), are more important in the prediction, even after all of the standard academic and demographic factors are added into the regression model. It appears, for African Americans-Chicano/Latinos, that those with fewer academic honors/activities in high school report greater development of academic (writing, oral presentation, critical thinking) and interpersonal skills while enrolled at UC. This relationship is observed for whites to a much lesser extent, and not at all for Asians. Unweighted GPA and API are statistically significant positive predictors of skills development for African Americans-Chicano/Latinos, but not for Asians or whites. SAT II writing and SAT II math are positive predictors of skills development for Asians, while the SAT II writing and SAT II third tests are positive predictor for whites. Table 7 shows which factors, including the PUVs, predict responsibility for organizing student groups. This is a measure taken from the records of Berkeley’s Dean of Students Office, which can serve as a proxy for “leadership”. As above, prediction of this outcome measure is better for African Americans-Chicano/Latinos than for Asians or for whites. Also, the PUVs add more to the prediction for African Americans-Chicano/Latinos than for Asians or whites, with the activities/leadership PUV predicting the best among the four PUVs. The PUV measuring spunk-spark-maturity also adds to the prediction in the positive direction for Asians and is near statistical significance for African Americans-Chicano/Latinos. Some academic measures, e.g., unweighted high school GPA, are positive predictors in the regression model for African Americans-Chicano/Latinos, but not for Asians nor for whites.
9
DRAFT, 10-15-06 DO NOT CIRCULATE OR CITE Table 6
Regressions Predicting UCUES Factor: Skill Development in College by Ethnic Group 1999-00 Berkeley Freshman Entrants Responding to UCUES
Ethnic Group Afr Amer. + Chicano/Latino Asian White
Unweighted High School GPA .313 .090 0.30 0.001 .411 .067 0.22 0.000 .467 .065 0.30 0.000
SAT I Total .000 .000 0.08 0.634 .000 .000 0.08 0.189 .000 .000 -0.03 0.629
SAT II Writing Score .001 .001 0.22 0.079 .001 .000 0.13 0.016 .000 .000 0.09 0.095
SAT II Math Score .000 .001 -0.04 0.772 .000 .000 0.02 0.671 .000 .000 -0.01 0.794
Third SAT II Achievement Test .000 .000 -0.02 0.813 .000 .000 0.05 0.222 .000 .000 0.04 0.427
Number of Semesters of A-F Courses .001 .005 0.01 0.902 -.003 .002 -0.05 0.159 .006 .002 0.12 0.003
Number of Semesters of AP/Honors Courses -.002 .004 -0.04 0.600 -.002 .002 -0.04 0.279 -.004 .002 -0.09 0.052
Number of AP Test Scores of "5" .080 .045 0.15 0.081 .049 .010 0.19 0.000 .061 .011 0.25 0.000
Is in College of Letters and Science? .284 .103 0.25 0.007 .078 .047 0.08 0.100 .207 .051 0.21 0.000
Is in College of Engineering? .418 .166 0.23 0.013 -.124 .058 -0.11 0.033 .014 .065 0.01 0.834
12
DRAFT, 10-15-06 DO NOT CIRCULATE OR CITE
Figure 1 shows that “obstacles” to success present at the time of admission predicts (lack of) success in college, IF students fail to engage academically. Table 8 examines the relationship of the PUV obstacles and UCUES factor course disengagement on UC Berkeley GPA, to determine if there is a different pattern of relationships for African Americans-Chicano/Latinos. Table 8 shows that obstacles, in a negative sense, do indeed play a role in predicting latest term UC GPA, for African Americans-Chicano/Latinos and Asians, but not for whites. UCUES factor course disengagement is strongly associated with lower GPAs for all groups. In the regression model that contains the academic and demographic predictor variables, course disengagement along with unweighted high school GPA are the two most important factors regardless of ethnic group. However, API score is also a predictor for African Americans-Chicano/Latinos; while SAT II writing, number of AP tests with scores of “5”, and spark-spunk-maturity are predictors for Asians. Number of AP tests with scores of “5”, number of semesters of A-F courses, number of semesters of AP/honors courses, and the PUV achievements (other) are predictors for whites. Summary of Findings To summarize the major findings, underrepresented students (African Americans and Chicano-Latinos) do score higher on both skill development in college and college leadership measures than Asians or whites even though they score lower on traditional academic outcome measures (e.g. college GPA). African Americans and Chicano-Latinos scored consistently lower than Asians or whites on career engagement/preparation, but did not score consistently lower than other groups on course disengagement, an important measure of the more generalized “academic engagement”. Notably, African Americans and Chicano/Latinos in the top third of the UC freshman class based on high school GPA, report higher engagement in research and creative projects than Asians or whites. The higher scores on the UCUES skill development factor are related to higher GPAs in high school, but also are related to less academic achievements while there. Students with such a profile may be more motivated to “grow” academically now that they are in college. Activities/leadership in high school does predict leadership in college for African Americans-Chicano/Latinos and Asians, but not for whites. This finding occurs despite the fact that African Americans and Chicano/Latinos, in the Berkeley data file, scored lower on activities/leadership in high school than Asians or white. However, African Americans-Chicano/Latinos did have highest scores on the spunk-spark-maturity-passion-likely-to-contribute factor, which may explain this discrepancy. High school academic measures, e.g., high school GPA, are also important in predicting college leadership for African Americans-Chicano/Latinos. Finally, while personal, social, family obstacles to achievement in high school do result in lower academic outcomes (i.e., lower GPAs) in college, there is no evidence that these obstacles differentially affect African Americans-Chicano/Latinos and Asians compared with whites.
13
DRAFT, 10-15-06 DO NOT CIRCULATE OR CITE
Conclusions What emerges from these data is a picture of two underrepresented groups who “engage” at UC in key ways: improving their academic/interpersonal skills and becoming leaders, despite lower GPAs. Their academic profiles in high school were also lower than other ethnic groups, but they were assessed by UC admission evaluators with a greater “potential to contribute” in college. In addition, those in the top third of the UC class report higher levels of engagement in research and creative activities. While these “facts” stand by themselves, a better understanding of the meaning of these findings can be obtained with additional research in this area on both current and new data sets (see Caveat/Disclaimer). Caveat/Disclaimer Despite the availability of two data bases rich in nuanced variables, belief in the verity of the findings in this study would be increased if these analyses could be repeated on larger cohorts of students or with additional control variables. Some analyses, e.g., analyses by ELC or by API level, could not be performed due to small sample sizes when the data were also disaggregated by ethnicity. The “richness” of the datasets, especially UC Berkeley’s, also made it difficult to “choose” the variables to study. It is hoped that the analyses in this paper will encourage investment in building additional data sets with a wide variety of predictor and outcome measures similar to the ones used in this report. References: Agronow, S. J., Freelon, R., and Levitan, C. An admissions outcome study: a report of a work-
in-progress. Presentation made at the 45th Annual Forum of the Association for Institutional Research (AIR), May 29-30, 2005.
Agronow, S. J. Eligibility in the Local Context (ELC) as a Predictor of Engagement in College.
Paper prepared for the University of California Board of Admissions and Relations with Schools (BOARS), September 30, 2005.
Flacks, R., Castillo, S., Agronow, S. J., and Brown, M. UCUES and admissions. Paper prepared
for the University of California Board of Admissions and Relations with Schools (BOARS), July 18, 2005.
Hout, M. Berkeley’s Comprehensive Review Method for Making Freshman Admission
Decisions: An Assessment. Berkeley: University of California, Berkeley, http://www.berkeley.edu/news/media/releases/2005/05/16/houtreport.pdf, May 16, 2005.
CODING VARIABLES AND INSTRUCTIONS (Regular and AR) THE FOLLOWING INSTRUCTIONS WILL LEAD YOU THROUGH THE APPLICATION BY INDICATING THE VARIOUS ITEMS THAT HAVE BEEN SELECTED FOR CODING. THE INSTRUCTIONS LIST THE VARIABLE, THE RANGE OF RESPONSES, WHICH WILL BE REPRESENTED BY NUMERICAL VALUES, AND ON OCCASION A NON-EXHAUSTIVE LIST OF EXAMPLES DESCRIBING THE VARIABLE. THE VARIABLES TO BE CODED WILL APPEAR IN TRUNCATED FORM ON THE CODE SHEET AND PROCEED VERTICALLY AND THEN BY COLUMN. THEY WILL CORRESPOND NUMERICALLY WITH THIS INSTRUCTIONS SHEET. WRITING ON THE APPLICATIONS IS PERMISSIBLE. FOR ITEMS THAT ARE NOT APPLICABLE PLEASE USE “0.”
Educational History 1. FrstLang: Language learned first: 1=English only or 2=English and another language or 3= Another language
2. InstOthEng: Instruction in a language other than English: Indicate 1=Yes or 2=No
3. NumHSatnd: Number of high schools attended (do not include summer school): Tally and indicate the number
Major Awards and Activities PLEASE CONSIDER THE SIGNIFICANCE OF THE APPLICANT’S HONORS, ACTIVITIES, AND SERVICE. WHETHER AN HONOR, ACTIVITY OR SERVICE HAS MAJOR SIGNIFICANCE, IS THE DISTINGUISHING FEATURE. MAJOR AWARDS OR HONORS INCLUDE THOSE IN ACADEMIC, ATHLETIC, ARTISTIC, OR COMMUNITY SERVICE AREAS. 4. NumMajAwds: Number of major awards: Tally and indicate number
Examples of major awards include Bausch and Lomb, Renssalaer Scholarship, GOVERNOR’S SCHOLAR AWARD, Westinghouse Science Competition (finalist or semi-finalist), Golden State Exam (GSE High Honors only), Brown/Yale/Harvard Book Awards, Siemans Award, school district, county, state, national science fair awards, AP Scholar (two tests w/a score of at least 4 or any 3 credit bearing), etc. A major award may also include an MVP distinction, or other athletic, artistic or service awards that signify distinction beyond the school site such as at a district, regional, state or national level (e.g., award in FFA or JSA, etc.).
A MAJOR ACTIVITY IS AN ACADEMIC, ATHLETIC, ARTISTIC OR SERVICE ACTIVITY THAT MEETS ONE OR MORE OF THE FOLLOWING FOUR CRITERIA: a. Sustained participation (more than one year) in a major organization or group such as:
Academic examples include: Yearbook, school newspaper, literary magazine, Academic Decathlon, Science Olympiad, Brain Bowl, Math Competitions, Mock Trial, Speech and Debate, Model UN, National Forensics League (NFL), robotics club, published author, etc.
Other major activities include: Youth symphony (district, county, state, etc.), visual art exhibited in a juried show, participation in an adult artistic organization or endeavor (adult symphony, professional actor), etc.
b. Individual positions of significant responsibility such as: Founder or co-founder, President (or other student government officer), Editor, Board of Directors, Team Captain (including cheerleading), CEO, soloist, lead acting role, concertmaster, composer, producer, director, choreographer, section leader, District Board of Directors, School Site Council, city/county youth council, WASC Council, HOBY, Girls/Boys State, Teen hotline/crisis hotline, Mayor’s Youth Advisory Board, Youth Commissioner (to school, principal or beyond, e.g. city or county), Eagle Scout, TUTORING in an academic subject, internships (if high level of responsibility), etc.
15
DRAFT, 10-15-06 DO NOT CIRCULATE OR CITE
c. Sustained participation in less important organizations or groups that have achieved distinction or have competed beyond the school level such as a member of a regional or state championship team, etc.
d. Participation in less important organizations or groups (including school sports teams) in which the applicant has been a founder or leader, or achieved individual distinction such as an MVP award. For example, the following count as major activities only if the applicant exercises a leadership role or receives distinction: Young Entrepreneurs, FBLA, Future Farmers of America (FFA), 4-H, Distributive Education Clubs of America (DECA), Junior Statesmen of America (JSA), HOSA, ROTC, Kiwanis/Key Club, CSF, NHS, etc.
NOTE: Pop-culture and other social groups or organizations such as the anime club, hip hop club, pep club, chess club, etc. are NOT considered major activities EVEN IF the applicant holds a leadership position. But, if the applicant is a founder of such a club it may be considered a major activity.
5. NumMajActs: Number of major activities: Tally and indicate number 6. NumLeadActs: In activities tallied in #5 how many leadership roles did the applicant assume? Tally and indicate
number 7. ActsAca: Are any of the activities tallied in #5 academic? 1=Yes or 2=No 8. ActsArt: Are any of the activities tallied in #5 artistic? 1=Yes or 2=No 9. ActsAthl: Are any of the activities tallied in #5 athletic? 1=Yes or 2=No 10. ActsServ: Are any of the activities tallied in #5 community service? 1=Yes or 2=No 11. ActsLead: Did the applicant assume a leadership role in an activity not tallied in #5 above? 1=Yes or 2=No
Employment (paid work) IF THE APPLICANT DID NOT FILL OUT ITEM 115, ANSWER #12. YOU MAY LEAVE #13 BLANK OR
ENTER “00”.
IF THE APPLICANT WORKED OTHER THAN DURING THE SOPHOMORE OR JUNIOR SCHOOL YEAR REMEMBER TO ANSWER #14-17.
12. EmplSchlYr: Applicant is employed at least once during the sophomore or junior school year (if employed a
minimum of 12 weeks then assume it is employment during the academic year). 1=Yes or 2=No or 3=Can’t determine
13. EmpHrs: If Yes on #12, what is the maximum reported number of hours worked per week? Write the number.
14. EarnsnonDis: Applicant uses earnings for non-discretionary purposes: 1=Yes or 2=No or 3=Can’t determine
Non-discretionary purposes include earnings spent to help support family (including paying for personal items like gas, food, rent in order to reduce family financial hardship), paying for tests and applications, etc.
15. AcaPosition: Applicant holds a paid position with academic content: Indicate 1=Yes or 2=No or 3=Can’t determine
FOR QUESTIONS #16 AND #17, PLEASE CONSIDER THE STATURE OR NATURE OF THE PAID POSITION. POSITIONS SUCH AS LIFEGUARD, CAMP COUNSELOR, TEEN CRISIS HOTLINE STAFF, TUTOR, TEACHER, SUPERVISOR, TEAM LEADER, PROGRAMMER, CHILD CARE PROVIDER, COACH, LEAGUE REFEREE, TRANSLATOR, CEO, ETC. HAVE A HIGH LEVEL OF RESPONSIBILITY AND REQUIRE ADDITIONAL SKILLS, TALENT, TRAINING, AND/OR MATURITY. 16. RespPosition: Applicant holds a responsible position: Indicate 1=Yes or 2=No or 3=Can’t determine 17. SpecSkil: Applicant holds a position that requires special skill: 1=Yes or 2=No or 3=Can’t determine
16
DRAFT, 10-15-06 DO NOT CIRCULATE OR CITE
JUDGMENT 18. StrngPg8: Are items 112-115 considered to be strong overall, relative to the Berkeley applicant pool? Indicate
1=Yes or 2=No
A strong page 8 constitutes sustained participation in a number of activities with significant leadership and honors.
19. LightPg8: Are items 112-115 considered to be light overall, relative to the Berkeley applicant pool? Indicate 1=Yes or 2=No A light page 8 constitutes sparse or intermittent participation, generally without significant leadership or honors.
Personal Statement and Additional Documents PLEASE CONSIDER THE PERSONAL STATEMENT AND ANY OTHER DOCUMENTATION INCLUDED WITH THE APPLICATION. THEN CODE FOR THE FOLLOWING VARIABLES. The application for 1999-2000 gives the applicant three prompts. The applicant can choose one or combine the prompts in order to write a 2 page personal statement. Please indicate the prompt chosen by the applicant. 20. PrmptA: Did the applicant choose prompt A? Indicate 1=Yes or 2=No 21. PrmptB: Did the applicant choose prompt B? Indicate 1=Yes or 2=No 22. PrmptC: Did the applicant choose prompt C? Indicate 1=Yes or 2=No 23. EvidAchvmnt: Is there evidence of academic achievement not mentioned elsewhere in the application? Indicate
1=Yes or 2=No 24. EvidLead: Is there evidence of leadership not mentioned elsewhere in the application (either new information or
significant details about activities mentioned on p.8)? Indicate 1=Yes or 2=No 25. EvidAccomp: Is there evidence of other non-academic accomplishments not mentioned elsewhere in the
application (either new information or significant details about activities mentioned on p.8)? Indicate 1=Yes or 2=No
26. EvidPassion: Is there evidence that the applicant pursued a passion? Indicate 1=Yes or 2=No 27. EfrtAcad: Is there evidence that the applicant made special effort to seek advanced academic coursework?
Indicate 1=Yes or 2=No 28. EfrtAcaChal: Is there evidence that the applicant made special effort to seek other academic challenges? Indicate
1=Yes or 2=No 29. TaughtSlf: Is there evidence that the applicant taught self or other an academic subject or skill? Indicate
1=Taught self or 2=Taught other or 3=Taught self and other or 4=Taught neither 30. TaughtOth (AddDocs): Other than the application and the personal statement, is there any additional
documentation? Indicate 1=One or more letters of recommendation or 2=Any other documentation or 3=Both #1 and #2 or 4= No
JUDGMENT 31. IntelMaturity: The Personal Statement (and other text written by the applicant) shows intellectual maturity,
relative to the Berkeley applicant pool: Indicate 1=Yes or 2=No
17
DRAFT, 10-15-06 DO NOT CIRCULATE OR CITE
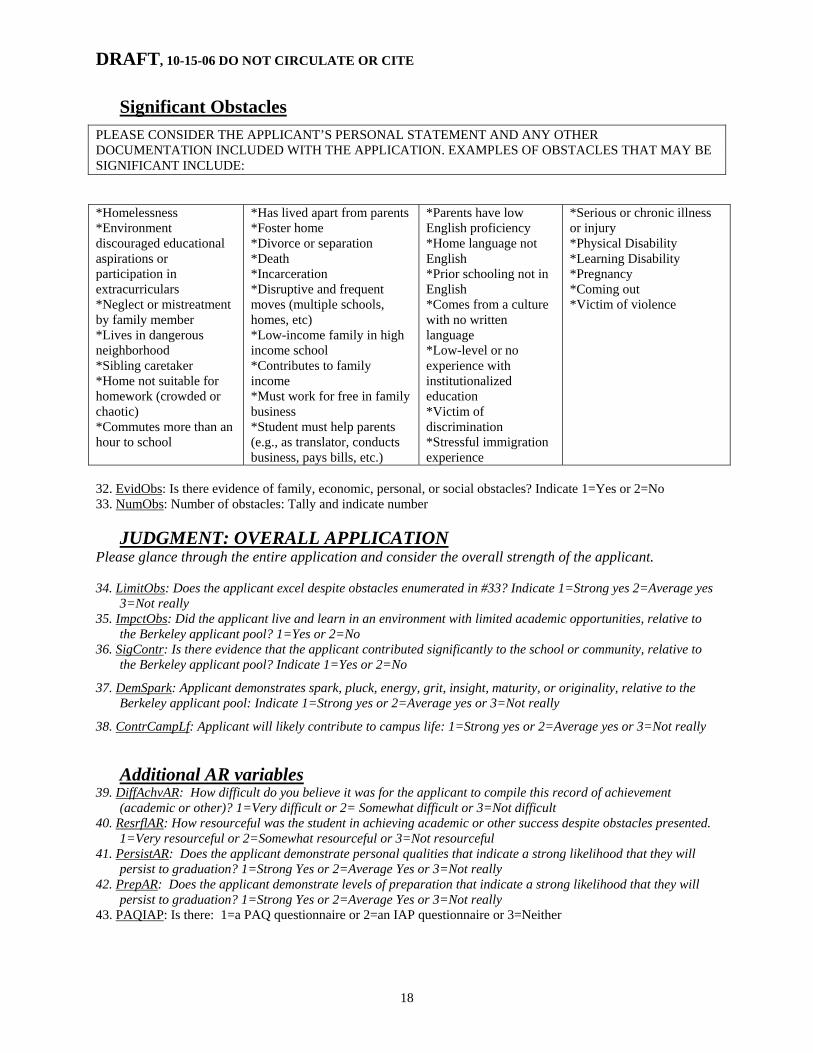
Significant Obstacles PLEASE CONSIDER THE APPLICANT’S PERSONAL STATEMENT AND ANY OTHER DOCUMENTATION INCLUDED WITH THE APPLICATION. EXAMPLES OF OBSTACLES THAT MAY BE SIGNIFICANT INCLUDE:
*Homelessness *Environment discouraged educational aspirations or participation in extracurriculars *Neglect or mistreatment by family member *Lives in dangerous neighborhood *Sibling caretaker *Home not suitable for homework (crowded or chaotic) *Commutes more than an hour to school
*Has lived apart from parents *Foster home *Divorce or separation *Death *Incarceration *Disruptive and frequent moves (multiple schools, homes, etc) *Low-income family in high income school *Contributes to family income *Must work for free in family business *Student must help parents (e.g., as translator, conducts business, pays bills, etc.)
*Parents have low English proficiency *Home language not English *Prior schooling not in English *Comes from a culture with no written language *Low-level or no experience with institutionalized education *Victim of discrimination *Stressful immigration experience
*Serious or chronic illness or injury *Physical Disability *Learning Disability *Pregnancy *Coming out *Victim of violence
32. EvidObs: Is there evidence of family, economic, personal, or social obstacles? Indicate 1=Yes or 2=No 33. NumObs: Number of obstacles: Tally and indicate number
JUDGMENT: OVERALL APPLICATION Please glance through the entire application and consider the overall strength of the applicant. 34. LimitObs: Does the applicant excel despite obstacles enumerated in #33? Indicate 1=Strong yes 2=Average yes
3=Not really 35. ImpctObs: Did the applicant live and learn in an environment with limited academic opportunities, relative to
the Berkeley applicant pool? 1=Yes or 2=No 36. SigContr: Is there evidence that the applicant contributed significantly to the school or community, relative to
the Berkeley applicant pool? Indicate 1=Yes or 2=No
37. DemSpark: Applicant demonstrates spark, pluck, energy, grit, insight, maturity, or originality, relative to the Berkeley applicant pool: Indicate 1=Strong yes or 2=Average yes or 3=Not really
38. ContrCampLf: Applicant will likely contribute to campus life: 1=Strong yes or 2=Average yes or 3=Not really
Additional AR variables
39. DiffAchvAR: How difficult do you believe it was for the applicant to compile this record of achievement (academic or other)? 1=Very difficult or 2= Somewhat difficult or 3=Not difficult
40. ResrflAR: How resourceful was the student in achieving academic or other success despite obstacles presented. 1=Very resourceful or 2=Somewhat resourceful or 3=Not resourceful
41. PersistAR: Does the applicant demonstrate personal qualities that indicate a strong likelihood that they will persist to graduation? 1=Strong Yes or 2=Average Yes or 3=Not really
42. PrepAR: Does the applicant demonstrate levels of preparation that indicate a strong likelihood that they will persist to graduation? 1=Strong Yes or 2=Average Yes or 3=Not really
43. PAQIAP: Is there: 1=a PAQ questionnaire or 2=an IAP questionnaire or 3=Neither
18
DRAFT, 10-15-06 DO NOT CIRCULATE OR CITE
APPENDIX B Factor Analysis of Previously Unrecorded Variables (PUVs)
A factor analysis was performed on “Previously Unrecorded Variables” (PUVs) coded from the Undergraduate Application for Admission for 4,536 of 4,556 freshmen who first matriculated at UC Berkeley in fall term 1999 or spring term 2000. The coding system used to capture these PUVs was originally developed by Berkeley Professor Michael Hout as part of his 2005 report, Berkeley’s Comprehensive Review Method for Making Freshman Admission Decisions: An Assessment (http://www.berkeley.edu/news/media/releases/2005/05/16/houtreport.pdf ). The variables coded represent a subset of the variables coded by Professor Hout on a fall 2004-spring 2005 applicant cohort – excluding grades and grade trends found on pages 4-5 of the application. A complete description of the coding of these Previously Unrecorded Variables (PUVs) is found in Appendix A of this report.
All factors were determined from principal components analysis with a minimum eigenvalue of 1.2, and varimax rotation. The five factors that emerged from the analysis accounted for 45.3 percent of the variance in the variables. Note that most factors are negatively (-) scored, but in that this direction was reversed for the multiple regression analyses shown in this report.
Factor #1: Spark-Passion-Maturity – Likely to Contribute to School/Community/Berkeley
(Negative Scores = More Spark, Passion, Contributions)
Question # Text of Item Factor Loading
v24_EvidLead Is there evidence of leadership not mentioned elsewhere in the application? .466 v25_EvidAccomp Is there evidence of other non-academic accomplishments not mentioned
elsewhere in the application? (1=Yes, 2=No) .589
v26_EvidPassion Is there evidence that the applicant pursued a passion? (1=Yes, 2=No) .567 v31_IntelMaturity The Personal Statement (and other text written by the applicant) shows
intellectual maturity, relative to the Berkeley applicant pool? (1=Yes, 2=No) .581
v36_SigContr The Personal Statement (and other text written by the applicant) shows intellectual maturity, relative to the Berkeley applicant pool? (1=Yes, 2=No)
.658
v37_DemSpark Applicant demonstrates spark, pluck, energy, grit, insight, maturity, or originality, relative to the Berkeley applicant pool: Indicate 1=Strong yes or 2=Average yes or 3=Not really
.755
v38_ContrCampLf Applicant will likely contribute to campus life: 1=Strong yes or 2=Average yes or 3=Not really
.794
Cronbach’s Alpha (Internal Consistency Reliability) .793 Correlation with UC GPA at Graduation (or last term attended) -.06
Factor #2: Participation or Leadership in Activities (Negative = More Activities)
Question # Text of Item Factor Loading
v5_NumMajActs Number of major activities: Tally and indicate number. -.837 v6_NumLeadActs In activities tallied in #5 how many leadership roles did the applicant assume?
Tally and indicate number. -.760
v7_ActsAca Are any of the activities tallied in #5 academic? 1=Yes or 2=No .487 v10_ActsServ Are any of the activities tallied in #5 community service? 1=Yes or 2=No .615 v18_StrngPg8 Are items 112-115 considered to be strong overall, relative to the Berkeley
applicant pool? Indicate 1=Yes or 2=No .637
v19_LightPg8 Are items 112-115 considered to be light overall, relative to the Berkeley applicant pool? Indicate 1=Yes or 2=No
-.588
Cronbach’s Alpha (Internal Consistency Reliability) .781 Correlation with UC GPA at Graduation (or last term attended) -.09
Factor #3: Have Significant Obstacles (Negative Scores = More Obstacles)
Question # Text of Item Factor Loading
v32_EvidObs Is there evidence of family, economic, personal, or social obstacles? Indicate 1=Yes or 2=No
.850
v33_NumObs Number of obstacles: Tally and indicate number. -.811 v20_PrmptA Did the applicant choose prompt A (talents)? Indicate 1=Yes or 2=No -.450 v21_PrmptB Did the applicant choose prompt B (intellectual)? Indicate 1=Yes or 2=No -.434 v22_PrmptC Did the applicant choose prompt C (Wrote personal statement about challenges
aka, OBSTACLES – see definition below)? Indicate 1=Yes or 2=No .775
Cronbach’s Alpha (Internal Consistency Reliability) .722 Correlation with UC GPA at Graduation (or last term attended) 0.17
Factor #4: Other Academic Achievements (Negative Scores = More Achievement)
Question # Text of Item Factor
Loading v23_EvidAchvmnt Is there evidence of academic achievement not mentioned elsewhere in the
application? Indicate 1=Yes or 2=No . 719
v27_EfrtAcad Is there evidence that the applicant made special effort to seek advanced academic coursework? Indicate 1=Yes or 2=No
.741
v28_EfrtAcaChal Is there evidence that the applicant made special effort to seek other academic challenges? Indicate 1=Yes or 2=No
.734
Cronbach’s Alpha (Internal Consistency Reliability) .695 Correlation with UC GPA at Graduation (or last term attended) 0.02
20
DRAFT, 10-15-06 DO NOT CIRCULATE OR CITE
Factor #5: Prompt A vs. B Factor (Negative Scores = Chose Essay Prompt “B”, Positive = Chose Prompt “A”)
Question # Text of Item Factor
Loading v20_PrmptA Did the applicant choose prompt A (talents)? Indicate 1=Yes or 2=No .686 v21_PrmptB Did the applicant choose prompt B (intellectual ach.)? Indicate 1=Yes or 2=No -.652 Cronbach’s Alpha (Internal Consistency Reliability) .397 Correlation with UC GPA at Graduation (or last term attended) 0.07
Note: Description of Essay Prompts
Essay Prompt A: The university seeks to enroll on each of its campuses an entering class that is academically superior and that embodies a wide range of talents, experiences, achievements, and points of view. Describe the qualities and accomplishments you would bring to the undergraduate student body at the University.
Essay Prompt B: Describe one of your intellectual achievements – such as a paper, project, production, or performance.
Essay Prompt C: Describe any unusual circumstances or challenges you have faced and discuss the way you have responded.
21
DRAFT, 10-15-06 DO NOT CIRCULATE OR CITE
APPENDIX C UC and UCB Spring 2003 UCUES Factor Analysis
Method UCUES items from the 2003 survey were factor analyzed using the UC sample (n=6,652) and a cohort of freshmen who matriculated at UC Berkeley in Fall 1999-Spring 2000 (n=1,628). The UC sample includes students from all campuses and all class levels. The UCB cohort completed the survey in their senior year. Items factored included those related to “engagement”, but a separate analysis also identified a number of factors assessing “satisfaction” and “utilization of services”. All factors were determined from principal components analysis with varimax rotation.
Engagement Factors Two sets of almost identical factors emerged in both the UC and UCB data sets with respect to engagement. Differences between the two sets occurred in terms of the “ordering” of the factors noted in the table below. Some of the factors are similar to those emerging in an analysis of the 2004 UCUES survey, performed by Sal Castillo, at UCSB. Some engagement items were excluded from the analyses if they were reduced the sample size appreciably.
The main difference in the factors used in the first versus second set is one of discrimination and “nuance”. A lower minimum eigenvalue (1.0) was used in the second set, as opposed to the first (1.4), splitting some factors.
Engagement Factor Set #1 (Smaller Number of Factors - Mineigen 1.4 – Loadings of > 0.40)
UC Factor #1 –UCB Factor #1: Engagement in Research and Creative Projects
Question # Text of Item UC Factor Loading
UCB Factor Loading
q7a_a_1 This year classes from faculty who refer to own research .425 q7a_a_2 This year small research-oriented seminars from faculty 0.607 .619 q7a_a_3 This year conduct research under faculty for course requirement 0.603 .537 q7a_a_4 This year conduct research under faculty for independent study 0.757 .763 q7a_a_5 This year work on faculty-mentored research for course credit 0.720 .739 q7a_a_6 This year work for pay on faculty research project 0.664 .610 q7a_a_7 This year present research findings for conference 0.768 .722 q7a_a_8 This year produce own creative project for course credit 0.563 .521 q7a_a_9 This year produce own creative project for independent study 0.710 .683 q7a_a_10 This year work on faculty-produced creative project outside course 0.704 .677 a6_a_2 Skills develop further research skills .432 Cronbach’s Alpha (Internal Consistency Reliability) .867 Correlation with UC GPA (Winter 2003)/UCB GPA at Graduation .06 .17
22
DRAFT, 10-15-06 DO NOT CIRCULATE OR CITE
UC Factor #2 –UCB Factor #2: Skills (Academic/Other) Developed in College
Question # Text of Item UC Factor Loading
UCB Factor Loading
q6_a_1 Skills develop further writing clearly 0.564 .569 q6_a_3 Skills develop further oral presentation skills 0.482 q6_a_4 Skills develop further express my views with in discussions 0.597 .650 q6_a_5 Skills develop further analytical & critical thinking skills 0.542 .535 q6_a_6 Skills develop further appreciation for cultural arts 0.603 .599 q6_a_8 Skills develop further culturally diverse viewpoints 0.683 .684 q6_a_9 Skills develop further interpersonal skills 0.671 .671 q6_a_10 Skills develop further leadership skills 0.520 .509 q6_a_11 Skills develop further acquiring well-rounded general education 0.618 .662 q6_a_14 Skills develop further personal code of values 0.650 .603 q6_a_15 Skills develop further informed citizen 0.639 .684 Cronbach’s Alpha (Internal Consistency Reliability) .850 Correlation with UC GPA (Winter 2003)/UCB GPA at Graduation .04 .12
UC Factor #3 –UCB Factor #4: Communicate with Faculty/TA
Question # Text of Item UC Factor Loading
UCB Factor Loading
q10a_a_2 This year met with faculty in person 0.448 .464 q10a_a_3 This year met with TAs in person 0.647 .755 q10a_a_4 This year sent email to a faculty 0.660 .534 q10a_a_5 This year sent email to a TA 0.879 .837 q10a_a_6 This year received individualized email from faculty 0.630 .467 q10a_a_7 This year received individualized email from TA 0.868 .819 Cronbach’s Alpha (Internal Consistency Reliability) .867 Correlation with UC GPA (Winter 2003)/UCB GPA at Graduation .02 .02
UC Factor #4 –UCB Factor #3: Faculty Engagement
Question # Text of Item UC Factor Loading
UCB Factor Loading
q10a_a_1 This year class where professor knows your name 0.763 .758 q10a_a_2 This year met with faculty in person 0.550 .580 q10a_a_4 This year sent email to a faculty 0.445 .602 q10a_a_6 This year received individualized email from faculty 0.457 .632 q10a_a_8 This year had class where professor grades your work 0.706 .689 q10a_a_9 This year made a class presentation 0.578 .539 Cronbach’s Alpha (Internal Consistency Reliability) .828 Correlation with UC GPA (Winter 2003)/UCB GPA at Graduation .16 .16
q8 Completion of assigned readings this academic year 0.635 .653 q9 Do you think you spent the right amount of time on coursework
this year -0.435 -.449
q10b_a_2 This year come to class without completing reading & assignments 0.702 .705 q10b_a_3 This year skipped class for work 0.480 .501 q10b_a_4 This year skipped class lectures were available online 0.589 .464 q10b_a_5 This year skipped class for other reasons 0.732 .734 Cronbach’s Alpha (Internal Consistency Reliability) .670 Correlation with UC GPA (Winter 2003)/UCB GPA at Graduation -0.28 -.29
UC Factor #6 –UCB Factor #7: Community Service-Leadership
Question # Text of Item UC Factor
Loading UCB Factor
Loading q2b_a_4 Other obligations community service 0.801 .780 q3 Are you an officer in campus organizations (1=No, 2=Yes) 0.631 .567 q4 Community service work this academic year (1=No, 2=Yes) 0.791 .752 q6_a_10 Skills develop further leadership skills 0.411 .465 Cronbach’s Alpha (Internal Consistency Reliability) .680 Correlation with UC GPA (Winter 2003)/UCB GPA at Graduation .05 .00
UC Factor #7 –UCB Factor #6: Career Engagement and Preparation
Question # Text of Item UC Factor
Loading UCB Factor
Loading q6_a_7 Skills develop further basic science & math 0.563 .693 q6_a_12 Skills develop further prep for specific career 0.517 .637 q6_a_13 Skills develop further prep for grad school 0.535 .458 q10b_a_2 This year come to class without completing reading & assignments -.539 Cronbach’s Alpha (Internal Consistency Reliability) .599 Correlation with UC GPA (Winter 2003)/UCB GPA at Graduation .06 .01
UC Factor #8 –NO UCB Factor: Work with Others
Question # Text of Item UC Factor
Loading UCB Factor
Loading q10b_a_7 This year work with classmates outside of class to prepare
assignments 0.772
q10b_a_8 This year studied for tests with other students 0.732 Cronbach’s Alpha (Internal Consistency Reliability) .755 Correlation with UC GPA (End-of-Term – Winter 2003) -.05
24
DRAFT, 10-15-06 DO NOT CIRCULATE OR CITE
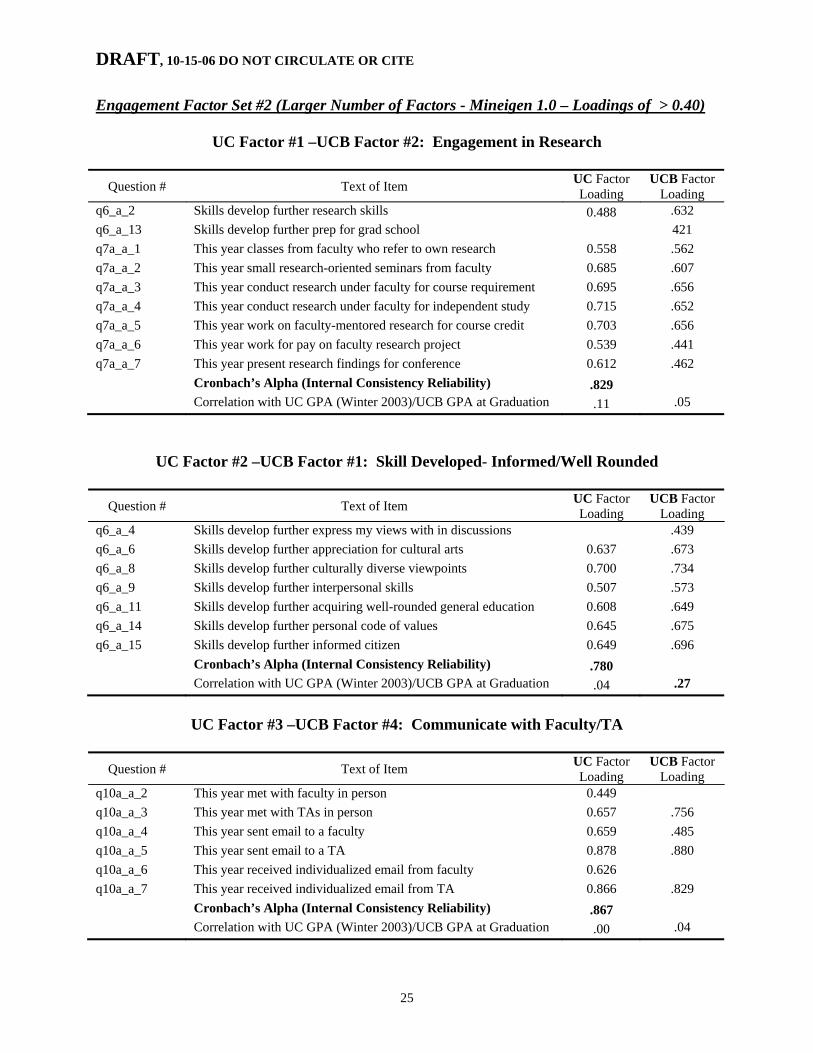
Engagement Factor Set #2 (Larger Number of Factors - Mineigen 1.0 – Loadings of > 0.40)
UC Factor #1 –UCB Factor #2: Engagement in Research
Question # Text of Item UC Factor Loading
UCB Factor Loading
q6_a_2 Skills develop further research skills 0.488 .632 q6_a_13 Skills develop further prep for grad school 421 q7a_a_1 This year classes from faculty who refer to own research 0.558 .562 q7a_a_2 This year small research-oriented seminars from faculty 0.685 .607 q7a_a_3 This year conduct research under faculty for course requirement 0.695 .656 q7a_a_4 This year conduct research under faculty for independent study 0.715 .652 q7a_a_5 This year work on faculty-mentored research for course credit 0.703 .656 q7a_a_6 This year work for pay on faculty research project 0.539 .441 q7a_a_7 This year present research findings for conference 0.612 .462 Cronbach’s Alpha (Internal Consistency Reliability) .829 Correlation with UC GPA (Winter 2003)/UCB GPA at Graduation .11 .05
q6_a_4 Skills develop further express my views with in discussions .439 q6_a_6 Skills develop further appreciation for cultural arts 0.637 .673 q6_a_8 Skills develop further culturally diverse viewpoints 0.700 .734 q6_a_9 Skills develop further interpersonal skills 0.507 .573 q6_a_11 Skills develop further acquiring well-rounded general education 0.608 .649 q6_a_14 Skills develop further personal code of values 0.645 .675 q6_a_15 Skills develop further informed citizen 0.649 .696 Cronbach’s Alpha (Internal Consistency Reliability) .780 Correlation with UC GPA (Winter 2003)/UCB GPA at Graduation .04 .27
UC Factor #3 –UCB Factor #4: Communicate with Faculty/TA
Question # Text of Item UC Factor
Loading UCB Factor
Loading q10a_a_2 This year met with faculty in person 0.449 q10a_a_3 This year met with TAs in person 0.657 .756 q10a_a_4 This year sent email to a faculty 0.659 .485 q10a_a_5 This year sent email to a TA 0.878 .880 q10a_a_6 This year received individualized email from faculty 0.626 q10a_a_7 This year received individualized email from TA 0.866 .829 Cronbach’s Alpha (Internal Consistency Reliability) .867 Correlation with UC GPA (Winter 2003)/UCB GPA at Graduation .00 .04
25
DRAFT, 10-15-06 DO NOT CIRCULATE OR CITE
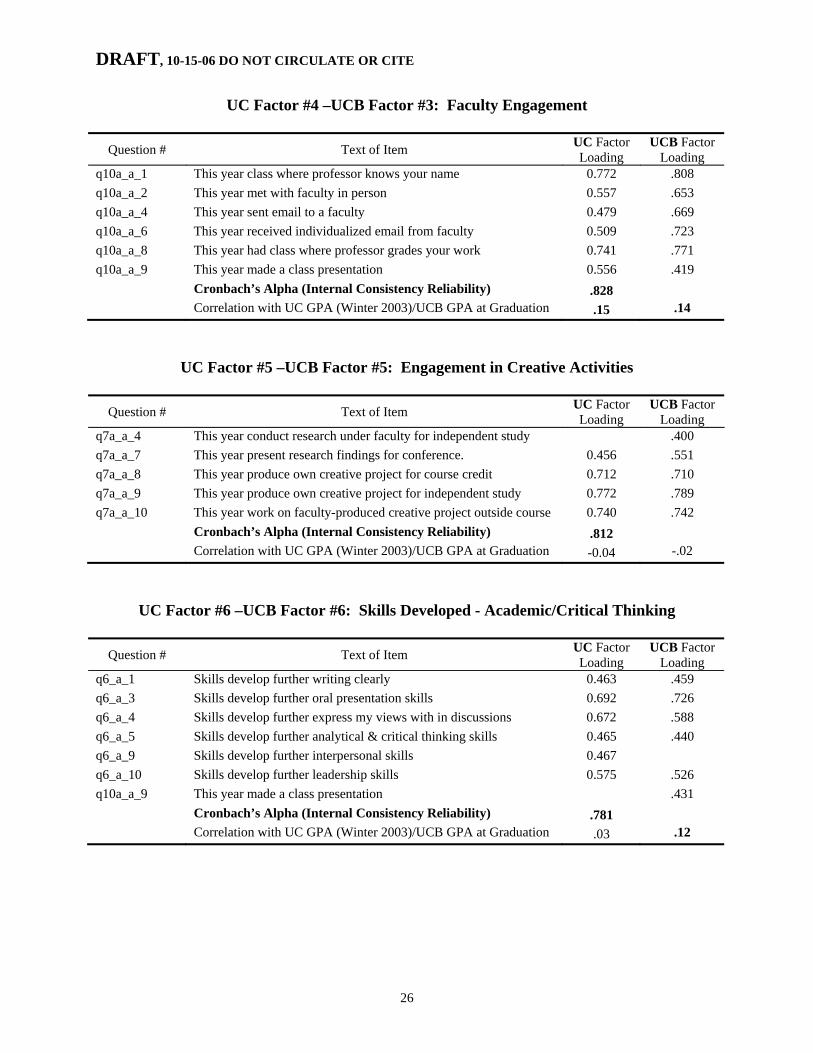
UC Factor #4 –UCB Factor #3: Faculty Engagement
Question # Text of Item UC Factor Loading
UCB Factor Loading
q10a_a_1 This year class where professor knows your name 0.772 .808 q10a_a_2 This year met with faculty in person 0.557 .653 q10a_a_4 This year sent email to a faculty 0.479 .669 q10a_a_6 This year received individualized email from faculty 0.509 .723 q10a_a_8 This year had class where professor grades your work 0.741 .771 q10a_a_9 This year made a class presentation 0.556 .419 Cronbach’s Alpha (Internal Consistency Reliability) .828 Correlation with UC GPA (Winter 2003)/UCB GPA at Graduation .15 .14
UC Factor #5 –UCB Factor #5: Engagement in Creative Activities
Question # Text of Item UC Factor Loading
UCB Factor Loading
q7a_a_4 This year conduct research under faculty for independent study .400 q7a_a_7 This year present research findings for conference. 0.456 .551 q7a_a_8 This year produce own creative project for course credit 0.712 .710 q7a_a_9 This year produce own creative project for independent study 0.772 .789 q7a_a_10 This year work on faculty-produced creative project outside course 0.740 .742 Cronbach’s Alpha (Internal Consistency Reliability) .812 Correlation with UC GPA (Winter 2003)/UCB GPA at Graduation -0.04 -.02
q6_a_1 Skills develop further writing clearly 0.463 .459 q6_a_3 Skills develop further oral presentation skills 0.692 .726 q6_a_4 Skills develop further express my views with in discussions 0.672 .588 q6_a_5 Skills develop further analytical & critical thinking skills 0.465 .440 q6_a_9 Skills develop further interpersonal skills 0.467 q6_a_10 Skills develop further leadership skills 0.575 .526 q10a_a_9 This year made a class presentation .431 Cronbach’s Alpha (Internal Consistency Reliability) .781 Correlation with UC GPA (Winter 2003)/UCB GPA at Graduation .03 .12
26
DRAFT, 10-15-06 DO NOT CIRCULATE OR CITE
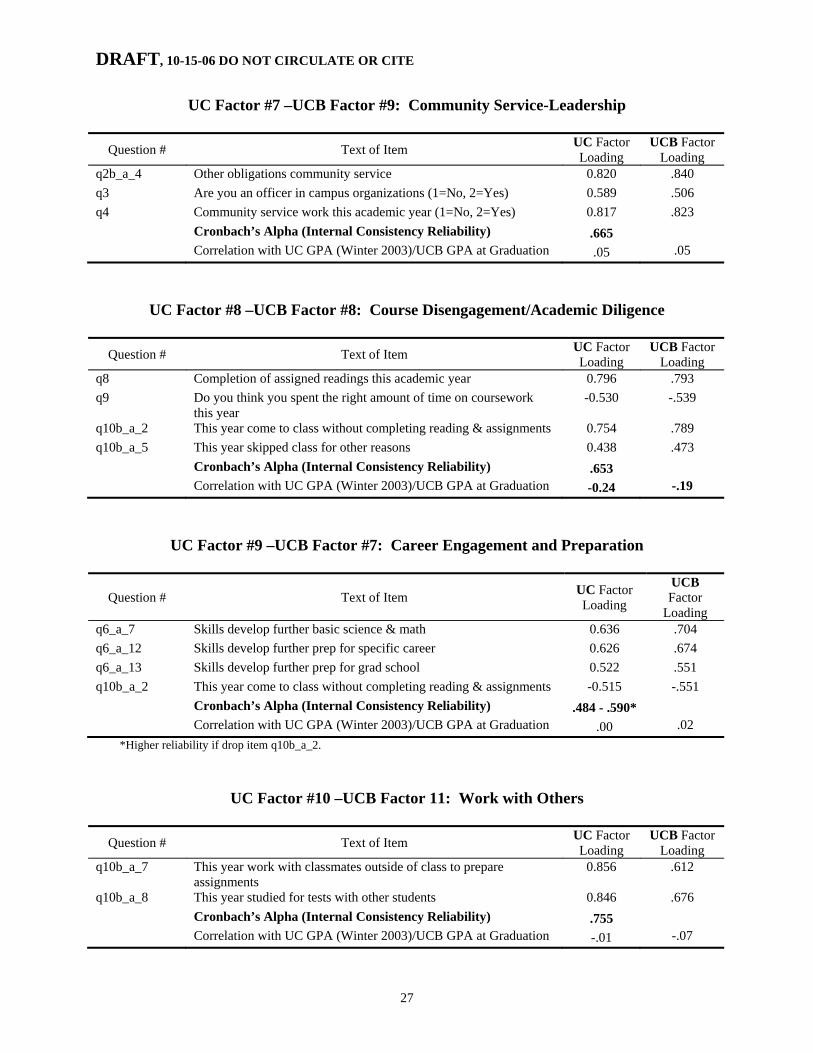
UC Factor #7 –UCB Factor #9: Community Service-Leadership
Question # Text of Item UC Factor Loading
UCB Factor Loading
q2b_a_4 Other obligations community service 0.820 .840 q3 Are you an officer in campus organizations (1=No, 2=Yes) 0.589 .506 q4 Community service work this academic year (1=No, 2=Yes) 0.817 .823 Cronbach’s Alpha (Internal Consistency Reliability) .665 Correlation with UC GPA (Winter 2003)/UCB GPA at Graduation .05 .05
q8 Completion of assigned readings this academic year 0.796 .793 q9 Do you think you spent the right amount of time on coursework
this year -0.530 -.539
q10b_a_2 This year come to class without completing reading & assignments 0.754 .789 q10b_a_5 This year skipped class for other reasons 0.438 .473 Cronbach’s Alpha (Internal Consistency Reliability) .653 Correlation with UC GPA (Winter 2003)/UCB GPA at Graduation -0.24 -.19
UC Factor #9 –UCB Factor #7: Career Engagement and Preparation
Question # Text of Item UC Factor Loading
UCB Factor
Loading q6_a_7 Skills develop further basic science & math 0.636 .704 q6_a_12 Skills develop further prep for specific career 0.626 .674 q6_a_13 Skills develop further prep for grad school 0.522 .551 q10b_a_2 This year come to class without completing reading & assignments -0.515 -.551 Cronbach’s Alpha (Internal Consistency Reliability) .484 - .590* Correlation with UC GPA (Winter 2003)/UCB GPA at Graduation .00 .02
*Higher reliability if drop item q10b_a_2.
UC Factor #10 –UCB Factor 11: Work with Others
Question # Text of Item UC Factor Loading
UCB Factor Loading
q10b_a_7 This year work with classmates outside of class to prepare assignments
0.856 .612
q10b_a_8 This year studied for tests with other students 0.846 .676 Cronbach’s Alpha (Internal Consistency Reliability) .755 Correlation with UC GPA (Winter 2003)/UCB GPA at Graduation -.01 -.07
27
DRAFT, 10-15-06 DO NOT CIRCULATE OR CITE
UC Factor #11 –UCB Factor #10: Skipped Class for Good Reason
Question # Text of Item UC Factor Loading
UCB Factor Loading
q10b_a_3 This year skipped class for work 0.695 .686 q10b_a_4 This year skipped class lectures were available online 0.737 .716 q10b_a_5 This year skipped class for other reasons 0.616 .549 Cronbach’s Alpha (Internal Consistency Reliability) .596 Correlation with UC GPA (Winter 2003)/UCB GPA at Graduation -0.15 -.15
Factor Set #3: Satisfaction and Service Utilization - Mineigen 1.2 – Loadings of > 0.40)
UC Factor #1 –UCB Factor #3: Satisfaction with the Academic Experience
Question # Text of Item UC Factor Loading
UCB Factor Loading
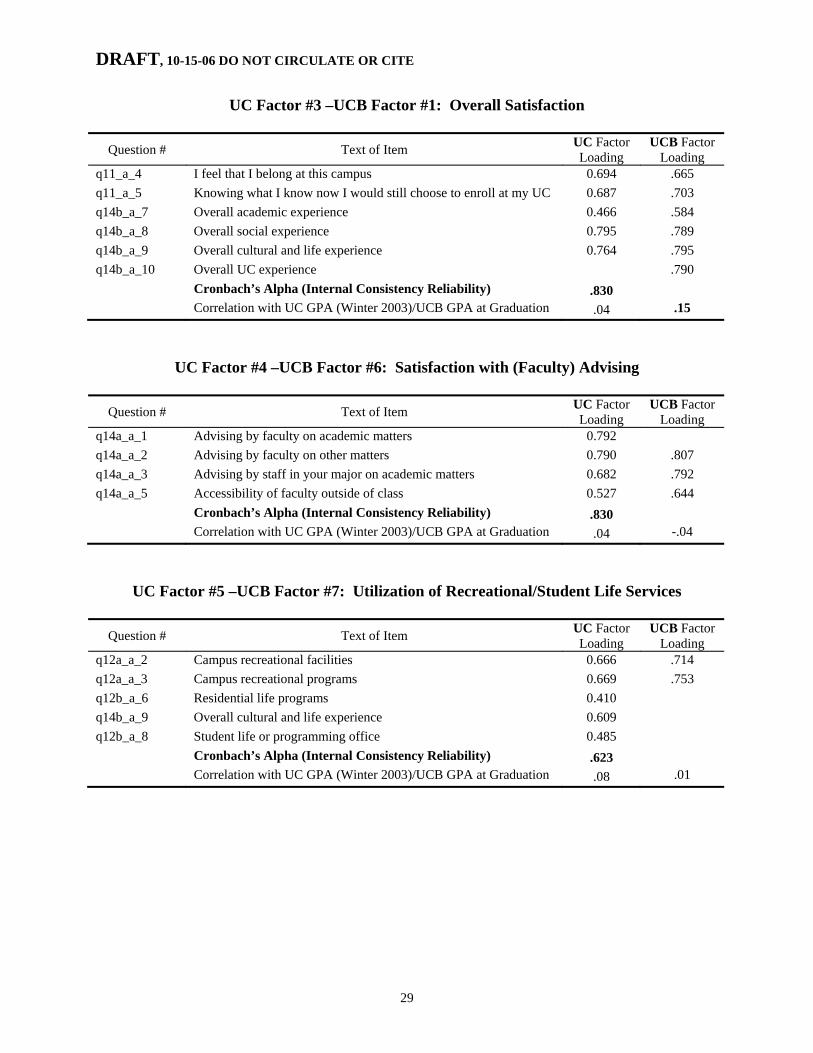
q14a_a_5 Accessibility of faculty outside of class 0.417 q14a_a_6 Availability of courses needed for graduation 0.652 .700 q14a_a_7 Access to small classes 0.515 .588 q14b_a_1 Variety of courses & subjects at this campus 0.663 .604 q14b_a_2 Ability to get into a major you want 0.631 .667 q14b_a_3 Availability of courses for general edu requirements 0.693 .643 q14b_a_4 Your overall UC GPA 0.401 .505 q14b_a_5 Overall quality of faculty instruction 0.562 .459 q14b_a_6 Overall quality of TAs 0.428 .427 q14b_a_7 Overall academic experience 0.565 .477 Cronbach’s Alpha (Internal Consistency Reliability) .809 Correlation with UC GPA (Winter 2003)/UCB GPA at Graduation .25 .38
UC Factor #2 –UCB Factor #2: Utilization of Special Services
Question # Text of Item UC Factor Loading
UCB Factor Loading
q12a_a_6 Child care services 0.652 .726 q12a_a_8 First-generation low-income student services 0.560 .585 q12a_a_9 Gay lesbian bisexual transgender services 0.597 .696 q12b_a_3 Psychological counseling services 0.462 .419 q12b_a_4 Reentry student services 0.631 .696 q12b_a_7 Services for disabled students 0.584 .669 q12b_a_8 Student life or programming office 0.418 q12b_a_9 Transfer student services 0.543 .759 Cronbach’s Alpha (Internal Consistency Reliability) .704 Correlation with UC GPA (Winter 2003)/UCB GPA at Graduation -.04 -.03
28
DRAFT, 10-15-06 DO NOT CIRCULATE OR CITE
UC Factor #3 –UCB Factor #1: Overall Satisfaction
Question # Text of Item UC Factor Loading
UCB Factor Loading
q11_a_4 I feel that I belong at this campus 0.694 .665 q11_a_5 Knowing what I know now I would still choose to enroll at my UC 0.687 .703 q14b_a_7 Overall academic experience 0.466 .584 q14b_a_8 Overall social experience 0.795 .789 q14b_a_9 Overall cultural and life experience 0.764 .795 q14b_a_10 Overall UC experience .790 Cronbach’s Alpha (Internal Consistency Reliability) .830 Correlation with UC GPA (Winter 2003)/UCB GPA at Graduation .04 .15
UC Factor #4 –UCB Factor #6: Satisfaction with (Faculty) Advising
Question # Text of Item UC Factor Loading
UCB Factor Loading
q14a_a_1 Advising by faculty on academic matters 0.792 q14a_a_2 Advising by faculty on other matters 0.790 .807 q14a_a_3 Advising by staff in your major on academic matters 0.682 .792 q14a_a_5 Accessibility of faculty outside of class 0.527 .644 Cronbach’s Alpha (Internal Consistency Reliability) .830 Correlation with UC GPA (Winter 2003)/UCB GPA at Graduation .04 -.04
UC Factor #5 –UCB Factor #7: Utilization of Recreational/Student Life Services
Question # Text of Item UC Factor Loading
UCB Factor Loading
q12a_a_2 Campus recreational facilities 0.666 .714 q12a_a_3 Campus recreational programs 0.669 .753 q12b_a_6 Residential life programs 0.410 q14b_a_9 Overall cultural and life experience 0.609 q12b_a_8 Student life or programming office 0.485 Cronbach’s Alpha (Internal Consistency Reliability) .623 Correlation with UC GPA (Winter 2003)/UCB GPA at Graduation .08 .01
29
DRAFT, 10-15-06 DO NOT CIRCULATE OR CITE
UC Factor #6 –UCB Factor #4: Respect for Personal Freedom of Expression
Question # Text of Item UC Factor Loading
UCB Factor Loading
q11_a_1 I can express my political & personal views on campus 0.608 .435 q11_a_2 Students are respected here regardless of religious beliefs 0.859 .867 q11_a_3 Students are respected here regardless of sexual orientations 0.811 .857 q12 Students are respected <undefined>.. .855 Cronbach’s Alpha (Internal Consistency Reliability) .728 Correlation with UC GPA (Winter 2003)/UCB GPA at Graduation -.07 .00
UC Factor #7 –UCB Factor #5: Utilization of Essential Services
Question # Text of Item UC Factor Loading
UCB Factor Loading
q12a_a_1 Campus financial aid office 0.565 .497 q12a_a_2 Campus recreational facilities q12a_a_3 Campus recreational programs q12a_a_4 Cashiers office 0.720 .455 q12a_a_5 Career center 0.400 q12a_a_6 Child care services q12a_a_7 Educational abroad program q12a_a_8 First-generation low-income student services q12a_a_9 Gay lesbian bisexual transgender services q12b_a_1 New student orientation .567 q12b_a_2 Personal safety programs .576 q12b_a_3 Psychological counseling services q12b_a_4 Reentry student services q12b_a_5 Registrars office 0.580 .590 q12b_a_6 Residential life programs .439 q12b_a_7 Services for disabled students q12b_a_8 Student life or programming office .418 Cronbach’s Alpha (Internal Consistency Reliability) .487 Correlation with UC GPA (Winter 2003)/UCB GPA at Graduation -.13 .03