74
Proposed Headquarters Hotel at the Saint Paul RiverCentre Prepared for the City of Saint Paul Department of Planning and Economic Development July 3, 2018
Proposed Headquarters Hotel at the Saint Paul RiverCentre
Prepared for the City of Saint PaulDepartment of Planning and Economic DevelopmentJuly 3, 2018
© 2018 Jones Lang LaSalle IP, Inc. All rights reserved. 2
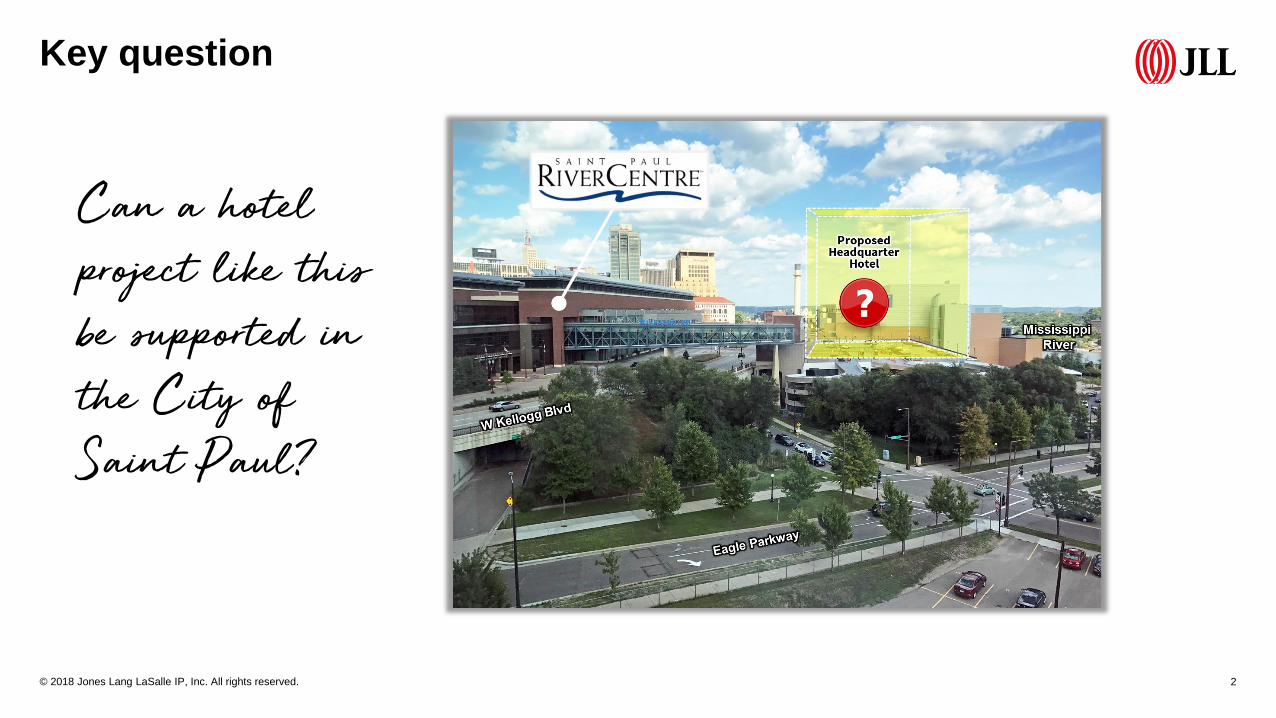
Key question
Can a hotel
project like this
be supported in
the City of
Saint Paul?
Executive Summary 4
What is the state of the hotel industry? 12
Do convention hotels impact existing hotels? 19
Is the Saint Paul RiverCentre achieving its goals? 22
Does a RiverCentre Hotel make difference in Saint Paul? 33
What could be the impact in Saint Paul? 58
Appendix 70
Table of Contents
JLL was the lead consultant for the development of the Hilton Americas (pictured here) adjacent to the George R. Brown Convention Center
Executive Summary

JLL analyzed numerous factors related to a proposed headquarter hotel to be located adjacent to the Saint Paul RiverCentre. The proposed hotel site would be located atop the envisioned replacement of the RiverCentre Ramp. The following executive summary serves to answer the following questions related to the proposed headquarter hotel:
• Why is a convention center needed in Saint Paul?
• Will a convention center hotel be helpful for Saint Paul?
• Will a convention center have a negative impact on the current hotel landscape?
• What is the cost of a convention center hotel?
• How could the convention center hotel perform?
• What is the economic impact of a convention center hotel?
• Who would own the convention center hotel?
© 2018 Jones Lang LaSalle IP, Inc. All rights reserved. 5
Executive Summary
WHY IS A CONVENTION CENTER NEEDED IN SAINT PAUL?
Successful convention centers generate significant opportunities to enhance a local economy via increased spending, more attractive development possibilities, expanded employment, and tax generation. In pursuit of these rewards, cities across the U.S. compete with one another every day for convention and meetings business.
However, simply constructing a convention center does not lead to success. Although the convention facility is essential, it is the “package” that typically wins the day and the business. Saint Paul offers components of a winning package, including excellent walkability (as measured by Walk Scores®) within an attractive downtown core, as well as a major international airport nearby; but it is missing one critical component. Convention centers need a connected or immediately adjacent hotel to be successful.
Currently, Saint Paul offers only one group-oriented hotel within walking distance of the RiverCentre, the 410-room InterContinental Saint Paul Riverfront. Meanwhile, the markets Saint Paul competes with for convention business, including Minneapolis, MN; Des Moines, IA; Madison, WI; Rochester, MN and Omaha, NE either have or are in the process of
developing two group-oriented hotels within a 1-mile radius of their respective convention centers. Moreover, Madison, Omaha, and Des Moines each offer a group-oriented hotel adjacent to their respective convention centers. Those that do not are in various stages of exploring how one might be developed. If Saint Paul desires to stay competitive, it should consider offering a second group-oriented hotel within walking distance of the RiverCentre, and the best location for such a hotel would be directly connected to the convention center.
WILL A CONVENTION CENTER HOTEL BE HELPFUL FOR SAINT PAUL?
JLL sought to answer this question through both primary survey research and an economic impact analysis, which is summarized following the question: What is the economic impact of a convention center hotel? In its primary research phase, JLL surveyed two separate groups: the first was an in-person focus group consisting of 15 locally-based meeting planners and the second was a national audience comprised of 36 meeting planners scattered throughout the U.S. For the national audience, JLL targeted meeting planners who have planned events in the Midwest of up to 1,200 room nights on peak. Events larger than 1,200 room nights on peak would require too many rooms to consider Saint Paul as a convention destination.
© 2018 Jones Lang LaSalle IP, Inc. All rights reserved. 6
Executive Summary
As aforementioned, meeting planners are key stakeholders for headquarters hotels as they decide where to place group business, a core demand segment for convention-oriented hotels. According to JLL’s research, 77% and 83% of focus group respondents and survey participants, respectively, deem selecting destinations with a headquarter hotel attached to the convention center absolutely necessary or highly important.
JLL also analyzed the RiverCentre operating performance. While the building reaches an optimal occupancy level on weekends, there is opportunity to fill the facility with additional weekday business. Meetings, conventions and tradeshows, which typically happen on weekdays, generate higher revenues per attendee than do consumer shows and other common weekend uses. Thus added hotel capacity that caters to the needs and wants of meeting planners, and therefore meeting attendees, will bolster efforts to bring groups to Saint Paul that spend money locally—at the hotel, at the RiverCentre, and in town.
Additionally, through the survey process, JLL delved into whether the RiverCentre facility meets the needs of meeting planners. JLL found that 69% and 70% of focus group and survey respondents, respectively, indicated that they strongly agree or agree that the RiverCentre space is
sufficient for their event needs. On the other hand, 93% and 53% of focus group respondents and survey participants, respectively, strongly disagree or disagree with the statement, “the hotel package surrounding the RiverCentre is sufficient for their event needs.”
WILL A CONVENTION CENTER HAVE A NEGATIVE IMPACT ON THE
CURRENT HOTEL LANDSCAPE?
JLL analyzed the impact of a set of 10 headquarter hotels on their respective lodging markets upon opening. The analysis found that when a new headquarter hotel delivered in a period of economic growth, the new room supply is absorbed within one-to-two years. On the other hand, if the hotel opened during a recessionary environment, supply absorption took up to five years.
The set of hotels (and open years) included in this analysis pertains to the 1,100-room Hyatt Regency Denver at Colorado Convention Center (2005), the 1,203-room Hilton Americas Houston (2004), the 616-room Marriott Louisville Downtown (2005), the 700-room Westin Charlotte (2003), the 800-room Hilton Austin (2003), the 1,005-room JW Marriott Indianapolis (2011), the 917-room Marriott St Louis Grand Hotel (2003), the 1,190-room Hilton San Diego Bayfront (2008), the 757-room Hilton Baltimore (2008)
© 2018 Jones Lang LaSalle IP, Inc. All rights reserved. 7
Executive Summary
and the 1,003-room Grand Hyatt San Antonio (2008).
Importantly, demand that absorbed the new supply following the opening of a headquarter hotel is largely driven by existence of the new hotel. For instance, when the 616-room Marriott Louisville Downtown opened in 2005, it caused a 45% increase in supply within the hotel’s competitive market. That year hotel demand within the competitive market increased by 55%. Convention center hotels are therefore demand generators—they bring new demand for hotel accommodations to the market.
On the other hand, smaller hotels, such as a new 125-room select service hotel (e.g. Hampton Inn, Courtyard by Marriott etc.) are not large enough from both a room and meeting space perspective to house large groups centrally, and therefore do not generate significant new hotel demand. Such hotels will rely on demand already existing in the market.
WHAT IS THE COST OF A CONVENTION CENTER HOTEL?
Based on JLL’s understanding of the project, initial development cost estimates for the proposed hotel could be in the $300,000 per key range and is inclusive of cost savings that would result in its unique location atop of the proposed ramp. Given the recommended hotel size of roundly 500
rooms with approximately 40,000 square feet of meeting space, this amounts to a total cost of $150 million. The recommended hotel program (e.g. room count, meeting space and position) is based on both JLL’s market research and primary research processes.
The total project cost estimate as well as the allocation of funds within the development cost budget were informed by JLL’s knowledge of completed headquarter hotel projects of a similar size and positioning, such as a +/-500-room full service hotel in downtown Columbus, OH with +/- 20,000 square feet of meeting space as well as the +/- 500-room full service hotel with +/- 45,000 square feet of meeting space located in a suburb of Chicago, IL. The average development cost per key for the aforementioned completed properties, assuming 2.0% annual inflation from the time the development budgets were created, is roundly $350,000 to $375,000 per key.
HOW COULD THE CONVENTION CENTER HOTEL PERFORM?
JLL prepared pro-forma hotel projections to inform anticipated hotel performance over a 10-year investment horizon. As a first step, to project rooms revenues using occupancy and average daily rate (ADR) estimates, we obtained market performance data via a data purchase from the
© 2018 Jones Lang LaSalle IP, Inc. All rights reserved. 8
Executive Summary
independent third-party data provider STR, formerly Smith Travel Research. JLL purchased two sets of data, the first includes the eight Downtown Saint Paul Hotels located within a 1-mile radius of the RiverCentre that report performance data to STR. The second set includes group-oriented hotels in the downtown areas of both Saint Paul and Minneapolis.
The two competitive sets were used to inform JLL’s occupancy and average daily rate projections. It is JLL’s opinion that the proposed hotel would perform better than the set of Saint Paul hotels in aggregate but not as well as the set of hotels that is largely comprised of hotels in downtown Minneapolis. JLL notes that selecting competitive sets based on location and hotel characteristics is both an art and a science as it requires choosing those hotels that are of similar size and positioning while also adhering to data provider requirements such as maintaining a balanced distribution of brand parent companies (e.g. Marriott International), as measured by room count.
The STR data obtained provide historical figures, and JLL used the historical data to inform future projections. Occupancy is estimated to ramp up from an opening year of 60.6% to a stabilized rate of 71.9% by year three of hotel operations. Stabilized occupancy projections are based
on a penetration, or fair share, analysis in which we looked at how other convention center-connected hotels perform in relation to their respective competitive sets. JLL’s internal historical data includes four occupancy penetration rates of full service, convention center-connected hotels, including hotels in Schaumburg, IL, Houston, TX, Columbus, OH and Myrtle Beach, NC. Based on this analysis JLL expects the proposed hotel to exceed its fair share of occupancy by 4% upon stabilization. The average daily rate penetration estimate was based upon a similar analysis. Given the proposed hotel’s prime location, JLL estimates the hotel will achieve a 7% rate premium with respect to the competitive set.
Penetration estimates, nevertheless, rely upon a baseline projection for the market. JLL assumed the market would increase from a 64% occupancy rate as of year-end 2017 to a 69% occupancy rate upon stabilization given added demand generated in the market due to the proposed hotel plus organic growth. Market average daily rates were assumed to increase at the inflationary rate of roundly 2% annually through the forecasted horizon.
After projecting the ‘top line’ or occupancy and average daily rate for the proposed hotel, the remaining line items in the pro-forma, both revenues and expenses, were based upon benchmarks of full service hotels in the
© 2018 Jones Lang LaSalle IP, Inc. All rights reserved. 9
Executive Summary

Minneapolis market obtained through JLL’s internal database. These hotels boast an average room count of 470 rooms, an average occupancy rate of 72% and an average daily rate of $190, so the set is deemed representative of the proposed hotel. Overall, JLL estimates that the proposed hotel will earn approximately $11 million in EBITDA Less Replacement Reserve by the third year of operation.
WHAT IS THE ECONOMIC IMPACT OF A CONVENTION CENTER HOTEL?
JLL analyzed the direct economic impact that the proposed hotel would have on the Saint Paul economy. JLL’s estimates are broken down into economic impact during the construction phase and ongoing annual economic impact.
During the construction phase, direct impact pertains to the hard costs and furniture, fixtures and equipment (FF&E) of the development estimated at $105 million and $15.7 million, respectively. JLL further estimated that 25% of hard cost and 80% of FF&E spend will take place in the market, with the remaining spent outside of the market and therefore not captured in the development phase direct economic impact figure. JLL calculated the state, city and local sales using the estimated $38.8 million portion of hard costs and FF&E spent in the market.
The ongoing direct economic impact pertains to the dollars spent by the hotel to operate coupled with spend by both proposed hotel guests and incremental market-wide hotel demand generated by the proposed hotel. To quantify visitor spend, JLL used Destination Marketing Association International (DMAI) estimates for guest spend per day and multiplied these figures by JLL’s estimated occupied room nights. Hotel and both in-hotel restaurant and parking spend is captured in JLL’s pro-forma while the DMAI estimates were used to project spend at other restaurants, sightseeing, entertainment, shopping and transportation, amounting to approximately $100 per day. Incremental market hotel demand was estimated to generate the projected Saint Paul market average rate of $180 by the third year of hotel operations.
Following the revenue calculations, the tax impact is quantified using the respective state, city and local sales and lodging tax rates: 6.875% state sales tax, 0.5% city sales, 0.25% local sales, 6.5% state lodging, 6.0% city lodging and 1.125% local lodging. Overall, the Saint Paul (city) share of projected economic impact amounts to approximately $200k during construction and then $1.7 million of the $4.8 million generated annually upon stabilization.
© 2018 Jones Lang LaSalle IP, Inc. All rights reserved. 10
Executive Summary
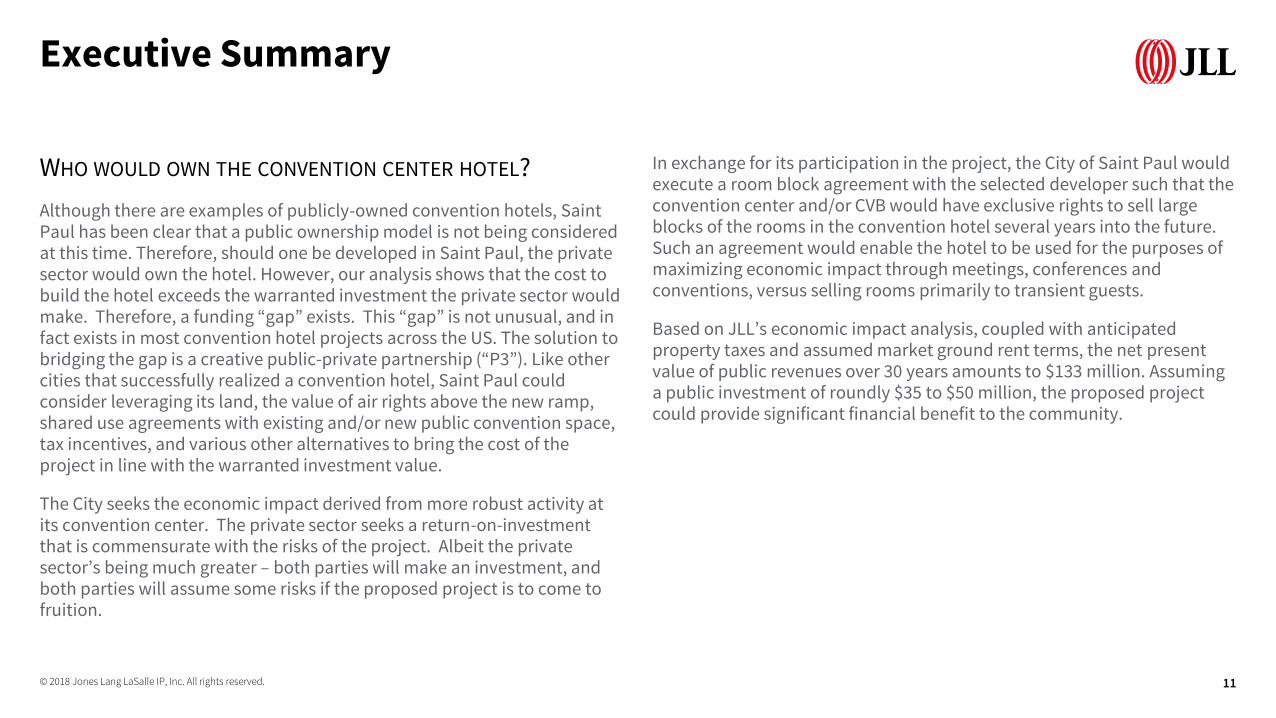
WHO WOULD OWN THE CONVENTION CENTER HOTEL?
Although there are examples of publicly-owned convention hotels, Saint Paul has been clear that a public ownership model is not being considered at this time. Therefore, should one be developed in Saint Paul, the private sector would own the hotel. However, our analysis shows that the cost to build the hotel exceeds the warranted investment the private sector would make. Therefore, a funding “gap” exists. This “gap” is not unusual, and in fact exists in most convention hotel projects across the US. The solution to bridging the gap is a creative public-private partnership (“P3”). Like other cities that successfully realized a convention hotel, Saint Paul could consider leveraging its land, the value of air rights above the new ramp, shared use agreements with existing and/or new public convention space, tax incentives, and various other alternatives to bring the cost of the project in line with the warranted investment value.
The City seeks the economic impact derived from more robust activity at its convention center. The private sector seeks a return-on-investment that is commensurate with the risks of the project. Albeit the private sector’s being much greater – both parties will make an investment, and both parties will assume some risks if the proposed project is to come to fruition.
In exchange for its participation in the project, the City of Saint Paul would execute a room block agreement with the selected developer such that the convention center and/or CVB would have exclusive rights to sell large blocks of the rooms in the convention hotel several years into the future. Such an agreement would enable the hotel to be used for the purposes of maximizing economic impact through meetings, conferences and conventions, versus selling rooms primarily to transient guests.
Based on JLL’s economic impact analysis, coupled with anticipated property taxes and assumed market ground rent terms, the net present value of public revenues over 30 years amounts to $133 million. Assuming a public investment of roundly $35 to $50 million, the proposed project could provide significant financial benefit to the community.
© 2018 Jones Lang LaSalle IP, Inc. All rights reserved. 11
Executive Summary
What is the State of the hotel industry?
© 2018 Jones Lang LaSalle IP, Inc. All rights reserved. 13
What is the State of the hotel industry?
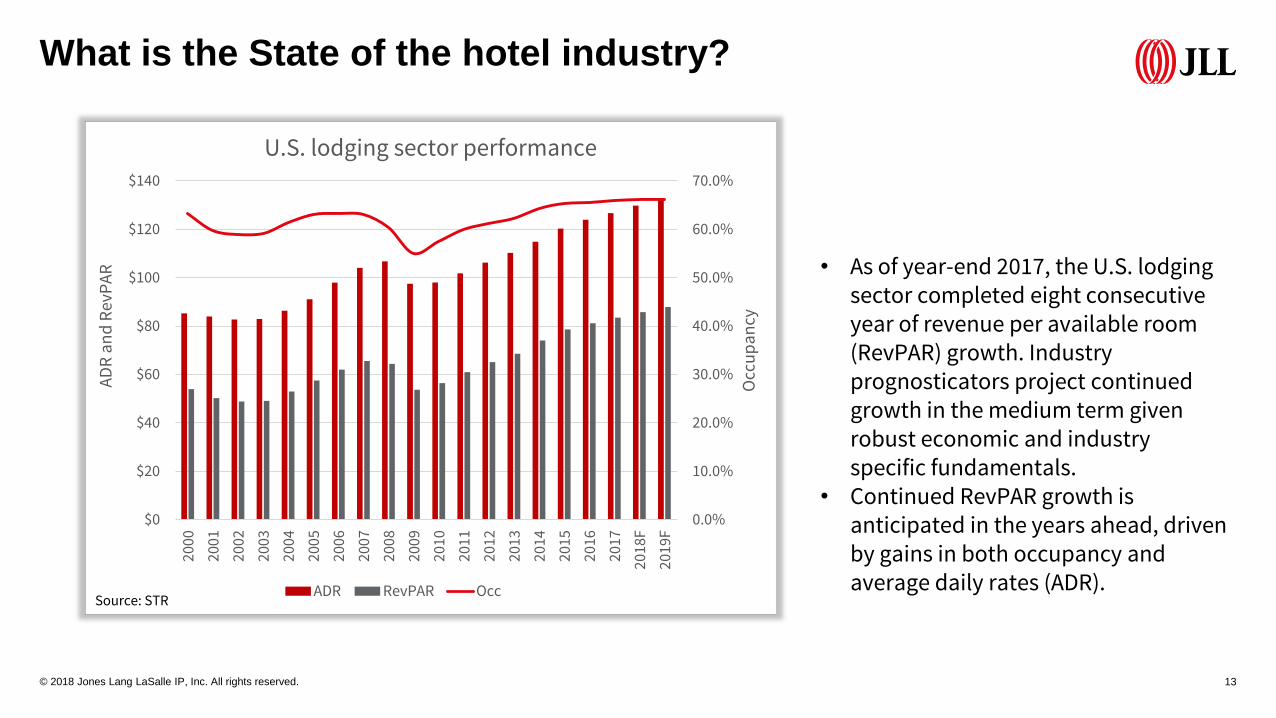
• As of year-end 2017, the U.S. lodging sector completed eight consecutive year of revenue per available room (RevPAR) growth. Industry prognosticators project continued growth in the medium term given robust economic and industry specific fundamentals.
• Continued RevPAR growth is anticipated in the years ahead, driven by gains in both occupancy and average daily rates (ADR).
0.0%
10.0%
20.0%
30.0%
40.0%
50.0%
60.0%
70.0%
$0
$20
$40
$60
$80
$100
$120
$14020
00
2001
2002
2003
2004
2005
2006
2007
2008
2009
2010
2011
2012
2013
2014
2015
2016
2017
2018
F
2019
F
Occ
up
an
cy
AD
R a
nd
Rev
PA
R
U.S. lodging sector performance
ADR RevPAR OccSource: STR
0.0%
0.5%
1.0%
1.5%
2.0%
2.5%
3.0%
3.5%
4.0%
2010 2011 2012 2013 2014 2015 2016 2017
Supply growth since 2010 - % of existing supply by level of positioning
Full service Select service
© 2018 Jones Lang LaSalle IP, Inc. All rights reserved. 14
What is the State of the hotel industry?
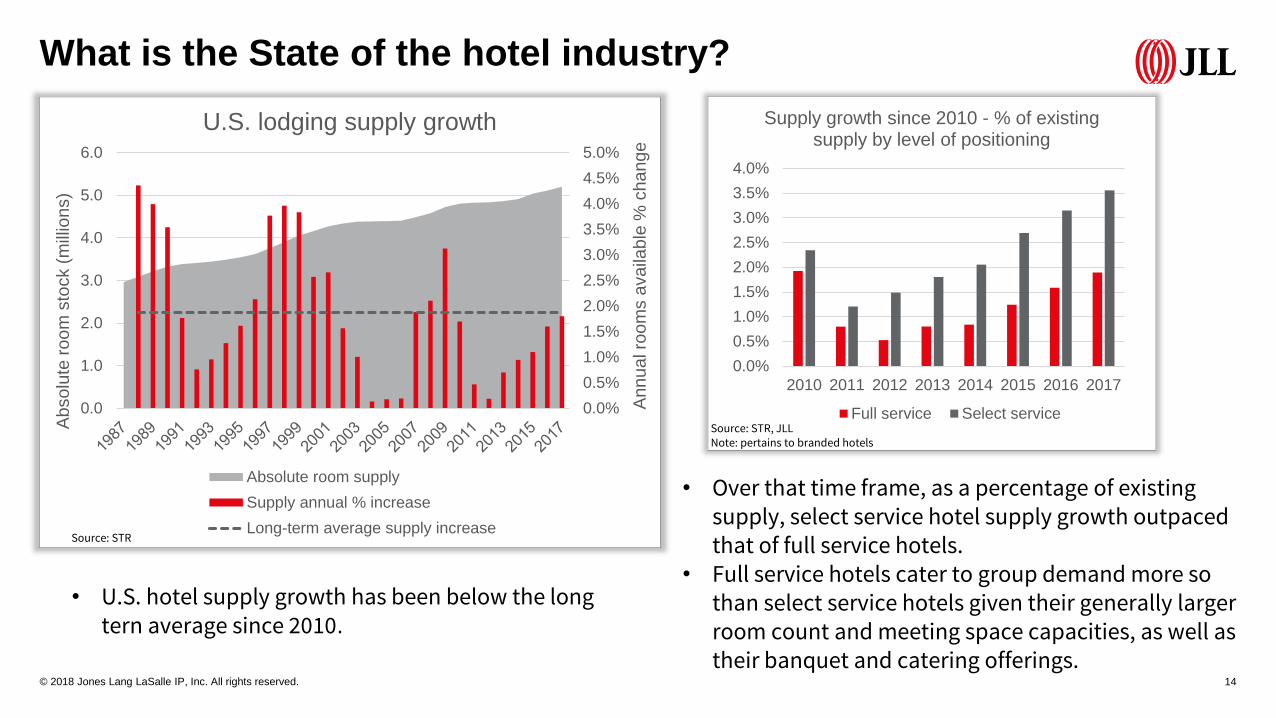
• U.S. hotel supply growth has been below the long tern average since 2010.
• Over that time frame, as a percentage of existing supply, select service hotel supply growth outpaced that of full service hotels.
• Full service hotels cater to group demand more so than select service hotels given their generally larger room count and meeting space capacities, as well as their banquet and catering offerings.
Source: STR
Source: STR, JLLNote: pertains to branded hotels
0.0%
0.5%
1.0%
1.5%
2.0%
2.5%
3.0%
3.5%
4.0%
4.5%
5.0%
0.0
1.0
2.0
3.0
4.0
5.0
6.0
Ann
ua
l ro
om
s a
vaila
ble
% c
ha
ng
e
Absolu
te r
oo
m s
tock (
mill
ion
s)
U.S. lodging supply growth
Absolute room supply
Supply annual % increase
Long-term average supply increase
© 2018 Jones Lang LaSalle IP, Inc. All rights reserved. 15
What is the State of the hotel industry?
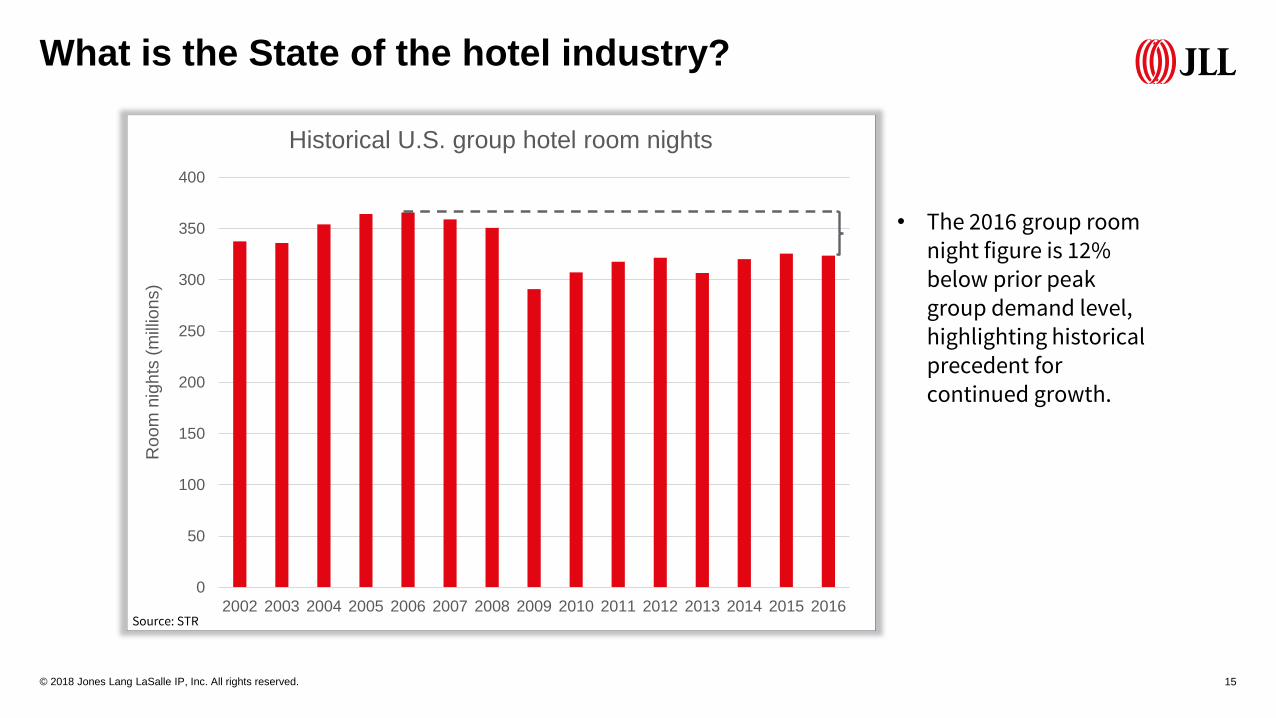
• The 2016 group room night figure is 12%below prior peak group demand level, highlighting historical precedent for continued growth.
0
50
100
150
200
250
300
350
400
2002 2003 2004 2005 2006 2007 2008 2009 2010 2011 2012 2013 2014 2015 2016
Roo
m n
igh
ts (
mill
ion
s)
Historical U.S. group hotel room nights
Source: STR
© 2018 Jones Lang LaSalle IP, Inc. All rights reserved. 16
What is the State of the hotel industry?
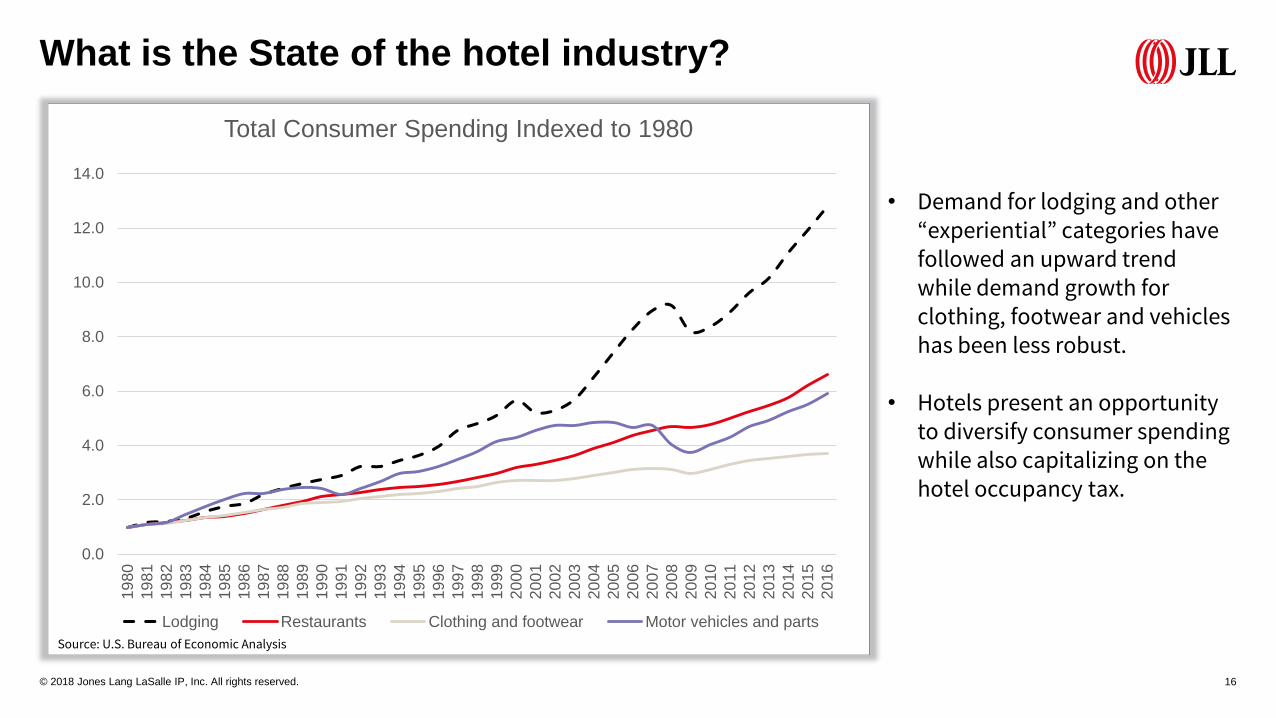
• Demand for lodging and other “experiential” categories have followed an upward trend while demand growth for clothing, footwear and vehicles has been less robust.
• Hotels present an opportunity to diversify consumer spending while also capitalizing on the hotel occupancy tax.
0.0
2.0
4.0
6.0
8.0
10.0
12.0
14.0
19
80
19
81
19
82
19
83
19
84
19
85
19
86
19
87
19
88
19
89
19
90
19
91
19
92
19
93
19
94
19
95
19
96
19
97
19
98
19
99
20
00
20
01
20
02
20
03
20
04
20
05
20
06
20
07
20
08
20
09
20
10
20
11
20
12
20
13
20
14
20
15
20
16
Total Consumer Spending Indexed to 1980
Lodging Restaurants Clothing and footwear Motor vehicles and parts
Source: U.S. Bureau of Economic Analysis
© 2018 Jones Lang LaSalle IP, Inc. All rights reserved. 17
What is the State of the hotel industry?What is the State of the hotel industry?
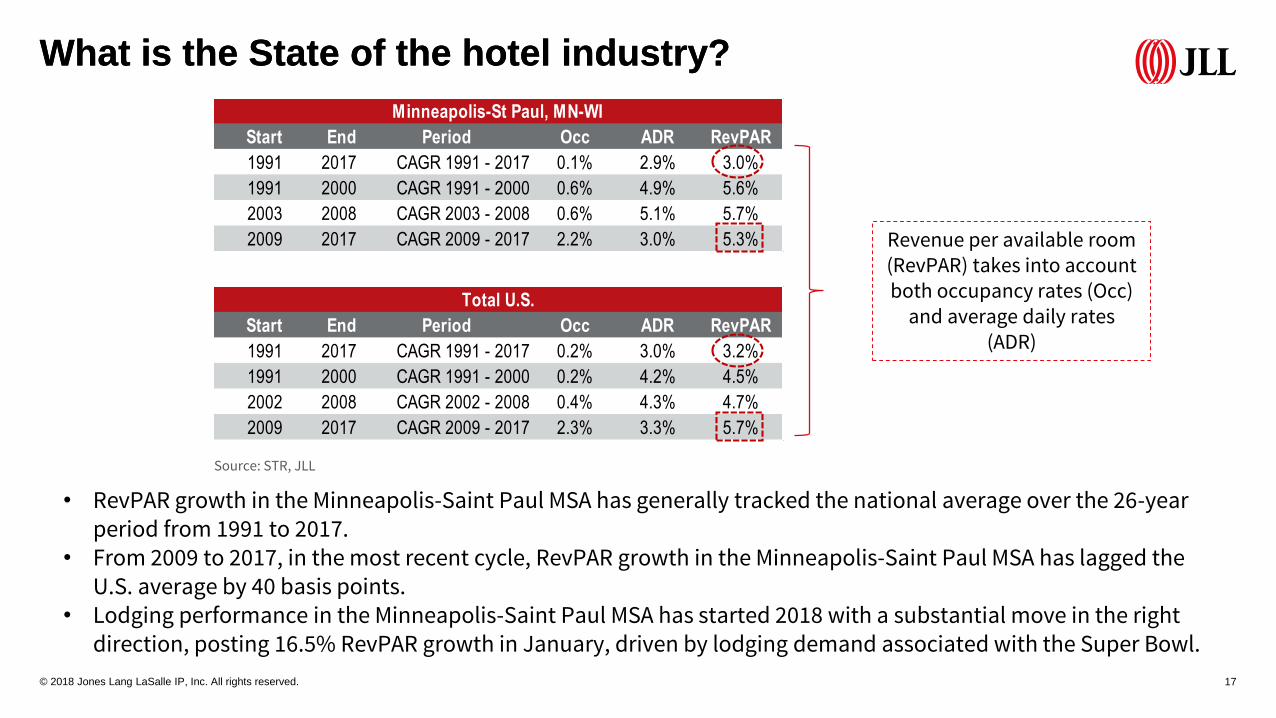
• RevPAR growth in the Minneapolis-Saint Paul MSA has generally tracked the national average over the 26-year period from 1991 to 2017.
• From 2009 to 2017, in the most recent cycle, RevPAR growth in the Minneapolis-Saint Paul MSA has lagged the U.S. average by 40 basis points.
• Lodging performance in the Minneapolis-Saint Paul MSA has started 2018 with a substantial move in the right direction, posting 16.5% RevPAR growth in January, driven by lodging demand associated with the Super Bowl.
Start End Period Occ ADR RevPAR
1991 2017 CAGR 1991 - 2017 0.1% 2.9% 3.0%
1991 2000 CAGR 1991 - 2000 0.6% 4.9% 5.6%
2003 2008 CAGR 2003 - 2008 0.6% 5.1% 5.7%
2009 2017 CAGR 2009 - 2017 2.2% 3.0% 5.3%
Minneapolis-St Paul, MN-WI
Start End Period Occ ADR RevPAR
1991 2017 CAGR 1991 - 2017 0.2% 3.0% 3.2%
1991 2000 CAGR 1991 - 2000 0.2% 4.2% 4.5%
2002 2008 CAGR 2002 - 2008 0.4% 4.3% 4.7%
2009 2017 CAGR 2009 - 2017 2.3% 3.3% 5.7%
Total U.S.
Source: STR, JLL
Revenue per available room (RevPAR) takes into account both occupancy rates (Occ)
and average daily rates (ADR)

© 2018 Jones Lang LaSalle IP, Inc. All rights reserved. 18
What is the State of the hotel industry?What is the State of the hotel industry?
0.0%
10.0%
20.0%
30.0%
40.0%
50.0%
60.0%
70.0%
80.0%
0
100,000
200,000
300,000
400,000
500,000
600,000
700,000
2000 2001 2002 2003 2004 2005 2006 2007 2008 2009 2010 2011 2012 2013 2014 2015 2016
Occup
an
cy r
ate
Sup
ply
(ro
om
nig
hts
)Saint Paul historical supply and occupancy rates
Supply (roomnights) OccupancySource: STRNote: JLL shows data through 2017 where available
Compound annual growth rates (CAGR)
Supply CAGR 2000 - 2016 1.2%
Demand CAGR 2000 - 2016 1.2%
Do Convention Hotels impact existing hotels?
© 2018 Jones Lang LaSalle IP, Inc. All rights reserved. 20
Do Convention Hotels impact existing hotels?
0.0%
10.0%
20.0%
30.0%
40.0%
50.0%
60.0%
0%
10%
20%
30%
40%
50%
60%A
nn
ua
l % c
ha
ng
e
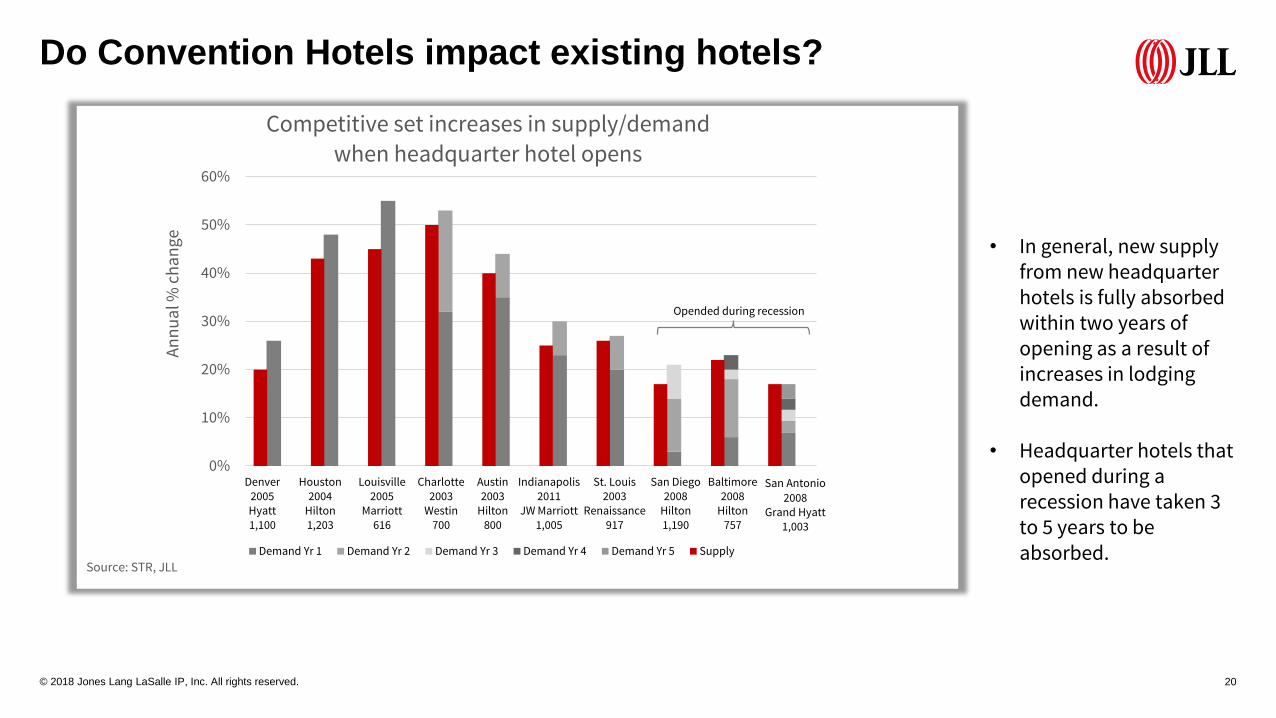
Competitive set increases in supply/demand
when headquarter hotel opens
Demand Yr 1 Demand Yr 2 Demand Yr 3 Demand Yr 4 Demand Yr 5 Supply
Source: STR, JLL
Denver2005Hyatt1,100
Houston2004
Hilton1,203
Louisville2005
Marriott616
Charlotte2003
Westin700
Austin2003
Hilton800
Indianapolis2011
JW Marriott1,005
St. Louis2003
Renaissance917
San Diego2008
Hilton1,190
Baltimore2008
Hilton757
San Antonio2008
Grand Hyatt1,003
Opended during recession
• In general, new supply from new headquarter hotels is fully absorbed within two years of opening as a result of increases in lodging demand.
• Headquarter hotels that opened during a recession have taken 3 to 5 years to be absorbed.
© 2018 Jones Lang LaSalle IP, Inc. All rights reserved. 21
Do Convention Hotels impact existing hotels?
$153
$172
$124
$0
$20
$40
$60
$80
$100
$120
$140
$160
$180
$200
2000 2001 2002 2003 2004 2005 2006 2007 2008 2009 2010 2011 2012 2013 2014 2015 2016
AD
R
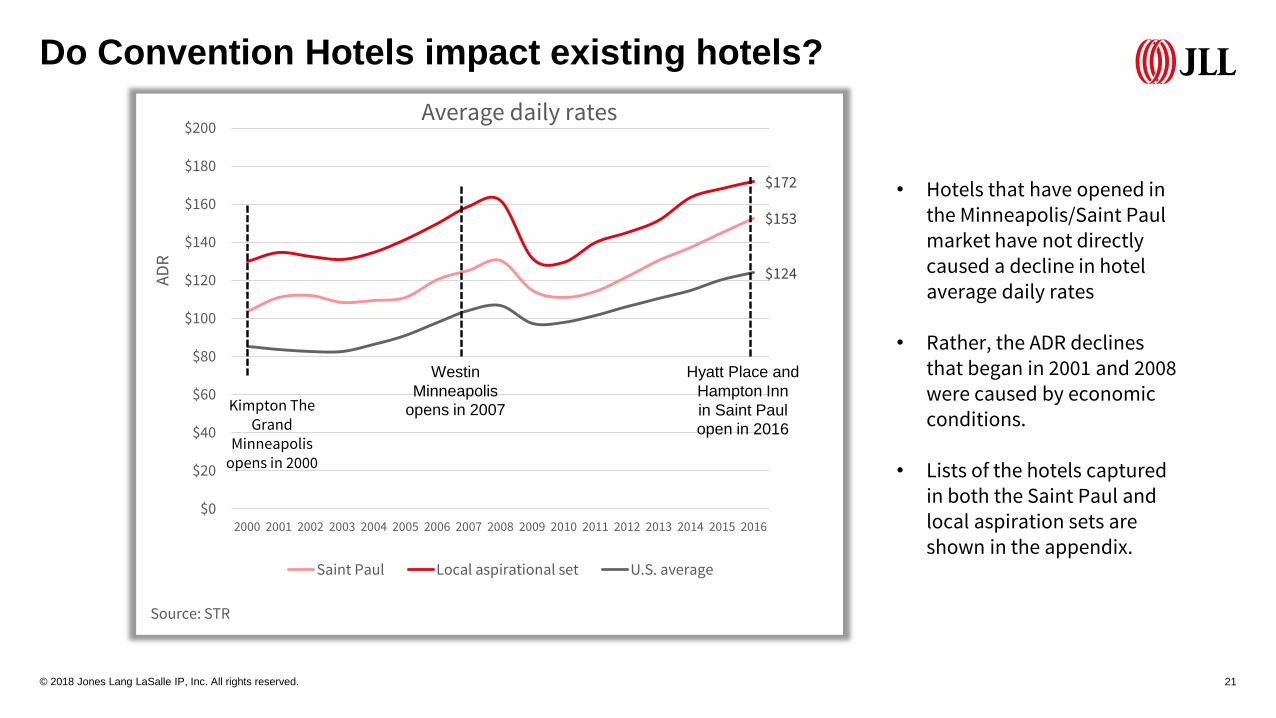
Average daily rates
Saint Paul Local aspirational set U.S. average
Kimpton The Grand
Minneapolis opens in 2000
Hyatt Place and
Hampton Inn
in Saint Paul
open in 2016
Westin
Minneapolis
opens in 2007
Source: STR
• Hotels that have opened in the Minneapolis/Saint Paul market have not directly caused a decline in hotel average daily rates
• Rather, the ADR declines that began in 2001 and 2008 were caused by economic conditions.
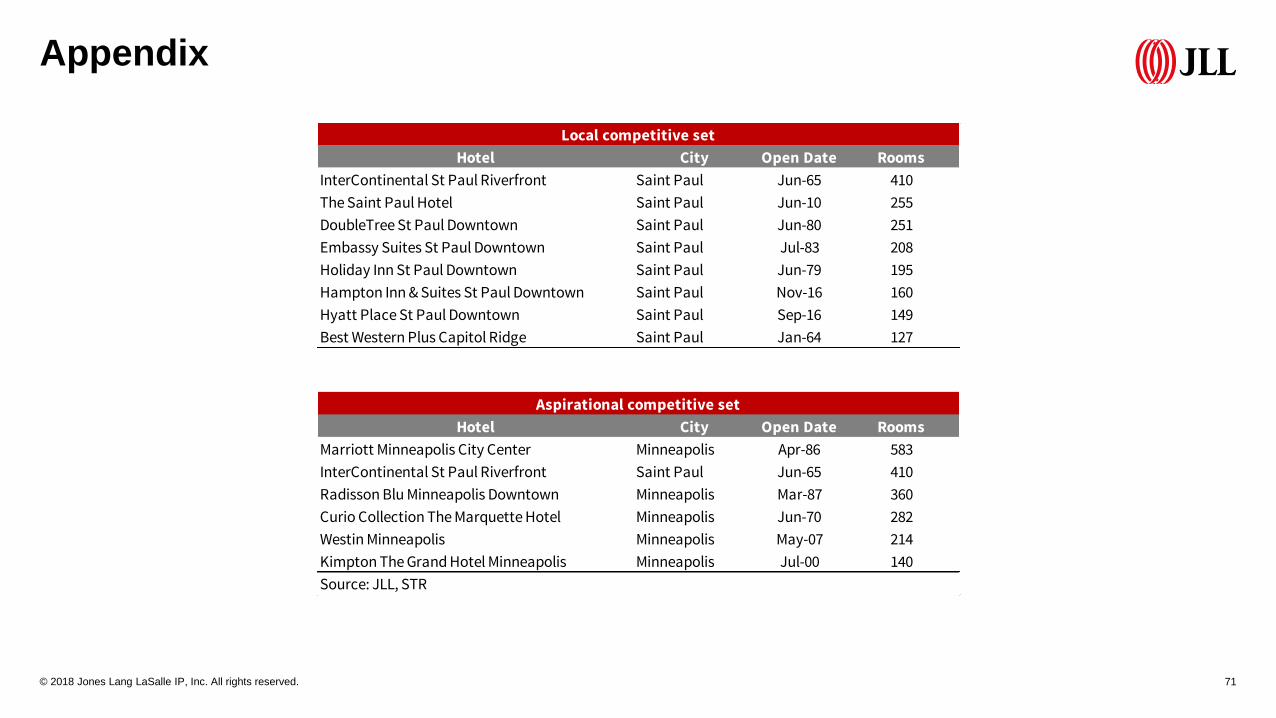
• Lists of the hotels captured in both the Saint Paul and local aspiration sets are shown in the appendix.

Is the Saint Paul RiverCentre achieving its goals?

© 2018 Jones Lang LaSalle IP, Inc. All rights reserved. 23
Is the Saint Paul RiverCentre achieving its goals?
Visit Saint Paul Mission Statement:
Visit Saint Paul is the official convention & visitors bureau for
Minnesota's capital city of Saint Paul.
The mission of the organization is to generate economic
growth for Saint Paul by effectively marketing the
RiverCentre campus, Saint Paul and the region as a
preferred convention and tourism destination.
© 2018 Jones Lang LaSalle IP, Inc. All rights reserved. 24
Is the Saint Paul RiverCentre achieving its goals?
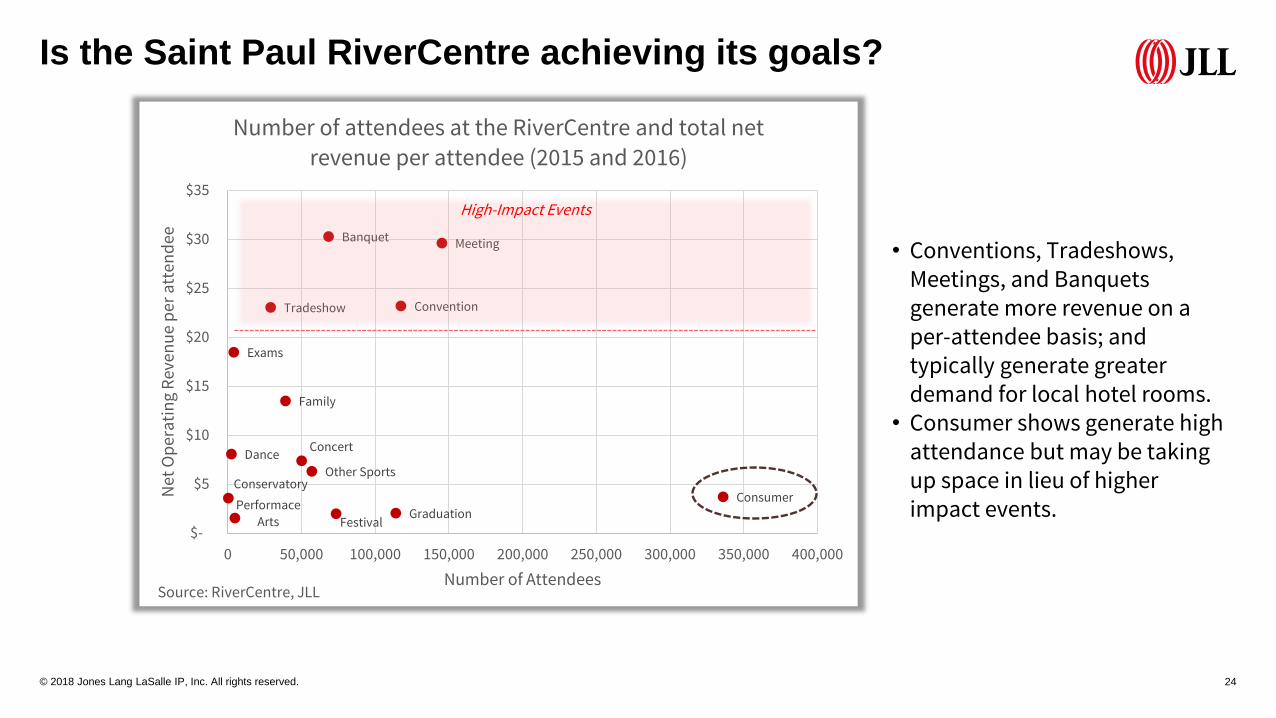
• Conventions, Tradeshows, Meetings, and Banquets generate more revenue on a per-attendee basis; and typically generate greater demand for local hotel rooms.
• Consumer shows generate high attendance but may be taking up space in lieu of higher impact events.
Consumer
Meeting
Convention
GraduationFestival
Banquet
Other Sports
Concert
Family
Tradeshow
Performace
Arts
Exams
Dance
Conservatory
$-
$5
$10
$15
$20
$25
$30
$35
0 50,000 100,000 150,000 200,000 250,000 300,000 350,000 400,000
Net
Op
era
tin
g R
even
ue
per
att
end
ee
Number of Attendees
Number of attendees at the RiverCentre and total net
revenue per attendee (2015 and 2016)
Source: RiverCentre, JLL
High-Impact Events

© 2018 Jones Lang LaSalle IP, Inc. All rights reserved. 25
Is the Saint Paul RiverCentre achieving its goals?
49%
15%
8%
5%
4%
4%
4%
3%
2% 2% 2%1% 1%
Mix of events at the RiverCentre (2015 - 2016)
Meeting Banquet Other Sports Consumer Concert
Tradeshow Family Graduation Performace Arts Conservatory
Convention Exams Dance
• Shown differently, almost three out of every four events in the RiverCentre are high-impact.
Source: RiverCentre, JLL
© 2018 Jones Lang LaSalle IP, Inc. All rights reserved. 26
Is the Saint Paul RiverCentre achieving its goals?
0%
10%
20%
30%
40%
50%
60%
70%
80%1/
1/20
15
2/1/
2015
3/1/
2015
4/1/
2015
5/1/
2015
6/1/
2015
7/1/
2015
8/1/
2015
9/1/
2015
10/1
/201
5
11/1
/201
5
12/1
/201
5
1/1/
2016
2/1/
2016
3/1/
2016
4/1/
2016
5/1/
2016
6/1/
2016
7/1/
2016
8/1/
2016
9/1/
2016
10/1
/201
6
11/1
/201
6
12/1
/201
6
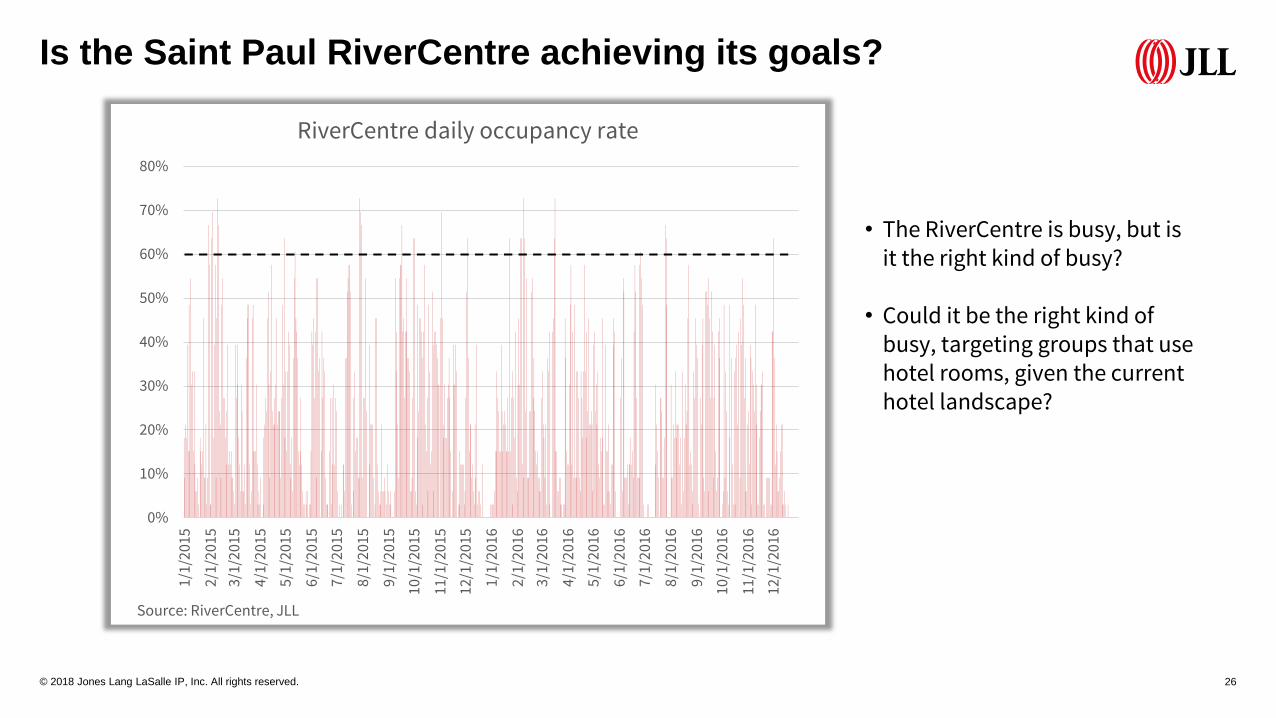
RiverCentre daily occupancy rate
Source: RiverCentre, JLL
• The RiverCentre is busy, but is it the right kind of busy?
• Could it be the right kind of busy, targeting groups that use hotel rooms, given the current hotel landscape?
© 2018 Jones Lang LaSalle IP, Inc. All rights reserved. 27
Is the Saint Paul RiverCentre achieving its goals?
0%
10%
20%
30%
40%
50%
60%
70%
80%
Meeting rooms Ballrooms Exhibit halls Roy Wilkins Studios Total
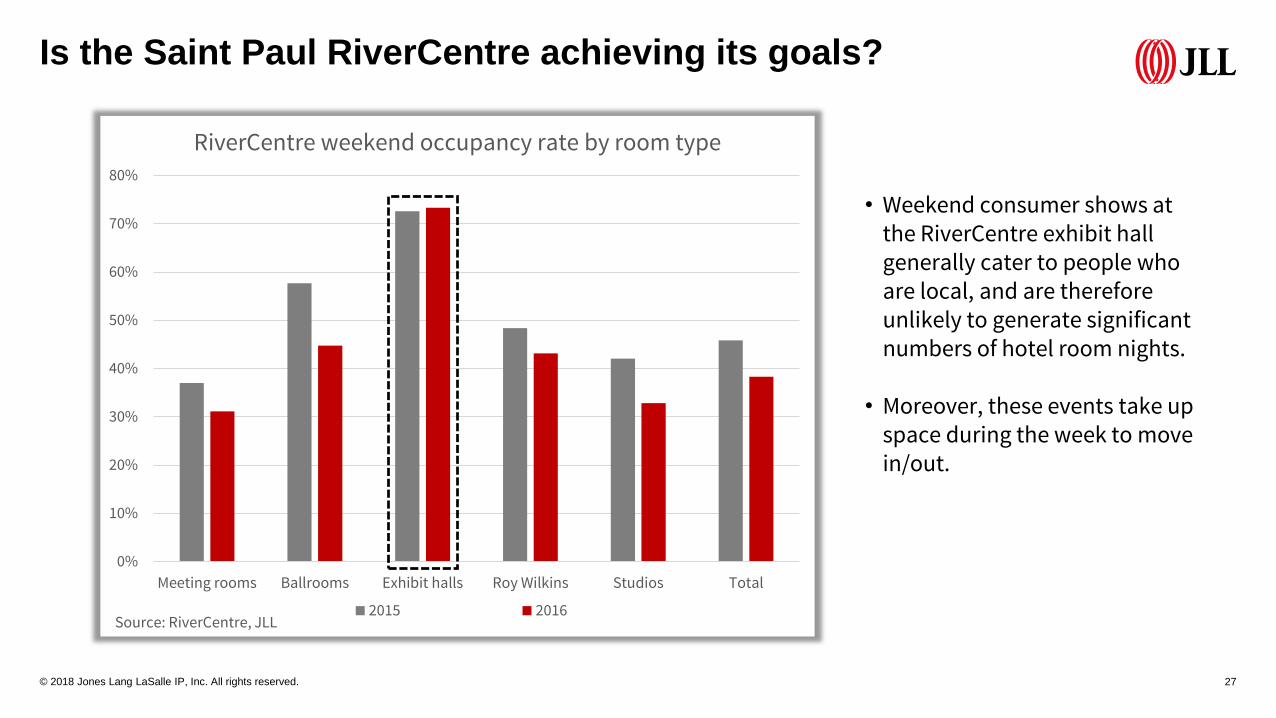
RiverCentre weekend occupancy rate by room type
2015 2016Source: RiverCentre, JLL
• Weekend consumer shows at the RiverCentre exhibit hall generally cater to people who are local, and are therefore unlikely to generate significant numbers of hotel room nights.
• Moreover, these events take up space during the week to move in/out.
© 2018 Jones Lang LaSalle IP, Inc. All rights reserved. 28
Is the Saint Paul RiverCentre achieving its goals?
0%
10%
20%
30%
40%
50%
60%
Meeting rooms Ballrooms Exhibit halls Roy Wilkins Studios Total
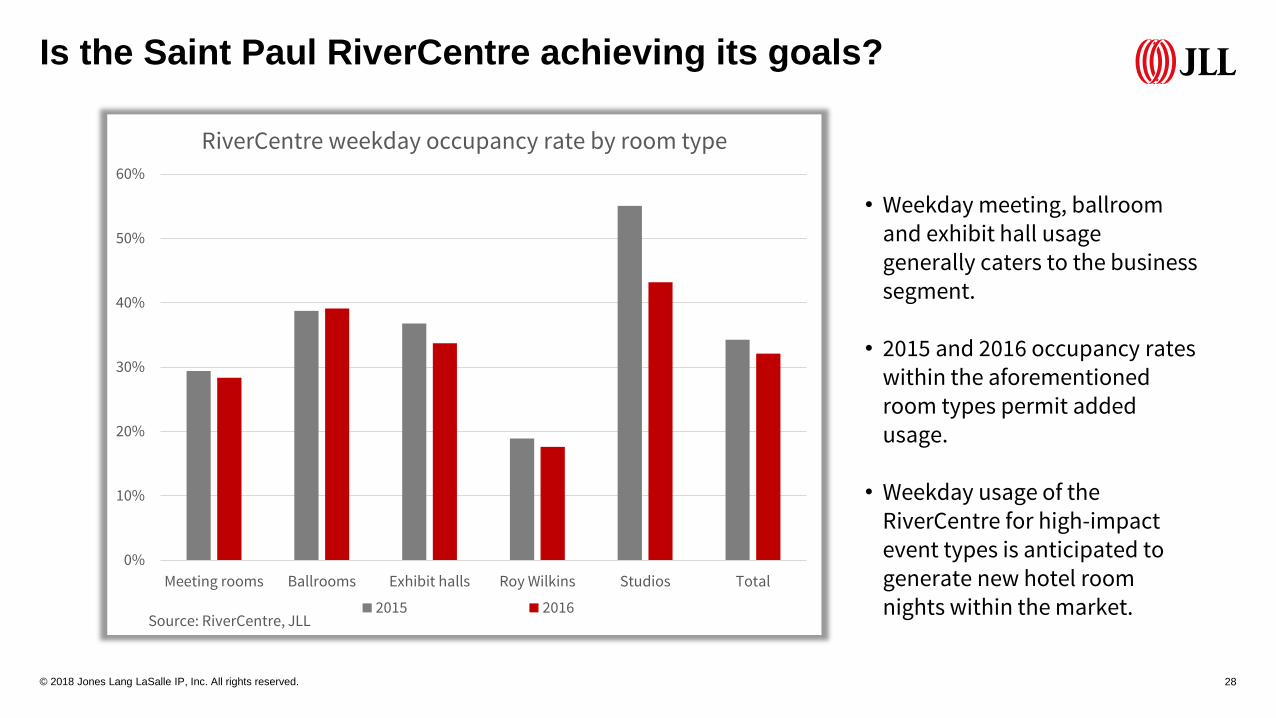
RiverCentre weekday occupancy rate by room type
2015 2016Source: RiverCentre, JLL
• Weekday meeting, ballroom and exhibit hall usage generally caters to the business segment.
• 2015 and 2016 occupancy rates within the aforementioned room types permit added usage.
• Weekday usage of the RiverCentre for high-impact event types is anticipated to generate new hotel room nights within the market.
© 2018 Jones Lang LaSalle IP, Inc. All rights reserved. 29
Is the Saint Paul RiverCentre achieving its goals?
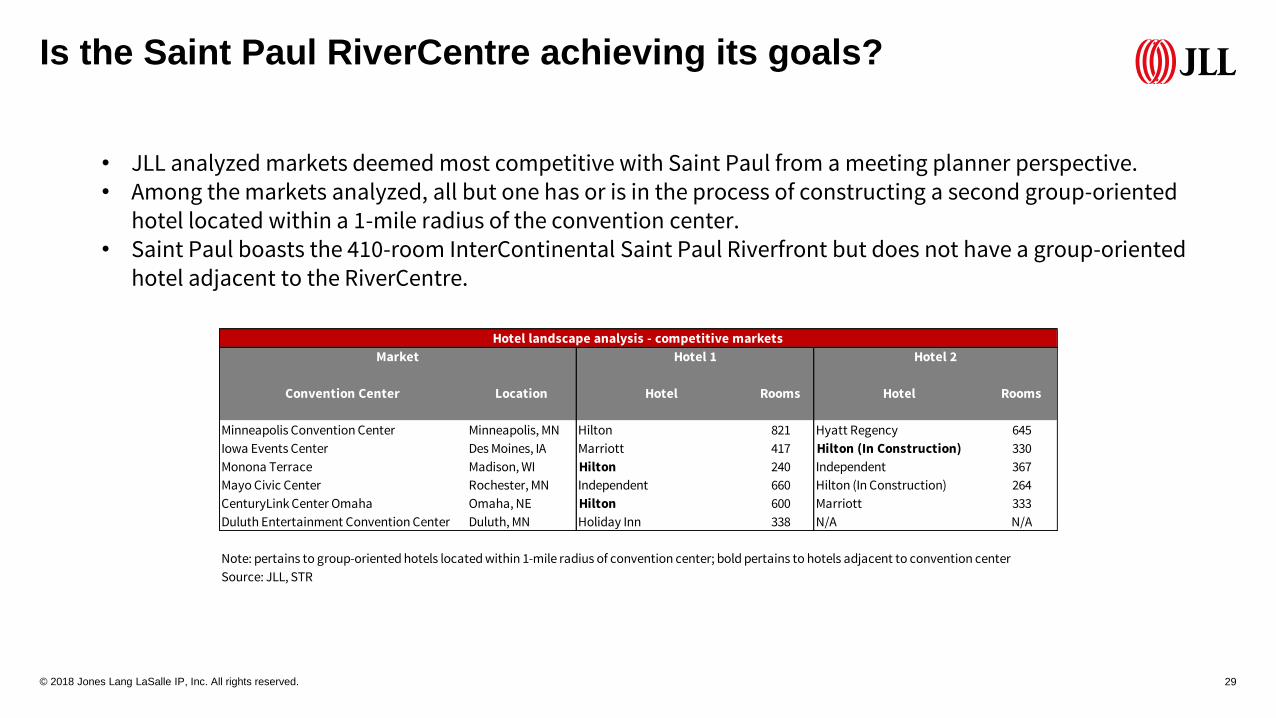
• JLL analyzed markets deemed most competitive with Saint Paul from a meeting planner perspective.• Among the markets analyzed, all but one has or is in the process of constructing a second group-oriented
hotel located within a 1-mile radius of the convention center.• Saint Paul boasts the 410-room InterContinental Saint Paul Riverfront but does not have a group-oriented
hotel adjacent to the RiverCentre.
Convention Center Location Hotel Rooms Hotel Rooms
Minneapolis Convention Center Minneapolis, MN Hilton 821 Hyatt Regency 645
Iowa Events Center Des Moines, IA Marriott 417 Hilton (In Construction) 330
Monona Terrace Madison, WI Hilton 240 Independent 367
Mayo Civic Center Rochester, MN Independent 660 Hilton (In Construction) 264
CenturyLink Center Omaha Omaha, NE Hilton 600 Marriott 333
Duluth Entertainment Convention Center Duluth, MN Holiday Inn 338 N/A N/A
Note: pertains to group-oriented hotels located within 1-mile radius of convention center; bold pertains to hotels adjacent to convention center
Source: JLL, STR
Hotel landscape analysis - competitive markets
Hotel 1Market Hotel 2
© 2018 Jones Lang LaSalle IP, Inc. All rights reserved. 30
Is the Saint Paul RiverCentre achieving its goals?
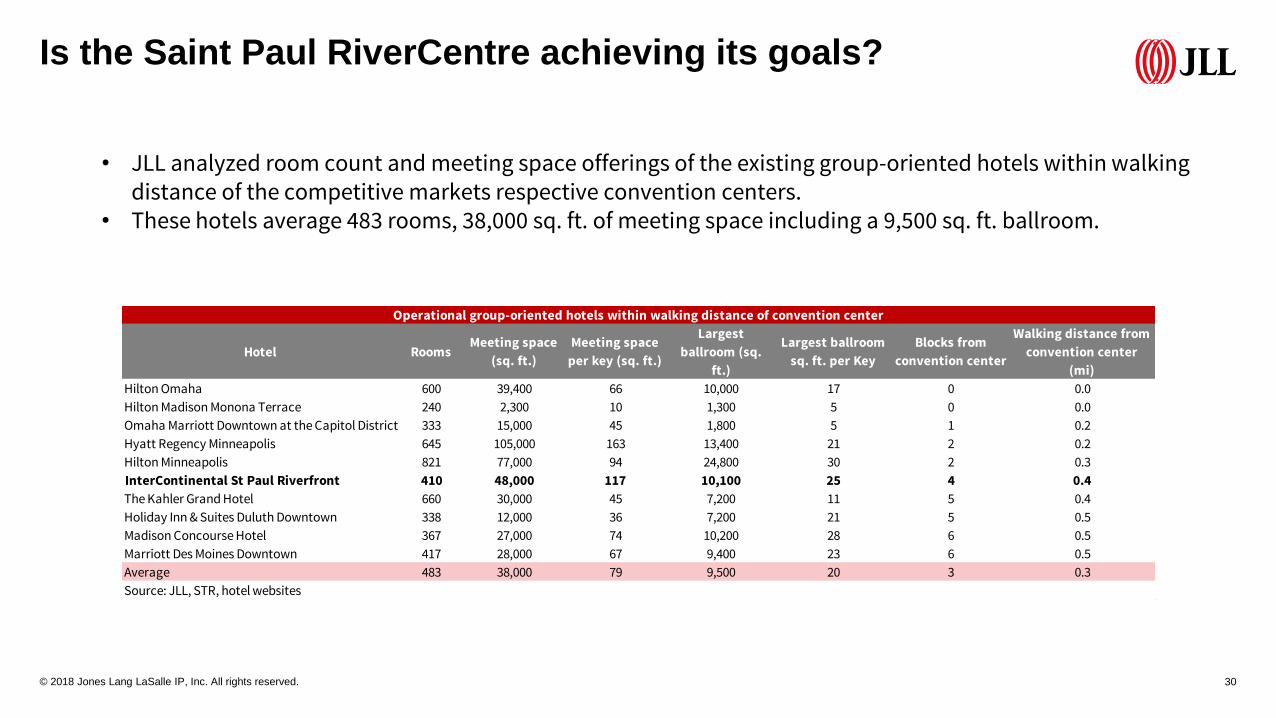
• JLL analyzed room count and meeting space offerings of the existing group-oriented hotels within walking distance of the competitive markets respective convention centers.
• These hotels average 483 rooms, 38,000 sq. ft. of meeting space including a 9,500 sq. ft. ballroom.
Hotel RoomsMeeting space
(sq. ft.)
Meeting space
per key (sq. ft.)
Largest
ballroom (sq.
ft.)
Largest ballroom
sq. ft. per Key
Blocks from
convention center
Walking distance from
convention center
(mi)
Hilton Omaha 600 39,400 66 10,000 17 0 0.0
Hilton Madison Monona Terrace 240 2,300 10 1,300 5 0 0.0
Omaha Marriott Downtown at the Capitol District 333 15,000 45 1,800 5 1 0.2
Hyatt Regency Minneapolis 645 105,000 163 13,400 21 2 0.2
Hilton Minneapolis 821 77,000 94 24,800 30 2 0.3
InterContinental St Paul Riverfront 410 48,000 117 10,100 25 4 0.4
The Kahler Grand Hotel 660 30,000 45 7,200 11 5 0.4
Holiday Inn & Suites Duluth Downtown 338 12,000 36 7,200 21 5 0.5
Madison Concourse Hotel 367 27,000 74 10,200 28 6 0.5
Marriott Des Moines Downtown 417 28,000 67 9,400 23 6 0.5
Average 483 38,000 79 9,500 20 3 0.3
Source: JLL, STR, hotel websites
Operational group-oriented hotels within walking distance of convention center
© 2018 Jones Lang LaSalle IP, Inc. All rights reserved. 31
Is the Saint Paul RiverCentre achieving its goals?
9491 90
71
62
4744
32
0
10
20
30
40
50
60
70
80
90
100
Wa
lk S
core
s®
Convention Center Walk Scores®
Source: walkscore.com
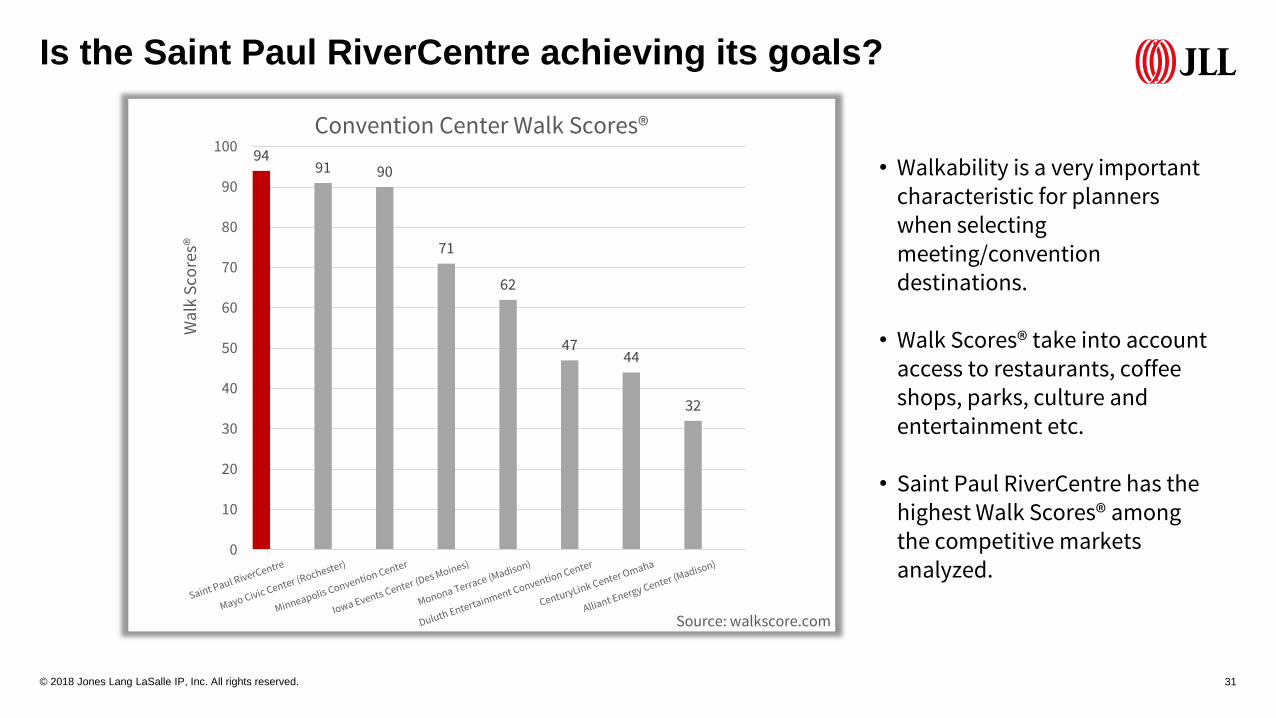
• Walkability is a very important characteristic for planners when selecting meeting/convention destinations.
• Walk Scores® take into account access to restaurants, coffee shops, parks, culture and entertainment etc.
• Saint Paul RiverCentre has the highest Walk Scores® among the competitive markets analyzed.
© 2018 Jones Lang LaSalle IP, Inc. All rights reserved. 32
Is the Saint Paul RiverCentre achieving its goals?
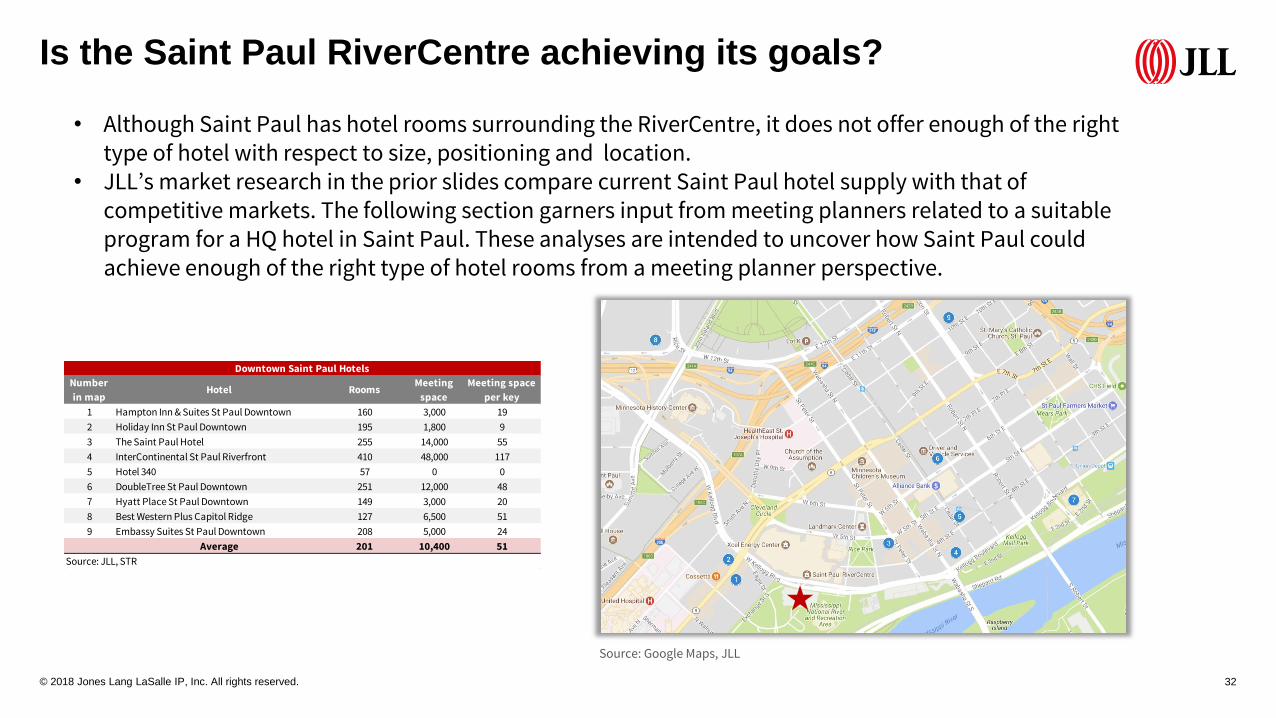
• Although Saint Paul has hotel rooms surrounding the RiverCentre, it does not offer enough of the right type of hotel with respect to size, positioning and location.
• JLL’s market research in the prior slides compare current Saint Paul hotel supply with that of competitive markets. The following section garners input from meeting planners related to a suitable program for a HQ hotel in Saint Paul. These analyses are intended to uncover how Saint Paul could achieve enough of the right type of hotel rooms from a meeting planner perspective.
Number
in mapHotel Rooms
Meeting
space
Meeting space
per key
1 Hampton Inn & Suites St Paul Downtown 160 3,000 19
2 Holiday Inn St Paul Downtown 195 1,800 9
3 The Saint Paul Hotel 255 14,000 55
4 InterContinental St Paul Riverfront 410 48,000 117
5 Hotel 340 57 0 0
6 DoubleTree St Paul Downtown 251 12,000 48
7 Hyatt Place St Paul Downtown 149 3,000 20
8 Best Western Plus Capitol Ridge 127 6,500 51
9 Embassy Suites St Paul Downtown 208 5,000 24
Average 201 10,400 51
Source: JLL, STR
Downtown Saint Paul Hotels
Source: Google Maps, JLL
Does RiverCentre Hotel make a difference in Saint Paul?
© 2018 Jones Lang LaSalle IP, Inc. All rights reserved. 34
Does RiverCentre Hotel make a difference in Saint Paul?
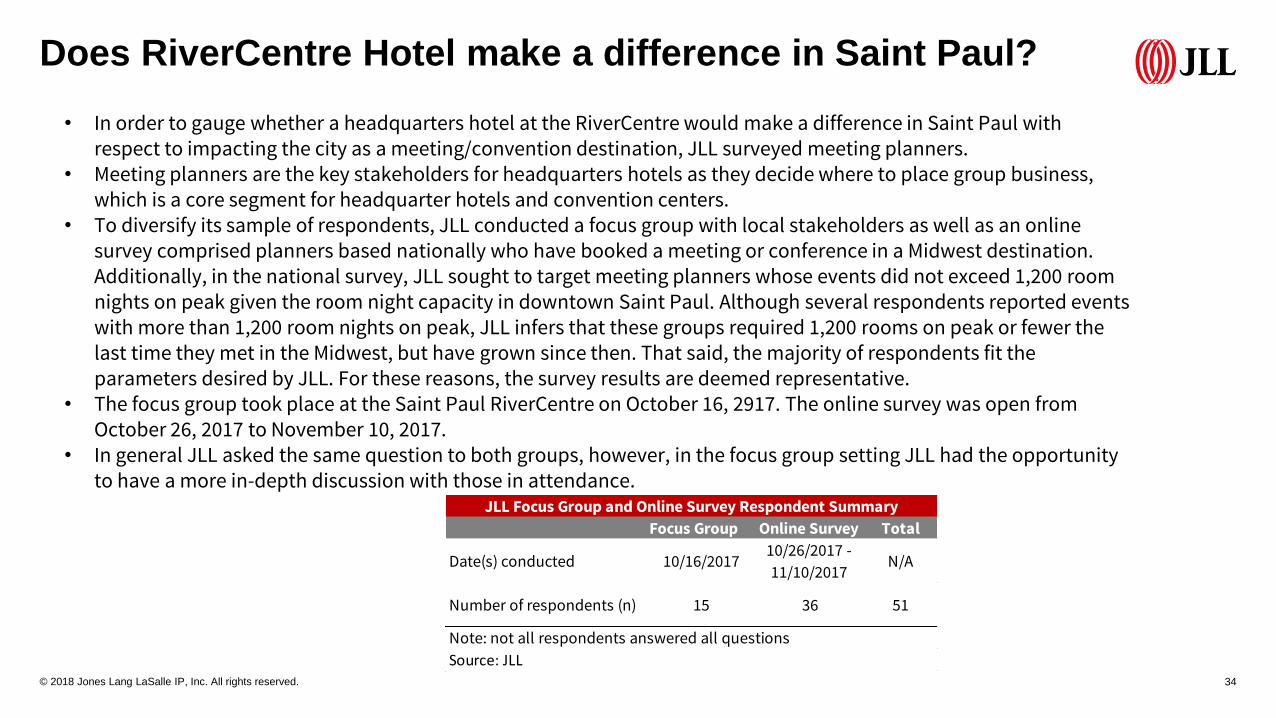
• In order to gauge whether a headquarters hotel at the RiverCentre would make a difference in Saint Paul with respect to impacting the city as a meeting/convention destination, JLL surveyed meeting planners.
• Meeting planners are the key stakeholders for headquarters hotels as they decide where to place group business, which is a core segment for headquarter hotels and convention centers.
• To diversify its sample of respondents, JLL conducted a focus group with local stakeholders as well as an online survey comprised planners based nationally who have booked a meeting or conference in a Midwest destination. Additionally, in the national survey, JLL sought to target meeting planners whose events did not exceed 1,200 room nights on peak given the room night capacity in downtown Saint Paul. Although several respondents reported events with more than 1,200 room nights on peak, JLL infers that these groups required 1,200 rooms on peak or fewer the last time they met in the Midwest, but have grown since then. That said, the majority of respondents fit the parameters desired by JLL. For these reasons, the survey results are deemed representative.
• The focus group took place at the Saint Paul RiverCentre on October 16, 2917. The online survey was open from October 26, 2017 to November 10, 2017.
• In general JLL asked the same question to both groups, however, in the focus group setting JLL had the opportunity to have a more in-depth discussion with those in attendance.
Focus Group Online Survey Total
Date(s) conducted 10/16/201710/26/2017 -
11/10/2017N/A
Number of respondents (n) 15 36 51
Note: not all respondents answered all questions
Source: JLL
JLL Focus Group and Online Survey Respondent Summary
© 2018 Jones Lang LaSalle IP, Inc. All rights reserved. 35
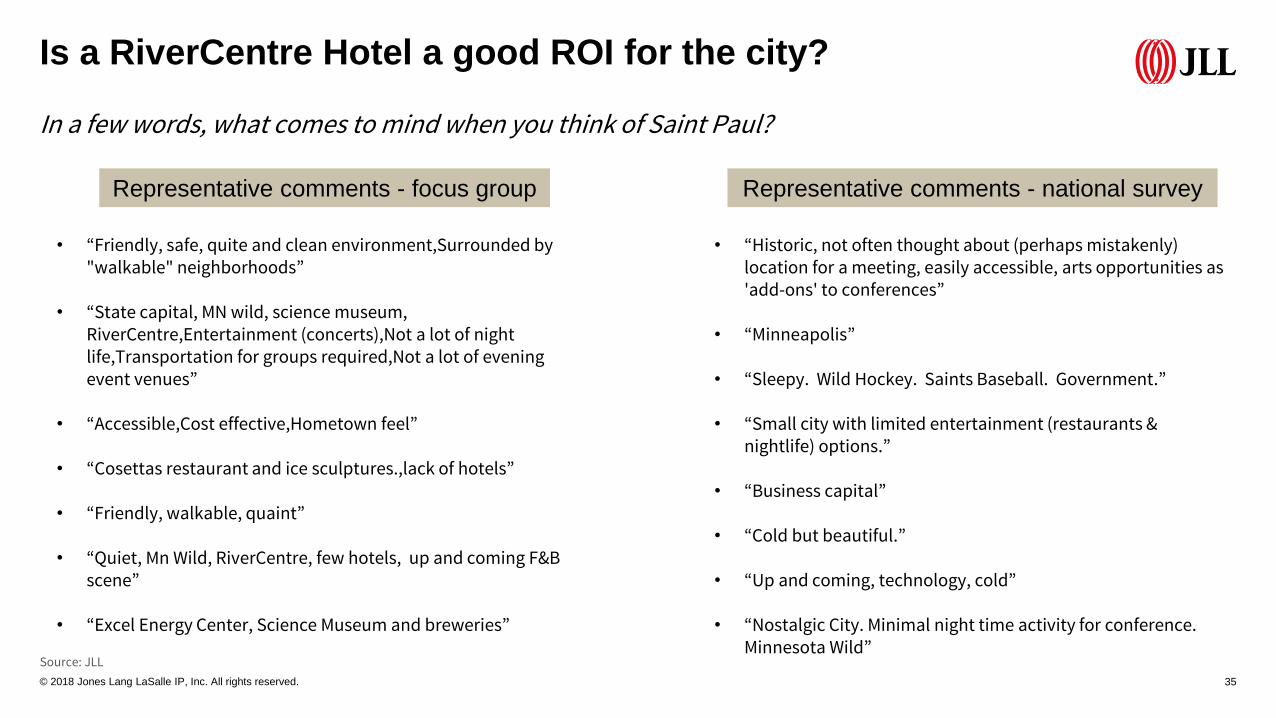
In a few words, what comes to mind when you think of Saint Paul?
• “Friendly, safe, quite and clean environment,Surrounded by "walkable" neighborhoods”
• “State capital, MN wild, science museum, RiverCentre,Entertainment (concerts),Not a lot of night life,Transportation for groups required,Not a lot of evening event venues”
• “Accessible,Cost effective,Hometown feel”
• “Cosettas restaurant and ice sculptures.,lack of hotels”
• “Friendly, walkable, quaint”
• “Quiet, Mn Wild, RiverCentre, few hotels, up and coming F&B scene”
• “Excel Energy Center, Science Museum and breweries”
• “Historic, not often thought about (perhaps mistakenly) location for a meeting, easily accessible, arts opportunities as 'add-ons' to conferences”
• “Minneapolis”
• “Sleepy. Wild Hockey. Saints Baseball. Government.”
• “Small city with limited entertainment (restaurants & nightlife) options.”
• “Business capital”
• “Cold but beautiful.”
• “Up and coming, technology, cold”
• “Nostalgic City. Minimal night time activity for conference. Minnesota Wild”
Representative comments - focus group Representative comments - national survey
Is a RiverCentre Hotel a good ROI for the city?
Source: JLL
© 2018 Jones Lang LaSalle IP, Inc. All rights reserved. 36
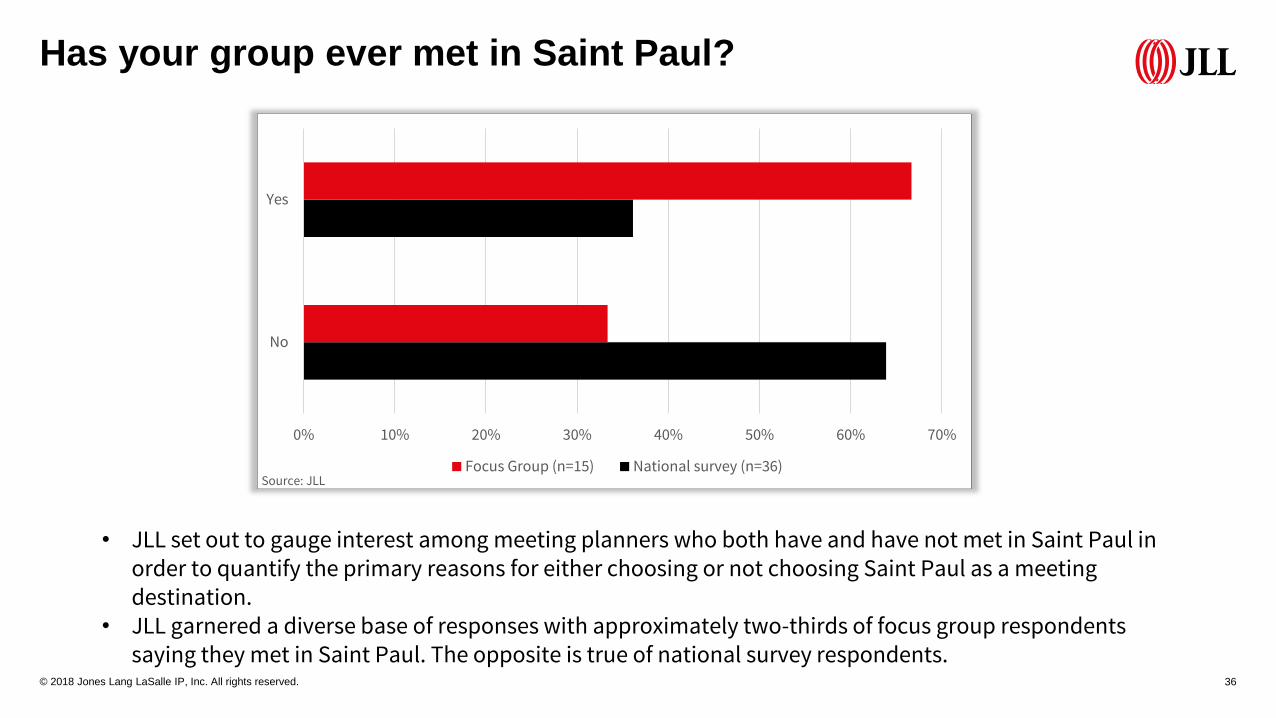
Has your group ever met in Saint Paul?
0% 10% 20% 30% 40% 50% 60% 70%
No
Yes
Focus Group (n=15) National survey (n=36)
• JLL set out to gauge interest among meeting planners who both have and have not met in Saint Paul in order to quantify the primary reasons for either choosing or not choosing Saint Paul as a meeting destination.
• JLL garnered a diverse base of responses with approximately two-thirds of focus group respondents saying they met in Saint Paul. The opposite is true of national survey respondents.
Source: JLL
© 2018 Jones Lang LaSalle IP, Inc. All rights reserved. 37
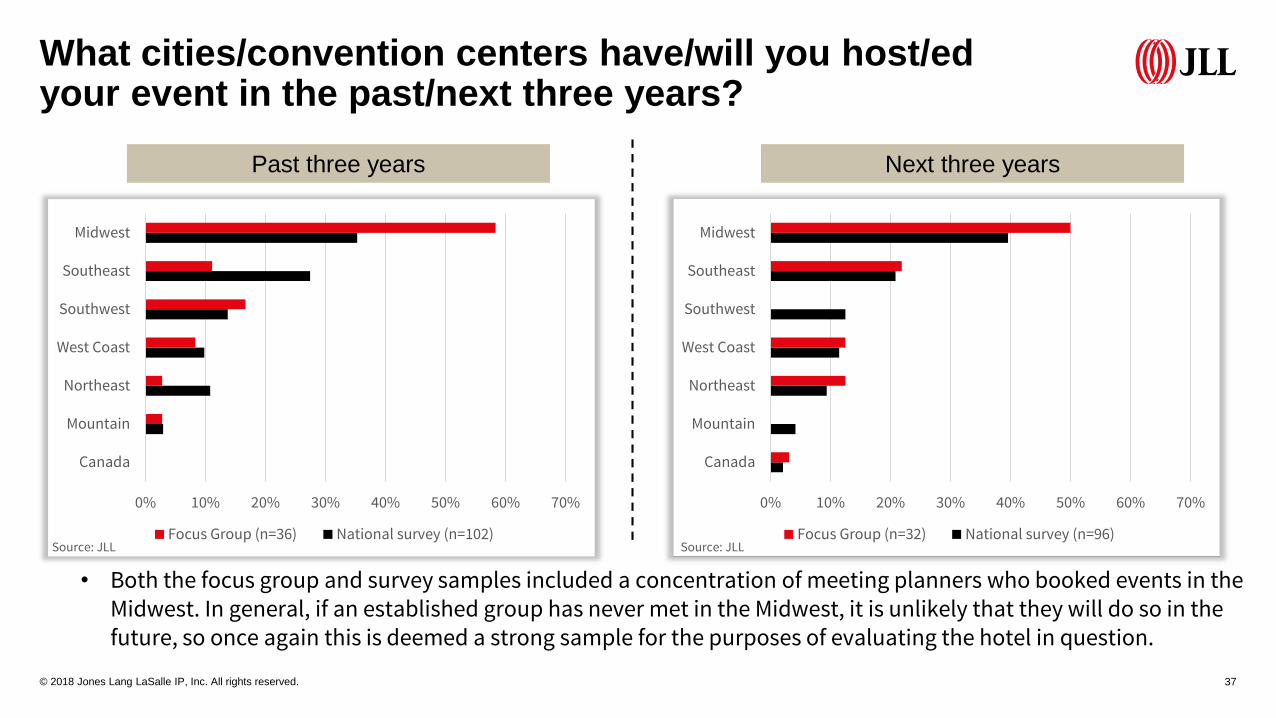
What cities/convention centers have/will you host/edyour event in the past/next three years?
0% 10% 20% 30% 40% 50% 60% 70%
Canada
Mountain
Northeast
West Coast
Southwest
Southeast
Midwest
Focus Group (n=36) National survey (n=102)
0% 10% 20% 30% 40% 50% 60% 70%
Canada
Mountain
Northeast
West Coast
Southwest
Southeast
Midwest
Focus Group (n=32) National survey (n=96)
Past three years Next three years
• Both the focus group and survey samples included a concentration of meeting planners who booked events in the Midwest. In general, if an established group has never met in the Midwest, it is unlikely that they will do so in the future, so once again this is deemed a strong sample for the purposes of evaluating the hotel in question.
Source: JLL Source: JLL
© 2018 Jones Lang LaSalle IP, Inc. All rights reserved. 38
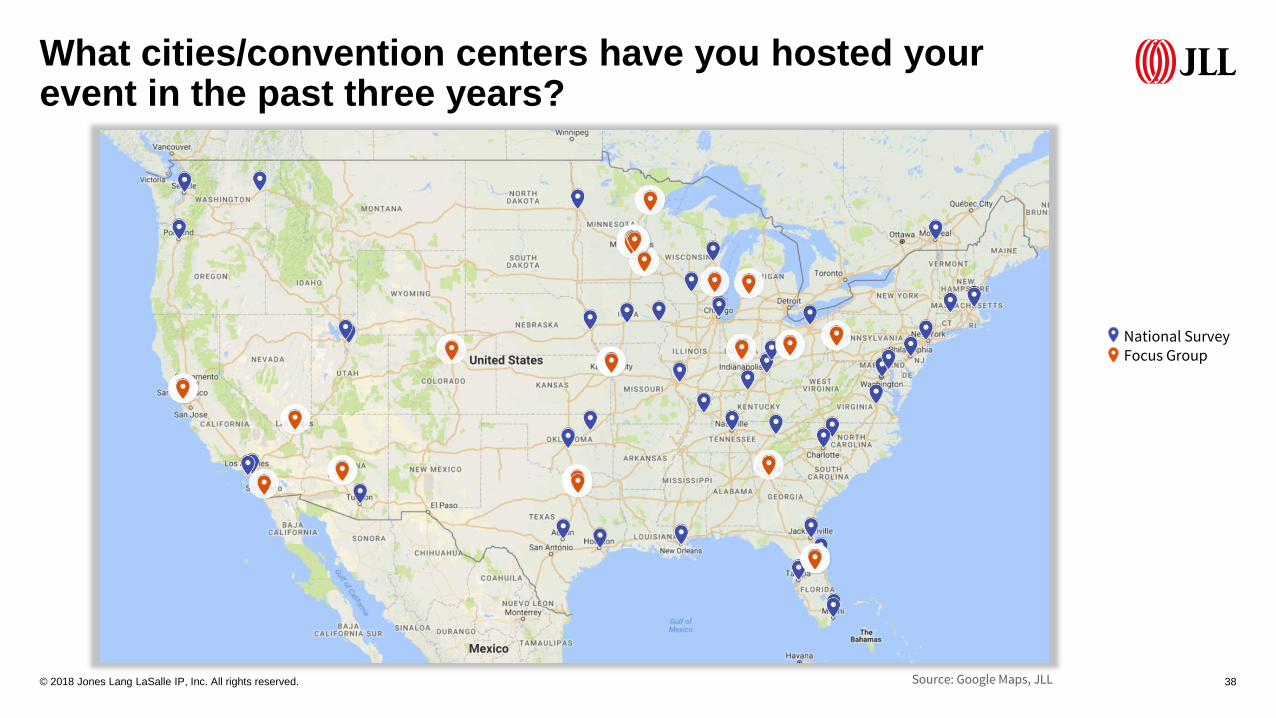
What cities/convention centers have you hosted your event in the past three years?
National SurveyFocus Group
Source: Google Maps, JLL
© 2018 Jones Lang LaSalle IP, Inc. All rights reserved. 39
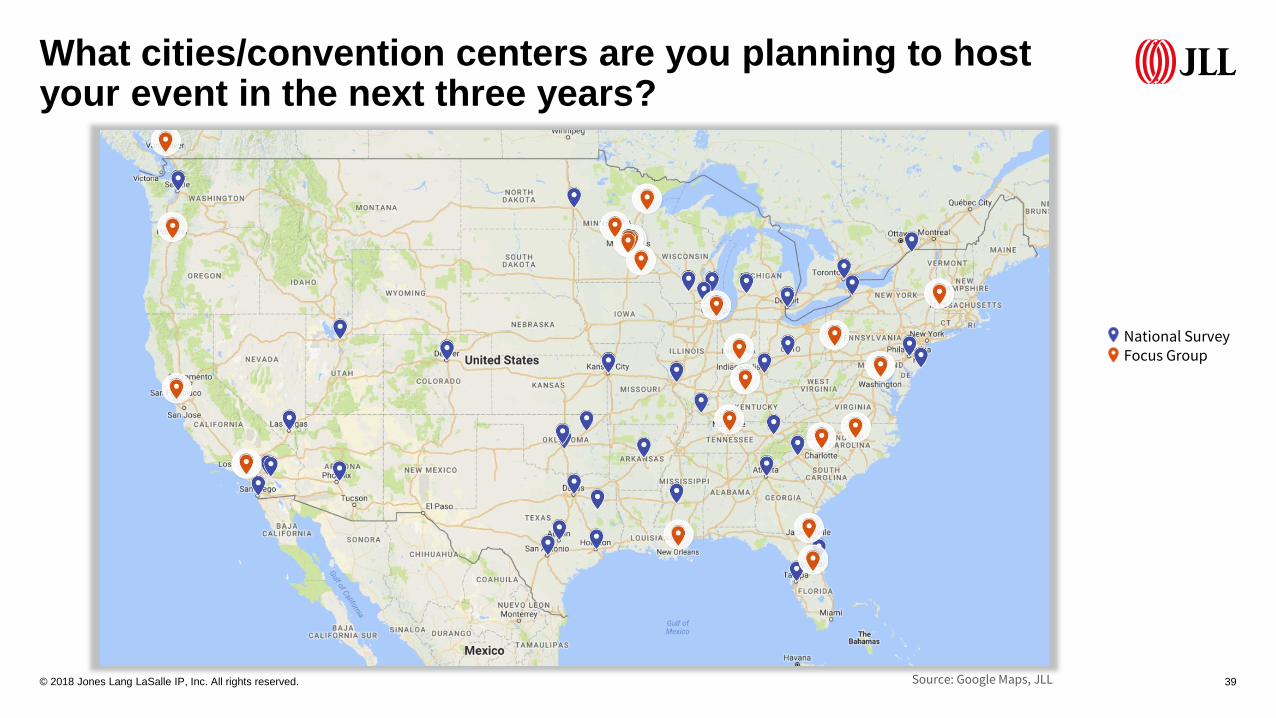
What cities/convention centers are you planning to host your event in the next three years?
National SurveyFocus Group
Source: Google Maps, JLL
© 2018 Jones Lang LaSalle IP, Inc. All rights reserved. 40
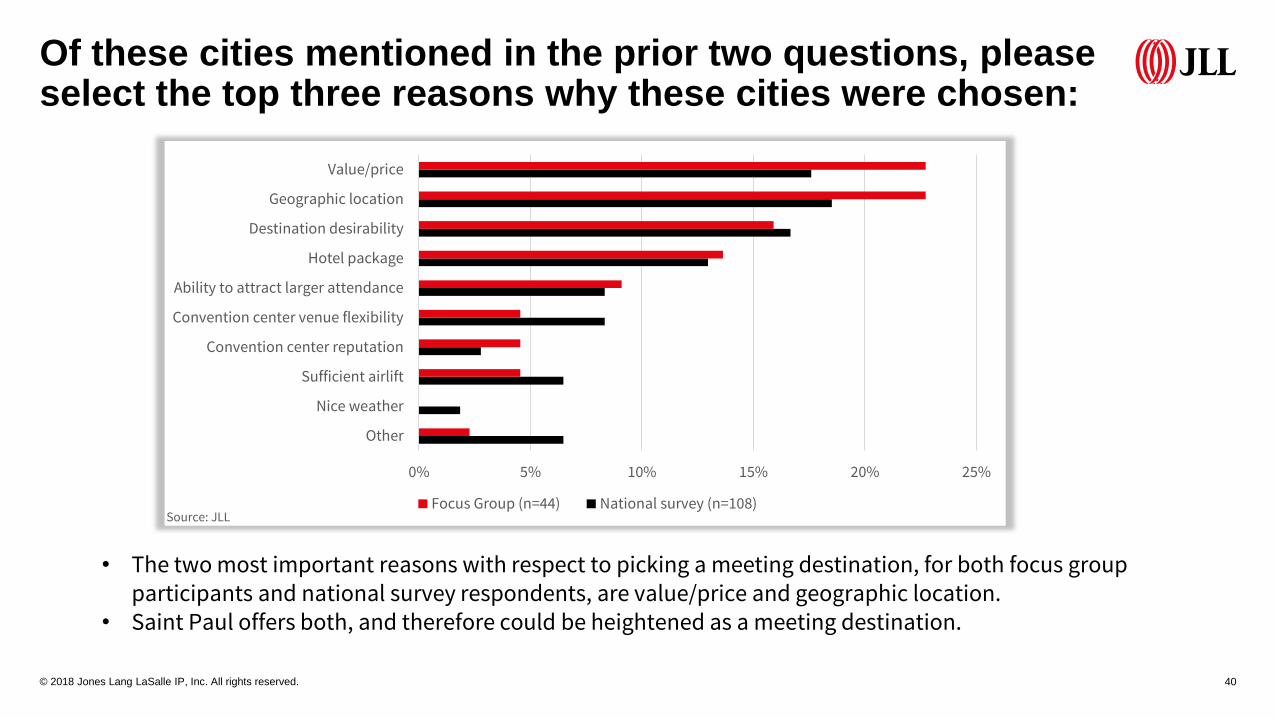
Of these cities mentioned in the prior two questions, please select the top three reasons why these cities were chosen:
0% 5% 10% 15% 20% 25%
Other
Nice weather
Sufficient airlift
Convention center reputation
Convention center venue flexibility
Ability to attract larger attendance
Hotel package
Destination desirability
Geographic location
Value/price
Focus Group (n=44) National survey (n=108)
• The two most important reasons with respect to picking a meeting destination, for both focus group participants and national survey respondents, are value/price and geographic location.
• Saint Paul offers both, and therefore could be heightened as a meeting destination.
Source: JLL
© 2018 Jones Lang LaSalle IP, Inc. All rights reserved. 41
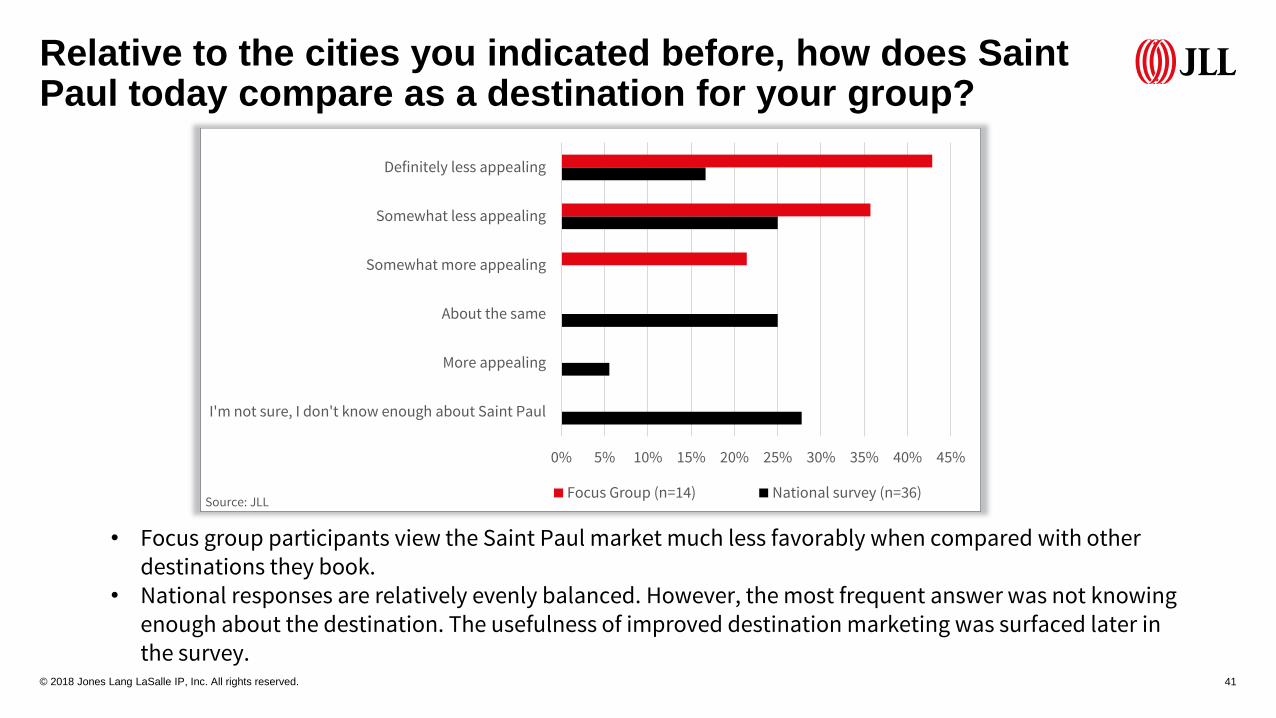
Relative to the cities you indicated before, how does Saint Paul today compare as a destination for your group?
0% 5% 10% 15% 20% 25% 30% 35% 40% 45%
I'm not sure, I don't know enough about Saint Paul
More appealing
About the same
Somewhat more appealing
Somewhat less appealing
Definitely less appealing
Focus Group (n=14) National survey (n=36)
• Focus group participants view the Saint Paul market much less favorably when compared with other destinations they book.
• National responses are relatively evenly balanced. However, the most frequent answer was not knowing enough about the destination. The usefulness of improved destination marketing was surfaced later in the survey.
Source: JLL
© 2018 Jones Lang LaSalle IP, Inc. All rights reserved. 42
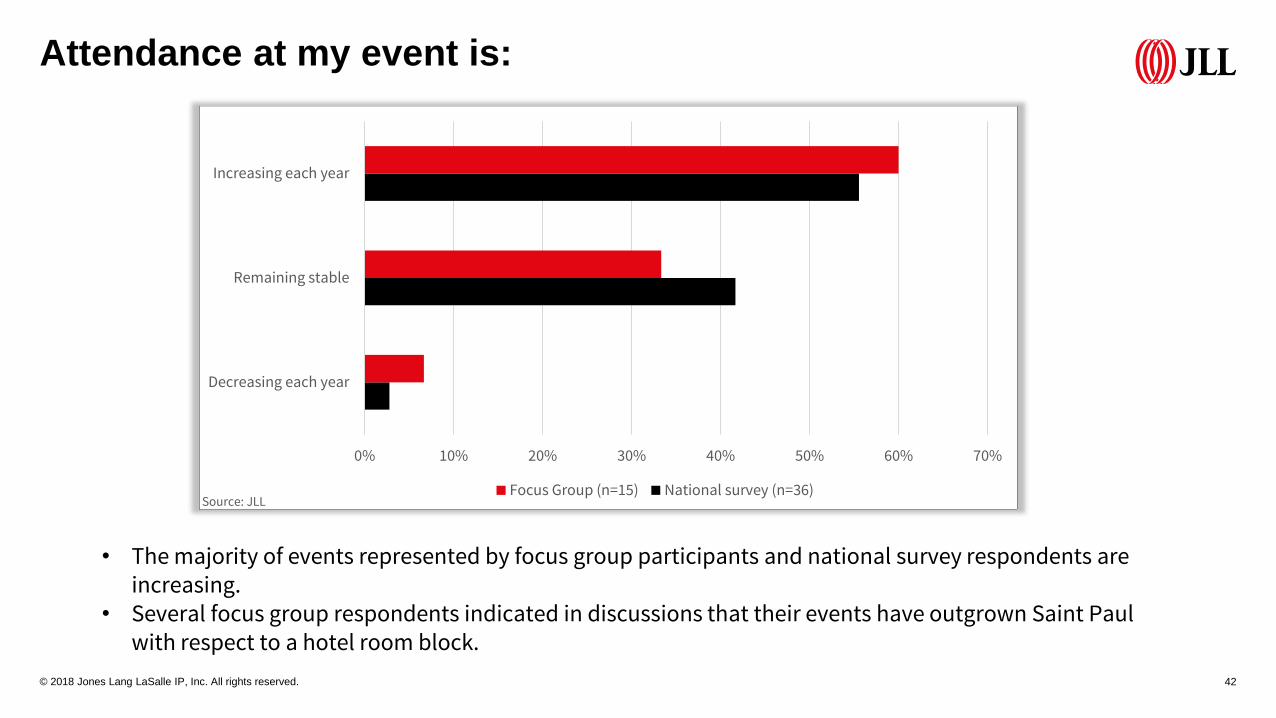
Attendance at my event is:
0% 10% 20% 30% 40% 50% 60% 70%
Decreasing each year
Remaining stable
Increasing each year
Focus Group (n=15) National survey (n=36)
• The majority of events represented by focus group participants and national survey respondents are increasing.
• Several focus group respondents indicated in discussions that their events have outgrown Saint Paul with respect to a hotel room block.
Source: JLL
© 2018 Jones Lang LaSalle IP, Inc. All rights reserved. 43
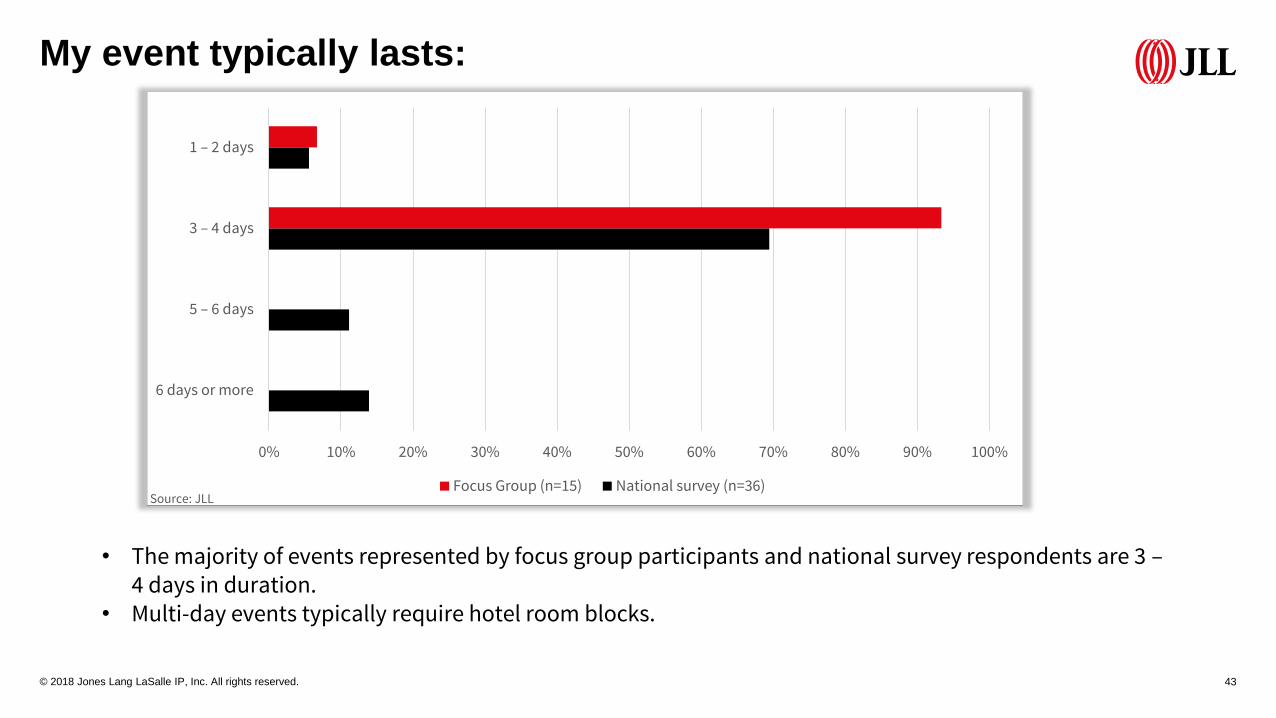
My event typically lasts:
0% 10% 20% 30% 40% 50% 60% 70% 80% 90% 100%
6 days or more
5 – 6 days
3 – 4 days
1 – 2 days
Focus Group (n=15) National survey (n=36)
• The majority of events represented by focus group participants and national survey respondents are 3 –4 days in duration.
• Multi-day events typically require hotel room blocks.
Source: JLL
© 2018 Jones Lang LaSalle IP, Inc. All rights reserved. 44
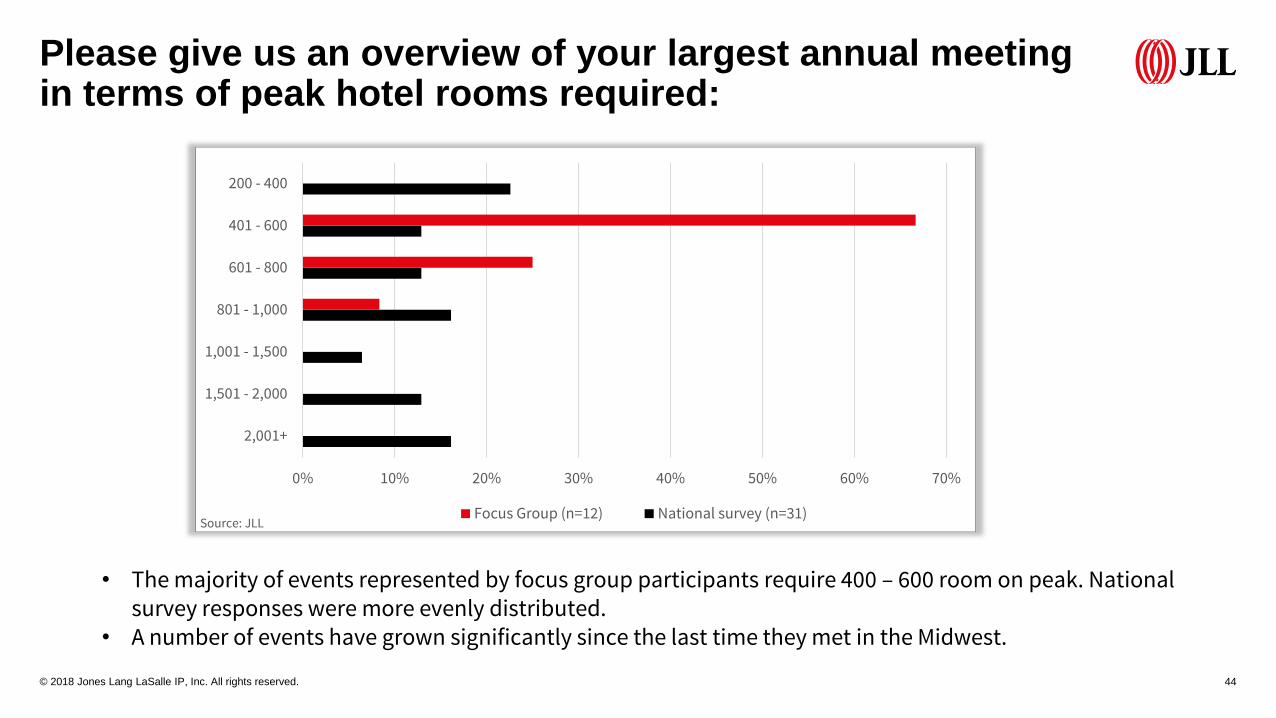
Please give us an overview of your largest annual meeting in terms of peak hotel rooms required:
0% 10% 20% 30% 40% 50% 60% 70%
2,001+
1,501 - 2,000
1,001 - 1,500
801 - 1,000
601 - 800
401 - 600
200 - 400
Focus Group (n=12) National survey (n=31)
• The majority of events represented by focus group participants require 400 – 600 room on peak. National survey responses were more evenly distributed.
• A number of events have grown significantly since the last time they met in the Midwest.
Source: JLL

© 2018 Jones Lang LaSalle IP, Inc. All rights reserved. 45
Overall, the RiverCentre is sufficient for my event needs.
0% 10% 20% 30% 40% 50% 60%
Strongly disagree
Disagree
Agree
Strongly agree
Focus Group (n=13) National survey (n=36)
• 69% and 70% of focus group and survey respondents, respectively, indicated that they strongly agree or agree that the RiverCentre space is sufficient for their event needs.
• In discussions, numerous focus group participants indicated that the facility did not offer enough breakout room space.
Source: JLL
© 2018 Jones Lang LaSalle IP, Inc. All rights reserved. 46
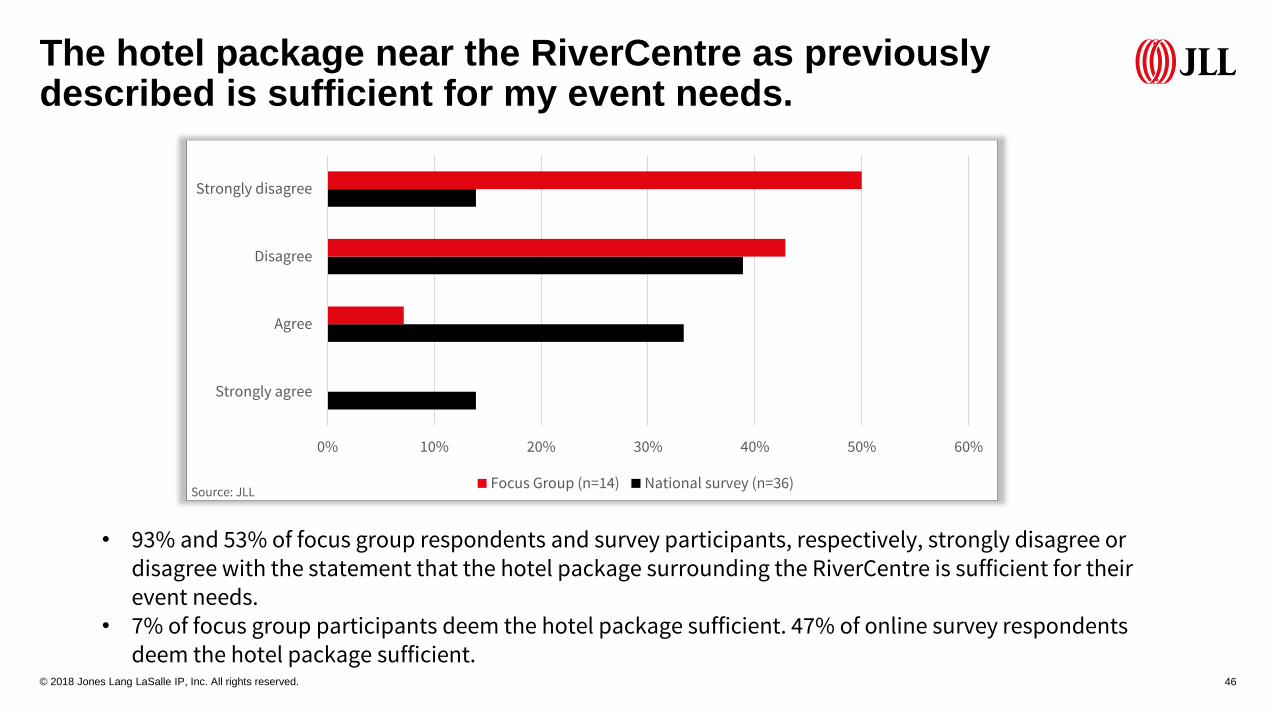
The hotel package near the RiverCentre as previously described is sufficient for my event needs.
0% 10% 20% 30% 40% 50% 60%
Strongly agree
Agree
Disagree
Strongly disagree
Focus Group (n=14) National survey (n=36)
• 93% and 53% of focus group respondents and survey participants, respectively, strongly disagree or disagree with the statement that the hotel package surrounding the RiverCentre is sufficient for their event needs.
• 7% of focus group participants deem the hotel package sufficient. 47% of online survey respondents deem the hotel package sufficient.
Source: JLL
© 2018 Jones Lang LaSalle IP, Inc. All rights reserved. 47
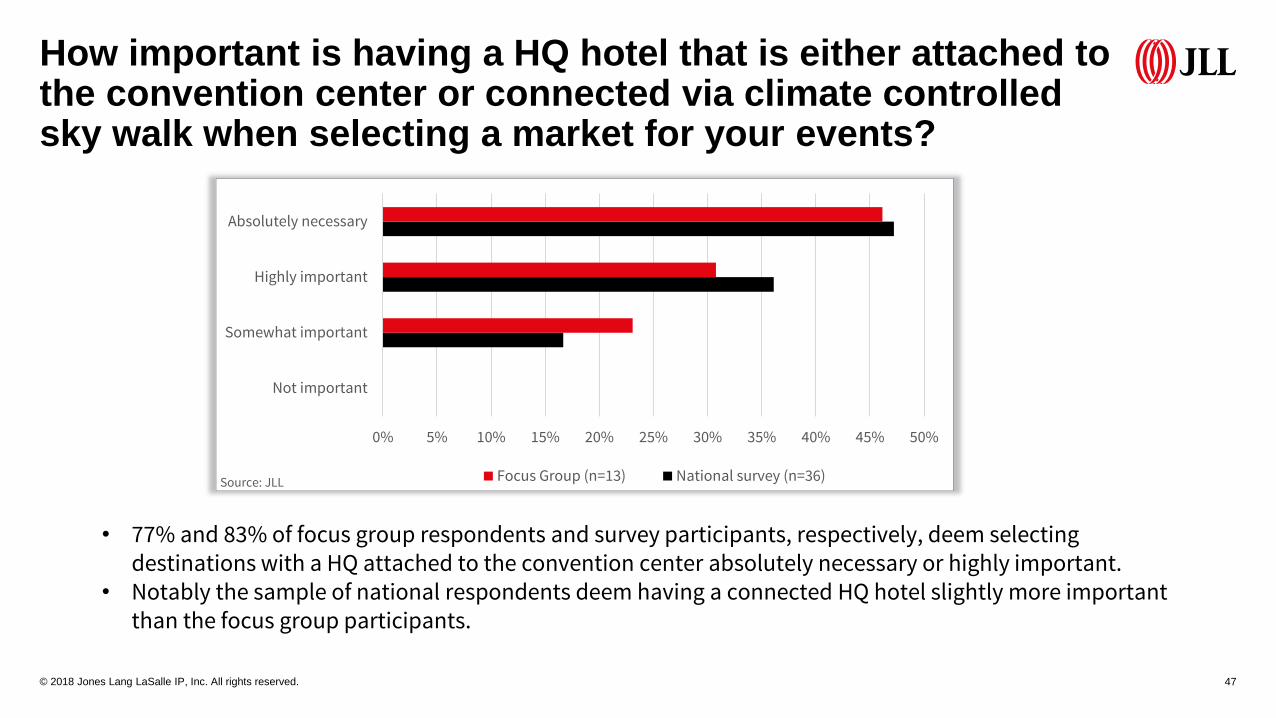
How important is having a HQ hotel that is either attached to the convention center or connected via climate controlled sky walk when selecting a market for your events?
0% 5% 10% 15% 20% 25% 30% 35% 40% 45% 50%
Not important
Somewhat important
Highly important
Absolutely necessary
Focus Group (n=13) National survey (n=36)
• 77% and 83% of focus group respondents and survey participants, respectively, deem selecting destinations with a HQ attached to the convention center absolutely necessary or highly important.
• Notably the sample of national respondents deem having a connected HQ hotel slightly more important than the focus group participants.
Source: JLL
© 2018 Jones Lang LaSalle IP, Inc. All rights reserved. 48
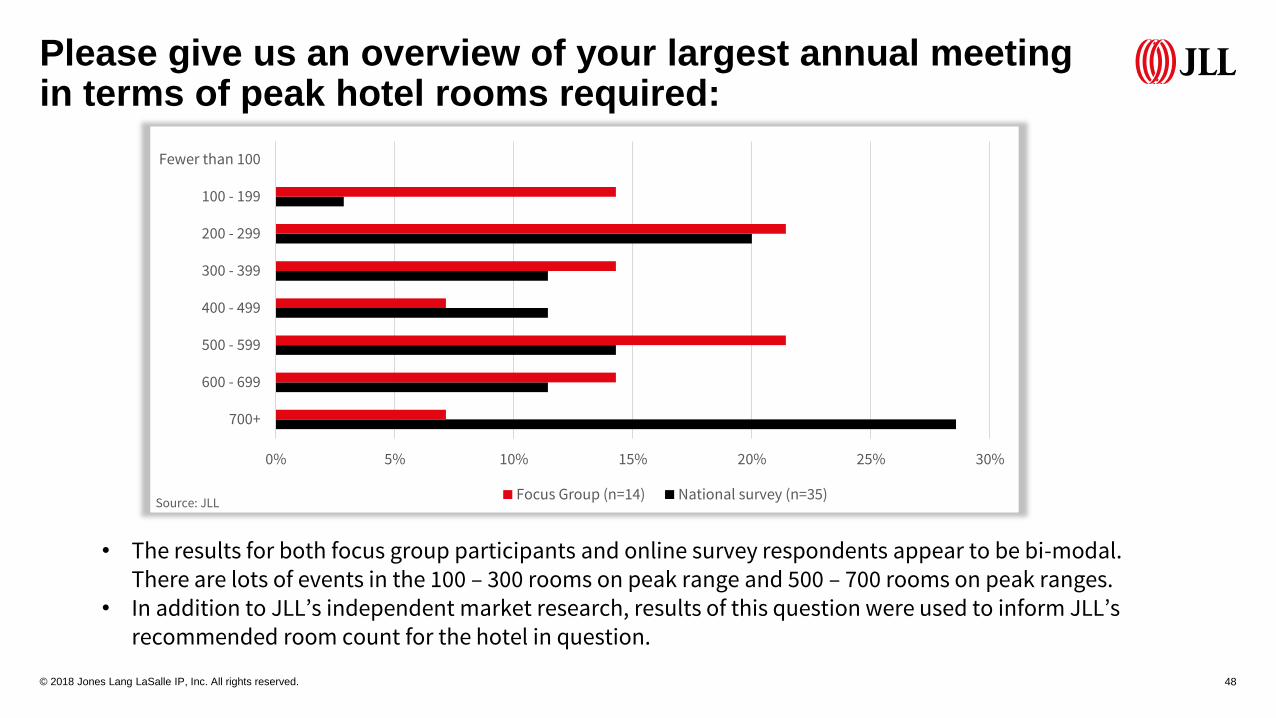
Please give us an overview of your largest annual meeting in terms of peak hotel rooms required:
0% 5% 10% 15% 20% 25% 30%
700+
600 - 699
500 - 599
400 - 499
300 - 399
200 - 299
100 - 199
Fewer than 100
Focus Group (n=14) National survey (n=35)
• The results for both focus group participants and online survey respondents appear to be bi-modal. There are lots of events in the 100 – 300 rooms on peak range and 500 – 700 rooms on peak ranges.
• In addition to JLL’s independent market research, results of this question were used to inform JLL’s recommended room count for the hotel in question.
Source: JLL
© 2018 Jones Lang LaSalle IP, Inc. All rights reserved. 49
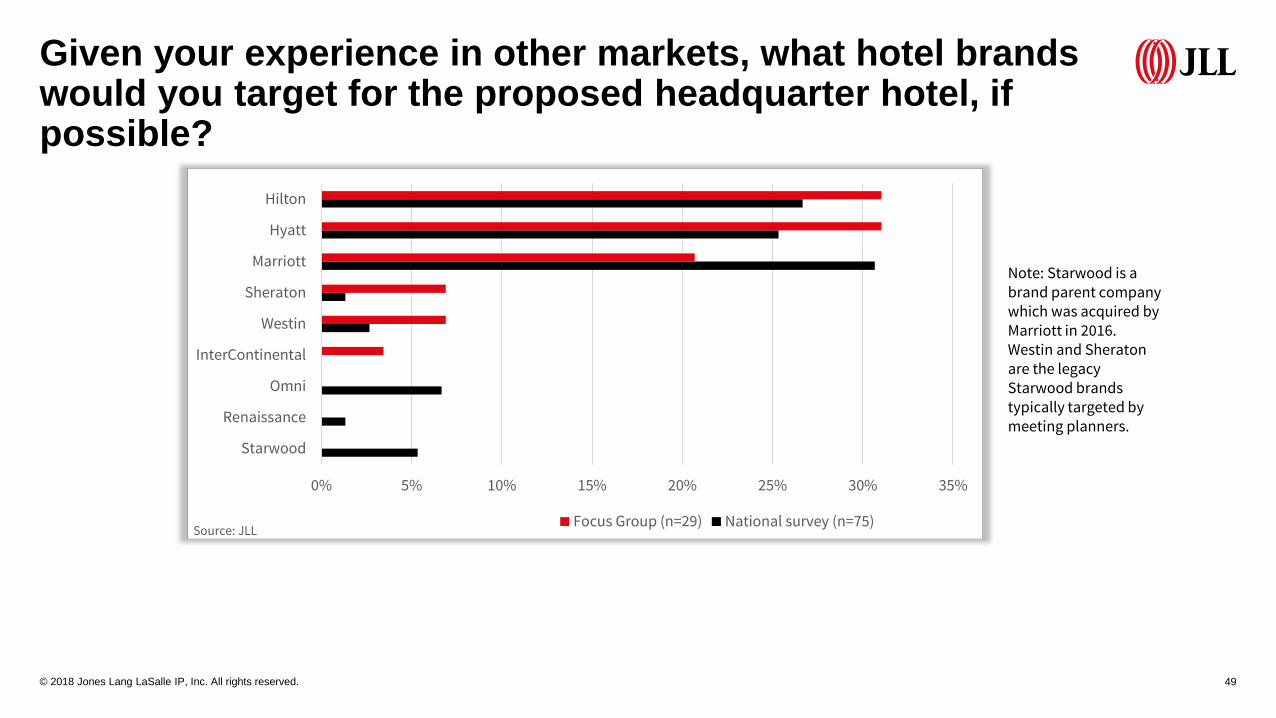
Given your experience in other markets, what hotel brands would you target for the proposed headquarter hotel, if possible?
0% 5% 10% 15% 20% 25% 30% 35%
Starwood
Renaissance
Omni
InterContinental
Westin
Sheraton
Marriott
Hyatt
Hilton
Focus Group (n=29) National survey (n=75)
Note: Starwood is a brand parent company which was acquired by Marriott in 2016. Westin and Sheraton are the legacy Starwood brands typically targeted by meeting planners.
Source: JLL
© 2018 Jones Lang LaSalle IP, Inc. All rights reserved. 50
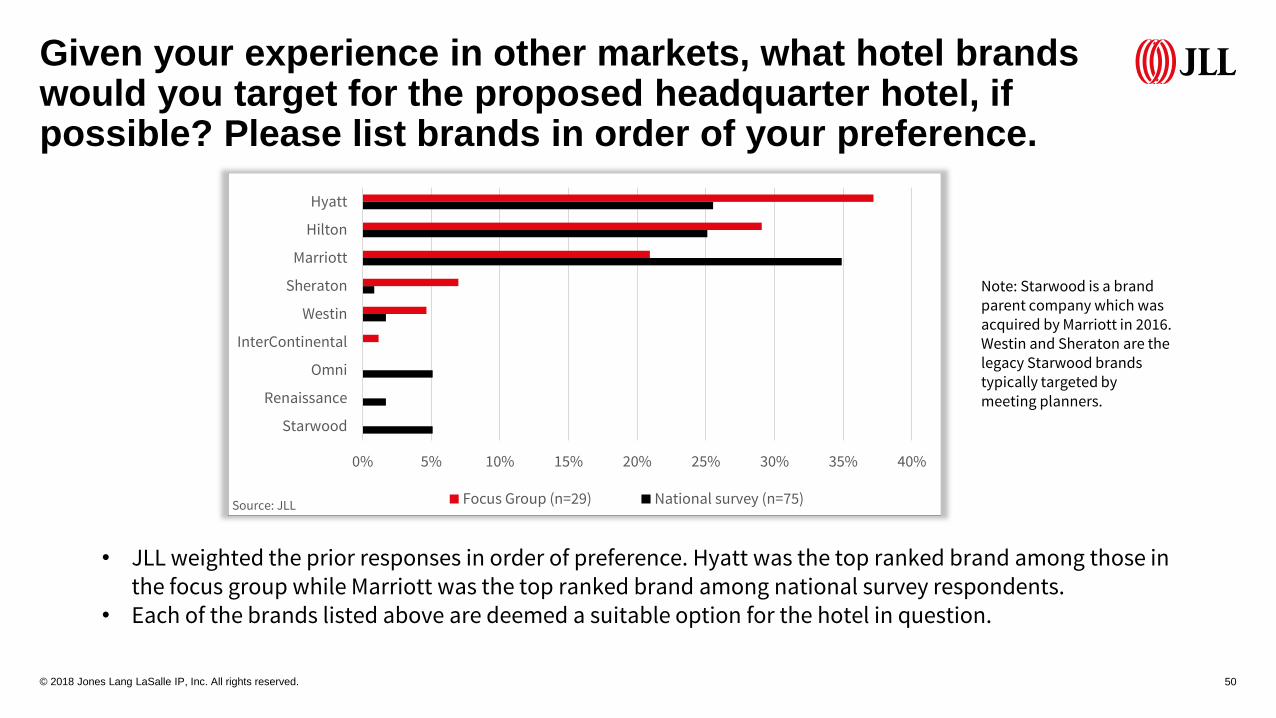
Given your experience in other markets, what hotel brands would you target for the proposed headquarter hotel, if possible? Please list brands in order of your preference.
0% 5% 10% 15% 20% 25% 30% 35% 40%
Starwood
Renaissance
Omni
InterContinental
Westin
Sheraton
Marriott
Hilton
Hyatt
Focus Group (n=29) National survey (n=75)
Note: Starwood is a brand parent company which was acquired by Marriott in 2016. Westin and Sheraton are the legacy Starwood brands typically targeted by meeting planners.
• JLL weighted the prior responses in order of preference. Hyatt was the top ranked brand among those in the focus group while Marriott was the top ranked brand among national survey respondents.
• Each of the brands listed above are deemed a suitable option for the hotel in question.
Source: JLL

© 2018 Jones Lang LaSalle IP, Inc. All rights reserved. 51
If you would prefer to see a new headquarters hotel adjacent to the RiverCentre, how much total meeting space would you like to see developed?
0% 5% 10% 15% 20% 25% 30% 35% 40%
More than 70k
60k – 70k
50k – 60k
40k – 50k
30k – 40k
20k – 30k
10k – 20k
Less than 10,000 sq. ft.
Focus Group (n=13) National survey (n=36)
• Similar to the results of the question about peak room nights required, the results for both focus group participants and online survey respondents appear to be bi-modal. 69% of focus group respondents require up to 40k sq. ft. while 69% of online survey respondents require more than 40k sq. ft.
• In addition to JLL’s independent market research, results of this question were used to inform JLL’s recommended room count for the hotel in question.
Source: JLL
© 2018 Jones Lang LaSalle IP, Inc. All rights reserved. 52
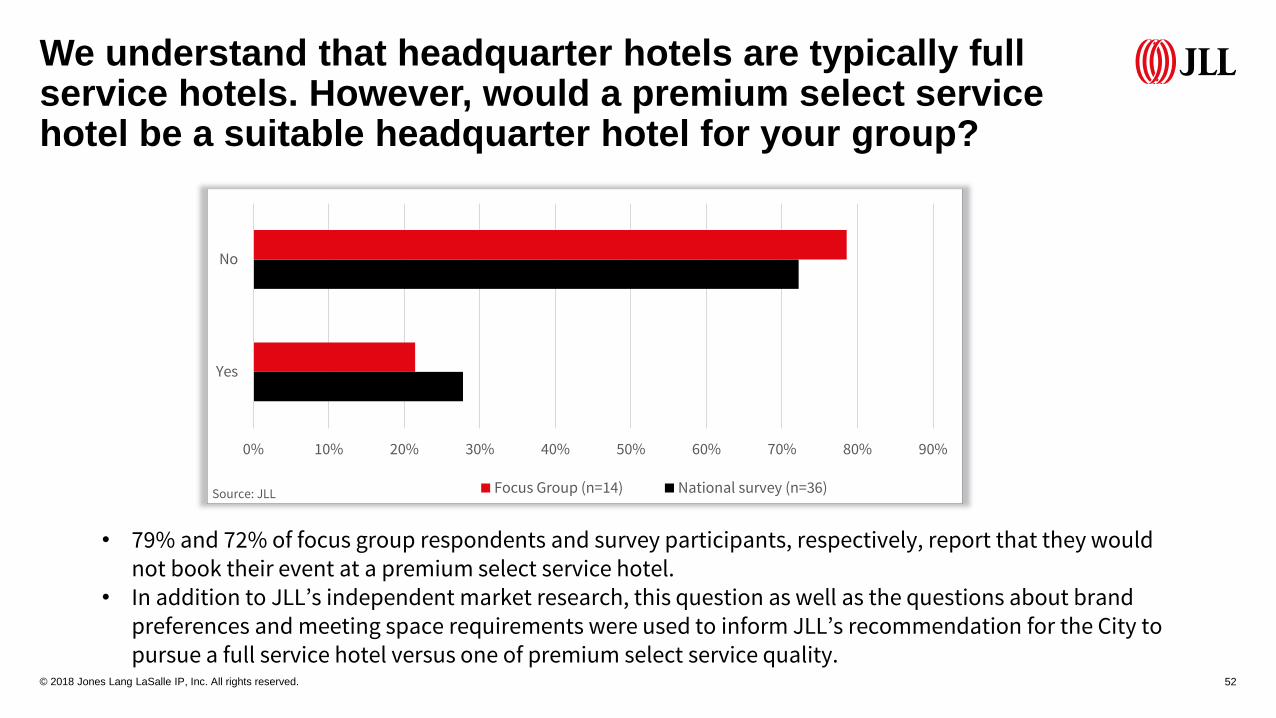
We understand that headquarter hotels are typically full service hotels. However, would a premium select service hotel be a suitable headquarter hotel for your group?
0% 10% 20% 30% 40% 50% 60% 70% 80% 90%
Yes
No
Focus Group (n=14) National survey (n=36)
• 79% and 72% of focus group respondents and survey participants, respectively, report that they would not book their event at a premium select service hotel.
• In addition to JLL’s independent market research, this question as well as the questions about brand preferences and meeting space requirements were used to inform JLL’s recommendation for the City to pursue a full service hotel versus one of premium select service quality.
Source: JLL
© 2018 Jones Lang LaSalle IP, Inc. All rights reserved. 53
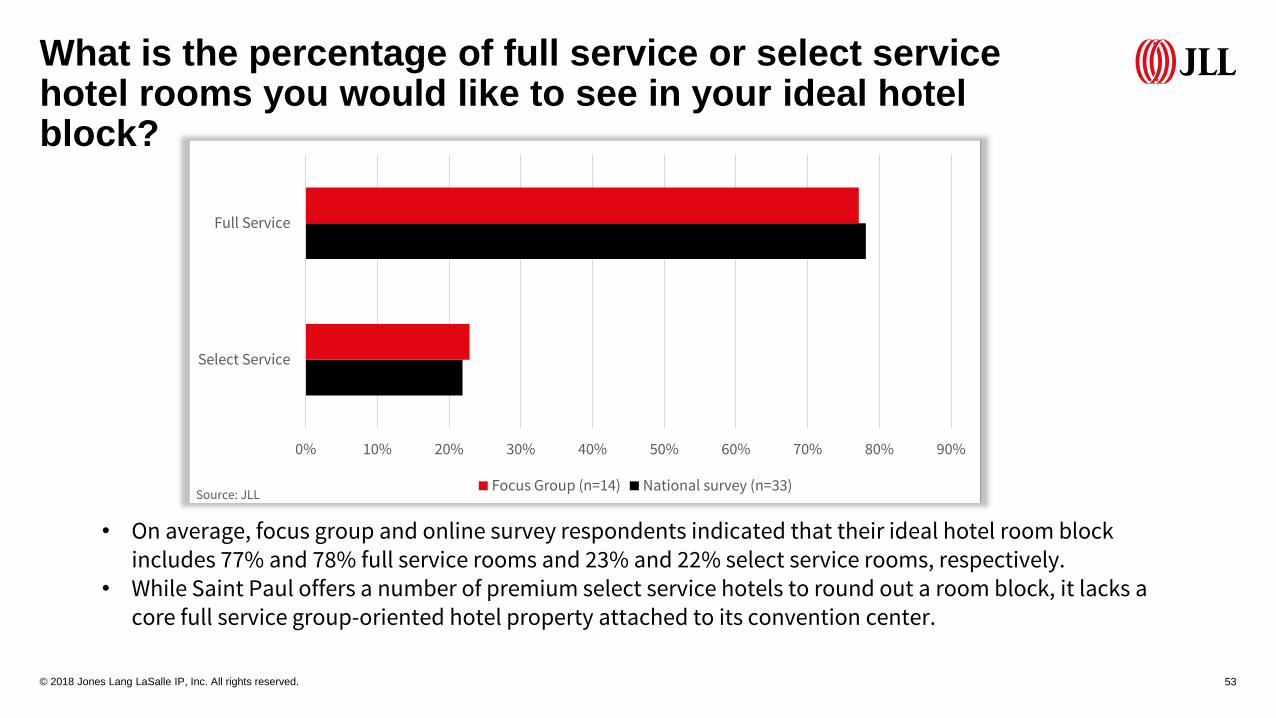
What is the percentage of full service or select service hotel rooms you would like to see in your ideal hotel block?
0% 10% 20% 30% 40% 50% 60% 70% 80% 90%
Select Service
Full Service
Focus Group (n=14) National survey (n=33)
• On average, focus group and online survey respondents indicated that their ideal hotel room block includes 77% and 78% full service rooms and 23% and 22% select service rooms, respectively.
• While Saint Paul offers a number of premium select service hotels to round out a room block, it lacks a core full service group-oriented hotel property attached to its convention center.
Source: JLL
© 2018 Jones Lang LaSalle IP, Inc. All rights reserved. 54
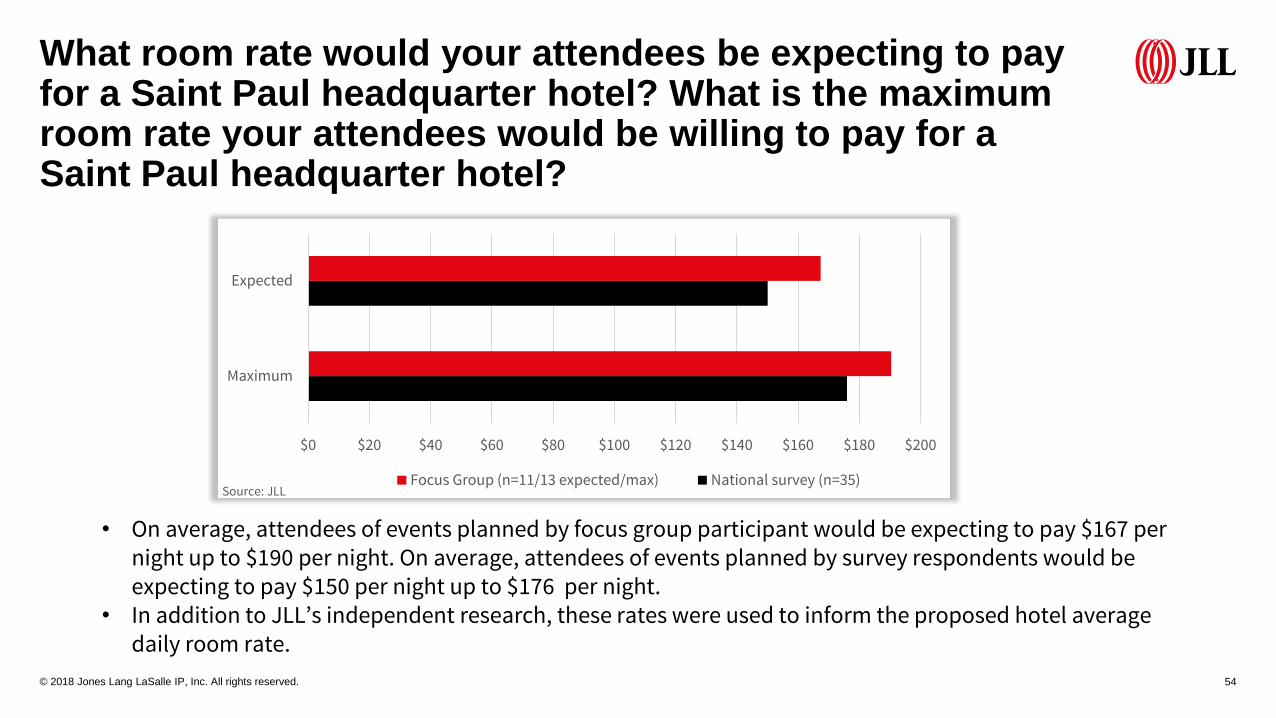
What room rate would your attendees be expecting to pay for a Saint Paul headquarter hotel? What is the maximum room rate your attendees would be willing to pay for a Saint Paul headquarter hotel?
$0 $20 $40 $60 $80 $100 $120 $140 $160 $180 $200
Maximum
Expected
Focus Group (n=11/13 expected/max) National survey (n=35)
• On average, attendees of events planned by focus group participant would be expecting to pay $167 per night up to $190 per night. On average, attendees of events planned by survey respondents would be expecting to pay $150 per night up to $176 per night.
• In addition to JLL’s independent research, these rates were used to inform the proposed hotel average daily room rate.
Source: JLL
© 2018 Jones Lang LaSalle IP, Inc. All rights reserved. 55
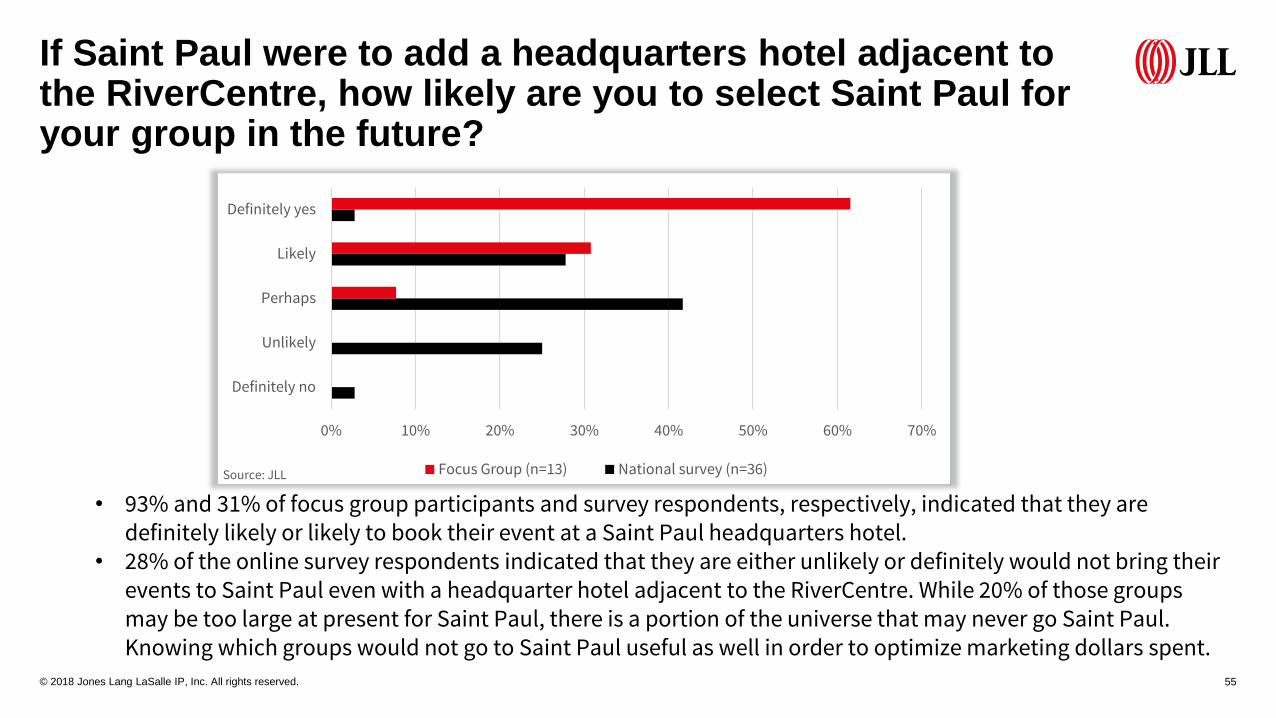
If Saint Paul were to add a headquarters hotel adjacent to the RiverCentre, how likely are you to select Saint Paul for your group in the future?
0% 10% 20% 30% 40% 50% 60% 70%
Definitely no
Unlikely
Perhaps
Likely
Definitely yes
Focus Group (n=13) National survey (n=36)
• 93% and 31% of focus group participants and survey respondents, respectively, indicated that they are definitely likely or likely to book their event at a Saint Paul headquarters hotel.
• 28% of the online survey respondents indicated that they are either unlikely or definitely would not bring their events to Saint Paul even with a headquarter hotel adjacent to the RiverCentre. While 20% of those groups may be too large at present for Saint Paul, there is a portion of the universe that may never go Saint Paul. Knowing which groups would not go to Saint Paul useful as well in order to optimize marketing dollars spent.
Source: JLL

© 2018 Jones Lang LaSalle IP, Inc. All rights reserved. 56
If Saint Paul could do one thing to improve as a convention destination, what would it be?
0% 5% 10% 15% 20% 25% 30% 35% 40% 45%
Other
Improve destination marketing/perception
Improve downtown transit
Add convention center space
Improve walkability
Increase things to do/vibrancy
Build a HQ Hotel
Focus Group (n=15) National survey (n=20)
• 40% of focus group participants said that building a HQ hotel at the RiverCentre would be the most beneficial for Saint Paul as a convention destination, with the remaining answers are fairly evenly distributed.
• 30% of online survey respondents mentioned improved destination marketing as being an important item to enhance Saint Paul as a convention destination. 25% listed building a HQ hotel.
Source: JLL

© 2018 Jones Lang LaSalle IP, Inc. All rights reserved. 57
Assuming Saint Paul addresses most if not all of issues that you identified as important for your group, how would you again compare Saint Paul as an overall destination relative to the cities that typically host your event?
0% 10% 20% 30% 40% 50% 60% 70%
Would be definitely less appealing
Would be somewhat less appealing
About the same
Would be somewhat more appealing
Would be definitely more appealing
Focus Group (n=13) National survey (n=36)
• 93% and 42% of focus group participants and online survey respondents, respectively, said that addressing key improvement opportunities would improve Saint Paul’s status with respect to other destinations.
Source: JLL
What could be the impact in Saint Paul?

© 2018 Jones Lang LaSalle IP, Inc. All rights reserved. 59
What could be the impact in Saint Paul?
• Based on market research, focus group
discussions and survey responses, JLL
recommends Saint Paul consider a
program for the Proposed Hotel:
• Full-service, Branded Hotel
• 500 guest rooms, and
• 40,000 sq. ft. of meeting space with
a 15,000 sq. ft. column-free ballroom
• The pro-forma financial projections which
follow pertain to a Proposed Hotel that
includes this program.
Public Space Area sq. ft.
Lobby, Front Desk and Vestibule 6,000
Three-meal Restaurant and Bar/Lounge 6,000
Public Restrooms 1,000
Meeting Space 40,000
Prefunction Space 12,000
Fitness Center 1,500
Subtotal 66,500
Guestrooms Area sq. ft.
Guestrooms (500) 241,300
Suites (50) 27,500
Single King (250) 118,800
Double-Double (200) 95,000
Subtotal (500) 241,300
Gross guestroom area per key (sq. ft.) 483
Back of House Areas Area sq. ft.
Back of House 52,300
Subtotal 52,300
Grand total gross sq. ft. 360,100
Grand total gross sq. ft. per key 720
Source: JLL
Proposed Hotel Programming Summary

© 2018 Jones Lang LaSalle IP, Inc. All rights reserved. 60
What could be the impact in Saint Paul?
Source: JLL
Proposed HQ Hotel at the RiverCentre Pro-Forma
All Values In (USD'000) 2022 2023 2024 2025 2026 2027
Period Ending December 31 December 31 December 31 December 31 December 31 December 31
Days Open in Period 365 365 366 365 365
Available Hotel Rooms 500 500 500 500 500
Available Room Nights 182,500 182,500 183,000 182,500 182,500
Occupied Room Nights 110,548 125,057 131,561 131,212 131,212
Occupancy 60.6% 68.5% 71.9% 71.9% 71.9%
Average Daily Rate 173.26 180.28 192.90 196.82 200.81
RevPAR 104.95 123.53 138.68 141.51 144.38
OPERATING REVENUE Amount Ratio PAR POR Amount Ratio PAR POR Amount Ratio PAR POR Amount Ratio PAR POR Amount Ratio PAR POR
Rooms Revenue 19,154 60.1% 38,308 173.26 22,545 60.6% 45,090 180.28 25,378 61.7% 50,756 192.90 25,825 61.7% 51,650 196.82 26,349 61.7% 52,698 200.81
Food & Beverage Revenue 11,608 36.4% 23,216 105.00 13,395 36.0% 26,790 107.11 14,374 35.0% 28,748 109.26 14,626 35.0% 29,252 111.47 14,923 35.0% 29,846 113.73
Parking / Garage / Valet Revenue 318 1.0% 636 2.88 367 1.0% 734 2.93 394 1.0% 788 2.99 401 1.0% 802 3.06 409 1.0% 818 3.12
Other Operated Departments Revenue 221 0.7% 442 2.00 255 0.7% 510 2.04 274 0.7% 548 2.08 279 0.7% 558 2.13 284 0.7% 568 2.16
Miscellaneous Income¹ 553 1.7% 1,106 5.00 638 1.7% 1,276 5.10 684 1.7% 1,368 5.20 696 1.7% 1,392 5.30 711 1.7% 1,422 5.42
Total Operating Revenue 31,853 100.0% 63,706 288.14 37,199 100.0% 74,398 297.46 41,104 100.0% 82,208 312.43 41,826 100.0% 83,652 318.77 42,676 100.0% 85,352 325.24
DEPARTMENTAL EXPENSES
Rooms Expenses 4,980 26.0% 9,960 45.05 5,636 25.0% 11,272 45.07 6,091 24.0% 12,182 46.30 6,198 24.0% 12,396 47.24 6,324 24.0% 12,648 48.20
Food & Beverage Expenses 8,125 70.0% 16,250 73.50 8,974 67.0% 17,948 71.76 9,343 65.0% 18,686 71.02 9,507 65.0% 19,014 72.46 9,700 65.0% 19,400 73.93
Parking / Garage / Valet Expenses 127 39.9% 254 1.15 147 40.1% 294 1.18 157 39.8% 314 1.19 160 39.9% 320 1.22 163 39.9% 326 1.24
Other Operated Departments Expenses 177 80.1% 354 1.60 204 80.0% 408 1.63 219 79.9% 438 1.66 223 79.9% 446 1.70 227 79.9% 454 1.73
Total Departmental Expenses 13,409 42.1% 26,818 121.30 14,961 40.2% 29,922 119.63 15,810 38.5% 31,620 120.17 16,088 38.5% 32,176 122.61 16,415 38.5% 32,830 125.10
Total Departmental Income 18,444 57.9% 36,888 166.84 22,238 59.8% 44,476 177.82 25,294 61.5% 50,588 192.26 25,738 61.5% 51,476 196.16 26,261 61.5% 52,522 200.14
UNDISTRIBUTED EXPENSESAdministrative & General 2,850 8.9% 5,700 25.78 3,034 8.2% 6,068 24.26 3,179 7.7% 6,358 24.16 3,241 7.7% 6,482 24.70 3,306 7.7% 6,612 25.20
Information & Telecommunication 605 1.9% 1,210 5.47 707 1.9% 1,414 5.65 781 1.9% 1,562 5.94 795 1.9% 1,590 6.06 811 1.9% 1,622 6.18
Sales & Marketing 2,600 8.2% 5,200 23.52 2,767 7.4% 5,534 22.13 2,900 7.1% 5,800 22.04 2,956 7.1% 5,912 22.53 3,016 7.1% 6,032 22.99
Property Operations and Maintenance (POM) 1,500 4.7% 3,000 13.57 1,597 4.3% 3,194 12.77 1,673 4.1% 3,346 12.72 1,706 4.1% 3,412 13.00 1,740 4.1% 3,480 13.26
Utilities 1,400 4.4% 2,800 12.66 1,490 4.0% 2,980 11.91 1,562 3.8% 3,124 11.87 1,592 3.8% 3,184 12.13 1,624 3.8% 3,248 12.38
Total Undistributed Expenses 8,955 28.1% 17,910 81.01 9,595 25.8% 19,190 76.73 10,095 24.6% 20,190 76.73 10,289 24.6% 20,578 78.41 10,498 24.6% 20,996 80.01
Gross Operating Profit 9,489 29.8% 18,978 85.84 12,643 34.0% 25,286 101.10 15,198 37.0% 30,396 115.52 15,449 36.9% 30,898 117.74 15,763 36.9% 31,526 120.13
Management Fee 956 3.0% 1,912 8.65 1,116 3.0% 2,232 8.92 1,233 3.0% 2,466 9.37 1,255 3.0% 2,510 9.56 1,280 3.0% 2,560 9.76
Income Before Non-Operating Income & Expenses 8,533 26.8% 17,066 77.19 11,527 31.0% 23,054 92.17 13,965 34.0% 27,930 106.15 14,194 33.9% 28,388 108.18 14,483 33.9% 28,966 110.38
NON-OPERATING INCOME & EXPENSESProperty Taxes 1,050 3.3% 2,100 9.50 1,071 2.9% 2,142 8.56 1,093 2.7% 2,186 8.31 1,115 2.7% 2,230 8.50 1,137 2.7% 2,274 8.67
Insurance 250 0.8% 500 2.26 255 0.7% 510 2.04 260 0.6% 520 1.98 265 0.6% 530 2.02 271 0.6% 542 2.07
Total Non-Operating Income & Expenses² 1,300 4.1% 2,600 11.76 1,326 3.6% 2,652 10.60 1,353 3.3% 2,706 10.28 1,380 3.3% 2,760 10.52 1,408 3.3% 2,816 10.73
EBITDA³ 7,233 22.7% 14,466 65.43 10,201 27.4% 20,402 81.57 12,613 30.7% 25,226 95.87 12,814 30.6% 25,628 97.66 13,075 30.6% 26,150 99.65
Replacement Reserve (FF&E) 637 2.0% 1,274 5.76 1,116 3.0% 2,232 8.92 1,644 4.0% 3,288 12.50 1,673 4.0% 3,346 12.75 1,707 4.0% 3,414 13.01
EBITDA Less Replacement Reserve⁴ 6,596 20.7% 13,192 59.67 9,085 24.4% 18,170 72.65 10,969 26.7% 21,938 83.38 11,141 26.6% 22,282 84.91 11,368 26.6% 22,736 86.64
¹ USALI 11th Edition refers to "Rentals & Other Income" as "Miscellaneous Income" ² USALI 11th Edition refers to "Fixed Charges" as "Non-Operating Income & Expenses" ³ USALI 11th Edition refers to "NOI" as "EBITDA" ⁴ USALI 11th Edition refers to "Adj. NOI" as "EBITDA Less Replacement Reserve"
© 2018 Jones Lang LaSalle IP, Inc. All rights reserved. 61
What could be the impact in Saint Paul?
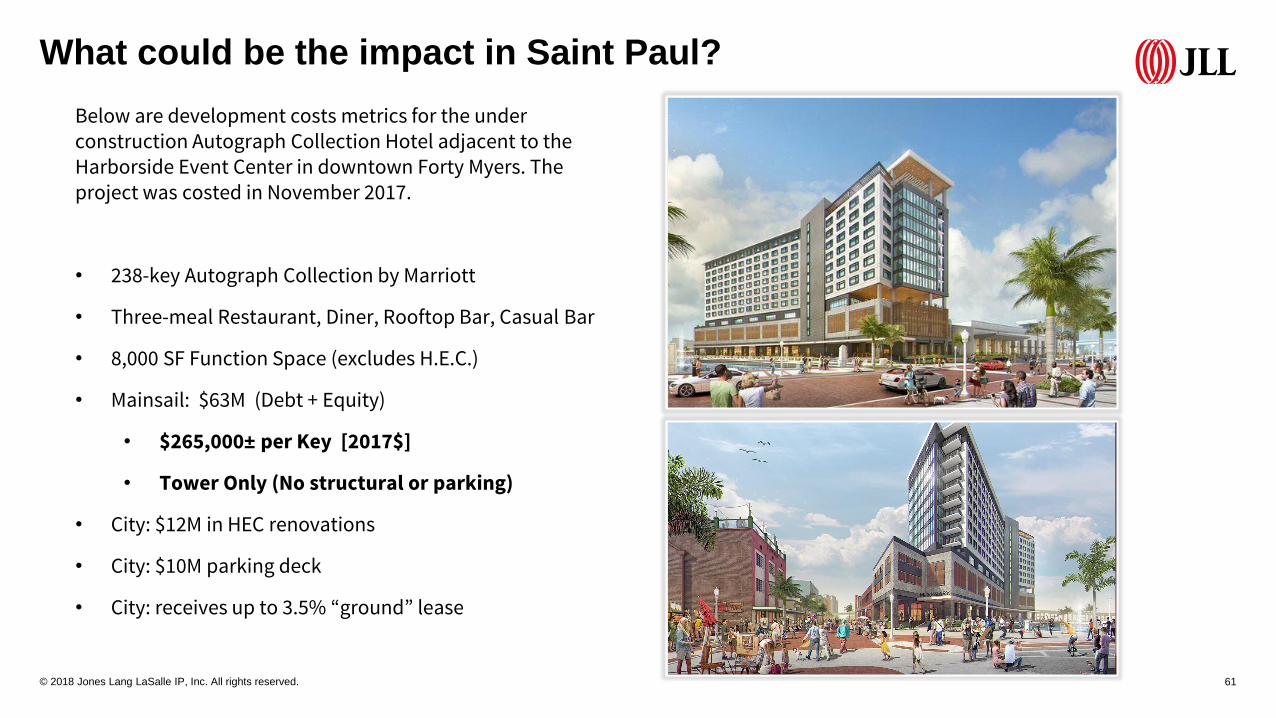
Below are development costs metrics for the under construction Autograph Collection Hotel adjacent to the Harborside Event Center in downtown Forty Myers. The project was costed in November 2017.
• 238-key Autograph Collection by Marriott
• Three-meal Restaurant, Diner, Rooftop Bar, Casual Bar
• 8,000 SF Function Space (excludes H.E.C.)
• Mainsail: $63M (Debt + Equity)
• $265,000± per Key [2017$]
• Tower Only (No structural or parking)
• City: $12M in HEC renovations
• City: $10M parking deck
• City: receives up to 3.5% “ground” lease
© 2018 Jones Lang LaSalle IP, Inc. All rights reserved. 62
What could be the impact in Saint Paul?
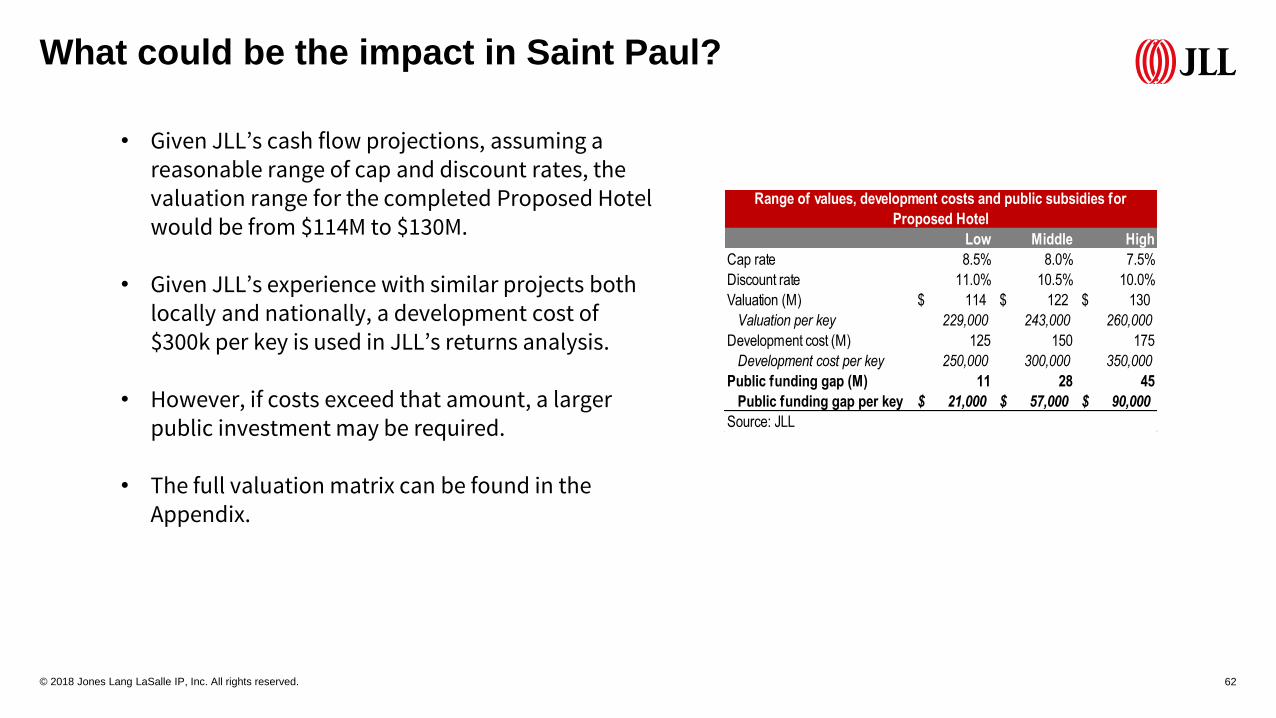
• Given JLL’s cash flow projections, assuming a reasonable range of cap and discount rates, the valuation range for the completed Proposed Hotel would be from $114M to $130M.
• Given JLL’s experience with similar projects both locally and nationally, a development cost of $300k per key is used in JLL’s returns analysis.
• However, if costs exceed that amount, a larger public investment may be required.
• The full valuation matrix can be found in the Appendix.
Low Middle High
Cap rate 8.5% 8.0% 7.5%
Discount rate 11.0% 10.5% 10.0%
Valuation (M) 114$ 122$ 130$
Valuation per key 229,000 243,000 260,000
Development cost (M) 125 150 175
Development cost per key 250,000 300,000 350,000
Public funding gap (M) 11 28 45
Public funding gap per key 21,000$ 57,000$ 90,000$
Source: JLL
Range of values, development costs and public subsidies for
Proposed Hotel
© 2018 Jones Lang LaSalle IP, Inc. All rights reserved. 63
What could be the impact in Saint Paul?
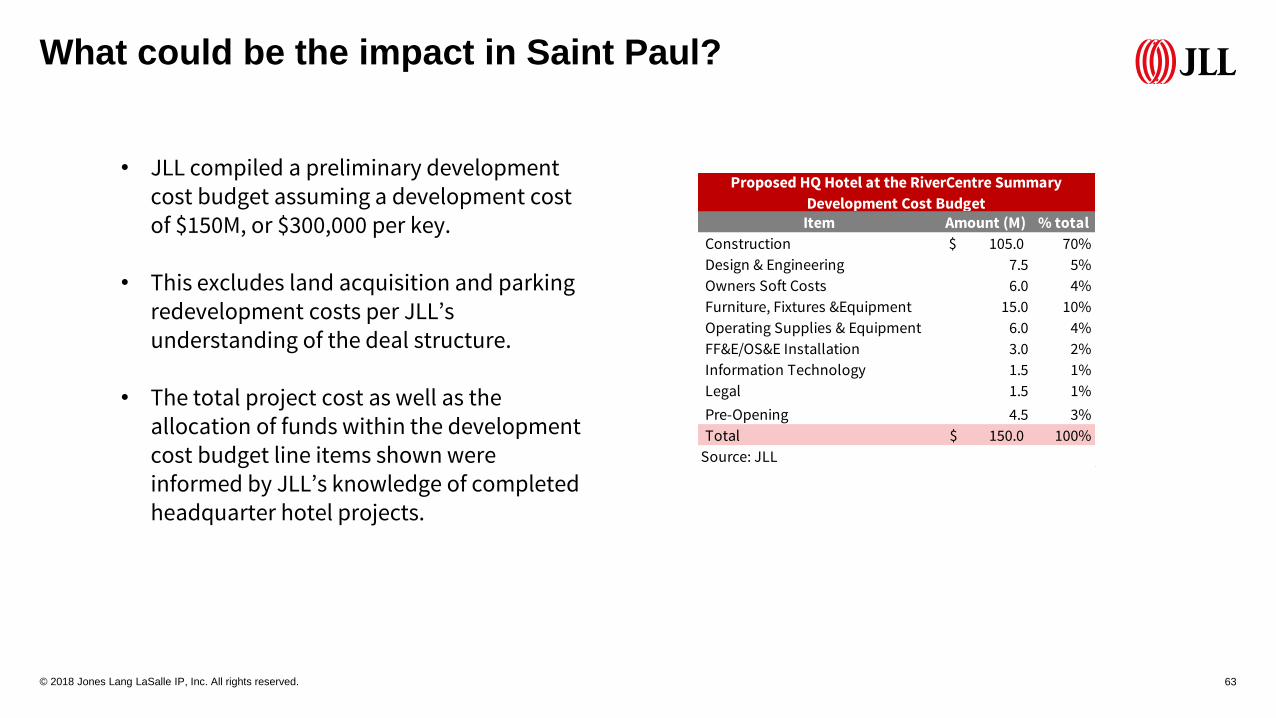
• JLL compiled a preliminary development cost budget assuming a development cost of $150M, or $300,000 per key.
• This excludes land acquisition and parking redevelopment costs per JLL’s understanding of the deal structure.
• The total project cost as well as the allocation of funds within the development cost budget line items shown were informed by JLL’s knowledge of completed headquarter hotel projects.
Item Amount (M) % total
Construction 105.0$ 70%
Design & Engineering 7.5 5%
Owners Soft Costs 6.0 4%
Furniture, Fixtures &Equipment 15.0 10%
Operating Supplies & Equipment 6.0 4%
FF&E/OS&E Installation 3.0 2%
Information Technology 1.5 1%
Legal 1.5 1%
Pre-Opening 4.5 3%
Total 150.0$ 100%
Source: JLL
Proposed HQ Hotel at the RiverCentre Summary
Development Cost Budget
© 2018 Jones Lang LaSalle IP, Inc. All rights reserved. 64
What could be the impact in Saint Paul?
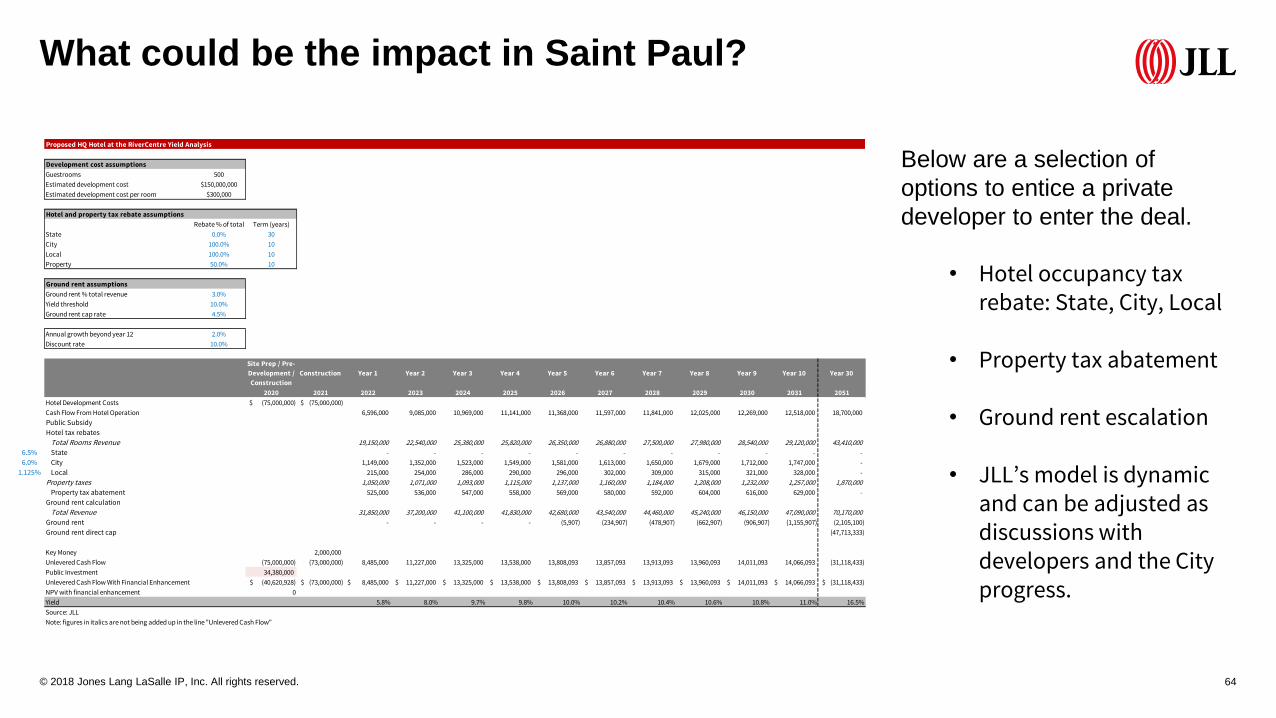
Below are a selection of
options to entice a private
developer to enter the deal.
• Hotel occupancy tax rebate: State, City, Local
• Property tax abatement
• Ground rent escalation
• JLL’s model is dynamic and can be adjusted as discussions with developers and the City progress.
Proposed HQ Hotel at the RiverCentre Yield Analysis
Development cost assumptions
Guestrooms 500
Estimated development cost $150,000,000
Estimated development cost per room $300,000
Hotel and property tax rebate assumptions
Rebate % of total Term (years)
State 0.0% 30
City 100.0% 10
Local 100.0% 10
Property 50.0% 10
Ground rent assumptions
Ground rent % total revenue 3.0%
Yield threshold 10.0%
Ground rent cap rate 4.5%
Annual growth beyond year 12 2.0%
Discount rate 10.0%
1 2 3 4 5 6 7 8 9 10 30
Site Prep / Pre-
Development /
Construction
Construction Year 1 Year 2 Year 3 Year 4 Year 5 Year 6 Year 7 Year 8 Year 9 Year 10 Year 30
2020 2021 2022 2023 2024 2025 2026 2027 2028 2029 2030 2031 2051
Hotel Development Costs (75,000,000)$ (75,000,000)$
Cash Flow From Hotel Operation 6,596,000 9,085,000 10,969,000 11,141,000 11,368,000 11,597,000 11,841,000 12,025,000 12,269,000 12,518,000 18,700,000
Public Subsidy
Hotel tax rebates
Total Rooms Revenue 19,150,000 22,540,000 25,380,000 25,820,000 26,350,000 26,880,000 27,500,000 27,980,000 28,540,000 29,120,000 43,410,000
6.5% State - - - - - - - - - - -
6.0% City 1,149,000 1,352,000 1,523,000 1,549,000 1,581,000 1,613,000 1,650,000 1,679,000 1,712,000 1,747,000 -
1.125% Local 215,000 254,000 286,000 290,000 296,000 302,000 309,000 315,000 321,000 328,000 -
Property taxes 1,050,000 1,071,000 1,093,000 1,115,000 1,137,000 1,160,000 1,184,000 1,208,000 1,232,000 1,257,000 1,870,000
Property tax abatement 525,000 536,000 547,000 558,000 569,000 580,000 592,000 604,000 616,000 629,000 -
Ground rent calculation
Total Revenue 31,850,000 37,200,000 41,100,000 41,830,000 42,680,000 43,540,000 44,460,000 45,240,000 46,150,000 47,090,000 70,170,000
Ground rent - - - - (5,907) (234,907) (478,907) (662,907) (906,907) (1,155,907) (2,105,100)
Ground rent direct cap (47,713,333)
Key Money 2,000,000
Unlevered Cash Flow (75,000,000) (73,000,000) 8,485,000 11,227,000 13,325,000 13,538,000 13,808,093 13,857,093 13,913,093 13,960,093 14,011,093 14,066,093 (31,118,433)
Public Investment 34,380,000
Unlevered Cash Flow With Financial Enhancement (40,620,928)$ (73,000,000)$ 8,485,000$ 11,227,000$ 13,325,000$ 13,538,000$ 13,808,093$ 13,857,093$ 13,913,093$ 13,960,093$ 14,011,093$ 14,066,093$ (31,118,433)$
NPV with financial enhancement 0
Yield 5.8% 8.0% 9.7% 9.8% 10.0% 10.2% 10.4% 10.6% 10.8% 11.0% 16.5%
Source: JLL
Note: figures in italics are not being added up in the line "Unlevered Cash Flow"

© 2018 Jones Lang LaSalle IP, Inc. All rights reserved. 65
What could be the impact in Saint Paul?
• The City can offer tax rebates to recoup/reduce public investment. Assuming market ground
rent terms, the City will also collect ground rent beginning at a point when the developer
could reasonably afford to pay ground rent.
• JLL has quantified the value of public revenue steams below, inclusive of tax rebates.
Public discount rate 4.5%
Public Revenue - Incorporates Hotel Tax Rebates and Property Tax Abatements
Year 1 Year 2 Year 3 Year 4 Year 5 Year 6 Year 7 Year 8 Year 9 Year 10 Year 30
NPV 2022 2023 2024 2025 2026 2027 2028 2029 2030 2031 2051
Hotel taxes
State 32.3$ 1,245,000$ 1,465,000$ 1,650,000$ 1,678,000$ 1,713,000$ 1,747,000$ 1,788,000$ 1,819,000$ 1,855,000$ 1,893,000$ 2,822,000$
City 17.7 -$ - - - - - - - - - 2,605,000
Local 3.3 -$ - - - - - - - - - 488,000
Property tax 17.2 525,000 535,000 546,000 557,000 568,000 580,000 592,000 604,000 616,000 628,000 1,870,000
Ground rent 16.6 - - - - 6,000 235,000 479,000 663,000 907,000 1,156,000 2,105,000
Ground rent direct cap 45.7 47,713,000
Total 132.8$ 1,770,000$ 2,000,000$ 2,196,000$ 2,235,000$ 2,287,000$ 2,562,000$ 2,859,000$ 3,086,000$ 3,378,000$ 3,677,000$ 57,603,000$
Source: JLL
© 2018 Jones Lang LaSalle IP, Inc. All rights reserved. 66
What could be the impact in Saint Paul?
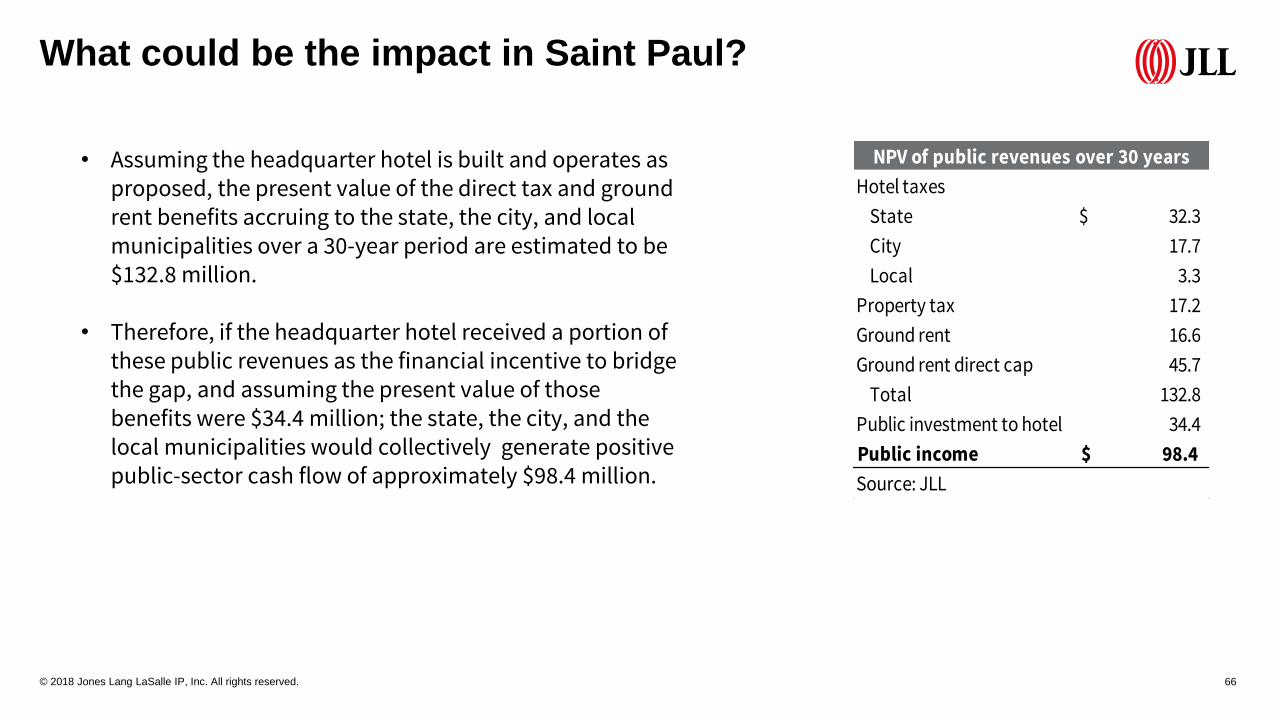
• Assuming the headquarter hotel is built and operates as proposed, the present value of the direct tax and ground rent benefits accruing to the state, the city, and local municipalities over a 30-year period are estimated to be $132.8 million.
• Therefore, if the headquarter hotel received a portion of these public revenues as the financial incentive to bridge the gap, and assuming the present value of those benefits were $34.4 million; the state, the city, and the local municipalities would collectively generate positive public-sector cash flow of approximately $98.4 million.
Hotel taxes
State 32.3$
City 17.7
Local 3.3
Property tax 17.2
Ground rent 16.6
Ground rent direct cap 45.7
Total 132.8
Public investment to hotel 34.4
Public income 98.4$
Source: JLL
NPV of public revenues over 30 years
© 2018 Jones Lang LaSalle IP, Inc. All rights reserved. 67
What could be the impact in Saint Paul?
• JLL analyzed the direct economic impact of building the Proposed Hotel at the RiverCentre. This incorporates economic impact from construction through operation.
• For construction impact, JLL incorporates sales taxes related to hard costs and FF&E/OS&E for items purchased in-state and locally.
• For ongoing impact, JLL incorporates projected hotel revenues with daily spending averages for those out-of-hotel revenue streams per the Destination Marketing Association International multipliers. These estimates pertain to both guest of the Proposed Hotel as well as event goers eating in area restaurants and staying at other hotels, for example.
© 2018 Jones Lang LaSalle IP, Inc. All rights reserved. 68
What could be the impact in Saint Paul?
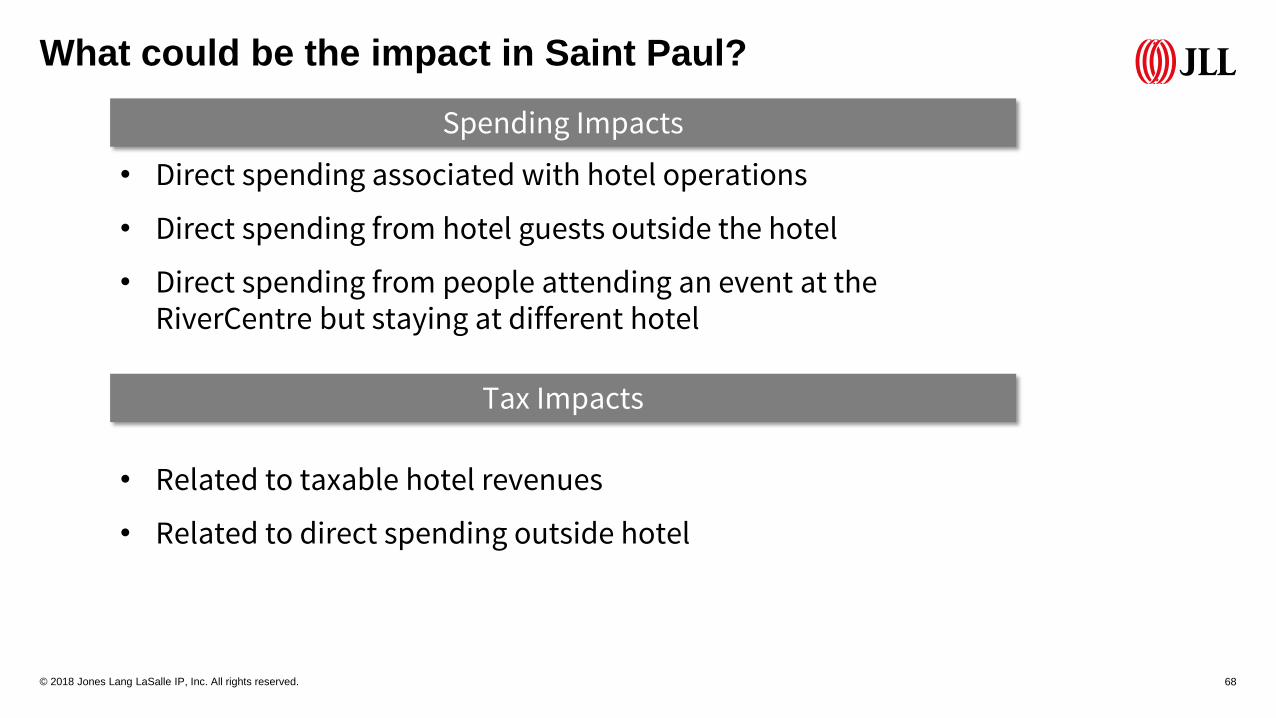
• Direct spending associated with hotel operations
• Direct spending from hotel guests outside the hotel
• Direct spending from people attending an event at the RiverCentre but staying at different hotel
• Related to taxable hotel revenues
• Related to direct spending outside hotel
Spending Impacts
Tax Impacts

© 2018 Jones Lang LaSalle IP, Inc. All rights reserved. 69
What could be the impact in Saint Paul?
Construction Impacts
2017$
Spending Impact
Direct 105,000,000$
Employment Impact
Direct (Total/Local) 840/210
Tax Impact
State Sales 2,670,000
City Sales 194,000
Local Sales 97,000
Total Direct 2,961,000$
Source: JLL
• Through an economic impact analysis, JLL projects a total direct impact from hotel construction of $3.0M and an ongoing annual direct impact of approximately $4.8M by year three of hotel operations.
Ongoing Annual Impacts
Stabilized yr. 3 in 2017$
Spending Impact
Direct Spend 41,601,000$
Employment Impact
Direct Hotel Jobs 300
Tax Impact
Direct
State
State Sales 1,000,000
State Lodging 1,620,000
State Property 201,000
Subtotal 2,821,000
City
City Sales 73,000
City Lodging 1,500,000
City Property 131,000
Subtotal 1,704,000
Local
Local Sales 34,000
Local Lodging 262,000
Local Property 12,000
Subtotal 308,000
Total Direct 4,833,000$
Source: JLL
Appendix
© 2018 Jones Lang LaSalle IP, Inc. All rights reserved. 71
Appendix
Hotel City Open Date Rooms
InterContinental St Paul Riverfront Saint Paul Jun-65 410
The Saint Paul Hotel Saint Paul Jun-10 255
DoubleTree St Paul Downtown Saint Paul Jun-80 251
Embassy Suites St Paul Downtown Saint Paul Jul-83 208
Holiday Inn St Paul Downtown Saint Paul Jun-79 195
Hampton Inn & Suites St Paul Downtown Saint Paul Nov-16 160
Hyatt Place St Paul Downtown Saint Paul Sep-16 149
Best Western Plus Capitol Ridge Saint Paul Jan-64 127
Hotel City Open Date Rooms
Marriott Minneapolis City Center Minneapolis Apr-86 583
InterContinental St Paul Riverfront Saint Paul Jun-65 410
Radisson Blu Minneapolis Downtown Minneapolis Mar-87 360
Curio Collection The Marquette Hotel Minneapolis Jun-70 282
Westin Minneapolis Minneapolis May-07 214
Kimpton The Grand Hotel Minneapolis Minneapolis Jul-00 140
Source: JLL, STR
Local competitive set
Aspirational competitive set

© 2018 Jones Lang LaSalle IP, Inc. All rights reserved. 72
Appendix
Contract Date Transaction Property City Price Rooms Price per RoomCap rate (%)
Feb-15 Westin Minneapolis Minneapolis 2015 Minneapolis $66,400,000 214 $310,000 6.4
Jan-16 Hilton The Marquette Hotel Minneapolis 2016 Minneapolis $74,500,000 281 $265,000 6.9
May-14 Wyndham Graves 601 Hotel 2014 Minneapolis $65,000,000 255 $255,000 5.5
Jul-15 Le Meridien Chambers Minneapolis 2015 Minneapolis $15,000,000 60 $250,000 6.0
Dec-16 The Commons Hotel Minneapolis 2016 Minneapolis $63,400,000 304 $209,000 N/A
Oct-12 The Hotel Minneapolis Autograph Collection 2012 Minneapolis $46,000,000 222 $207,000 6.6
Aug-16 DoubleTree Suites Minneapolis 2016 Minneapolis $40,200,000 229 $176,000 8.3
Jul-16 Hilton Minneapolis 2016 Minneapolis $143,000,000 821 $174,000 7.8
Mar-17 Marriott Minneapolis Northwest 2017 Brooklyn Park $29,250,000 230 $127,000 9.8
Oct-15 Doubletree Minneapolis Park Place 2015 Minneapolis $37,325,500 297 $126,000 N/A
Mar-14 Embassy Suites Bloomington 2014 Bloomington $24,000,000 218 $110,000 N/A
Jul-14 Marriott Minneapolis Southwest 2014 Minnetonka $33,100,000 321 $103,000 7.3
Source: JLL
Note: pertains to sales over $100K per room
Minneapolis area full service hotel sales since 2012
Proposed HQ Hotel at the RiverCentre
Discounted Cash Flow Asset Value Analysis (USD'000)
Summary of Assessment Key Variables Present Value Matrix - Net Value after Capital Deductions
Date of Valuation 12/31/2021 Discount Rate 10.5% Value USD'000, Value USD/ key, 2022 Adj. EBITDA Cap Rate
Holding Period 10 Years Terminal Cap Rate 8.0% Discount Rate Terminal Cap Rate
Land Tenure Freehold/Fee - Simple Closing Costs % 1.0% 7.0% 7.5% 8.0% 8.5% 9.0%
Acquisition Costs % 0.0%
California Real Estate Tax1.1%
Value Calculations Gross Yield Net Yield
PV of Terminal 58,496 2022 5.4% 5.4%
PV of Income Stream 63,186 2023 7.5% 7.5%
Gross Value 121,682 243 / key 2024 9.0% 9.0%
Acquisition Costs 0 2025 9.2% 9.2%
Capital Deductions 0 2026 9.3% 9.3%
Net Value 121,682 243 / key 2027 9.5% 9.5%
Terminal Value 2028 9.7% 9.7%
Year 11 EBITDA Less Replacement Reserve12,829 2029 9.9% 9.9%
Year 10 Residual Value 160,366 2030 10.1% 10.1%
Closing Costs 1,604 2031 140.8% 140.8%
Net Reversion Proceeds 158,762 318 / key 2032 0.0% 0.0%
Secondary Currency Value ('000) 2033 0.0% 0.0%
117,377
235 / key
5.6%
114,372
229 / key
5.8%
130,039
260 / key
5.1%
111,449
223 / key
5.9%
10.5%
113,813
228 / key
5.8%
110,669
221 / key
6.0%
107,874
216 / key
6.1%
125,649
251 / key
5.2%
121,389
243 / key
5.4%
117,661
235 / key
5.6%
11.0%
11.5%
121,450
243 / key
5.4%
125,582
251 / key
5.3%
121,682
243 / key
5.4%
118,241
236 / key
5.6%
115,183
230 / key
5.7%
9.5%
134,629
269 / key
4.9%
129,966
260 / key
5.1%
125,885
252 / key
5.2%
119,084
238 / key
5.5%
122,284
245 / key
5.4%
10.0%
139,431
279 / key
4.7%
134,550
269 / key
4.9%
130,279
261 / key
5.1%
126,511
253 / key
5.2%
123,161
246 / key
5.4%
© 2018 Jones Lang LaSalle IP, Inc. All rights reserved. 73
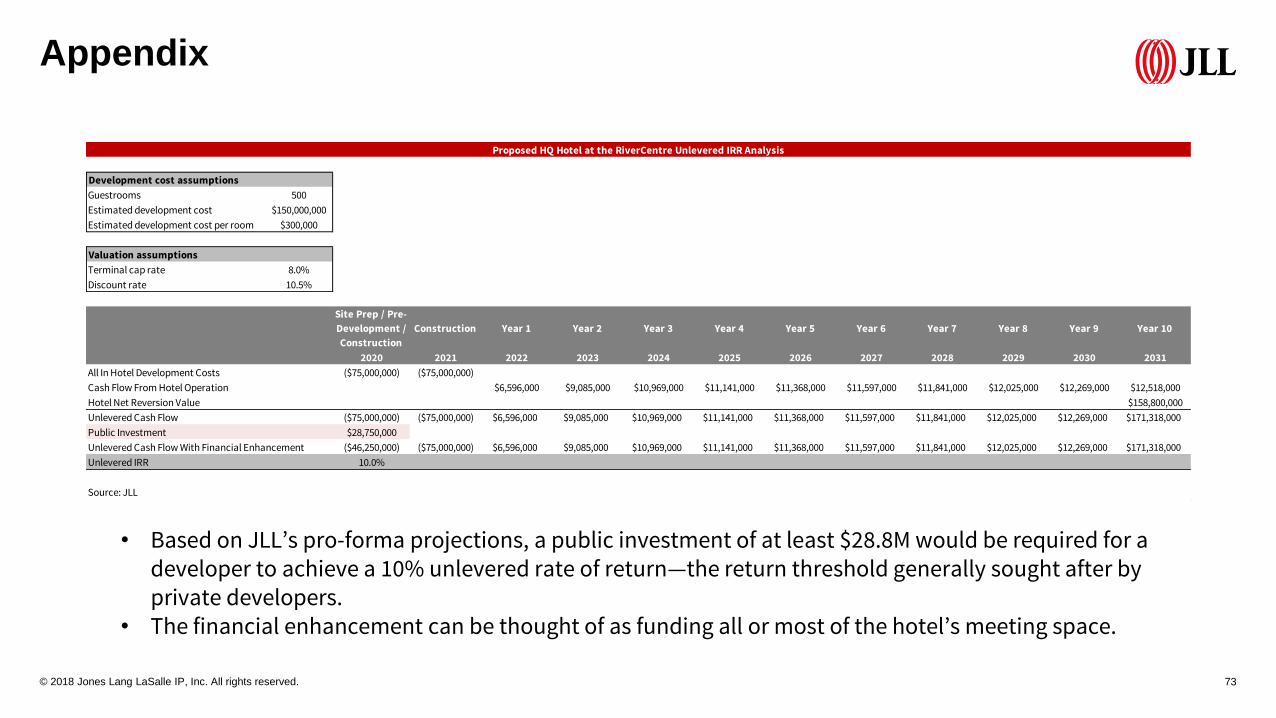
Appendix
• Based on JLL’s pro-forma projections, a public investment of at least $28.8M would be required for a developer to achieve a 10% unlevered rate of return—the return threshold generally sought after by private developers.
• The financial enhancement can be thought of as funding all or most of the hotel’s meeting space.
Development cost assumptions
Guestrooms 500
Estimated development cost $150,000,000
Estimated development cost per room $300,000
Valuation assumptions
Terminal cap rate 8.0%
Discount rate 10.5%
Site Prep / Pre-
Development /
Construction
Construction Year 1 Year 2 Year 3 Year 4 Year 5 Year 6 Year 7 Year 8 Year 9 Year 10
2020 2021 2022 2023 2024 2025 2026 2027 2028 2029 2030 2031
All In Hotel Development Costs ($75,000,000) ($75,000,000)
Cash Flow From Hotel Operation $6,596,000 $9,085,000 $10,969,000 $11,141,000 $11,368,000 $11,597,000 $11,841,000 $12,025,000 $12,269,000 $12,518,000
Hotel Net Reversion Value $158,800,000
Unlevered Cash Flow ($75,000,000) ($75,000,000) $6,596,000 $9,085,000 $10,969,000 $11,141,000 $11,368,000 $11,597,000 $11,841,000 $12,025,000 $12,269,000 $171,318,000
Public Investment $28,750,000
Unlevered Cash Flow With Financial Enhancement ($46,250,000) ($75,000,000) $6,596,000 $9,085,000 $10,969,000 $11,141,000 $11,368,000 $11,597,000 $11,841,000 $12,025,000 $12,269,000 $171,318,000
Unlevered IRR 10.0%
Source: JLL
Proposed HQ Hotel at the RiverCentre Unlevered IRR Analysis
© 2018 Jones Lang LaSalle IP, Inc. All rights reserved.
Thank you
Eric GorensteinAssociate
Hotels & Hospitality Group
(312) 228-3518
Executive Vice President
Hotels & Hospitality Group
(404) 307-9279
Tony Peterman


