UPEC2010 31st Aug - 3rd Sept 2010 Proposed Iceland/UK (Peterhead) 1.2 GW HVDC Cable 1 Thomas J. Hammons , Univeity of Glasgow, United Kingdom. Email: [email protected]Egill Benedikt Hreinsson, University of Iceland, Reykjavik, Iceland. Email: [email protected]Piotr Kacejko, Lublin University of Technology, Poland. Email: [email protected]Abstract This Paper presents and discusses the current situation of developments in harnessing hydropower in Iceland for large- scale generation of electricity for export by cable to the United Kingdom. It addresses (i) market considerations with cost of electricity from new offshore and inland wind power, gas and coal-fired plant, and nuclear plant, (ii) investments for the development of hydro resources in Iceland, (iii) submarine cables and converter plant, and (iv) overall capacity of the link. It is noted that (a) there should be no major difficulties in the manufacture and laying of submarine cables of length and type necessary for the Link, (b) availability of the connection should be at least equal to that of new coal/gas and nuclear plant, and (c) cost of delivered energy would be very competitive with offshore and onshore wind, and of new coal/gas and nuclear plant. Also reviewed is deep drilling projects in Iceland, the exploration of deep unconventional geothermal resources in NE Iceland that could be harnessed in future that could be developed in future for the link. The economics, availability, and reliability of geothermal plants are reviewed. Keywords: Market considerations for HVDC Link; economics of Icelandic hydro power; hydro developments in Iceland; HVDC submarine cables; HVDC converter stations; power generation costs for Iceland/UK cable; geothermal power generation; drilling for geothermal energy; geothermal research and development. 1. Introduction This paper discusses economically harnessable hydropower in Iceland for transmission to the UK and onwards as an energy source for reducing greenhouse gas emissions. It is an update of an earlier paper on Feasibility of Iceland/United Kingdom HVDC Submarine Cable Link published in 1989 [1], and others [2-5]. Advanced Geothermal Power Generation in Iceland that could be developed as a source of renewable energy for the UK and Europe in future is evaluated in Reference [6]. Other early proposals and studies include [7], and later studies and discussions primarily on a spot market based links include [8-10]. These have also reviewed the Iceland energy resources in this context to considerable detail. Onshore and offshore wind-power is being developed extensively in the UK at this time and new high-efficiency gas/coal-fired plant is being commissioned. New nuclear plant is planned to replace the existing life-expired nuclear generation. Iceland is a huge energy opportunity as North Sea oil resees are declining rapidly. Iceland has huge untapped hydro potential. Iceland has a unique geographical location on the collision/edge of two huge tectonic plates: the European and the North American. This creates possibilities to harvest by deep drilling, when the technology is proven, vast amounts of geothermal on the low height parts of the fault. Iceland's total external debt is now between 400% and 900% of its GDP, depending on the reference. Up to half of that may be short term. As a result, the economy will decline rapidly if this is not addressed appropriately. The GDP/debt ratio will increase more if nothing is done. Energy for debt has therefore been proposed to benefit the Icelandic economy, rather than demanding huge amounts out of a heavily damaged economy without supporting necessary recovery. In this proposal, the interests of the debtor and of creditors merge into a common plan for the future. This paper addresses the viability of a submarine cable connection from Iceland to Scotland to connect with the proposed EU HVDC cable hub at Peterhead in Scotland with onward connections to England, Netherlands, Europe and Scandinavia (see Ten year Neork Development Plan, http:ensoe.eul). Hydro developments in Iceland, submarine cables, HVDC transmission, rectifier/inverter stations, investment cost attributable to a power sale, availability of the conneion, technical considerations and cost comparisons for electricity from Iceland to the UK are examined. It is noted the European Union hopes to generate a fiſth of its electricity from renewable energies by 2020. This requires its member states to easily move electricity from one country to another. Late 2009, nine European countries agreed to build a power grid of HV cables under the North Sea. It will be the first multinational grid designed to address the fluctuation nature of green power generation. The grid will transport energy generated by a mix of wind, hydro, solar, and tidal power between Belgium, Denmark, France, Germany, Noay, and the United Kingdom to better balance supply and demand. Energy produced at night in UK wind farms, for example, could be stored in Noay's hydropower facilities and released the following day. The European power companies currently plan around 100 GWs of offshore wind power. The North Sea cable project, estimated to cost the nine countries more than 30 billion Euros, will be financed through a mix of taxpayers' money and private investment, largely from energy companies. The proposed 1.2 GW Iceland power cable would be linked in to the Noh Sea cable grid at Peterhead and would operate partly base load but could partly be operated as means of interaion beeen the UK/North Sea wind resources and Iceland hydroeleric reservoirs. Later developments could include the almost unlimited geothermal power from Iceland that could become available when the technology is proven. 2. Hydropower Sites in Iceland: Capacity, Energy, Connection Cost and Energy in Cost Group Investment costs are given in pounds sterling at January 2010 prices using the exchange rate that was applicable at the time. Some discrepancies will always be present because of rate of exchange fluctuations and different costs trends. Such T J Hammons, DSc, CEng, FIEEE, Inteational Practices for Energy Development and Power Generation, Glasgow University, llC Winton Drive, Glasgow G 12 OPZ, United Kingdom, Tel: +44-141-339-7770.
Transcript
UPEC2010 31st Aug - 3rd Sept 2010
Proposed Iceland/UK (Peterhead) 1.2 GW HVDC Cable
1 Thomas J. Hammons , University of Glasgow, United Kingdom. Email: [email protected]
Egill Benedikt Hreinsson, University of Iceland, Reykjavik, Iceland. Email: [email protected] Piotr Kacejko, Lublin University of Technology, Poland. Email: [email protected]
Abstract
This Paper presents and discusses the current situation of developments in harnessing hydropower in Iceland for largescale generation of electricity for export by cable to the United Kingdom. It addresses (i) market considerations with cost of electricity from new offshore and inland wind power, gas and coal-fired plant, and nuclear plant, (ii) investments for the development of hydro resources in Iceland, (iii) submarine cables and converter plant, and (iv) overall capacity of the link.
It is noted that (a) there should be no major difficulties in the manufacture and laying of submarine cables of length and type necessary for the Link, (b) availability of the connection should be at least equal to that of new coal/gas and nuclear plant, and (c) cost of delivered energy would be very competitive with offshore and onshore wind, and of new coal/gas and nuclear plant.
Also reviewed is deep drilling projects in Iceland, the exploration of deep unconventional geothermal resources in NE Iceland that could be harnessed in future that could be developed in future for the link. The economics, availability, and reliability of geothermal plants are reviewed.
Keywords: Market considerations for HVDC Link; economics of Icelandic hydro power; hydro developments in Iceland; HVDC submarine cables; HVDC converter stations; power generation costs for Iceland/UK cable; geothermal power generation; drilling for geothermal energy; geothermal research and development.
1. Introduction
This paper discusses economically harnessable hydropower in Iceland for transmission to the UK and onwards as an energy source for reducing greenhouse gas emissions. It is an update of an earlier paper on Feasibility of Iceland/United Kingdom HVDC Submarine Cable Link published in 1989 [1], and others [2-5]. Advanced Geothermal Power Generation in Iceland that could be developed as a source of renewable energy for the UK and Europe in future is evaluated in Reference [6].
Other early proposals and studies include [7], and later studies and discussions primarily on a spot market based links include [8-10]. These have also reviewed the Iceland energy resources in this context to considerable detail.
Onshore and offshore wind-power is being developed extensively in the UK at this time and new high-efficiency gas/coal-fired plant is being commissioned. New nuclear plant is planned to replace the existing life-expired nuclear generation. Iceland is a huge energy opportunity as North Sea oil reserves are declining rapidly.
Iceland has huge untapped hydro potential. Iceland has a unique geographical location on the collision/edge of two huge tectonic plates: the European and the North American. This creates possibilities to harvest by deep drilling, when the
technology is proven, vast amounts of geothermal on the low height parts of the fault.
Iceland's total external debt is now between 400% and 900% of its GDP, depending on the reference. Up to half of that may be short term. As a result, the economy will decline rapidly if this is not addressed appropriately. The GDP/debt ratio will increase more if nothing is done. Energy for debt has therefore been proposed to benefit the Icelandic economy, rather than demanding huge amounts out of a heavily damaged economy without supporting necessary recovery. In this proposal, the interests of the debtor and of creditors merge into a common plan for the future.
This paper addresses the viability of a submarine cable connection from Iceland to Scotland to connect with the proposed EU HVDC cable hub at Peterhead in Scotland with onward connections to England, Netherlands, Europe and Scandinavia (see Ten year Network Development Plan, http://ensoe.eul). Hydro developments in Iceland, submarine cables, HVDC transmission, rectifier/inverter stations, investment cost attributable to a power sale, availability of the connection, technical considerations and cost comparisons for electricity from Iceland to the UK are examined.
It is noted the European Union hopes to generate a fifth of its electricity from renewable energies by 2020. This requires its member states to easily move electricity from one country to another. Late 2009, nine European countries agreed to build a power grid of HV cables under the North Sea. It will be the first multinational grid designed to address the fluctuation nature of green power generation. The grid will transport energy generated by a mix of wind, hydro, solar, and tidal power between Belgium, Denmark, France, Germany, Norway, and the United Kingdom to better balance supply and demand. Energy produced at night in UK wind farms, for example, could be stored in Norway's hydropower facilities and released the following day. The European power companies currently plan around 100 GWs of offshore wind power. The North Sea cable project, estimated to cost the nine countries more than 30 billion Euros, will be financed through a mix of taxpayers' money and private investment, largely from energy companies. The proposed 1.2 GW Iceland power cable would be linked in to the North Sea cable grid at Peterhead and would operate partly base load but could partly be operated as means of interaction between the UK/North Sea wind resources and Iceland hydroelectric reservoirs. Later developments could include the almost unlimited geothermal power from Iceland that could become available when the technology is proven. 2. Hydropower Sites in Iceland: Capacity, Energy,
Connection Cost and Energy in Cost Group
Investment costs are given in pounds sterling at January 2010 prices using the exchange rate that was applicable at the time. Some discrepancies will always be present because of rate of exchange fluctuations and different costs trends. Such
T J Hammons, DSc, CEng, FIEEE, International Practices for Energy Development and Power Generation, Glasgow University, llC Winton Drive, Glasgow G 12 OPZ, United Kingdom, Tel: +44-141-339-7770.
deviations are not believed to be of vital importance in assessing the overall viability of the development.
Table I shows technically harnessable hydropower for each hydro plant in Iceland. It indicates that the potential is roughly 3 GW and would produce about 22,400 GWh/yr. The
Table also indicates approximate connection costs and cost of energy in the six cost groups for which the cheapest is listed first. Where capacity in MW and utilisation time in h/yr is not indicated, the energy is on account of water diversions or increased storage capacity.
T bl 1 H d a e 1yl rop ower S't . I I eS In d C ce an : 't E ap aclly, ner gy, C f C t d E onnecl on os an . C t G nergy In os roup Table Project Name Reference Capacity Energy Utilisa Cost Connection In Phase Energy Item Number on (MW) (GWh/yr) -tion Group Cost
# One in Cost Figure 1 Time (£/kWh/yr) Group
(h/yr) (£m/GWh/yr) (GWh/yr)
1 Skaftarveita an miolunar i Langasj6 17 -- 465 -- I -- No
2 Tungnirrl6n 24 -- 270 -- I -- No
3 NorolingaOlduveita- 566-567,5 m y.s. 27 -- 635 -- I -- No 1370 4 Arnardalsvirkjun 12 570 4000 7018 2 0.00316 Yes
12 H61msarvirkjun - miolun i H61msirrl6ni 20 72 470 6528 3 0.01684 No
13 H61msarvirkjun neori 21 48 360 7500 3 0.02200 No
14 Bjallavirkjun 25 46 340 7391 3 0.00711 No
15 BuoarMlsvirkjun 28 80 585 7313 3 0.00763 Yes
16 Selfossvirkjun 38 30 250 8333 3 0.00279 No 5097 17 Blonduveita 5 20 131 6550 4 0.01400 No
18 Skatastaoavirkjun C 7 156 1090 6987 4 0.00753 No
19 Villinganesvirkjun 8 33 237 7182 4 0.00795 Yes
20 Helmingsvirkjun 13 270 2100 7778 4 0.00126 No
21 Ojupa 14 75 498 6640 4 0.00626 No
22 Hverfistlj6t 15 40 260 6500 4 0.01411 No
23 Markartlj6tsvirkjun B 23 109 735 6743 4 0.01237 Yes
24 SkrokkOlduvirkjun 26 30 215 7167 4 0.05421 No
25 Hvammsvirkjun 29 82 665 8110 4 0.00363 Yes
26 Holtavirkjun 30 53 415 7830 4 0.00421 Yes
27 B1afellsvirkjun 33 76 536 7053 4 0.01395 Yes
28 Buoartunguvirkjun 34 50 320 6400 4 0.00989 No
29 Haukholtsvirkjun 35 60 358 5967 4 0.01000 No
30 Hestvatnsvirkjun 37 40 300 7500 4 0.00916 No 7860 31 Hvita i Borgarfiroi 1 20 125 6250 5 0.02905 No
32 Glamuvirkjun 2 67 400 5970 5 0.01089 No
33 Hvala 4 35 259 7400 5 0.02974 No
34 Eyjadalsarvirkjun 11 8 58 7250 5 0.02253 No
35 Markartlj6tsvirkjun A 22 14 120 8571 5 0.09394 Yes
36 Gygjarfossvirkjun 32 21 146 6952 5 0.11316 No
37 Hagavatnsvirkjun 39 20 140 7000 5 0.03232 No 1248 38 SkUfnavatnavirkjun 3 8.5 60 7059 6 0.09563 No
39 F1j6tshnUksvirkjun 9 58 405 6983 6 0.03163 Yes
40 Voroufell 36 52 170 3269 6 0.01074 No 635 Average 2993.5 22,405 7,485 22,405
ITotal Currency rate of exchange £1 - 190.0kr
#Construction cost of switchgear etc. for connection to HV AC System for firm hydro capacity in £m/GWh/yr (£lkWh/yr.).
This results in an increased allocation of system firm capacity in other projects/stations with installed MW but do not have their own installed MW in generators. While they are then
based on MW in other stations the cost benefit is allocated to specific construction projects (dams, etc.). Construction cost of
switchgear etc. for connection to the HV AC System for firm hydro capacity in £m/GWh/yr (£/kWh/yr.) is indicated
The data in Table 1 was downloaded on May 1 2010 from:
The Energy Investment Cost Groups: Energy, Power and Investment Cost are given in Table 2. The investment costs in columns 7-10 do not include interest during construction. The difference in bounds in columns 3 and 4 reflects the uncertainty associated with the projects within each cost group.
The cost group and the upper and lower bound definitions and explanations given in Table 2 are from:
Location of Major Hydro Power Plants, possible Geothermal Plants and HVDC Converter Stations in Iceland for the Proposed Iceland/UK HVDC Cable Link is illustrated in Figure 1. Figure 1 also includes locations for major geothermal sites although these are not included in the present paper.
a e : T bl 2 E t nergy nves men t C t G os roups: E nergy, P ower an d l t nves men t C t os Energy Energy in Unit Cost for Hydro Average Cost Cost Group (£IkWh/yr) Power in
Group (GWh/yr) (£m/GWh/yr) Group Lower Upper Median (MW) bound bound
Investment cost in columns 7 - 10 does not include interest during construction Currency rate of exchange: £1 = 190 kr Average utilization time: 7500 h/yr
Investment Cost for
Hydro (£m)
192 978 979
1924 391 254
4718
Difference in bounds in column 3 reflects uncertainty associated with the projects.
AC System Total Unit Connection Investment Investment
Table 3. Cost of HVDC Converters, Cable, Cable Mobilisation and Installation & Burial: Iceland/Peterhead
MWRating Cost (£m) Comments HVDC Converters (Pair) 1200 250 Bipole assumed HVDC Cable 1200 1170 Bipole, therefore two cables required. Costs based on £1m/route
km Cable Mobilisation, - 121 Costs based on £5m mobilisation + installation/burial of Installation & Burial £ 1 OOklkm/cct Total - 1541 1.2 OW lInk from Iceland to a landmg pomt at Peterhead Scotland, dIstance 1170km. The four slgmficant figures results from calculatIons, so a test range is £1.SBn--£1.6Bn is of sufficient accuracy for cost analysis Source: Scottish and Southern Energy
3. Cost of HVDC Converters, Cable, Cable Mobilisation, and Installation/Burial: Iceland/Peterhead
This is indicated in Table 3. It corresponds to a 1.2 GW link from Iceland to a landing point at Peterhead Scotland, distance 1170km. The four significant figures results from calculations, so a test range is £1.58n to-£1.68n is of sufficient accuracy for cost analysis which is equivalent to about 2858n to 3058n Icelandic kr.
Cable cost is subject to variation due to movement in the market price of copper, lead and steel, and fluctuations in the exchange rates. The cost of cable mobilisation, installation and
burial is also uncertain and requires a thorough marine survey of the intended route to provide a reasonable estimate but can be considered as typically 8% to 15% of cable cost for long length. This does not include any embedding cost that may be necessary to improve the availability of the cable circuit.
�;01Ilr
a
-"'-
"';rolf' �
"bj c�
<,.;.
4J-4�
\BI.,,�
�
�
o-46lwr L-
�
I M,tiI�
, "' ..
""II
__
_ tl��. :z . . c""(;'
\ s;� ""
""" (
�
v
_fo
,. y� k
( .
.�
'-.
10 ,J
��_ f"-lL;\l�
RjojI(�' �
'-
� Giu&ic
C
' _
� I
81d-
" ,;-"
. 5-\"
/..
" --l/o"j6k,," \,. ) \
'( l " ',0
LW,\
h '" � I
11 [I �"
Q1
@92
/):
\-1\:,'1( /\ �/
'\-"-L
., 1 '\{
'-(
r"" 101
t l't o
Dl00 \.
'\. . a �99
'''�.
\ 9
7Ji'rrw
tlog
7 0
96
-,
� ( ;95
940 \-�
j'
910
\., ,-i1
12 L
J.� Hils-IOn
•
HVDC (,,11b
lt-
hu
ulin
g silt
:.lIu
l Jlo
ssiblt-
("OU
\"f'11f'
1"
slati
on
10("
aO
OIl
.�
b
l'-pi
m" I
j�-....
... ",J'
/
hI-..
.;==J. D
�- -
( ��.
�� -- ��
. :) .
10\". 1 _ -"
�
'>
1 Hv,tM 80rgarfi
rCi 2 CI�muvirkjun
I'\) (\
. W
en
.. 0
/
79 �SI
..0--0
91 \ �J
-.... "
3 Skufnaviltrl
avifklu
n
.. HvaI�J 6fetg
sfir6i 58IoM
IN.It.> 6 5Icaw
,.�.vmqun B
7 Slcatasl.O.virtjun C
8 Vllllng
anE,vi,kju
ll
9 flj6l,nnju1uvir1<jun
to Hriafni)bJargavirlclun A-
111 Eyfada
lsaNirkjun
ti. Amar<lalsvt
rkjun 13 He-Imingsvirkjun 1!4 Djupa 15 H .... rfi'NjOl 16 Skaftirvcita m
oo miOlun (Llng.a.sj-6 117 Slcaft.i
rveita an mialun
ar r lan9a�6 18 Slcaft.irvirkjun I' H
Olm,irvirkjun -on miol
lunar ZO H
OI"
".rvirkjun -micllun
i H61msarlooi
21 H61nuiiMrlcjun neori 22 MarlcaJ1!6"'irl<jun A Z3 Marlcarti6Uv
irl<jun 8 24 Tut"!g,
najrlQo
2S BjallaviJkjun 26 Skro!dt.oldLJVi
rkjun 27 N
orOlingCl<lldLNeita
:566-567.5 my.,.
28 BUO.rhilsvirtjun
S:9J--64
62�6�
61 _..,kl
a n .. 29 HV-iimmsvirkjun 30 Ii<>
�.virkj"n 31 Urriclafou-viJliun 32 Gygjarfossvi
'*jun 33 Blalen,v;
rI<jun 34 8,;6anunguvirklun 35 H
au,ho
lUvill<
jun
36 V
6,,;ufell 37 Hesh1alnlviriqun 3ft Selfossvi
ricjun 39 HagavaLnsvirkjun 40 B�
land
svirtiu
n
27� 26
17 ,
--�
2S
Z4
�
-[j�cli
A
D:f.
.... / .!:,
..J; '>/d'35
SuI .. rt.ng'D
Hr.u,;:"i'5�ldz"s
16
' \ N«j •• A----=-
-,-A
, .?
!')'ja.
\,,0
. 73�-''''"
-.
4" I
'�'o, -
-....
' M
L
. n"..,
7S D
Sog
036 ',s-
/ 85
• <;
') -"
. "�
" J'
M
�
<
� �
"-,
�'o
y,,�
"
, "
..
"" .. 0 ..
oJ
,�� ';j '>-
_,
�:.'o'
,-,/"
6S .' 'v
10 176 1-:. LJ, 1'-f..,. ry')!/
r-2��J.:40
\ :.:sf
-<;.,../
71 �)r�,.
r II
)
67
"(
\J�
M
rra�rl' 21 "
,
/P-
-,,,kull
�
'\, 'N
'" �
I" H
ytl.l"O
t-)H
hic P
OW
t-I: L
t-g.
NH
�E��til
lg 1)I:Ult�
21 R
dt-n
u("
t-Illunbt-I'. n
t-w h
y,b
"o
�
Rf>
st
rv
ou
" for
n).p
l'ais
:ll -
\V:U
fT
wa
yslt
uuu
t-1.c;
, I
'J<>.l. <.A.
, '�
•
10 20
lO 40
50
So
urc
e:
http
://www.ra
mm
aa
ae
tlun
.is/m
ed
ia/k
ortN
firlitsk
ort
.pd
f. L
an
ds
virk
jun
Ma
ste
r Pla
n
f"'-.................. ;» ..
........
� ),4
D1.5
Vatnajokull
.-/ �
�-t
�;("
5myltilbtOr
g�
Lt
gt
nd
Gf'
otlU'
nn
al P
ow
tr
:
Exi
stin
g p
lan
ts
76 R
tft-HU('t-
lUu
nb
t-I", Ilt-
W g
t-o
tht-
nn
al
P."o
jtC'
t for
:ll)p
ra
isa
l
�
High
t tt-Inl)tranu"f' ,2:t-otJatl'lnal an.l
".� -,,-
� .
61 Reykjanes
62 Sl6ra Sandvik 63 Eidvo
rp (Sva
rts.ng�
Q4 S.n<;ffd
65 Troll.dy
ngi. 66 Sve!fl
uh.l. 67 Auslurengjar 68 S,"".
i't.irlSr,oll 69 M
eitillin o 70 Grauhnukar 71 Hverahliol 72 H
.lli,h,iai
7l Inn,tid.lul 74 Pit
t. 75 trv
crilrdalur (6Ifu5Va!m
aendur)
76 blfusd. lur
77 Gr�
l\dalur
73 Geys;r
Fig
ure
1. L
oc
atio
n o
f Ma
jor H
yd
ro P
ow
er P
lan
ts, P
os
sib
le G
eo
the
rma
l Pla
nts
an
d H
VDC
Co
nv
ert
er S
tatio
ns
in Ic
ela
nd
for th
e P
rop
os
ed
Ice
lan
d/U
K
HV
DC C
ab
le L
ink
79 HYerabolfl
80 NeOri Hverad
.lir 81 Kiw
botnar
82 wcrf
cll 8� kv
eraveftir 84 Slav
",'';
,1 85 V",tur-l
leykiad,lir 86 A"l\l,.I
r-ReykjilQalir
87 46sartungul
88 lolrullU
ng"' 89 Ka
ld.klof 90 Lo
n<lm
.nn.laugar 91 H'go
ngU'l;rl<jun 92 Vonarskaro 93 Kveriofj
611 94 A'kia 9 S H
rutMlsar
96 Fremrioamar
97 Bjam.arflag 98 Krafla I .. .s�k
kun 99 Krafla II
100 Giilly\<1d 1 01 �eistarey
ldr
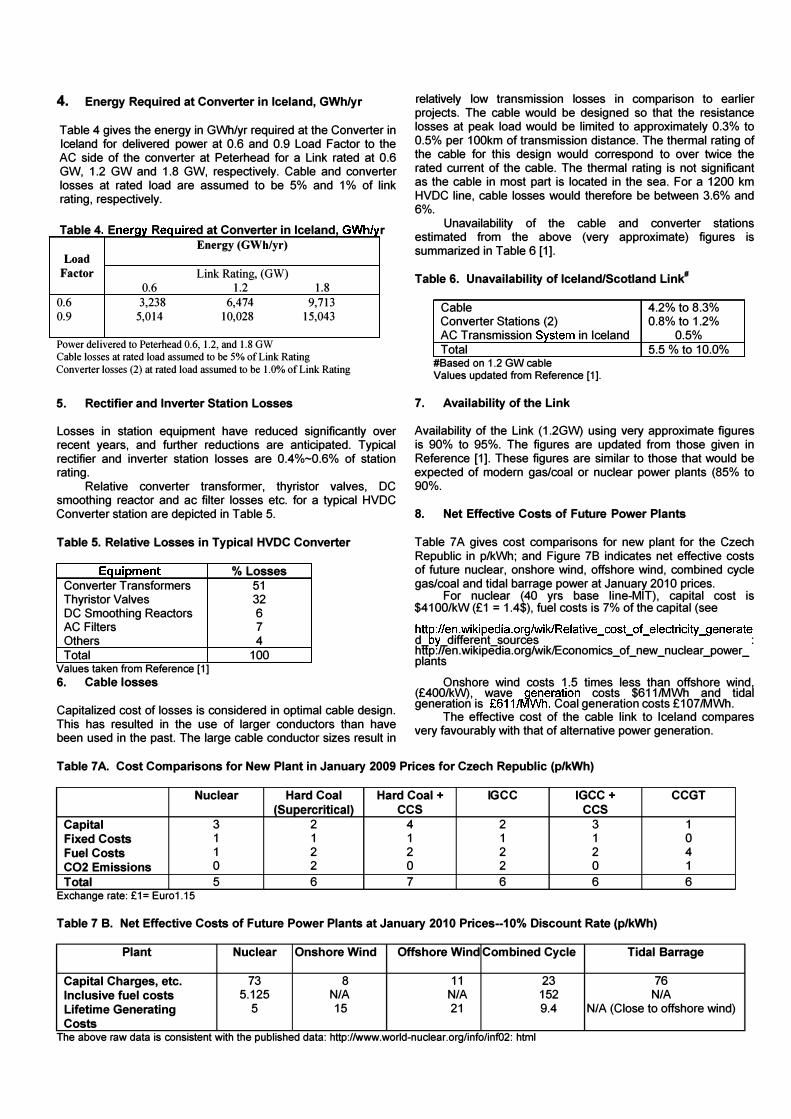
4. Energy Required at Converter in Iceland, GWh/yr
Table 4 gives the energy in GWh/yr required at the Converter in Iceland for delivered power at 0.6 and 0.9 Load Factor to the AC side of the converter at Peterhead for a Link rated at 0.6 GW, 1.2 GW and 1.8 GW, respectively. Cable and converter losses at rated load are assumed to be 5% and 1 % of link rating, respectively.
T bl 4 E a e nergy R . d t C eqUire a rt . I I d GWh/ r onve er In ce an , 1/'1 Energy (GWh/yr)
Power delIvered to Peterhead 0.6, 1.2, and 1.8 OW Cable losses at rated load assumed to be 5% of Link Rating Converter losses (2) at rated load assumed to be 1.0% of Link Rating
5. Rectifier and Inverter Station Losses
Losses in station equipment have reduced significantly over recent years, and further reductions are anticipated. Typical rectifier and inverter station losses are 0.4%-0.6% of station rating.
Relative converter transformer, thyristor valves, DC smoothing reactor and ac filter losses etc. for a typical HVDC Converter station are depicted in Table 5.
Table 5. Relative Losses in Typical HVDC Converter
Equip ment Converter Transformers Thyristor Valves DC Smoothing Reactors AC Filters Others Total
Values taken from Reference [1]
6. Cable losses
% Losses 51 32 6 7 4
100
Capitalized cost of losses is considered in optimal cable design. This has resulted in the use of larger conductors than have been used in the past. The large cable conductor sizes result in
relatively low transmission losses in comparison to earlier projects. The cable would be designed so that the resistance losses at peak load would be limited to approximately 0.3% to 0.5% per 100km of transmission distance. The thermal rating of the cable for this design would correspond to over twice the rated current of the cable. The thermal rating is not significant as the cable in most part is located in the sea. For a 1200 km HVDC line, cable losses would therefore be between 3.6% and 6%.
Unavailability of the cable and converter stations estimated from the above (very approximate) figures is summarized in Table 6 [1].
Table 6. Unavailability of Iceland/Scotland Link#
Cable 4.2% to 8.3% Converter Stations (2) 0.8% to 1.2% AC Transmission System in Iceland 0.5% Total 5.5 % to 10.0%
#8ased on 1.2 GW cable Values updated from Reference [1].
7. Availability of the Link
Availability of the Link (1.2GW) using very approximate figures is 90% to 95%. The figures are updated from those given in Reference [1]. These figures are similar to those that would be expected of modern gas/coal or nuclear power plants (85% to 90%.
8. Net Effective Costs of Future Power Plants
Table 7A gives cost comparisons for new plant for the Czech Republic in p/kWh; and Figure 78 indicates net effective costs of future nuclear, onshore wind, offshore wind, combined cycle gas/coal and tidal barrage power at January 2010 prices.
For nuclear (40 yrs base line-MIT), capital cost is $4100/kW (£1 = 1.4$), fuel costs is 7% of the capital (see
http://et:J.wikipedia.org/wiklRelative_cost_oCelectricitLgenerate d by different sources : hHp:ffen.wikipedia.orglwiklEconomics of new nuclear power plants
- - - - -
Onshore wind costs 1.5 times less than offshore windl (£400/kW), wave generation costs $611/MWh and tida
generation is £611/MWh. Coal generation costs £107/MWh. The effective cost of the cable link to Iceland compares
very favourably with that of alternative power generation.
Table 7A. Cost Comparisons for New Plant in January 2009 Prices for Czech Republic (p/kWh)
Nuclear Hard Coal Hard Coal + IGCC IGCC+ CCGT (Supercritical) CCS CCS
Capital Charges, etc. 73 8 11 23 76 Inclusive fuel costs 5.125 N/A N/A 152 N/A Lifetime Generating 5 15 21 9.4 N/A (Close to offshore wind) Costs
The above raw data IS consistent with the published data. http.llwww.world-nuclear.orglinfollnf02: html
9. Scheme Development Costs at January 2010 Prices (£m)
Table 8 gives scheme development costs at January 2010 prices for hydro development (including AC system switchgear in Iceland), HVDC cables, converters, and AC transmission system development in Iceland. Cost of hydro development corresponds to load factors of 0.6 and 0.9.
Table 8. Scheme Development Costs at January 2010 Prices (£m)---Taken from Tables 1, 2 & 3 above
Rating Load Development Cost (£m) (MW) Factor a b c d 600 0.6 498.8 706 125 50
0.9 2826.4 1876 375 150 a Hydro development (including AC System Connection) b HVDC submarine cables c Converter stations (2) d AC system development in Iceland
Total
1379.8 1661.3 2657.1 3352.2 4015.1 5227.4
Rating in MW is for energy delivered to the AC Network at Peterhead where DC transmission system losses are allowed for.
Cost of hydro development including AC system connection in Iceland evaluated using energy in Energy Cost Groups in ascending order
10. Cost of Delivered Energy
Three contributions should be considered in estimating the cost of delivered energy. These are:
(i) payback of loan on capital investment and interest charges
(ii) running costs including cost of maintenance (iii) losses in cables and converters.
Running costs and cost of maintenance for hydropower are quite low in comparison with other costs and may be ignored in an initial economic assessment. Overall transmission losses are assumed to be as indicated in Section 4.
The average cost of delivered energy is given by:
Cost/kWh = (total payback + total interest charges) = PB (total number of units delivered) U
where PB = I {[component cost] x time / payback period} +
and
+ I [component cost / yr] x [rate of interest]
U = 365 x 24 x [delivered power] x [load factor] x yr
This algorithm is modified appropriately to give the average cost of delivered energy over different times, i.e. 1yr, 25yr, 40yr.
Table 9 gives the cost of delivered energy at the AC side of the converter at Peterhead over the first year of operation at January 2010 prices for 600 MW, 1200 MW and 1800 MW delivered at 0.6 and 0.9 load factor to the AC system at Peterhead corresponding to interest at 4.5%, 6.0%, and 8.0%, respectively. It is assumed that the payback period is 40 yr for hydro and the AC transmission system in Iceland, and 25 yr for converter stations and the HVDC cable.
Availability is assumed to be 100%.
Table 9. Cost of Delivered Energy over First Year at January 2010 Prices (Payback period based on Realistic
Payback penod: 40 yr-hydro and AC transmission system In Iceland Payback period: 25 yr-converter stations and HVDC cable Availability 100%
Table 10 indicates ccost of delivered energy to Peterhead over the first year for the payback period based on plant expected life of 80 yr for hydro, and 40 yr for HVDC cables, converter stations and AC system development in Iceland. The cost corresponds to interest at 4.5%, 6.0% and 8.0%, respectively. It is assumed that the Link rating corresponds to power supplied to the converter in Iceland, not that which is delivered to Peterhead.
Comparison of Table 1 0 with Table 9 shows that cost of delivered energy over the first year is less if the payback period is based on system component expected life.
Table 10. Cost of Delivered Energy to Peterhead over First Year at January 2010 Prices (Payback Period based on
Plant Expected Life)
Energy Cost (p/kWh)
Rating (MW) 600 1200 1800 Load Factor 0.6 0.9 0.6 0.9 0.6 0.9 Gen. Energy
Payback penod: 80 yr for hydro Payback period 40 yr for HVDC cables, Converter stations and AC
System development in Iceland
Availability 100%
Table 11 indicates ccost of delivered energy to Peterhead over the first year of operation, over 25 yr and over 40 yr for the payback period based on plant expected life of 80 yr for hydro, and 40 yr for HVDC cables, converter stations and AC system development in Iceland. The cost corresponds to interest at 4.5%, 6.0% and 8.0%, respectively. It is assumed that the Link rating corresponds to power delivered at Peterhead (not that which is supplied to the converter station in Iceland).
Comparison of Table 11 with Table 10 shows that cost of delivered energy over 25 and 40 yr based on equal annuity analysis for payback period based on plant expected life is less than for the first year. However, the HVDC cables, converter stations and AC system development in Iceland would need renewing after 40 years.
Table 11. Average Cost of Energy Delivered to Peterhead at January 2010 Prices-Equal Annuity Analysis (Payback
Payback penod: 80 yr for hydro Payback period 40 yr for HVDC cables, Converter stations and AC
System development in Iceland Interest charges during construction ignored (this is included roughly in
development cost) Availability 100%
11. Geothermal Energy
During the last 5-10 years, the development of sustainable geothermal and hydropower resources in Iceland has been the most intensive and fastest growing in Europe. It has also more of these energy resources per capita than any other country. A total of about 1250 MW has been developed and some 1300 MW are to come on line within the next decade. Recent projects include the first phases (400 MW) of the Hellisheidi Geothermal Scheme [6].
Table 12 shows the world the technical potential of renewable energy resources (WEA, 2000) [11]. The technical potential is the yearly availability of the renewable resources. These estimates suggest that the technical potential of renewables is sufficiently large to meet future world energy requirements. The present annual consumption of primary energy in the world is about 400 EJ.
Table 12. Technical Potential of Renewable Energy Sources in Exajoules/a
EJ per year
Hydropower 50 Biomass 276 Solar ener!:lY 1575 Wind ener!:lY 640 Geothermal energy 5000 TOTAL 7600
Source: World Energy Assessment (WEA, 2000) [11]
Evidently, a large opportunity to cut GHG emission exists with the geothermal energy sector. However this estimate did not include innovations such as the Iceland Deep Drilling Project (lOOP) [6].
In summary, the long-term program to improve efficiency and economics of geothermal energy by harnessing deep unconventional geothermal resources is an ambitious project to produce electricity from natural supercritical hydrous fluids from drillable depths. Producing higher-temperature fluids for
generation of electric power offers two advantages over using the fluids from conventional wells: (i) higher enthalpy, which promises high power output and higher efficiency per unit mass, and (ii) higher pressure, which keeps the fluid density high and thus contributes to higher mass-flow rates. The choice of technology to be applied for power generation from these high-temperature fluids will be decided after determining the physical and chemical properties of the fluids that are produced.
There are three approaches to improve the economics of the geothermal industry worldwide: (i) cascading the usage of geothermal energy by using the effluent water from electricity production for industrial processes and for domestic heating, (ii) reducing the cost of drilling and completing geothermal production wells, and (iii) reducing the number of wells needed by increasing the power output of each. The best way to achieve the latter is to produce supercritical fluids. Successful completion of the lOOP project is of considerable importance for the geothermal industry at large. A successful outcome would be a major step forward for the geothermal industry on a global scale, which in turn, could help counterbalance the threat of global warming by increased use of sustainable, nonpolluting energy resources.
Potential Geothermal developments in Iceland are summarised in:
(1) Cost of electricity delivered would be very competitive with that from new wind-farms, nuclear, modern gas/coal fired plant, and tidal barrage / tidal stream power.
(2) Availability of the connection should at least equal that from nuclear, and gas/coal fired plant.
(3) No major difficulties are anticipated in manufacturing, laying and repairing the submarine cables or in construction of hydro schemes for the Link.
(4) Expected life for hydro developments is at least 60 years, submarine cables 50 years, and rectifier/inverter stations 30-40 years.
(5) The link could be considerably expanded in future to utilize deep-well geothermal power when the technology is proven
(6) The contribution would make a significant contribution towards UK and European targets for renewable energy. The development would benefit the Icelandic economy, rather than demanding huge amounts out of a heavily damaged economy without supporting necessary recovery.
(7) The Icelandic hydroelectric system is likely to be a perfect match for interacting with the UK/North sea wind energy resources in a similar way as the Norwegian hydroelectric power system
(8) The HVOC UK-Iceland link can serve partly as a oneway exporter of hydroelectric or geothermal energy from Iceland to the UK or it can be considered as a short term bilateral medium for hourly interaction of hydro with marketslwind based on market signals or short term shadow prices. This dual role should be further defined in a negotiation process between the respective national authorities.
13 Acknowledgement
The Authors thank Landsvirkjun, Scottish and Southern Energy, and colleagues for valuable discussions and for
providing advice and data for this study.
14" References
[1] T. J. Hammons, A. Olsen and T. Gudmundsson. Feasibility of Iceland/United Kingdom HVDC Submarine Cable Link, IEEE Transactions on Energy Conversion, Vol. 4, (3), 1989, pp. 414-424.
[2] T. J. Hammons, G. Palmason and S. Thorhallsson. Geothermal Electric Power Generation in Iceland for the Proposed Iceland/United Kingdom HVDC Power Link, IEEE Transactions on Energy Conversion, Vol. 6, (2), 1991, pp. 289-296.
[3] T. J. Hammons, A. Olsen, P. Kacejko and C. L. Leung. Proposed Iceland/United Kingdom Power Link-An Indepth Analysis of Issues and Returns, IEEE Transactions on Energy Conversion, Vol. 8, (3), 1993, pp. 566-574.
[4] T. J. Hammons, K. O. Lee, K. H. Chew and T. C. Chua. Competitiveness of Renewable Energy from Iceland via the Proposed Iceland/UK HVDC Submarine Cable Link. Electric Machines and Power Systems, Vol. 26, 1998, pp. 917-933.
[5] T. J. Hammons. Energy Potential of the Oceans in Europe and North America: Tidal, Wave, Currents, OTEC, and Offshore Wind. International Journal of Power and Energy Systems (IJPES), ACTA Press, Paper 203-4142, Vo1.28, (4), 2008, pp. 416-428.
[6] T J Hammons and A. Gunnarsson. Geothermal Power Developments and Sustainability in Iceland and Worldwide, International Journal of Power and Energy Systems (IJPES), ACTA Press, Paper 203-4494, Vo1.30, (2), 2010, pp. 94-107.
[7] E. B. Hreinsson. Export of Iceland's Hydroelectric Power Using a HVDC Submarine Cable. A report presented to Landsvirkjun (The National Power Co), September 1986.
[8] E. B. Hreinsson. Renewable Energy Resources in Iceland - Environmental Policy and Economic Value. An invited paper Proc. of the Nordic Conference on Production and Use of Renewable Energy, 9 -11 of July, 2008, Vaasa, Finland (Invited paper).
[9] E. B. Hreinsson. The Economic Rent in Hydro and Geothermal Resources in Iceland with Reference to International Energy Markets and Resource Cost Structure, Proc. of the 2008 IEEE PES General Meeting, July 20-24, Pittsburgh, PA, USA.
[10] E. B. Hreinsson. Environmental, Technical, Economics and Policy Issues of the Master Plan for the Renewable Hydro and Geothermal Energy Resources in Iceland, Proc. of the International Universities Power Engineering Conference, (UPEC2007), Brighton, United Kingdom, September 4th-6th, 2007.
[11] WEA. World Energy Assessment: Energy and the Challenge of Sustainability. Prepared by UNDP, UN-DESA and the World Energy Council. United Nations Development Programme, New York, 2000, 508. 8.
Biographies
Thomas James Hammons received the degree of ACGI from City and Guilds College, London, U.K. and the B.Sc. degree in Engineering (1 st Class Honours), and the DIC, and Ph.D. degrees from Imperial College, London University, UK.
He is a member of the teaching faculty of the Faculty of Engineering, University of Glasgow, Scotland, UK. Prior to this he was employed as an
Engineer in the Systems Engineering Department of Associated Electrical Industries, Manchester, UK. He was Professor of Electrical and Computer Engineering at McMaster University, Hamilton, Ontario, Canada in 1978-1979. He was a Visiting Professor at the Silesian Polytechnic University, Poland in 1978, a Visiting Professor at the Czechoslovakian Academy of Sciences, Prague in 1982, 1985 and 1988, and a Visiting Professor at the Polytechnic University of Grenoble, France in 1984. He is the author/co-author of over 400 scientific articles and papers on electrical power engineering. He has lectured extensively in North America, Africa, Asia, and both in Eastern and Western Europe.
Dr Hammons is a Fellow of IEEE (1996), is Past Chair of International Practices for Energy Development and Power Generation of IEEE, and Past Chair of United Kingdom and Republic of Ireland (UKRI) Section IEEE. He is a Past Chair of the IEEE PES Task Force on harmonizing power-engineering standards worldwide. He received the IEEE Power Engineering Society 2003 Outstanding Large Chapter Award as Chair of the United Kingdom and Republic of Ireland Section Power Engineering Chapter (1994-2003) in 2004 and the IEEE Power Engineering Society Energy Development and Power Generation Award in Recognition of Distinguished Service to the Committee in 1996. He also received two higher honorary Doctorates in Engineering. He is a Founder Member of the International Universities Power Engineering Conference (UPEC) and is Past Permanent Secretary of UPEC. He is a registered European Engineer in the Federation of National Engineering Associations in Europe.
Egill Benedikt Hreinsson received the First Part of his Engineering Degree from the University of Iceland, the MSc. in Electrical Engineering from the University of Lund, Sweden and the MSc. in Industrial and Systems Engineering from Virginia Tech, Blacksburg, VA. In 1972 he joined Landsvirkjun, the National Power Co. of Iceland, Reykjavik, working on SCADAIEMS, telecommunication and telemeter systems, power system
planning and analysis of hydroelectric system operations and expansion. In 1982 he joined the Department of Electrical and Computer Engineering, Faculty of Engineering, University of Iceland, where he is currently a professor in the Department of Electrical and Computer Engineering. He is the recipient of the Thor Thors award. He has been an associate consultant in USA with KEMA consulting and in Europe (including Iceland) in the fields of electric power systems, communications and computer applications in energy systems. He is a senior member of the IEEE and member of the Association of Engineers in Iceland: He chaired the Iceland Department of Industry Committee for the re-evaluation of Electric power safety. His research and teaching interests include power system analysis, economics and operations planning in addition to the application and merging of the arts in engineering and science. He is the author/co-author of over 150 scientific and technical articles and papers on electrical power engineering, management and economics. He is also a jazz pianist and has
been on the board of the Reykjavik Jazz Festival and the Suzuki Music School in Reykjavik. He has played extensively in Iceland and elsewhere.
Piotr Kacejko graduated with an MSc from the Faculty of Electrical Engineering, Lublin University of Technology, Poland. He has been a member of the teaching faculty of this
university for 25 years. He received PhD degree and DSc degree from Lublin University of Technology and Warsaw University of Technology, respectively.
He was also employed as a Consultant Engineer in the Power Distribution Company Lubzel Ltd. and with the Polish National Grid Company (PSE). He spent a couple of months as a research fellow with the Faculty of Engineering, University of Glasgow, UK. Since 2006 he is a full professor and the head of
the Power Engineering Department, TU Lublin. He is the coauthor of over 100 papers and 4 books on power system analysis, protection problems and reliability enhancement. Prof. Kacejko is also co-author of commercial software used for short circuit analysis (SCC). He works as an expert and a consultant for companies that are planning connection of power sources (plants, and wind farms) to the grid. He is a member of IEEE.