21
Proposed IPM Potential Scenarios January 8, 2013

Proposed IPM Potential Scenarios
January 8, 2013

2
The following slides present projections from the latest 2012 RGGI Reference Case and draft potential scenarios.
These projections are draft and may change as ICF makes refinements based on state review and input.
This analysis provides information for the overall program review process. The scenario specifications do not reflect a preference for or selection of any specific policy.
DRAFT RGGI Potential Scenario Analysis Purpose
2

3
The chart shows historical and projected CO2 emissions for the RGGI states and by ISO.
RGGI DRAFT REFERENCE CASE
3
DRAFT RGGI Potential Scenario Analysis Reference Case Recap
0
20
40
60
80
100
120
140
160
180
2009 2010 2011 2012 2013 2014 2015 2016 2017 2018 2019 2020
Mill
ion
To
ns
CO
2
RGGI Affected ISO-NE NYISO PJM (RGGI) RGGI Cap
Historical Projected

4
2012 Emissions from Affected Sources (Millions)
4
2012 Q1-Q3 emissions from RGGI COATS
2012 Q4 emissions projection based upon RGGI COATS 2011 Q4 emissions
Q1 2012 Q2 2012 Q3 2012 Q4 2012 Total
Emissions 18 22 31 20 (est.) 91 (est.)

5
The modeling assumes that market participants do not bank allowances in 2012.
The modeling assumes in 2013 that the market is aware of program changes and assumes 100% banking of available allowances.
RGGI DRAFT ASSUMPTIONS
DRAFT RGGI Potential Scenario Analysis Potential Scenario Assumptions – 91 and 97 Cap_Bank recap
Scenario Name
Cost
Containment
Reserve (CCR)
CCR Price
Triggers
Results of
Interim
Adjustment for
Banked
Allowances
2012-2013
Projected
Banked
Allowances
First Control
Period
Banked
Allowances
97 Cap_Bank
(2014 projected
emissions)
Up to 10 M
allowances
annually
2014: $5
2015-2017: $7
2018-2020: $10
2014: 80 M Tons
2020: 68 M Tons 68 M allowances
47 M
allowances
91 Cap_Bank
(2012 projected
emissions)
Up to 10 M
allowances
annually
2014: $5
2015-2017: $7
2018-2020: $10
2014: 73 M Tons
2020: 65 M Tons 68 M allowances
47 M
allowances

6
DRAFT RGGI Potential Scenario Analysis Potential Scenario Assumptions – 91 and 97 Cap_Bank recap
6
Interim Adjustment for Banked Allowances
– Adjusts 97 & 91 caps for the maximum projected 2009-2013 private bank of allowances.
– For the modeling, we assume the projected 2009-2013 private bank of allowances is 115 M.
– 115 M includes an estimated 47 M first control bank and projected bank for 2012 and 2013 (market is made aware of policies in 2013, so there is banking in 2013 but not in 2012).
– Adjustment is spread across 2014-2020.
2014 2015 2016 2017 2018* 2019 2020
97 Cap_Bank 97 95 92 88 88 88 83
Interim Adjustment for Banked Allowances 80 77 75 72 72 72 68
91 Cap_Bank 91 89 87 82 82 82 78
Interim Adjustment for Banked Allowances 73 72 70 66 66 66 65
* The 2018 model run year is representative of 2017-2019. The averaged 2018 input represents potential policy (same as current policy) of a 2.5% per year reduction to the cap.
RGGI DRAFT ASSUMPTIONS
7
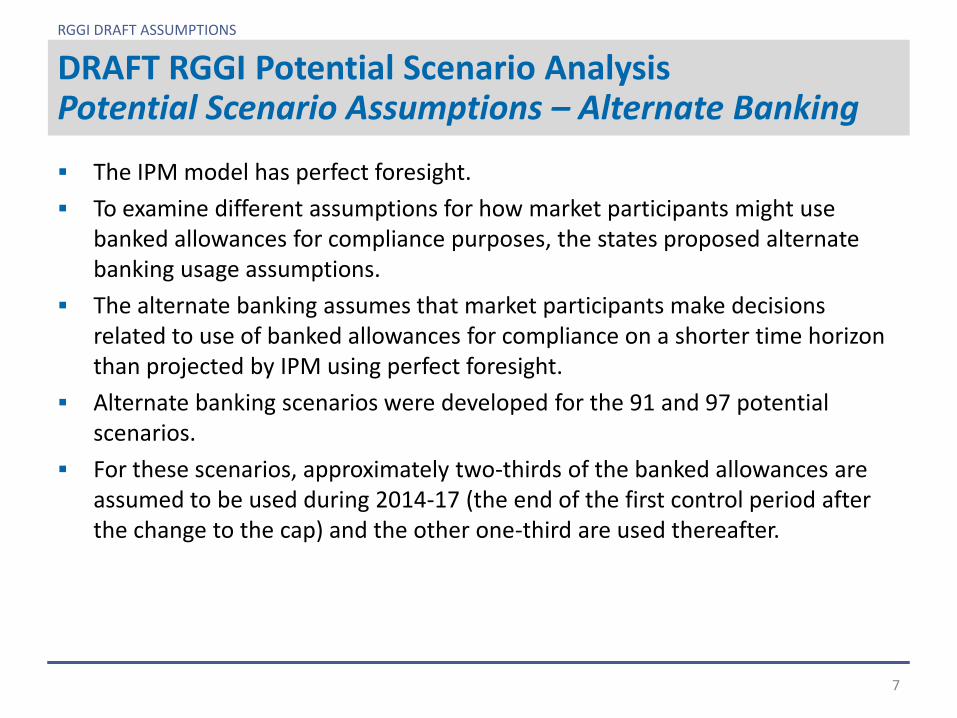
The IPM model has perfect foresight.
To examine different assumptions for how market participants might use banked allowances for compliance purposes, the states proposed alternate banking usage assumptions.
The alternate banking assumes that market participants make decisions related to use of banked allowances for compliance on a shorter time horizon than projected by IPM using perfect foresight.
Alternate banking scenarios were developed for the 91 and 97 potential scenarios.
For these scenarios, approximately two-thirds of the banked allowances are assumed to be used during 2014-17 (the end of the first control period after the change to the cap) and the other one-third are used thereafter.
DRAFT RGGI Potential Scenario Analysis Potential Scenario Assumptions – Alternate Banking
RGGI DRAFT ASSUMPTIONS

8
RGGI DRAFT ASSUMPTIONS
DRAFT RGGI Potential Scenario Analysis Potential Scenario Assumptions-91 Cap_Alt Bank and 97 Cap_Alt Bank
Scenario
Name
Cost
Containment
Reserve (CCR)
CCR Price
Triggers
(4-6-8-10)
Results of
Interim
Adjustment for
Banked
Allowances
2012-2013
Projected
Banked
Allowances
First Control
Period
Banked
Allowances
97 Cap_ Alt
Bank
Up to 10 M
allowances
annually
2014: $4
2015: $6
2016: $8
2017-2020: $10
2014: 80 M Tons
2020: 68 M Tons
68 M
allowances
47 M
allowances
91 Cap_Alt
Bank
Up to 10 M
allowances
annually
2014: $4
2015: $6
2016: $8
2017-2020: $10
2014: 73 M Tons
2020: 65 M Tons
68 M
allowances
47 M
allowances
9
Model run years are 2012, 2013, 2014, 2015, 2016, 2018 (representing 2017-2019), 2020.
Offsets can be used to meet 3.3% of a compliance obligation. Offset expansion triggers (stage one $7 and stage two $10 and international) have been removed.
RGGI DRAFT ASSUMPTIONS
DRAFT RGGI Potential Scenario Analysis Potential Scenario Assumptions

10
Potential Scenario Results: 91 and 97 Cap_Bank Sources of Emission Reductions 97 Cap_Bank

11
Potential Scenario Results: 91 and 97 Cap_Bank Sources of Emission Reductions 91 Cap_Bank
17 M CCR

12
Potential Scenario Results: 91 and 97 Cap_Bank Allowance Prices
12
91_Cap_Bank: CCR 2014: 10M; 2017: 7M
Allowance Price Trends 2014 -2020 91 Cap_Bank: $5.90 – $8.25 97 Cap_Bank: $4.70 - $6.60

13
Potential Scenario Results: 91 and 97 Cap_Alt Bank Sources of Emission Reductions 97 Cap_Alt Bank
8.4 M CCR

14
Potential Scenario Results: 91 and 97 Cap_Alt Bank Sources of Emission Reductions 91 Cap_Alt Bank
10 M CCR

15
2012 SCENARIO ANALYSIS
Potential Scenario Results: 91 and 97 Cap_Alt Bank Allowance Prices
15
Allowance Price Trends 2014 -2020 91 Cap_Alt Bank: $3.60 – $10 97 Cap_Alt Bank: $1.86 – $10

16
Potential Scenario Results: Allowance Price Summary
16
Allowance Prices Trends: 2014 - 2020 91 Cap_Alt Bank: $3.60 - $10 91 Cap_Bank: $5.90 - $8.25 97 Cap_Alt Bank: $1.86 - $10 97 Cap_Bank: $4.70 - $6.60
Sensitivity Analyses Assumptions
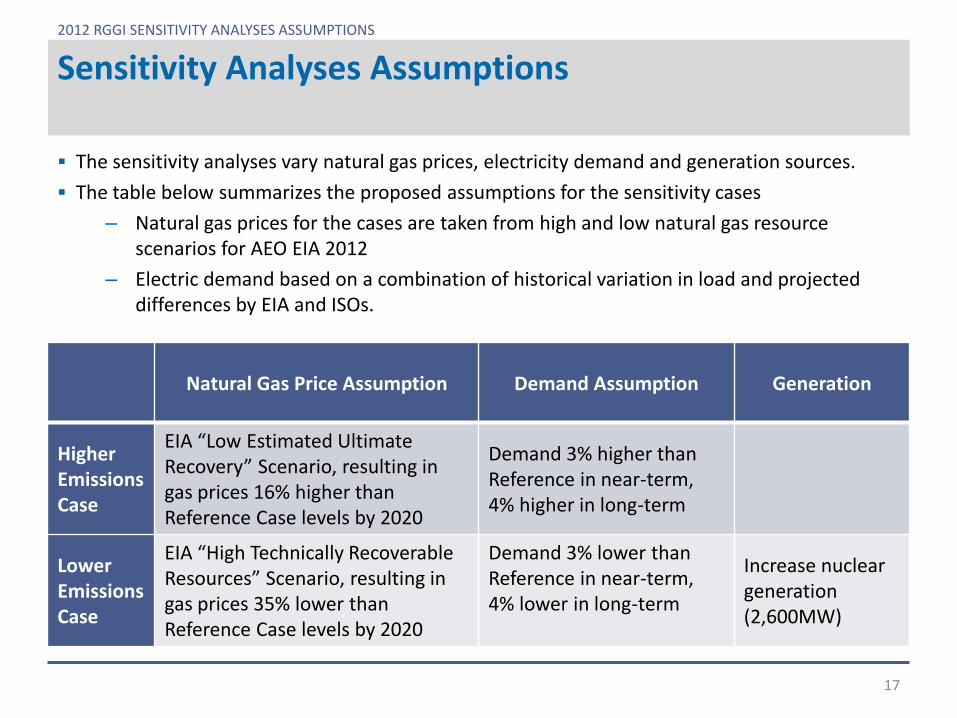
The sensitivity analyses vary natural gas prices, electricity demand and generation sources.
The table below summarizes the proposed assumptions for the sensitivity cases
– Natural gas prices for the cases are taken from high and low natural gas resource scenarios for AEO EIA 2012
– Electric demand based on a combination of historical variation in load and projected differences by EIA and ISOs.
Natural Gas Price Assumption Demand Assumption Generation
Higher Emissions Case
EIA “Low Estimated Ultimate Recovery” Scenario, resulting in gas prices 16% higher than Reference Case levels by 2020
Demand 3% higher than Reference in near-term, 4% higher in long-term
Lower Emissions Case
EIA “High Technically Recoverable Resources” Scenario, resulting in gas prices 35% lower than Reference Case levels by 2020
Demand 3% lower than Reference in near-term, 4% lower in long-term
Increase nuclear generation (2,600MW)
2012 RGGI SENSITIVITY ANALYSES ASSUMPTIONS
17

18
RGGI DRAFT SENSITIVITY CASES
18
Sensitivity Case Projections CO2 Emissions
0
20
40
60
80
100
120
140
160
180
2009 2010 2011 2012 2013 2014 2015 2016 2017 2018 2019 2020
RGGI Affected
Reference
High Case
Low Case
RGGI Cap
Historical Projected

19
Potential Scenario Sensitivities Results Sources of Emission Reductions 97 Cap_Alt Bank_High
CCR 16.5 M

20
Potential Scenario Sensitivities Results Sources of Emission Reductions 91 Cap_Alt Bank_High
CCR 50.5 M
21
2012 SCENARIO ANALYSIS
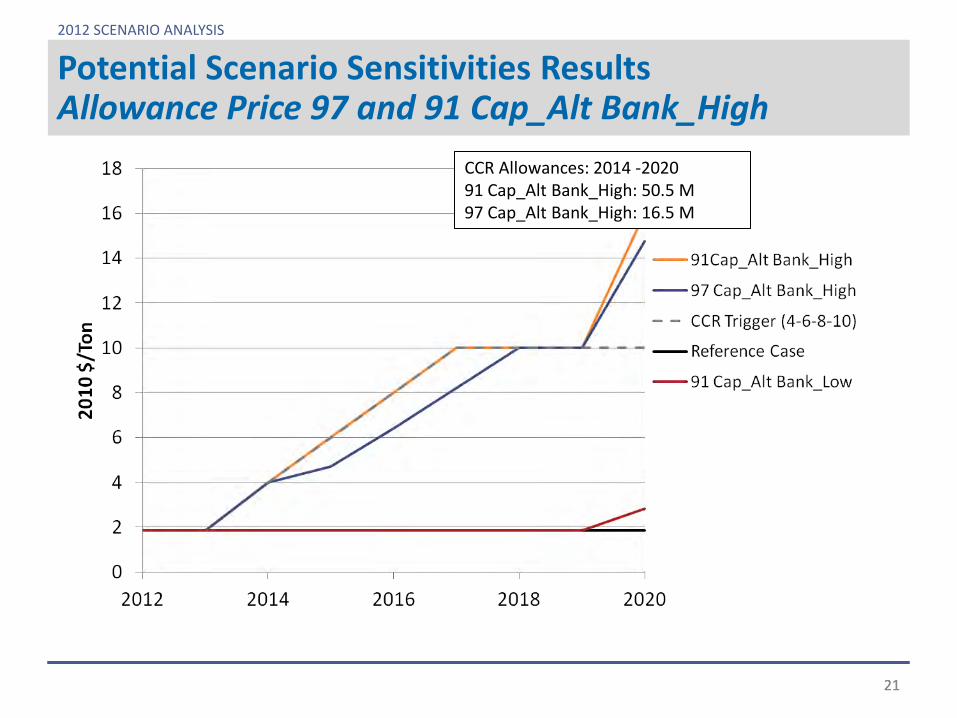
Potential Scenario Sensitivities Results Allowance Price 97 and 91 Cap_Alt Bank_High
21
CCR Allowances: 2014 -2020 91 Cap_Alt Bank_High: 50.5 M 97 Cap_Alt Bank_High: 16.5 M


