9 th and 10 th October 2013 79 Second International Conference of Pharmacoeconomics and Outcomes Research PROPOSED PHARMACOECONOMICS GUIDELINES FOR INDIA (PEG - I) Professor S K Gupta President ISPOR India ISPOR India Chapter
Transcript
9th and 10th October 2013 79
Second International Conference of Pharmacoeconomics and Outcomes Research
PROPOSED PHARMACOECONOMICS
GUIDELINES FOR INDIA (PEG - I)
ProfessorSKGuptaPresidentISPORIndia
ISPOR INDIA CHAPTERISPOR India Chapter
9th and 10th October 201380
Second International Conference of Pharmacoeconomics and Outcomes Research
PROPOSED PHARMACOECONOMICS GUIDELINES FOR INDIA (PEG - I)
(Affordable and equitable medical care through informed decision-making)
Draft submitted to:
ISPOR – India Chapter, Executive Committee
www.isporindia.com
Draft prepared by Core Committee for PEG-I, Members (Authors)
Dr. Suresh K. Gupta- President, ISPOR India Chapter, New Delhi, India
Dr. Divya Mishra- Associate Director, Clin. Dev., SFJ Pharmaceuticals, New Delhi, India
Mahendra K. Rai- Senior Consultant (HEOR), Capita India, Mumbai, India
Richa Goyal- Consultant (HEOR), Capita India Pvt. Ltd., Mumbai, India
Javed Shaikh- Consultant (HEOR), Capita India Pvt. Ltd., Mumbai, India
Munish Duvedi- Clinical Team Lead, GVK Biosciences, Gurgaon, India
Submitted on:
30th September 2013
New Delhi, India
9th and 10th October 2013 81
Second International Conference of Pharmacoeconomics and Outcomes Research
Table of Contents
About ISPOR - India Chapter 3
Abbreviations 4
Chapter I: Prologue and Objective 5
Chapter II: Pharmacoeconomic Research Guidelines around the World 8
Chapter III: Need for PE Research in India – Who needs it and why? 12
Chapter IV: Existing scenario in India 17
Chapter V: Proposed guidance for Pharmacoeconomic Research in India 19
Chapter VI: Proposed areas of further research In India 30
Appendix A: Budget Impact Analysis (BIA) 32
Appendix B: CHEERS Checklist 34
Acknowledgements 37
Declaration of Conflict of Interest 37
References 38
9th and 10th October 201382
Second International Conference of Pharmacoeconomics and Outcomes Research
About ISPOR - India Chapter
Rising medical care costs is not only a cause of concern for patients but also for policy makers and
service providers. The creation of ISPOR India chapter is a humble initiative by professionals, students
and researchers interested in Pharmacoeconomics, health economics and its impact of various policies
related to health care sector.
Our Mission
The mission of the Society of Pharmacoeconomics and Outcomes Research India (SPOR-INDIA) is
to provide an environment for knowledge sharing among researchers, healthcare practitioners and
decision-makers interested in Pharmacoeconomics and outcomes research; to serve as a bridge in
bringing together Indian researchers, healthcare practitioners, and decision-makers interested
in Pharmacoeconomics and members of pharmaceutical industry, health-related organizations,
and academia; to act as a resource at a local level for individuals including students interested in
Pharmacoeconomics and outcomes research and to provide an opportunity for India chapter members
to become more familiar with the activities of ISPOR as well as participate in its activities.
Aims and Objectives
The Aims and Objectives of the society shall be as under:
• Provide an environment for knowledge sharing among researchers, healthcare practitioners,
and decision-makers interested in Pharmacoeconomics and outcomes research.
• Serve as a bridge in bringing together Indian researchers, healthcare practitioners, and
decision-makers interested in Pharmacoeconomics and members of the pharmaceutical
industry, health-related organizations, and academia.
• Act as a resource at a local level for individuals including students interested in Pharmaco-
economics and outcomes research.
• Provide an opportunity for India chapter members to become more familiar with the
activities of ISPOR as well as participate in it.
• Maintain affiliation as a component chapter of the International Society of Pharmacoeconomics
and Outcomes Research (ISPOR).
• Promote research in area of policy, advocacy and public health related issues.
For further information, please visit www.isporindia.com
9th and 10th October 2013 83
Second International Conference of Pharmacoeconomics and Outcomes Research
Abbreviations
BIA Budget Impact Analysis
CADTH Canadian Agency for Drugs and Technology in Health
CBA Cost Benefit Analysis
CCA Cost Consequence Analysis
CEA Cost Effectiveness Analysis
CGHS Central Government Health Services
CMA Cost Minimization Analysis
CPA Central Procurement Agency
CUA Cost Utility Analysis
DALY Disability Adjusted Life Years
DCGI Drug Controller General of India
DGHS Directorate General of Health Services
DHR Department of Health Research
DTAB Drugs Technical Advisory Board
HRQoL Health-related quality of life
ICER Increment cost-effectiveness ratio
IRDA Insurance Regulatory and Development Authority
ISPOR International Society of Pharmacoeconomics and Outcomes Research
MCI Medical Council of India
NICE National Institute for Health and Clinical Excellence
NPPA National Pharmaceutical Pricing Authority
PABC Pharmaceutical Benefits Advisory Committee
PEG-I Pharmacoeconomics Guidelines For India
QALY Quality Adjusted Life Years
9th and 10th October 201384
Second International Conference of Pharmacoeconomics and Outcomes Research
Chapter I: Prologue and Objective
Objective of this guideline
The Primary Objective of this guideline cum working paper is to initiate India specific Pharmacoeconomics
research. The pharmacoeconomic data generated from such research needs to be as per global
Pharmacoeconomics research standards and principles. This will help various stakeholders to appreciate
and criticise the applicability of such data as an enabler to a wiser and more informed decision-making
tool.
Secondarily, the working paper intends to identify information vacuum in areas where more studies
need to be conducted with experts from respective areas.
How it started?
Cost of illness and medical bills are leading over 100 million people globally into poverty every year. In
some countries, 5% of the population is forced into poverty every year because they have to pay for
health services. As per World Health Organization (WHO), in countries like India, people who pay for
their health care services suffer “catastrophic costs”. While millions suffer and die in absence of access
or inability to afford medical care, many others suffer because they end up paying through borrowing
debts and selling assets etc.
Health and medical service is a finite resource for an infinite demand which is reflected in WHO’s
annual World Health Report 2010, which stated that even rich countries where medical care was earlier
accessible and affordable are finding it very difficult respond to people’s needs. The report estimated
that between 20% and 40% of all health expenditures is wasted due to inefficiency. Overpaying
is a form of waste. For instance, in some countries medicine prices are up to 67 times more than
the international average price, grossly affecting expenditures for other health services. This calls for
9th and 10th October 2013 85
Second International Conference of Pharmacoeconomics and Outcomes Research
serious review of public’s procurement and alignment of health policies.
Like India, in many other middle and low income countries, direct and indirect medical costs drives
millions of people to poverty every year. Rising medical costs and inaccessibility to health care leads
to millions of deaths many of which could possibly have been saved if health policies were better
informed and equitable. Unlike developed countries, health policy formulation in developing countries
encompasses far more complex areas of intervention besides direct medical care and infrastructure
such as primary education, poverty alleviation, sanitation, housing, insurance etc. Unarguably the
funds available for this scope of health care spending are extremely scarce and the ability to utilise
them wisely and economically is absolutely necessary.
Review of Evolution of health policy of India pre and post Independence concluded that there is not
much improvement in vision of equity in health.1 It is very ironical that the vision laid by Sir Bhor
Committee at the dawn of Independence is yet to be achieved, even while the problems today are
much larger and disease burdens are enormous. The Indian government published their first National
Health Policy 35 years post independence as a consequence of signing of Alma Ata declaration on
Primary Health Care. Notably, several governments and 5 years plans later, the goal of Health for all still
eludes us. Indian expenditure on health care still remains at 1.4 percent. Health Ministry has proposed
a new initiative called ‘Free medicine for all through Public Health Facilities’ under the National Rural
Health Mission (NRHM). The Cabinet has approved the setting up of a Central Procurement Agency for
bulk procurement of drugs and to support in preparing Standard Treatment Protocols.
However formulary decisions by CPA’s is unclear. It is not clear on what consideration are decisions
taken to include drugs in to free medicine distribution plan. An even bigger question facing the
policymkaers and the people of India is whether the funds that are allocated for health care are
rationally utilised? This is an area where Pharmacoeconomics comes in to play. To scale up care,
allocation for healthcare must be raised to at least 2.5 per cent of GDP by the end of the 12th Plan, and
3 per cent in the subsequent five years. This, the expert group estimates, can bring about a dramatic
reduction in out-of-pocket spending from 67 per cent of total health expenditures today to 47 per cent
by 2017 and 33 per cent by 2022.2
In one of his speeches3 prime minister of India stated that “health issues need to be conceptualized
in a framework that understands these relationships, even though a specific disease itself can be
treated through a mixture of social and clinical management. Issues of health particularly in developing
countries have strong links with social, economic, environmental and cultural factors. They therefore
need responses that appreciate intersecting spaces”.
Following the 1st International Conference of ISPOR India Chapter on 22- 23 Oct 2012 at New Delhi,
it was widely felt that pharmacoeconomics research is helping decision makers globally in taking
Can a wiser approach to address cost of Illness
help reduce poverty alleviation bills of
Government?
9th and 10th October 201386
Second International Conference of Pharmacoeconomics and Outcomes Research
informed decisions and India should have its own guidelines addressing the needs of the country in
many interrelated domains like health policy, pharmaceutical policy, pharma pricing, health insurance
and clinical prescription standards. India lacks independent and credible data in terms of health and
pharmacoeconomics. So it was decided that ISPOR shall take an initiative to draft the guidelines based
on study of international guidelines and ISPOR. Many countries have issued guidelines to conduct
pharmacoeconimics research. Several countries like Canada and USA and UK have specific templates
and directions to submit PE data for evaluation by regulatory authorities. It was observed that these
guideline may vary from country to country but basic component of PE research remains same. PER is
gradually progressing toward (Health Impact Analysis) HIA and (Budget Impact analysis) BIA and they
make absolute sense for low and middle income countries (LMIC) with low funds to spend on health
care (Appendix A).
What prompted ISPOR to draft PEG for India?
Globally PER is impacting national health policies, reimbursement decisions, formulary compositions,
new drug research and drug development process. Data generated from such research is increasingly
helping policy and law makers, health care administrators, and practitioners to take rational decisions.
Type of Impact Country Associated Organisation
Influnce on Health Policy,
Regulatory Impact and
clinical guidance
Canada CADTH
UK NICE
France HAS
Germany IQWiG
Italy AIFA
Spain AEMPS
On 28 January 2013, Annual meeting National Executive of ISPOR India Chapter passed a unanimous
resolution that being flag bearers of pharmacoeconomics research in India, an initiative should be
taken by ISPOR India Chapter to formulate guidelines to conduct pharmacoeconomics research in India
and help researchers develop India specific data. A core committee with few experts in industry and
academia were entrusted with task to prepare first draft to be circulated among with public for wider
consultations. Following this decision core group of experts had several meetings and deliberations
and decided to place guidelines on ISPOR India website for further comment and review.
Please refer www.isporindia.com
9th and 10th October 2013 87
Second International Conference of Pharmacoeconomics and Outcomes Research
Chapter II: Pharmacoeconomic Research Guidelines around the World
Research and methods for conducting pharmacoeconomic analysis have developed over the last
several decades and many countries throughout the world are increasingly trying to generate robust
data to support decision-making. Many changes exist in approach to conduct studies however; basic
principles of Pharmacoeconomics remain same. Countries like UK, Canada, and Australia have come a
long way in setting some global standards for conduct and reporting of pharmacoeconomic research.
The Canadian Agency for Drugs and Technology in Health (CADTH) has provided clear guidelines for
the submission of pharmacoeconomic analyses. These guidelines define the methodologies behind
the scope, perspective and reporting formats of the analyses, as well as providing best practices for
the calculation of the costs and benefits associated with the assessed technology. The importance
of the pharmacoeconomic component of review submissions has grown in direct proportion to the
increased public and political pressure on health care budgets. Similarly, in UK NICE had taken up a
major advisory role to legislative representatives, clinicians and many other stake holders. In Australia,
guidelines for Preparing Submissions to the Pharmaceutical Benefits Advisory Committee (PBAC)
(December 2008) provide manufacturers with guidance to prepare the clinical and economic data for
submissions to the PBAC.
A summary of some of the pharmacoeconomic guidelines is presented in Table 1. Most of these
guidelines were published during years 2004-2009, with Swiss guidelines published earlier in year
1998. Al of these guidelines had policy decision makers as common target audience. Other targets
included researchers, pharmaceutical companies, health departments, and stakeholders for insurance.
The perspective for evaluation included in all guidelines was ‘Societal’ in order to include all relevant
costs and outcomes. Other commonly suggested perspectives were ‘Provider’, ‘Payer’, ‘Patient’
and ‘Employer’. The choice of comparator was primarily the most frequently used drug or closest
alternative. Choice of comparator was also based on clinical practice, current practice or all relevant
comparators in a given indication. These guidelines suggested using a time horizon that should be
long enough to capture all the meaningful differences in costs and outcomes.
Most of the published guidelines advocate using assumptions in economic analysis, German guidelines
being an exception as IQWiG tries to avoid assumptions. These guidelines specify the sources for costs
in respective countries and the need for systematic review of evidence, meta-analysis and modelling.
The most commonly used health economic analysis types include CEA, CUA, and CMA. Most of the
guidelines had preference for effectiveness over efficacy and advocate using Health-related quality of
life (HRQoL) parameters as preferred outcome measure. For modelling studies, all guidelines suggest
using discount rates between 3-5% (for costs and outcomes), with few exceptions. The preferred
9th and 10th October 201388
Second International Conference of Pharmacoeconomics and Outcomes Research
methods to derive utility values reported across guidelines were ‘standard gamble’ (SG) and ‘time-
trade-off’ (TTO). All guidelines suggested stating the implicit and explicit equity assumptions made in
the evaluation.
All guidelines suggest conducting sensitivity analysis (univariate, multivariate, probabilistic) for checking
robustness of results. Incremental analysis is suggested in case of health economic analysis involving
drug comparisons. Wherever applicable, increment cost-effectiveness ratio (ICER) should be calculated
as it may be used as a criterion to assist in decision-making.
Table 1: Comparison of PE Guidelines for selected countries on selected key features
Canada France Germany TheNetherlands Switzerland
Title and year of the Document
Guidelines for the Economic Evaluation of Health Technologies: Canada (3rd Edition, 2006)
French Guidelines for the Economic Evaluation of Health Care Technologies (September 2004)
General Methods for the As-sessment of the Relation of Benefits to Costs (Version 1.0 dated 19/11/2009)
Guidelines for Pharmacoeconomic Research in the Netherlands (April 2006) (Dutch Ver-sion 2004)
Manual for the standardization of clinical and eco-nomic evaluation of medical technol-ogy (1998 draft)
Target audience of funding/ author’s interests
Canadian decision and policy makers who are responsible for the funding decisions regarding health technologies
IQWiG can be commissioned by Federal Joint Committee (FJC; or by the Department of Health
Who conduct PE evaluation or evaluate the PE s tud ie s (dec i s ion makers)
Federal Commis-sion for Health Insurance Benefits (ELK)
Perspective This perspective may include costs that are incurred by long-term care, social services, or community-based services
Economic evaluation studies of health care programmes must adopt the widest possible perspective in order to include all the relevant outcomes of each pro-gramme studied.
Health care sector, optional: social security (including long term nursing care and other branches of social security) or societal
Society, third party payer / reim-bursement agency, health care pro-vider, patient, em-ployer
Choice of comparator
Single most prevalent clinical practice, current practice weighted by market share, or lowest cost but more effective than placebo, do-nothing alternative
The therapeutic strategies to be used as comparators will be chosen among those most frequently used (including non-treatment) or newer strategies which may legitimately be deemed likely to become reference strategies
All relevant comparators in a given indication
Treatment in clinical guidelines of GPs; if not available most prevalent treatment
Closest alternative technology, first choice treatment, non-intervention
Time horizon The time horizon should be long enough to capture all the meaningful differences in costs and outcomes between the intervention and comparators.
Long enough that all outcomes, both pos-itive and negative, of the treatments used and evaluated be included in the study.
Primary time horizon: Dura-tion of RCTs, secondary time horizon: Any longer time horizon depending on the rel-evance for the decision maker, eg chronic diseases
Should be clearly de-scribed and appropri-ate to the disease and treatment. Long-term effects should be em-phasized
Not specific
Assumptions required
Yes Yes IQWiG tries to avoid assump-tions
Yes Yes
Preferred analytical technique
The selection of the appropriate type of evaluation (CUA, CEA, CMA, CBA, and CCA) depends on the research question, the condition of interest, and the availability of data on outcomes.
Any one of CMA, CEA, CUA, CBA, and CCA. The choice must be justified.
Efficiency frontier method based on a CEA, but CUA also possible
CEA, CUA, no CMA
Any one of CMA, CCA, CEA, CUA, CBA. Refer CBA as the gold stan-dard
Source of costs CADTH Guidance Document for the Costing Process
The identification, measurement and val-uation of costs should be consistent with the perspective of the PMSI.
Resource use and costs are to be reported separately. Data should come from German statutory health insurance.
Reference prices list should be used
R e i m b u r s e m e n t rates established by health insurers, tariffs and other ad-ministratively fixed rates
Second International Conference of Pharmacoeconomics and Outcomes Research
Systematic review of evidences
Yes Yes Yes, for any health economic analysis is based on prior ben-efit reports by IQWiG
Yes, encourage me-ta-analysis
Yes, emphasize meta-analysis
Preference for effectiveness over efficacy
Where feasible, the outcomes and costs in an economic evaluation should be based on the effectiveness of the intervention, rather than its efficacy
Effectiveness is to be preferred to ef-ficacy. If, however, efficacy is the sole indicator available, every effort should be made to convert this into effectiveness by means of appropriate adjustments.
See the general methods of IQWiG on efficacy vs. ef-fectiveness. RCTs should be focusing on realistic scenarios while high level of evidence for the benefit assessment is warranted
Yes, modelling on trial data and other sources is required
Yes, the basis for technology assess-ment is the whole disease manage-ment process in real practice
Preferred outcome measure
Health-related quality of life, Quality-adjusted life years, Preferences (utilities), Willingness to pay
Final outcomes preferred. Patient relevant outcomes (mortality, morbidity, qual-ity of life) as indicated in so-cial code book V relevant for statutory health insurance in Germany
Effectiveness by in-tention-to-treat prin-ciple, and expressed in natural units (pref life-years gained) or QALY
Life years gained or lost, health re-lated quality of life, quality cor-rected life years gained or lost
Preferred method to derive utility
Should justify the selection The methods most commonly used to identify preferences are the SG, TTO, and VAS methods. These methods allow for the expression of individual preferences within a strict framework.
Patient preferences about the hierarchy of endpoints are to be elicited with methods (discrete choice, analytic hier-archy process). If utilities are included in the analysis they are derived from patients and not the general public.
SG, TTO or VAS. Should justify the selection
SG, TTO, and rat-ing scale.
Equity issues stated
Yes. State the implicit and explicit equity assumptions made in the evaluation.
Yes Equity issues will be taken into account by the decision maker FJC.
Yes Yes, issues of ac-cess, distribution and ethical ques-tions should be considered
Discounting costs
Yes, standard: 5%; conduct sensitivity analyses using (real) discount rates of 0% and 3%.
For the purposes of international com-parisons the rates used should be 0%, 3% and 5%.
Base case 3%, sensitivity anal-yses at 0,5,7, and 10%.
4% Most common: 2.5%, 5%, 10%
Discounting outcomes
Yes, standard: 5%; conduct sensitivity analyses using (real) discount rates of 0% and 3%.
For the purposes of international com-parisons the rates used should be 0%, 3% and 5%.
Base case 3%, sensitivity anal-yses at 0,5,7, and 10%.
1.5% Most common: 2.5%, 5%, 10%
Sensitivity analysis-parameters and range
Capture the full range of variability or uncertainty that is relevant for each model input.
Maintain uncertain variables. Sensitivity analyses are per-formed and respective ranges are chosen to check for robust-ness of results.
All key uncertain parameters, within a defined area and best/worst case sce-nario
The variation range accepted for key parameters should be plau-sible
Sensitivity analysis-methods
One-way, two-way, multi-way, scenario analysis, Monte Carlo simulation
A distinction is made between univari-ate and multivariate analysis, and also between first order and second order analysis.
Both univariate and multi-variate sensitivity analyses are performed.
One-way, multi-way and probabilistic analysis
The sensitivity of study conclusions should be exam-ined in detail.
Incremental analysis
Yes Yes Yes Yes Yes
Total C/E Yes Cost-effectiveness (or cost-utility ratios) must be expressed in incremental form so that they may be used as a criterion to as-sist in decision-making.
Efficiency frontier will be presented as a plot. Maximum reimbursable price to be rec-ommended for decision maker will be calculated on the basis of efficiency frontier (ICERs).
Yes Yes
Chapter III: Need for PE Research in India – Who needs it and why?
Analysis of global case studies gives varied utilities of pharmacoeconomic research from health policy,
drug evaluation, licensing, clinical prescription recommendations, insurance etc. Everyone is aware
that such PER data is necessary and it will be useful in several ways in many multidisciplinary areas,
but who will need it in India?
9th and 10th October 201390
Second International Conference of Pharmacoeconomics and Outcomes Research
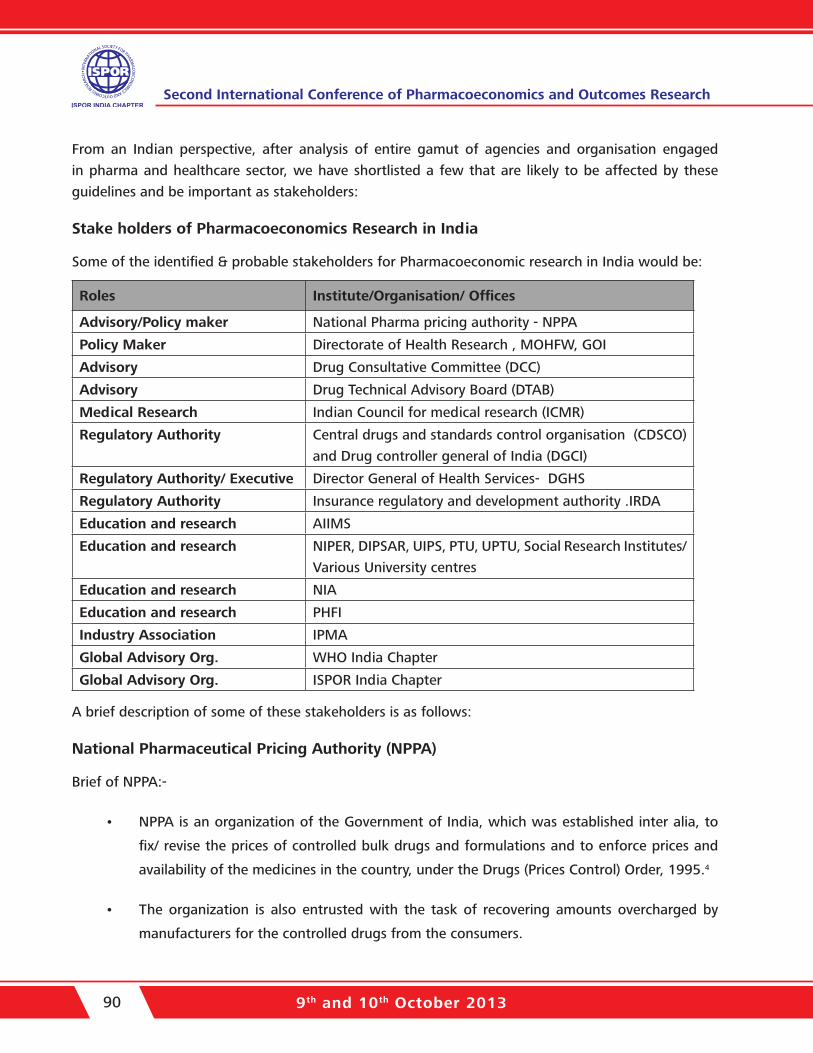
From an Indian perspective, after analysis of entire gamut of agencies and organisation engaged
in pharma and healthcare sector, we have shortlisted a few that are likely to be affected by these
guidelines and be important as stakeholders:
Stake holders of Pharmacoeconomics Research in India
Some of the identified & probable stakeholders for Pharmacoeconomic research in India would be:
Roles Institute/Organisation/ Offices
Advisory/Policy maker National Pharma pricing authority - NPPA
Policy Maker Directorate of Health Research , MOHFW, GOI
Advisory Drug Consultative Committee (DCC)
Advisory Drug Technical Advisory Board (DTAB)
Medical Research Indian Council for medical research (ICMR)
Regulatory Authority Central drugs and standards control organisation (CDSCO)
and Drug controller general of India (DGCI)
Regulatory Authority/ Executive Director General of Health Services- DGHS
Regulatory Authority Insurance regulatory and development authority .IRDA
Education and research AIIMS
Education and research NIPER, DIPSAR, UIPS, PTU, UPTU, Social Research Institutes/
Various University centres
Education and research NIA
Education and research PHFI
Industry Association IPMA
Global Advisory Org. WHO India Chapter
Global Advisory Org. ISPOR India Chapter
A brief description of some of these stakeholders is as follows:
National Pharmaceutical Pricing Authority (NPPA)
Brief of NPPA:-
• NPPA is an organization of the Government of India, which was established inter alia, to
fix/ revise the prices of controlled bulk drugs and formulations and to enforce prices and
availability of the medicines in the country, under the Drugs (Prices Control) Order, 1995.4
• The organization is also entrusted with the task of recovering amounts overcharged by
manufacturers for the controlled drugs from the consumers.
9th and 10th October 2013 91
Second International Conference of Pharmacoeconomics and Outcomes Research
• It also monitors the prices of decontrolled drugs in order to keep them at reasonable levels.
The Drugs Technical Advisory Board (DTAB)
Drugs Technical Advisory Board (DTAB) is a board constituted by the Central Government to advise
the Central Government and the State Governments on technical matters regarding administration of
Drugs and Cosmetics act 1940 & Rules 1945, and to carry out the other functions assigned to it by this
Act. DTAB is the Apex decision-making body for safety of the drugs.
Insurance Regulatory and Development Authority (IRDA)
IRDA is an autonomous apex statutory body which regulates and develops the insurance industry in
India. It was constituted by a Parliament of India Act called Insurance Regulatory and Development
Authority Act, 1999 and duly passed by the Government of India5.
Executive bodies like DCGI and DGHS
Under the Drug and Cosmetics Act, the regulation of manufacture, sale and distribution of Drugs is
primarily the concern of the State authorities. The Central Authorities are responsible for approval of
new drugs; Clinical Trials in the country, laying down the standards for Drugs, control over the quality
of imported Drugs, coordination of the activities of State Drug Control Organizations and providing
expert advice with a view of bring about the uniformity in the enforcement of the Drugs and Cosmetics
Act.
Drug Controller General of India (DCGI) is responsible for approval of licenses of specified categories
of drugs such as blood and blood products, IV fluids, vaccines and sera in India. The Directorate
General of Health Services (DGHS), a repository of technical knowledge, is an attached office of this
Ministry. The DGHS also renders technical advice on all medical and public health matters and in the
implementation of various health schemes. In order to implement the policies and programmes of the
Ministry in an effective manner, there are three subordinate offices located at various places in the
country which function directly under the Ministry. The Ministry is also administratively concerned
with 29 autonomous/statutory bodies. There are also three Public Sector Undertakings under the
administrative control of the Ministry.
Central Procurement Agencies (CPA’s)
The establishment of India’s Central Procurement Agency (CPA) paved the way for a single procurement
system for healthcare goods for the Indian government’s health services and programmes. Separately,
the government has scaled up its low-cost Jan Aushadhi pharmacies, with 740 outlets planned in
the next two years, and at least one for each district as part of efforts to increase drug access and
affordability. A single procurement system should improve the transparency of the drug-tender system,
9th and 10th October 201392
Second International Conference of Pharmacoeconomics and Outcomes Research
enabling the government to negotiate better prices and streamline the current process, while expansion
of Jan Aushadhi will increase access to drugs and reduce out-of-pocket expenditure, as the stores
provide generic drugs at 50% less than the retail cost equivalent. As the sole national procurer, the
CPA will enjoy greater bargaining power over pharma firms, while the expansion of Jan Aushadhi will
mean that both innovative and generic firms can expect a push for lower pricing and larger volumes6.
Educational and Research Institutes
The Medical Council of India (MCI) is the statutory body for establishing uniform and high standards of
medical education in India. The Council grants recognition of medical qualifications, gives accreditation
to medical colleges, grants registration to medical practitioners, and monitors medical practice in
India.
The main functions of the Medical Council of India are the following:
• Establishment and maintenance of uniform standards for undergraduate medical education.
• Regulation of postgraduate medical education in medical colleges accredited by it. (The
National Board of Examinations is another statutory body for postgraduate medical
education in India).
• Recognition of medical qualifications granted by medical institutions in India.
• Recognition of foreign medical qualifications in India.
• Accreditation of medical colleges.
• Registration of doctors with recognised medical qualifications.
• Keeping a directory of all registered doctors (called the Indian Medical Register).
Registration of doctors and their qualifications is usually done by state medical councils.
It is obvious from global literature that pharmacoeconomic evidence can be utilized at various levels in
the healthcare setup to support decisions on licensing, pricing, reimbursement, and even maintenance
of formulary procedure of pharmaceuticals in hospitals. For the insurance companies to give better
facility at minimum cost, India must develop the platform for Pharmacoeconomics with a valid
methodology and appropriate training. Pharmacoeconomics should be proposed be a part of course
curriculum across various pharma colleges and universities in India.
9th and 10th October 2013 93
Second International Conference of Pharmacoeconomics and Outcomes Research
How these stakeholders can benefit from PEG?
PEG can be useful for these stakeholders to facilitate decision making in following ways:
1. National Pharmaceutical Pricing Authority (NPPA) – National Pharma Pricing Policy
• Prioritization and Identification of drugs/products in India, which are pharmaco-
economically more important and beneficial.
• Creation of database by sponsoring/conduction PE studies- Pharmacoeconomic Studies
and Health Technology Evaluation. Can replicate role of NICE – UK to some extent.
• Help government in identification of areas of pharmaceutical subsidies, import, and
identify the areas in research where government can incentivize the research of new
drugs and health technologies
2. Health Insurance – Health policy-makers and health systems research institutions in
collaboration with economic policy study institutes need to gather information about the
prevailing disease burden at various geographical regions to develop standard treatment
guidelines. This would help estimate the costing of health services for evolving benefit
packages and to determine the premium to be levied and subsidies to be given. This will
also help to map health care facilities available and the institutional mechanisms, which
need to be in place, for implementing health insurance schemes.7
3. Government/Central/State can be guided on reimbursement under various mandatory
sponsored insurance schemes like CGHS/ESIS. Department of Health Research
(DHR), Government of India) is expected to play pioneering role in development of
pharmacoeconomics research in India. DHR can somewhat play role similar to NICE in UK.
As per the mandate given by Government of India, it sates “DHR will promote and provide
guidance on research and governance issues, including ethical issues in medical and health
research”
4. Public hospitals Procurements: Guidance to States and Centre on free drug distribution in
public hospitals.
5. Guide government on subsidy to be provided on technologies, so that medicine bills could
be reduced, new technologies could be introduced in management of diseases and import
9th and 10th October 201394
Second International Conference of Pharmacoeconomics and Outcomes Research
duties waived off on essential pharmacoeconomic drugs.
6. Prescription Advice to practitioners in various therapeutic domains.
7. Creation of national database on the pharmacoeconomics of various drugs and health
technologies, which may help Central Bureau of Health Intelligence.
8. Universal Vaccination Programme: Pharmacoeconomic research can help prioritization of
vaccine and biological to be introduced in this programme by demonstrating comparative
impact of vaccines. Vaccines are considered as most pharmacoeconomic health interventions.
9. Prioritisation of clinical trial application: Drug Controller General of India/CDSCO is the
competent authority to give permission for clinical trial in India. However with the advent
of “Me too” drugs and large generic drug marker have similar claims but before marketing
they need to take approval from DCGI. However, similar to American and European
drug regulators, CDSCO is also short of experts to review applications and they need to
strategically prioritise. So, proposed pharmacoeconomic benefits can one of the deceasing
or enable in deciding, if the clinical trials can be evaluated and prioritised. It si several times
observed that globally various regulatory authorities spend lot of time to review clinical trial
application of generic and “Me too” drugs, where as those drug trials which are necessary
to be conducted in larger public interest are delayed. This will also encourage pharma
companies to innovate pharmacoeconomic economic medicine and health technologies.
Chapter IV: Existing scenario in India
A sincere attempt at estimating the current level of understanding and research efforts in
Pharmacoeconomics across India is essential to enable identification of gaps in knowledge and
maximize impact of these guidelines for various stakeholders in the healthcare chain. Systematic
Literature Reviews are essential first steps to consolidate existent data into meaningful inferences
on various aspects. One such review recently reported at the ISPOR Annual meeting at New Orleans,
20138 has attempted a comprehensive look at PE and OR research publications from India. The full
manuscript currently exists as Data on File and is under review for publication in one of the journals.
Abstract:
Background and Objectives: This systematic literature review was conducted to identify, evaluate,
and characterize the variety, quality, and intent of the health economics and outcomes studies being
9th and 10th October 2013 95
Second International Conference of Pharmacoeconomics and Outcomes Research
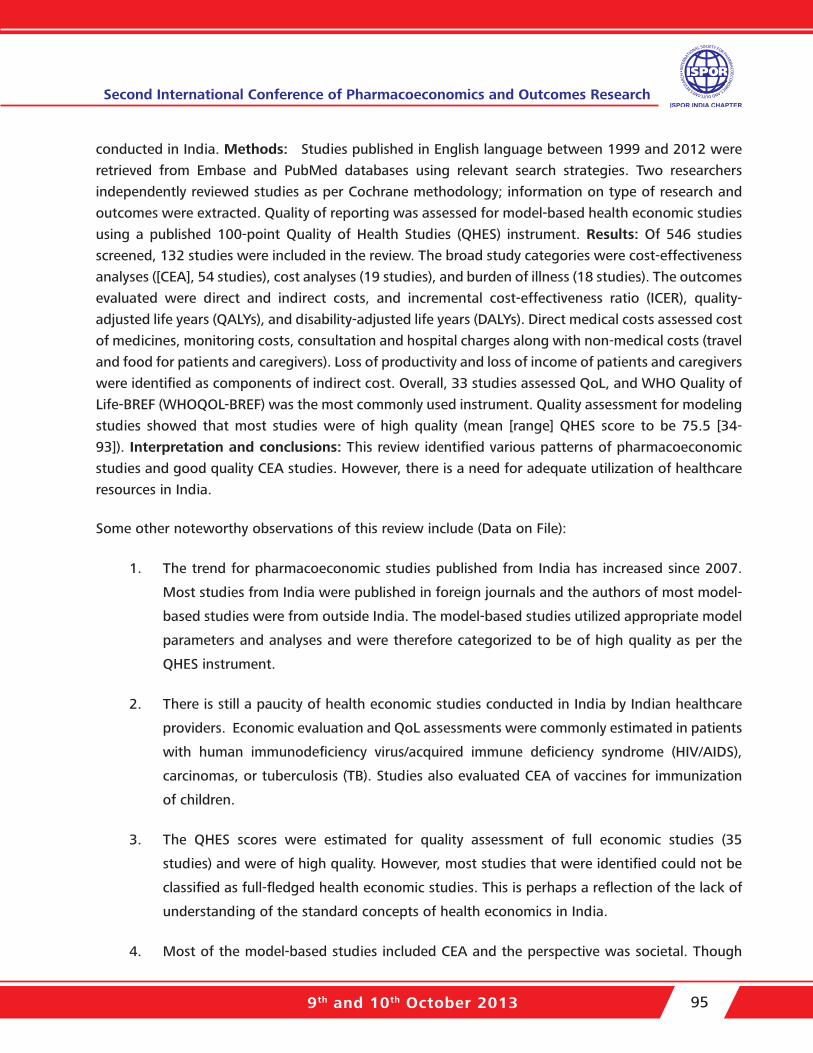
conducted in India. Methods: Studies published in English language between 1999 and 2012 were
retrieved from Embase and PubMed databases using relevant search strategies. Two researchers
independently reviewed studies as per Cochrane methodology; information on type of research and
outcomes were extracted. Quality of reporting was assessed for model-based health economic studies
using a published 100-point Quality of Health Studies (QHES) instrument. Results: Of 546 studies
screened, 132 studies were included in the review. The broad study categories were cost-effectiveness
analyses ([CEA], 54 studies), cost analyses (19 studies), and burden of illness (18 studies). The outcomes
evaluated were direct and indirect costs, and incremental cost-effectiveness ratio (ICER), quality-
adjusted life years (QALYs), and disability-adjusted life years (DALYs). Direct medical costs assessed cost
of medicines, monitoring costs, consultation and hospital charges along with non-medical costs (travel
and food for patients and caregivers). Loss of productivity and loss of income of patients and caregivers
were identified as components of indirect cost. Overall, 33 studies assessed QoL, and WHO Quality of
Life-BREF (WHOQOL-BREF) was the most commonly used instrument. Quality assessment for modeling
studies showed that most studies were of high quality (mean [range] QHES score to be 75.5 [34-
93]). Interpretation and conclusions: This review identified various patterns of pharmacoeconomic
studies and good quality CEA studies. However, there is a need for adequate utilization of healthcare
resources in India.
Some other noteworthy observations of this review include (Data on File):
1. The trend for pharmacoeconomic studies published from India has increased since 2007.
Most studies from India were published in foreign journals and the authors of most model-
based studies were from outside India. The model-based studies utilized appropriate model
parameters and analyses and were therefore categorized to be of high quality as per the
QHES instrument.
2. There is still a paucity of health economic studies conducted in India by Indian healthcare
providers. Economic evaluation and QoL assessments were commonly estimated in patients
with human immunodeficiency virus/acquired immune deficiency syndrome (HIV/AIDS),
carcinomas, or tuberculosis (TB). Studies also evaluated CEA of vaccines for immunization
of children.
3. The QHES scores were estimated for quality assessment of full economic studies (35
studies) and were of high quality. However, most studies that were identified could not be
classified as full-fledged health economic studies. This is perhaps a reflection of the lack of
understanding of the standard concepts of health economics in India.
4. Most of the model-based studies included CEA and the perspective was societal. Though
9th and 10th October 201396
Second International Conference of Pharmacoeconomics and Outcomes Research
other perspectives such as that of hospital, provider or patient were also represented in
some studies. This finding differs from the only other previously published literature review
by Desai et al9 who reported that most included studies did not present a perspective.
5. An understanding of true cost measures including all direct and indirect cost components is
necessary while formulating national policies. Few studies, example in TB and HIV patients
used resource utilisation and costs estimates from established or state level resources such
as National Institute for Research in Tuberculosis, Chennai, Y. R. Gaitonde Centre for AIDS
Research and Education (YRG CARE) in Chennai, the Karnataka Health Promotion Trust
(KHPT), the Andhra Pradesh State AIDS Control Society (APSACS) and National AIDS Control
Organisation (NACO) (for HIV anti-retroviral therapies). However, majority did not report the
source of cost data used while few others mentioned using institutional cost databases. It
is clearly apparent that no centralized cost database exists in the country making temporal
and inter- study comparisons extremely challenging.
6. Utilization of healthcare resources and resulting data from these health economic studies
in India by policy makers, and institutions was inadequately assessed and reported. The
disparity in resource availability as well as utilization that is evident in public vs. private
provision healthcare; rural vs. urban spending as well as seen across states was evident in
some studies and suggests the need for the policy initiatives to be relevant to the different
healthcare settings in India.
7. It is therefore, a challenge at the current time for healthcare providers to promote health
using improved and cost-effective modalities for the prevention, diagnosis and therapy of
various diseases and aliments.
Chapter V: Proposed guidance for Pharmacoeconomic Research in India
Guideline 1: Identify target groups of audience and type of analysis to be performed
The primary target of pharmacoeconomic research is the Ministry of Health and Family Welfare,
Government of India. More government stakeholders including Ministry of Chemicals and Fertilizers
(Department of Pharmaceuticals) will be identified during implementation phase of the guideline.
Secondary target groups include patients, prescribers, suppliers, hospitals, insurers and researchers.
Pharmacoeconomic research will provide insight into the cost-effectiveness of the drug.
9th and 10th October 2013 97
Second International Conference of Pharmacoeconomics and Outcomes Research
Guideline 2: Identify the perspective of the evaluation
Pharmacoeconomics evaluation should be performed and reported from a societal perspective, in
which all costs and benefits are included, irrespective of who actually bears the costs or receives the
benefits.
All studies must be reported from a social perspective. There is a broad consensus internationally, that
on the grounds of welfare-theory the social perspective should form the basis for pharmacoeconomic
evaluation. This social perspective means that, all costs and benefits should be identified regardless of
who incurs the costs or who receives the benefits. However, the comprehensive societal perspective
should be transparently disaggregated into multiple viewpoints, including that of the primary decision-
maker (the decision-maker, if any, to whom the study is primarily targeted). Relevant subsidiary
viewpoints could include the health care system, major third party payers such as ministries of health,
and the patient and family viewpoint. No matter what the viewpoint chosen, it should obviously be
consistent on both sides of the cost-outcome ratio (i.e. in both the numerator and the denominator).
Guideline 3: Justifications on choice of comparator should be provided
How and why a comparator was used in PER?
The economic evaluation of a drug is always based on comparison with another treatment. The
outcome of that comparison will be largely determined by the choice of the comparator. Selecting the
right comparative treatment is therefore vitally important, not only for the economic evaluation but
also when evaluating the therapeutic value of the drug. In choosing the comparator, it is important
to adhere as closely as possible to the current guidelines and evaluation procedures.There may be
a variety of relevant comparators for a drug, and they may differ across the various subgroups of
patients. Relevant comparators may include other drugs, other medical care (e.g. surgery or watchful
waiting), and no treatment. In theory, all other possible treatments for the same patients are relevant
comparators. In practice, studies will have to identify one, or a small number, of primary relevant
comparators. The issue of relevant comparators is complicated because there are two possible
questions. Is the new drug cost-effective relative to the existing drugs or treatments that it will in fact
replace (local cost-effectiveness)? Or, is the new drug cost-effective relative to optimally cost-effective
treatment (global cost-effectiveness)? For example, if current practice is itself unevaluated (which is
often the case) and if current practice is in fact not cost-effective, the new drug can appear to be cost-
effective (locally cost-effective) when in fact it is not (not globally cost-effective).
In the ideal situation, one would compare the current most cost-effective option (as reflected
[theoretically] in current practice guidelines or criteria for use) to the new agent. Practically, one often
cannot identify such a comparator and, therefore, will use the agent with the lowest treatment costs
(i.e. the sum of drug costs, administration costs, and the costs of treating any side effects) for a given
9th and 10th October 201398
Second International Conference of Pharmacoeconomics and Outcomes Research
course of therapy. This is more appropriate than using the drug with the lowest unit price as the
comparator. However, even choosing the lowest cost comparator can be difficult. The selection of an
appropriate comparator requires input from the decision-makers, as the choice of comparator relates
to the question(s) the target audience wants answered. Thus, analysts are encouraged to obtain input
from decision-makers as they develop their research protocols.
The comparative treatment can also be a non-medicinal form of treatment. A number of problems can
arise in the practical application of these guidelines. The prescribing behavior of doctors and therapeutic
insights can both change with time. This means that views on the most suitable comparative treatment
will also change. What was considered to be a well-founded choice of comparator for Phase 3 studies
may, once all the clinical studies have been concluded, or by the time the drug is being registered for
inclusion on the list, prove to no longer be the most appropriate choice. It is also important that clinical
research with new drugs has a markedly international character; when choosing the comparison
model, a manufacturer cannot be expected to take all possible views and desires into account. The
choice made may deviate from what would normally be regarded as ‘standard’ in India. This choice
will have to be supported by arguments demonstrating a close a connection with generally accepted
guidelines and protocols. Since it is so important that the comparative treatment should adhere as
closely as possible to the Indian situation, consultation on the choice will usually be necessary before
carrying out pharmacoeconomic evaluation.
Guideline 4: Choice on use of Analytical technique to be used for PER
If the improvement in quality of life forms an important effect of the drug being assessed, then it is
necessary to carry out a cost-utility analysis (CUA). If this is not the case, then at effectiveness (CEA) has
to be carried out. If the manufacturer does not expect the drug to have an added therapeutic value,
nor that it will be mutually replaceable with (a) different drug(s), then a cost-minimisation analysis
(CMA) can be carried out.
In the case of a new drug, research is primarily aimed at determining its therapeutic value. If the drug
has a therapeutic added-value, then its costs and how these costs relate to the therapeutic added-
value must be defined by means of an economic evaluation. All aspects of the treatment, such as side-
effects and their costs, must be included in the evaluation. For the economic analysis of new drugs
a choice can be made between a cost-minimization analysis (CMA), cost-effectiveness analysis (CEA),
cost utility analysis (CUA) or cost-benefit analysis (CBA). Although there is considerable overlap among
the various analytic techniques that can be used, it is useful to identify the following five methods. Not
all of these approaches have been widely used, but conceptually they are distinct and the distinctions
are useful in helping to clarify the field.
1. Cost-Minimization Analysis (CMA): Cost-minimization analysis is appropriate when the
9th and 10th October 2013 99
Second International Conference of Pharmacoeconomics and Outcomes Research
clinical outcomes (i.e. efficacy and safety) for the drug and the comparator(s) are virtually
the same. In such a case, the decision simply revolves around the costs.
2. Cost-Consequence Analysis (CCA): This is a disaggregated type of study that makes the
least assumptions and puts the greatest burden on the decision-makers. It is a “Consumer
Reports” style of study. The costs and consequences of the drug compared to one or more
relevant alternatives are simply listed in disaggregated form (e.g. drug costs, hospital costs,
other costs, strokes avoided, minor side-effects, major side effects, etc.). Any weighting of
the component factors and aggregation is left to the user of the study.
3. Cost-Effectiveness Analysis (CEA): In cost-effectiveness analysis, the incremental costs are
compared to the incremental outcomes as measured in physical or natural units. Natural
units could range from clinical measures, such as millimeters of mercury blood pressure
reduction, through disability days averted, to lives saved, or life-years gained.
4. Cost-Utility Analysis (CUA): Cost-utility analysis refers to a particular form of CEA where
the outcomes are measured in terms of quality-adjusted life years (QALY) gained. QALYs
combine changes in quantity and quality of life (QOL; mortality and morbidity) into one
composite measure which is independent of program or disease. The quality-adjustment
factors should reflect aggregated preferences of individuals for the outcomes. The factors
have been measured directly on patients or the general public, taken from published tables
or formulae, or estimated by professional judgments.
5. Cost-Benefit Analysis (CBA): In cost-benefit analysis, the incremental outcomes are
expressed in dollar terms, usually using the contingent valuation approach of estimating
benefits to elicit an assessment of willingness to pay (WTP), so that the overall analysis can
be conducted entirely in dollars.
A process should be established within each disease category to agree upon standard clinical outcomes
that could be used for CCA, CMA, and CEA. Moreover, the outcomes could form the basis for the
preference elicitations required in both of CUA and CBA.
Guideline 5: Time horizon of a Pharmacoeconomic evaluation
Time horizon of PE evaluation must be such that it enables valid and reliable statements to be made
regarding the effects and costs of the treatments being compared. This includes both intended and
unintended effects and costs (e.g. side effects).
9th and 10th October 2013100
Second International Conference of Pharmacoeconomics and Outcomes Research
The analytic horizon of a pharmacoeconomic evaluation must be able to capture all relevant outcomes.
This time horizon should provide sufficient opportunities for observing the most important outcomes
of the intervention. When modeled data are needed to meet this requirement, the structure and
rationale of the model must be presented. The analytic horizon for pharmacoeconomic studies should
extend into the future to capture the major clinical and economic outcomes related to the treatment(s)
under study. It must be emphasized that the same time horizon must be applied to both costs and
outcomes. In many cases, this would mean that the analysis must follow patients for the duration
of their lifetime. Frequently, the appropriate analytic horizon will extend beyond the availability of
primary data. In this case, the study will consist of primary data and modeled data. The assumptions
of modeling should be explicit, well-justified, and thoroughly tested by sensitivity analysis. In many
studies it may be useful to analyze the data using several analytic horizons: a short-term horizon that
includes only primary data, and a long-term horizon that also incorporates modeled data.
The time within which effects and costs can be anticipated depends on the treatment goal and thus on
the anticipated outcome. When a decision has to be made regarding the reimbursement of a new drug,
there is often insufficient information available about its effectiveness. To obtain this information, the
drug needs to be used in practice. Because primary data usually provide insufficient insight into the
value of a drug in the medium- and long-term, modeled data will often have to form an integral part
of the dossier being submitted in application for reimbursement.
Guideline 6: Cost identification, measurement and evaluation
Cost identification
Cost identification involves identifying all the relevant resource items for subsequent measurement
and valuation. A useful first step is to develop a probability or decision tree of the therapeutic pathway
which describes all relevant downstream events. Then viewpoints for the analysis are selected, and
resource items that are applicable to each viewpoint are identified. In the comprehensive societal
viewpoint, all costs related to the therapeutic pathway should be included; however, transfer payments
(e.g. sickness pay, unemployment insurance, welfare payments) should not. If subsidiary viewpoints
are presented in the analysis, they should contain the subset of cost items relevant to that viewpoint
but which were excluded from the primary societal analysis. This means that subsidiary analyses may
include transfer payments if they represent a cost or savings from the viewpoint in question.
The following cost categories can be distinguished:
Direct costs within the healthcare system: From a social perspective, the direct costs within the
healthcare system must form part of the analysis. These are the medical costs of prevention, diagnosis,
therapy, etc.
9th and 10th October 2013 101
Second International Conference of Pharmacoeconomics and Outcomes Research
Direct costs outside the healthcare system: From a social perspective, the direct costs outside the
healthcare system must form part of the analysis. An example of such costs is a patient’s travelling
expenses
Indirect costs within the healthcare system: These are the medical costs which may arise during life-
years that have been saved. It is increasingly recommended that these costs should only be included in
the analysis if there is a clear relationship with the intervention. Costs of illnesses that are not related
to the intervention should be omitted from the analysis.
Indirect costs outside the healthcare system: In the case of indirect costs outside the healthcare
system, the focus is mainly on the costs of production losses. However, it can also involve costs in other
sectors (e.g., education). One approach for determining these costs is the human capital approach
(HCA). This method is controversial, however, because it can lead to extremely high outcomes (for
the savings made), which raises the question of whether the results are realistic. This is because in
the HCA, the potential (and, in theory, maximum) production loss is calculated by totaling the loss of
earnings from the moment of morbidity/mortality to the moment of retirement.
An alternative approach to HCA is the ‘friction cost method’. The period over which the production
loss is calculated is limited to the friction period, i.e. the period between the initial absence and the
actual moment of replacement. This period is currently estimated to be some 3 months on average.
Due to the above-mentioned overestimation, the human capital method is not the method of choice.
It is preferable to use the friction cost approach. For the sake of completeness, it should be mentioned
that costs incurred as a result of the research itself should not be included.
Cost measurements
The deployment of people and resources during a treatment must first be described in natural
(non-monetary) units, such as hours, tasks, nursing days or daily doses. All cost data obtained from
international studies must be validated for use in India. A distinction should be made between volume
and price when presenting the costs. The natural units should be shown in as much detail as possible.
Showing the deployment of people/resources in volume units also makes the study more easily
transferable to other countries/situations.
Resources used in treatment must first be described in natural (non-dollar) units. All resource utilization
data derived from international trials must be validated for Canadian practice. Costs are the product
of a vector of the quantities of resources (Q) and the unit prices of resources (P). Cost measurement
consists of determining the quantities, Q, of resources (i.e. health care resources, non-health care
resources, informal caregiver time, patient time for treatment) used as part of a given intervention.
Cost valuation consists of determining the unit costs/prices, P, of these individual resources. It is
9th and 10th October 2013102
Second International Conference of Pharmacoeconomics and Outcomes Research
important to separate these two concepts, in part, because of the potential to use standard costs for
valuation. Where should one go to determine the resource consumption associated with a particular
product? In considering drugs that go through multiple trials during their development, the later trials
would more nearly match the actual therapeutic pathway of final use and would be the appropriate
source for the resource quantities. In considering international trials, it should be noted that resource
quantities cannot be directly imported into the Indian system; because of the major differences in the
way that health care is delivered in many countries. As a minimum, resource quantities must be re-
validated for Indian practice. Note should also be made regarding the methods by which one analyzes
the uncertainty inherent in resource utilization versus unit price data. The former should be subjected
to inferential statistical analysis, while with the latter uncertainty should be evaluated via sensitivity
analysis.
Cost evaluation
Economic definitions should be used for the costs. Ideally, uniform amounts should be used for certain
cost categories in order to promote the comparability and extrapolability of the results of different
studies.
Guideline 7: Assessing quality of life and QALYs
The quality of life (QOL) can be measured by using generic and disorder specific questionnaires or a
utility instrument. In a prospective study, if health related quality of life (HRQOL) is being included as an
outcome, one instrument from each of the following three types: specific measures, generic profiles,
and preference-based measures can be included. Quality of life includes many aspects of living in
addition to health, for example; wealth, freedom, political system, and cleanliness of the environment
all contribute to the overall QOL10.
Specific Measures
Specific instruments include those that target at specific diseases, such as the Functional Living Index
- Cancer11 or the Western Ontario-McMaster Osteoarthritis Index12; specific populations, such as the
Care and Resource Evaluation Tool for the Elderly13; and specific functions, such as visual function
measured by the Activities of Daily Vision Scale14.
Generic Measures
Generic measures are applicable to a wide range of patients and diseases15. They provide scores on
a number of dimensions and typically are not aggregated into an overall summary score. Three well
known instruments in this category are the Short Form 3616 (SF-36), the Sickness Impact Profile (SIP17),
and the Nottingham Health Profile (NHP18).
9th and 10th October 2013 103
Second International Conference of Pharmacoeconomics and Outcomes Research
QALYs
A QALY is calculated by multiplying the number of life years added via a program by a standardized
weight (between 0.0 and 1.0) that reflects the health-related quality of life during that time (where
0.0 is the weight given to immediate death and 1.0 is the weight given to perfect health for a defined
period of time). In a slight variation on this theme, some approaches to QALY weights provide for the
possibility of negative weights for states considered worse than death19.
Direct Measurement
Direct measurement requires conducting of complex and costly measurement tasks using one of the
three more widely used instruments: the standard gamble or time trade-off for revealed preferences;
or the visual analog scale for stated preferences.
The weights can be obtained indirectly through the use of “off the shelf” preference weighted health
status systems. Three well-known instruments in this category are the Quality of
Well Being (QWB20), the Health Utilities Index (HUI21), and the EuroQol, now renamed the EQ-5D22.
All of these systems have the same overall structure, whereby health status is described by multiple
attributes and levels of function within each attribute. The score represents an estimate of the mean
preference score that would be given to that health state by a random sample of the general public.
In each indirect preference measurement system, every unique combination of levels across attributes
defines a unique health state.
Guideline 8: Modelling
The use of modeling techniques is desirable in pharmacoeconomic studies. There are two different
and important situations in which the modelling of data is required. The first is to obtain effectiveness
data from efficacy data. The second occurs if the data originated from a study which was carried out
in another country with a different healthcare system. This is of particular importance in the context of
multinational studies. The modelling of data must be carried out with great care. Choices made need
to be substantiated.
The translation from various other guidelines referred (Dutch and Canadian) should take into account
demographic and epidemiological differences, differences in the provision of healthcare, differences
in (financial) incentives for healthcare providers and differences in relative prices.
Ideally, pharmacoeconomic studies should report on drug effectiveness rather than efficacy. As
effectiveness data are generally not available, appropriate modelling techniques based on sound
Pharmacoepidemiology (e.g. using epidemiologic studies to estimate patient compliance with therapy
9th and 10th October 2013104
Second International Conference of Pharmacoeconomics and Outcomes Research
in the real world) are permissible. All assumptions used in such extrapolation techniques must be
stated explicitly and thoroughly tested with sensitivity analysis.
Guideline 9: Incremental analysis
Costs and effects must be reported in the form of incremental values (i.e. as differences between two
alternatives). These incremental values must be used in the pharmacoeconomic evaluation. The study
must also provide insight into the total values of the costs and effects of both treatments. From the
incremental analysis one can deduce what the (net) difference in costs and effects will be when the
new treatment replaces the existing one. In order to place the outcome of the incremental analysis
in a broader context, the total costs and effects also need to be reported. The inclusion of total costs
and effects will, moreover, improve the ability to translate the study to, for example, (future) situations
with another comparative treatment.
Analytic Technique
Although there is considerable overlap among the various analytic techniques that can be used, it is
useful to identify the following five methods. Not all of these approaches have been widely used, but
conceptually they are distinct and the distinctions are useful in helping to clarify the field.
Cost-Minimization Analysis (CMA): Cost-minimization analysis is appropriate when the clinical
outcomes (i.e. efficacy and safety) for the drug and the comparator(s) are virtually the same. In such a
case, the decision simply revolves around the costs.
Cost-Consequence Analysis (CCA): This is a disaggregated type of study that makes the least
assumptions and puts the greatest burden on the decision-makers. It is a “Consumer Reports” style
of study. The costs and consequences of the drug compared to one or more relevant alternatives are
simply listed in disaggregated form (e.g. drug costs, hospital costs, other costs, strokes avoided, minor
side-effects, major side effects, etc.). Any weighting of the component factors and aggregation is left
to the user of the study.
Cost-Effectiveness Analysis (CEA): In cost-effectiveness analysis, the incremental costs are compared
to the incremental outcomes as measured in physical or natural units. Natural units could range from
clinical measures, such as millimeters of mercury blood pressure reduction, through disability days
averted, to lives saved, or life-years gained.
Cost-Utility Analysis (CUA): Cost-utility analysis refers to a particular form of CEA where the outcomes
are measured in terms of QALY gained. QALYs combine changes in quantity and QOL (mortality and
morbidity) into one composite measure which is independent of program or disease. The quality-
adjustment factors should reflect aggregated preferences of individuals for the outcomes. The
9th and 10th October 2013 105
Second International Conference of Pharmacoeconomics and Outcomes Research
factors have been measured directly on patients or the general public, taken from published tables or
formulae, or estimated by professional judgment. Readers should beware that not everyone makes the
distinction between CEA and CUA which has been made in this document. Some researchers refer to
CUA studies as CEA or as cost per QALY (gained) studies.
Cost-Benefit Analysis (CBA): In cost-benefit analysis the incremental outcomes are expressed in dollar
terms, usually using the contingent valuation approach of estimating benefits to elicit an assessment
of willingness to pay (WTP), so that the overall analysis can be conducted entirely in dollars. Consistent
with the desire to permit broad comparisons, the expression of results in cost-utility or cost-benefit
terms is preferred. Cost-minimization analysis is, of course, appropriate in those rare cases where
clinical outcomes across alternatives are virtually the same. The expression of results in only cost-
effectiveness or cost-consequence terms is acceptable, with justification, for example, when there is
no important impact on health-related quality of life (HRQOL). A process should be established within
each disease category to agree upon standard clinical outcomes that could be used for CCA, CMA, and
CEA. Moreover, the outcomes could form the basis for the preference elicitations required in both of
CUA and CBA.
Guideline 10: Discounting future effects and costs
Future outcomes and costs should be discounted at equal rates. The current discount rate must be
applied. This discount rate must be varied in a sensitivity analysis. If other percentages are used as the
basic discount rate, they need to be thoroughly substantiated.
Future outcomes are required to be discounted at the same rate as costs. This rate must be varied in a
sensitivity analysis, with a discount rate of 0% (no discounting) at minimum. Discussions can be made
that these future outcomes must be discounted, and at the same rate as costs, to avoid paradoxical
results.23,24 Experts also call for increased research on individuals’ time preferences in order to come
to a resolution regarding the differential discounting of costs and benefits. The discount rate should,
however, be varied in a sensitivity analysis. At minimum, a sensitivity analysis involving a discount
rate of 0% should be carried out in order to assess the impact of the above argument. In addition,
it is suggested that sensitivity analysis based on a 3% rate should be considered, in order to allow
comparisons with studies which will be using the 3% rate required by the Washington Panel reference
case25.
Identification of Cost
A probability tree of the therapeutic pathway which describes all relevant downstream events should
be provided, when appropriate. Cost items that should be included are all direct health care costs,
social services costs, spillover costs on other sectors, and costs that fall on the patient and family. Cost
items that should be excluded are those not relevant to the therapeutic pathway such as those not
9th and 10th October 2013106
Second International Conference of Pharmacoeconomics and Outcomes Research
related to the treatment being evaluated, costs relevant only to the clinical trial, and transfer payments
such as sickness pay, unemployment insurance and welfare payments.
When relevant, lost time should be documented and reported as part of the description of the impact
of the intervention. If HRQOL is an outcome measure in the study, some lost time will likely contribute
to changes in HRQOL. Depending on the viewpoint, some lost time will represent a real cost in terms
of lost resources and should be included as a cost item, but should also be tested with sensitivity
analysis.
Cost identification involves identifying all the relevant resource items for subsequent measurement
and valuation. A useful first step is to develop a probability or decision tree of the therapeutic pathway
which describes all relevant downstream events.
Future Health Care Costs
One of the important issues is that of dealing with future health care costs; that is, the costs associated
with patients who live longer and consume health care resources as a result of a given intervention.
Future costs should be judged by their relationship to the intervention; for example, any additional
care required during “added years of life” as a direct consequence of the program in question. For
instance, future costs of care for patients who survive septic shock via a new intervention should
include the cost of treating the underlying condition which is now an issue as a direct consequence of
giving the new therapy. Alternatively, the impact of a new drug for high cholesterol produces added
years of life which occur far into the future. One would not be expected to include the treatment costs
of clinically unrelated diseases (e.g. cancers) during the added life years, because these treatment
costs are not a necessary and direct consequence of the specific intervention. Also, availability of data
should be taken into consideration.
Cost of Loss of Productivity
Cost of lost time or indirect non-medical costs (i.e. productivity costs, formerly referred to as indirect
medical costs) they relate to economic evaluations taking the societal perspective.
Patients and/or family members can lose time from work and other activities as part of illness and
treatment. For family members, time may be lost in taking patients for treatment, visiting patients in
hospital, or caring for patients at home. The amount of lost time, by whom, and lost from what (work,
other major activity, leisure) should be recorded. At the most basic level, these data should be reported
as consequences of the intervention.
Placing a value on lost time has been the focus of papers by Koopmanschap and his colleagues26. They
have proposed the friction cost method as an alternative to the HCA for incorporating work absence
9th and 10th October 2013 107
Second International Conference of Pharmacoeconomics and Outcomes Research
and productivity losses into economic evaluations.27,28 This may be an alternative means of accounting
for lost time, although it omits the value of the patient’s time in the analysis (which is contrary to
welfare economic theory) and is most correctly used in a non-full employment scenario.
Guideline 11: Use of expert panel
The current report describes the pharmacoeconomic guidelines in Indian scenario. A Guideline
Development Committee has been set up for the development of the same. The Committee has
tailored the Canadian guidelines and Dutch practice and has, where necessary, introduced certain
modifications as per the Indian scenario. In addition, the guidelines have been formulated with respect
to the choice of the comparative treatment. The guidelines have adopted the social perspective as
their starting-point. This implies that direct costs, inside and outside the healthcare system, need to
be included in the analysis. The indirect costs outside the healthcare system should be mentioned
separately. A new standard cost list if required will be available for the purpose of uniformity of
costs. The Committee also recognizes that differences in interpretation may occur, especially in the
beginning and reconciliation may be required. The pharmacoeconomic guidelines will be evaluated
and adjusted where necessary.
Chapter VI: Proposed areas of further research In India
Anticipated road map on formalisation of PEG India
• Phase 1 of PEG: Education and awareness on Pharmacoeconomics
• Phase 2 of PEG: Data generation and analysis and Meta-analysis, pilot studies.
• Phase 3 of PEG: Advisories and regulatory recommendations.
• Phase 4 of PEG: Expansion of PEG to other areas like Insurance, Clinical Prescriptions, and
Policy etc.
Core committee recommends that PE studies be conceptualized and their relevance demonstrated
through some of the areas enumerated below and more inputs are at present being sought from
experts to further refine this list.
This will be an essential step in making these guidelines more comprehensive and adaptable to India
scenario while also enhancing the understanding of PER data applicability by various stake holders.
1. Study the current policy decision making processes prevalent in health care sectors in India
2. Study on the role of PEOR in enhancing equity in health care and prioritisation of health care
spending within the exisiting policy framework In India.
9th and 10th October 2013108
Second International Conference of Pharmacoeconomics and Outcomes Research
3. Study on the role of PEOR on health impact assessment in evaluation of national health
programmes in India.
4. Studying the feasibility and utility of a national pharmacoeconomic database.
5. Identify the road blocks in conduct of reliable PE studies in India .
6. Encourage and train researchers on conduct of systematic reviews and meta-analysis in
their respective domains to generate and build on robust data for initiation of PEA and HTA
(health technology assessment) by policy makers.
7. Encourage better reporting of PE data in a user friendly manner by making use of the
recent guidance for economic evaluations of health interventions- The Consolidated Health