Page 1
Prospects of the WSR-88D Radar for Cloud Studies
VALERY M. MELNIKOV
Cooperative Institute for Mesoscale Meteorological Studies, University of Oklahoma, Norman, Oklahoma
DUSAN S. ZRNIC AND RICHARD J. DOVIAK
NOAA/OAR/National Severe Storms Laboratory, Norman, Oklahoma
PHILLIP B. CHILSON
School of Meteorology and Atmospheric Radar Research Center, University of Oklahoma, Norman, Oklahoma
DAVID B. MECHEM
Atmospheric Science Program, Department of Geography, University of Kansas, Lawrence, Kansas
YEFIM L. KOGAN
Cooperative Institute for Mesoscale Meteorological Studies, University of Oklahoma, Norman, Oklahoma
(Manuscript received 1 June 2009, in final form 21 March 2010)
ABSTRACT
Sounding of nonprecipitating clouds with the 10-cm wavelength Weather Surveillance Radar-1988 Doppler
(WSR-88D) is discussed. Readily available enhancements to signal processing and volume coverage patterns
of the WSR-88D allow observations of a variety of clouds with reflectivities as low as 225 dBZ (at a range of
10 km). The high sensitivity of the WSR-88D, its wide velocity and unambiguous range intervals, and the
absence of attenuation allow accurate measurements of the reflectivity factor, Doppler velocity, and spectrum
width fields in clouds to ranges of about 50 km. Fields of polarimetric variables in clouds, observed with
a research polarimetric WSR-88D, demonstrate an abundance of information and help to resolve Bragg and
particulate scatter. The scanning, Doppler, and polarimetric capabilities of the WSR-88D allow real-time,
three-dimensional mapping of cloud processes, such as transformations of hydrometeors between liquid and
ice phases. The presence of ice particles is revealed by high differential reflectivities and the lack of correlation
between reflectivity and differential reflectivity in clouds in contrast to that found for rain. Pockets of high
differential reflectivities are frequently observed in clouds; maximal values of differential reflectivity exceed
8 dB, far above the level observed in rain. The establishment of the WSR-88D network consisting of 157
polarimetric radars can be used to collect cloud data at any radar site, making the network a potentially
powerful tool for climatic studies.
1. Introduction
Clouds cycle water and energy through the atmo-
sphere and play a vital role in determining the global
radiation balance. A large amount of cloud data has
been obtained with millimeter-wavelength radars. The
use of short wavelengths makes it possible to achieve
a very high level of spatial resolution with relatively
small antennas and to provide good detectability of non-
precipitating clouds. Kollias et al. (2007) recently pub-
lished a review of ground-based cloud radars and their
applications (see also Hamazu et al. 2003; Manheimer
et al. 2003; Widener and Mead 2004). Continuously run-
ning millimeter-wavelength cloud radars (MMCRs),
operated by the Atmospheric Radiation Measurement
Program (ARM), have vertically pointed beams so they
obtain cloud parameters above the radars. There are
two types of MMCRs, which we will be referring to as
MMCR-8 and MMCR-3: the first operates at an 8-mm
Corresponding author address: Dr. Valery Melnikov, CIMMS,
University of Oklahoma, 120 David Boren Blvd., Rm. 4919, Nor-
man, OK 73072.
E-mail: [email protected]
APRIL 2011 M E L N I K O V E T A L . 859
DOI: 10.1175/2010JAMC2303.1
� 2011 American Meteorological Society
Page 2
wavelength and the second at a 3-mm wavelength. Re-
trievals of cloud parameters using MMCRs can be found
in Kropfli and Kelly (1996), Clothiaux et al. (1995),
Kollias et al. (2001), Matrosov et al. (1992, 2002), and
Reinking et al. (2002), among others.
In April 2006, the Cloud Profiling Radar (CPR) was
put into orbit as part of the CloudSat mission. The CPR
is a 3-mm-wavelength radar developed in order to col-
lect global data from clouds (Stephens et al. 2002). The
CPR has demonstrated unique capabilities for cloud
mapping, but its data have severe limitations in spatial
resolution, the number of measurement parameters, and
update time. These limitations will be difficult to over-
come in the foreseeable future.
The National Weather Service (NWS) operates a
network of 10-cm-wavelength WSR-88Ds; the network
has 157 units. This network has been designed to mon-
itor severe weather and precipitation. As such, existing
radar volume coverage patterns (VCPs) have been op-
timized for those purposes. The maximum elevation
angle of the VCPs is about 208 and the signal-to-noise
ratio (SNR) threshold for reflectivity displays is typically
set to 2 dB. All of these factors constructively combine
to inhibit the detection of echoes from nonprecipitating
clouds. We show that the high-power transmitters, low-
noise receivers, and readily available enhancements to
signal processing give the WSR-88D an inherent capa-
bility to detect a variety of nonprecipitating clouds.
Miller et al. (1998) arrived at mixed results when com-
paring cloud detections using a WSR-88D from the NWS
network and those detections obtained with a vertically
pointed 3-mm-wavelength cloud radar. Both radars de-
tected clouds up to 80% of the time during a 2-month
campaign; sometimes, the WSR-88D registered echoes
that had not been registered with the 3-mm-wavelength
radar and vice versa. Miller et al. show that significant
obstacles impair the collection of cloud data with a WSR-
88D using available algorithms. But we were able to op-
erate the National Severe Storms Laboratory’s (NSSL’s)
Research and Development WSR-88D in a mode that
overcame many of these obstacles to demonstrate the in-
herent capabilities of this radar for cloud measurements.
Furthermore, we discuss how upcoming polarimetric up-
grades to the WSR-88D can help resolve some of the
ambiguities that plagued the measurements made by
Miller et al. (1998).
In section 2, we compare the theoretical perfor-
mance of the NSSL WSR-88D (i.e., KOUN, located in
Norman, Oklahoma) with that obtained with the MMCRs
being used for continuous data collection [i.e., ARM’s
MMCR-8 and MMCR-3, and the CPR operated by
the National Aeronautics and Space Administration
(NASA)]. We also compare cloud observations made
with a network WSR-88D to those made at KOUN (i.e.,
a polarimetric WSR-88D). Polarimetric capabilities will
be added to the network of WSR-88Ds in the near future.
In section 3, we demonstrate the importance of a large
unambiguous velocity interval and low attenuation rates
for quantitative cloud measurements. In section 4, we
present the first results of polarimetric radar observa-
tions in nonprecipitating clouds conducted at KOUN.
We also demonstrate the importance of low attenuation
rates for quantitative polarimetric measurements. In
section 5, we discuss how dual-wavelength polarimetric
data can help to resolve the relative contributions from
incoherent and coherent scatter.
2. KOUN signal processing for cloud observations
WSR-88Ds are operated in two surveillance modes:
‘‘clear air’’ and ‘‘precipitation.’’ The clear-air mode is
used in fair weather to monitor the possible devel-
opment of precipitation. In this mode, a microwave
pulse of longer length (4.5 ms) is transmitted to improve
the detection of weak echoes. Upon detecting echoes
above a selected reflectivity factor threshold, the radar
automatically switches over to the precipitation mode
that uses the shorter-length pulse (1.57 ms). To stipulate
cloud detection capabilities, two parameters are most
significant: 1) the reflectivity factor Z10 that produces an
echo SNR 5 0 dB at a range of 10 km and 2) range
resolution, DR. The Z10 in the precipitation mode is
221.5 dBZ (Doviak and Zrnic 2006, Table 3.1); in the
clear-air mode sensitivity is 9.5 dB better but DR is about
750 m. So there is the likelihood that the number of scat-
terers will not increase proportionally with DR, a required
condition necessary to achieve the 9.5-dB sensitivity
increase. This condition is less likely to be met for ob-
servations of thin cloud layers at high-elevation angles.
For this reason, we have restricted our observations to
the short pulse mode.
To enhance quantitative measurements of clouds, the
following data collection and signal processing pro-
cedures were used:
1) longer dwell times (i.e., 128 samples spaced about
1 ms apart, about 3 times that typically used by the
NWS) to improve the accuracy of the measurements,
2) smaller elevation increments (i.e., 0.258 instead of 18)
to improve the accuracy and number of measure-
ments,
3) twice the range sampling rate, also to improve ac-
curacy,
4) a noise speckle remover to reduce the occurrence of
false echoes,
5) correlation estimators for polarimetric variables to
lessen noise effects,
860 J O U R N A L O F A P P L I E D M E T E O R O L O G Y A N D C L I M A T O L O G Y VOLUME 50
Page 3
6) data collection at elevations higher than 208 to ob-
serve clouds at close range, and
7) ground clutter filters at all elevations to remove
many artifacts.
Procedures 1–5 improve the accuracy of the presented
data and provide images that are less cluttered by
noise and artifacts. We collected cloud data at eleva-
tions angles up to 608, the elevation limit for the WSR-
88D. These data collection and processing procedures
allow clear data presentations at SNRs as low as
27 dB. Herein, we present radar images as verti-
cal cross sections or range–height indicators (RHIs).
At the pulse repetition frequency (PRF) of 1280 Hz,
24 s is needed to complete one RHI with procedures
1–7 above. For the KOUN radar, Z10, presented in
the nonpolarimetric mode, is 221.5 dBZ (Table 1).
Radar products from the network WSR-88D are gen-
erated if the SNR is larger than 2 dB. Thus, we present
reflectivity data 9 dB lower than that typically used by
the NWS. The standard deviation fi.e., SD[Z(dBZ)]g of the
reflectivity factor estimate for a radar resolution volume
(i.e., 18 3 0.25 km) producing an SNR of 27 dB is SD(Z) 5
4.34/(M1/2SNR)[1 1 2SNR 1 SNR2/(2syn
p1/2)]1/2 dBZ,
where syn5 sy/(2ya) and ya is the unambiguous velocity
(Doviak and Zrnic 2006; section 6.3.1.2). For an SNR 5 0.2
(27 dB), sy 5 1 m s21, and M 5 768, (i.e., 128 time
samples, multiplied by the 4 angular and 1.5 range samples),
we obtain SD(Z) 5 1.0 dBZ.
Several of the significant parameters of some cloud ra-
dars and the WSR-88D are listed in Table 1. The 8-mm-
wavelength radars are capable of resolving many of the
structures found within clouds of varying thickness (Moran
et al. 1998). Although the MMCR-3 radars are well suited
for cloud observations, attenuation becomes an issue. As
can be seen in Table 1, the minimum measurable re-
flectivity that will be available from the upgraded polari-
metric WSR-88D is about the same as that for the 3-mm
MMCRs, and about 5 dB worse than that for the MMCR-
8 in the general mode. Thus, the detectability of clouds by
the WSR-88D is comparable to that of the cloud radars.
But the ground-base cloud radars are superior by a factor
of 3–5 to the WSR-88D in spatial resolution (Table 1).
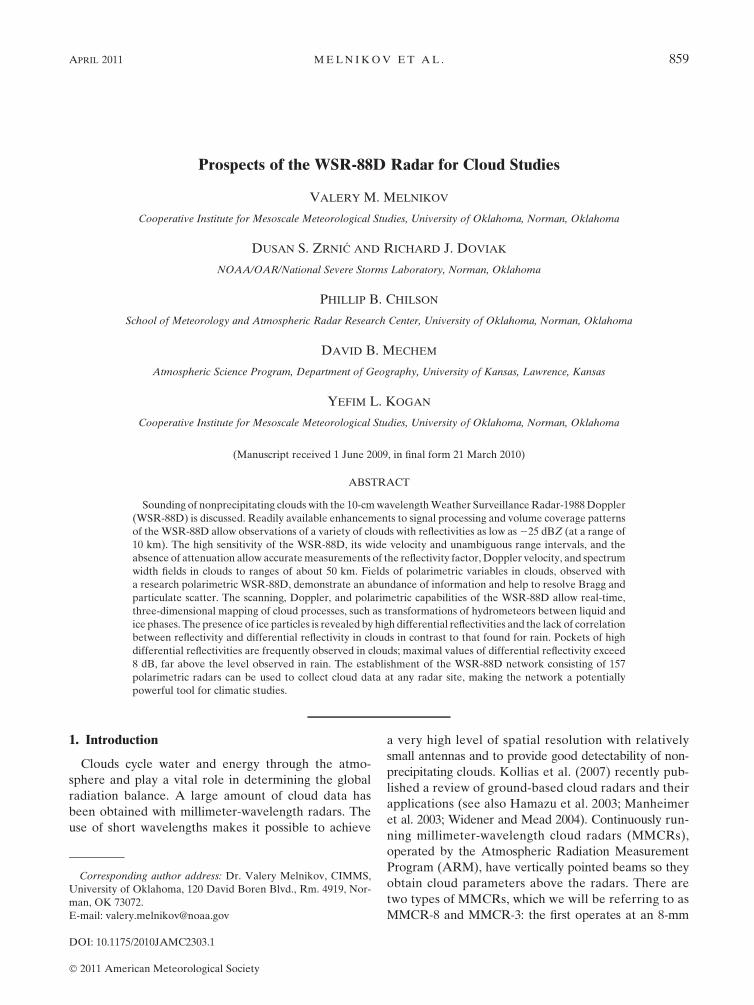
Figures 1 and 2 demonstrate the capability of the
KOUN radar to detect optically thin clouds. Sky pic-
tures to the west and east of KOUN are presented in
Figs. 1a and 1b, the composite reflectivity (i.e., maxi-
mal reflectivities for all elevations) from the NWS
WSR-88D 11 km northeast of KOUN near Oklahoma
City (KTLX) is shown in Fig. 1c, and a visible satellite
image over Oklahoma is presented in Fig. 1d. Cirrus
clouds in central Oklahoma are barely seen in Fig. 1d,
and it is impossible to discern the presence of cirrus
clouds in Fig. 1c.
TABLE 1. Parameters of radars selected for cloud measurement; GSM and CM stand for the general and stratus and cirrus modes of
operations, respectively.
ARM’s
MMCR-8
ARM’s
MMCR-3
NASA’s
CPR
NOAA’s WSR-88D
(short-pulse mode)
Wavelength (mm) 8.7 3 3 109
Pulse power (kW) 0.1 1.7 — 450
Pulse width (ms) 0.3/0.6 0.3 3.3 1.57
Antenna size (m) 3 0.6 1.95 8.54
Beamwidth (one-way
half-power width,8)
0.2 0.24 0.12 0.96
Radial resolution (m) 45/90 45 500 250
Two-way transversal
resolution (m)
10 at 10 km 17 at 10 km 1400 (cross track),
2500 (along track)
49 at 10 km
Z10 (dBZ) 230 (GSM) 226 226 221.5 (single polarization)
248 (CM) 218.5 (dual polarization)
225.5 (with enhanced
processing in dual-
polarization mode)
Scanning capability No No No Yes
Doppler capability Yes Yes No Yes
Unambiguous velocity
(m s21)/range of
measurements (km)
3.2/16 (GSM),
20.3/16 (CM)
7.9/15 — 27/150–35/117
Dual polarization Yes, for the
Southern Great
Plains site
Yes No Yes, for KOUN; yes, for
upgraded WSR-88Ds
Attenuation Strong Severe Severe Negligible
No. of systems 5 3 1 157
APRIL 2011 M E L N I K O V E T A L . 861
Page 4
At the same time, the KOUN data from vertical cross
sections at azimuth angles of 2708 and 908 are presented
in Figs. 2a and 2b. Cirrus clouds, at a height of about
8 km, are clearly detected to 50 km. The minimal re-
flectivity seen in the cirrus layer is 222.5 dBZ. Ground
clutter filter residuals contaminate data to 5 km, and
beyond that they are sporadic and do not pose significant
problems to cloud mapping. Comparing Figs. 1c and 2, it
is concluded that the signal processing and data collec-
tion procedures employed with the network WSR-88D
cannot consistently show, as does the KOUN, the
presence of nonprecipitating clouds.
There can be two sources of scattering of 10-cm-
wavelength radiation in clouds: 1) particulate scattering
and 2) Bragg scatter from turbulent fluctuations of hu-
mid air. The latter mechanism produces 0 differential
reflectivity, ZDR, expressed in decibels. In Fig. 2d, the
field of ZDR is shown. We can see that the values of ZDR
are positive and exceed 3 dB in the cirrus cloud bottom.
High ZDR values signify that at least a part of the re-
flected signal comes from cloud particles. Observations
of positive ZDR in cirrus clouds are a strong indication
that ice crystals are strong sources of radar echoes at
10-cm wavelengths. In contrast to the cirrus clouds, note
the convective plumes in Fig. 2b with strong reflec-
tivities (i.e., .25 dBZ) at their 1.5-km tops, and much
weaker reflectivities in their interior regions. The plume-
top differential reflectivities (Fig. 2d) are about 0 dBZ,
FIG. 1. The 23 Mar 2008 sky pictures from KOUN at 2021 UTC looking toward the (a) west and (b) east. (c) Composite reflectivity data
from a network WSR-88D at 2018 UTC. (d) Visible satellite image of OK at 2015 UTC.
862 J O U R N A L O F A P P L I E D M E T E O R O L O G Y A N D C L I M A T O L O G Y VOLUME 50
Page 5
suggesting Bragg scatter from these regions. Detection of
low-altitude clouds can be problematic in the sense of
distinguishing cloud echoes from Bragg scattering in the
boundary layer.
Figure 3a presents a reflectivity field with areas at the
limit of KOUN’s detectability. In the area shown with the
arrow, at ranges of about 10 km, Z goes from 223.8 to
224.3 dBZ. Because of insertion loss from polarimetric
hardware installed on research KOUN (flexible wave-
guides, additional length of the waveguides, insertion los-
ses of new elements, and two rotary joints), the radar is
1.3–1.5 dB worse in terms of sensitivity when compared
with the ‘‘legacy’’ WSR-88D. These losses will be elimi-
nated in the dual-polarization prototype radar.
To estimate the reduction of solar radiation on the
ground caused by the clouds in Figs. 1 and 2, we have
FIG. 2. Vertical cross sections of reflectivity factors observed by the KOUN radar at 2020 UTC 23 Mar 2008. SNR $ 27 dB for an
azimuth of (a) 2708 and (b) 908. (c) Rawinsonde soundings at 0000 UTC 24 Mar 2008 of temperature (T), wind velocity (W), and relative
humidity with respect to water (RHw) and ice (RHi) at Norman. The RHi is shown for subfreezing temperatures. (d) Differential re-
flectivity field at 908 azimuth.
APRIL 2011 M E L N I K O V E T A L . 863
Page 6
compared measured solar radiation with model results.
The Bird model (Bird and Hulstrom 1981) has been used
to estimate the solar flux on the ground in the absence of
clouds. The Oklahoma Mesonet site in Norman measures
solar radiation every 5 min. For the time represented in
Fig. 2, the measured and modeled solar radiation amounts
in the absence of clouds were 751 and 797 W m22, re-
spectively. That is, the radiation deficit due to clouds
was less than 6%. So we conclude that the WSR-88Ds
can observe radiatively significant clouds. But to ad-
dress radiation problems, it is necessary to deploy other
instruments near the WSR-88D or/and satellite infor-
mation should be used.
Miller et al. (1998) compared cloud detection using a
WSR-88D and The Pennsylvania State University’s (PSU)
3-mm-wavelength radar MMCR-3 located 18.5 km from
the State College, Pennsylvania, WSR-88D (KCCX); data
from the MMCR-3 were collected along a vertically di-
rected beam to be compared with the KCCX data at
various elevation angles along the same vertical. They
used the WSR-88D’s standard level II data collected with
VCPs 11, 21, 32 (all in precipitation mode), and 31 (in
clear-air mode). The level II data are an array of three
meteorological variables (i.e., reflectivity factor Z; Doppler
velocity y; and spectrum width sy) for SNR $ 2 dB or
higher depending on the threshold settings selected by
the radar operator. Miller et al. (1998), using KCCX data
for SNR $ 6 dB, reported that the coincident detection
of echoes with these radars depends on height and varies
from 30% to 60%. At some times, the radars showed
consistency in their detections, while at other times they
did not. The discrepancies were explained by the lower
sensitivity of the KCCX when this radar did not detect
echoes that were recognized by PSU’s MMCR-3, and by
the presence of insects aloft and/or the presence of Bragg
scatter to KCCX if it detected echoes that the PSU’s
MMCR-3 did not. On the other hand, we show that cloud
observations with the WSR-88D can be carried out for
SNR $ 27 dB, 13 dB lower than the level used in the
experiments of Miller et al. (1998); so the number of
cases lacking simultaneous detection could be reduced
significantly.
Two RHIs shown in Figs. 3b and 3c demonstrate dif-
ferences between Miller et al.’s (1998) and our experi-
ments. Figure 3b is for the data displayed at an SNR $
27 dB. Figure 3c was generated from the same data but
thresholded at SNR $ 2 dB, the same as that for most
networking WSR-88Ds, but still 4 dB lower than for
the data from the experiments of Miller et al. (1998).
Because of the higher SNR threshold and the use of
a maximal antenna elevation of 208, clouds would not be
observed if procedures standard to the NWS operations
were used. We conclude that the WSR-88D can observe
many more nonprecipitating clouds than are seen rou-
tinely, but the parameters of existing VCPs are not op-
timal for such observations.
3. Base radar data from nonprecipitating clouds
The reflectivity factor Z, the Doppler velocity y, and
the velocity spectrum width sy are the base radar vari-
ables measured with the WSR-88Ds. The goal of this
section is to demonstrate the capability of the WSR-88D
to measure and map over vast regions Z, y, and sy for
clouds, as well as to demonstrate the need for a large
unambiguous velocity for accurate measurements of y
and sy. Often, vertical cross sections reveal important
details of clouds, so herein we present vertical cross
sections of the base data. Because the spectrum width
cannot be accurately measured at SNR 5 27 dB, sy
fields are presented for an SNR $ 23 dB.
The detectability of clouds depends on its water–ice
content and range. Often clouds are detected to ranges
FIG. 3. (a) Vertical cross section of low reflecting clouds observed on 13 Nov 2008, and vertical cross section of reflectivity observed with
the KOUN radar at 908 azimuth at 2020 UTC 23 Mar 2008 for (b) SNR $ 27 and (c) SNR $ 2 dB.
864 J O U R N A L O F A P P L I E D M E T E O R O L O G Y A N D C L I M A T O L O G Y VOLUME 50
Page 7
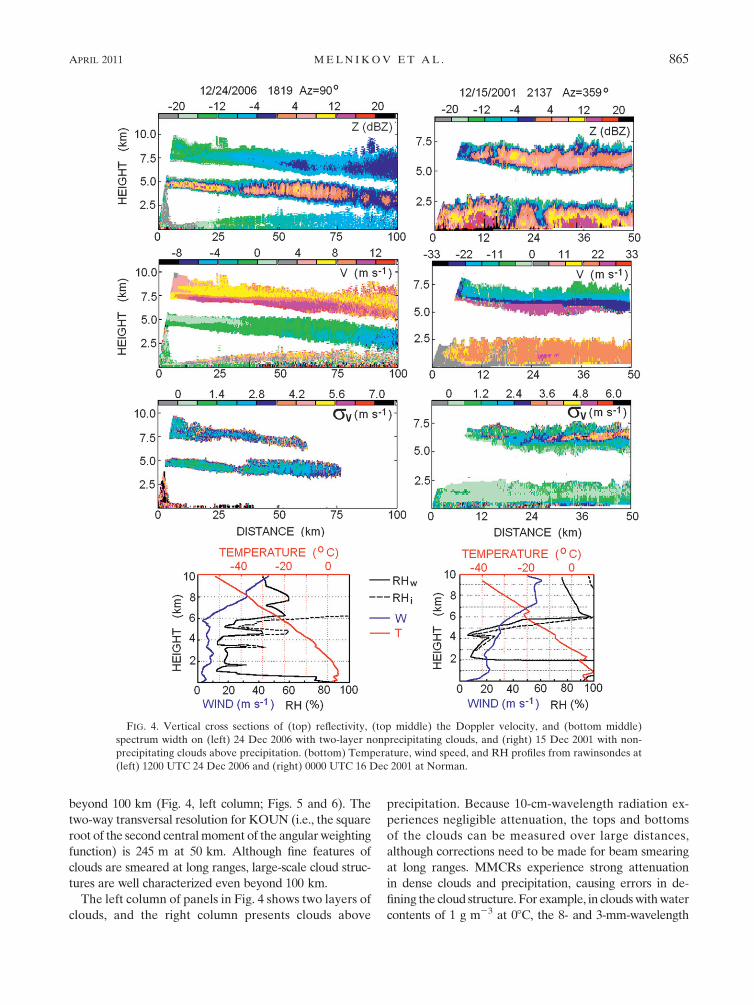
beyond 100 km (Fig. 4, left column; Figs. 5 and 6). The
two-way transversal resolution for KOUN (i.e., the square
root of the second central moment of the angular weighting
function) is 245 m at 50 km. Although fine features of
clouds are smeared at long ranges, large-scale cloud struc-
tures are well characterized even beyond 100 km.
The left column of panels in Fig. 4 shows two layers of
clouds, and the right column presents clouds above
precipitation. Because 10-cm-wavelength radiation ex-
periences negligible attenuation, the tops and bottoms
of the clouds can be measured over large distances,
although corrections need to be made for beam smearing
at long ranges. MMCRs experience strong attenuation
in dense clouds and precipitation, causing errors in de-
fining the cloud structure. For example, in clouds with water
contents of 1 g m23 at 08C, the 8- and 3-mm-wavelength
FIG. 4. Vertical cross sections of (top) reflectivity, (top middle) the Doppler velocity, and (bottom middle)
spectrum width on (left) 24 Dec 2006 with two-layer nonprecipitating clouds, and (right) 15 Dec 2001 with non-
precipitating clouds above precipitation. (bottom) Temperature, wind speed, and RH profiles from rawinsondes at
(left) 1200 UTC 24 Dec 2006 and (right) 0000 UTC 16 Dec 2001 at Norman.
APRIL 2011 M E L N I K O V E T A L . 865
Page 8
radiation will be attenuated by 1 and 4.8 dB km21
(Meneghini and Kozu 1990, p. 152). Consider the data
presented in the right column of Fig. 4 for clouds above
snow falling at a rate of about 1 mm h21. Using Eq. (6.23)
of Battan (1973) for 8-mm wavelength, we obtain one-
way attenuation of 0.09 dB km21. At high elevation
angles where the one-way path in snow is about 2 km,
the total reflectivity bias of the clouds would be 0.36 dB
and for a slant path of 5 km it would be 0.9 dB. But at
the 3-mm wavelength, these biases would be 16 and
43 dB, considerably reducing the MMCR capability to
make continuous and accurate measurements. Millimeter-
wavelength radiation experiences even stronger attenu-
ation rates in melting layers (e.g., Fig. 6h at the height
of 2.7 km and Fig. 6n at 2.5 km). Thus, the WSR-88D
could provide complementary information on the vertical
structure of clouds and precipitation to improve the in-
formation extracted from satellite observations (e.g.,
Stephens and Kummerow 2007). Cloud radars are not
expected to perform well in precipitation, so observa-
tions at 10-cm wavelengths are especially advanta-
geous for studies of water accumulation in clouds and
the transition to rain (e.g., thin rain shafts in Fig. 6j).
Because useful polarimetric data on cloud particles
require slant soundings, and because slant soundings
result in broader spectra due to the vertical shear of the
horizontal wind, a large unambiguous velocity is required
to accurately measure the Doppler velocity and spectrum
width sy. One can see velocity aliasing in Fig. 4 (right, V
panel) and Fig. 5 (left, V panel). At 8-mm wavelength
and with a pulse repetition frequency of 3000 Hz (an
unambiguous range of 50 km), the velocity would be
FIG. 5. As in Fig. 4, but for (left) 19 Dec 2006 and (right) 27 Nov 2008. (bottom) Data obtained at (left) 1200 UTC
19 Dec 2006 and (right) 0000 UTC 28 Nov 2008.
866 J O U R N A L O F A P P L I E D M E T E O R O L O G Y A N D C L I M A T O L O G Y VOLUME 50
Page 9
aliased four times, making it difficult to interpret. A
higher repetition frequency would provide a larger
Nyquist interval but would shorten the unambiguous
range, making it even more difficult to unravel the range
aliasing.
Spectrum width is related to turbulence, which is
generally thought to influence the drop growth by
stochastic coalescence (e.g., Jonas 1996; Shaw 2003).
Waves in clouds (seen in spectrum width fields in the
right sy panels of Figs. 4 and 5) are also significant fea-
tures controlling cloud properties. To accurately measure
sy, the unambiguous velocity must be at least 1.7 sy
(Melnikov and Zrnic 2004). For example, the maximal
measured sy in the cloud shown in the left sy panel of
FIG. 6. Vertical cross sections of polarimetric fields. (right) Rawinsonde profiles of temperature (T), wind velocity (W), and relative
humidity (RHw and RHi) at Norman, obtained for the closest time to radar observations: (top to bottom) 0000 UTC 7 Jan 2007, 0000 UTC
28 Nov 2008, 1200 UTC 2 Mar 2006, 0000 UTC 17 Jun 2007, and 0000 UTC 24 Jan 2009.
APRIL 2011 M E L N I K O V E T A L . 867
Page 10
Fig. 5 is 10 m s21; thus, the unambiguous velocity should
be larger than 17 m s21. But wind shear, not turbulence,
can be the dominant contributor to sy, and the narrower
beams of the MMCRs can significantly reduce the shear
contributions. To separate turbulence and shear contri-
butions, a technique used by Melnikov and Doviak
(2009), or that used by Hocking (2003), can be employed.
Vertical velocities in clouds are important. The WSR-
88D is not capable of sounding vertically. To estimate
the vertical velocities, the vertical azimuth display
(VAD) technique could be used at high elevations (e.g.,
Doviak and Zrnic 2006, section 9.3.3). Stretching and
shearing of the wind can also be obtained from the VAD
data. Applications of these techniques to cloud sounding
are beyond the scope of this paper. The scanning and
Doppler capabilities of the WSR-88Ds allow us to de-
termine the advection of hydrometeors, which is one of
the important parameters in global cloud models. This
capability could be advantageous for atmospheric radi-
ation problems as well.
The WSR-88D network works around the clock. The
mission of the network is precipitation measurements
and severe weather monitoring. To not compromise that
mission, cloud observations could be conducted at times
without precipitation. Cloud observations can be per-
formed with a set of vertical cross sections (i.e., RHIs).
The number of RHIs that can be used to create a ‘‘cloud’’
VCP depends on the allowed time. In 5 min, 12 RHIs can
be completed using the enhanced data acquisition and
processing mode described in section 2.
4. Polarimetric radar observations of clouds
The NWS is planning to upgrade the WSR-88D network
with polarimetric capabilities in the near future. The first
prototype of the polarimetric WSR-88D is scheduled for
deployment in 2011. The proof-of-concept WSR-88D
KOUN employs a polarimetric mode with simultaneous
transmission and reception of horizontally (H) and verti-
cally (V) polarized waves (Zrnic et al. 2006). Polarimetric
radar can measure more meteorological variables that can
aid in retrieving cloud properties.
Simultaneously with the base radar variables, KOUN
routinely measures the following polarimetric variables:
1) differential reflectivity ZDR, 2) total differential phase
fDP, and 3) the copolar correlation coefficient rhy (e.g.,
Doviak and Zrnic 2006, section 6.8). KOUN also has the
capability of switching from transmitting H only to also
measuring the cross-polar coefficients. Signals from
clouds are often weak, and thus the influence of noise on
polarimetric variables can be strong. To mitigate the
noise impacts at low SNR, the covariance estimators of
polarimetric variables are used in the KOUN (Melnikov
and Zrnic 2007). The polarimetric radar variables are
measured during the same dwell time as that for the base
radar variables.
Observations of nonprecipitating clouds with KOUN
show a tremendous amount of information in the fields
of polarimetric variables. In this paper, we do not an-
alyze the polarimetric fields in detail but rather show
their main features to suggest the wealth of information
that could be derived from these variables. There is
no correlation between reflectivity and differential
reflectivity in clouds (see, e.g., Figs. 6g and 6h, 6j and
6k, and 6m and 6n) in contrast to rain wherein Z and
ZDR are positively correlated (e.g., Doviak and Zrnic
2006, section 8.5.3). The correlation for rain occurs
because more intense rain typically has larger drops
that are oblate and thus correspondingly larger ZDR.
Figure 7a presents a scatterplot of Z and ZDR in clouds
shown in Figs. 6g and 6h wherein the lack of correlation
between the variables for clouds is apparent. In Fig. 7b,
a scatterplot of ZDR and rhy also shows weak negative
correlation, and rhy as low as 0.9, which is again in
contrast to rain wherein rhy is typically larger than 0.98.
The lack of correlation between Z, ZDR, and rhy in
clouds is due to the presence of ice particles, which can
have random orientation. Furthermore, ZDR could
decrease with increasing Z due to the aggregation of ice
particles; that is, the aggregates are more spherical (i.e.,
have lower ZDR but larger Z) than the particles they
consist of.
In some clouds, fields of differential reflectivity are
uniform with values lower than 1 dB; the ZDR field in
Fig. 2d is nearly uniform but has values substantially
exceeding 1 dB, which suggests scatter from ice particles.
Often, ZDR exhibits a wide range of values (i.e., 0–8 dB;
e.g., the maximal ZDR in Fig. 6a is 8.3 dB), and exhibits
patterns with ‘‘pockets’’ of high and low ZDR, as in Figs. 6a,
6d, 6h, and 6k), suggesting differing processes of formation
and evolution of hydrometeors. The observed positive ZDR
in clouds also indicates that particles make a strong con-
tribution to echoes although a contribution from Bragg
scatter could exist.
Observations from KOUN show high temporal vari-
ability of the polarimetric fields. Rapid changes in the
polarimetric variables could be linked to crucial micro-
physical processes. Thus, having a rapid-scan polarimetric
Doppler radar could prove valuable for microphysical
analyses. Polarimetric radar at 10-cm wavelengths can be
a powerful tool to complement MMCR radar studies of
clouds with mixed phases, which are challenges for re-
mote sensors (e.g., Shupe et al. 2008).
Polarimetric information is successfully used in clas-
sifying various types of scatterers in the atmosphere. For
example, the polarimetric variables ZDR and rhy can be
868 J O U R N A L O F A P P L I E D M E T E O R O L O G Y A N D C L I M A T O L O G Y VOLUME 50
Page 11
used to distinguish hydrometeor and biological scat-
terers (e.g., insects and birds; Zrnic and Ryzhkov 1999).
Measurement of ZDR and rhy is most suitable for slant
soundings of the atmosphere because polarimetric mea-
surements lose much of their value for vertical soundings.
Furthermore, it is important to have low attenuation
of radiation, as it is for 10-cm wavelengths, to be sure
that differential attenuation does not modify ZDR. Thus,
the WSR-88D is well suited for polarimetric observa-
tions in clouds and should complement measurements
with MMCRs.
5. Resolving scatter mechanisms in clouds
Many visual cloud images from the ground and sat-
ellites exhibit good correspondence with radar-derived
images. But these observations do not prove that echoes
come exclusively from cloud particles. Knight and Miller
(1993, 1998) studied dual-wavelength (i.e., 10 and 3 cm)
reflectivity data from the early stages of convective
clouds, and deduced that there are at least two sources of
backscatter signals: Rayleigh scatter from cloud droplets
and coherent or Bragg scatter from refractive index
variations (see also Gossard 1979). They found that
Bragg scatter from developing cumulus clouds can
dominate Rayleigh scatter at 10-cm wavelengths. Re-
solving Bragg and particulate scatter in precipitation
was considered by Gage et al. (1999). The purpose of
this section is to show how polarimetric radar can be
helpful in resolving these two types of scattering mech-
anisms.
To differentiate classical Bragg scatter associated with
a fixed arrangement of scatters from the Bragg scatter
associated with random changes in density perturba-
tions, Bragg scatter from refractive index perturbations
has been defined as stochastic Bragg scatter (Doviak
1999) or as stochastically coherent scatter (Zhang et al.
1990; Erkelens et al. 2001). Comparing radar returns at
10- and 0.9-cm wavelengths, Kropfli and Kelly (1996) also
suggested that fluctuations of refractivity caused by de-
veloping cumulus clouds can contribute significantly to
backscatter at 10-cm wavelengths. Whereas these studies
showed significant Bragg scatter from cumulus clouds
at 10-cm wavelength, Gossard and Strauch (1981), using
3-cm-wavelength radar, found no evidence of Bragg scat-
ter from stratiform clouds.
The Bragg scatter from air and its corresponding re-
flectivity ha is (e.g., Ottersten 1969; Doviak and Zrnic
2006, section 11.4.3.1)
ha
50.38C2
n
l1/3, (1)
where l is the radar’s wavelength and Cn2 is the atmo-
sphere’s refractive index structure parameter. The re-
ceived voltage V associated with backscatter from cloud
particles is proportional to V 5 �nan exp(2jkrn), where
k 5 2p/l is the propagation wavenumber; an is the con-
tribution from, and rn the range to, the nth particle; and
the summation includes all particles having significant
return. The ensemble average power is [Doviak and Zrnic
2006, Eq. (4.2); Siegert and Goldstein 1951]
FIG. 7. Scatterplots of measured Z, ZDR, and rhy for clouds shown in Figs. 6g and 6h. The red line in (b) is the median
obtained from the radar data.
APRIL 2011 M E L N I K O V E T A L . 869
Page 12
P 5 E[jVj2]
5 E �nja
nj2
� �1 E �
n 6¼ma
na
m* exp[2jk(r
n� r
m)]
" #
5A
r2(h
pi1 h
pc), (2)
where E[x] represents an ensemble or time average, A is
a radar constant, the asterisk denotes a complex conju-
gate, r is the range to the scattering volume, and the total
reflectivity (i.e., the scatter cross section per unit volume),
hp [ hpi 1 hpc, is composed of reflectivities hpi and hpc due
to incoherent and coherent scatter from particles (i.e., hy-
drometeors). If the scatterer’s locations are uncorrelated,
the ensemble average of the second summation is zero (i.e.,
hpc 5 0), and there remains only the commonly observed
incoherent hydrometeor backscatter.
But if there is spatial correlation of scatterer locations
(i.e., random density perturbations at two locations are
correlated), then the ensemble average of the second
term is not 0. If the density perturbations have strong
spatial variations at l/2 scales, there will be correspond-
ingly strong coherent scatter from the hydrometeor’s
density fluctuations; note in (2) that there are N2 terms
contributing to the coherent term compared to N terms
for incoherent scatter. Although reflectivity associated
with stochastic Bragg scatter can be large compared to
that associated with incoherent scatter, the evidence for
strong Bragg scatter from perturbations in hydrometeor
number density is spotty (e.g., Erkelens et al. 2001).
The incoherent component of reflectivity hh,ypi for
horizontally or vertically polarized waves is (Doviak and
Zrnic 2006, section 8.5.3.1)
hh,ypi 5
p5jKj2
l4Z
h,y, (3)
where K is the dielectric factor of the hydrometeor and
Zh,y are the reflectivity factors of the hydrometeors for
horizontal or vertical polarization. Erkelens et al. (2001)
and Gossard and Strauch (1983, section 2.5) hypothesized
that turbulence, mixing mean gradients of particulate
density Np, creates stochastic Bragg scatter reflectivity
expressed as
hpc 50.38C2
p
l1/3, (4)
where Cp2 is the structure parameter of the hydrometeor
density perturbations. Using simplifying assumptions (i.e.,
all particles are spherical and have the same diameter, the
inertial subrange of turbulence extends to scales at least as
small as l/2, and ignoring evaporation and condensation),
Erkelens et al. (2001) show that Cp2 5 3.39jKj2L0
22/3
b2E[Np2]D6, where L0 is the outer scale of turbulence, D is
the particles’ diameter, and b2 is a proportionality pa-
rameter relating the variance of hp to E[Np2]. Parameter Cp
2
can be expressed in terms of Z by noting that Z 5
E[Np]D6. Therefore, Cp2 5 3.39jKj2qZ, where q 5
L022/3b2E[Np
2]/E[Np] is a combined unknown.
The total reflectivity h is simply the sum of the re-
flectivities (i.e., hpi1ha1hpc) for each of the three scat-
tering mechanisms. That is,
h 5p5jKj2Z
l41
0.38C2n
l1/31
3.39jKj2qZ
l1/3. (5)
Because Bragg scatter from hydrometeors has the same
wavelength dependence as that from the refractive in-
dex, we can use data from radars operating at different
wavelengths (e.g., 3 and 10 cm) to calculate Z, the re-
flectivity factor associated with the hydrometeors.
Equation (5) also applies to nonspherical particles
such as ice crystals for which Zh 6¼ Zy. In this case there
are four unknowns: Zh, Zy, Cn2, and q. To solve for them,
we can apply polarimetric measurements at two wave-
lengths. Because Bragg scatter from refractive index
perturbations has no differential reflectivity, we deduce
hh
5p5jKj2Z
h
l41
0.38C2n
l1/31
3.39jKj2qZh
l1/3and (6a)
hy5
p5jKj2Zy
l41
0.38C2n
l1/31
3.39jKj2qZy
l1/3. (6b)
At centimeter wavelengths, cloud particles can be con-
sidered to be Rayleigh scatterers. Therefore, the mea-
sured reflectivity factors Zh and Zy are equal at different
wavelengths, l1 and l2 [e.g., Zh(l1) 5 Zh(l2)]. Mea-
surements at two wavelengths and two polarizations are
sufficient to calculate all four unknowns. But (6) as-
sumes that inertial subrange turbulence, responsible for
Bragg scatter, is present at both wavelengths.
The purpose of suggesting a dual-wavelength, dual-
polarization experiment is to establish whether Bragg
scatter from stratiform clouds is significant. Gossard and
Strauch (1981) found no evidence of Bragg scatter from
stratiform clouds at 3-cm wavelengths, but this has
not been established for 10-cm wavelengths. If Bragg
scatter from stratiform clouds is insignificant, then the
dual-polarization WSR-88D can provide reliable and
accurate data on cloud particles.
Polarimetric radar observations with KOUN show
that at the same height in a cloud, differential reflectivity
can vary by few decibels (Fig. 6). Hydrometeor scatter
must dominate in regions with high ZDR because scatter
870 J O U R N A L O F A P P L I E D M E T E O R O L O G Y A N D C L I M A T O L O G Y VOLUME 50
Page 13
from refractive index perturbations has ZDR 5 0 dB.
The observed positive ZDR in stratiform clouds strongly
suggests particles are one of the main sources of radar
echoes from such clouds.
6. Conclusions
Our observations with the KOUN WSR-88D using
enhanced signal processing show sufficient sensitivity of
the radar for measurements of various cloud parame-
ters. We have observed, in a dual-polarization mode,
reflectivities as low as 223 dBZ at 10-km ranges; the
total reflectivity span is about 58 dB in nonprecipitating
clouds. The ground-based cloud radars have 3–5 times
superior spatial resolution. Our cloud observations with
the KOUN radar show that within 50 km the spatial
resolution of KOUN is satisfactory to measure the
spatial structure of most clouds. Smearing of radar fields
is seen at longer ranges but the main features of radar
fields are still preserved. Observations with the KOUN
radar showed the great advantages of scanning radars—
‘‘instant’’ fields of cloud properties are obtained and pat-
terns of the time evolution of the fields are observed.
Wind and turbulence strongly affect microphysical
processes in clouds, so Doppler measurements are im-
portant. To measure wind shears and turbulence with
scanning radars (i.e., beams not vertically directed), a wide
unambiguous Doppler velocity interval is required. The
WSR-88D is well suited for Doppler measurements and
could supplement data collected with MMCRs.
Additional information on the microphysics of cloud
particles can be obtained with radar polarimetry, espe-
cially at elevation angles far from zenith. The planned
polarimetric upgrades to the WSR-88D will provide
the capability to measure reflectivity factors as low as
225.5 dBZ. Thus, the WSR-88D could be a valuable
supplement to cloud measurements with MMCRs. The
WSR-88D is well suited for polarimetric observations:
10-cm-wavelength radiation does not experience atten-
uation in clouds and light precipitation, so measured
parameters are not biased by attenuation. At millimeter
wavelengths, attenuation is an issue.
Polarimetric observations of nonprecipitating clouds
conducted with the KOUN WSR-88D show a tremendous
amount of information on polarimetric variables. In
clouds, the differential reflectivity ZDR spreads over
a wide interval from 0 to over 8 dB, which is much
wider than in rain. Because of the ice phase, there is no
clear Z–ZDR relation as there is for rain. In some
clouds, ZDR fields are uniform but more frequently
they exhibit patterns with ‘‘pockets’’ of high and low
ZDR; this likely points to intense processes of trans-
formation of hydrometeors.
Our observations of positive ZDR in stratiform clouds
suggest that particles are one of the main sources of
radar echoes at 10-cm wavelengths. It is suggested that
simultaneous observations with 3- and 10-cm polari-
metric radars would be capable of relating the measured
power to the reflectivity factor Z of cloud particles. Fur-
thermore, the addition of dual-wavelength observations
could quantify the relative importance of Bragg scatter
from the fluctuations in hydrometeor density and the
fluctuations in air density (i.e., in refractive index). Bragg
scatter from air could bias ZDR toward 0 dB. Thus, the
presence of cloud areas with large positive ZDR in clouds
points to the absence of significant Bragg scatter at least
in those areas.
Cloud data from WSR-88Ds can be used in studies of
the development and evolution of clouds and precip-
itation, cloud model parameterization, radiation transfer
in cloudy atmospheres, and as an instrument in climatic
cloud studies. The radar is not capable of sampling all of
the radar-radiatively significant clouds but it is possible
to collect radar data from cirrus clouds that reduce the
solar flux reduction on the ground by up to 6%. The
radar is also capable of estimating the advection of hy-
drometeors, which is an important parameter in radia-
tion transfer problems.
The NWS WSR-88Ds work around the clock. Because
many days in a year are cloudy without precipitation,
these WSR-88Ds can be used for cloud observations
without compromising their primary mission. Cloud ob-
servations with the WSR-88Ds can be implemented into
the existing radar network and could make the network
an instrument for climate studies.
Acknowledgments. Mr. M. Schmidt and Mr.
R. Wahkinney maintained the WSR-88D KOUN in impec-
cable condition. We thank Dr. G. Zhang and our anony-
mous reviewers for their critical review and suggestions
that helped us to improve the manuscript. We also thank
Dr. C. A. Fiebrich and Ms. A. G. McCombs for their as-
sistance with data from the Oklahoma Mesonet. Funding
for this study was provided by the NOAA/Office of Oce-
anic and Atmospheric Research under NOAA–University
of Oklahoma Cooperative Agreement NA17RJ1227 (U.S.
Department of Commerce).
REFERENCES
Battan, L. J., 1973: Radar Observation of the Atmosphere. Uni-
versity of Chicago, 324 pp.
Bird, R. E., and R. L. Hulstrom, 1981: A simplified clear sky model
for direct and diffuse insolation on horizontal surfaces. Solar
Energy Research Institute Tech Rep. SERI/TR-642-761, 39 pp.
Clothiaux, E. E., M. A. Miller, B. A. Albrecht, T. P. Ackerman,
J. Verlinde, D. M. Babb, R. M. Peters, and W. J. Syrett, 1995:
APRIL 2011 M E L N I K O V E T A L . 871
Page 14
An evaluation of a 94-GHz radar for remote sensing of cloud
properties. J. Atmos. Oceanic Technol., 12, 201–229.
Doviak, R. J., 1999: Scattering from refractive index perturbations in
turbulent flow. [Published lecture available from the National
MST Radar Facility, Gandanki-517 122, Tirupati, India.]
——, and D. S. Zrnic, 2006: Doppler Radar and Weather Obser-
vations. 2nd ed. Dover, 562 pp.
Erkelens, J. S., V. K. C. Venema, H. W. J. Russchenberg, and
L. P. Ligthart, 2001: Coherent scattering of microwaves by
particles: Evidence from clouds and smoke. J. Atmos. Sci., 58,
1091–1102.
Gage, K. S., C. R. Williams, W. L. Ecklund, and P. E. Johnston, 1999:
Use of two profilers during MCTEX for unambiguous identifi-
cation of Bragg scattering and Rayleigh scattering. J. Atmos.
Sci., 56, 3679–3691.
Gossard, E. E., 1979: A fresh look at the radar reflectivity of clouds.
Radio Sci., 14, 1089–1097.
——, and R. G. Strauch, 1981: The refractive index spectra within
clouds from forward-scatter radar observations. J. Appl. Meteor.,
20, 170–183.
——, and ——, 1983: Radar Observations of Clear Air and Clouds.
Elsevier, 280 pp.
Hamazu, K., H. Hashiguchi, T. Wakayama, T. Matsuda, R. J. Doviak,
and S. Fukao, 2003: A 35-GHz scanning Doppler radar for fog
observations. J. Atmos. Oceanic Technol., 20, 972–986.
Hocking, W. K., 2003: Fast and accurate calculation of spectral
beam-broadening for turbulence studies. Proc. 10th Int.
Workshop on Technical and Scientific Aspects of MST Radar,
Piura, Peru, International Union of Radio Science, 214–217.
Jonas, P. R., 1996: Turbulence and cloud microphysics. Atmos.
Res., 40, 283–306.
Knight, C. A., and L. J. Miller, 1993: First radar echoes from cu-
mulus clouds. Bull. Amer. Meteor. Soc., 74, 179–188.
——, and ——, 1998: Early radar echoes from small, warm cu-
mulus: Bragg and hydrometeor scattering. J. Atmos. Sci., 55,
2974–2992.
Kollias, P., B. A. Albrecht, R. Lhermitte, and A. Savtchenko, 2001:
Radar observations of updrafts, downdrafts, and turbulence in
fair-weather cumuli. J. Atmos. Sci., 58, 1750–1766.
——, E. E. Clothiaux, M. A. Miller, B. A. Albrecht, G. L. Stephens,
and T. P. Ackerman, 2007: Millimeter-wavelength radars:
New frontier in atmospheric cloud and precipitation research.
Bull. Amer. Meteor. Soc., 88, 1608–1624.
Kropfli, R. A., and R. D. Kelly, 1996: Meteorological research ap-
plications of mm-wave radar. Meteor. Atmos. Phys., 59, 105–121.
Manheimer, W. M., and Coauthors, 2003: Initial cloud images with
the NRL high power 94 GHz WARLOC radar. Geophys. Res.
Lett., 30, 1103, doi:10.1029/2002GL016507.
Matrosov, S. Y., T. Uttal, J. B. Snider, and R. A. Kropfli, 1992:
Estimates of ice cloud parameters from ground-based infrared
radiometer and radar measurements. J. Geophys. Res., 97,
11 567–11 574.
——, A. Korolev, and A. J. Heymsfield, 2002: Profiling ice mass
and characteristic particle size from Doppler radar measure-
ments. J. Atmos. Oceanic Technol., 19, 1003–1018.
Melnikov, V., and D. S. Zrnic, 2004: Estimates of large spectrum widths
from autocovariances. J. Atmos. Oceanic Technol., 21, 969–974.
——, and ——, 2007: Autocorrelation and cross-correlation esti-
mators of polarimetric variables. J. Atmos. Oceanic Technol.,
24, 1337–1350.
——, and R. J. Doviak, 2009: Turbulence and wind shear in layers
of large Doppler spectrum width in stratiform precipitation.
J. Atmos. Oceanic Technol., 26, 430–443.
Meneghini, R., and T. Kozu, 1990: Spaceborne Weather Radar.
Artech House, 199 pp.
Miller, M. A., J. Verlinde, G. V. Gilbert, G. J. Lehenbauer,
J. S. Tongue, and E. E. Clothiaux, 1998: Detection of non-
precipitating clouds with the WSR-88D: A theoretical and
experimental survey of capabilities and limitations. Wea.
Forecasting, 13, 1046–1062.
Moran, K. P., B. E. Martner, M. J. Post, R. A. Kropfli, D. C. Welsh,
and K. B. Widener, 1998: An unattended cloud profiling radar
for use in climate research. Bull. Amer. Meteor. Soc., 79, 443–455.
Ottersten, H., 1969: Atmospheric structure and radar backscat-
tering in clear air. Radio Sci., 4, 1179–1193.
Reinking, R. F., S. Y. Matrosov, R. A. Kropfli, and B. W. Bartram,
2002: Evaluation of a 458 slant quasi-linear radar polarization
state for distinguishing drizzle droplets, pristine ice crystals, and
less regular ice particles. J. Atmos. Oceanic Technol., 19, 296–321.
Shaw, R. A., 2003: Particle–turbulence interactions in atmospheric
clouds. Annu. Rev. Fluid Mech., 35, 183–227.
Shupe, M. D., and Coauthors, 2008: A focus on mixed-phase
clouds. Bull. Amer. Meteor. Soc., 89, 1549–1562.
Siegert, A. F. G., and H. Goldstein, 1951: Coherent and incoherent
scattering from assemblies of scatterers. Propagation of Short
Radio Waves, D. E. Kerr, Ed., McGraw-Hill, 699–706.
Stephens, G. L., and C. D. Kummerow, 2007: The remote sensing
of clouds and precipitation from space: A review. J. Atmos.
Sci., 64, 3742–3765.
——, and Coauthors, 2002: The CloudSat mission and the A-Train.
Bull. Amer. Meteor. Soc., 83, 1771–1790.
Widener, K. B., and J. B. Mead, 2004: W-band ARM cloud radar—
Specifications and design. Proc. 14th ARM Science Team
Meeting, Albuquerque, NM, Department of Energy/Office
of Science. [Available online at http://www.arm.gov/publications/
proceedings/conf14/.]
Zhang, G., J. Hou, S. Ito, and T. Oguchi, 1990: Optical wave
propagation in random medium composed of both turbulence
and particles. J. Commun. Res. Lab., 37 (151/152), 43–62.
Zrnic, D. S., and A. V. Ryzhkov, 1999: Polarimetry for weather
surveillance radars. Bull. Amer. Meteor. Soc., 80, 389–406.
——, V. M. Melnikov, and J. K. Carter, 2006: Calibrating differ-
ential reflectivity on the WSR-88D. J. Atmos. Oceanic Tech-
nol., 23, 944–951.
872 J O U R N A L O F A P P L I E D M E T E O R O L O G Y A N D C L I M A T O L O G Y VOLUME 50