Proteaceae from severely phosphorus-impoverished soils extensively replace phospholipids with galactolipids and sulfolipids during leaf development to achieve a high photosynthetic phosphorus-use-efficiency Hans Lambers 1 , Gregory R. Cawthray 1 , Patrick Giavalisco 2 , John Kuo 3 , Etienne Laliberte ´ 1 , Stuart J. Pearse 1 , Wolf-Ru ¨ diger Scheible 2,4 , Mark Stitt 2 , Franc ¸ois Teste 1 and Benjamin L. Turner 1,5 1 School of Plant Biology, The University of Western Australia, 35 Stirling Highway, Crawley, Western Australia, 6009, Australia; 2 Max Planck Institute of Molecular Plant Physiology, Am Mu ¨hlenberg 1, D-14476, Potsdam-Golm, Germany; 3 Centre for Microscopy and Microanalysis, The University of Western Australia, 35 Stirling Highway, Crawley, Western Australia, 6009, Australia; 4 Plant Biology Division, The Samuel Roberts Noble Foundation, Ardmore, OK, 73401, USA; 5 Smithsonian Tropical Research Institute, Apartado 0843-03092, Balboa, Anco ´n, Republic of Panama Author for correspondence: Hans Lambers Tel: +61 8 64887381 Email: [email protected]Received: 3 June 2012 Accepted: 20 July 2012 New Phytologist (2012) 196: 1098–1108 doi: 10.1111/j.1469-8137.2012.04285.x Key words: Banksia, galactolipids, Hakea, phospholipids, photosynthetic phosphorus- use-efficiency (PPUE), sulfolipids. Summary Proteaceae species in south-western Australia occur on severely phosphorus (P)-impoverished soils. They have very low leaf P concentrations, but relatively fast rates of photosynthesis, thus exhibiting extremely high photosynthetic phosphorus-use-efficiency (PPUE). Although the mechanisms underpinning their high PPUE remain unknown, one possibility is that these species may be able to replace phospholipids with nonphospholipids during leaf development, without compromising photosynthesis. For six Proteaceae species, we measured soil and leaf P concentrations and rates of photosynthesis of both young expanding and mature leaves. We also assessed the investment in galactolipids, sulfolipids and phospholipids in young and mature leaves, and compared these results with those on Arabidopsis thaliana, grown under both P-sufficient and P-deficient conditions. In all Proteaceae species, phospholipid levels strongly decreased during leaf development, whereas those of galactolipids and sulfolipids strongly increased. Photosynthetic rates increased from young to mature leaves. This shows that these species extensively replace phospholipids with nonphospholipids during leaf development, without compromising photosynthesis. A considerably less pronounced shift was observed in A. thaliana. Our results clearly show that a low investment in phospholipids, relative to nonphospholipids, offers a partial explanation for a high photosynthetic rate per unit leaf P in Proteaceae adapted to P-impoverished soils. Introduction South-western Australia is an ancient region known for its severely nutrient-impoverished soils (McArthur, 1991; Lambers et al., 2012) and exceptionally high plant biodiversity (Hopper, 2009). Among the macronutrients, phosphorus (P) is the least available nutrientinthisregion,asaconsequenceofprolongedsoilweathering (Lambers et al., 2010; Laliberte ´ et al., 2012). Sulfur is one of the few macronutrients that is found at concentrations similar to that considered adequate for growth of crop plants in Banksia (Proteaceae) species in this region (Denton et al., 2007). On the most severely P-impoverished soils, nonmycorrhizal Proteaceae are an important component of the vegetation (Pate & Bell, 1999). Under low-P conditions, plant species in this family typically form cluster roots that effectively ‘mine’ P by releasing large amounts of low-molecular-weight carboxylates (Lambers et al., 2008). P-starved leaves tend to have low rates of photosynthesis per unit leaf area, at least in crop plants (Brooks et al., 1988; Rao & Terry, 1989; Fredeen et al., 1990). Leaves of Proteaceae species from south-western Australia, however, exhibit relatively fast rates of photosynthesis, despite having extremely low leaf P concentrations ([P]) (Denton et al., 2007). Consequently, some of these species exhibit a very high photosynthetic P-use-efficiency (PPUE) (Denton et al., 2007; Lambers et al., 2010). In view of dwindling phosphate rock reserves and increasing prices of P fertilizers (Gilbert, 2009), understanding the biochemical basis of this high PPUE would allow us to explore whether there are lessons for developing P-efficient crops (Lambers et al., 2011). 1098 New Phytologist (2012) 196: 1098–1108 Ó 2012 The Authors www.newphytologist.com New Phytologist Ó 2012 New Phytologist Trust Research
Transcript
Proteaceae from severely phosphorus-impoverished soilsextensively replace phospholipidswith galactolipids and sulfolipidsduring leaf development to achieve a high photosyntheticphosphorus-use-efficiency
Hans Lambers1, Gregory R. Cawthray1, Patrick Giavalisco2, John Kuo3, Etienne Laliberte1, Stuart J. Pearse1,
Wolf-Rudiger Scheible2,4, Mark Stitt2, Francois Teste1 and Benjamin L. Turner1,5
1School of Plant Biology, The University of Western Australia, 35 Stirling Highway, Crawley, Western Australia, 6009, Australia; 2Max Planck Institute of Molecular Plant Physiology, Am
Muhlenberg 1, D-14476, Potsdam-Golm, Germany; 3Centre for Microscopy and Microanalysis, The University of Western Australia, 35 Stirling Highway, Crawley, Western Australia, 6009,
Australia; 4Plant Biology Division, The Samuel Roberts Noble Foundation, Ardmore, OK, 73401, USA; 5Smithsonian Tropical Research Institute, Apartado 0843-03092, Balboa, Ancon, Republic
� Proteaceae species in south-westernAustralia occuron severelyphosphorus (P)-impoverished
soils. They have very low leaf P concentrations, but relatively fast rates of photosynthesis, thus
exhibiting extremely high photosynthetic phosphorus-use-efficiency (PPUE). Although the
mechanisms underpinning their high PPUE remain unknown, one possibility is that these species
may be able to replace phospholipids with nonphospholipids during leaf development, without
compromising photosynthesis.� For six Proteaceae species, we measured soil and leaf P concentrations and rates of
photosynthesis of both young expanding andmature leaves.Wealso assessed the investment in
galactolipids, sulfolipids and phospholipids in young and mature leaves, and compared these
results with those on Arabidopsis thaliana, grown under both P-sufficient and P-deficient
conditions.� In all Proteaceae species, phospholipid levels strongly decreased during leaf development,
whereas those of galactolipids and sulfolipids strongly increased. Photosynthetic rates increased
from young to mature leaves. This shows that these species extensively replace phospholipids
with nonphospholipids during leaf development, without compromising photosynthesis. A
considerably less pronounced shift was observed in A. thaliana.� Our results clearly show that a low investment in phospholipids, relative to nonphospholipids,
offers a partial explanation for a high photosynthetic rate per unit leaf P in Proteaceae adapted to
P-impoverished soils.
Introduction
South-western Australia is an ancient region known for its severelynutrient-impoverished soils (McArthur, 1991; Lambers et al.,2012) and exceptionally high plant biodiversity (Hopper, 2009).Among the macronutrients, phosphorus (P) is the least availablenutrientinthis region,asaconsequenceofprolongedsoilweathering(Lambers et al., 2010;Laliberte et al., 2012). Sulfur is oneof the fewmacronutrients that is found at concentrations similar to thatconsidered adequate for growth of crop plants in Banksia(Proteaceae) species in this region (Denton et al., 2007). On themost severely P-impoverished soils, nonmycorrhizal Proteaceae arean important component of the vegetation (Pate & Bell, 1999).Under low-P conditions, plant species in this family typically form
cluster roots that effectively ‘mine’ P by releasing large amounts oflow-molecular-weight carboxylates (Lambers et al., 2008).
P-starved leaves tend to have low rates of photosynthesis per unitleaf area, at least in crop plants (Brooks et al., 1988; Rao & Terry,1989; Fredeen et al., 1990). Leaves of Proteaceae species fromsouth-western Australia, however, exhibit relatively fast rates ofphotosynthesis, despite having extremely low leaf P concentrations([P]) (Denton et al., 2007). Consequently, some of these speciesexhibit a very high photosynthetic P-use-efficiency (PPUE)(Denton et al., 2007; Lambers et al., 2010). In view of dwindlingphosphate rock reserves and increasing prices of P fertilizers(Gilbert, 2009), understanding the biochemical basis of this highPPUE would allow us to explore whether there are lessons fordeveloping P-efficient crops (Lambers et al., 2011).
1098 New Phytologist (2012) 196: 1098–1108 � 2012 The Authors
www.newphytologist.com New Phytologist� 2012 New Phytologist Trust
Research
In barley (Hordeum vulgare) grown in nutrient solution at agrowth-limiting P supply, themajor P fractions in leaves are nucleicacids (30%), free orthophosphate (26%), P-containingmetabolites(26%) and phospholipids (17%) (Chapin & Bieleski, 1982).Phospholipids are a component of the plasmalemma and oftonoplast, chloroplast, and mitochondrial membranes (Hartelet al., 2000; Andersson et al., 2003; Jouhet et al., 2004; Anderssonet al., 2005). Phospholipids also play a role in signalling duringplant development and in plant responses to stress (Cowan, 2006).Therefore, when considering changes in P distribution that couldaffect PPUE in mature leaves, changes in the concentrations oforthophosphate, P-containing metabolites and nucleic acids andmembrane lipid composition are the most likely candidates(Veneklaas et al., 2012).
There is good evidence that rapid rates of photosynthesis requirea fine balance between the concentrations of free phosphate andphosphorylated intermediates, and that photosynthesis is inhibitedwhen free phosphate is depleted (Heldt et al., 1977; Stitt &Quick,1989; see Stitt et al., 2010 for a recent review). The totalconcentration of P, adenine nucleotides and phosphorylatedintermediates is constrained by the amount of phosphate in thecytoplasm.While there is evidence that shortage of phosphate in thecytosol and chloroplast can lead to remobilization of phosphatefrom the vacuole (Sharkey et al., 1986; Mimura, 1995), little isknown about how this process is regulated. Eudicots tend toaccumulate orthophosphate in epidermal cells (Conn &Gilliham,2010); however,Hakea prostrataR. Br. (Proteaceae) accumulates Pin itsmesophyll cells (Shane et al., 2004). The accumulation of P inmesophyll cells may allow more efficient use of P for photosyn-thesis, which occurs in the mesophyll cells. Except for some studiesindicating that enzyme concentrations of UDP-glucose pyrophos-phorylase may increase in P-deficient plants (Ciereszko et al.,2001), little is known about how photosynthesis can be optimizedto maintain flux when the total amount of P available forintermediary metabolism is decreased.
In a recent paper (Lambers et al., 2011), we hypothesized that ahigh PPUE might be partly attributable to a replacement ofphospholipids by galactolipids or sulfolipids, which do not containP. Upon P starvation of Arabidopsis thaliana plants, the phospho-lipid fraction in leaves declines from 36 to 19% (Dormann &Benning, 2002) with a concomitant increase of galactolipids and
sulfolipids. In P-replete plants, the thylakoid and the innerenvelope membrane already contain quite high galactolipidconcentrations, but other cellular membranes contain mainlyphospholipids. During P-starvation, galactolipids are substitutedfor phospholipids in these extrachloroplastidic membranes (Hartelet al., 2000; Dormann, 2007). The replacement of phospholipidsby other lipids in several membranes in response to P starvation is adynamic and reversible process (Andersson et al., 2003; Cruz-Ramırez et al., 2006; Gaude et al., 2008) and is seen inmany plantspecies, including barley, oats (Avena sativa) and maize (Zea mays)(Tjellstrom et al., 2008). However, replacement of phospholipidsby other lipids, while preventing leaf death under severe Plimitation, might inexorably lead to a decline in the rate ofphotosynthesis (Brooks et al., 1988; Rao & Terry, 1989; Fredeenet al., 1990).
Here we test the hypothesis that mature leaves of Proteaceae thatoccur naturally on severely P-impoverished soils and exhibit a veryhigh PPUE (Denton et al., 2007) invest relatively little P inphospholipids and predominantly use galactolipids and sulfolipidsinstead. We chose to test this hypothesis in a location that is wellknown for its high plant biodiversity (particularly Proteaceae) andits ancient, nutrient-impoverished soils, Lesueur National Park insouth-western Australia (Hopper & Gioia, 2004) (Fig. 1). Wecompare the results on relative lipid composition in six Proteaceaespecies with those obtained on the model plant Arabidopsisthaliana, grown under both P-sufficient and P-starved conditions.This allows a comparison of the response of Proteaceae species fromseverely P-impoverished soils with that of a species commonlyfound in a relatively nutrient-rich habitat.
Materials and Methods
Site and species description
All sites were located in the Arrowsmith Region in LesueurNational Park (30°S, 115°E), north-east of Jurien Bay (220 kmnorth of Perth) in south-western Australia (Figs 1, 2). Geologicalformations within this region are of Early Jurassic (e.g. Cockle-shell Gully Formation) to Middle to Late Triassic (e.g. LesueurSandstone) age (Playford et al., 1976). Soils on the uplands inLesueur National Park are a complex mixture of siliceous sands,
Latit
ude
Latit
ude
Longitude Longitude
–24
–30.10
–30.15
–30.20
–30.25
115.10 115.15 115.20 115.25
–26
–28
–30
–32
–34
115 120
(a) (b)
Fig. 1 Location of (a) LesueurNational Park inWestern Australia and (b) the sites in LesueurNational Park where three Banksia and threeHakea species were sampled.
� 2012 The Authors New Phytologist (2012) 196: 1098–1108New Phytologist� 2012 New Phytologist Trust www.newphytologist.com
NewPhytologist Research 1099
lateritic gravels, yellow texture-contrast soils, yellow massiveearths and brown mottled cracking clays (Griffin & Burbidge,1990); all are strongly weathered and invariably low in major plantnutrients, particularly P (McArthur, 1991). Lesueur National Parkis well known for its high plant species diversity, particularlyProteaceae (Burbidge et al., 1990); < 27 000 ha contain > 820higher plant taxa (http://www.dec.wa.gov.au/).We collected leavesand soil in the pristine habitat of three Banksia and threeHakeaspecies. Three Banksia species were sampled in the LesueurDissectedUplands (30.1836°S; 115.1524°E): Banksia candolleanaMeisn., Banksia attenuata R.Br. and Banksia menziesii R.Br.(Figs. 1b, 2a). Two Hakea species were sampled in the BanovichUplands (30.1621°S; 115.1993°E):Hakea flabellifoliaMeisn. andHakea neurophylla Meisn. (Figs. 1b, 2). A third Hakea species,Hakea prostrata, was sampled in the Lesueur Dissected Uplands,close to Cockleshell Gully (30.13907°S; 115.1507°E; Fig. 1b). Allleaves had a healthy appearance and showed no visual signsof nutrient deficiency (such as leaf yellowing or anthocyaninaccumulation), despite the extremely low soil P availability.
Soil sampling and analyses
InNovember 2010, soil was sampled close to the studied plants, butoutside the main rooting zone, typically 1 m from the base of thestem. After digging a small 25-cm-deep pit, soil was sampled fromthe side of the pit, at three depths: 0–5, 5–10 and 10–15 cm. Thesamples were air-dried and then stored at 4°C in plastic bags, beforebeing sent to the Smithsonian Tropical Research Institute inPanama for chemical analyses.
Soil pH was determined in a 1 : 2 soil to solution ratio in bothwater and 10 mMCaCl2 using a glass electrode (Hendershot et al.,2008). Total carbon (C) and nitrogen (N) were determined byautomated combustion and thermal conductivity detection on aThermoFlashEA112analyser (CEElantech,Lakewood,NJ,USA).
Total P was determined by ignition (550°C for 1 h) and acidextraction (1 M H2SO4 for 16 h), with detection by automatedmolybdate colourimetry on a Lachat Quickchem 8500 (Hach Ltd,Loveland, CO, USA). Readily exchangeable phosphate (resin P)was determined by extraction with anion-exchange membranes(Turner & Romero, 2009). It is assumed that this fraction is easilyavailable for most plants given that it is readily exchangeable; itincludes free phosphate in solution, phosphate sorbed to surfacesthat can exchange with anions on the resin, and some acid-labileorganic and condensed inorganic phosphates (Cheesman et al.,2010).
Leaf gas exchange
Gas exchange was measured on young, expanding leaves and onmature, fully expanded leaves, after which the leaves were quicklyfrozen in liquid N2 for subsequent analysis of phospholipidsand other lipids. We measured at least four intact, attached,young, expanding (current year) and mature (previous year)leaves of at least three replicate plants each, using an LI-6400portable gas-exchange system (Li-Cor, Lincoln, NE, USA) atambient pCO2 and temperature (400 lmol mol�1 and 25–30°C,respectively). Photosynthetically active radiation was set at1500 lmol quanta m�2 s�1 (LI-6400-02B red-blue light source;Li-Cor). Measurements were taken on two separate days inNovember and December 2010. All Banksia species and H.flabellifolia were measured in November only, whereas H.neurophylla was measured both in November and December. Nosignificant differences were found between the gas exchangemeasurements of the one species (H. neurophylla) that were takenon the separate days. Following the gas-exchange measurements,leaves were harvested to determine leaf area, then oven-dried fortotal leaf P analysis.
Leaf P analyses
The dry mass of leaves that were used for leaf gas-exchangemeasurements was determined after drying for 48 h at 70°C. Thematerial was then finely ground with a stainless steel ball mill andsubsamples were digested in concentratedHNO3 : HClO4 (3 : 1)which was then analysed for P using the malachite-green method(Motomizu et al., 1983).
Lipid analyses
Leaf material collected from the same plants as those used for gas-exchange measurements was snap-frozen in liquid N immediatelyafter field collection. Fresh weights were determined and thesamples were transferred on dry ice to the Max Planck Institute ofMolecular Plant Physiology (Potsdam, Germany). Approximately40 mg of fresh weight material (range 35.6–49.9 mg) was groundto a fine powder using a Mixer Mill (MM300; Retsch GmbH,Haan, Germany). The lipid extraction, UPLC-FT-MS (UltraPerformance Liquid Chromatography-Fourier Transform-MassSpectrometry) analysis and peak extraction were essentiallyperformed as previously described (Giavalisco et al., 2011;Hummel et al., 2011). The peak signal intensities of the annotated
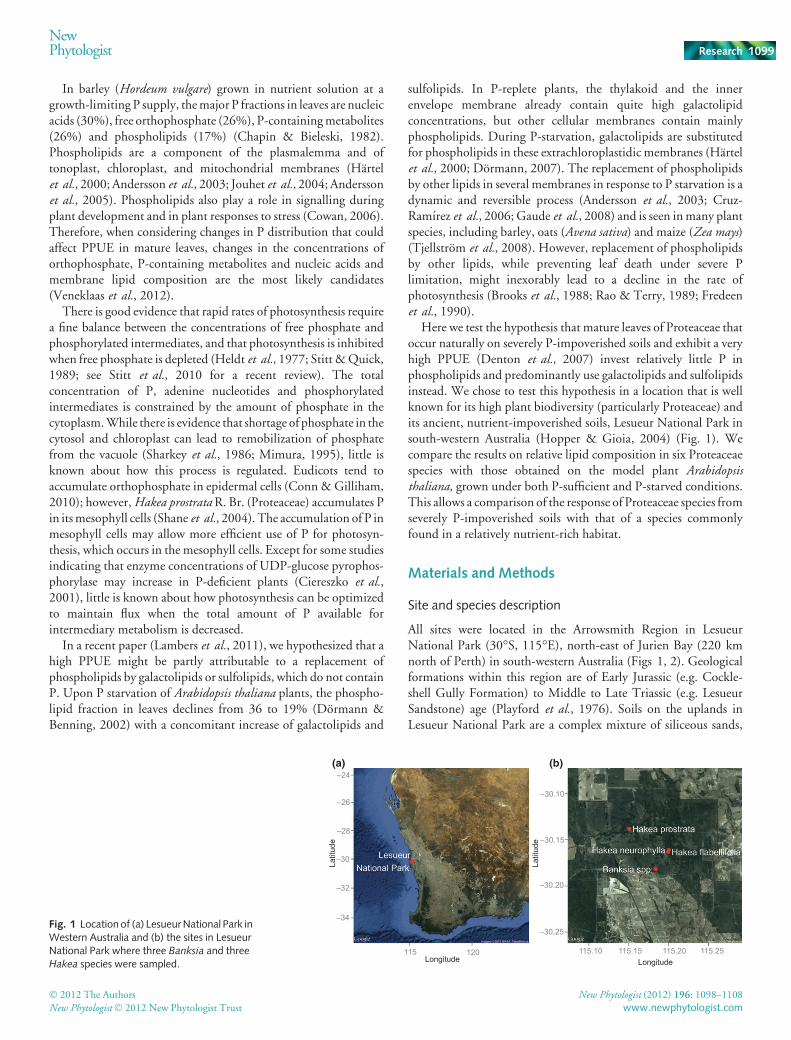
Fig. 2 Habitat of the investigatedBanksia andHakea species in Lesueur National Park, nearJurien Bay in Western Australia (Photos:Marion Cambridge).
New Phytologist (2012) 196: 1098–1108 � 2012 The Authors
www.newphytologist.com New Phytologist� 2012 New Phytologist Trust
Research
NewPhytologist1100
lipids were finally normalized against an internal standard as well asthe fresh weights of the individual samples, so that the arbitraryunits represent signal intensity per unit fresh weight and are a proxyfor lipid concentrations.
Growth of Arabidopsis thaliana
To compare the results for highly P-efficient Proteaceae with thosefor a model species, P-sufficient and P-starved Arabidopsis thaliana(L.) Heynh. plants for lipid analysis were grown at the Max PlanckInstitute ofMolecular Plant Physiology (Potsdam, Germany). Seedsof the Columbia (Col-0) accession were germinated and seedlingsgrown for 1 wk in a 16-h light (250 lmol photons m�2 s�1, 20°Cand 75% relative humidity (RH)) 8-h dark (6°C and 75% RH)regime in a standard peat-vermiculite-sand (6 : 3 : 1) substrate(Stender AG, Luckau, Germany). After another 1 wk in an 8-h light(160 lmol photons m�2 s�1, 20°C and 60% RH), 16-h dark(16°C and 75% RH) regime, individual plantlets were transferredto pots (6 cm diameter) filled with either standard substrate or aP-poor substrate (Kausek Gartenbau, Mittenwalde, FRG), andplaced for another 4 wk in a Percival AR-36L2 growth chamber(Percival-Scientific, Perry, IA, USA) set to the same environmentalconditions. The pots were irrigated twice a week with deionizedwater. All analysed leaf samples were harvested on the same day andwithin 1 h during themiddle of the light period, by snap-freezing inliquid N. Lipid analysis was performed as already described.
Electron and fluorescence microscopy
Fresh, healthy and intact mature (young) leaves, cut into 3–5-mm-long pieces with a double-edged razor blade, were fixed in2.5% (v/v) glutaraldehyde in phosphate-buffered saline (PBS)for 24 h. The fixed tissues were dehydrated in an ethanol series(70–95–100% dry ethanol), critical point-dried, mounted onSEM aluminium stubs, and coated with gold. Images were cap-tured with a Zeiss 1555 field-emission variable-pressure scanningelectron microscope (VP-FESEM; Carl Zeiss, Oberkochen,Germany) at 5 kV.
Leaf blades of B. menziesii and H. prostata were cross-sectionedwith a double-edged razor blade, critical-pointed dried, and coatedwith gold. Images were taken with a Zeiss 1555 VP-FESEM at5 Kv. The hand sections of freshly collected leaf blades werephotographed under an excitation filter (G365) and an emissionfilter (LP 420) inserted into a beamof incident light from amercuryvapour lamp with a Zeiss Axioplan Microscope equipped with aZeiss Axiocam digital camera.
Statistical analysis
Differences in leaf [P] and photosynthetic rates between leafdevelopment stages and plant species were tested using linearmixed-effect models (Pinheiro & Bates, 2000), with randomintercepts per individual plant (because more than one leaf wassampled from the same plant). The significance of differences intotal signal intensities of phospholipids, galactolipids and sulfoli-pids between young and mature leaves was assessed using linear
mixed-effect models, with random intercepts per plant species. Inall cases, residuals were visually inspected for heteroscedasticity anddifferent variance structures were specified if they significantlyimproved the models, as evaluated via likelihood ratio tests(Pinheiro & Bates, 2000). Analyses were conducted in the REnvironment, using the ‘nlme’ package (Pinheiro & Bates, 2000).
Results
Soil analyses
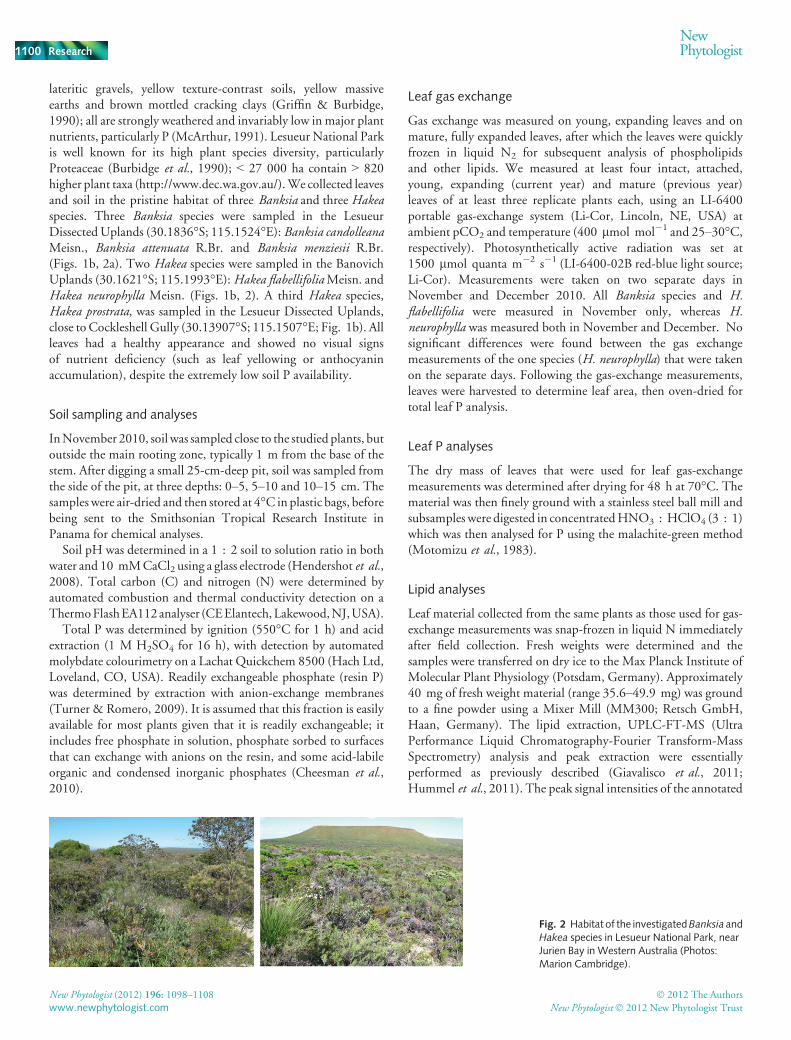
As expected, concentrations of ‘available’ and total P in soilcollected next to sampled plants were extremely low (Fig. 3).Resin-P valueswere <1 mg P kg�1 dry soil in the top 0–5 cmandfurther down the profile, with the exception of the top 0–5 cm atthe site of H. prostrata which showed slightly higher values(1.7 mg P kg�1 dry soil) (Fig. 3a). Hakea neurophylla grows on arocky substrate, exploiting cracks, and hence the collection of soil atdepth was not always feasible.
Resin-P concentrations in soil collected from the Peron Slopesand Spearwood dunes (>120 000 yr old) (McArthur & Bettenay,1974), where some of the sampled species occur, were similar tothose shown in Fig. 3(a). For comparison, resin-P concentrations
Resin P
Total P
Hakea prostrata
Hakea neurophylla
Hakea flabellifolia
Banksia spp.
Hakea prostrata
Hakea neurophylla
Hakea flabellifolia
Banksia spp.
0.0 0.5 1.0 1.5 2.0
0 5 10 15 20 25 30P concentration (mg kg−1)
Fig. 3 Soil resinphosphorus (P)and totalP fromthreedepths (0–5 cm(blue),5–10 cm (green) and 10–20 cm (red)) at the sampling sites (Fig. 1b) wherethe Banksia andHakea species occur in their natural habitat. Resin Pis considered the fraction that is readily available for most plants; however,Proteaceaespecieshaveaccesstoa largerpool,asaresultoftheircarboxylate-releasing cluster roots. Values are means ± SE (n = 3).Hakea neurophyllagrows on a rocky substrate, exploiting cracks, andhence the collection of soilat depth was not always feasible; soil collected in three samples was pooled,and hence for this site no standard errors could be calculated.
� 2012 The Authors New Phytologist (2012) 196: 1098–1108New Phytologist� 2012 New Phytologist Trust www.newphytologist.com
NewPhytologist Research 1101
in unfertilized crop and pasture soils are typically in the range of20–40 mg P kg�1 dry soil (Hedley et al., 1982).
Total P concentrations in the sampled soils were invariably verylow, ranging from 9 to 25 mg kg�1 dry soil (Fig. 3b). Forcomparison, total-P concentrations in unfertilized crop andpasturesoils are typically in the range of 550–770 mg P kg�1 dry soil(Hedley et al., 1982).
All soils collected at locations where the studied species weresampled (Fig. 1b) were acidic, with a pH (CaCl2) of 4–5,irrespective of location or soil depth.
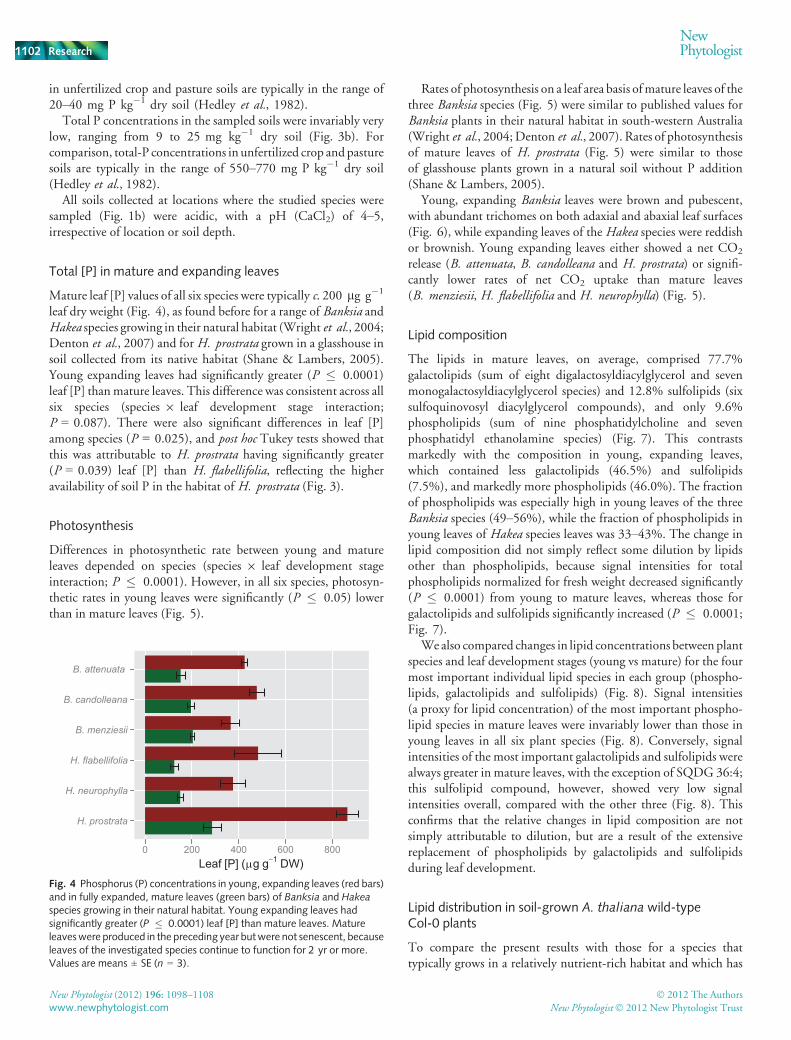
Total [P] in mature and expanding leaves
Mature leaf [P] values of all six species were typically c. 200 lg g�1
leaf dry weight (Fig. 4), as found before for a range of Banksia andHakea species growing in their natural habitat (Wright et al., 2004;Denton et al., 2007) and forH. prostrata grown in a glasshouse insoil collected from its native habitat (Shane & Lambers, 2005).Young expanding leaves had significantly greater (P � 0.0001)leaf [P] thanmature leaves. This difference was consistent across allsix species (species 9 leaf development stage interaction;P = 0.087). There were also significant differences in leaf [P]among species (P = 0.025), and post hoc Tukey tests showed thatthis was attributable to H. prostrata having significantly greater(P = 0.039) leaf [P] than H. flabellifolia, reflecting the higheravailability of soil P in the habitat of H. prostrata (Fig. 3).
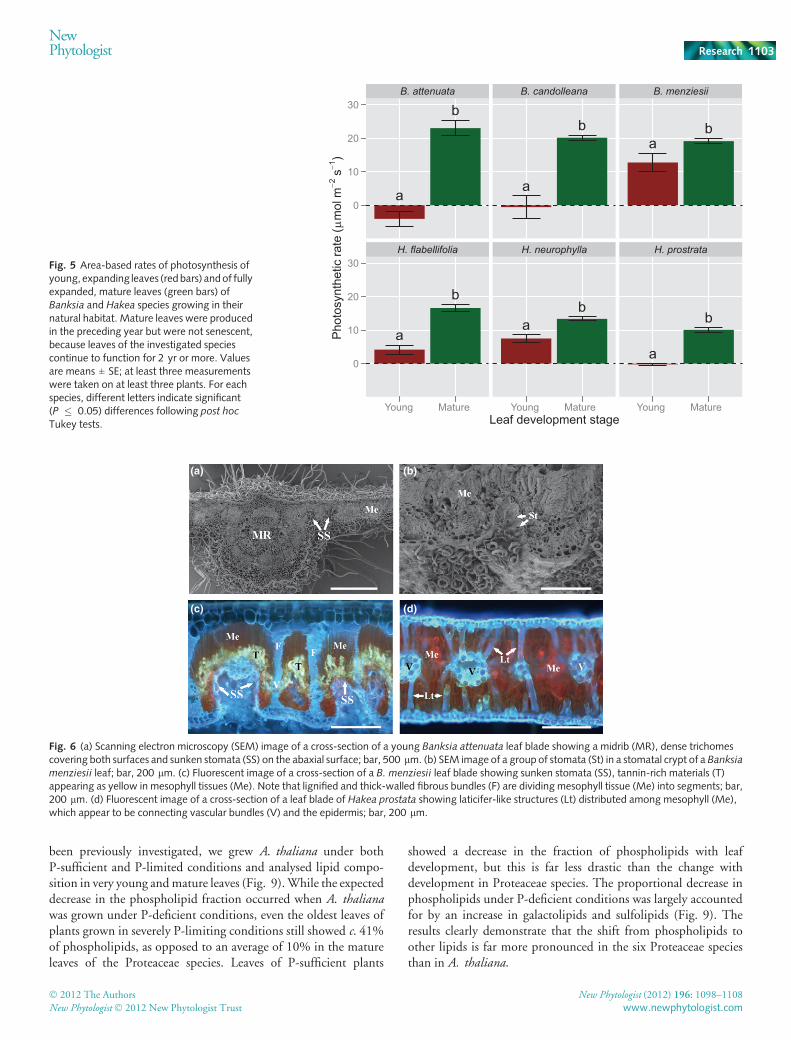
Photosynthesis
Differences in photosynthetic rate between young and matureleaves depended on species (species 9 leaf development stageinteraction; P � 0.0001). However, in all six species, photosyn-thetic rates in young leaves were significantly (P � 0.05) lowerthan in mature leaves (Fig. 5).
Rates of photosynthesis on a leaf area basis ofmature leaves of thethree Banksia species (Fig. 5) were similar to published values forBanksia plants in their natural habitat in south-western Australia(Wright et al., 2004;Denton et al., 2007). Rates of photosynthesisof mature leaves of H. prostrata (Fig. 5) were similar to thoseof glasshouse plants grown in a natural soil without P addition(Shane & Lambers, 2005).
Young, expanding Banksia leaves were brown and pubescent,with abundant trichomes on both adaxial and abaxial leaf surfaces(Fig. 6), while expanding leaves of theHakea species were reddishor brownish. Young expanding leaves either showed a net CO2
release (B. attenuata, B. candolleana and H. prostrata) or signifi-cantly lower rates of net CO2 uptake than mature leaves(B. menziesii, H. flabellifolia and H. neurophylla) (Fig. 5).
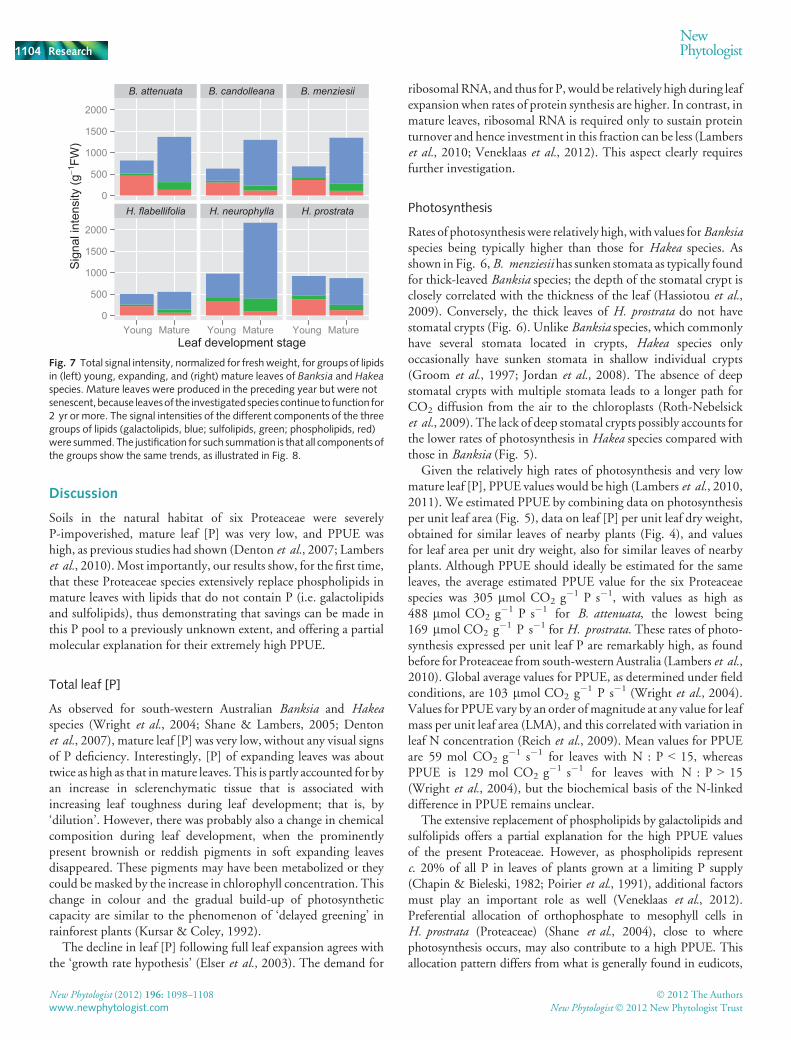
Lipid composition
The lipids in mature leaves, on average, comprised 77.7%galactolipids (sum of eight digalactosyldiacylglycerol and sevenmonogalactosyldiacylglycerol species) and 12.8% sulfolipids (sixsulfoquinovosyl diacylglycerol compounds), and only 9.6%phospholipids (sum of nine phosphatidylcholine and sevenphosphatidyl ethanolamine species) (Fig. 7). This contrastsmarkedly with the composition in young, expanding leaves,which contained less galactolipids (46.5%) and sulfolipids(7.5%), and markedly more phospholipids (46.0%). The fractionof phospholipids was especially high in young leaves of the threeBanksia species (49–56%), while the fraction of phospholipids inyoung leaves of Hakea species leaves was 33–43%. The change inlipid composition did not simply reflect some dilution by lipidsother than phospholipids, because signal intensities for totalphospholipids normalized for fresh weight decreased significantly(P � 0.0001) from young to mature leaves, whereas those forgalactolipids and sulfolipids significantly increased (P � 0.0001;Fig. 7).
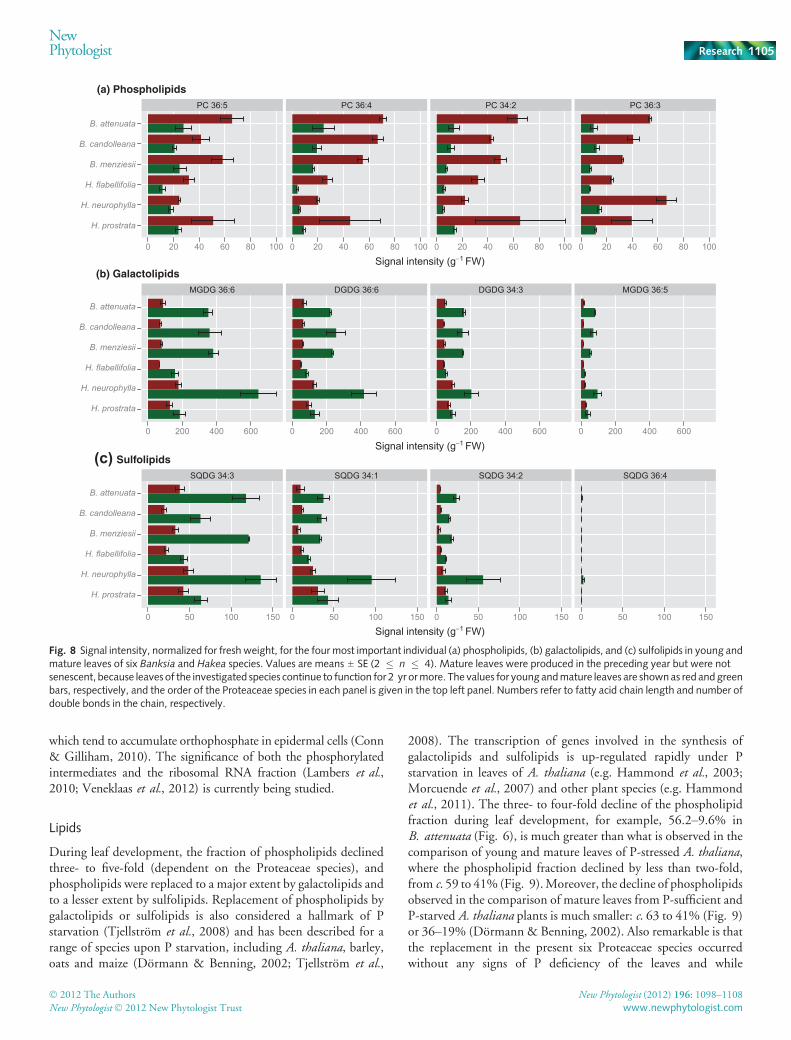
We also compared changes in lipid concentrations between plantspecies and leaf development stages (young vs mature) for the fourmost important individual lipid species in each group (phospho-lipids, galactolipids and sulfolipids) (Fig. 8). Signal intensities(a proxy for lipid concentration) of the most important phospho-lipid species in mature leaves were invariably lower than those inyoung leaves in all six plant species (Fig. 8). Conversely, signalintensities of the most important galactolipids and sulfolipids werealways greater in mature leaves, with the exception of SQDG 36:4;this sulfolipid compound, however, showed very low signalintensities overall, compared with the other three (Fig. 8). Thisconfirms that the relative changes in lipid composition are notsimply attributable to dilution, but are a result of the extensivereplacement of phospholipids by galactolipids and sulfolipidsduring leaf development.
Lipid distribution in soil-grown A. thaliana wild-typeCol-0 plants
To compare the present results with those for a species thattypically grows in a relatively nutrient-rich habitat and which has
H. prostrata
H. neurophylla
H. flabellifolia
B. menziesii
B. candolleana
B. attenuata
0 200 400 600 800Leaf [P] (μg g−1 DW)
Fig. 4 Phosphorus (P) concentrations in young, expanding leaves (red bars)and in fully expanded, mature leaves (green bars) of Banksia and Hakeaspecies growing in their natural habitat. Young expanding leaves hadsignificantly greater (P � 0.0001) leaf [P] than mature leaves. Matureleaveswere produced in the preceding year butwere not senescent, becauseleaves of the investigated species continue to function for 2 yr or more.Values are means ± SE (n = 3).
New Phytologist (2012) 196: 1098–1108 � 2012 The Authors
www.newphytologist.com New Phytologist� 2012 New Phytologist Trust
Research
NewPhytologist1102
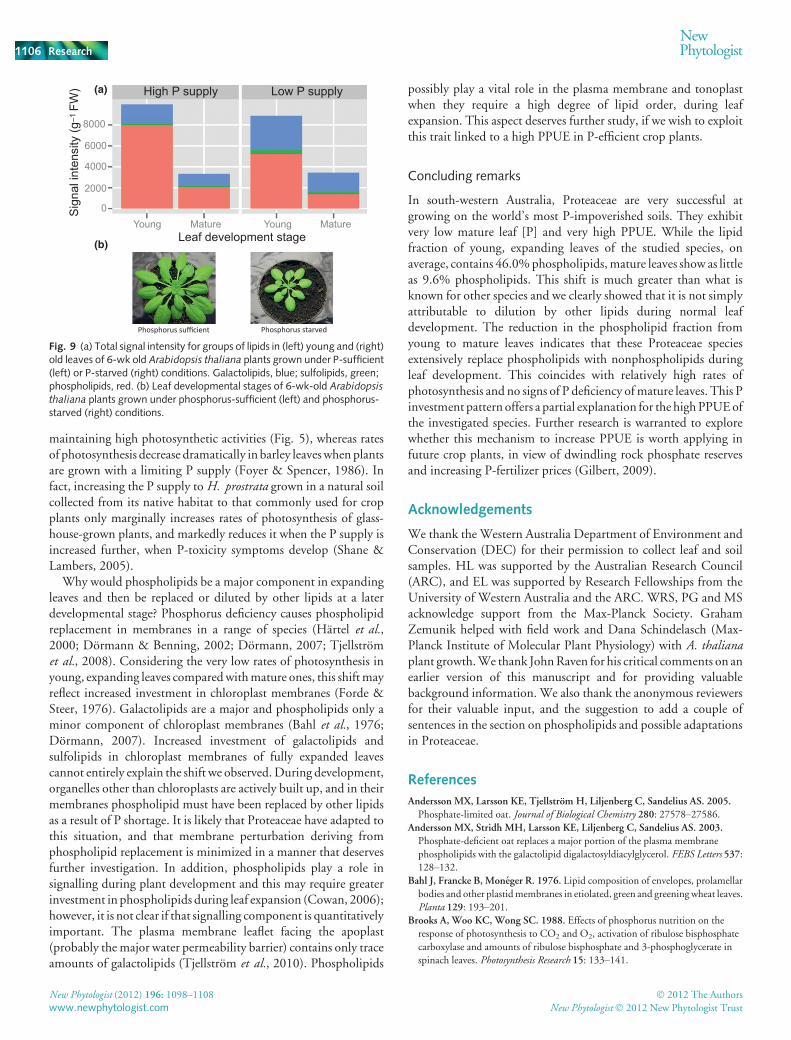
been previously investigated, we grew A. thaliana under bothP-sufficient and P-limited conditions and analysed lipid compo-sition in very young andmature leaves (Fig. 9).While the expecteddecrease in the phospholipid fraction occurred when A. thalianawas grown under P-deficient conditions, even the oldest leaves ofplants grown in severely P-limiting conditions still showed c. 41%of phospholipids, as opposed to an average of 10% in the matureleaves of the Proteaceae species. Leaves of P-sufficient plants
showed a decrease in the fraction of phospholipids with leafdevelopment, but this is far less drastic than the change withdevelopment in Proteaceae species. The proportional decrease inphospholipids under P-deficient conditions was largely accountedfor by an increase in galactolipids and sulfolipids (Fig. 9). Theresults clearly demonstrate that the shift from phospholipids toother lipids is far more pronounced in the six Proteaceae speciesthan in A. thaliana.
a
b
a
ba
b
a
b
ab
a
b
B. attenuata B. candolleana B. menziesii
H. flabellifolia H. neurophylla H. prostrata
0
10
20
30
0
10
20
30
Leaf development stage
Pho
tosy
nthe
ticra
te(μ
mol
m−2
s−1 )
Young Mature Young Mature Young Mature
Fig. 5 Area-based rates of photosynthesis ofyoung, expanding leaves (redbars) andof fullyexpanded, mature leaves (green bars) ofBanksia and Hakea species growing in theirnatural habitat. Mature leaves were producedin the preceding year but were not senescent,because leaves of the investigated speciescontinue to function for 2 yr or more. Valuesare means ± SE; at least three measurementswere taken on at least three plants. For eachspecies, different letters indicate significant(P � 0.05) differences following post hoc
Tukey tests.
(a) (b)
(c) (d)
Fig. 6 (a) Scanning electron microscopy (SEM) image of a cross-section of a young Banksia attenuata leaf blade showing a midrib (MR), dense trichomescovering both surfaces and sunken stomata (SS) on the abaxial surface; bar, 500 lm. (b) SEM image of a group of stomata (St) in a stomatal crypt of a Banksiamenziesii leaf; bar, 200 lm. (c) Fluorescent image of a cross-section of a B. menziesii leaf blade showing sunken stomata (SS), tannin-rich materials (T)appearing as yellow in mesophyll tissues (Me). Note that lignified and thick-walled fibrous bundles (F) are dividing mesophyll tissue (Me) into segments; bar,200 lm. (d) Fluorescent image of a cross-section of a leaf blade of Hakea prostata showing laticifer-like structures (Lt) distributed among mesophyll (Me),which appear to be connecting vascular bundles (V) and the epidermis; bar, 200 lm.
� 2012 The Authors New Phytologist (2012) 196: 1098–1108New Phytologist� 2012 New Phytologist Trust www.newphytologist.com
NewPhytologist Research 1103
Discussion
Soils in the natural habitat of six Proteaceae were severelyP-impoverished, mature leaf [P] was very low, and PPUE washigh, as previous studies had shown (Denton et al., 2007; Lamberset al., 2010).Most importantly, our results show, for the first time,that these Proteaceae species extensively replace phospholipids inmature leaves with lipids that do not contain P (i.e. galactolipidsand sulfolipids), thus demonstrating that savings can be made inthis P pool to a previously unknown extent, and offering a partialmolecular explanation for their extremely high PPUE.
Total leaf [P]
As observed for south-western Australian Banksia and Hakeaspecies (Wright et al., 2004; Shane & Lambers, 2005; Dentonet al., 2007), mature leaf [P] was very low, without any visual signsof P deficiency. Interestingly, [P] of expanding leaves was abouttwice as high as that inmature leaves. This is partly accounted for byan increase in sclerenchymatic tissue that is associated withincreasing leaf toughness during leaf development; that is, by‘dilution’. However, there was probably also a change in chemicalcomposition during leaf development, when the prominentlypresent brownish or reddish pigments in soft expanding leavesdisappeared. These pigments may have been metabolized or theycould bemasked by the increase in chlorophyll concentration. Thischange in colour and the gradual build-up of photosyntheticcapacity are similar to the phenomenon of ‘delayed greening’ inrainforest plants (Kursar & Coley, 1992).
The decline in leaf [P] following full leaf expansion agrees withthe ‘growth rate hypothesis’ (Elser et al., 2003). The demand for
ribosomalRNA, and thus for P,would be relatively high during leafexpansion when rates of protein synthesis are higher. In contrast, inmature leaves, ribosomal RNA is required only to sustain proteinturnover and hence investment in this fraction can be less (Lamberset al., 2010; Veneklaas et al., 2012). This aspect clearly requiresfurther investigation.
Photosynthesis
Rates of photosynthesis were relatively high,with values forBanksiaspecies being typically higher than those for Hakea species. Asshown in Fig. 6,B. menziesii has sunken stomata as typically foundfor thick-leaved Banksia species; the depth of the stomatal crypt isclosely correlated with the thickness of the leaf (Hassiotou et al.,2009). Conversely, the thick leaves of H. prostrata do not havestomatal crypts (Fig. 6). Unlike Banksia species, which commonlyhave several stomata located in crypts, Hakea species onlyoccasionally have sunken stomata in shallow individual crypts(Groom et al., 1997; Jordan et al., 2008). The absence of deepstomatal crypts with multiple stomata leads to a longer path forCO2 diffusion from the air to the chloroplasts (Roth-Nebelsicket al., 2009). The lack of deep stomatal crypts possibly accounts forthe lower rates of photosynthesis in Hakea species compared withthose in Banksia (Fig. 5).
Given the relatively high rates of photosynthesis and very lowmature leaf [P], PPUE values would be high (Lambers et al., 2010,2011). We estimated PPUE by combining data on photosynthesisper unit leaf area (Fig. 5), data on leaf [P] per unit leaf dry weight,obtained for similar leaves of nearby plants (Fig. 4), and valuesfor leaf area per unit dry weight, also for similar leaves of nearbyplants. Although PPUE should ideally be estimated for the sameleaves, the average estimated PPUE value for the six Proteaceaespecies was 305 lmol CO2 g�1 P s�1, with values as high as488 lmol CO2 g�1 P s�1 for B. attenuata, the lowest being169 lmol CO2 g�1 P s�1 for H. prostrata. These rates of photo-synthesis expressed per unit leaf P are remarkably high, as foundbefore for Proteaceae from south-westernAustralia (Lambers et al.,2010). Global average values for PPUE, as determined under fieldconditions, are 103 lmol CO2 g�1 P s�1 (Wright et al., 2004).Values for PPUE vary by an order ofmagnitude at any value for leafmass per unit leaf area (LMA), and this correlated with variation inleaf N concentration (Reich et al., 2009). Mean values for PPUEare 59 mol CO2 g�1 s�1 for leaves with N : P < 15, whereasPPUE is 129 mol CO2 g�1 s�1 for leaves with N : P > 15(Wright et al., 2004), but the biochemical basis of the N-linkeddifference in PPUE remains unclear.
The extensive replacement of phospholipids by galactolipids andsulfolipids offers a partial explanation for the high PPUE valuesof the present Proteaceae. However, as phospholipids representc. 20% of all P in leaves of plants grown at a limiting P supply(Chapin & Bieleski, 1982; Poirier et al., 1991), additional factorsmust play an important role as well (Veneklaas et al., 2012).Preferential allocation of orthophosphate to mesophyll cells inH. prostrata (Proteaceae) (Shane et al., 2004), close to wherephotosynthesis occurs, may also contribute to a high PPUE. Thisallocation pattern differs from what is generally found in eudicots,
B. attenuata B. candolleana B. menziesii
H. flabellifolia H. neurophylla H. prostrata0
500
1000
1500
2000
0
500
1000
1500
2000
Young Mature Young Mature Young MatureLeaf development stage
Sig
nal i
nten
sity
(g−1
FW)
Fig. 7 Total signal intensity, normalized for freshweight, for groups of lipidsin (left) young, expanding, and (right) mature leaves of Banksia and Hakeaspecies. Mature leaves were produced in the preceding year but were notsenescent,because leavesof the investigatedspecies continue to function for2 yr or more. The signal intensities of the different components of the threegroups of lipids (galactolipids, blue; sulfolipids, green; phospholipids, red)were summed. The justification for such summation is that all components ofthe groups show the same trends, as illustrated in Fig. 8.
New Phytologist (2012) 196: 1098–1108 � 2012 The Authors
www.newphytologist.com New Phytologist� 2012 New Phytologist Trust
Research
NewPhytologist1104
which tend to accumulate orthophosphate in epidermal cells (Conn& Gilliham, 2010). The significance of both the phosphorylatedintermediates and the ribosomal RNA fraction (Lambers et al.,2010; Veneklaas et al., 2012) is currently being studied.
Lipids
During leaf development, the fraction of phospholipids declinedthree- to five-fold (dependent on the Proteaceae species), andphospholipids were replaced to a major extent by galactolipids andto a lesser extent by sulfolipids. Replacement of phospholipids bygalactolipids or sulfolipids is also considered a hallmark of Pstarvation (Tjellstrom et al., 2008) and has been described for arange of species upon P starvation, including A. thaliana, barley,oats and maize (Dormann & Benning, 2002; Tjellstrom et al.,
2008). The transcription of genes involved in the synthesis ofgalactolipids and sulfolipids is up-regulated rapidly under Pstarvation in leaves of A. thaliana (e.g. Hammond et al., 2003;Morcuende et al., 2007) and other plant species (e.g. Hammondet al., 2011). The three- to four-fold decline of the phospholipidfraction during leaf development, for example, 56.2–9.6% inB. attenuata (Fig. 6), is much greater than what is observed in thecomparison of young and mature leaves of P-stressed A. thaliana,where the phospholipid fraction declined by less than two-fold,from c. 59 to 41% (Fig. 9).Moreover, the decline of phospholipidsobserved in the comparison of mature leaves from P-sufficient andP-starved A. thaliana plants is much smaller: c. 63 to 41% (Fig. 9)or 36–19% (Dormann & Benning, 2002). Also remarkable is thatthe replacement in the present six Proteaceae species occurredwithout any signs of P deficiency of the leaves and while
Fig. 8 Signal intensity, normalized for fresh weight, for the four most important individual (a) phospholipids, (b) galactolipids, and (c) sulfolipids in young andmature leaves of six Banksia and Hakea species. Values are means ± SE (2 � n � 4). Mature leaves were produced in the preceding year but were notsenescent, because leaves of the investigated species continue to function for 2 yr ormore. The values for young andmature leaves are shownas red andgreenbars, respectively, and the order of the Proteaceae species in each panel is given in the top left panel. Numbers refer to fatty acid chain length and number ofdouble bonds in the chain, respectively.
� 2012 The Authors New Phytologist (2012) 196: 1098–1108New Phytologist� 2012 New Phytologist Trust www.newphytologist.com
NewPhytologist Research 1105
maintaining high photosynthetic activities (Fig. 5), whereas ratesof photosynthesis decrease dramatically in barley leaveswhen plantsare grown with a limiting P supply (Foyer & Spencer, 1986). Infact, increasing the P supply toH. prostrata grown in a natural soilcollected from its native habitat to that commonly used for cropplants only marginally increases rates of photosynthesis of glass-house-grown plants, and markedly reduces it when the P supply isincreased further, when P-toxicity symptoms develop (Shane &Lambers, 2005).
Why would phospholipids be a major component in expandingleaves and then be replaced or diluted by other lipids at a laterdevelopmental stage? Phosphorus deficiency causes phospholipidreplacement in membranes in a range of species (Hartel et al.,2000; Dormann & Benning, 2002; Dormann, 2007; Tjellstromet al., 2008). Considering the very low rates of photosynthesis inyoung, expanding leaves comparedwithmature ones, this shiftmayreflect increased investment in chloroplast membranes (Forde &Steer, 1976). Galactolipids are a major and phospholipids only aminor component of chloroplast membranes (Bahl et al., 1976;Dormann, 2007). Increased investment of galactolipids andsulfolipids in chloroplast membranes of fully expanded leavescannot entirely explain the shift we observed.During development,organelles other than chloroplasts are actively built up, and in theirmembranes phospholipid must have been replaced by other lipidsas a result of P shortage. It is likely that Proteaceae have adapted tothis situation, and that membrane perturbation deriving fromphospholipid replacement is minimized in a manner that deservesfurther investigation. In addition, phospholipids play a role insignalling during plant development and this may require greaterinvestment in phospholipids during leaf expansion (Cowan, 2006);however, it is not clear if that signalling component is quantitativelyimportant. The plasma membrane leaflet facing the apoplast(probably the major water permeability barrier) contains only traceamounts of galactolipids (Tjellstrom et al., 2010). Phospholipids
possibly play a vital role in the plasma membrane and tonoplastwhen they require a high degree of lipid order, during leafexpansion. This aspect deserves further study, if we wish to exploitthis trait linked to a high PPUE in P-efficient crop plants.
Concluding remarks
In south-western Australia, Proteaceae are very successful atgrowing on the world’s most P-impoverished soils. They exhibitvery low mature leaf [P] and very high PPUE. While the lipidfraction of young, expanding leaves of the studied species, onaverage, contains 46.0%phospholipids,mature leaves show as littleas 9.6% phospholipids. This shift is much greater than what isknown for other species and we clearly showed that it is not simplyattributable to dilution by other lipids during normal leafdevelopment. The reduction in the phospholipid fraction fromyoung to mature leaves indicates that these Proteaceae speciesextensively replace phospholipids with nonphospholipids duringleaf development. This coincides with relatively high rates ofphotosynthesis and no signs of P deficiency ofmature leaves. This Pinvestment pattern offers a partial explanation for the highPPUEofthe investigated species. Further research is warranted to explorewhether this mechanism to increase PPUE is worth applying infuture crop plants, in view of dwindling rock phosphate reservesand increasing P-fertilizer prices (Gilbert, 2009).
Acknowledgements
We thank the Western Australia Department of Environment andConservation (DEC) for their permission to collect leaf and soilsamples. HL was supported by the Australian Research Council(ARC), and EL was supported by Research Fellowships from theUniversity of Western Australia and the ARC. WRS, PG and MSacknowledge support from the Max-Planck Society. GrahamZemunik helped with field work and Dana Schindelasch (Max-Planck Institute of Molecular Plant Physiology) with A. thalianaplant growth.We thank JohnRaven for his critical comments on anearlier version of this manuscript and for providing valuablebackground information. We also thank the anonymous reviewersfor their valuable input, and the suggestion to add a couple ofsentences in the section on phospholipids and possible adaptationsin Proteaceae.
Phosphate-deficient oat replaces a major portion of the plasma membrane
phospholipids with the galactolipid digalactosyldiacylglycerol. FEBS Letters 537:128–132.
Bahl J, Francke B, Moneger R. 1976. Lipid composition of envelopes, prolamellar
bodies and other plastidmembranes in etiolated, green and greeningwheat leaves.
Planta 129: 193–201.Brooks A, Woo KC, Wong SC. 1988. Effects of phosphorus nutrition on the
response of photosynthesis to CO2 and O2, activation of ribulose bisphosphate
carboxylase and amounts of ribulose bisphosphate and 3-phosphoglycerate in
spinach leaves. Photosynthesis Research 15: 133–141.
Phosphorus sufficient Phosphorus starved
Sig
nal i
nten
sity
(g–1
FW
)
8000
6000
4000
2000
0Young Mature Young Mature
Leaf development stage
High P supply Low P supply(a)
(b)
Fig. 9 (a) Total signal intensity for groups of lipids in (left) young and (right)old leaves of 6-wk old Arabidopsis thaliana plants grown under P-sufficient(left) or P-starved (right) conditions. Galactolipids, blue; sulfolipids, green;phospholipids, red. (b) Leaf developmental stages of 6-wk-old Arabidopsis
thaliana plants grown under phosphorus-sufficient (left) and phosphorus-starved (right) conditions.
New Phytologist (2012) 196: 1098–1108 � 2012 The Authors
www.newphytologist.com New Phytologist� 2012 New Phytologist Trust
Research
NewPhytologist1106
BurbidgeAA,Hopper SD,VanLeeuwen S, eds. 1990.A report to the EnvironmentalProtection Authority from the Department of Conservation and Land Management.Bulletin 424. Perth, Australia: Environmental Protection Authority.
Chapin FS, Bieleski RL. 1982.Mild phosphorus stress in barley and a related low-
phosphorus-adapted barleygrass: phosphorus fractions and phosphate absorption
in relation to growth. Physiologia Plantarum 54: 309–317.Cheesman AW, Turner BL, Reddy KR. 2010. Interaction of phosphorus
compounds with anion-exchange membranes: implications for soil analysis. SoilScience Society of America Journal 74: 1607–1612.
Ciereszko I, JohanssonH,HurryV,KleczkowskiLA. 2001.Phosphate status affects
the gene expression, protein content and enzymatic activity of UDP-glucose
pyrophosphorylase inwild-type and phomutants ofArabidopsis.Planta212: 598–605.
Conn S, GillihamM. 2010. Comparative physiology of elemental distributions in
plants. Annals of Botany 105: 1081–1102.Cowan A. 2006. Phospholipids as plant growth regulators. Plant Growth Regulation48: 97–109.
Cruz-Ramırez A, Oropeza-Aburto A, Razo-Hernandez F, Ramırez-Chavez E,
Herrera-Estrella L. 2006. Phospholipase DZ2 plays an important role in
extraplastidic galactolipid biosynthesis and phosphate recycling in Arabidopsisroots. Proceedings of the National Academy of Sciences, USA 103: 6765–6770.
Denton MD, Veneklaas EJ, Freimoser FM, Lambers H. 2007. Banksia species(Proteaceae) from severely phosphorus-impoverished soils exhibit extreme
efficiency in the use and re-mobilization of phosphorus. Plant, Cell &Environment 30: 1557–1565.
Dormann P 2007.Galactolipids in plant membranes. Encyclopedia of Life Sciences:eLS. Chichester, UK: JohnWiley & Sons Ltd. http://www.els.net. doi: 10.1002/
9780470015902.a0020100.
Dormann P, Benning C. 2002. Galactolipids rule in seed plants. Trends in PlantScience 7: 112–118.
Gilbert N. 2009. The disappearing nutrient. Nature 461: 716–718.Griffin EA, Burbidge AA 1990. Vegetation. In: Burbidge AA, Hopper SD, Van
Leeuwen D eds. A report to the Environmental Protection Authority from theDepartment of Conservation and LandManagement. Bulletin 424. Perth, Australia:Environmental Protection Authority, 15–24.
Groom PK, Lamont BB, Markey AS. 1997. Influence of leaf type and plant age on
leaf structure and sclerophylly inHakea (Proteaceae).Australian Journal of Botany45: 827–838.
strategies change with soil age. Trends in Ecology and Evolution 23: 95–103.McArthur WM. 1991. Reference soils of south-western Australia. South Perth,Australia: Department of Agriculture Western Australia.
McArthurWM, Bettenay E. 1974.Development and distribution of soils of the SwanCoastal Plain, Western Australia. Melbourne, Australia: CSIRO.
MimuraT. 1995.Homeostasis and transport of inorganicphosphate inplants.Plantand Cell Physiology 36: 1–7.
Morcuende R, Bari R, Gibon Y, Zheng W, Pant BD, Blasing O, Usadel B,
Czechowski T, Udvardi MK, Stitt M, et al. 2007. Genome-wide
Motomizu S, Wakimoto T, Toei K. 1983. Spectrophotometric determination
of phosphate in river waters with molybdate and malachite green. Analyst 108:361–367.
Pate JS, Bell TL. 1999. Application of the ecosystem mimic concept to the species-
rich Banksia woodlands of Western Australia. Agroforestry Systems 45: 303–341.Pinheiro JC, Bates DM. 2000.Mixed-effects models in S and S-PLUS. New York,
NY, USA: Springer.
Playford PE, Cockbain AE, Low GH. 1976. Geology of the Perth Basin, WesternAustralia. Perth, Australia: Geological Survey, Western Australia.
� 2012 The Authors New Phytologist (2012) 196: 1098–1108New Phytologist� 2012 New Phytologist Trust www.newphytologist.com
NewPhytologist Research 1107
Poirier Y, Thoma S, Somerville C, Schiefelbein J. 1991.Mutant of Arabidopsisdeficient in xylem loading of phosphate. Plant Physiology 97: 1087–1093.
Rao IM, Terry N. 1989. Leaf phosphate status, photosynthesis, and carbon
partitioning in sugar beet: I. Changes in growth, gas exchange, and Calvin cycle