17
Establishing an Emission Control arEa in U.s. WatErs Protecting American Health from Global Shipping Pollution
Establishing an Emission Control arEa in U.s. WatErs
Protecting American Health from Global Shipping Pollution


Protecting American Health from Global Shipping Pollution
Establishing an Emission control arEa in U.s. watErs
Authors
Janea Scott
Hilary Sinnamon

AcknowledgmentsWe would like to thank the following people for their contributions and insight in developing this report: Vickie Patton, Dennis McLerran, Ramon Alvarez, Cal Baier-Anderson, John Balbus, Bill Becker, Paul Billings, Elena Craft and Nancy Kruger. We very much appreciate all of your invaluable help.
Environmental Defense FundEnvironmental Defense Fund is dedicated to protecting the environmental rights of all people, including the right to clean air, clean water, healthy food and flour-ishing ecosystems. Guided by science, we work to create practical solutions that win lasting political, economic and social support because they are nonpartisan, cost-effective and fair.
American Lung AssociationNow in its second century, the American Lung Association is the leading organi zation working to save lives by improving lung health and preventing lung disease. With your generous support, the American Lung Association is “Fighting for Air” through research, education and advocacy.
National Association of Clean Air AgenciesThe National Association of Clean Air Agencies (NACAA) comprises the air pollution control agencies in 53 states and territories and over 165 metropolitan areas across the country. NACAA’s members have primary responsibility for ensuring that everyone in our nation breathes clean, healthful air.
Puget Sound Clean Air AgencyThe Puget Sound Clean Air Agency is the regional air quality agency for the area including the major container ports of Seattle and Tacoma, Washington. We work together to clean the air we breathe and protect our climate through education, incentives and enforcement.
Cover photo: Ocean-going ship at the port of Los Angeles. Photo by Janea Scott.
©2009 Environmental Defense Fund
The complete report is available online at www.edf.org.
iii
Executive summary
The United States Government can chart a course to achieve healthier air for the millions of Americans impacted by the emissions from ocean-going ships by applying to the International Maritime Organization (IMO) for an Emission Control Area (ECA)—an area where stricter pollution limits apply. Ocean-going ships, sometimes referred to as Category 3 ships, are the largest ships on the water and include con-tainer ships, tankers, cruise ships, and bulk carriers. These large vessels travel all over the world, making international shipping a significant factor in U.S. port traffic and emissions. In fact, 90% of ship calls on U.S. ports are made by foreign-flagged vessels. Ocean-going ships impact air quality in U.S. coastal cities and ports and even send pollution hundreds of miles inland.
The American Lung Association (ALA), Environmental Defense Fund (EDF), the National Association of Clean Air Agencies (NACAA), and the Puget Sound Clean Air Agency (PSCAA) strongly support the leadership of the United States Government to fully implement the pollution limits available under international
PortAngeles Seattle
TacomaVancouver
Portland
Coos Bay
San FranciscoOakland
StocktonRichmond
Port HuenemeLong Beach
San Diego
Two Harbors
Duluth-Superior
BeaumontPort Arthur
Houston
GalvestonTexas City
Corpus Christi
Brownsville
Lake Charles
LOOP TermPlaqueminesNew OrleansPort S. LA
GulfportPascagoola
Mobile
Memphis
Pensacola
Tampa
Palm BeachPort EvergladesMiami
Port Canaveral
JacksonvilleBrunswick
SavannahCharleston
Wilmington
Newport News NorfolkHarbor
Baltimore
Philadelphia/Delaware
Pittsburgh
Cincinnati
ToledoGaryChicago
Milwaukee
Wtwy
Burns
Detroit
PresqueIsle
ClevelandLorain
St. Louis
NY/NJ PortsBridgeport
New HavenProvidence
BostonPortsmouth
Portland
≤0.01 >0.01–≤0.03 >0.03–≤0.05 >0.05–≤0.1 >0.1–≤0.25
>0.25–≤0.5 >0.5–≤1.0 >1.0–≤2.0 >2.0–≤4.1 outside 12 km grids
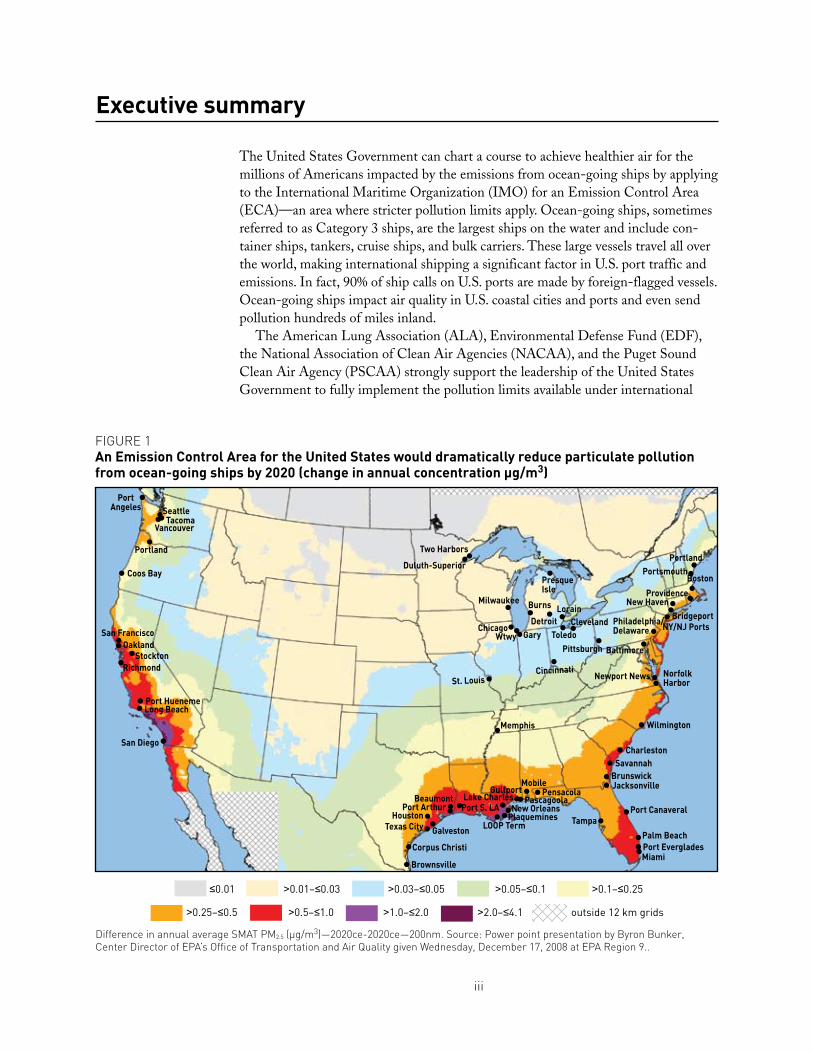
Figure 1 An Emission Control Area for the United States would dramatically reduce particulate pollution from ocean-going ships by 2020 (change in annual concentration µg/m3)
Difference in annual average sMAt PM2.5 (µg/m3)—2020ce-2020ce—200nm. source: Power point presentation by Byron Bunker, Center Director of ePA’s office of transportation and Air Quality given Wednesday, December 17, 2008 at ePA region 9..

iv
Protecting American Health from Global Shipping Pollution
law to reduce harmful marine air pollution. We also respectfully request that the IMO promptly act on the United States ECA application, and give it full con sideration at the July 2009 meeting of the IMO Marine Environment Protection Committee (MEPC 59). As Figure 1 illustrates, prompt action to establish an ECA for the United States will secure vital clean air protections for millions of Americans.
• This map depicts the estimated reductions in annual concentrations of harmful particulate pollution in 2020 if the United States establishes an ECA to cover the nation’s entire Exclusive Economic Zone, which generally extends a distance of 200 nautical miles from the coast. About 87 million Americans live in port areas that are not meeting basic federal public health standards.
• The Environmental Protection Agency’s early estimates indicate the benefits of an ECA would be about 5 times larger than that of the recently finalized commercial ships and locomotives rule.1
• ECAs require fuel to be over 60% cleaner than the global average by 2010 and 96% cleaner in 2015, resulting in emissions reductions far greater and faster than by baseline global standards.
• Establishing an ECA for the United States would reduce smogforming oxides of nitrogen (NOx) emissions by 80% from existing engine emission levels, particulate pollution (PM) by 85% and sulfur oxides (SOx) by 95%.
• Estimated 2020 particulate concentration reductions in the United States as a result of an ECA are as high as 4.1 µg/m3 (micrograms per cubic meter) in some of the most impacted port areas.
• In some metropolitan areas, like Houston, the expected reductions could mean the difference between meeting and not meeting the healthbased federal clean air standards.2
1
Healthier air on deck
The International Maritime Organization has charted a course for deep reductions in air pollution from shipsThe IMO, established under the purview of the United Nations, is responsible for coordinating with member nations to establish international pollution standards for ocean-going ships. Annex VI of the International Convention for the Prevention of Marine Pollution from Ships (MARPOL) treaty contains the clean air provisions that apply to all signatory nations. The United States became a party to this treaty in 2008. Annex VI consists of two sets of emissions standards: (1) global standards that apply to all ships arriving at, and departing from, countries that are party to the MARPOL treaty; and (2) more rigorous geographically-based standards that apply in specially designated areas called Emission Control Areas (ECAs).
In October 2008, the IMO updated Annex VI of the MARPOL treaty to be more protective. The new standards require modest global reductions in oxides of nitrogen (NOx), particulate pollution (PM), and sulfur oxides (SOx) pollution. They also put in place the framework for more rigorous reductions to be made in ECAs, those areas hardest hit by shipping pollution. We support the U.S. application to the IMO for ECA designation in order to enforce these rigorous standards on all inter-national ships that enter the area.3 The global and ECA emission control standards are as follows:
NOx emission control standards
• 20% NOx reduction beginning in 2011 for new engines.
• 15 to 20% NOx reduction beginning in 2011 for existing engines.
• Within an ECA: 80% NOx reduction beginning in 2016 for new engines. These NOx standards are based on advanced emission control technology, including selective catalytic reduction (SCR).4 SCR is a commonly used technology to reduce NOx emissions in all varieties of diesel engines, and has been successfully installed in over 300 marine vessels.5
Fuel quality standards
• Beginning in 2012, global sulfur fuel levels will drop from the current standard of 45,000 parts per million (ppm) to 35,000 ppm. However, the current global average is about 27,000 ppm.6
• Global sulfur limits will drop to 5,000 ppm in January 2020. However, this deadline may be delayed to 2025 pending a review in 2018 of the availability of the cleaner fuel.
• Within an ECA: Sulfur limits will drop from the current standard of 15,000 ppm to 10,000 ppm in August 2010 and to 1,000 ppm in January 2015.7
The IMO’s action to improve fuel quality is essential because ocean-going ships are currently powered by residual fuel, which is some of the dirtiest fuel on earth.

2
Protecting American Health from Global Shipping Pollution
Residual fuel has a high content of ash, metals, nitrogen, and sulfur that result in high SOx and PM emissions. Since SOx emissions are directly related to the concentration of sulfur in the fuel, reducing the sulfur in fuels, as required by the IMO, also reduces SOx emissions.8 Fortunately, most ship engines that are designed to run on residual fuel are also capable of burning cleaner low sulfur distillate fuel. As a result, no significant ship changes or upgrades are necessary to burn cleaner fuel,9 so the cleaner fuel required in an ECA can be used immediately.
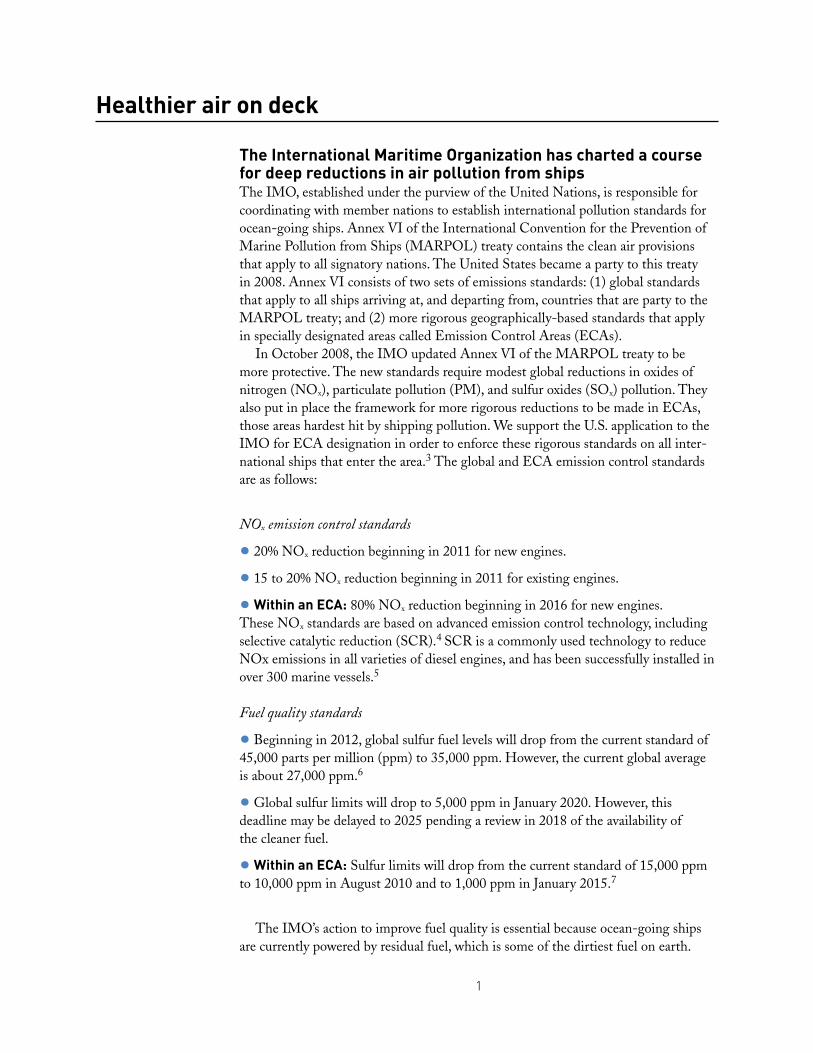
Figure 2 illustrates the far greater reduction in fuel sulfur content in ECAs compared to the baseline global standards. While the new global standards require ship fuel to reduce sulfur limits to 35,000 ppm in 2012, this will have minimal impact because the global average fuel sulfur level is 27,000 ppm. More significant reduc tions will be achieved in 2020, when the global standard drops to 5,000 ppm—this is an 80% reduction from the global average. However, this 2020 deadline may be delayed to 2025 pending a review in 2018 of the availability of the cleaner fuel.
In contrast to the global standards, ECAs require fuel to be over 60% cleaner than the global average in 2010 and 96% cleaner in 2015, reducing more pollution far more quickly than under the baseline global standards. Sulfur levels in a U.S. ECA would not drop to 10,000 ppm until 201210 and EPA has confirmed that the lower sulfur fuel required will be available at that time.11
When fully implemented in the United States, the ECA requirements for engines and fuel would reduce NOx emissions by 80% from current levels, PM by 85% and SOx by 95%.12 These reductions will provide clean air benefits to communities from coast to coast.
Figure 2 Global sulfur requirements for ocean-going ship fuel under new IMO rule
source: iMo, Annex 13, resolution MePC.176 (58), revised MArPoL Annex Vi, Adopted on 10 october 2008.
0
5,000
10,000
15,000
20,000
25,000
30,000
35,000
40,000
45,000
50,000
20252020201520122010Current
Global standardGlobal standardwith possible delayECA standardToday’s global averageP
arts
per
mill
ion
of s
ulfu
r

3
Protecting American Health from Global Shipping Pollution
Securing an Emission Control Area for the United States will have a striking impact on air quality across our nationDiesel exhaust, like that emitted from ocean-going ships, is among the most danger-ous and per vasive sources of air pollution. The constituents of diesel exhaust include particulate matter (PM), impli cated in a host of respiratory problems and thousands of premature deaths every year; smog-forming oxides of nitrogen (NOx); sulfur dioxide (SO2), which forms harmful fine particles and falls back to earth as acid rain; and a noxious brew of toxic chem icals that together pose a cancer risk greater than that of any other air pollutant. Shipping-related PM emissions contribute to approxi-mately 60,000 global deaths annually, with impacts concentrated in coastal regions on major trade routes.13 The U.S. Environ mental Protection Agency (EPA) estimated that in 2001, ocean-going ships emitted:
• more than 54,000 tons of fine particulate matter, which is equivalent to the pollution from 117 coal-fired power plants.14
• approximately 745,000 tons of smog-forming NOx pollution—comparable to the NOx emissions from more than 800 million of today’s new cars,15 and
PortAngeles Seattle
TacomaVancouver
Portland
Coos Bay
San FranciscoOakland
StocktonRichmond
Port HuenemeLong Beach
San Diego
Two Harbors
Duluth-Superior
BeaumontPort Arthur
Houston
GalvestonTexas City
Corpus Christi
Brownsville
Lake Charles
LOOP TermPlaqueminesNew OrleansPort S. LA
GulfportPascagoola
Mobile
Memphis
Pensacola
Tampa
Palm BeachPort EvergladesMiami
Port Canaveral
JacksonvilleBrunswick
SavannahCharleston
Wilmington
Newport News NorfolkHarbor
Baltimore
Philadelphia/Delaware
Pittsburgh
Cincinnati
ToledoGaryChicago
Milwaukee
Wtwy
Burns
Detroit
PresqueIsle
ClevelandLorain
St. Louis
NY/NJ PortsBridgeport
New HavenProvidence
BostonPortsmouth
Portland
≤0.01 >0.01–≤0.03 >0.03–≤0.05 >0.05–≤0.1 >0.1–≤0.25
>0.25–≤0.5 >0.5–≤1.0 >1.0–≤2.0 >2.0–≤4.1 outside 12 km grids
Figure 3 Estimated reductions in annual PM concentrations from U.S. ECA in 2020 (ug/m3)
Difference in annual average sMAt PM2.5 (µg/m3)—2020ce-2020ce—200nm. source: Power point presentation by Byron Bunker, Center Director of ePA’s office of transportation and Air Quality given Wednesday, December 17, 2008 at ePA region 9.

4
Protecting American Health from Global Shipping Pollution
• around 450,000 tons of SO2, which is more than 40% of the total SO2 from the U.S. transportation sector.16 This percentage is due mainly to the low grade residual fuel ocean-going ships use. Residual fuel is the tar-like product left behind after all the lighter petroleum is refined from crude oil and is so viscous that it requires heat-ing before it can be burned.17
The diesel air pollution from ocean-going ships has been under regulated. In the past two decades, EPA has set rigorous emission standards for nearly all other mobile sources of diesel, including highway trucks and buses, non road sources such as con-struction equipment, locomotives and smaller com mercial ships. Securing an ECA for the United States will put in place rigorous standards for ocean-going ships that are more comparable to the standards set for other diesel sources. Establishing an ECA that covers the nation’s entire Exclusive Economic Zone will result in sig nifi-cantly greater emissions reductions than the IMO baseline global standards and will provide much needed air quality improve ments across the nation, particularly in densely populated coastal areas.
Figure 3 depicts the air quality benefits the United States could secure by imple-menting an ECA for the entire coastline of the mainland United States. Figure 3 speaks loudly and clearly: Every state in the lower 48 would see an improve ment in air quality if large ocean-going ships in U.S. waters met the rigorous pollu tion control standards that would be required in an ECA—even states that are land-locked. Par ticulate pollution reductions, represented in annual average con cen tra-tions, range from 0.01 to 0.1 µg/m3 (micrograms per cubic meter) in the middle of the country up to 4.1 ug/m3 in some of the hardest hit coastal and port areas. These reductions will translate into significant health benefits across the nation. Addi tionally, in some metropolitan areas, like Houston, the expected reductions could mean the difference between meeting and not meeting the health-based federal clean air standards.18
Given the enormous clean air and public health benefits to be gained from strong emission standards for ocean-going ships, the IMO should promptly act on the U.S. application to establish an ECA.
IMO approval of U.S. Emission Control Area will clear the way for healthier airWhen countries apply to the IMO for an ECA designation, they must demonstrate a need to prevent, reduce and control emissions of SOx, PM, and/or NOx from ships. The United States has a compelling case for ECA designation. These contaminants are major contributors to unhealthy air pollution in the United States, especially the harmful levels of particulate pollution and ground-level ozone in many communities.
More than half of all Americans live in communities out of compliance with the federal health-based standards for ozone and particulate pollution.19 And millions live near U.S. port cities that are especially hard hit by shipping pollution. EPA esti-mates that 87 mil lion Americans live in port areas that are not meeting basic federal health standards.20
An ECA application submitted by the United States this spring will be considered by the IMO at the July 2009 meeting of the Marine Environment Protection Com-

5
Protecting American Health from Global Shipping Pollution
mittee (MEPC 59). The IMO will then vote on the U.S. application in 2010. If accepted, the ECA designation will go into effect in 2012.21 We respectfully urge the IMO to approve the ECA designation for the United States. The need for these clean air measures is clear and convincing.
Pollution from ocean-going ships in U.S. waters impacts public health and revered ecosystemsThe large ocean-going ships that travel along U.S. coastlines and dock at our nation’s ports deliver considerable amounts of pollution in addition to the goods they bring. Much of the pollution from these large vessels is concentrated in ports and the densely populated metropolitan areas near ports that, in almost every instance, already suffer from unhealthy air.
The health effects of diesel emissions in general are well documented. Diesel air pollution adds to cancer risk all around the United States. In many places, diesel emis sions create the greatest contribution to cancer risk from air pollution. For example, in the Seattle area, diesel soot accounts for somewhere between 70% and 85% of the total cancer risk from all air toxics.22 And in the South Coast Air Basin, which includes Los Angeles, diesel exhaust contributes about 84% of the cancer risk from air toxics.23
In addition, because diesel emissions are a complex mixture of chemicals, exposure to this pollution contributes to a wide range of non-cancer health risks, including pulmonary disease, cardiovascular effects, neurotoxicity, low birth weight in infants, premature births, congenital abnormalities and elevated infant mortality rates.24
Particulate matterParticulate matter can aggravate respiratory conditions such as asthma and chronic bronchitis and has been associated with cardiac arrhythmias (heartbeat irregularities), heart attacks and premature deaths. People with diabetes, heart or lung disease, the elderly and children are at highest risk from exposure to particulate pollution.25
A recent study calculated that, worldwide, shipping-related PM emissions con-tribute to approx imately 60,000 deaths annually, with impacts concentrated in coastal regions on major trade routes.26 The study also predicted that under the regulations in place before the amendments to Annex VI were passed in October 2008, and with the expected growth in shipping activity, annual deaths could increase 40% by 2012, in creasing the number of deaths associated with shipping pollution to 84,000 every year.27
NOx and ozone Oxides of nitrogen transform into aerosol particulates and also combine with volatile organic compounds in the presence of sunlight to form smog, or ground-level ozone. High ozone levels cause acute respiratory problems, aggravated asthma, decreased lung function, inflammation of lung tissue, an increase in hospital admissions and emergency room visits for respiratory causes, and crop damage. Children with asthma are among those most at risk. Ozone also is associated with premature

6
Protecting American Health from Global Shipping Pollution
death.28 The national health-based standard for ozone was strengthened in March 2008 to be more protective than the 1997 standard.
Environmental impactsPollution from ocean-going ships impacts our environment, in addition to impacting public health. The same fine particles that can be breathed deep into the lungs adversely affecting human health also cause the haze that pollutes scenic vistas in national parks and wilderness areas and creates “brown clouds” in our urban centers.
The constituents of diesel exhaust also contribute to the acid rain that continues to harm sensitive ecosystems across the United States. Acid rain occurs when pollutants like SO2 and NOx react with water, oxygen, and other chemicals in the atmosphere to form various acidic compounds. The result is a mild solution of sulfuric acid and nitric acid.29 When this acid falls back to the earth, it harms our nation’s revered ecosystems–causing acidification of lakes and streams and con-tributing to the damage of trees, like red spruce trees, at high elevations and many sensitive forest soils.30
Pollution from ocean-going vessels also contributes to global climate change. In 2006, in U.S. waters alone, these vessels emitted about 55.6 million metric tons of CO2.31 Additionally, ocean-going ships contribute about 1.7% of global black carbon emissions every year.32 Black carbon refers to the solar-absorbing component of soot, which is released during the combustion process, and is another potent global warm ing pollutant.33 Studies show that black carbon triggers snow and ice melting, and contributes to Arctic warming.34 And in some places, including the Alaska region, shipping can contribute an additional 40% to atmospheric con-centrations of black carbon.35 Further, black carbon from shipping could have disproportionate effects on air quality near port areas because of the intensity of shipping in these areas.36
Timely reductions in PM and NOx from ocean-going ships will help states protect human health and achieve cleaner airApproximately 88 million people nationwide either live in counties that do not meet the 1997 federal air quality standards for fine particles, or their counties contribute to violations elsewhere.37 About 132 million people live in counties that violate the 1997 eight-hour federal air quality standard for ozone.38 These standards have recently been updated to be more protective, so the number of people living in communities that violate federal air quality standards will increase.39
Ocean-going ships are a major source of harmful fine particles, and their emissions also contribute to harmful smog levels. In Figure 4, EPA identifies 40 ports that are currently located in nonattainment areas. EPA estimates that some 87 million Americans live in these port areas that are not meeting basic federal public health standards for ground-level ozone and particulate pollution.40 This map, however, is not based on recent updates strengthening the public health-based standards for fine particulate matter and ozone, so air quality problems in U.S. port areas are likely to be more widespread than this map indicates. For example, both the Port of Seattle and

7
Protecting American Health from Global Shipping Pollution
Port of Tacoma areas are within a region that is in violation of the new federal ozone standards based on data for Summer 2008.
As illustrated in Figure 1 previously, reducing pollution from these ships will help every state in the nation improve its air quality.
Conclusion: Establishing an Emission Control Area for the United States will dramatically reduce marine shipping pollution and protect public healthThe United States has the opportunity to join an international emissions con trol program that would reduce shipping pollution along U.S. coastlines, at U.S. ports and indeed, in every state in the continental United States. Participation in the ECA program would result in SOx reductions of approximately 98% and NOx reductions of up to 80% from each new ship. Prompt action by the IMO can secure healthier air for millions of Americans.
Figure 4 Air quality problems are widespread especially in U.S. port areas
Source: Control of emissions From New Marine Compression-ignition engines at or Above 30 Liters per Cylinder; Proposed rule (December 7, 2007). 72 Fed. reg. 69522, page 69528.

8
Protecting American Health from Global Shipping Pollution
ALA, EDF, NACAA, and PSCAA support the United States’ application for a U.S. ECA and respectfully recommend that the IMO promptly approve the application.
Ocean-going vessels from all over the world dock at over 100 U.S. ports. EPA estimates that some 87 million Americans live in port areas that do not meet basic federal public health standards for ground-level ozone and particulate pollution.41 Fortunately, a pivotal opportunity is on deck to achieve significant reductions in the pollution from ocean-going ships. With U.S. leadership in requesting the establish-ment of an Emission Control Area, and IMO approval, the nation will be sailing more smoothly towards healthier air.
9
Notes
1 Power point presentation by Byron Bunker, Center Director of EPA’s Office of Transportation and Air Quality given Wednesday, December 17, 2008 at EPA Region 9.
2 Based on Texas Commission on Environmental Quality data for the Clinton C403/C304/AH113 monitor, generated at http://www.tceq.state.tx.us/cgi-bin/compliance/monops/site_photo.pl?cams=403. These data show the yearly average for PM2.5 concentrations as 15 µg/m3 in 2005, 16 µg/m3 in 2006, 15 µg/m3 in 2007, and 13 µg/m3 in 2008—the 2008 data, however, is still under review. The three-year average for 2005–2007 is 15.33 µg/m3 which is just above the current annual fine particle standard at 15 µg/m3 and the three-year average for 2006–2008 is 14.7 µg/m3 which is just below the current standard. The reductions from 0.25 to 1.0µg/m3, expected from establishing an ECA, could help the Houston metropolitan region attain or main tain the current health-based federal clean air standard of 15µg/m3 for fine particulates.
3 IMO, Annex 13, Resolution MEPC.176 (58), Revised MARPOL Annex VI, Adopted on 10 October 2008. http://tinyurl.com/c5w9d3.
4 IMO, Annex 13, Resolution MEPC.176 (58), Revised MARPOL Annex VI, Adopted on 10 October 2008. http://tinyurl.com/c5w9d3.
5 72 Fed. Reg. 69,522 (December 7, 2007) “Control of Emissions From New Marine Compression-Ignition Engines at or Above 30 Liters per Cylinder; Proposed Rule,” at 69,539.
6 72 Fed. Reg. 69,522 (December 7, 2007) “Control of Emissions From New Marine Compression-Ignition Engines at or Above 30 Liters per Cylinder; Proposed Rule,” at 69,541.
7 IMO, Annex 13, Resolution MEPC.176 (58), Revised MARPOL Annex VI, Adopted on 10 October 2008. http://tinyurl.com/c5w9d3.
8 72 Fed. Reg. 69,522 (December 7, 2007) “Control of Emissions From New Marine Compression-Ignition Engines at or Above 30 Liters per Cylinder; Proposed Rule,” at 69,541.
9 72 Fed. Reg. 69,522 (December 7, 2007) “Control of Emissions From New Marine Compression-Ignition Engines at or Above 30 Liters per Cylinder; Proposed Rule,” at 69,541.
10 “Given the MARPOL amendment acceptance process and the lead time specified in the regulations, an ECA submitted [by late March or early April] could be expected to enter into force as early as August 2012.” EPA Regulatory Update, Frequently Asked Questions about the Emission Control Area Application Process. EPA-420-F-09-001, January 2009.
11 EPA Regulatory Update, “Frequently Asked Questions about the Emission Control Area Application Process,” EPA420-F-09-001; January 2009. http://www.epa.gov/otaq/regs/nonroad/marine/ci/420f09001.pdf
12 EPA Program Announcement, “International Maritime Organization Adopts Program to Control Air Emissions from Ocean-going Vessels,” EPA420-F-08-033; October 2008. http://www.epa.gov/otaq/regs/nonroad/marine/ci/420f08033.pdf
13 Corbett JJ, Winebrake JJ, Green EH, Kasibhatla P, Eyring V, Lauer A. 2007. Mortality from Ship Emissions: A Global Assessment. Environ Sci Technol. 41:8512-8518
14 Control of Emissions From New Marine Compression-Ignition Engines at or Above 30 Liters per Cylinder; Proposed Rule (December 7, 2007). 72 Fed. Reg. 69522, page 69545-69546. Power plant comparisons are based on 0.25lb/MWh of PM2.5 and 4.22 lb/MWh of NOx for power plants, which are the averages for existing coal plants in the western U.S. Also assumes a typical power plant unit has 500MW capacity and 85% utilization rate.
15 Control of Emissions From New Marine Compression-Ignition Engines at or Above 30 Liters per Cylinder; Proposed Rule (December 7, 2007). 72 Fed. Reg. 69522, page 69545-69546. Cal-culations based on Tier 2 NOx emissions standard (0.07g NOx/mile) for highway vehicles and 12,000 vehicle miles/year. Bureau of Automotive Repair, Engineering and Research Branch, State of California, “Methodology for Calculating Vehicle Miles Traveled (VMT),” Sep tem-ber 30, 2000, Report 2000-06, available at http://www.epa.gov/otaq/regs/im/vmt.pdf

10
Protecting American Health from Global Shipping Pollution
16 Control of Emissions From New Marine Compression-Ignition Engines at or Above 30 Liters per Cylinder; Proposed Rule (December 7, 2007). 72 Fed. Reg. 69522, page 69545-69546.
17 http://www.atsdr.cdc.gov/toxprofiles/tp123-c3.pdf 18 Based on Texas Commission on Environmental Quality data for the Clinton C403/C304/
AH113 monitor, generated at http://www.tceq.state.tx.us/cgi-bin/compliance/monops/site_photo.pl?cams=403. These data show the yearly average for PM2.5 concentrations as 15 µg/m3 in 2005, 16 µg/m3 in 2006, 15 µg/m3 in 2007, and 13 µg/m3 in 2008—the 2008 data, however, is still under review. The three-year average for 2005–2007 is 15.33 µg/m3 which is just above the current annual fine particle standard at 15 µg/m3 and the three-year average for 2006–2008 is 14.7 µg/m3 which is just below the current standard. The reductions from 0.25 to 1.0µg/m3, expected from establishing an ECA, could help the Houston metropolitan region attain or main tain the current health-based federal clean air standard of 15µg/m3 for fine particulates.
19 PM2.5: http://www.epa.gov/oar/oaqps/greenbk/qnsum.html, web resource, last accessed Febru-ary 13, 2009. Ozone: http://www.epa.gov/oar/oaqps/greenbk/gnsum.html, web resource, last accessed February 13, 2009.
20 EPA press release: IMO Sets Sail for Global Action on Pollution from Large Ships, October 10,2008. http://yosemite.epa.gov/opa/admpress.nsf/0/24A02C8A96574D3F852574DE005B6308.
21 EPA Regulatory Update, “Frequently Asked Questions about the Emission Control Area Application Process,” EPA420-F-09-001; January 2009. http://www.epa.gov/otaq/regs/nonroad/marine/ci/420f09001.pdf.
22 Puget Sound Clean Air Agency, “Final Report: Puget Sound Air Toxics Evaluation,” October 2003. http://www.pscleanair.org/airq/basics/psate_final.pdf
23 South Coast Air Quality Management District, “Final Report: MATES III,” September 2008. http://www.aqmd.gov/prdas/matesIII/MATESIIIFinalReportSept2008.html
24 Krivoshto IN, Richards JR, Albertson TE, Derlet RW. 2008. The Toxicity of Diesel Exhaust: Implications for Primary Care. J Am Board Fam Med. 21:55– 62.
25 American Lung Association, Facts About Particle Pollution, April 2008. http://www.lungusa2 .org/sota/SOTA08__PMFacts.pdf.
26 Corbett JJ, Winebrake JJ, Green EH, Kasibhatla P, Eyring V, Lauer A. 2007. Mortality from Ship Emissions: A Global Assessment. Environ Sci Technol. 41:8512-8518
27 Corbett JJ, Winebrake JJ, Green EH, Kasibhatla P, Eyring V, Lauer A. 2007. Mortality from Ship Emissions: A Global Assessment. Environ Sci Technol. 41:8512-8518
28 Jerrett, M. et al. 2009. Long-term ozone exposure and mortality. N Engl J Med 360;11. Bell ML, Peng RD, Dominici F. 2006. The exposure-response curve for ozone and risk of mortality and the adequacy of current ozone regulations. Environ Health Perspect. 114(4):532-536. Bell ML, McDermott A, Zeger SL, Samet JM, Dominici F. 2004. Ozone and short-term mortality in 95 US urban communities, 1987-2000. JAMA. 292(19):2372-2378. Levy JI, Chemerynski SM, Sarnat JA. 2005. Ozone exposure and mortality: an empiric bayes metaregression analysis,” Epidemiol. 16(4):458-468.
29 http://www.epa.gov/acidrain/what/index.html, web resource, last accessed September 18, 200830 http://www.epa.gov/acidrain/effects/index.html, web resource, last accessed September 18, 200831 Regulating Greenhouse Gas Emissions Under the Clean Air Act; Proposed Rule ( July 30,
2008) 73 Fed. Reg. 44354 at 4446632 Ramanathan, V. and G. Carmichael (2008) Global and Regional Climate Changes due to Black
Carbon, Nature Geoscience. May be accessed online at: http://www-ramanathan.ucsd.edu/publications/Ram_Carmichael-NatGeo1-221.pdf
33 Lack, Daniel, et al. (2008) Light Absorbing Carbon Emissions from Commercial Shipping, Geophysical Research Letters, 35:L13815

11
Protecting American Health from Global Shipping Pollution
34 Ramanathan, V. and G. Carmichael (2008) Global and Regional Climate Changes due to Black Carbon, Nature Geoscience. May be accessed online at: http://www-ramanathan.ucsd.edu/publications/Ram_Carmichael-NatGeo1-221.pdf Lack, Daniel, et al. (2008) Light Absorbing Carbon Emissions from Commercial Shipping, Geophysical Research Letters, 35:L13815 Flanner, M. G., C. S. Zender, J. T. Randerson, and P. J. Rasch (2007), Present-day climate forcing and response from black carbon in snow, J. Geophys. Res., 112, D11202, doi:10.1029/2006JD008003.
35 Lack, Daniel, et al. (2008) Light Absorbing Carbon Emissions from Commercial Shipping, Geophysical Research Letters, 35:L13815
36 Lack, Daniel, et al. (2008) Light Absorbing Carbon Emissions from Commercial Shipping, Geophysical Research Letters, 35:L13815
37 http://www.epa.gov/pmdesignations/2006standards/documents/2008-12-22/factsheet.htm PM2.5: http://www.epa.gov/oar/oaqps/greenbk/qnsum.html, web resource, last accessed February 13, 2009
38 Ozone: http://www.epa.gov/oar/oaqps/greenbk/gnsum.html, web resource, last accessed February 13, 2009
39 Ozone: National Ambient Air Quality Standards for Ozone; Final Rule, published March 27, 2008. 73 Fed. Reg. 16436. May be accessed on the web at: http://www.epa.gov/fedrgstr/EPA-AIR/2008/March/Day-27/a5645.pdf, last accessed March 10, 2009. Particulate Matter: National Ambient Air Quality Standards for Particulate Matter; Final Rule, published October 17, 2006. 71 Fed. Reg. 61144. May be accessed on the web at: http://www.epa.gov/ttn/naaqs/standards/pm/data/fr20061017.pdf, last accessed March 10, 2009.
40 EPA press release: IMO Sets Sail for Global Action on Pollution from Large Ships, October 10, 2008. May be accessed online at http://yosemite.epa.gov/opa/admpress.nsf/0/24A02C8A96574D3F852574DE005B6308
41 EPA press release: IMO Sets Sail for Global Action on Pollution from Large Ships, October 10, 2008. May be accessed online at http://yosemite.epa.gov/opa/admpress.nsf/0/24A02C8A96574D3F852574DE005B6308


![The Merchant Shipping (Prevention of Pollution by …extwprlegs1.fao.org/docs/pdf/uk86171.pdf · [DfT 00134] STATUTORY INSTRUMENTS 2008 No. 3257 MARINE POLLUTION The Merchant Shipping](https://static.documents.pub/doc/80x56/5ae20e4e7f8b9a5b348bc7d0/the-merchant-shipping-prevention-of-pollution-by-dft-00134-statutory-instruments.jpg)

