Page 1
The Pennsylvania State University
The Graduate School
Department of Bioengineering
PROTEIN ADSORPTION TO HYDROPHOBIC SURFACES
A Thesis in
Bioengineering
by
Anandi Krishnan
© 2005 Anandi Krishnan
Submitted in Partial Fulfillment
of the Requirements
for the Degree of
Doctor of Philosophy
August 2005
Page 2
The thesis of Anandi Krishnan was reviewed and approved* by the following:
Erwin A. Vogler
Associate Professor of Materials Science & Engineering and Bioengineering
Thesis Advisor
Chair of Committee
Christopher A. Siedlecki
Assistant Professor of Surgery and Bioengineering
William O. Hancock
Assistant Professor of Bioengineering
David L. Allara
Professor of Chemistry
Kelly Brown
Senior Scientist, Johnson & Johnson
Center for Biomaterials and Advanced Technologies (CBAT)
Herbert H. Lipowsky
Professor of Bioengineering
Head of the Department of Bioengineering
*Signatures are on file in the Graduate School
Page 3
iii
ABSTRACT
Adsorption energetics of diverse purified proteins as well as whole-blood plasma and
serum (aqueous-buffer) solutions were remarkably similar at two hydrophobic surfaces – water-
air (liquid, vapor, LV) and solid-water (solid-liquid, SL). A ‘Traube-rule-like’ progression
(molar concentration required to reach a specified spreading pressure decreases with increasing
) was observed at both hydrophobic surfaces (LV and SL) for globular proteins spanning
three-orders-of-magnitude in molecular weight ( ). Collective results from the observed
‘Traube-rule-like’ progression in interfacial-tension reduction, an invariant partition coefficient ,
and a constant Gibbs’ surface excess (as a measure of amount of protein adsorbed) all imply that
water controls the energetics of the protein adsorption process. Hence, protein adsorption to
hydrophobic surfaces has more to do with water than the proteins themselves. A relatively
straightforward theory of protein adsorption predicated on the interfacial packing of hydrated
spherical molecules with dimensions scaling as a function of accounts for the essential
physical chemistry of protein adsorption and rationalizes significant experimental observations.
From this theory, it is evident that displacement of interfacial water by hydrated proteins
adsorbing from solution places an energetic cap on protein adsorption to hydrophobic surfaces.
This phenomenon is generic to all proteins. As a consequence, protein adsorption is not found to
vary significantly among diverse protein types. Variations from this general trend may reflect
deviations in protein geometry from simple spheres and/or tendency of some proteins to adopt a
more spread/compact configuration in the adsorbed state.
MW
MW
MW
Page 4
iv
TABLE OF CONTENTS
LIST OF TABLES vii
LIST OF FIGURES ix
Preface xiv
Acknowledgements xvii
Chapter 1 Scaled Interfacial Activity of Proteins at the Liquid-Vapor Interface 1
1.1 Introduction 2
1.2 Materials and Methods 5
1.3 Results and Discussion 9
1.4 Conclusions 23
Citations 26
Chapter 2 Traube-Rule Interpretation of Protein Adsorption at the Liquid-
Vapor Interface
40
2.1 Introduction 41
2.2 Materials and Methods 44
2.3 Theory 45
2.4 Results and Discussion 54
2.4.1 Experimental Results 54
2.4.2 Theoretical Interpretation of Results 58
2.5 Conclusions 62
2.6 Appendix 64
2.6.1 Estimation of CBmax 64
2.6.2 Estimation of parameters for Ubiquitin 65
2.6.3 Steady-state γlv as a function of MW and concentration 65
Citations 66
Chapter 3 Mixology of Protein Solutions and the Vroman Effect 87
3.1 Introduction 88
3.2 Materials and Methods 92
3.3 Theory 92
3.4 Results 97
3.5 Discussion 100
3.6 Conclusions 105
Citations 106
Chapter 4 Liquid-Vapor Interfacial Tension of Blood Plasma, Serum and
Purified Protein Constituents Thereof
120
4.1 Introduction 121
4.2 Materials and Methods 123
Page 5
v
4.3 Results 126
4.4 Discussion 128
4.5 Conclusions 133
Citations 135
145 Chapter 5 Scaled Interfacial Activity of Proteins at a Hydrophobic
Solid/Aqueous-Buffer Interface
5.1 Introduction 146
5.2 Materials and Methods 149
5.3 Results and Discussion 154
5.4 Conclusions 164
Citations 169
186 Chapter 6 Interfacial Energetics of Globular-Blood Protein Adsorption
to a Hydrophobic Solid/Aqueous-Buffer Interface
6.1 Introduction 187
6.2 Materials and Methods 190
6.3 Theory 195
6.4 Results 200
6.5 Discussion 207
6.6 Conclusions 212
6.7 Appendix 214
6.7.1 Estimation of CBmax 214
6.7.2 Estimation of ΓSL - ΓSV 215
6.7.3 Estimation of parameters for Ubiquitin and α2-macroglobulin 216
Citations 218
Chapter 7 An Evaluation of Methods for Contact Angle Measurement 241
7.1 Introduction 242
7.2 Materials and Methods 244
7.3 Results and Discussion 247
7.4 Conclusions 248
Citations 249
Page 6
vi
Chapter 8 Interfacial Energetics of Blood Plasma and Serum at a Hydrophobic
Solid/Aqueous-Buffer Interface
253
8.1 Introduction 254
8.2 Materials and Methods 256
8.3 Results 260
8.4 Discussion 262
8.5 Conclusions 265
Citations 266
Chapter 9 Energy and Mass Balance for Protein Adsorption to Hydrophobic
Surfaces from Aqueous-Buffer Solution
282
9.1 Introduction 282
9.2 Materials and Methods 285
9.3 Theory of Protein Adsorption 287
9.4 Results and Discussion 289
9.5 Conclusions 290
Citations 291
Page 7
vii
LIST OF TABLES
Chapter 1 Scaled Interfacial Activity of Proteins at the Liquid-Vapor Interface 1
Table 1 Purified Proteins, Protein Mixtures & Synthetic Surfactants 31
Table 2 Pendant-Drop Tensiometry (PDT) Liquid Vapor (LV) Interfacial
Activity Of Purified Protein Solutions
32
Table 3 Pendant-Drop Tensiometry(PDT) and Wilhelmy Balance
Tensiometry(WBT) of Proteins, Protein Mixtures and Synthetic
Surfactants
33
Chapter 2 Traube-Rule Interpretation of Protein Adsorption at the Liquid-
Vapor Interface
40
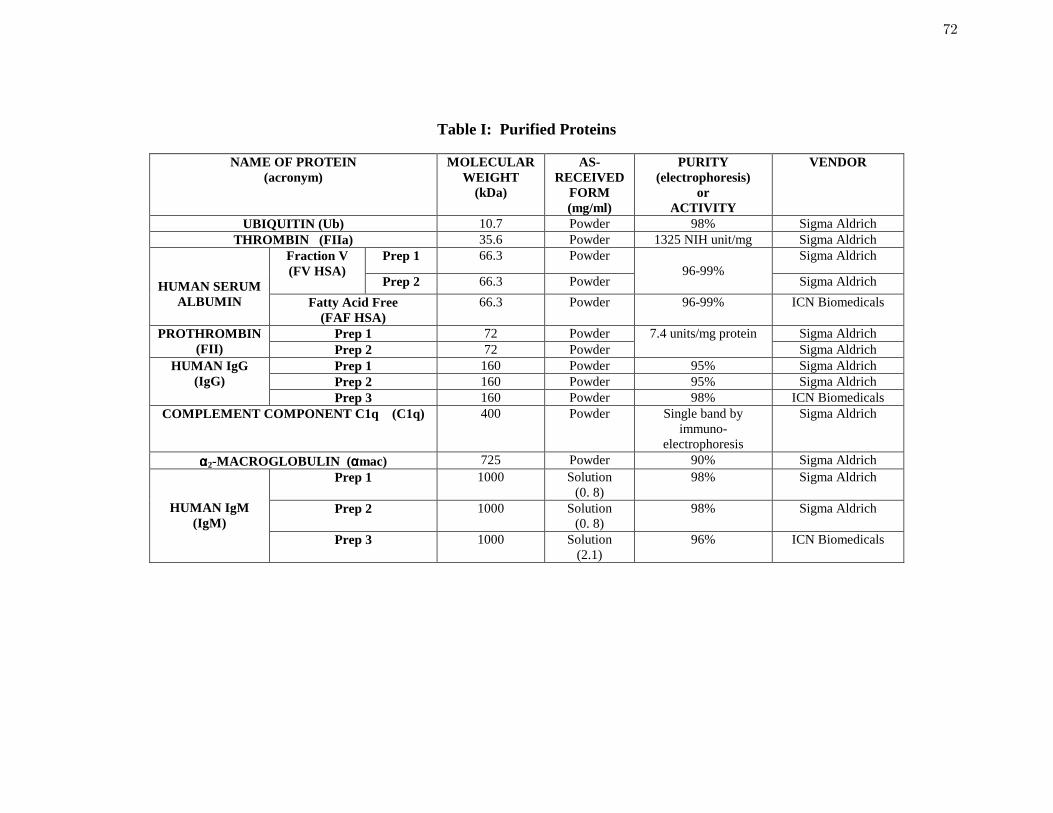
Table 1 Purified Proteins 72
Table 2 Steady-state Protein Parameters 73
Chapter 3 Mixology of Protein Solutions and the Vroman Effect 87
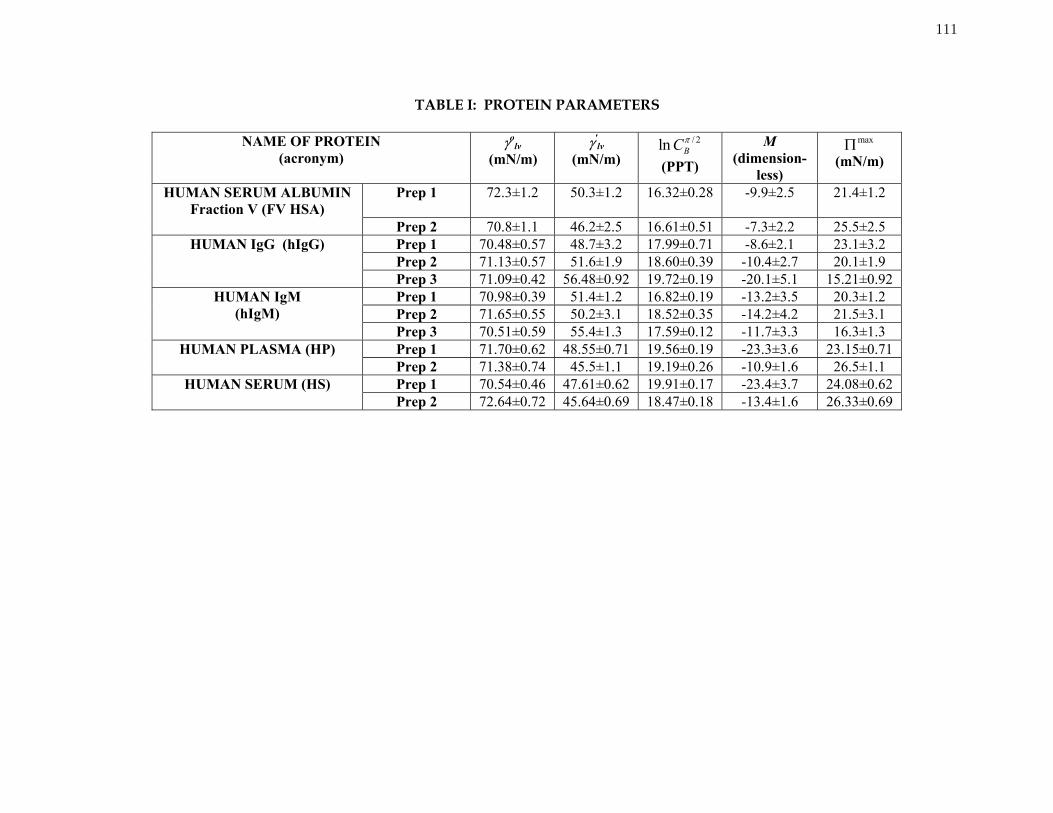
Table 1 Protein Parameters 111
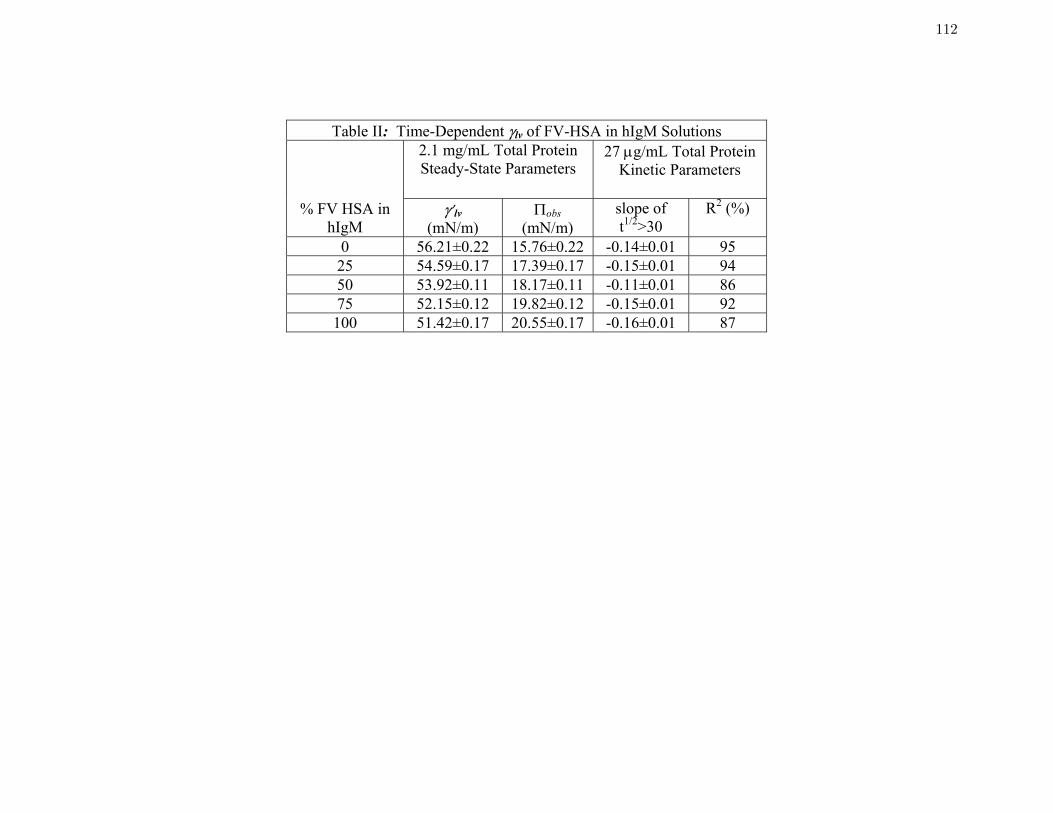
Table 2 Time-Dependent γlv of FV-HSA in hIgM Solutions 112
Chapter 4 Liquid-Vapor Interfacial Tension of Blood Plasma, Serum and Purified
Protein Constituents Thereof
120
Table 1 Comparison of Pendant-Drop Tensiometry (PDT) and Wilhelmy
Balance Tensiometry (WBT) of Purified Proteins and Protein Mixtures
138
Chapter 5 Scaled Interfacial Activity of Proteins at a Hydrophobic
Solid/Aqueous-Buffer Interface
145
Table 1 Purified Proteins and Surfactants 176
Table 2 Steady-state Protein Adsorption Parameters 177
Chapter 6 Interfacial Energetics of Globular-Blood Protein Adsorption
to a Hydrophobic Solid/Aqueous-Buffer Interface
186
Table 1 Purified Proteins and Surfactants 223
Table 2 Steady-state Protein Adsorption Parameters 224
Table 3 Gibbs’ Surface Excess 225
Page 8
viii
Chapter 7 An Evaluation of Methods for Contact Angle Measurement 233
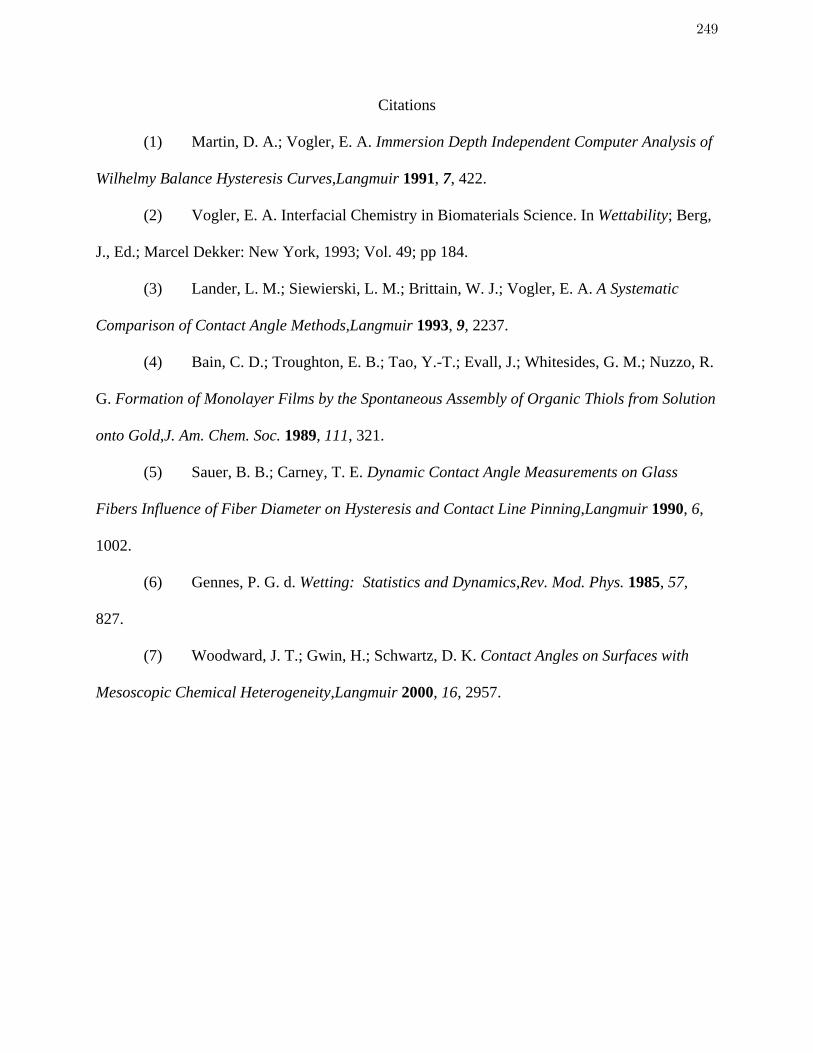
Table 1 Comparison Of Contact Angle Measurements by Tilting-Plate (TPG),
Captive-Drop Goniometry (CDG) and Wilhelmy-Balance Tensiometry
(WBT).
250
Chapter 8 Interfacial Energetics of Blood Plasma and Serum at a Hydrophobic
Solid/Aqueous-Buffer Interface
253
Table 1 Steady-state Plasma/Serum adsorption parameters 273
Chapter 9 Energy and Mass Balance for Protein Adsorption to Hydrophobic
Surfaces from Aqueous-Buffer Solution
282
Table 1 Interphase Protein-Water Inventory 295
Table 2 Mass Proportions of Protein and Water within the Interphase –
Theory and Experiment
296
Page 9
ix
LIST OF FIGURES
Chapter 1 Scaled Interfacial Activity of Proteins at the Liquid-Vapor Interface 1
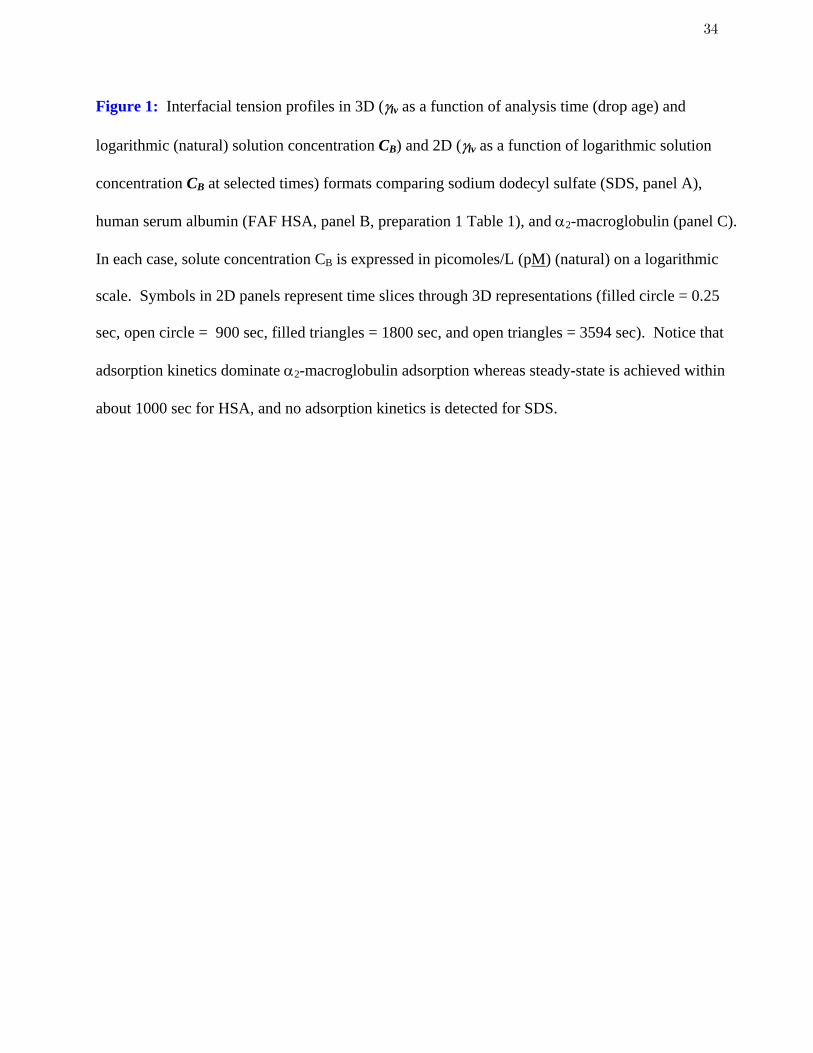
Figure 1 Interfacial tension profiles in 3D (γlv as a function of analysis time (drop
age) and logarithmic (natural) solution concentration CB) and 2D (γlv as
a function of logarithmic solution concentration CB at selected times)
formats comparing sodium dodecyl sulfate (SDS, panel A), human
serum albumin (FAF HSA, panel B, preparation 1 Table 1), and α2-
macroglobulin (panel C).
35
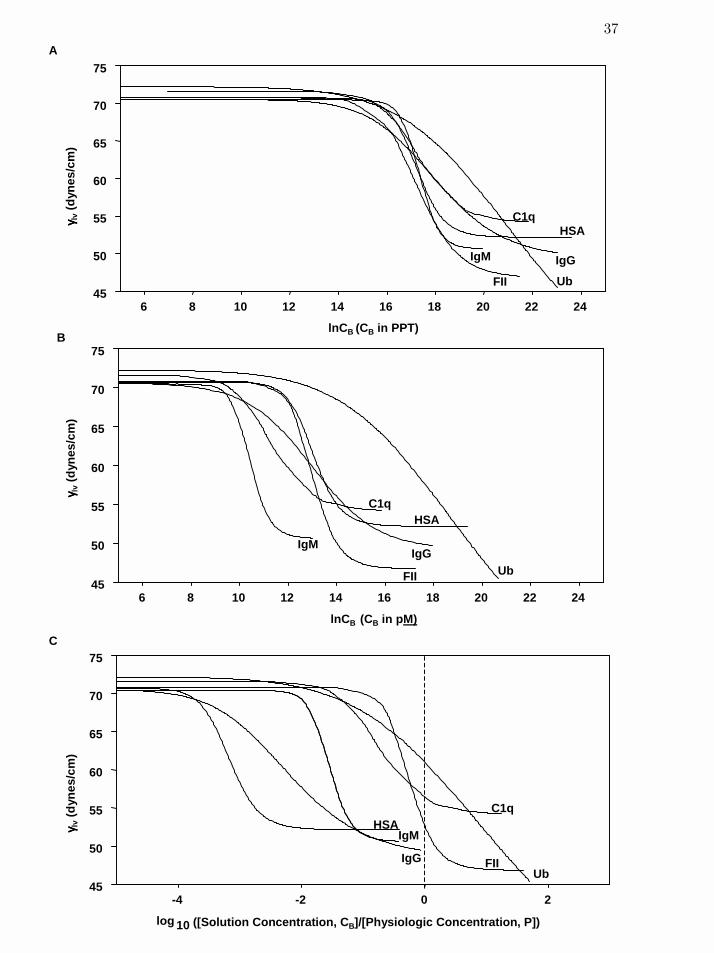
Figure 2 Concentration dependence of protein interfacial tension γlv scaled in
three different ways: by logarithmic (natural) weight-volume (panel A),
molarity (panel B), and logarithmic (base 10) ratio-to-physiological
concentration (panel C), for selected proteins spanning an order-of-
magnitude of molecular weight.
37
Figure 3 Interfacial activity of blood factors FXII (symbols, preparation 1 Table
1) and FXIIa (cross, preparation 2) solutions with concentration scaled
as a ratio-to-physiological concentration.
39
Chapter 2 Traube-Rule Interpretation of Protein Adsorption at the Liquid-Vapor
Interface
40
Figure 1 Interfacial tension profiles in 3D (γlv as a function of analysis time (drop
age) and logarithmic (natural) solution concentration CB) and 2D (γlv as
a function of logarithmic solution concentration CB at selected times)
formats comparing Aerosol-OT (AOT, panel A), human serum albumin
(FAF HSA, panel B), and human immunoglobulin-M (IgM, panel C,
Table 1).
75
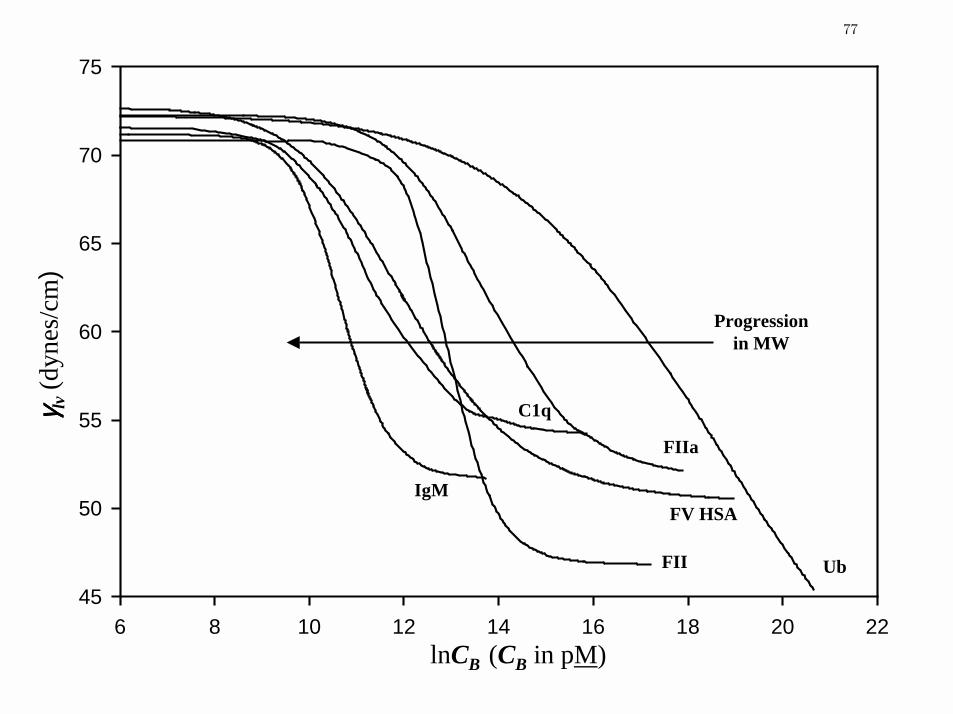
Figure 2 Comparison of steady-state, concentration-dependent γlv for proteins
selected from Table 1 spanning three decades in MW.
77
Figure 3 Apparent Gibbs’ surface excess Γ as a function of protein MW
calculated from concentration-dependent γlv for multiple preparations of
proteins as listed in Table 1.
79
Figure 4 Relationship between the surface-saturating bulk solution concentration
CBmax and protein MW.
81
Page 10
x
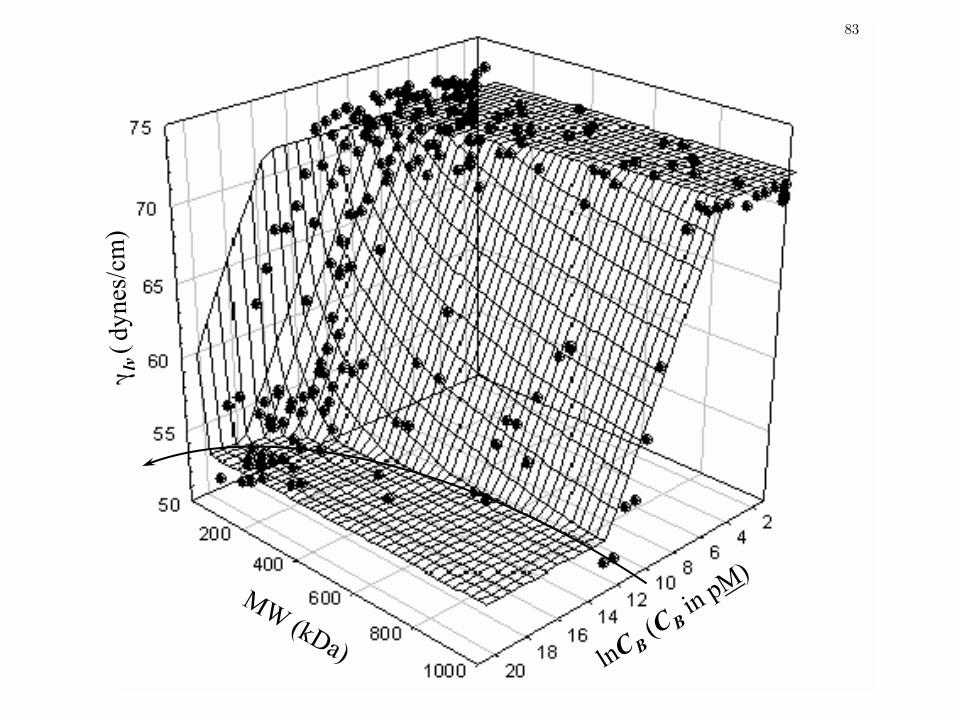
Figure 5 Traube-rule-like dependence of concentration-dependent γlv for proteins
selected from Table 1 spanning three decades in MW
83
Figure 6 Monotonic increase in interphase thickness with protein molecular 85
Chapter 3 Mixology of Protein Solutions and the Vroman Effect 87
Figure 1 Interfacial tension profiles in 3D (γlv as a function of analysis time (drop
age) and logarithmic (natural) solution concentration ) and 2D (γBC lv
as a function of logarithmic solution concentration at selected times)
formats comparing (human) immunoglobulin-G (hIgG, panel A,
preparation 1, Table 1), plasma (HP, panel B, preparation 1, Table 1),
and serum (HS, panel C, preparation 1, Table 1).
BC
114
Figure 2 Comparison of steady-state, concentration-dependent lvγ data for
(human) plasma (HP, preparation 2, Table 1), serum (HS, preparation
2, Table 1), and IgG (hIgG, preparation 3, Table 1) on a single
concentration axis, showing that protein mixtures cannot be confidently
distinguished from a purified protein.
116
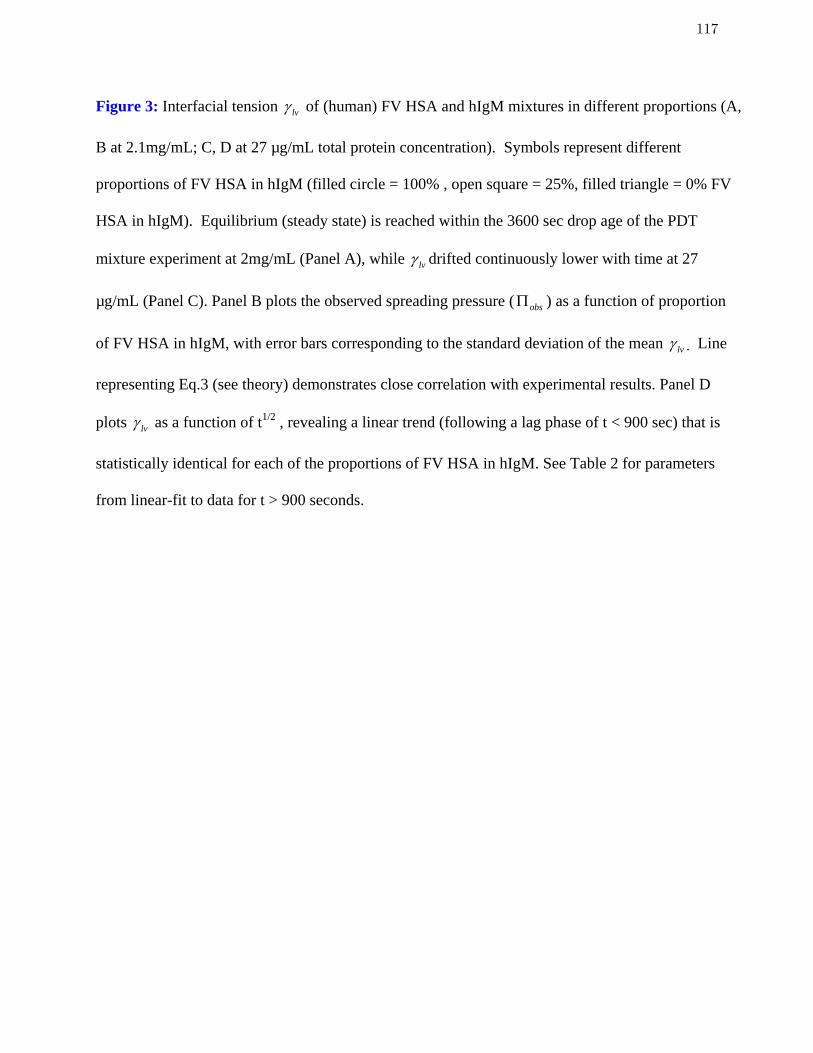
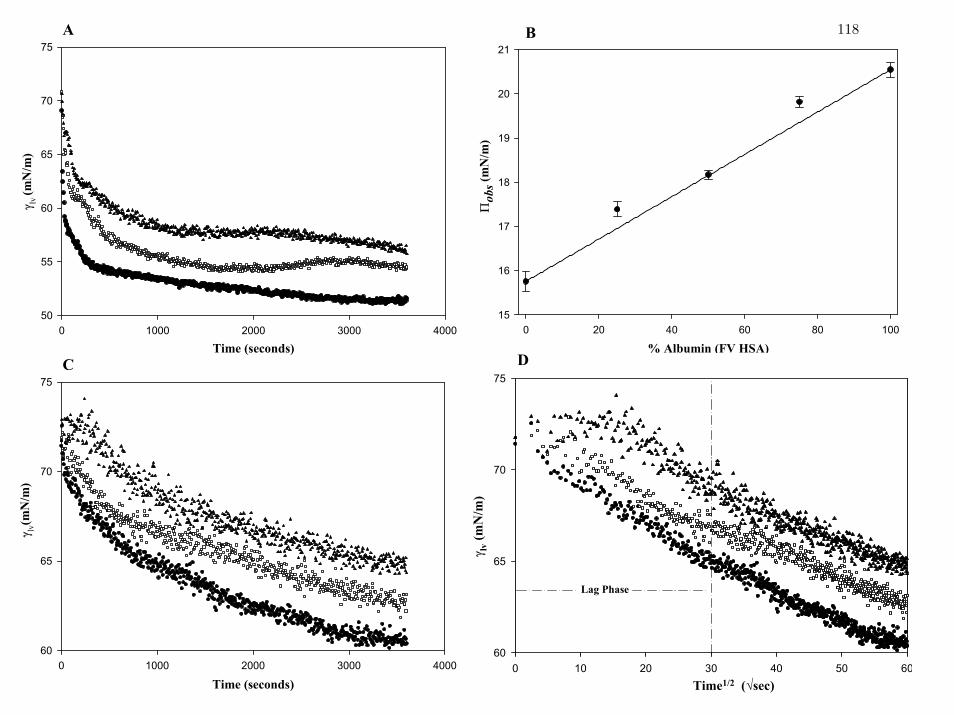
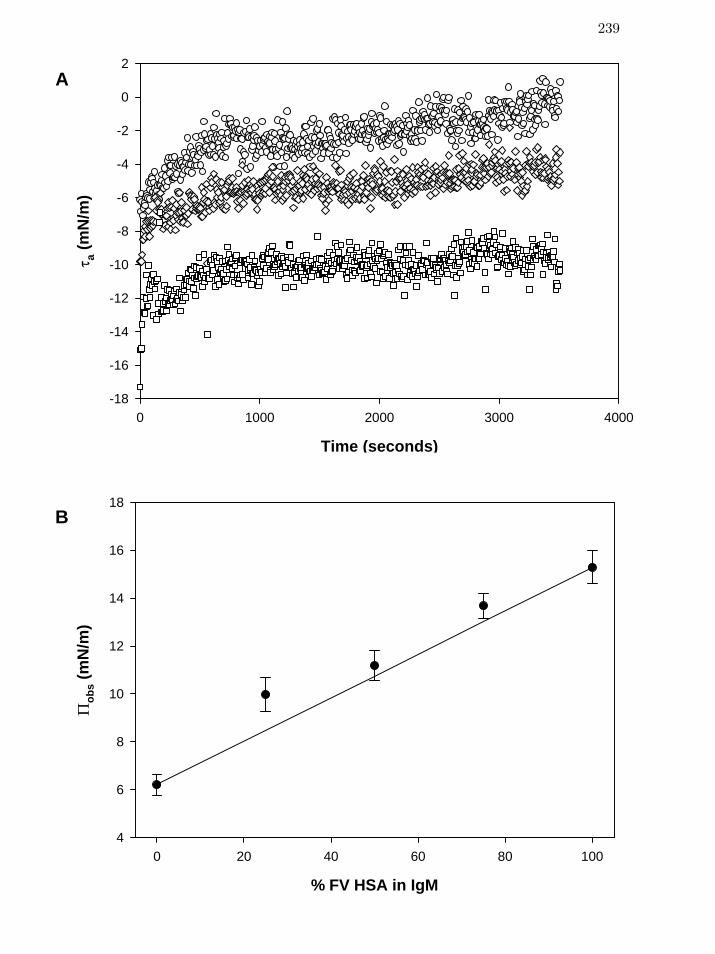
Figure 3 Interfacial tension lvγ of (human) FV HSA and hIgM mixtures in
different proportions (A, B at 2.1mg/mL; C, D at 27 µg/mL total
protein concentration).
118
Chapter 4 Liquid-Vapor Interfacial Tension of Blood Plasma, Serum and Purified
Protein Constituents Thereof
120
Figure 1 Interfacial tension profiles in 3D (lv
γ as a function of analysis time (drop
age) and logarithmic (natural) solution concentration ) and 2D (BClv
γ as
a function of logarithmic solution concentration at selected times)
formats comparing human (HS, panel A, preparation 2, Table I), ovine
(OS, panel B), and equine (ES, panel C) serum.
BC
140
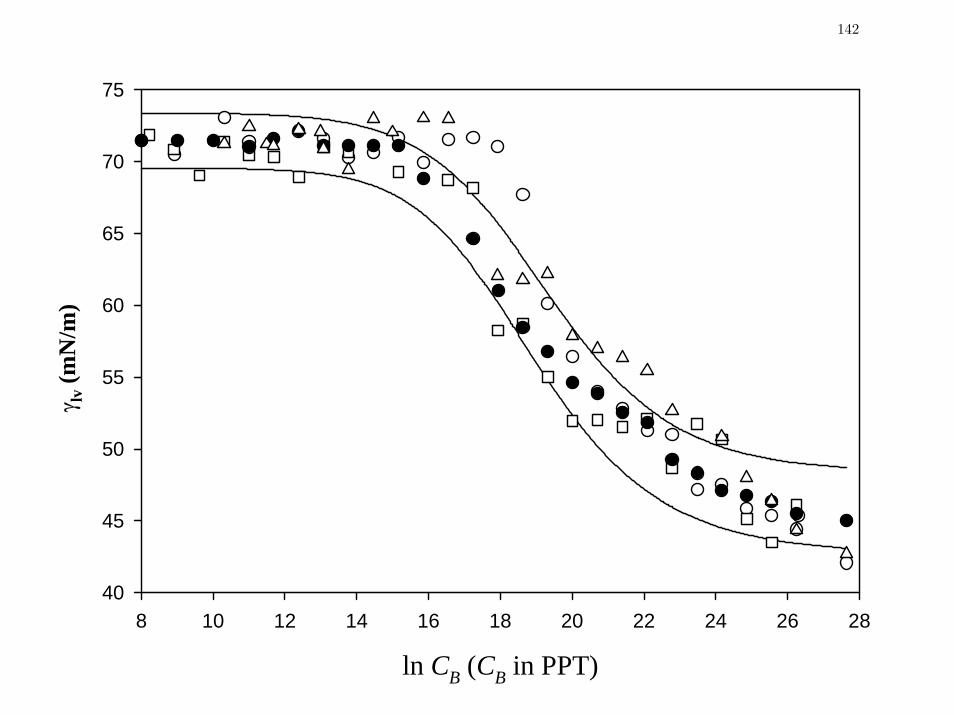
Figure 2 Comparison of steady-state, concentration-dependent lv
γ data for human
(HP, filled circle, preparation 2, Table I), ovine (OP, open circle),
equine (EP, open square) and bovine (BP, open triangle) plasma on a
single concentration axis.
142
Page 11
xi
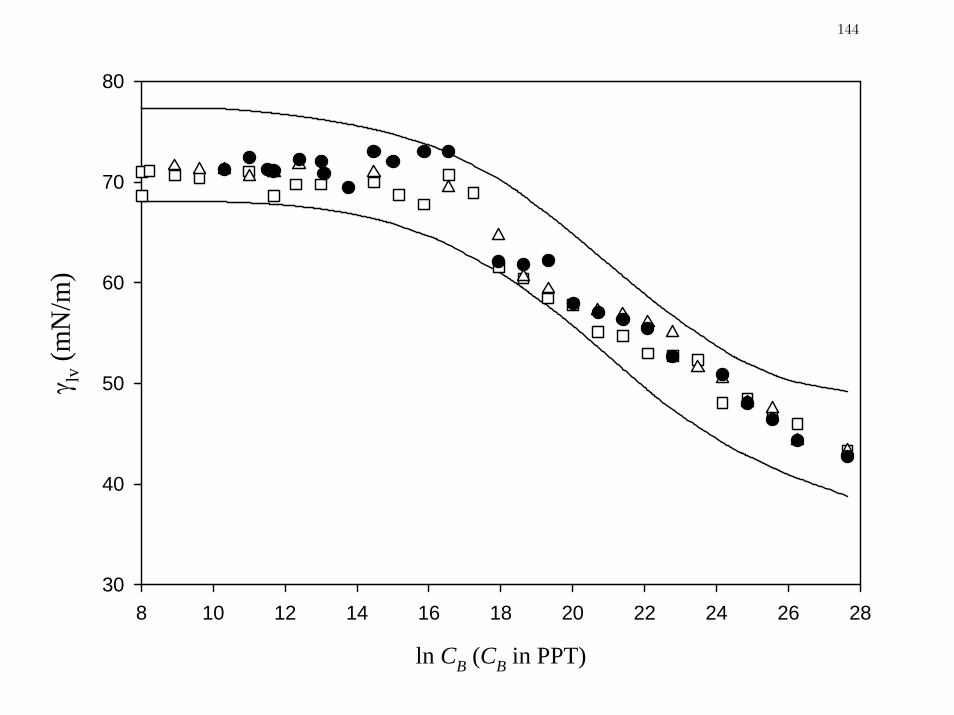
Figure 3 Comparison of steady-state (t = 3600 sec), concentration-dependent
lvγ data for bovine plasma collected at different ages.
144
Chapter 5 Scaled Interfacial Activity of Proteins at a Hydrophobic Solid/Aqueous-
Buffer Interface
145
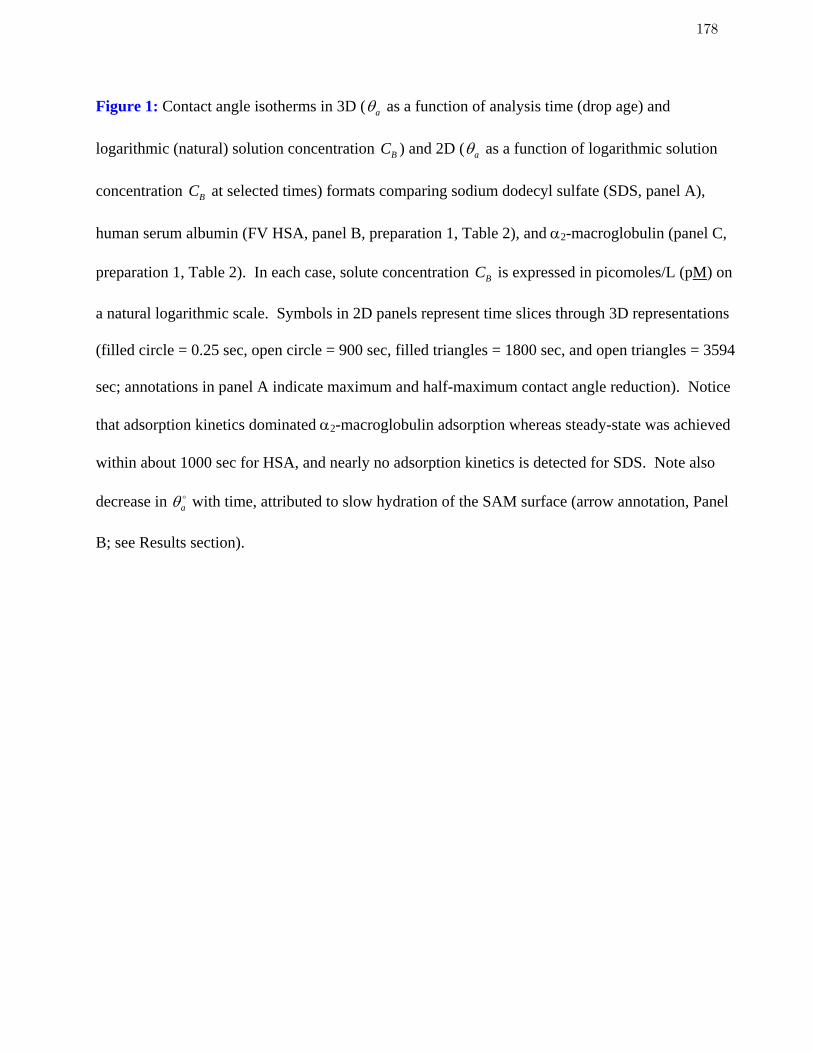
Figure 1 Contact angle isotherms in 3D ( aθ as a function of analysis time (drop
age) and logarithmic (natural) solution concentration ) and 2D (BC aθ
as a function of logarithmic solution concentration at selected times)
formats comparing sodium dodecyl sulfate (SDS, panel A), human
serum albumin (FV HSA, panel B, preparation 1, Table 2), and α
BC
2-
macroglobulin (panel C, preparation 1, Table 2).
179
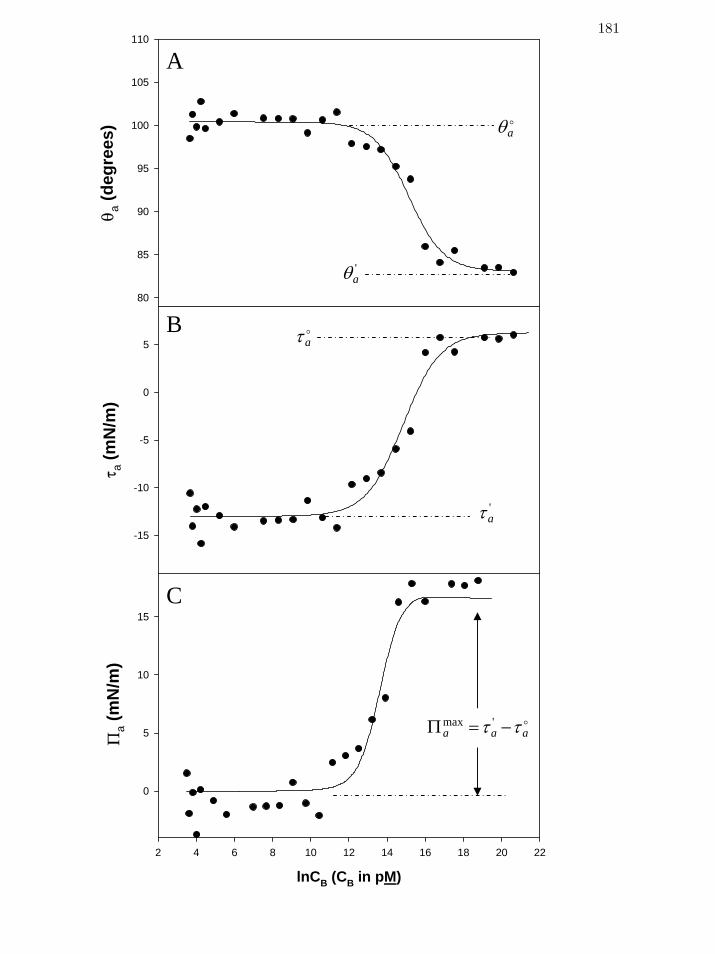
Figure 2 Sequential interpretation of a steady-state (3600 sec drop age) contact
angle adsorption isotherm for thrombin (FIIa) - Panel A, advancing
contact angles, aθ ; panel B, advancing adhesion tension, aτ ; panel C,
advancing spreading pressure aΠ .
181
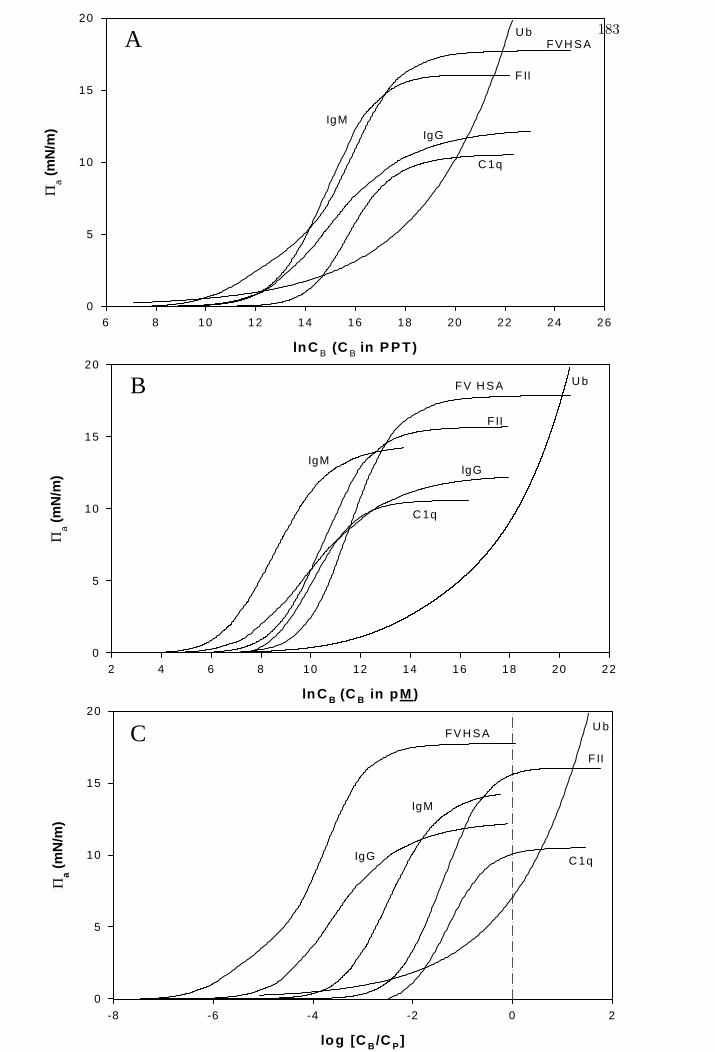
Figure 3 Spreading pressure isotherms scaled three different ways for selected
proteins spanning three decades in molecular weight – by natural
logarithmic weight-volume (panel A), picomolarity (panel B), and
logarithmic (base 10) ratio-to-physiological concentration (panel C).
aΠ 183
Figure 4 Spreading pressure isotherms of blood factor FXII (preparation 1,
Table 1), scaled as a ratio-to-physiological concentration. aΠ 185
Chapter 6 Interfacial Energetics of Globular-Blood Protein Adsorption
to a Hydrophobic Solid/Aqueous-Buffer Interface
186
Figure 1 Advancing contact angle isotherms in 3D ( aθ as a function of analysis
time (drop age) and logarithmic (natural) solution concentration )
and 2D (BC
aθ as a function of logarithmic solution concentration at
selected times) formats comparing Tween-20 (Panel A ,TWEEN-20,
Table 2), prothrombin (Panel B, FII, Table 2), and immunoglobulin-M
(Panel C, IgM, preparation 2, Table 2) adsorption to a methyl-
terminated SAM surface.
BC
227
Page 12
xii
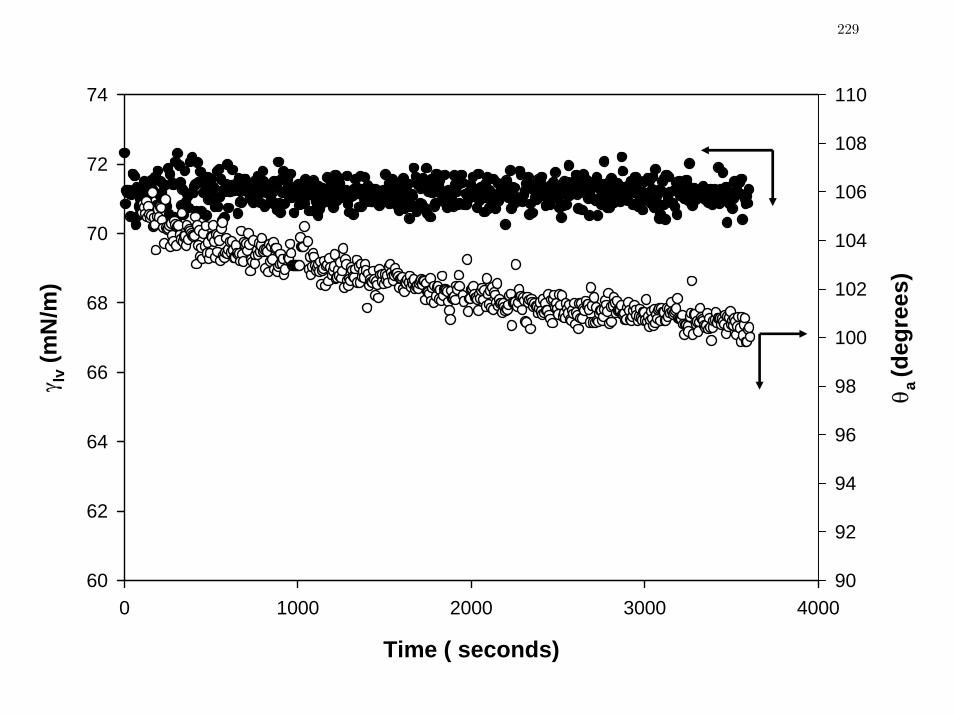
Figure 2 Advancing PBS contact angles oaθ (left axis, closed circles) on 1-
hexadecane thiol SAMs on gold decrease monotonically with observation
time while liquid-vapor interfacial tension, lvγ (right axis, open circles)
remains constant, suggesting time-dependent “hydration” of the SAM
surface.
229
Figure 3 Sequential interpretation of a steady-state (3600 sec drop age) contact
angle adsorption isotherm for human serum albumin (FV HSA,
preparation 2, Table 2)
231
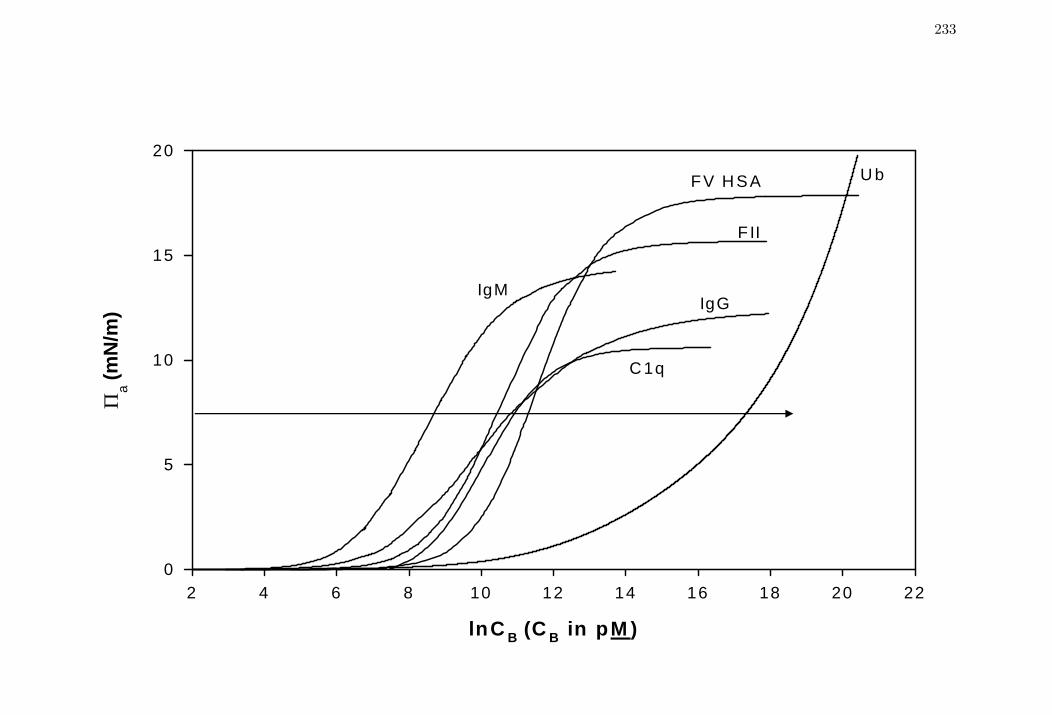
Figure 4 Comparison of steady-state spreading pressure aΠ isotherms for
selected proteins spanning three decades in molecular weight (Table 1).
233
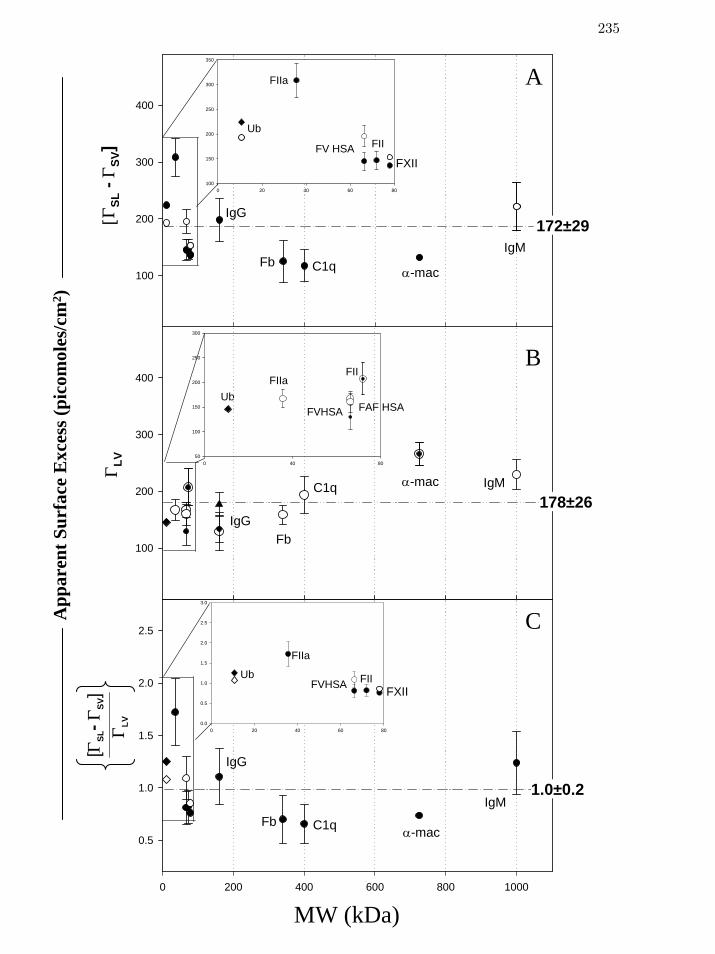
Figure 5 Apparent Gibbs’ surface excess scaled by protein at the solid-
liquid (SL) ([MW
]sl svΓ − Γ , panel A) and the liquid-vapor (LV) interfaces
( , panel B) for multiple protein preparations. lvΓ
235
Figure 6 Relationship between the surface-saturating bulk solution concentration
and protein (natural logarithmic scale) at the solid-liquid
(SL, panel A) and liquid-vapor interfaces (LV, panel B) for multiple
protein preparations.
maxBC MW
237
Figure 7 Time-dependent adhesion tension aτ (Panel A) of pure albumin
(circles), pure hIgM (squares), and a 50:50 mixture of albumin in hIgM
(diamonds) at constant 5mg/mL total protein.
239
Chapter 7 An Evaluation of Methods for Contact Angle Measurement 241
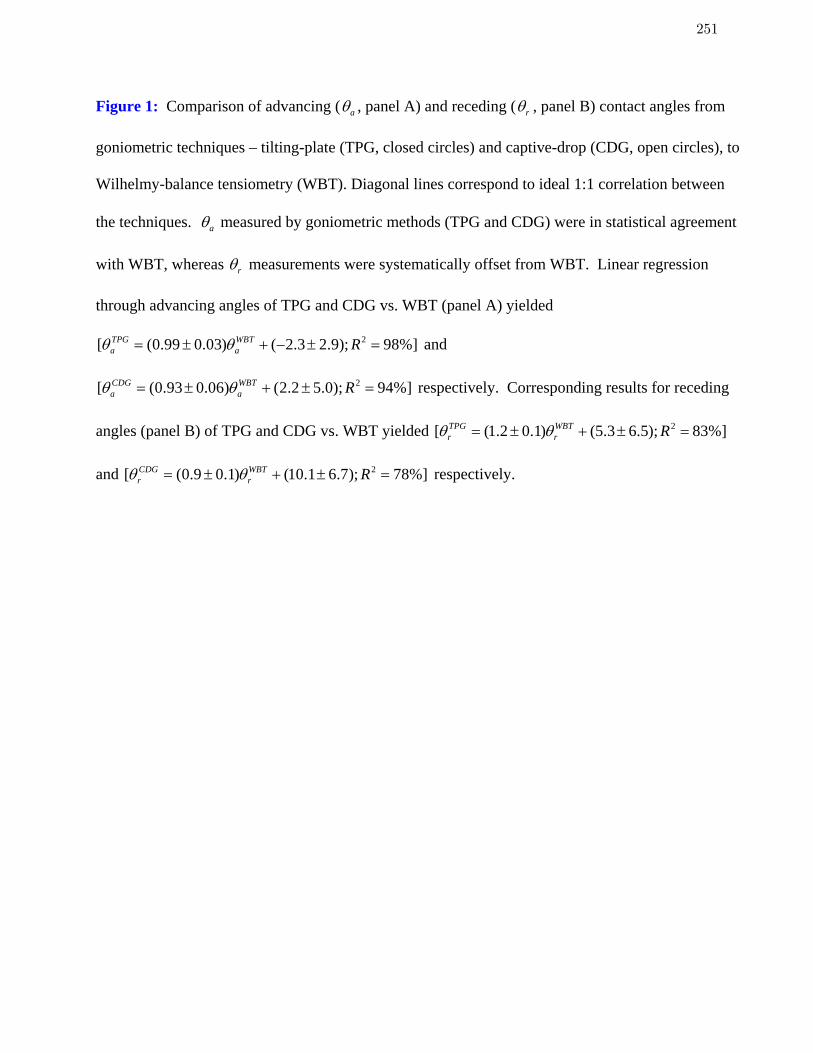
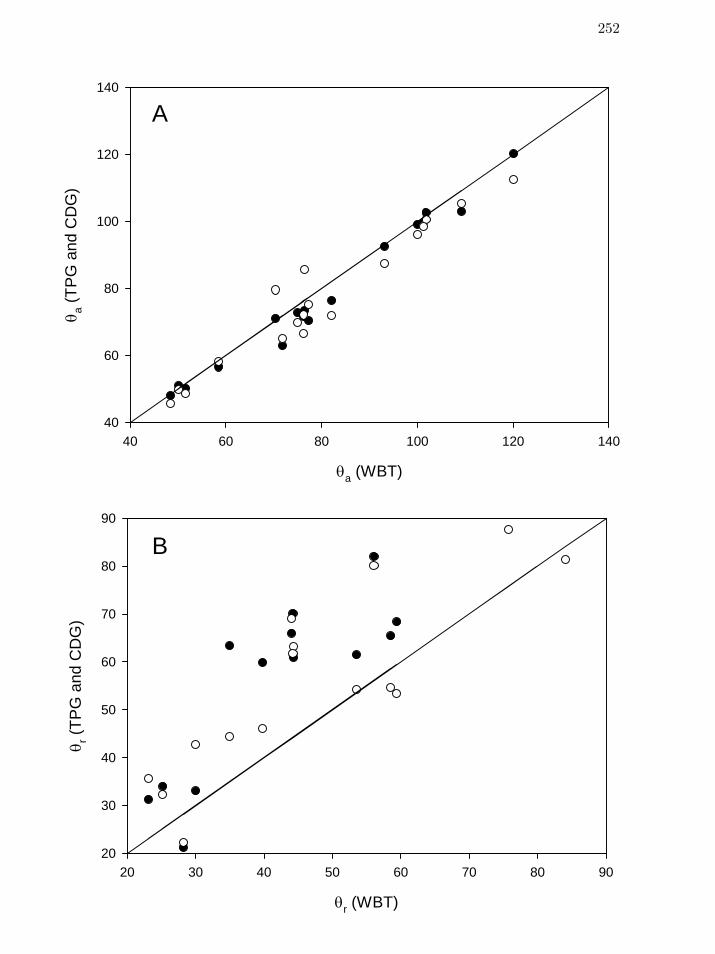
Figure 1 Comparison of advancing ( aθ , panel A) and receding ( rθ , panel B)
contact angles from goniometric techniques – tilting-plate (TPG, closed
circles) and captive-drop (CDG, open circles), to Wilhelmy-balance
tensiometry (WBT).
252
Page 13
xiii
Chapter 8 Interfacial Energetics of Blood Plasma and Serum at a Hydrophobic
Solid/Aqueous-Buffer Interface
253
Figure 1 Advancing contact angle isotherms in 3D ( aθ as a function of analysis
time (drop age) and logarithmic (natural) solution concentration )
and 2D (BC
aθ as a function of logarithmic solution concentration at
selected times) formats comparing human (HS, panel A, Table 1), ovine
(OS, panel B), and equine (ES, panel C) serum.
BC
275
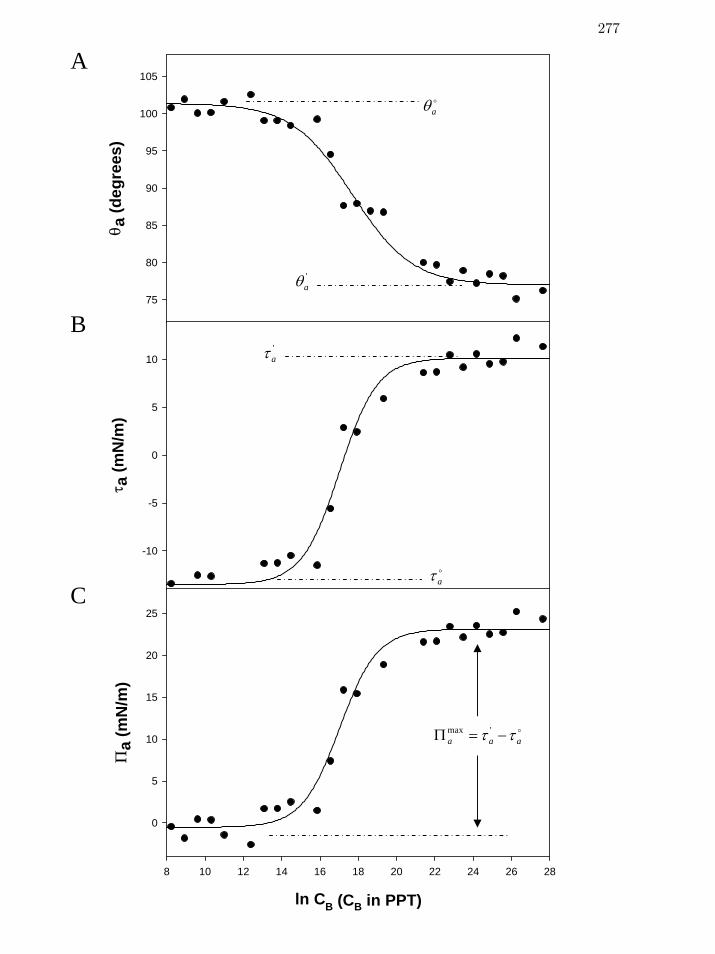
Figure 2 Sequential interpretation of a steady-state (3600 sec drop age) contact
angle adsorption isotherm for human serum (HS, Table 1); Panel A,
advancing contact angles, aθ ; Panel B, advancing adhesion tension, aτ ;
Panel C, advancing spreading pressure aΠ .
277
Figure 3 Comparison of steady-state, concentration-dependent aΠ (panel A) as
well as lvγ (panel B) data for (human) plasma (HP, Table 1), serum
(HS), and IgG (hIgG) on a single concentration axis, showing that
protein mixtures cannot be confidently distinguished from a purified
protein at two hydrophobic surfaces.
279
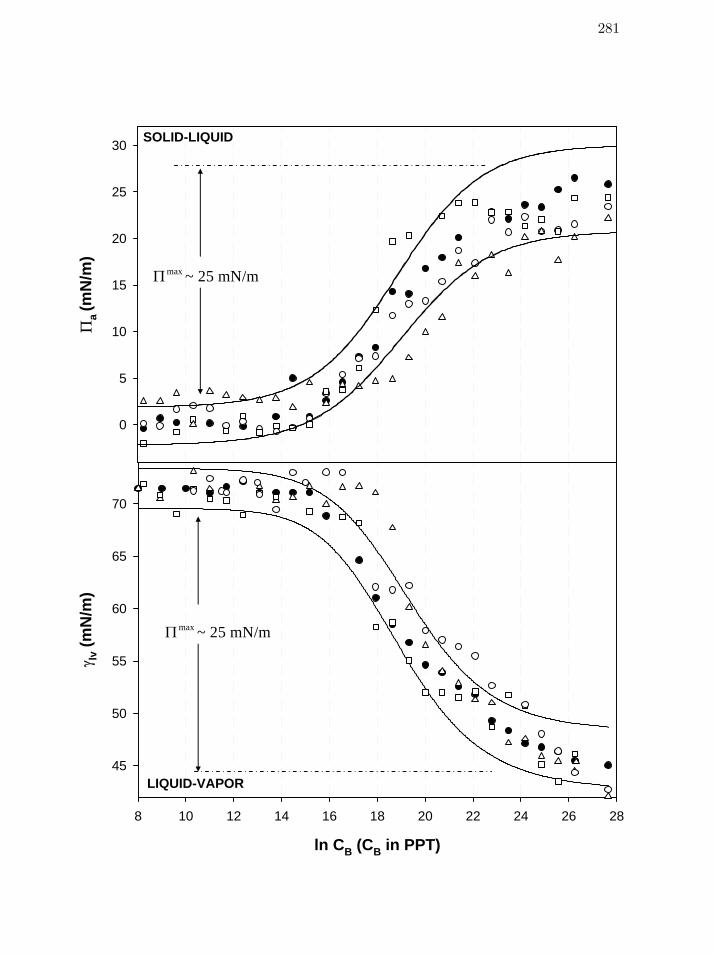
Figure 4 Comparison of steady-state, concentration-dependent aΠ (panel A) as
well as lvγ data for human (HP, filled circle, Table 1), ovine (OP, open
triangle), equine (EP, open square) and bovine (BP, open circle) plasma
on a single concentration axis.
281
Chapter 9 Energy and Mass Balance for Protein Adsorption to Hydrophobic
Surfaces from Aqueous-Buffer Solution
282
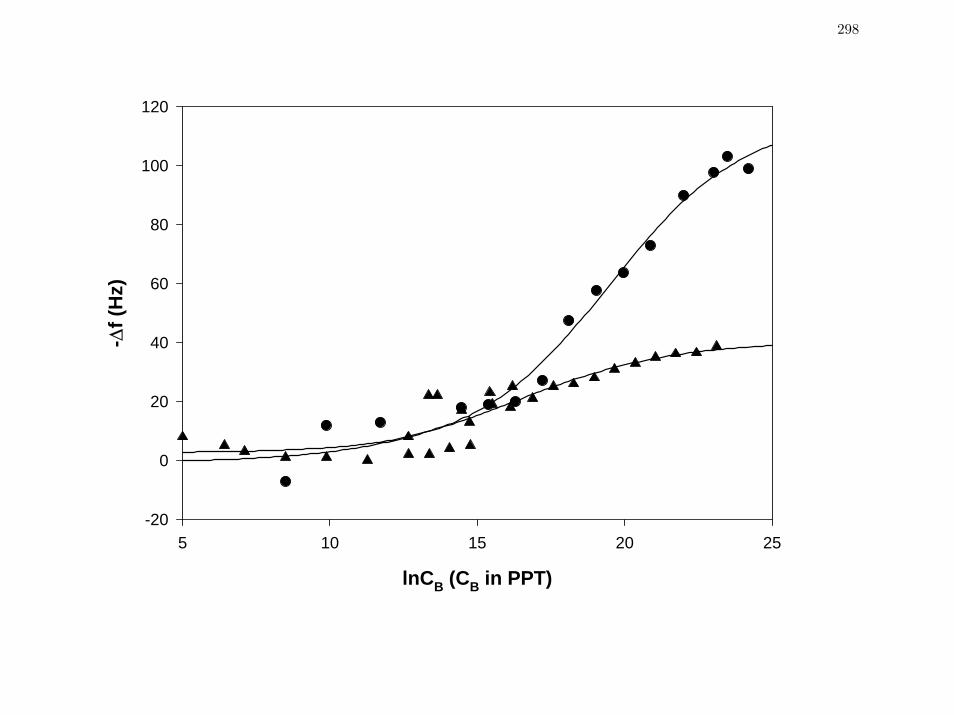
Figure 1 Comparison of resonance frequency shift ( f∆ ) for two purified proteins
FV HSA (MW=66.3kDa, closed triangles) and IgG (MW= 160kDa,
closed circles) measured from quartz crystal microbalance.
298
Figure 2 Comparison of adsorption isotherms from QCM (resonance frequency
shift, , open circles) with goniometry (spreading pressure, , closed
circles) for albumin (FV HSA).
f∆ aΠ
300
Page 14
xiv
Preface
Protein adsorption addresses an area of study that virtually defines the field of
biomaterials surface science. The theme of proteins at interfaces has dominated the biomaterials
literature for decades. Adsorption of plasma proteins is widely believed to be one of the first and
instantaneous biological responses to a biomaterial surface in contact with blood that in turn
dictates end-use biocompatibility. Exactly how these molecular-scale events transpiring at
hydrated surfaces potentiate macroscopic outcomes such as blood coagulation, cell adhesion, or
immune responses is generally understood only at the level of descriptive biochemistry. Work
accomplished and outlined in this thesis focuses on a comprehensive understanding of the
phenomenon of protein adsorption and is devoted to developing concise biophysical laws that
guide design and synthesis of biomaterials widely used in medicine. Although these biophysical
laws are most efficiently written in the stilted parlance of physical chemistry and tested using
techniques of modern surface science/engineering, significant outcomes of this work hold
considerable promise for widespread, practical bioengineering utility because of the fundamental
nature of protein adsorption to medical-device performance.
Detailed results are presented in the following nine chapters, each of distinct journal
article format. The underlying message from the work extends novel insights to biomaterials
literature, challenging conventional wisdom about protein-surface selection and interfacial
behavior. Primary purpose of this thesis has been to understand and interpret plasma-protein
adsorption to hydrophobic surfaces in a systematic, organized fashion using principles of
interfacial energetics (tensiometry and wettability).
Page 15
xv
The first chapter reviews current literature, including the fundamentals tenets of
selectivity and specificity in protein adsorption to varied biomaterial surfaces; and introduces our
results from time-and-concentration-dependent liquid-vapor (LV) interfacial tension lvγ of a
variety of purified proteins ranging from albumin to ubiquitin spanning nearly three decades in
molecular weight (MW), especially focusing on proteins of the blood-plasma coagulation
cascade. The second develops a comprehensive theory of protein adsorption based on simple
sphere-packing of protein molecules within a three-dimensional interphase and interprets scaling
relationships introduced in Chapter 1. Though much has been accomplished in Chapters 1-2 for
purified proteins at a model hydrophobic surface, adsorption of proteins from multi-protein
mixtures is of more practical relevance to biomaterials. This is addressed in Chapters 3-4 using
binary protein mixtures as well as whole-blood-plasma and serum at the LV surface. Chapter 3
also extends the theory of protein adsorption from purified proteins to protein mixtures, revealing
mixing rules that describe how individual proteins comprising a mixture compete for space at a
surface in the adsorption process. Chapter 4 applies these mixing rules of competitive protein
adsorption to a systematic survey of concentration-dependent lvγ of blood plasma and serum
derived from human and animal species. Results from chapters 1-4 probing molecular details of
protein adsorption strongly implicate water as a moderating or mediating agent. Chapters 5-9
continue to pursue this water-oriented perspective of protein adsorption at a solid-water
hydrophobic surface (solid-liquid, SL) for the same span of purified proteins and protein
mixtures studied at the LV surface. Remarkably similar adsorption energetics is revealed at two
hydrophobic surfaces for solutions of purified proteins as well as multi-protein mixtures.
Page 16
xvi
Similarity in results between the two surfaces permits equal application of the theory of
protein adsorption, thus accommodating significant experimental observations from interfacial
energetics. Chapter 9 is unique in that it tests the utility of the sphere-packing model of protein
adsorption (derived from interfacial energetics) as a tool in predicting adsorbed protein mass
from a complementary experimental technique – quartz crystal microbalance.
Thus, the work is simply, a systematic investigation combining modern surface-science
experimental methods and biophysical theory that reveals important biophysical rules of protein
adsorption to material surfaces. This thesis constitutes first steps towards achieving a complete
mass and energy inventory necessary for a comprehensive understanding of the protein
adsorption process. In the course of the next nine chapters, I shall endeavor to give a detailed
understanding of my doctoral research on protein adsorption to hydrophobic surfaces.
Page 17
xvii
ACKNOWLEDGEMENTS
This thesis reflects unwavering help and guidance from Dr Vogler. I am grateful to him
for this opportunity, first handed to me when all I could offer was a simple sense of enthusiasm
and commitment to education. Dr Vogler has carefully walked me through different facets of
science and graduate school and life, for that matter – thus bringing me to this day – when I can
say – thank you. The wholesome experience of graduate education at Penn State under
Dr. Vogler’s tutelage has shaped the person I am today, and will remain the best years of my life.
I would also like to extend my gratitude to my thesis-committee members - Dr. Siedlecki,
Dr. Hancock, Dr. Allara and Dr. Brown for helpful suggestions, criticisms and constant
encouragement. I am equally thankful to Dr. Lipowsky for being available for me during many
of my confused periods throughout graduate school. This work was initiated as an
undergraduate research project by Jackie Sturgeon, whom I wish to thank for all her help with
facilitating a smooth transition.
Very special thanks to Ivy Liu who readily made many of the thiol-self-assembled
monolayer surfaces and quartz-crystal microbalance measurements crucial to this thesis. Thanks
are also due to Karen Bussard who carefully prepared and shipped our human plasma and serum
samples at short notice, from Dr. Siedlecki’s lab at Hershey Medical Center. I have been
fortunate that my tensiometric instrument was always responsive to my demands and hence, I
wish to thank Dr. Roger Woodward for instrument design and implementation. Paul Cha, my
fellow researcher, with his sweet and sometimes, playful temper made long hours in the lab a
Page 18
xviii
joyful experience. Andrea, my sometime lab-mate and Hyeran, my colleague always enjoyed
spending their energies in injecting some fun into my work life.
My thesis project as well as my graduate stipend was supported, in part, by the National
Institutes of Health and by Johnson & Johnson through the prestigious Focused Giving Grant
Program. The department of materials science and engineering has played a special role in
hosting and providing a supportive environment throughout my graduate studies. I would like to
thank everyone in the department and Dr. Messing, the Head of the Department in particular, for
the support.
There are a handful of people whose life’s sole ambition was to see me reach my doctoral
degree. My father – who always stashed some money away so I could study in the United States,
my mother – who constantly pushed me to look beyond the pressures of daily life and reach
higher and vi – my husband – who stayed calm through days and nights of trouble and joy.
No measure of thanks will cover what I owe them today.
Page 19
Chapter 1
Scaled Interfacial Activity of Proteins at the Liquid-Vapor Interface
Abstract
A principal conclusion drawn from observations of time- and concentration-dependent liquid-vapor (LV)
interfacial tension γlv of a diverse selection of proteins ranging from albumin to ubiquitin spanning nearly
three decades in molecular weight (MW) is that concentration scaling substantially alters perception of
protein interfacial activity as measured by reduction in γlv. Proteins appear more similar than dissimilar on
a weight/volume basis whereas molarity scaling reveals a “Traube-rule” ordering by MW, suggesting that
adsorption is substantially driven by solution concentration rather than diversity in protein amphilicity.
Scaling as a ratio-to-physiological-concentration demonstrates that certain proteins exhibit the full
possible range of interfacial activity at-and-well-below physiological concentration whereas others are
only weakly surface active within this range, requiring substantially higher solution concentration to
achieve reduction in γlv. Important among this latter category of proteins are the blood factors XII and
XIIa, assumed by the classical biochemical mechanism of plasma coagulation to be highly surface active,
even in the presence of overwhelming concentrations of other blood constituents such as albumin and
immunoglobulin that are shown by this work to be among the class of highly-surface-active proteins at
physiologic concentration. A comparison of pendant drop and Wilhelmy balance tensiometry as tools for
assessing protein interfacial activity shows that measurement conditions employed in the typical
Wilhelmy plate approach fails to achieve the steady-state adsorption condition that is accessible to
pendant drop tensiometry.
1
Page 20
1.1. Introduction
A working hypothesis that has emerged as a fundamental biomaterials-surface-science tenet from
more than three decades of research is that protein adsorption is the first step in the biological
response to materials. With this simple yet powerful doctrine, the full panoply of macroscopic
biological outcomes observed when a material is brought into contact with different biological
milieu (the in vitro or in vivo biological response) is qualitatively explained as originating in
preferential adsorption of protein(s) to a material surface, typically leading to the expression of
epitope(s) that potentiate different biochemical reactions. The list of supporting examples is
quite comprehensive;1 and include blood coagulation (contact activation by blood factor XII
and/or stimulation of platelets by adsorbed fibrinogen), cell adhesion (membrane-bound
receptors to adsorbed adhesins), complement activation (contact activation of blood factor C3),
haptotaxis (cell migration along an adsorbed gradient of cytostimulating agent); to name but a
few from many. This overarching tenet asserts that the biological response to materials
originates in molecular-scale processes occurring directly on, or at least vicinal to, hydrated
material surfaces.
Protein adsorption can influence the biological response in at least two general but not entirely
independent ways. First, as briefly mentioned above, adsorbed protein can expose receptors or
ligands thereto and participate in one or more of the myriad “lock-and-key” biochemical
reactions, especially those involved in signal transduction.2 In these circumstances, a rather
small amount of adsorbed protein can induce disproportionate effects, amplified by cascade-type
reactions so familiar in modern molecular physiology (a little can do a lot). The second way has
to do with interfacial energetics which is quite distinct from the aforementioned in that interfacial
2
Page 21
energetics are not directly subject to any sort of biological amplification. Instead, protein-
surface-water interactions are governed by purely kinetic/thermodynamic rules3-17 predicated on
the basic principles of transport phenomena and energetics. Surfactant science fully elaborates
these rules from which it is clear that, for a given surface chemistry/energy immersed in water,
the free energy of adsorption is solely dependent on solute molecular characteristics rather than
biological potential of that solute. Amphilicity (interaction energetics with water) is paramount
among these solute characteristics, governing both sign and magnitude of the free energy change
occurring upon adsorption. The linkage between these two different aspects of protein
adsorption lies in the fact that interfacial energetics controls the amount of protein adsorbed and
biochemistry influences activity of protein in the adsorbed state.
With all of this in mind, and focusing only on the interfacial energetics of protein adsorption, we
are curious to know specifically how proteins, as a general class of (possibly glycosylated)
polyamide biopolymers, can exhibit the widely-varying “biosurfactant”18 properties seemingly
required to support the protein-adsorption tenet. That is to ask, how is it that particular proteins
can adsorb to material surfaces from heterogeneous aqueous mixtures (such as blood) and evoke
specifically-related biological responses when, in fact, protein amphilicity is limited to the
permutations and combinations of (effectively) 20 different amino acids? True, it is well known
that the primary amino-acid sequence folds into higher-order structure that distinguishes one
protein type from any other and greatly influences bioactivity. But any such arrangement of
primary structure and related aggregation into hydrophilic/hydrophobic domains still leads to net
amphilicity that pales in comparison to the great range purposely built into synthetic surfactants
drawn from anionic, cationic, non-ionic, zwitterionic, and perfluorinated categories.
3
Page 22
So, bearing in mind that there is no known biological amplification of interfacial energetics, we
are led to ask if there is sufficient “amphiphilic diversity” among proteins to account for the
adsorption specificity implicit in the protein-adsorption tenet. All of this is to say, we seek to
better understand the interfacial energetics behind the biological response to materials and the
protein-adsorption tenet.
We report herein time-and-concentration-dependent liquid-vapor (LV) interfacial tension lvγ of a
variety of purified proteins ranging from albumin to ubiquitin spanning nearly three decades in
molecular weight (MW), especially focusing on proteins of the blood-plasma coagulation
cascade. Results are compared to that obtained for selected surfactant reference compounds.
The liquid-vapor (LV) interface is a molecularly-smooth, model hydrophobic surface where
interfacial energetics can be directly measured by tensiometric (surface thermodynamic)
techniques.18 Scaling of interfacial tension measurements by weight, molarity, and especially as
a ratio-to-physiologic-concentration reveals that (i) propensity to adsorb to the LV interface
(a.k.a interfacial activity) of this diverse set of proteins is more alike than dissimilar and that (ii)
concentration is a more important determinant of protein adsorption than is structure-related
amphilicity. Outcome of experimental observations is interpreted in terms of the protein-
adsorption tenet, suggesting that selective protein adsorption from heterogeneous mixtures may
be over-emphasized in explication of diverse biological responses to materials. Quantitative
application of this tenet in biomaterials science thus requires a more thorough accounting of
interfacial energetics scaled to physiological-protein concentration.
4
Page 23
1.2. Materials and Methods
Purified Proteins, Protein Mixtures, and Synthetic Surfactants: Table 1 compiles pertinent
details on proteins, protein mixtures, and surfactants used in this work. Protein purity was
certified by the vendor to be no less than the respective values listed in Column 5 of Table 1, as
ascertained by electrophoresis (SDS-PAGE or immunoelectrophoresis). Mass, concentration,
and molecular weights supplied with purified proteins were accepted without further
confirmation. Human platelet poor plasma (HP, citrated) was prepared from outdated (within 2
days of expiration) lots obtained from the Hershey Medical Center Blood Bank. Human serum
(HS) was prepared in 15 mL batches from HP by recalcification with 0.1 M CaCl2 at 5:1 v/v
plasma: calcium ratio and coagulation in clean glass-scintillation vials for about 15 min. The
single value for physiological concentration of human proteins applied in this work was middle
of the range listed by Putnam19 as given in Table 1. Serial dilutions of protein stock solutions
(usually 10 mg/mL) were performed in 96-well microtiter plates by (typically) 50:50 dilution in
phosphate buffered saline solution (PBS) prepared from powder (Sigma Aldrich) in distilled-
deionized (18 MΩ) water (interfacial tension of PBS and water was checked periodically by
Wilhelmy-balance tensiometry). Between 24-30 dilutions were prepared in this manner,
covering a dynamic range between 10-10 to 1 % (w/v), taking care to mix each dilution by
repeated pipette aspiration and avoiding foaming of concentrated solutions. The first 12
dilutions (through about 10-5 %) were prepared one-at-a-time from the preceding solution in the
series just before interfacial tension measurements (as a means of conserving concentrated-
protein volume) whereas more dilute solutions were prepared all at once. Microtiter plates were
covered by commercial plate-sealing film to retard evaporation during the course of analysis and,
in those events when protein dilutions were not to be analyzed within two contiguous days,
5
Page 24
plates were stored at 0 oC. Plates were equilibrated with ambient laboratory temperature
(approximately 23 oC) and solutions older than about 5 days were discarded. Surfactants were
stored under ambient conditions in clean-glass bottles sealed with polyethylene-lined screw-type
caps. Surfactants were used as received from the vendor without further purification except in
the case of sodium dodecyl sulfate that was twice recrystallized from absolute ethanol (see Table
1). Unless otherwise specified, surfactant solutions were prepared in PBS.
Liquid-Vapor Interfacial Tension Measurements: LV interfacial tensions lvγ reported in this
work were measured by either Wilhelmy-balance tensiometry (WBT) or pendant-drop
tensiometry (PDT). Unless specifically indicated otherwise, results refer to PDT performed on a
commercial automated tensiometer (First Ten Angstroms Inc., Portsmouth VA). The
tensiometer employed a Tecan liquid-handling robot to aspirate between 10-12 µL of solutions
contained in a 96-well microtiter plate prepared by the serial dilution protocol described above.
Actual pick-up volume was adjusted to accommodate desired dispense volume (as a means of
conserving protein, especially at the highest concentrations) and a fresh disposable-pipette tip
was used for each solution. We found that dip-coating of disposable polypropylene tips in a
commercial perfluorocarbon hydrophobizing agent (NYEBAR, NYE Lubricants Inc.; Bedford,
MA) followed by water wash and air drying greatly aided formation and hanging of symmetric
pendant drops, especially at the highest protein concentrations (lowest lvγ ). This coating
procedure was shown not to measurably affect interfacial tensions. The robot was used to
reproducibly transfer the tip with fluid contents into a humidified (99+ % RH) analysis chamber
and dispense between 6-11 µL pendant drops (smaller drop volume required for lower interfacial
tensions) within the focal plane of a magnifying camera. These and all other aspects of pendant
6
Page 25
drop analysis were performed under computer control. Proprietary algorithms supplied by the
vendor were used to deduce interfacial tensions from drop images captured at a programmed rate
by a frame grabber. Typically, 600 images were captured at a rate of 1 image every 6 sec
following 0.25 sec delay to permit vibrations of the expelled drop to dampen. Drop evaporation
rates within the humidified chamber deduced from computed-drop volumes (based on image
analysis) were observed to vary with solute concentration, generally ranging from approximately
25 nL/min for pure water to 10 nL/min for solute solutions > 0.1% w/v. The impact of this
evaporation rate over the 60 min time frame of the experiment was apparently negligible, as
gauged from the behavior of purified surfactants discussed in the results section. Precision of lvγ
was about 0.5 dyne/cm based on repeated measurement of the same pendant drop. The
instrument was calibrated against pure water interfacial tension and further confirmed on
occasion against Wilhelmy-balance tensiometry. The analysis chamber was thermostated to a
lower-limit of 25±1 oC by means of a computer-controlled resistive heater. Upper-temperature
limit was not controlled but rather floated with laboratory temperature, which occasionally
drifted as high as 29 oC during summer months. Thus, reported lvγ values were probably not
more accurate than about 1 dyne/cm on an inter-sample basis considering the small, but
measurable, variation of water interfacial tension with temperature. This range of accuracy was
deemed adequate to the conclusions of this report which do not strongly depend on more highly
accurate lvγ that is difficult to achieve on a routine basis. Instead, veracity of arguments raised
herein depend more on a breadth of reliable measurements made across the general family of
human proteins.
7
Page 26
Wilhelmy-balance tensiometry was performed using a commercial computer-controlled
instrument (Camtel CDCA 100, Royston UK) using solvent-and-plasma-discharge-cleaned glass
coverslips as the plate (Fisher brand 22X30 mm #1; three sequential rinses of as-received
coverslips in each of water, isopropanol, and chloroform; plasma-discharge-treated for ~ 5 min at
100 mtorr air in a Harrick plasma cleaner, Ossining, New York). The balance was calibrated
with standard weights thereby accounting for local variation in the force of gravity. No attempt
was made to thermostat the balance and all reported measurements were made at ambient
laboratory temperature. Also, no attempt was made to correct for the (presumably small but not
measured) variation in the perimeter of glass coverslips used as plates in the Wilhelmy method.
Solutions (approximately 10 mL) were contained in disposable polystyrene beakers (Fisher)
previously determined not to measurably affect interfacial tension of water contained therein.
Computation and Data Representation: Computational, statistical, and theoretical methods
used in this work have been discussed in detail elsewhere.18,20,21 Briefly, time-dependent lvγ data
corresponding to different solutions were recovered from PDT files and correlated with
concentrations, leading to a matrix of results with row values representing concentration and
time (in sec) as column values. It was generally observed that lvγ data takes on a sigmoidal
shape when plotted on logarithmic-concentration axes,18,20 with well-defined low-concentration
asymptote lv
γ and high-concentration asymptote 'lv
γ . Successive non-linear least-squares fitting
of a four-parameter logistic equation B
' /2 MB= [( - )/(1+(lnC /lnC ) )]+
lv lv lvlv'γ γ γ γΠ to
concentration-dependent lvγ data for each time within the observation interval quantified lv
γ and
'lv
γ parameters with a measure of statistical uncertainty.
8
Page 27
Fitting also recovered a parameter measuring concentration-at-half-maximal-change in
interfacial activity, (where B
/2lnCΠ max12 2Π
= Π and max 'lv lv
γ γΠ ≡ − ), as well as a parameter M
that measured steepness of the sigmoidal curve. This multi-parameter fitting to concentration-
dependent lv
γ data was a purely pragmatic strategy that permitted quantification of best-fit
protein and surfactant characteristics but is not a theory-based analysis.18,20,21 Three-dimensional
(3D) representations of time-and-concentration lv
γ data were created in Sigma Plot (v8) from the
data matrix discussed above and overlain onto fitted-mesh data computed from least-squares
fitting. Two-dimensional (2D) representations were created from the same data matrices at
selected observation times. Concentration-dependent Wilhelmy-balance data was treated
similarly except time dependence in lv
γ was not a controlled variable.
1.3. Results and Discussion
Results and discussion are combined into one section because it is efficient to introduce and
discuss the different facets of the work in the sequence that follows and then combine separate
observations in the Conclusions section. The presentation is organized in the following order.
First, general characteristics of the quantitative data are described, comparing proteins and
surfactants and placing data into an overall context for interpretation. Second, these results are
interpreted graphically by scaling concentration-dependent lv
γ in three different ways (termed
herein “interfacial tension curves” or simply “lv
γ curves”) that give different insights into protein
interfacial activity and provoke interpretation in terms of the protein-adsorption tenet briefly
discussed in the Introduction. Third, a brief comparison of Wilhelmy-balance and pendant-drop
tensiometry of protein mixtures and surfactant reference compounds is given which, although
9
Page 28
somewhat tangential to the main theme of this paper, is an important analytical consideration that
might affect future attempts to reproduce or extend results presented herein. Finally, within this
context, we focus on results obtained for blood factors XII and XIIa because these proteins turn
out to be relatively strong biosurfactants, at least as rated against other proteins, but yet are only
weakly surface active at physiological concentrations.
General Aspects of the Data: Tables 1-3 compile qualitative and quantitative results of this
work. Interfacial tension parameters measured by PDT listed in Tables 2 and 3 are the average
fitted values corresponding to final 25 lv
γ curves recorded within the 60-minute time frame of
the PDT experiment and listed error is standard deviation of this mean. Interfacial tension
parameters measured by WBT result from best fit to a single concentration-dependent lv
γ curve
(no time dependence was recorded for WBT) and listed uncertainty is standard-error-of-the-fit to
the four-parameter logistic equation discussed in Methods and Materials. Secure interpretation
of concentration-dependent lv
γ is highly dependent on the purity of solute from which solutions
were prepared. There are two considerations of particular importance in this regard for protein
solutes. The first is that purified proteins should be substantially free of all other proteins or
protein fragments and ideally should retain native conformation. Protein purity has been
quantified by electrophoresis provided by the vendor as part of product certification (column 5 of
Table 1) but protein conformation remains an unknown/uncontrolled variable. Activity is of
particular concern in the case of enzymes of Table I but of course activity is not a direct measure
of purity. The second important consideration is that of surfactant contamination possibly
occurring in the various fractionation/purification steps employed to separate single proteins
from complex mixtures such as blood. Indeed, surfactant contamination can significantly affect
10
Page 29
lvγ , even at trace concentrations (e.g. <0.01%) that may not be easily resolved by modern bulk
analytical techniques; especially for proteins available only in small quantities/concentrations.
As it turns out, PDT techniques employed herein are among the most sensitive techniques
available to detect surfactant contamination and can distinguish between surface activity of
proteins and surfactants, as well surfactant mixtures.22 From these measurements, it can be
safely concluded that purified proteins studied herein were not overwhelming contaminated with
synthetic surfactants, especially methyl silicones widely used in separation media, because these
detergents typically reduce lv
γ to much lower levels than observed for protein solutions.
Nevertheless, this fact alone does not guarantee that proteins were not very slightly contaminated
with strong surfactants or even significantly contaminated with hydrocarbon surfactants (that
have generally low surfactant strength) at the precise solution concentrations required to mask
protein surface activity. It is noteworthy in this regard that interfacial activity among the wide
array of proteins derived from a variety of sources studied herein was quite conserved (relative to
synthetic surfactants) and happens to be quite similar to human plasma/serum that was not
subjected to any fractionation/purification steps (compare Table 2 and 3). Thus, we conclude
that if proteins were in fact contaminated with surfactants, then this contamination must have
occurred in an unlikely manner leading to similar lv
γ for all proteins and in proportions that just
happen to cause solution lv
γ to overlap with that of unpurified plasma/serum. We add further
that protein lv
γ results reported herein were not substantially different from previous similar
studies (see for examples refs. 20,21,23 and citations therein) and that we were able to detect
cases of protein contamination, as described below in specific reference to FXIIa, as well as
inadvertent contamination induced by contact with plate sealing film (we have found that Nalge-
11
Page 30
Nunc plate-sealing film can be used as described in Methods and Materials in that it does not
detectably alter water interfacial tension whereas lv
γ of water in 96-well plates covered with
Corning film was reduced to ~ 65 dyne/cm and exhibit time-dependence consistent with
surfactant contamination). Thus, we conclude that concentration-dependent lv
γ of proteins listed
in Table 1 was dominated by the natural polypeptide amphilicity and cannot be attributed to
surfactant contamination.
As further noted in Table 1, replicate protein preparations were studied for human albumin (FV
and FAF HSA), IgG, IgM and blood factors FII, FXII, FXIIa . Occasionally different vendors
were used as a means of controlling for discrepancies that might arise from sourcing. In
consideration of all experimental variables ranging from sourcing to data reduction, we conclude
that variation associated with manipulation and dilution of protein concentrates (~ 10 mg/mL;
includes transfer losses by adsorption to pipettes, vials, and wells; slight but inevitable foaming
of proteins brought into solution from powder; etc.) overwhelms lv
γ measurement error
discussed in the Materials and Methods and that differences between preparations or vendors
were insufficient to affect basic conclusions of this work. We call particular attention to the case
of FXIIa (preparations 1 and 2) for which as-received proteins were apparently contaminated
with an unidentified surface-active compound, leading to lv
γ curves that were distinctly not
sigmoidal with a mid-range-concentration “step” that precluded analysis in the manner described
in the Materials and Methods section. We speculate that FXIIa was contaminated during
preparation (FXII → FXIIa) procedures because FXII from the same vendors did not exhibit this
behavior which was unlike that observed for all other proteins, protein mixtures (blood plasma
12
Page 31
and serum), and surfactant reference compounds. Only results obtained with preparation 2 of
FXIIa are provided herein although both preparations behaved similarly.
Quantitative Comparison of Proteins and Surfactants: Protein adsorption fell into three
broad categories identified herein as Type 1, 2 and 3. Column 2 of Table 2 assigns adsorption
type observed for the listed proteins. Type 1 lv
γ curves were clearly sigmoidal with distinct low-
and high-concentration plateaus measured by lv
γ and 'lv
γ parameters listed in columns 3 and 4
(see, as examples, Figs. 1 A and B). Steady-state was apparently achieved in Type 1 adsorption
at or before 3600 sec drop age whereupon kinetic effects in lv
γ were no longer resolvable at any
concentration (less than about 1 dyne/cm). No semblance of a 'lv
γ plateau was reached at the
highest concentrations studied for Type 2 proteins (see, for examples, results for ubiquitin in Fig.
2 and FXII in Fig. 3). It is not evident from this work if these proteins would exhibit Type 1
behavior if yet-higher concentrations were available for study. We note, however, that kinetic
effects had fully dampened for Type 2 adsorption within the interval 3500< t <3600 sec of the
PDT experiment. This strongly suggests that steady-state had in fact been achieved, but that
higher-solution concentrations were required to saturate the surface and achieve a verifiable 'lv
γ
plateau. Moreover, we note that large proteins such as IgM and α2-macroglobulin achieved
steady state over the 60 min time frame (see Figs. 1, 2), confirming that mass transport and
adsorption kinetics could indeed be completed within the time frame of the PDT experiment.
Thus, we conclude that Type 2 adsorption was concentration rather than time limited. Only
graphical estimates for Type 2 parameters are provided in Table 2 because firm values could not
13
Page 32
be ascertained by statistical fitting procedures described in the Materials and Methods section.
However, experimental experience suggests that 'lv
γ and maxΠ were within 10 dyne/cm of the
stated value and within about 2 units. B
/2lnCΠ
We made no attempt to estimate the exponential parameter M for Type 2 proteins. Steady-state
adsorption was not achieved for Type 3 and no well-defined 'lv
γ plateau was observed. Instead,
lvγ drifted continuously lower with increasing concentration, giving the appearance that a high-
concentration limit was just on the horizon but was never quite realized. In this work, Type 3
behavior was observed only as a transient state ultimately leading to steady state. However, Type
3 adsorption has been observed at all realizable concentrations up to the solubility limit for
certain animal proteins (such as bovine serum, plasma, albumin and IgG) as will be reported
elsewhere. Results for α2-macroglobulin (Fig. 1C) are especially interesting with regard to
adsorption types, illustrating kinetic effects that arguably transition from Type 2 behavior at
early drop age, and ending with (poorly-defined) Type 1 adsorption behavior.
Examining data of Table 2 in detail now, note that lv
γ data (column 3) fall between 70 and 72
dyne/cm, consistent with the interfacial tension of water near 25 oC. Variations within this range
can be traced to uncertainty in the statistical fit to concentration-dependent lv
γ data (listed error)
and variation in ambient temperature. Moving to column 4 of Table 2, it is apparent that proteins
generally exhibited a lower interfacial tension 'lv
γ > 30 dyne/cm, with FXII yielding the lowest
value among those listed in Table 2. This is of special interest to blood plasma coagulation
14
Page 33
because FXII adsorption from whole blood or plasma to procoagulant materials is thought to
potentiate the intrinsic pathway of coagulation and enhanced “biosurfactancy” is consistent with
this view. However, as will be discussed subsequently, FXII surface activity is substantially
mitigated by a low-physiologic concentration that cannot sustain a high level of interfacial
activity.
Column 5 gives values for the half-maximum of interfacial tension reduction that fall
within a broad range of about 10 to 22 natural- (base e) log units (for concentration expressed in
p
B
/2lnCΠ
M). Steepness of the sigmoidally-shaped lv
γ curve measured by M is given in column 6 (with
larger negative numbers consistent with steeper lv
γ curve) likewise covers a rather broad range.
The significance of B
/2lnCΠ and M parameters is best gauged graphically from Figs. 1-3. The
maximum reduction in interfacial tension max 'lv lv
γ γΠ ≡ − observed for the proteins listed in
column 7 was calculated assuming lv
γ = 71.97 in all cases, for the purpose of internal
consistency. Error in is therefore identical to error in maxΠ 'lv
γ . Table 3 construction is similar
to that of Table 2 using the same parameters that quantify lv
γ curves. The purpose of Table 3 is
to compare results of pendant-drop tensiometry (PDT) and Wilhelmy-balance tensiometry
(WBT) applied to protein mixtures and surfactant reference compounds that were available in
sufficient volume to satisfy demands of the Wilhelmy method (about 10 mL, see Materials and
Methods).
15
Page 34
In general, it was noted that lv
γ and 'lv
γ parameters from PDT and WBT were in reasonable
agreement (and hence ) for all solutes but maxΠB
/2lnCΠ and M parameters were in substantial
disagreement, especially for proteins and protein mixtures. Our interpretation is that WBT, as
applied in this work, does not measure adsorption kinetics in the same way as PDT due to quite
different mass-transfer and adsorption processes occurring at the moving plate-meniscus region
than at the stagnant-drop interface.18 These differences were negligible at low concentrations
and overwhelmed by adsorption from high-concentration solutions, leading to differences in
measured γlv for only intervening concentrations that, in turn, led to differences in and B
/2lnCΠ M .
Graphical Interpretation of Results: Time-and-concentration-dependent LV interfacial
tension lv
γ profiles were obtained for the purified proteins, protein mixtures, and surfactants
listed in Table 1. Representative results for the anionic surfactant SDS, purified protein HSA
(fatty acid free, FAF), and α2-macroglobulin are compared in Fig. 1 in both three-dimensional
(3D, lv
γ as a function of time and concentration) and two-dimensional (2D, lv
γ as a function
concentration at specified times) representations. Note that the logarithmic-solute-concentration
ordinate in Fig. 1 is expressed in picomolarity units (pBlnC M, 10-12 moles solute/L solution; see
following and Materials and Methods section for computational and data representation details).
Examining first 3D and 2D representations of SDS interfacial activity (Fig. 1A) which serves as
a reference compound, it was observed that the lv
γ curve was strictly sigmoidal in shape, with a
well-defined low-concentration asymptote lv
γ and a high-concentration asymptote 'lv
γ
characteristic of Type 1 adsorption. In this latter regard, SDS and HSA exhibited similar
concentration-limiting behavior (compare Fig. 1 A and B) that is typically interpreted as
16
Page 35
formation of a critical micelle concentration (CMC), at least for surfactants. This paper provides
no evidence of micelles, for either proteins or surfactants, and so only acknowledges a limiting
behavior at which further increase in solute concentration did not measurably change lv
γ . Unlike
SDS, however, adsorption/mass transfer kinetics significantly affected early-time lv
γ
measurements of HSA solutions, although steady state was achieved well before the final
observation time at 3600 sec. As mentioned in the preceding section, kinetic effects are even
more pronounced for large proteins such as α2-macroglobulin for which it is observed that
adsorption behavior transitions from Type 2 at the earliest observations, to Type 1 as steady state
is achieved near 3600 sec. Thus Fig. 1 captures the significant adsorption trends quantified in
Tables 2 and 3.
Scaled Interfacial Activity: Figs. 2 A, B, and C compare lv
γ curves for proteins selected from
Table 1 to cover the full range of molecular weight (MW) studied in this work, scaled in three
different ways for direct comparison; by weight, molarity, and ratio-to-physiological
concentration. Smooth curves represent a “slice” taken from 3D curves like those of Fig. 1 at or
near 3600 sec. Supporting data are not shown with smooth curves of Fig. 2 for the sake of
clarity, but representative lv
γ curves with authentic data are amply illustrated in Figs. 1 and 3.
The following discusses results of each scaling method in order of appearance on Fig. 2. These
different scaling methods sharpen general impressions about the energetics of protein adsorption
that are particularly pertinent to the protein-adsorption tenet discussed in the Introduction.
17
Page 36
Fig. 2A compares lv
γ curves with expressed in parts-per-trillion (i.e. PPT, grams solute/10BC 12
g solvent, so that the ln BC scale has positive values at all concentrations). Weight scaling is
applicable to purified proteins, protein mixtures, and surfactants alike, permitting comparison of
interfacial activity on a single concentration axis.18,20,21 Two features are readily apparent from
Fig. 2A. First, it is noted that the dynamic range of max 'lv lv
γ γΠ ≡ − < 40 dyne/cm. This is to be
interpreted in light of the maxΠ range observed for synthetic surfactants that can exceed 60
dyne/cm, with 25 < < 50 dyne/cm for ordinary hydrocarbon soaps and surfactants.maxΠ 24,25
Thus, it would appear that proteins and protein mixtures are relatively weak surfactant systems
with only slightly overlapping with the weakest of surfactant systems. Second, it is
somewhat surprising that
maxΠ
'lv
γ data for this diverse set of proteins (with MW spanning nearly three
orders of magnitude; see Table 1) lies within a relatively narrow 20 dyne/cm band. Again, this
should be interpreted in light of the full range observed for synthetic surfactants wherein 'lv
γ
varies substantially over the entire measurable range. Thus, it is evident from Fig. 2A that, on a
weight basis, proteins exhibit quite similar LV interfacial activity. These results corroborate and
extend similar previous investigations with focus on a narrower range of protein MW.18,20,21
Bearing in mind the great range in MW spanned by proteins in Fig. 2, it is reasonable to
conclude that commensurate variability in protein structure does not confer widely varying LV
interfacial activity; at least not in comparison to the full range available to ordinary surfactants.
However convenient weight scaling may be, it is nevertheless true that free-energy and
stoichiometry scale on a molar basis. Thus, for the purpose of better understanding interfacial
energetics, it is therefore useful to express in molar units. We have chosen to express solute BC
18
Page 37
dilution in picomoles/L (i.e. picomolarity, pBC M, 10-12 moles solute/L solution so that the
scale has positive values for all dilutions) for solutes with a known (nominal) MW. This
approach is applicable to purified proteins and surfactants but not to chemically-undefined
protein mixtures such as plasma and serum. Variability in interfacial activity among the diverse
purified proteins reported in Fig. 2 is much more evident on a molar rather than weight basis
(compare Fig. 2A to Fig. 2B). Of course, molar scaling does not alter observations regarding the
range of mentioned above, but it does effectively expand the concentration axis by moving
higher-MW proteins (such as α
ln BC
maxΠ
2-macroglobulin and IgM) to the left and lower-MW proteins
(such as albumin and ubiquitin) to the right. It is apparent from Fig. 2B that high-MW proteins
reduce lv
γ at lower molarity than low-MW proteins. This progression in MW is suggestive of
the Traube-rule for linear hydrocarbon surfactants in which it is observed that the concentration
required to reduce lv
γ to a specified value decreases in a regular progression with each -CH2-
unit in a homologous series.26-29 Of course, proteins are hardly simple hydrocarbon molecules
and have many more degrees of orientational freedom at the interface.3,30
Furthermore, proteins are not interrelated in any known homologous series (other than perhaps
being comprised of a limited selection of amino acids). Still, the inference taken from Fig. 2B is
that protein concentration required to reduce lv
γ to a specified value decreases with MW in a
manner loosely consistent with the addition of a generic amino-acid-building-block having an
“average amphilicity” that increases MW but does not radically change protein interfacial
activity. Otherwise, if MW increased by addition of amino-acid-building-blocks with highly-
variable amphilicity, then would be expected to be a much stronger function of protein maxΠ
19
Page 38
MW than is observed in Fig. 2B. Thus, it appears that molar variability in lv
γ is achieved by
aggregating greater mass of similar amphiphilic character, as opposed to accumulating greater
amphilicity with increasing MW.
Weight and molar scaling are very useful experimental and conceptual constructs that may turn
out to have little direct relevance to the in vivo biological response to materials because these
scales do not account for the widely-varying natural abundance of the many different proteins
comprising the mammalian proteome.31 Thus, for the purpose of better understanding protein
interfacial activity within a physiologic context, we have found it useful to ratio to nominal
(mean) physiological concentration
BC
PC and express on a (base 10) logarithmic scale
. In this way, the physiologic condition can be readily identified at
with more-dilute-protein solutions lying to the left (negative
values) and more-concentrated solutions lying to the right (positive values; see
dashed vertical line on Fig. 2C). This approach is applicable to purified proteins for which
humoral or cellular concentrations are known. Thus, Fig. 2C reveals a different kind of diversity
in protein interfacial activity than discussed above in reference to weight or molar scales.
/BC CP
(log / )B pC C
(log / ) 0B pC C = (log / )B pC C
(log / )B pC C
Certain proteins, notably albumin, IgG and IgM, produced the full maxΠ range well below
physiologic concentration (lv
γ data lies substantially to the left of . By contrast,
C1q, prothrombin (FII), and ubiquitin did not express
(log / ) 0B pC C =
maxΠ at physiologic concentration (lv
γ
curves cross the line) but were still observed to be substantially surface active
at physiologic concentrations. Interestingly, only a limited portion of the available range
(log / ) 0B pC C =
maxΠ
20
Page 39
was exhibited by blood factor XII and the enzyme form XIIa (lv
γ data lie substantially to the
right of ), as will be discussed separately below in reference to Fig. 3 because
this has special significance in blood coagulation. It appears that (l is a pragmatic
scaling of interfacial activity with relevance to biomedical materials that reveals concentration-
driven diversity in interfacial activity observed among humoral and cellular proteins.
(log / ) 0B pC C =
og / )B pC C
Fig. 3 focuses on results obtained for blood factors FXII and FXIIa. Activation of FXII by
adsorption to procoagulant surfaces is thought to potentiate the intrinsic pathway of blood
coagulation (see refs. 32,33 and citations therein). Thus, understanding the interfacial activity of
FXII and FXIIa is important toward a full appreciation of the contact activation mechanism34,35
and anticoagulation as well.36 Fig. 3 is prepared in basically the same format as Fig. 2C except
that smooth curves here correspond to different observation times up to 3594 sec. Data points
for the 3594 sec drop age are included for preparation 2 of FXIIa verifying that, although less-
concentrated solutions of FXIIa indicated presence of an unidentified surface-active
contaminant, higher-protein concentrations were not measurably different than that obtained for
FXII that presented no such difficulties (data corresponding to preparation 1 not shown). This
suggests that, at these higher concentrations, FXIIa surfactancy overwhelmed that of the putative
contaminant and that FXIIa interfacial activity is not too different than FXII.
Similarity between FXII and FXIIa is consistent with the fact that FXIIa differs from FXII only
by cleavage of a disulfide bridge37 and not wholesale molecular alteration. This latter feature of
zymogen → enzyme conversion is substantially different from the prothrombin → thrombin (FII
→ FIIa) reaction that cleaves a much smaller protein with quite different biosurfactant properties
21
Page 40
(compare results listed in Table 2 and see FII in Fig. 2).38-40 Fig. 3 thus demonstrates that FXII
and FXIIa were only weakly surface active at physiologic concentrations and that was not
achieved unless solutions were nearly two orders-of magnitude more concentrated. Moreover,
maximum reduction in
maxΠ
lvγ was achieved only at substantially long equilibration times (> 1800
sec). These adsorption kinetics must be interpreted in terms of the blood-plasma-coagulation
process that can be complete within 300 sec or so when blood plasma is saturated with high-
surface-area procoagulants.34 Results obtained with purified FXII and FXIIa are seemingly
inconsistent with the traditional biochemical mechanism of contact activation of blood plasma
coagulation that asserts rapid FXII adsorption onto hydrophilic procoagulant surfaces (see refs.
32,33 and citations therein). FXII adsorption, and FXIIa desorption for that matter, must occur
in the presence of overwhelming concentrations of other blood proteins, notably albumin and
IgG that this work demonstrates to be much more surface active on both molar and
physiological-concentration scales (Fig. 2). Furthermore, we note that FXII adsorption to the LV
interface is not rapid relative to other proteins such as albumin, as might be expected for a
protein with putatively enhanced interfacial activity. Although mechanisms of adsorption to
hydrophilic (efficient procoagulant) surfaces are not necessarily the same as those leading to
adsorption to hydrophobic (inefficient procoagulant) surfaces, it is the general experience that
much more protein is adsorbed to hydrophobic surfaces.35
On this basis, we expect that FXII and FXIIa would exhibit even less adsorption to hydrophilic
procoagulants than we observe at the hydrophobic LV surface within a time-frame relevant to
coagulation. All taken together, these studies of FXII and FXIIa adsorption to the hydrophobic
LV interface support our contention that FXII does not adsorb directly onto hydrophilic
22
Page 41
procoagulant surfaces in a manner that displaces water (surface dehydration) and that contact
activation of FXII → FXIIa occurs by some process other than suggested by the traditional
mechanism.34-36
1.4. Conclusions
Time-and-concentration-dependent liquid-vapor (LV) interfacial tension lv
γ has been measured
for a diverse set of human proteins ranging from albumin to ubiquitin, with special focus on
blood-plasma proteins. Three different methods of scaling concentration dependence were
explored: weight, molarity, and ratio-to-physiologic concentration. On a weight basis, proteins
among the group appeared more similar than dissimilar, especially when viewed from the
perspective of the full range available to synthetic-surfactant reference compounds, reducing lv
γ
by no more than about 40 dyne/cm ( max 'lv lv
γ γΠ ≡ − < 40 dyne/cm) and all proteins falling within
a relatively narrow 20 dyne/cm band (55 < 'lv
γ < 30 dyne/cm). We interpret this observation to
mean that there is insufficient amphiphilic diversity among the proteins studied to support wide-
ranging interfacial activity at the LV interface, even though molecular weight (MW) varied over
nearly three orders-of-magnitude. Molar scaling revealed that interfacial activity followed a
progression in MW, with the concentration required to reach a specified lv
γ value decreasing
with increasing MW.
This progression in MW is reminiscent of the Traube-rule for linear hydrocarbon surfactants in
which it is observed that the concentration required to reduce lv
γ to a specified value decreases
23
Page 42
in a regular progression with each CH2 unit (i.e. MW) in a homologous series.26-29 The parallel
interpretation for proteins is that molar variability in lv
γ is achieved by aggregating greater mass
of similar amphiphilic character (blocks of amino acids), as opposed to accumulating greater
amphilicity with MW. The significance of this observation is that it suggests that the structural
variability that confers vastly different bioactivity does not greatly affect interaction energetics in
water that drive adsorption to the LV interface. Scaling interfacial activity to physiological
concentration revealed that certain proteins, such as albumin and IgG, produced the full maxΠ
range at-and-well below physiologic concentration whereas others, notably blood factor XII
(Hageman factor) required concentration by more than two-orders-of-magnitude above the
nominal-physiologic concentration to express the full range of maxΠ characteristic of this
protein.
In summary, results reported herein support the overall conclusion that combinations and
permutations of the 20 naturally-occurring amino acids comprising the primary sequence of
mammalian proteins is insufficient to support widely-varying LV interfacial activity, no matter
how these sequences happen to fold into higher-order structure. Furthermore, we contend that
protein concentration, not diversity in molecular structure, is the significant energetic driver of
adsorption to the LV interface. Interpreted in terms of the protein-adsorption tenet discussed in
the Introduction, these results suggest that assertion of differential protein adsorption to
biomaterial surfaces from heterogeneous mixtures such as blood requires careful justification in
terms of both concentration and kinetics.
24
Page 43
In this regard, blood factor XII is especially relevant to the development of hemocompatible
materials because adsorption of FXII from blood onto procoagulant surfaces is generally
accepted to be the first step in potentiation of the intrinsic pathway of plasma coagulation. A
significant question that arises particular to FXII and FXIIa asks how specific adsorption to
procoagulant surfaces can occur when FXII is so weakly surface active at physiologic
concentrations, especially in the presence of overwhelming concentrations of proteins such as
albumin or IgG that are shown by this work to be among the class of highly-surface-active
proteins at physiologic concentrations. Perhaps specific interactions with solid surfaces and
(rapid) Vroman-effect interchange of adsorbed proteins not explored in this research can
rationalize all observations and theories. Even so, such descriptive biochemical explanations
will have much more authority when shown to be consistent with the interfacial energetics of
adsorption.
25
Page 44
Citations
(1) Horbett, T. Protein Adsorption on Biomaterials. In Biomaterials: Interfacial
Phenomena and Applications; Cooper, S. L., Peppas, N. A., Hoffman, A. S., Ratner, B. D., Eds.;
Am. Chem. Soc.: Washington D. C., 1982; Vol. 199; pp 234.
(2) Ray, L. B. The Science of Signal Transduction, Science 1999, 284, 755.
(3) Ramsden, J. J. Puzzles and Paradoxes in Protein Adsorption, Chemical Society
Reviews 1995, 24, 73.
(4) Haynes, C. A.; Norde, W. Globular Proteins at Solid/Liquid Interfaces, Colloids
and Surfaces B: Biointerfaces 1994, 2, 517.
(5) Norde, W.; Lyklema, J. The Adsorption of Human Plasma Albumin and Bovine
Pancreas Ribonuclease at Negatively Charged Polystyrene Surfaces IV. The Charge Distribution
in the Adsorbed State, J. Colloid and Interface Sci. 1978, 66, 285.
(6) Norde, W.; Lyklema, J. The Adsorption of Human Plasma Albumin and Bovine
Pancreas Ribonuclease at Negatively Charged Polystyrene Surfaces V. Microcalorimetry, J.
Colloid and Interface Sci. 1978, 66, 295.
(7) Norde, W.; Lyklema, J. The Adsorption of Human Plasma Albumin and Bovine
Pancreas Ribonuclease at Negatively Charged Polystyrene Surfaces III. Electrophoresis, J.
Colloid and Interface Sci. 1978, 66, 277.
(8) Norde, W.; Lyklema, J. The Adsorption of Human Plasma Albumin and Bovine
Pancreas Ribonuclease at Negatively Charged Polystyrene Surfaces II. Hydrogen Ion Titrations,
J. Colloid and Interface Sci. 1978, 66, 266.
26
Page 45
(9) Norde, W.; Lyklema, J. The Adsorption of Human Plasma Albumin and Bovine
Pancreas Ribonuclease at Negatively Charged Polystyrene Surfaces I. Adsorption Isotherms,
Effects of Charge, Ionic Strength, and Temperature, J. Colloid and Interface Sci. 1978, 66, 257.
(10) Shirahama, H.; Lyklema, J.; Norde, W. Comparative Protein Adsorption in Model
Systems, J. Colloid and Interface Sci. 1990, 139, 177.
(11) Norde, W.; Lyklema, J. Thermodynamics of Protein Adsorption: Theory with
Special Reference to the Adsorption of Human Plasma Albumin and Bovine Pancreas
Ribonuclease at Polystyrene Surfaces, J. Colloid and Interface Sci. 1979, 71, 350.
(12) Norde, W.; Lyklema, J. Protein Adsorption and Bacterial Adhesion to Solid
Surfaces: A Colloid-Chemical Approach, Colloids and Surfaces 1989, 38, 1.
(13) Norde, W.; Lyklema, J. Why Proteins Prefer Interfaces, J. Biomater. Sci. Polymer
Edn. 1991, 2, 183.
(14) Norde, W. Adsorption of Proteins From Solution at the Solid-liquid Interface,
Adv. Colloid and Interface Sci. 1986, 25, 267.
(15) Arai, T.; Norde, W. The Behavior of Some Model Proteins at Solid-liquid
Interfaces. 1. Adsorption from Single Protein Solutions, Colloids and Surfaces 1990, 51, 1.
(16) Fraaije, J.; Norde, W.; Lyklema, J. Interfacial Thermodynamics of Protein
Adsorption Ion Co-adsorption and Ion Binding in Solution. II. Model Interpretation of Ion
Exchage Lysozyme Chromatography, Biophysical Chemistry 1991, 40, 317.
(17) Haynes, C.; Norde, W. Structures and Stabilities of Adsorbed Proteins, J. Colloid
and Interface Sci. 1995, 169, 313.
(18) Vogler, E. A. Interfacial Chemistry in Biomaterials Science. In Wettability; Berg,
J., Ed.; Marcel Dekker: New York, 1993; Vol. 49; pp 184.
27
Page 46
(19) Putnam, F. W. Alpha, Beta, Gamma, Omega - The Roster of the Plasma Proteins.
In The Plasma Proteins: Structure, Function, and Genetic Control; Putnam, F. W., Ed.;
Academic Press: New York, 1975; Vol. 1; pp 58.
(20) Vogler, E. A. Practical Use of Concentration-Dependent Contact Angles as a
Measure of Solid-Liquid Adsorption I: Theoretical Aspects, Langmuir 1992, 8, 2005.
(21) Vogler, E. A. Practical Use of Concentration-Dependent Contact Angles as a
Measure of Solid-Liquid Adsorption II: Experimental Aspects, Langmuir 1992, 8, 2013.
(22) Feri, J. K.; Stebe, K. J. Which Surfactants Reduce Surface Tension Faster? A
Scaling Argument for Diffusion Socntrolled Adsorption, Adv. in Colloid and Interface Sci. 2000,
85, 61.
(23) Tripp, B. C.; Magda, J. J.; Andrade, J. D. Adsorption of Globular Proteins at the
Air/Water Interface as Measured via Dynamic Surface Tension: Concnetration Dependence,
Mass-transfer Considerations, and Adsorption Kinetics, J. Colloid and Interface Sci. 1995, 173,
16.
(24) Schwartz, A. M.; Perry, J. W. Surface Active Agents; Interscience Publishers:
New York, 1949.
(25) Rosen, M. J. Surfactants and Interfacial Phenomena; Wiley: New York, 1978.
(26) Traube, J. Ueber die Capillaritatscontanten Organischer Stoffe in Wasserigen
Losungen, Annalne Chemie 1891, 265, 27.
(27) Tanford, C. The Hydrophobic Effect: Formation of Micelles and Biological
Membranes; John Wiley & Sons: New York, 1973.
(28) Adamson, A. W. Physical Chemistry of Surfaces, 2 ed.; Interscience Publishers:
New York, 1960.
28
Page 47
(29) Tanford, C. How Protein Chemists Learned about the Hydrophobic Factor,
Protein Science 1997, 6, 1358.
(30) Andrade, J. D.; Hlady, V. Protein Adsorption and Materials Biocompatibility: A
Tutorial Review and Suggested Mechanisms, Adv. Polym. Sci. 1986, 79, 3.
(31) Anderson, N. L.; Anderson, N. G. The Human Plasma Proteome:History,
Character, and Diagnostic Prospects, Molecular and Cellular Proteomics 2002, 1, 845.
(32) Mitropoulos, K. A. The Levels of FXIIa Generated in Hyman Plasma on an
Electronegative Surface are Insensitive to Wide Variation in the Conventration of FXII,
Prekallikrein, High Moleuclar Weight Kininogen or FXI, Thromb. Haemost. 1999, 82, 1033.
(33) Mitropoulos, K. A. High Affinity Binding of Factor FXIIa to an Electronegative
Surface Controls the Rates of Factor XII and Prekallirien Activation in vitro, Thrombosis
Research 1999, 94, 117.
(34) Vogler, E. A.; Graper, J. C.; Harper, G. R.; Lander, L. M.; Brittain, W. J. Contact
Activation of the Plasma Coagulation Cascade.1. Procoagulant Surface Energy and Chemistry, J.
Biomed. Mat. Res. 1995, 29, 1005.
(35) Vogler, E. A.; Graper, J. C.; Sugg, H. W.; Lander, L. M.; Brittain, W. J. Contact
Activation of the Plasma Coagulation Cascade.2. Protein Adsorption on Procoagulant Surfaces,
J. Biomed. Mat. Res. 1995, 29, 1017.
(36) Vogler, E. A.; Nadeau, J. G.; Graper, J. C. Contact Activation of the Plasma
Coagulation Cascade. 3. Biophysical Aspects of Thrombin Binding Anticoagulants, J. Biomed.
Mat. Res. 1997, 40, 92.
(37) Colman, R. W. Contact Activation Pathway: Inflammatory Fibrinolytic,
Anticoagulant, Antiadhesive, and Antiangiogenic Activities. In Hemostasis and Thrombosis:
29
Page 48
Basic Principles and Clinical Practice; Fourth ed.; Colman, R. W., Marder, V. J., Hirsh, J.,
Clowes, A. W., Eds.; J.B. Lippincott Company: Philadelphia, 2000; pp 103.
(38) Mann, K. G. Prothrombin and Thrombin. In Hemostasis and Thrombosis: Basic
Principles and Clinical Practice; Third ed.; Colman, R. W., Hirsh, J., V.J.Marder, Salzman, E.
W., Eds.; J.B. Lippincott Company: Philadelphia, 1994; pp 184.
(39) Narayanan, S. Multifunctional roles of thrombin, Annals of Clinical & Laboratory
Science 1999, 29, 275.
(40) Fenton, J. W. Thrombin. In Bioregularoty Funtions of Thrombin; Waltz, D. A.,
Fenton, J. W., Shuman, M. A., Eds.; The National Academy of Sciences: New York, 1986; Vol.
485; pp 5.
30
Page 49
TABLE 1: Purified Proteins, Protein Mixtures & Synthetic Surfactants CLASS NAME
(acronym) MOLECULAR
WEIGHT g/mol
AS-RECEIVED
FORM (mg/ml)
PURITY (electrophoresis)
or ACTIVITY
PHYSIOLOGIC CONCENTRATION
mg/100ml (nominal value)
METHOD (Table #)
VENDOR
Prep 1 73% PDT/WBT (2,3)
ICN Biomedicals
Prep 2 73% PDT (2)
ICN Biomedicals
Fatty Acid Free
(FAF HSA)
Prep 3
66,300 Powder
96-99% PDT (2)
Sigma Aldrich
Prep 1
HUMAN SERUM
ALBUMIN
Fraction V (FV HSA) Prep 2
66,300 Powder 96-99%
3500-5500 (4500)
(Also applied to FAF HSA)
PDT (2)
Sigma Aldrich
HEMOGLOBIN (Hb) 66000 Powder 89% N/A PDT (2)
Sigma Aldrich
Prep1 PROTHROMBIN (FII) Prep2
72,000 Powder 7.4 units/mg protein
clotting assay
5-10 (7.5)
PDT (2)
Sigma Aldrich
THROMBIN (FIIa) 35,600 Powder 1325 NIH unit/mg protein
N/A PDT (2)
Sigma Aldrich
α2---MACROGLOBULIN (α MAC)
725,000 Powder 90% 150-350 (250)
PDT (2)
Sigma Aldrich
Prep 1 95% Sigma Aldrich Prep 2 95% Sigma Aldrich
HUMAN IgG (IgG)
Prep 3
160,000 Powder
98%
800-1800 (1300)
PDT (2)
ICN Biomedicals Prep 1 78,000 Solution
(4.6) 95% 4 PDT
(2) Haematologic Technologies
FACTOR XII (FXII)
Prep 2 78,000 Solution (1.5)
95% 4 PDT (2)
Enzyme Research Laboratories
Prep 1 78,000 Solution (1.4)
121 PEU/mg N/A -
Enzyme Research Laboratories
FACTOR XIIa (FXIIa)
Prep 2 78,000 Solution (0. 8)
86 PEU/mg N/A PDT (2)
Innovative Research
UBIQUITIN (Ub)
10,700 Powder 98% 10-20 (15)
PDT (2)
Sigma Aldrich
COMPLEMENT COMPONENT C1q (C1q)
400,000 Powder Single band by immuno
electrophoresis
10-25 (17.5)
PDT (2)
Sigma Aldrich
Prep 1 Prep 2
PROTEINS
HUMAN IgM (IgM)
Prep 3
1000,000 Solution (0. 8)
98% 60-250 (155)
PDT (2)
Sigma Aldrich
HUMAN SERUM (HS) Neat Blood Bank PROTEIN MIXTURES HUMAN PLASMA (HP)
N/A Neat
PDT/ WBT (3) Blood Bank
CETYL BROMIDE (CDAB) 378.5 Powder Sigma Aldrich TWEEN 80 (TWN 80) 1309.7 Liquid Sigma Aldrich AEROSOL-OT (AOT) 444.6 Powder
PDT/WBT (3)
Fluka SODIUM DODECYL SULFATE (SDS) 288.4 Powder PDT (3) Lancaster Chemicals
SURFACTANTS
PERFLUOROOCTANOIC ACID (PFOA) 414.1 Powder
N/A
N/A
PDT/WBT (3) SynQuest Labs
31
Page 50
Table 2: Pendant-Drop Tensiometry (PDT) Liquid Vapor (LV) Interfacial Activity Of Purified Protein Solutions
* pM = picomoles/L (10-12 moles/L); Listed data result from statistical fit (See Materials & Methods). † Parameters are estimates for Type 2 (See Materials & Methods).
NAME (acronym)
TYPE γγγγolv
dynes/cm γγγγ'
lv dynes/cm
lnCBΠΠΠΠ /2
PPT (pM)*
M dimensionless
ΠΠΠΠmax
dynes/cm Prep 1 1 70.74±0.32 51.96±0.44 17.23±0.11
(13.04±0.11) -23.1±3.0 19.73±0.44
Prep 2 1 71.39±0.59 51.91±0.61 16.34±0.14 (12.15±0.15)
-17.3±3.0 19.79±0.61
Fatty Acid Free (FAF HSA)
Prep 3 1 70.83±0.30 53.37±0.47 16.25±0.16 (12.06±0.16)
-13.0±2.0 18.33±0.47
Prep 1 1 72.4±1.2 50.3±1.2
16.32±0.28 (12.14±0.28)
-9.9±2.5 21.4±1.2
HUMAN SERUM ALBUMIN
Fraction V (FV HSA)
Prep 2 1 70.8±1.1 46.2±2.5 16.61±0.51 (12.44±0.53)
-7.3±2.2 25.5±2.5
Prep 1 1 70.50±0.73 43.1±2.4 17.55±0.45 (12.72±0.35)
-10.8±2.9 28.6±2.4 PROTHROMBIN (FII)
Prep 2 1 70.51±0.73 43.0±2.4 16.85±0.55 (12.72±0.34)
-10.8±2.8 28.7±2.4
THROMBIN (FIIa) 1 72.23±0.31 47.6±1.5 18.01±0.21 (14.44±0.26)
-11.0±1.3 24.1±1.5
Prep 1 2 71 29 19 (15)
- 42 FACTOR XII (FXII) † Prep 2 2 70 37 19
(15) - 34
FACTOR XIIa (FXIIa) †
Prep 2 2 72 42 16 (12)
- 30
Prep 1 1 70.48±0.57 48.7±3.2 17.99±0.71 (13.04±0.69)
-8.6±2.1 23.1±3.2
Prep 2 1 71.13±0.57 51.6±1.9 18.60±0.39 (13.54±0.41)
-10.4±2.7 20.1±1.9
HUMAN IgG
(IgG)
Prep 3 1 71.09±0.42 56.48±0.92 19.72±0.19 (14.65±0.19)
-20.1±5.1 15.21±0.92
α2---MACROGLOBULIN (α MAC)
1 71.96±0.36 57.21±0.57 16.17±0.19 (9.54±0.15)
-19.4±5.7 14.47±0.57
HEMOGLOBIN (Hb)
1 71.44±0.38 43.85±0.66 16.01±0.10 (11.82±0.10)
-19.6±2.7 27.85±0.66
UBIQUITIN (Ub) †
2 72 46 17 (15)
- 26
COMPLEMENT COMPONENT C1q (C1q)
1 71.59±0.54 54.2±1.6 17.27±0.36 (11.27±0.38)
-14.2±4.1 17.5±1.6
Prep 1 1 70.98±0.40 51.4±1.2 16.82±0.19 (9.92±0.20)
-13.2±3.5 20.3±1.2
Prep 2 1 71.65±0.55 50.2±3.1 18.52±0.32 (11.64±0.35)
-14.2±4.2 21.5±3.1
HUMAN IgM (IgM)
Prep 3 1 71.16±0.53 51.6±1.3 17.59±0.12 (10.69±0.12)
-21.0±4.3 20.1±1.3
32
Page 51
Table 3: Pendant-Drop Tensiometry(PDT) and Wilhelmy Balance Tensiometry(WBT) of Proteins, Protein Mixtures and Synthetic Surfactants
γγγγolv
(dynes/cm) γγγγ'
lv (dynes/cm)
lnCBΠΠΠΠ /2
PPT (pM)** M
(dimensionless) ΠΠΠΠmax
(dynes/cm) NAME* PDT
TYPE PDT WBT PDT WBT PDT WBT PDT WBT PDT WBT
HP 1 71.70±0.62 72.29±0.46 48.55±0.71 51.7±5.6 19.56±0.19 23.1±1.3 -23.3±3.7 -13.5±3.6 23.15±0.71 20.2±6.0 HS 1 70.54±0.46 73.08±0.61 47.61±0.62 43.0±6.1 19.91±0.17 24.1±1.1 -23.1±3.6 -10.3±3.8 24.08±0.62 28.9±6.1 FAF HSA‡ 1 70.74±0.32 72.82±0.51 51.96±0.44 59.5±1.5 17.23±0.11
(13.04±0.11)15.90±0.46
(11.71±0.46)-23.1±3.0 -13.4±5.2 19.73±0.44 12.4±1.5
PFOA† 2 71 73.00±0.29 15 9.2±2.0 20 (21)
20.22±0.11 (21.10±0.10)
- -20.6±1.6 57 62.8±2.0
CDAB 1 72.74±0.63 72.7±1.3 35.54±0.50 36.4±2.1 16.70±0.07 (17.67±0.07)
16.64±0.40 (17.60±0.35)
-35.8±4.3 -13.6±3.3 36.15±0.50 35.6±2.1
TWN80 1 72.8±2.3 72.75±0.31 36.0±1.6 37.63±0.67 15.27±0.32 (15.05±0.33)
14.65±0.14 (14.38±0.14)
-14.8±3.1 -7.30±0.47 35.7±1.6 34.34±0.67
AOT 1 71.89±0.35 72.03±0.58 23.86±0.39 20.61±0.58 15.08±0.08 (15.89±0.08)
18.75±0.28 (19.66±0.22)
-17.6±1.7 -13.2±1.6 47.83±0.39 51.36±0.58
SDS 1 71.15±0.20 - 33.40±0.58 - 18.79±0.07 (20.04±0.07)
- -20.5±1.3 - 38.29±0.58 -
Notes: * See Table 1 for acronym definition. ** pM = picomoles/L (10-12 moles/L); Listed data result from statistical fit (See Materials & Methods) † Parameters are estimates for Type 2 (See Materials & Method). ‡ Repeated from Table 2 for ease of comparison.
33
Page 52
Figure 1: Interfacial tension profiles in 3D (γlv as a function of analysis time (drop age) and
logarithmic (natural) solution concentration CB) and 2D (γlv as a function of logarithmic solution
concentration CB at selected times) formats comparing sodium dodecyl sulfate (SDS, panel A),
human serum albumin (FAF HSA, panel B, preparation 1 Table 1), and α2-macroglobulin (panel C).
In each case, solute concentration CB is expressed in picomoles/L (pM) (natural) on a logarithmic
scale. Symbols in 2D panels represent time slices through 3D representations (filled circle = 0.25
sec, open circle = 900 sec, filled triangles = 1800 sec, and open triangles = 3594 sec). Notice that
adsorption kinetics dominate α2-macroglobulin adsorption whereas steady-state is achieved within
about 1000 sec for HSA, and no adsorption kinetics is detected for SDS.
34
Page 53
2 4 6 8 10 12 14 16 18 20 22 24 2625
30
35
40
45
50
55
60
65
70
75
γ lv
(dyn
es/c
m)
Elapsed Time (sec) lnC B(C B
in pM)
γ l v (d
ynes
/ cm
)
A
lnCB (CB in pM)
2 4 6 8 10 12 14 16 18 2050
55
60
65
70
75
2 4 6 8 10 12 14 16 18 2050
55
60
65
70
75
Elapsed Time (sec)
γ lv
(dyn
es/c
m)
lnC B(C B
in pM)lnCB (CB in pM)
γ lv (d
ynes
/cm
)γ l v
( dyn
es/ c
m)
Elapsed Time (s
γ lv
(dyn
es/c
m)
C
B
time
lnC B(C B
in pM)
lnCB (CB in pM)ec)
35
Page 54
Figure 2: Concentration dependence of protein interfacial tension γlv scaled in three different ways:
by logarithmic (natural) weight-volume (panel A), molarity (panel B), and logarithmic (base 10)
ratio-to-physiological concentration (panel C), for selected proteins spanning an order-of-magnitude
of molecular weight. Only statistically-fit smooth curves are shown for clarity (see Figs. 1 and 3 for
similar plots including authentic data and Table 2 for statistics of fit). Interfacial activity among
proteins appears more similar than dissimilar when viewed on a weight basis but diversity among
proteins becomes more apparent when scaled on a molar or ratio-to-physiological concentration.
Physiologic scaling (panel C) shows that FAF HSA, IgG, and IgM (preparations 1, Table 1) are fully
surface active at-and-below physiological concentrations whereas C1q, FII (preparation 1), and Ub
require concentration by as much as two orders-of-magnitude to achieve maximum reduction of γlv.
36
Page 55
lnCB (CB in PPT)6 8 10 12 14 16 18 20 22 24
γγ γγ lv(d
ynes
/cm
)
45
50
55
60
65
70
75
FII
HSA
Ub
IgM IgG
C1q
lnCB (CB in pM)
6 8 10 12 14 16 18 20 22 2445
50
55
60
65
70
75
HSA
FII
IgMIgG
C1q
Ub
log 10 ([Solution Concentration, CB]/[Physiologic Concentration, P])
-4 -2 0 245
50
55
60
65
70
75
HSA
FII
IgM
Ub
C1q
IgG
A
C
B
γγ γγ lv(d
ynes
/cm
)γγ γγ lv
(dyn
es/c
m)
37
Page 56
Figure 3: Interfacial activity of blood factors FXII (symbols, preparation 1 Table 1) and FXIIa
(cross, preparation 2) solutions with concentration scaled as a ratio-to-physiological concentration.
Data points for FXIIa (3594 sec drop age) suggest that adsorption of these two proteins to the LV
interface was not substantially different. Statistically-fit smooth curves drawn for FXII at 0.25, 900,
1800, and 3594 sec drop age illustrate FXII adsorption kinetics.
38
Page 57
-4 -2 0 235
40
45
50
55
60
65
70
75
log10([Solution Concentration, CB]/[Physiologic Concentration, P])
γγ γγ lv(d
ynes
/cm
)
39
Page 58
Chapter 2
Traube-Rule Interpretation of Protein Adsorption at the Liquid-Vapor Interface
Abstract
Pendant-drop tensiometry of aqueous-buffer solutions of purified human proteins spanning nearly three
orders-of-magnitude in molecular weight (MW) reveals that reduction in liquid-vapor (LV) interfacial
tension γlv followed a systematic progression in MW with the molar concentration required to reach a
specified γlv value decreasing with increasing MW in a manner reminiscent of the Traube-rule for linear
hydrocarbon surfactants. Furthermore, concentration-dependence of interfacial tension (dγlv/dlnCB, where
CB is bulk-solution concentration) is observed to be surprisingly invariant among this disparate group of
proteins (i.e. approximately constant apparent Gibbs’ surface excess Γ = -1/RT dγlv/dlnCB). These
findings are interpreted through a model of protein adsorption predicated on the interfacial packing of
spherical molecules with dimensions scaling as a function of MW. The Traube-rule-like ordering is
rationalized as a natural outcome of an invariant partition coefficient that entrains a fixed fraction of bulk-
solution molecules within a LV interphase which thickens with increasing protein size (MW). Thus,
protein adsorption follows a homology in molecular size rather than composition. Calibration of the
sphere-packing model to previously-reported neutron reflectometry (NR) of albumin adsorption permitted
interpretation of tensiometric results in terms of interphase thickness and multilayering, predicting that
relatively small proteins with MW < 125 kDa (e.g. albumin) fill a single layer whereas larger proteins
with MW ~ 1000 kDa (e.g. IgM) require up to five molecular layers to satisfy a constant partition
coefficient.
40
Page 59
2.1. Introduction
Isidor Traube’s 1891 investigation of the liquid-vapor (LV) interfacial tension γlv of hydrocarbon
acid, alcohol, ester, and ketone homologs dissolved in water1 may well be the first systematic
observation of what is now commonly known as the hydrophobic effect.2-4 Traube observed that
the molar concentration required to reduce γlv to an arbitrary value decreased in regular
progression with each added methylene unit within a particular homologous series. This pattern
eluded Traube’s predecessor Emile Duclaux (1840-1904) who, working exclusively in
weight/volume (w/v) dilutions, failed to scale concentration-dependent γlv by solution molarity
and discern the pattern that later became evident to Traube.5 Hence history-of-science celebrates
the ‘Traube rule’ and remembers Duclaux better by his work with Pasteur and leadership of the
Pasteur Institute than his efforts in physical chemistry. Nearly a quarter century later in 1917,
Irving Langmuir applied a straightforward thermodynamic interpretation of the Traube rule6 that
systematized existing surfactancy data by assuming that surfactant adsorbed to a planar LV
interface as a single molecular layer, with hydrocarbon ‘tails’ protruding through the plane. This
insight, which we take quite for granted today, effectively allowed him to the estimate the work
required to expel a methylene group from aqueous solution (approx. 640 cal/mole).7
Accordingly, the Traube rule results from the fact that neither “amphilicity” (interaction
energetics with water) nor adsorbed ‘foot print’ of an extended methylene chain (the
hydrophobic moiety of a hydrocarbon surfactant) changes significantly within a homologous
series and, as a consequence, γlv scales in a regular and predictable pattern with solution molarity.
Thus it is now understood that adsorption of these simple surfactants to the LV interface is
effectively dictated by the energetics of hydrophobic hydration.8
41
Page 60
These water-orchestrated effects were not entirely lost on natural scientists contemporaneous
with Langmuir who were just beginning to piece together the now-familiar biochemistry of life
(see, as examples refs. 9,10 and especially 11,12 for a history-of-science perspective). Not fully
appreciated then but commonly acknowledged today5 is that the hydrophobic effect underlies
many important biological functions2,13 such as formation/stability of lipid bilayers, folding of
proteins into higher-order structure, and the “biosurfactancy” of proteins14 that controls
adsorption to medical-device surfaces. This latter subject is extremely important in the field of
biomaterials, the primary motivation of this work, because it is generally agreed within the
biomaterials community that protein adsorption mediates and directs the observed biological
response to artificial materials (see refs. 15, 16 and citations therein). Exactly how this occurs at
the molecular level is not so clear however, and protein adsorption remains one of the most
controversial and recondite topics in contemporary biomaterials surface science.14,15,17,18 Failure
to come to grips with the protein-adsorption problem is as curious as it is vexing, for one might
have otherwise anticipated that water, the universal biological solvent system,11,18 would impart
more obvious regularity in protein adsorption than is readily discernable from the intensive
research effort invested in this subject. That is to say, no Traube-like rule for protein adsorption
is apparent from decades of focused research, especially as it relates to biocompatibility of
materials.
With all of the aforementioned in mind, we have undertaken an extensive study of time-and-
concentration-dependent γlv of purified human-protein solutions. A significant motivation of this
work was to broaden the scope of previous investigation to include proteins with molecular
weight (MW) spanning three orders-of-magnitude in search of a pattern missed in similar
42
Page 61
previous studies with narrower focus (see especially ref. 19 and citations therein). As in these
earlier studies, the LV interface was chosen as a molecularly-smooth, model hydrophobic surface
where interfacial energetics are directly accessible to tensiometric (surface thermodynamic)
techniques and adsorbed-protein concentrations Γ can be deduced by application of Gibbs’
isotherm.14 In a manner evocative of the brief history reviewed above, we observe that
concentration-dependent γlv among these diverse proteins is more similar than dissimilar when
scaled on a w/v basis whereas molarity scaling reveals a Traube-rule-like ordering15 by MW at
nearly constant Γ.
These results are herein interpreted through a model predicated on the packing of globular-
protein molecules having nearly spherical dimensions within the LV surface region. This model
explains the Traube-rule-like progression in MW as resulting from adsorption of progressively-
larger spheres within a commensurately-thickening surface region, leading to a homology in
protein size (rather than methylene units in linear hydrocarbon surfactants). Unlike Langmuir’s
two-dimensional (2D) interpretation of the interface, which was a good approximation for small-
molecule surfactants, the model explicitly treats the surface as a 3D interphase with finite
volume that accommodates larger protein molecules. Just as in Langmuir’s analysis of
hydrocarbon surfactants, however, it is concluded that protein amphilicity does not significantly
change within the homologous series in molecular size and, as a consequence, it is possible to
rationalize how it happens that γlv scales with solution molarity at nearly constant Γ. Hence, we
find that water does indeed impose discernable regularity in protein adsorption; a factor that may
help better understand the energetics behind the biological response to materials.
43
Page 62
2.2. Materials and Methods
Purified Proteins: Table 1 compiles pertinent details on proteins and surfactants used as
received without further purification. Protein purity was certified by the vendor to be no less
than the respective values listed in Column 4 of Table 1, as ascertained by electrophoresis (SDS-
PAGE or immunoelectrophoresis). Mass, concentration, and molecular weights supplied with
purified proteins were accepted without further confirmation. Ref. 15 discloses all details related
to protein solution preparation including serial dilutions of protein stock solutions (usually 10
mg/mL) that were performed in 96-well microtiter plates by (typically) 50:50 dilution in
phosphate buffered saline solution (PBS) prepared from powder (Sigma Aldrich) in distilled-
deionized (18 MΩ) water (interfacial tension of PBS and water was checked periodically by
Wilhelmy-balance tensiometry).
Liquid-Vapor Interfacial Tension Measurements: LV interfacial tensions γlv reported in this
work were measured by pendant-drop tensiometry using a commercial automated tensiometer
(First Ten Angstroms Inc., Portsmouth VA) applying techniques discussed in detail elsewhere.15
Briefly, the tensiometer employed a Tecan liquid-handling robot to aspirate between 10-12 µL of
solutions contained in a 96-well microtiter plate prepared by the serial-dilution protocol
mentioned above. The robot was used to reproducibly transfer the tip with fluid contents into a
humidified (99+ % RH) analysis chamber and dispense between 6-11 µL pendant drops (smaller
drop volume required for lower interfacial tensions) within the focal plane of a magnifying
camera. These and all other aspects of pendant drop analysis were performed under computer
control. Precision of γlv was about 0.5 dyne/cm based on repeated measurement of the same
pendant drop. The instrument was calibrated against pure water interfacial tension and further
44
Page 63
confirmed on occasion against Wilhelmy-balance tensiometry. The analysis chamber was
thermostated to a lower-limit of 25±1 oC by means of a computer-controlled resistive heater.
Upper-temperature limit was, however, not controlled but rather floated with laboratory
temperature, which occasionally drifted as high as 29 oC during summer months. Thus, reported
γlv values are probably not more accurate than about 1 dyne/cm on an inter-sample basis
considering the small but measurable variation of water interfacial tension with temperature.
This range of accuracy is deemed adequate to the conclusions of this report which do not
strongly depend on more highly-accurate γlv that is difficult to achieve on a routine basis.
Instead, veracity of arguments raised herein depend more on a breadth of reliable measurements
made across the broad selection of human proteins listed in Table 1. Data analysis and
statistical methods are fully described in ref. 15.
2.3. Theory
General Features of the Protein-Adsorption Model: The protein-adsorption model disclosed
below is based on two related experimental observations and implications thereof; namely, (i) the
surprisingly slight variation in the concentration dependence of liquid-vapor interfacial tension
γlv among the diverse globular proteins studied herein spanning nearly three decades of
molecular weight MW (see Tables 2.1-2.2) and (ii) the substantially constant value of the
apparent Gibbs’ surface excess Γ for these proteins. The model asserts that these are outcomes
of a relatively constant partition coefficient P that entrains protein within an interphase region
separating bulk-solution from bulk-vapor phases. The interphase thickens with increasing
protein size because volume occupied by adsorbed-protein molecules is proportional to MW
according to the well-known relationships among MW, solvent-exposed area, volume, and
45
Page 64
packing density.20 As a consequence, interphase concentrations CI of larger proteins are lower
than that of smaller proteins at constant P ≡ CI/CB. This latter effect leads directly to a Traube-
rule-like ordering for proteins. These principal assertions coupled with a packing model for
adsorbed protein provide analytical relationships that, when fitted to experimental data, yield
scaling relationships for protein adsorption relating molecular size (MW) to interfacial
energetics.
Liquid-Vapor (LV) Interphase: The LV surface region is modeled as a layer with finite
thickness bounded on one side by the bulk-vapor phase and bulk-solution phase on the other.
This “3D” surface-region paradigm is consistent with Gibbs or Guggenheim constructions and
certain venerable adsorption-kinetics models including a sub-surface surface region (such as
Ward and Tordai),21 but is not necessarily consistent with a strictly “2D” concept in which all
adsorbate is constrained to a single interfacial layer (see refs. 3,14 and citations therein for more
discussion relevant to protein adsorption). More specifically, the interphase is modeled
(following Schaaf and Dejardin for example)22 as consisting of N slabs with thickness δ, the
characteristic size of the protein molecule under study (in cm), such that the total interphase
thickness (in cm) Ω = Nδ and volume VI = AΩ = ANδ (in cm3); where A is the interfacial area
(cm2) and N is an integer number of slabs that may be fully or partially filled. The interphase
solute concentration CI (in moles/cm3) is related to these variables through Eq. 1:
ΩΓ≈⎟
⎠⎞
⎜⎝⎛
−ΩΓ=+Ω
Γ=+⎟⎠⎞⎜
⎝⎛Γ=⎟
⎠⎞
⎜⎝⎛ +
== lvlvIlvB
lvBaIII P
PP
CCNANnnVnC
1/ δδ
….Eq. 1
46
Page 65
where nI is the total number of solute moles (comprised of adsorbate na over-and-above nB
contributed by the bulk phase) that reside within VI and Γlv is the Gibbs’ surface excess
(moles/cm2), respectively. The approximation is specific to the case that adsorption is
energetically favorable for which the (dimensionless) partition coefficient P ≡ CI/CB >> 1; as
generally anticipated for protein adsorption to a hydrophobic interface,3 so that bulk-phase
contribution to nI is negligible relative to that adsorbed from solution at steady-state (i.e. nB < na;
CI is dominantly adsorbate). As will be discussed in greater detail below, Γlv generally differs
from the apparent Γ deduced directly from experimental measurements.
Proteins and Protein Packing within the LV Interphase: Oblate-spheroid, globular-protein
molecules are approximately spherical in aqueous solution4,23 and are consequently modeled as
spheres with radius rv = 6.72X10⁻⁸MW1/3(packing-volume radius in cm for MW expressed in
kDa; see ref. 20 for a review of literature up to 1977 and refs. 24-29 for subsequent work
regarding spherical dimensions and molecular packing proteins). This strategy is similar to that
adopted by Ostuni et al.30 in which sphere packing is taken to be the simplest physically-relevant
model intended to yield semiquantitative description of general trends in protein adsorption.
This model is not expected to account for the myriad complexity and variations among proteins
that no doubt invalidate spheric assumptions at a detailed level of investigation. Thus, we
assume that spherical dimensions apply approximately to proteins with 10 < MW < 1000 kDa,
although we have no specific evidence for this other than the above-cited literature and the extent
to which the derived model simulates or fits experimental data. With these molecular
dimensions, the highest conceivable solution concentration of protein corresponds to face-
centered-cubic (FCC, or equivalently hexagonal) close packing of spheres with radius rv. Such a
47
Page 66
close-packed unit cell contains eight ⅛ spheres and six ½ spheres (total of 4 spheres) residing
within a cubic volume (2rv√2)3 and hence the FCC protein concentration CFCC = 4
molecules/(2rv√2)3. Using HSA as an example protein with MW = 66.3 kDa and calculated rv =
2.7 nm, CFCC = 14.6 mM (or about 24X physiological concentration;31,32 lnCFCC = 23.4 in pM).
Such high concentrations are not at all likely in either bulk solution or within the interphase.
However, it seems reasonable to propose that the maximal interphase concentration CImax is
proportional to CFCC through a packing-efficiency parameter ε that effectively measures how
close protein spheres can pack, such that CImax
= εCFCC. We assume that packing within an
aqueous interphase is limited by repulsion of hydrated spheres33 and, as a consequence, regard ε
as a generic factor independent of protein (sphere) size that is approximately constant for all
globular proteins discussed herein. If sphere repulsion is uniform and symmetric, then CImax
effectively results from packing spheres with radius R = χrv; where χ is a factor measuring the
excluded volume surrounding each molecule. Given that CFCC = 4 molecules/(2rv√2)3 and CImax
= 4 molecules/(2R√2)3 = εCFCC, it follows that χ = ε-⅓. Hence, molecular dimensions (2rv) differ
from the characteristic dimensions δ = 2rvχ = 2rvε-⅓.
It is of interest to express the protein-packing concepts discussed above in terms of volume
fractions as a means of probing further the physical meaning of ε. The volume fraction occupied
by protein Φp = nIVp/VI = CIVp; where the protein molar volume Vp = 4/3πrv3NA if NA is the
Avogadro number. At interphase saturation, CI = CImax
so that Φpmax = 0.74ε; revealing that
Φpmax is equivalent to FCC packing at ε = 1 (by model construction) and decreases linearly with
(fractional) ε. It is noteworthy that Φpmax is independent of MW because efficiency of packing
spheres does not depend on size, even though the volume occupied by large spheres is greater
48
Page 67
than that of small spheres. Thus, the protein-packing model views adsorption as a process
leading to displacement of a fixed amount of water that is controlled by ε and that interphase
capacity for protein is controlled by the energetics of what amounts to be interphase
dehydration.34
A Traube-Like Rule for Protein Adsorption: Eq. 2 combines the notion of CImax
with the
MW-dependent radius of spherical proteins, where experimentally-convenient dimensions of
picomolarity (10-12 moles/L) have been introduced:
( )( ) ( ) ⎟
⎠⎞⎜
⎝⎛===
− Lpicomole
MWX
MWXmolecules
r
moleculesCv
Iεεε 11
33/183max 1068.9
1072.6177.0
22
4 ...Eq. 2
It is apparent from Eq. 2 that maximal interphase protein concentration varies inversely with
protein size (MW), with higher concentrations for low-MW proteins and sharply-lower
concentrations for higher-MW proteins. Interphase saturation occurs at CImax
and must therefore
correspond to the bulk concentration CBmax at which the limiting interfacial tension γ'
lv is
achieved (i.e. the concentration at maximum spreading pressure Πmax ≡ γolv - γ'
lv). CBmax can be
estimated from concentration-dependent γlv curves (see Appendix, 2.6.1) and is related to CImax
through the partition coefficient P ≡ CImax/CB
max. Eq. 3 states this relationship as a logarithmic
expression that is convenient to apply to (steady-state) concentration-dependent γlv data:
( ) ( ) ([ ]PMWPMWXPCC I
B /ln6.27ln/lnln1068.9lnlnln 11max
max εε ++−=+−=⎟⎠⎞
⎜⎝⎛= ) …. Eq. 3
49
Page 68
Assuming that ε/P is constant for all proteins within this study (as discussed above for ε and
below for P), Eq. 3 predicts a linear relationship between lnCBmax and lnMW with a slope of –1.
A value for the unknown ratio ε/P can be extracted from the intercept (see Results section).
Traube’s rule for hydrocarbon surfactants stipulates that the concentration required to reduce γlv
to an arbitrary value γ*lv decreases in a regular progression with each -CH2- unit (i.e. MW) in a
homologous series.1,2,4,7 Gibbs’ adsorption isotherm can be combined with Eq. 3 to derive a
Traube-like rule for proteins by noting that the apparent Gibbs’ surface excess Γ is approximated
by slope of the linear-like region of experimental concentration-dependent γlv curves35,36 (i.e. the
‘surface excess region’ falling between γlvo and γ'
lv centered at lnCBΠ/2; see Fig.2.1A
annotations):
( )
[ ]*max
*'
lnlnlnlnBB
lvlv
B
lv
B
lv
CCCRTC −−
=∆∆≈Γ−=
γγγδ
δγ …….…………….. Eq. 4
( )[ ]MWCPRT Blvlv lnlnln6.27 *'* −−+Γ+= εγγ ...…...……………Eq. 4a
50
Page 69
where CB* is the concentration required to achieve any arbitrary γ *
lv within the surface-excess
region. Eq. 4a follows directly from Eq. 4 by insertion of Eq. 3 and is a Traube-like rule for
globular proteins where the homology is in protein size rather than methylene units in linear
surfactants. This size homology results directly from the proportional increase in protein volume
with MW.20
Protein Partition Constant: A central assumption of this work is that the partition coefficient P
is approximately constant for all proteins. The Guggenheim interphase construction37,38 can be
used to explore this notion more explicitly which, for a two-component solution (surface-active
solute ‘2’ and solvent ‘1’), the concentration dependence of liquid-vapor interfacial tension is
given by Eq. 5:
⎥⎦
⎤⎢⎣
⎡⎟⎟⎠
⎞⎜⎜⎝
⎛−
−≈⎥
⎦
⎤⎢⎣
⎡⎟⎟⎠
⎞⎜⎜⎝
⎛−
−= 2
1
121
1
22
2ln nnnn
ARTn
xxn
ART
xI
IIIlvδ
δγ ……………………Eq. 5
where the superscript “I” differentiates the interphase region from the bulk phase (with no
superscript), n is number of moles of 1 or 2, and x is mole fraction. The approximation applies
to dilute-solute solutions where x2 = n2/(n1+n2) ~ n2/n1 and x1 ~ 1. Eq. 5 can be written in terms
of solvent and solute partition coefficients P1 ≡ CI,1/CB,1 = (n1I/n1)(V/VI) and P2 ≡ CI,2/CB,2 =
(n2I/n2)(V/VI), respectively:
[ ] [ ] [ 1ln 22,122,122,
2−Ω−≈−Ω−=−
−= PRTCPPRTCPP
AVRTC
x BBIBlv
δδγ ] ….Eq. 6
51
Page 70
where VI is the interphase volume used as above, V is the bulk-solution volume, and the identity
VI = AΩ has been applied. The approximation is valid for dilute-solute solution for which
change in solvent concentration within the interphase due to adsorption is negligible. Eq. 6 is
valid for any two proteins ‘i’ and ‘j’ that might have quite different MW (MWj ≠ MWi) but for
which we observe experimentally to exhibit similar δγlv/δlnx2 (i.e. the apparent Gibbs’surface
excess is approximately constant for all proteins). Simultaneous solution of these two equations
using ‘i’ and ‘j’ in place of the generic ‘2’ solute designation of Eq. 6 for the particular situation
CB,2 = CBmax allows solution for the partition coefficients Pi and Pj in terms of interphase
thickness and bulk concentrations:
[ ][ ] j
i
jB
iB
jI
iI
jB
iB
j
i
i
j
PP
CC
CC
CC
PP
=⎟⎟⎠
⎞⎜⎜⎝
⎛⎟⎟⎠
⎞⎜⎜⎝
⎛
Γ
Γ=⎟
⎟⎠
⎞⎜⎜⎝
⎛⎟⎟⎠
⎞⎜⎜⎝
⎛
ΩΩ
=−
−max
,
max,
max,
max,
max,
max,
max
max
//
11
…………………Eq. 7
where Eq. 7 makes use of the approximation CI = nI/VI ≈ Γ/Ω that is commensurate with
P >> 1. Thus Eq. 7 leads to the conclusion that Pj (Pj –1) = Pi (Pi –1), a condition that can be met
only if Pi = Pj. Evidently then, similar dγlv/dlnCB means that the partition coefficient P ≡ CI/CB
is approximately constant among proteins spanning nearly three decades in MW and does not
significantly vary with molecular size.
Surface Excess: An issue that arises in the quantitative interpretation of concentration-
dependent LV interfacial tensions is that activity coefficients, even of simple hydrocarbon
solutes, are not typically unitary as is frequently assumed in application of Gibbs’ adsorption
isotherm, and deviations from ideality have significant impact on computed values of Gibbs’
52
Page 71
surface excess.39 Proteins are complex polyelectrolyte solutes that are not ideal40,41for which
assumption of unit activity coefficients is no doubt quantitatively in error and apparently leads to
considerable difference between real (Γlv =-1/RT dγlv/dlna where a is solute activity) and
apparent (Γ = -1/RT dγlv/dlnx2, not corrected for solute activity) surface excess values. However,
in this particular work, it is experimentally observed that Γ is approximately constant for proteins
with widely varying MW, strongly suggesting that any activity-related discrepancy between Γ
and Γlv is roughly constant among these proteins. The ratio Γ/Γlv measures this discrepancy and
can be written in terms of an activity coefficient σ ≡ a/x2 by noting that Γlv =-a/RT (dγlv/da) and
Γ = - x2/RT (dγlv/dx2):
( )( ) ( ) ( ) cdxddxdaxaddadxxd lvlvlvlv ≈===ΓΓ 2222 //1///// σσγγγ ……………Eq. 8
Thus, Γ = cΓlv under the circumstance that the (generally unknown) activity coefficient σ is not a
strongly non-linear function of protein concentration.
Interphase Thickness: The maximal interphase thickness Ωmax that occurs when the interphase
is saturated with adsorbate can be computed from Eq. 1 in combination with Eq. 2, assuming that
Γ = cΓlv:
max max8/
9.68 10lv IMWc CX ε
ΓΩ = Γ = ……………………………………………….Eq. 9
where units of picomoles and cm have been used. Eq. 9 states that Ωmax increases in direct
proportion to protein MW (i.e. proportional to protein volume), with a relatively thin interphase
for low-MW (smaller) proteins and a thicker interphase for high-MW proteins. Ωmax may be
53
Page 72
comprised of multiple layers as dictated by the partition coefficient P and layer packing
calculated from Nmax = Ωmax/δ = Ωmax/2rvχ.
2.4. Results and Discussion
This portion of the paper is divided into two main parts. The first reports experimental
observation of time-and-concentration-dependent liquid-vapor (LV) interfacial tension γlv of
aqueous-buffer solutions of purified human proteins with molecular weight (MW) spanning
nearly three-orders-of-magnitude. The second part interprets these results according to the
sphere-packing model in the general order disclosed in the preceding Theory section. Taken
together, experiment and theory support the contention that water imposes uniformity in protein
adsorption to the LV interface, packing molecules into an interphase region that thickens with
increasing protein size (MW) at a constant partition coefficient.
2.4.1. Experimental Results
Concentration-Dependent LV Interfacial Tension: The principal experimental observations
of this work were time-and-concentration-dependent liquid-vapor (LV) interfacial tension γlv of
aqueous-buffer solutions of purified human proteins with molecular weight (MW) spanning
three-orders-of-magnitude. Interfacial tension measurements were made using pendant-drop
tensiometry as described in the Methods and Materials section. Fig. 1 compares selected results
for the anionic surfactant aerosol-OT (Fig. 1A, AOT, MW = 444 Da), human serum albumin
(Fig. 1B, fatty-acid-free FAF HSA, MW = 66.3 kDa), and immunoglobulin M (Fig. 1C, IgM,
54
Page 73
1000 kDa) in both three-dimensional (3D, γlv as a function of time and concentration) and two-
dimensional (2D, γlv as a function concentration at specified times) representations, termed ‘γlv
curves’ herein. Note that the logarithmic-solute-concentration ordinate lnCB in Fig. 1 is
expressed in picomolarity units (pM, 10-12 moles solute/L solution). It was observed that these
γlv curves were generally sigmoidal in shape, with well-defined low-concentration limits γolv and
a high-concentration asymptotes γ'lv. Smooth curves through the data of Fig. 1 result from least-
squares fitting of a four-parameter logistic equation (γlv = [(γolv - γ'
lv)/(1+(lnCBΠ/2/lnCB)M]+
γ'lv) to concentration-dependent γlv data for each time within the observation interval, as
described elsewhere.15,35,36 Empirical application of a logistic equation was a purely pragmatic
approach aimed at quantifying variable parameters with a measure of statistical confidence. In
this way, data fitting recovered γolv, γ'
lv, and a parameter measuring concentration-at-half-
maximal-change in interfacial activity, lnCBΠ/2 (where Π/2 = ½Πmax and Πmax ≡ γo
lv - γ'lv), as well
as a parameter M that measured steepness of the sigmoidal curve. Results for HSA and IgM
(Fig. 1B and 1C, respectively) were similar to AOT in that sigmoidal-shaped γlv curves
connected low- and high-concentration asymptotes. Significantly more pronounced time
dependence in γlv was observed for proteins, however, especially for intermediate concentrations.
Dynamics were undoubtedly due to rate-limiting, mass-transfer and adsorption steps that slowly
brought large macromolecules to the LV interface relative to the small-molecule reference
compound AOT for which only limited kinetics were observed. Observation of time-dependence
was important in this particular work only in so far as data demonstrate that γlv kinetics dampen
within the time frame of experimentation and achieved steady state within the 3600 sec
observation window. Data collected in Table 2 refers only to steady-state measurements. The
55
Page 74
bulk-solution concentration at which the limiting interfacial tension γ'lv occurs (CB
max) is of
theoretical interest in this work and was estimated from fitted parameters compiled in Table 2 as
described in the Appendix 6.1. CBmax is typically interpreted as the critical micelle concentration
(CMC), at least for surfactants. This paper provides no evidence of micelles, for either proteins
or surfactants, and so only acknowledges a bulk-phase concentration at which further increase in
solute concentration did not significantly change γlv.
Fig. 2 compiles smoothed, steady-state γlv curves for proteins selected from Table 2 spanning
three decades in MW (data not shown in Fig. 2 for the sake of clarity; see Fig. 1 for examples
with authentic data and Table 2 for statistics-of-fit). The Traube-rule-like progression in MW
evident in the molar scaling of Fig. 2 was not at all obvious on a w/v basis (not shown) because
data is compressed into a single band.15 However scaled, similarity of γlv curves for such a
diverse group of proteins is rather striking (Πmax < 30 dyne/cm with γ'lv lying within ±10
dyne/cm) and corroborates results of previous studies of proteins covering a narrower range of
MW.19 Bearing in mind that the Πmax range for synthetic surfactants can exceed 60 dyne/cm,
with 25 < Πmax < 50 dyne/cm typical of ordinary hydrocarbon soaps and surfactants,42,43 it is
apparent from data of Table 2 and Figs. 1, 2 that aqueous-protein solutions are relatively weak
surfactant systems with Πmax only slightly overlapping with the weakest of surfactant systems. In
view of the substantial structural diversity of the human plasma proteome sampled by proteins of
Table 1,31 it seems reasonable to conclude that variability in protein structure does not confer
widely-varying LV interfacial activity; at least not in comparison to the full range available to
ordinary surfactants.
56
Page 75
Apparent Gibbs’ Surface Excess: The apparent Gibbs’ surface excess Γ with error estimates
collected in Table 2 were calculated from the slope of the linear-like region of the concentration-
dependent γlv curve (i.e. the surface excess region between γlvo and γ'
lv centered at lnCBΠ/2; see
Fig. 1) corresponding to steady-state, as described previously.35,36 The term “apparent” alerts the
reader to the facts that casual application of Gibbs’ adsorption isotherm [Γ = (-1/RT)dγlv/dlnCB]
treats solutes (proteins and surfactants) as isomerically-pure, non-ionized polyelectrolytes44 at
infinite dilution with unit activity coefficients.39 In particular, this treatment does not explicitly
take into account counter ions which, for a 1:1 ionic surfactant such as AOT dissolved in pure
water, means that the actual surface excess Γlv = 1/2 Γ.43,45 Thus, Γ = 460 ± 31 picomole/cm2
derived from data of Fig. 1A was found to be in good agreement with drop-volume tensiometry
(Γlv = 221 picomole/cm2) and predicts an adsorbed footprint 1/Γlv = 70 Å2/molecule in
reasonable agreement with neutron reflectometry (NR) measurements.45,46 No counter-ion
correction of apparent surface excess Γ was necessary for polyelectrolytes dissolved in
swamping concentrations of buffer salts,43 however, and values listed in Table 2 were taken to be
proportional to the actual Gibbs’ surface excess Γlv, as discussed in the Theory section; bearing
in mind, of course, the aforementioned assumptions of purity and applicability of the infinite-
dilution approximation.
Fig. 3 plots apparent Γ values collected in Table 2 against protein MW, with error bars
representing intra-experiment uncertainty calculated by propagation of fitted-parameter errors, as
described previously.35,36 Inter-experiment error suggested by replicate protein preparations
(sometimes different lots obtained from different vendors, see Table 1) appeared not to be
significantly larger than intra-experiment uncertainty. Taken as a whole, this data supports the
57
Page 76
contention that concentration-dependence of interfacial tension dγlv/dlnCB was relatively constant
among proteins with MW spanning nearly three-orders-of-magnitude (10–1000 kDa).
Again in view of the substantial structural diversity of the human plasma proteome sampled by
proteins of Table 1,31 it seems reasonable to conclude that variability in protein structure does
not confer widely-varying LV interfacial activity.
2.4.2. Theoretical Interpretation of Results
Secure interpretation of concentration-dependent interfacial tensions in terms of adsorbed
concentrations and interphase thicknesses is critically dependent on availability of solvent39 and
solute activities47 for protein solutions of particular interest to this work, as well as packing
densities within a 3D interphase. Specific information of this kind is, for the most part,
unavailable and much of the existing protein-adsorption literature is quite controversial or
internally inconsistent (see ref. 3 and citations therein). Interpretive problems are exacerbated by
the fact that only a narrow range of protein MW has been heretofore explored; concentrating
work on relatively low-MW proteins31 such as albumin, lysozyme, and casein; thus comparing
proteins derived from different tissues (e.g. blood, ocular, mammary) and sometimes from
different species (e.g. bovine v. human). On occasion, chemically-treated proteins are used as
surrogates for natural forms, such as in the delipidization of fraction (FV) albumin to fatty-acid-
free (FAF) serum albumin. This work is exceptional only in that it has specifically focused on
purified human globular proteins with a broad range of molecular weights. Even so, a standard
of reference is required to (partially) compensate for unknown protein activity. Thus, we have
chosen to ‘calibrate’ the model outlined in the Theory section to the neutron reflectometry (NR)
58
Page 77
of FAF HSA at the LV interface reported by Lu et al.48, recognizing that this single-point
calibration to delipidated protein may bias the outcome but with the expectation that any such
bias will be systematic and that general trends revealed will not be seriously compromised.
Protein Packing within the LV Interphase: NR resolved a single molecular layer of FAF
HSA at the LV interface at saturating surface coverage, residing within a 4.8 nm thick layer.48
This finding is somewhat consistent with a protein-sphere radius rv = 2.7 nm calculated from
molecular-packing density calculations discussed in the Theory section or, as described in the
cited NR literature, a 4X14 nm ellipsoidal molecule adsorbed with the major axis oriented
parallel to the interface. The adsorbate mass/unit area deduced from NR was 2.1 ± 0.3 mg/m2, or
3.2 picomole/cm2 and construed to be equivalent to Gibbs’ surface excess Γlv.49 Interpreted in
terms of Eq. 9 of the sphere-packing model, this implies that Ωmax = 4.8X10⁻⁷ cm and that CImax
= Γlv/ Ωmax = 6.7X10⁶ picomole/cm3 (6.7X10⁹ pM or lnCImax = 22.6 for comparison with scaling
of Figs. 1, 2, and 5). With CFCC = 1.5X10¹⁰ pM for HSA (lnCFCC = 23.4), this implies that ε ~
0.45, or that the saturation interfacial concentration is approximately half of the hypothetical
face-centered cubic arrangement of hard spheres with radius rv, or Φpmax = 0.74ε ~ 1/3. The
effective-packing radius R is thus 30% larger than rv with χ = 1.3 (as calculated from δ = 2R =
2rvχ = 2rvε-⅓ = 7.1 nm), which is consistent with a 3.6 nm hydrodynamic radius obtained by
dynamic light scattering of albumin solutions.50 This inferred value of ε might also be compared
to the so-called ‘jamming limit’ of 0.55 at which adsorbing disks saturate a surface without
overlap,51 and to reports of adsorbed-protein densities exceeding this limit,30,52 so long as it is
borne in mind that these latter benchmarks are specific to molecular packing within a single layer
(2D) and not in multiple layers (3D). It is of further interest that CImax exceeds the estimated
59
Page 78
solubility limit for HSA by a factor of ~9 (CSL = 7.5X10⁸ pM, lnCSL = 20.4 pM or about 50 g/L),
corroborating the conclusion drawn from diverse literature sources that adsorbed concentrations
can be surprisingly large and that a proteinaceous interphase must indeed be a very viscous
region.3 We estimate from steady-state concentration-dependent γlv for FAF HSA that lnCBmax =
14.2±0.2 (1.5X10⁶ pM; see Fig. 1B and Table 2) suggesting that P = (CImax/CB
max) ~ 5X10³,
which is in reasonable agreement with early ellipsometric measurements of bovine albumin,53 as
well as other related studies reviewed in ref. 3. Furthermore, this single-point calculation of P is
consistent with the extrapolated value derived from the Traube-like-rule for proteins (see below),
suggesting that the partition coefficient is approximately constant across the proteins of this
study as deduced from the slight variation in dγlv/dlnCB.
A Traube-Like Rule for Protein Adsorption and Partition Constant: Fig. 4 plots CBmax data
compiled in Table 2 on logarithmic coordinates compatible with Eq. 3 of the Theory section
(data corresponding to ubiquitin was estimated as described in the Appendix 6.2). Proteins fall
within a monotonically-decreasing band consistent with the anticipation of a unit slope and
positive intercept [lnCBmax = (-1.4±2.8) lnMW + (21.8±15.6); R2 = 71.6%]. Interpretation of
these results must take into account that the highly-simplified model of adsorption treats proteins
as uniform hard spheres and does not attempt to account for structural complexities of real
molecules, variations introduced by delipidization (as in the case of FAF HSA), or unfolding
(denaturation) that may occur upon concentration within the interphase. Hence failure of data to
quantitatively adhere to Eq. 3 is hardly surprising. Nevertheless, it is of interest to estimate ε/P ~
3X10⁻³ from the nominal intercept value (bearing in mind the large error) and, by assuming ε ~
0.45 from the preceding section, estimate P ~ 1.5X10²; which is within an order-of-magnitude of
60
Page 79
the single-point estimate based on NR discussed above. According to Eq. 3 and Fig. 4, low-MW
proteins require greater bulk-phase concentrations to saturate the interphase than higher-MW
proteins. Given that CBmax values plotted in Fig. 4 approach 10 % w/v, it is reasonable to
anticipate that extrapolated CBmax values for yet-lower-MW proteins must equal or exceed
protein-solubility limits. As a consequence, surface saturation and the related limiting interfacial
tension γ'lv is not expected for low-MW proteins at fixed P. In this regard, it is noteworthy that
γlv curves for low-MW proteins such as ubiquitin (10.7 kDa) fail to achieve a limiting interfacial
tension at any concentration below the solubility limit15 (see Fig. 4 and further below).
Fig. 5 is a summary graphic showing relationships among steady-state γlv, MW, and
concentration of aqueous-buffer solutions of globular proteins. Data points of Fig. 5 correspond
to proteins selected from Table 1 whereas the mesh was calculated from Eq. 4a of the Theory
section using the fitted value of ε/P obtained as discussed above and as further detailed in
Appendix 6.3. The Traube-rule effect is especially evident as viewed along the lnCB axis where
increasing concentration of lower-MW proteins are required to reach the limiting interfacial
tension γ'lv. It is noteworthy that γ'
lv is not achieved for low-MW proteins such as ubiquitin, as
discussed above.
Surface Excess and Interphase Thickness: Again using NR of HSA as a single-point
calibration by taking Γlv = 3.2 picomole/cm2, the factor relating actual and apparent surface
excess c = Γ/Γlv = 179/3.2 = 56. Eq. 9 can be used to calculate maximum interphase thickness
and, from rv, the number of layers required to contain different size proteins. As shown in Fig.
2.6, interphase thickness increases linearly with MW. The number of layers occupied by protein
61
Page 80
has been calculated as increasing in steps, although it seems more likely that transitions are not
so discrete; more probably partially filling an additional layer before the previous is well packed.
However these layers actually populate, Eq. 9 predicts that, at fixed partition coefficient P, low-
MW proteins such as albumin (66 kDa) fall within one layer whereas large proteins such as IgM
(1000 kDa) occupy five layers. Thus, the constraint that P is approximately constant for all
proteins imposes the requirement that proteins with MW > 125 kDa populate more than a single
layer at surface saturation.
2.5. Conclusions
The two principal experimental observations of this work were that (i) reduction in liquid-vapor
(LV) interfacial tension γlv of aqueous-buffer solutions of purified human proteins followed a
regular progression in MW with the molar concentration required to reach a specified value
decreasing with increasing MW and (ii) the rate-of-change in γlv with protein concentration
dγlv/dlnCB was relatively constant among proteins with MW spanning nearly three-orders-of-
magnitude (10–1000 kDa). The former observation was interpreted in terms of a protein-
adsorption model predicated on the packing of spherically-shaped molecules with dimensions
that scale with MW. The latter was rationalized as an outcome of a constant partition coefficient
that entrained a fixed fraction of bulk-solution molecules within a three-dimensional interphase
that thickens with increasing proteins size (MW). When calibrated to previously-reported
neutron-reflectometry (NR) of albumin adsorption to the LV interface, the model permitted
calculation of interphase thickness and number of molecular layers residing within this
interphase. Interphase thickness was predicted to increase linearly with MW, requiring up to five
62
Page 81
layers for large proteins (MW ~ 1000 kDa) but only a single layer for small proteins (MW < 125
kDa).
This study strongly suggests that water orchestrates a systematic pattern in protein adsorption to
the LV interface that has not been evident from similar previous studies using proteins covering
a narrower MW range. Realization of this pattern has followed a somewhat similar historical
pathway to understanding the Traube rule, requiring routine access to purified compounds with
known MW spanning a sufficiently large range that homology could be observed. In the protein
case, the homology is molecular size, rather than chemical composition as in the Traube rule,
implying that the structural variability that confers vastly different bioactivity to proteins does
not greatly affect interaction energetics with water. It is these interactions that lead to the
expulsion of protein from solution14 to the hydrophobic LV interface, simultaneously reducing
interfacial energetics and solution concentration of a relatively hydrophobic solute11 for which
water is an ambivalent solvent.54,55 Amphilicity is the word coined by Hartley56 in 1936 to
express this ambivalent solvency from the perspective of the solute molecules (originally
amphipathy). Apparently in the case of proteins, molar variability in γlv is achieved by
aggregating greater mass of similar amphiphilic character (blocks of amino acids), as opposed to
accumulating greater amphilicity with MW. The extent to which this amphilicity leads to protein
accumulation at the LV interface is limited by the extent to which this surface can be dehydrated,
interpreted herein as protein volume fraction Φpmax ~ 1/3. The significance of these conclusions
to biomaterials science is that combinations and permutations of the 20 naturally-occurring
amino acids comprising the primary sequence of mammalian proteins seems insufficient to
support widely-varying LV interfacial activity, no matter how these sequences happen to fold
63
Page 82
into higher-order structure. As a consequence, assertion of differential protein adsorption to
biomaterial surfaces from heterogeneous biological mixtures (such as blood) based on molecular
structure alone requires careful justification in terms of interfacial energetics,15 bearing in mind
that hydrophobic hydration is a, perhaps the, key phenomenon controlling adsorption.
2.6. Appendix
2.6.1. Estimation of CBmax
CBmax was calculated from fitted data by evaluating Eq. 4a of the Theory section at half-maximal
change in interfacial tension γΠ/2 = ½(γo
lv - γ'lv), which occurs at a bulk-phase composition
lnCBΠ/2:
( )[ ]
( )[ ]
[ ]2/
2/
2/
2/
ln2
lnlnln
2
lnlnlnlnln
maxmax
max
max''
max
'
*max
*'
Π
Π
Π
Π
+Γ
Π=⇒
−
⎟⎟⎠
⎞⎜⎜⎝
⎛⎟⎟⎠
⎞⎜⎜⎝
⎛ Π+−
=
−−
=−−
=Γ−=∆∆
BBBB
lvlv
BB
lv
BB
lvlv
B
lv
CRT
CCC
CCCCRTC
γγ
γγγγγ
………..…….. Eq. A1
where the identity Πmax ≡ γolv - γ'
lv has been used. All of the parameters in the RHS of Eq. A1 are
derived from non-linear, least-squares fitting of concentration-dependent γlv to a four-parameter
logistic equation as described in the Methods and Materials section. Confidence in CBmax values
listed in Table 2 and plotted in Fig. 4 was computed by propagation of the standard errors in
best-fit parameters through Eq. A1 as given by Eq. A2. In consideration of all sources of
experimental error, we conclude that lnCBmax estimates are no better than about 20%.
( ) ⎥⎥⎦
⎤
⎢⎢⎣
⎡⎟⎟⎠
⎞⎜⎜⎝
⎛Γ
′−−−
Γ+= Γ
°
′°2
2
222
222
41
2max σγγσσσσ
γγπlvlv
CC
lvlvBB RT ………….......Eq. A2
64
Page 83
where σ ’s represent standard errors in lnCBmax and the best-fit parameters lnCB
Π/2, γolv, γ'
lv and Γ.
2.6.2. Estimation of parameters for Ubiquitin
Parameters for ubiquitin listed in Table 1 and shown in Figs. 2-5 are graphical estimates from the
steady-state, concentration-dependent γlv curve. Firm values could not be ascertained by
statistical-fitting procedures described in Methods and Materials because surface saturation is not
reached within solubility limits for this protein. Thus, a well-defined high concentration
asymptote, γ'lv is not achieved at physically-realizable concentrations. However, the highest-
concentration γlv ~ 46 dynes/cm is within the Πmax of all other proteins studied. Given that Πmax
is conserved among the broad range of proteins, it seems reasonable to conclude that
γlv = 46 dynes/cm is not too far from the hypothetical γ'lv that would be achieved if Ub was
sufficiently soluble to fill the interphase. Thus, we estimate that Πmax/2 ~ 13 dynes/cm would
occur at lnCBΠ/2 = 15 pM. The low-concentration asymptote is clearly defined at γo
lv = 72
dynes/cm, consistent with the interfacial tension of saline near 25oC. An estimate of the apparent
surface excess Γ was made from the experimental data by application of the Gibbs’ adsorption
isotherm. With these estimates in hand, CBmax was calculated as described in Appendix 6.1.
2.6.3. Steady-state γlv as a function of MW and concentration
The smooth mesh through the summary graphic Fig. 5 was computed from Eq. 4a of the Theory
section assuming that the nominal values γolv = 72, γ'
lv = 45 and Γ = 179 approximates all
proteins of this study. Eq. 4a permits calculation on any interfacial tension within the linear-like
Gibbs’ excess region (i.e. the surface excess region between γlvo and γ'
lv centered at lnCB
Π/2; see
Figs.1A, 3), above and below which calculated γlv are truncated to γolv and γ'
lv, respectively.
65
Page 84
Citations
(1) Traube, J. Ueber die Capillaritatscontanten Organischer Stoffe in Wasserigen Losungen,
Annalne Chemie 1891, 265, 27.
(2) Tanford, C. The Hydrophobic Effect: Formation of Micelles and Biological Membranes;
John Wiley & Sons: New York, 1973.
(3) Vogler, E. A. Structure and Reactivity of Water at Biomaterial Surfaces, Adv. Colloid
and Interface Sci. 1998, 74, 69.
(4) Tanford, C. How Protein Chemists Learned about the Hydrophobic Factor, Protein
Science 1997, 6, 1358.
(5) Edsall, J. T. Isidor Traube: Physical Chemist, Biochemisty, Colloid Chemist and
Controversialist, Proc. Am. Philosophical Soc. 1985, 129, 371.
(6) Langmuir, I. The Constitution and Fundamental Properties of Solids and Liquids. II.
Liquids., J. Am. Chem. Soc. 1917, 39, 1848.
(7) Adamson, A. W. Physical Chemistry of Surfaces, 2 ed.; Interscience Publishers: New
York, 1960.
(8) Yaminsky, V. V.; Vogler, E. A. Hydrophobic Hydration, Current Opinion in Colloid and
Interface Sci. 2001, 6, 342.
(9) Macallum, A. B. Surface Tension and Vital Phenomena; The University Library:
Toronto, 1912.
(10) Henderson, L. J. The Fitness of the Environment: An Inquiry into the Biological
Significance of the Properties of Matter; Macmillan Company: Boston, 1913.
(11) Vogler, E. A. Biological Properties of Water. In Water in Biomaterials Surface Science;
Morra, M., Ed.; John Wiley and Sons: New York, 2001; pp 4.
66
Page 85
(12) Vogler, E. A. On the Origins of Water Wetting Terminology. In Water in Biomaterials
Surface Science; Morra, M., Ed.; John Wiley and Sons: New York, 2001; pp 150.
(13) Tanford, C. The Hydrophobic Effect and the Organization of Living Matter, Science
1978, 200, 1012.
(14) Vogler, E. A. Interfacial Chemistry in Biomaterials Science. In Wettability; Berg, J., Ed.;
Marcel Dekker: New York, 1993; Vol. 49; pp 184.
(15) Krishnan, A.; Sturgeon, J.; Siedlecki, C. A.; Vogler, E. A. Traube-Rule Interpretation of
Protein Adsorption to the Liquid-Vapor Interface, J. Biomed. Mat. Res. 2003.
(16) Horbett, T. Protein Adsorption on Biomaterials. In Biomaterials: Interfacial Phenomena
and Applications; Cooper, S. L., Peppas, N. A., Hoffman, A. S., Ratner, B. D., Eds.; Am.
Chem. Soc.: Washington D. C., 1982; Vol. 199; pp 234.
(17) Vogler, E. A. How Water Wets Biomaterials. In Water in Biomaterials Surface Science;
Morra, M., Ed.; John Wiley and Sons: New York, 2001; pp 269.
(18) Vogler, E. A. Water and the Acute Biological Response to Surfaces, J. Biomat. Sci.
Polym. Edn. 1999, 10, 1015.
(19) Tripp, B. C.; Magda, J. J.; Andrade, J. D. , Adsorption of Globular Proteins at the
Air/Water Interface as Measured via Dynamic Surface Tension: Concnetration Dependence,
Mass-transfer Considerations, and Adsorption Kinetics, J. Colloid and Interface Sci. 1995, 173,
16.
(20) Richards, F. M., Areas, Volumes, Packing and Protein Structure, Ann. Rev. Biophys.
Bioeng. 1977, 6, 151.
(21) Ward, A. F. H.; Tordai, L., Time-Dependence of Boundary Tensions of Solutions I. The
Role of Diffusion in Time-Effects, J. Chem. Phys. 1946, 14, 453.
67
Page 86
(22) Schaff, P.; Dejardin, P. Coupling Between Interfacial Protein Adsorption and Bulk
Diffusion. A Numerical Study, Colloids and Surfaces 1987, 24, 239.
(23) Teller, D. , Accessible Area , Packing Volumes, and Interaction Surfaces of Globular
Proteins, Nature 1976, 260, 729.
(24) Chothia, C. Structural Invariants in Protein Folding, Nature 1975, 254, 304.
(25) Miller, S.; Lesk, A.; Janins, J.; Chothia, C. The Accessible Surface Area and Stability of
Oligomeric Proteins, Nature 1987, 328, 834.
(26) Miller, S.; Janin, J.; Lesk, A.; Chothia, C. Interior and Surface of Monomeric Proteins, J.
Mol. Biol. 1987, 196, 641.
(27) Tsai, J.; Taylor, R.; Chothia, C.; Gerstin, M. The Packing Density in Proteins: Standard
Radii and Volumes, J. Mol. Bio. 1999, 290, 253.
(28) Gerstein, M.; Chothia, C. Packing at the Protein-Water Interface, Proc. Natl. Acad. Sci.
1996, 93, 10167.
(29) Miller, S.; Janin, J.; Leak, A. M.; Chothia, C., Interior and Surface of Monomeric
Proteins, J. Mol. Biol. 1987, 196, 641.
(30) Ostuni, E.; Grzybowski, B. A.; Mrksich, M.; Roberts, C. S.; Whitesides, G. M.,
Adsorption of Proteins to Hydrophobic Sites on Mixed Self-Assembled Monolayers,
Langmuir 2003, 19, 1861.
(31) Anderson, N. L.; Anderson, N. G., The Human Plasma Proteome:History, Character, and
Diagnostic Prospects, Molecular and Cellular Proteomics 2002, 1, 845.
(32) Putnam, F. W. Alpha, Beta, Gamma, Omega - The Roster of the Plasma Proteins. In The
Plasma Proteins: Structure, Function, and Genetic Control; Putnam, F. W., Ed.;
Academic Press: New York, 1975; Vol. 1; pp 58.
68
Page 87
(33) Werner, P.; Caflisch, A., A Sphere-Based Model for the Electrostatics of Globular
Proteins, J. Am. Chem. Soc. 2003, 125, 4600.
(34) This conclusion is in general accord with a relatively new theory of protein adsorption
introduced by Rao that concludes adsorption is driven by reduction in interfacial water
chemical potential. See Rao, C. S.; Damodaran, S., Langmuir 2000, 16, 9468-9477.
(35) Vogler, E. A. Practical Use of Concentration-Dependent Contact Angles as a Measure of
Solid-Liquid Adsorption I: Theoretical Aspects, Langmuir 1992, 8, 2005.
(36) Vogler, E. A. Practical Use of Concentration-Dependent Contact Angles as a Measure of
Solid-Liquid Adsorption II: Experimental Aspects, Langmuir 1992, 8, 2013.
(37) Guggenheim, E. A. Thermodynamics: An Advance Treatment for Chemists and
Physicists, 5 ed.; Wiley: New York, 1967.
(38) Aveyard, R.; Haydon, D. A. An Introduction to the Principles of Surface Chemistry;
Cambridge University Press: London, 1973.
(39) Strey, R.; Vilsanen, Y.; Aratono, M.; Kratohvil, J. P.; Yin, Q.; Friberg, S. E., On the
Necessity of Using Activities in the Gibbs Equation, J. Phys. Chem. B. 1999, 103, 9112.
(40) Wills, P. R.; Comper, W. D.; Winzor, D. J., Thermodynamic Non-ideality in
Macromolecular Solutions: Interpretation of Virial Coefficients, Archives of Biochem.
and Biophys. 1993, 300, 206.
(41) Knezic, D. Thermodynamic Properties of Supersaturated Protein Solutions. Ph. D.,
Polytechnic University, 2002.
(42) Schwartz, A. M.; Perry, J. W. Surface Active Agents; Interscience Publishers: New York,
1949.
(43) Rosen, M. J. Surfactants and Interfacial Phenomena; Wiley: New York, 1978.
69
Page 88
(44) Frommer, M. A.; Miller, I. R. , Adsorption of DNA at the Air-Water Interface, J. Phys.
Chem. 1968, 72, 2862.
(45) Nave, S.; Eastoe, J., What Is So Special about Aerosol-OT? 1. Aqueous Systems,
Langmuir 2000, 16, 8733.
(46) Drop-volume measurements are assumed to closely correlate with early pendant drop
measurements taken near t=0 because, in a drop-volume experiment, the LV interface is
continuously forming until the drop separates from the tip, rather than achieving the
steady-state adsorption condition accessible to an aged pendant drop (Γ = 337.3±28.2
picomoles/cm2 at steady-state taken near 1 hour drop age).
(47) Rao, C. S.; Damodaran, S., Is Surface Pressure a Measure of Interfacial Water Activity?
Evidence from Protein Adsorption Behavior at Interfaces, Langmuir 2000, 16, 9468.
(48) Lu, J. R.; Su, T. J.; Penfold, J. Adsorption of Serum Albumins at the Air/Water Interface,
Langmuir 1999, 15, 6975.
(49) Note that surface excess of the small molecule reference compound AOT (MW = 444
Da) reported herein is much larger than that of proteins (1000 < MW < 10 kDa),
presumably because of the great disparity in molecular size.
(50) Helfrich, J. P. Am. Biotech. Lab, Flow-mode dynamic laser light scattering technology for 21st century biomolecular characterization, 1998, 16, 64.
(51) Feder, J. J. Theor. Biol. 1980, 87, 237.
(52) Robeson, J. L.; Tilton, R. D. Langmuir 1996, 12, 6104
(53) Feijter, J. A. D.; Benhamins, J.; Veer, F. A. Biopolymers 1978, 17, 1759.
(54) Pain, R. H. Molecular Hydration and Biological Function. In Biophysics of Water;
Franks, F., Mathias, S., Eds.; John Wiley and Sons: Chichester, 1982; pp 3.
(55) Rand, R. P. Science 1992, 256, 618.
70
Page 89
(56) Hartley, G. S. Actualites Scientifiques et Industrielles 1936, 387, 4.
71
Page 90
Table I: Purified Proteins
NAME OF PROTEIN (acronym)
MOLECULAR WEIGHT
(kDa)
AS-RECEIVED
FORM (mg/ml)
PURITY (electrophoresis)
or ACTIVITY
VENDOR
UBIQUITIN (Ub) 10.7 Powder 98% Sigma Aldrich THROMBIN (FIIa) 35.6 Powder 1325 NIH unit/mg Sigma Aldrich
Prep 1 66.3 Powder Sigma Aldrich Fraction V (FV HSA)
Prep 2 66.3 Powder
96-99%
Sigma Aldrich
HUMAN SERUM ALBUMIN Fatty Acid Free
(FAF HSA) 66.3 Powder 96-99% ICN Biomedicals
Prep 1 72 Powder Sigma Aldrich PROTHROMBIN (FII) Prep 2 72 Powder
7.4 units/mg protein Sigma Aldrich
Prep 1 160 Powder 95% Sigma Aldrich Prep 2 160 Powder 95% Sigma Aldrich
HUMAN IgG (IgG)
Prep 3 160 Powder 98% ICN Biomedicals COMPLEMENT COMPONENT C1q (C1q) 400 Powder Single band by
immuno-electrophoresis
Sigma Aldrich
αααα2-MACROGLOBULIN (ααααmac) 725 Powder 90% Sigma Aldrich Prep 1 1000 Solution
(0. 8) 98% Sigma Aldrich
Prep 2 1000 Solution (0. 8)
98% Sigma Aldrich
HUMAN IgM (IgM)
Prep 3 1000 Solution (2.1)
96% ICN Biomedicals
72
Page 91
TABLE II: STEADY-STATE PROTEIN PARAMETERS
NAME OF PROTEIN (acronym)
γolv
(dynes/cm) γ'
lv (dynes/cm)
lnCBΠ/2
(pM)
M (dimension-
less)
Πmax
(dynes/cm) Apparent Γ †
(picomoles/cm2) lnCB
max (pM)
UBIQUITIN (Ub)* 72 46 15 - 26 146 18THROMBIN (FIIa) 72.23±0.31 47.6±1.5 14.44±0.26 -11.00±1.3 24.1±1.5 167 ±18 17.41±0.18
Prep 1 72.3±1.2 50.3±1.2
12.14±0.28 -9.9±2.5 21.4±1.2 160±21 14.92±0.28Fraction V (FV HSA)
Prep 2 70.8±1.1 46.2±2.5 12.44±0.53 -7.3±2.2 25.5±2.5 129±25 16.26±0.39
HUMAN SERUM ALBUMIN Fatty Acid Free
(FAF HSA) 70.83±0.30 53.37±0.47 12.06±0.16 -13.0±2.0 18.33±0.47 167.9±9.4 14.15±0.16
Prep 1 70.50±0.73 43.1±2.4 12.72±0.35 -10.8±2.9 28.6±2.4 207±33 15.39±0.27PROTHROMBIN (FII) Prep 2 70.51±0.73 43.0±2.4 12.72±0.34 -10.8±2.8 28.6±2.4 207±32 15.40±0.26
Prep 1 70.48±0.57 48.7±3.2 13.04±0.69 -8.6±2.1 23.1±3.2 130±34 16.44±0.47Prep 2 71.13±0.57 51.6±1.9 13.54±0.41 -10.4±2.7 20.1±1.9 134±24 16.49±0.29
HUMAN IgG (IgG)
Prep 3 71.09±0.42 56.48±0.92 14.65±0.19 -20.1±5.1 15.21±0.92 177±21 16.26±0.17COMPLEMENT COMPONENT C1q (C1q) 71.59±0.54 54.2±1.6 11.27±0.38 -14.2±4.1 17.5±1.6 194±33 13.08±0.34
α2-MACROGLOBULIN (α mac) 71.96±0.36 57.21±0.57 9.54±0.15 -19.4±5.7 14.47±0.57 266±21 10.65±0.15Prep 1 70.98±0.39 51.4±1.2 9.92±0.19 -13.2±3.5 20.3±1.2 230±26 11.63±0.17Prep 2 71.65±0.55 50.2±3.1 11.64±0.35 -14.2±4.2 21.5±3.1 232±59 13.50±0.22
HUMAN IgM (IgM)
Prep 3 70.51±0.59 55.4±1.3 10.58±0.30 -11.7±3.3 16.3±1.3 149±25 12.62±0.26
Notes: * Ubiquitin(10.7 kDa) does not reach surface saturation within solubility limits; reported values are graphical estimates (see Appendix 6.2). † Apparent Γ is proportional to Gibbs’ surface excess Γlv (see Theory section).
73
Page 92
Figure 1: Interfacial tension profiles in 3D (γlv as a function of analysis time (drop age) and
logarithmic (natural) solution concentration CB) and 2D (γlv as a function of logarithmic solution
concentration CB at selected times) formats comparing Aerosol-OT (AOT, panel A), human serum
albumin (FAF HSA, panel B), and human immunoglobulin-M (IgM, panel C,
preparation 3, Table 1). In each case, solute concentration CB is expressed in picomoles/L (pM).
Symbols in 2D panels represent time slices through 3D representations (filled circle = 0.25 sec, open
circle = 900 sec, filled triangles = 1800 sec, and open triangles = 3594 sec; annotations in panel A
indicate maximum and half-maximum spreading pressure). Notice that adsorption kinetics dominate
IgM adsorption, requiring 1hour to reach steady state, whereas kinetics dampen within about 2000
sec for HSA. Dynamic effects dampen within 900 sec for AOT, the small-molecule reference
surfactant.
74
Page 93
2 4 6 8 10 12 1450
55
60
65
70
75
γ lv(m
N/m
)
lnCB (CB in pM)
γ lv(m
N/m
)
Elapsed Time (sec) lnCB(CB
in pM)
lnCB(CB
in pM)Elapsed Time (sec)
γ lv(m
N/m
)
A
lnCB(CB
in pM)Elapsed Time (sec)
γ lv(m
N/m
)
C
B
time
γ l v( m
N/m
)
lnCB (CB in pM)
2 4 6 8 10 12 14 16 18 2050
55
60
65
70
75
γ l v(m
N/m
)
lnCB (CB in pM)6 8 10 12 14 16 18 20 22 24
20
25
30
35
40
45
50
55
60
65
70
75
Πmax
1/2Πmax
lnCBπ/2
γ
'γ
75
Page 94
Figure 2: Comparison of steady-state, concentration-dependent γlv for proteins selected from Table
1 spanning three decades in MW (only statistically-fit curves shown for clarity; see Fig. 1 for similar
plots including authentic data and Table 2 for statistics of fit). Molar scaling reveals a Traube-rule-
like ordering in which it is observed that high-MW proteins reduce γlv to any arbitrary value at lower
molarity than low-MW proteins (arrow).
76
Page 95
6 8 10 12 14 16 18 20 2245
50
55
60
65
70
75
Ub
FIIa
FV HSA
FII
C1q
IgM
lnCB (CB in pM)
γγ γγ lv(d
ynes
/cm
)
Progression in MW
77
Page 96
Figure 3: Apparent Gibbs’ surface excess Γ as a function of protein MW calculated from
concentration-dependent γlv for multiple preparations of proteins as listed in Table 1 (Open circle =
preparation 1, filled circle = preparation 2, Filled triangle = preparation 3) and inset expands low-
MW region. Data point corresponding to ubiquitin (Ub, filled diamond) was estimated as described
in the Appendix 6.2. Error bars represent uncertainty computed by propagation of experimental
errors into compiled Γ values (see Results section). Dashed line represents arithmetic mean of Γ
values listed in Table 2.
78
Page 97
0 200 400 600 800 10000
100
200
300
400
500
0 40 8050
100
150
200
250
300
MW (kDa)
FIIaFAF HSA
FV HSA
FII
IgG
C1q
αmac
IgM
UbFV HSA
App
aren
t Γ(p
icom
oles
/cm
2 )
179 ± 27
79
Page 98
Figure 4: Relationship between the surface-saturating bulk solution concentration CBmax and protein
MW (Open circle = preparation 1, filled circle = preparation 2, filled triangle = preparation 3).
Linear regression through the data yielded a slope of -1.4 ± 2.8 consistent with the expectation of
unit slope and an intercept 21.8 ± 15.6 (R2 = 71.6%). Notice that low-MW proteins require greater
bulk-phase concentrations to saturate the interphase than higher-MW proteins.
80
Page 99
2 3 4 5 6 710
12
14
16
18
20
lnMW (kDa)
lnC B
max
(pM
)
FIIa
FV HSA
FV HSA
FAF HSA
IgG
C1q
α mac
IgM
FII
Ub
81
Page 100
Figure 5: Traube-rule-like dependence of concentration-dependent γlv for proteins selected from
Table 1 spanning three decades in MW (reading from left to right on MW axis:
Ub, FIIa, FAF HSA, FV HSA preparation 1, FII preparation 1, IgG preparation 2, α mac, C1q, IgM
preparation 4). Data points are superimposed on a mesh calculated from Eq. 4a of the theory section
(see Appendix 6.3 for details). The Traube-rule effect is especially evident as viewed along the lnCB
axis where monotonically-increasing concentrations of lower-MW proteins are required to reach a
universal limiting interfacial tension γ'lv.
82
Page 101
γ lv(d
ynes
/cm
)
MW (kDa) lnCB(CB
in pM)
83
Page 102
Figure 6: Monotonic increase in interphase thickness with protein molecular weight (left-hand
axis). A fixed partition coefficient requires that higher-MW proteins (MW > 125 kDa) occupy
multiple layers (right-hand axis), predicting up to five layers for proteins such as IgM (1000 kDa).
Transition between layers is shown as occurring in discrete steps although it is more likely that
occupation of a subsequent layer occurs before the preceding is completely packed.
84
Page 103
0 100 200 300 400 500 600 700 800 900 10001
2
3
4
5
0
20
40
60
80
MW (kDa)
Inte
rpha
se th
ickn
ess (
nm)
Num
ber o
f lay
ers
85
Page 104
Glossary of Symbols a Protein activity A Area of interphase (cm2) c Proportionality constant, c ≡ Γ/Γlv CB Bulk solution concentration (moles/volume) CB
max Bulk solution concentration at limiting interfacial tension (moles/volume) CB
Π/2 Bulk solution concentration at half-maximal-change in interfacial activity (moles/volume) CB
* Bulk solution concentration at arbitrary interfacial tension, γ*lv (moles/volume)
CFCC Face-Centered-Cubic close packing concentration (moles/volume) CI Interphase concentration (moles/volume) CI
max Maximal interphase concentration (moles/volume) CSL Solubility limit concentration (moles/volume) χ Proportionality constant, χ ≡ R/ rv δ Interphase thickness element (cm) ε Packing efficiency Φp Volume fraction of protein in the interphase Φp
max Maximum volume fraction of protein in the interphase γlv Liquid-vapor (LV) interfacial tension (dynes/cm) γo
lv Low-concentration asymptote of a concentration-dependent γlv curve (dynes/cm) γ'
lv High-concentration asymptote of a concentration-dependent γlv curve (dynes/cm) γ*
lv Arbitrary interfacial tension (dynes/cm) Γlv Actual Gibbs’ surface excess (moles/area) Γ Apparent Gibbs’ surface excess (moles/area), Γ = cΓlv Γ1
o Moles of water per-unit-area of interface when Φw = 1 (moles/area) M Parameter fitted to concentration-dependent γlv curve nI Total protein moles within the interphase (moles), nI = na+ nB na Moles of adsorbate within the interphase (moles) nB Moles of protein contributed by bulk phase (moles) n1 Moles of component 1 in a 2-component solution n2 Moles of component 2 in a 2-component solution N Number of slabs of interphase NA Avogadro number P Partition coefficient, P ≡ CI/ CB Π Spreading pressure (dynes/cm), Π ≡ γo
lv - γ'lv
Πmax Maximum spreading pressure (dynes/cm) rv Protein radius (cm) R Effective radius (cm), R ≡ χrv R Universal Gas Constant (ergs/oK mol) σ Activity coefficient T Temperature (oK) VI Interphase volume (cm3) Vp Protein molar volume (cm3/mole) Ω Total interphase thickness (cm) x Mole fraction
86
Page 105
Chapter 3
Mixology of Protein Solutions and the Vroman Effect
Abstract
Mixing rules stipulating both concentration and distribution of proteins adsorbed to the liquid-vapor (LV)
interphase from multi-component aqueous solutions are derived from a relatively straightforward protein-
adsorption model. Accordingly, proteins compete for space within an interphase separating bulk-vapor
and bulk-solution phases on a weight, not molar, concentration basis. This results in an equilibrium
weight-fraction distribution within the interphase that is identical to bulk solution. However, the absolute
interphase concentration of any particular protein adsorbing from an m-component solution is 1/mth that
adsorbed from a pure, single-component solution of that protein due to competition with m-1 constituents.
Applied to adsorption from complex biological fluids such as blood plasma and serum, mixing rules
suggest that there is no energetic reason to expect selective adsorption of any particular protein from the
mixture. Thus, dilute members of the plasma proteome are overwhelmed at the hydrophobic LV surface
by the thirty classical plasma proteins occupying the first-five decades of physiological concentration.
Mixing rules rationalize the experimental observations that (i) concentration-dependent liquid-vapor
interfacial tension lvγ of blood plasma and serum (comprised of about 490 different proteins) cannot be
confidently resolved, even though serum is substantially depleted of coagulable proteins (e.g. fibrinogen);
and (ii) lvγ of plasma is startlingly similar to that of purified protein constituents. Adsorption-kinetics
studies of human albumin (66.3 kDa) and IgM (1000 kDa) binary mixtures revealed that relatively
sluggish IgM molecules displace faster-moving albumin molecules adsorbing to the LV surface. This
Vroman-effect-like process leads to an equilibrium lvγ reflecting the linear combination of w/v
concentrations at the surface predicted by theory. Thus, the Vroman effect is interpreted as a natural
outcome of protein reorganization to achieve an equilibrium interphase composition dictated by a firm set
of mixing rules.
87
Page 106
3.1. Introduction
Protein adsorption is widely accepted within the biomaterials community to be among the first
steps in the biological response to materials that ultimately determines biocompatibility in end
use (see ref. 1 and citations therein). As a consequence, a great deal of effort has been expended
toward understanding the biochemical activity of proteins in the adsorbed state2 and how these
surface-bound proteins trigger a rich panoply of macroscopic biological outcomes when a
biomaterial is brought into contact with different biological milieu or used in different
physiological compartments (the in vitro or in vivo biological response). Biomedical surface
science3 of protein adsorption has also received considerable attention because interfacial
energetics (related to biomaterial surface hydration)4,5 control the amount of protein adsorbed
under different physical conditions (protein-solution concentration, biomaterial surface energy,
temperature, etc.), which of course influences biocompatibility as well.
A popular research strategy in both of these pursuits has been the study of purified proteins that
are thought to be representative members of the mammalian proteome (see, for examples refs. 6-
9). An implicit assumption underlying this strategy is that behavior of an intact biological
system (e.g. whole blood plasma/serum or tissue/cell extracts) consisting of a plurality of
proteins can be inferred from that of the individual constituents, even though there is no readily
apparent, a priori reason to expect that this ‘piece-at-a-time’ postulate is valid.10 That is to say,
there is no strong precedent suggesting that a simple sum-of-the-parts-equals-the-whole equation
is applicable to the protein-adsorption problem. Indeed, the so-called ‘Vroman effect’ (see refs.
6,7,11-29 and citations therein) strongly suggests otherwise. Leo Vroman first observed that
adsorption from plasma or serum occurred through a complex series of adsorption-displacement
88
Page 107
steps in which low-molecular-weight (MW) proteins arriving first at a surface are displaced by
relatively higher MW proteins arriving later. Certain proteins, such as albumin, are observed to
be relatively resistant to displacement at hydrophobic surfaces whereas others, such as high
molecular weight kininogen, readily displaces fibrinogen.30 Exact molecular mechanisms
underlying this process have not yet been resolved and the Vroman effect remains one of the
quintessential mysteries of biomaterials surface science.29 All of this is to say that there are no
specific ‘mixing rules’ stipulating how interfacial behavior of complex protein mixtures can be
deduced from the behavior of single-protein solutions.
This chapter discusses mixing rules derived from a relatively straightforward theory of protein
adsorption that reveals how individual proteins comprising a mixture compete for space at a
surface in the adsorption process. Reported results are specific to the liquid-vapor (LV)
interface, a molecularly-smooth hydrophobic surface where interfacial energetics can be directly
and sensitively measured by tensiometric (surface thermodynamic) techniques.5 Insights into
protein adsorption may thus be relevant to purely hydrophobic solid surfaces where dispersion
forces predominate, although this is not proven by this work, but probably do not directly extend
to hydrophilic surfaces where more chemically-specific interactions between proteins and the
surface may occur.4 Using pendant-drop tensiometry, we find that concentration-dependent
interfacial tension lvγ of a broad array of purified human proteins spanning three decades in
molecular weight (MW) are quite similar to one another and surprisingly similar to that of
plasma and serum, when protein concentration is scaled on a weight/volume (w/v) basis. These
experimental outcomes are rationalized in terms of the mixing model, as are adsorption-kinetic
studies of binary mixtures that illuminate the cause of the Vroman effect.
89
Page 108
3.2. Materials and Methods
Purified Proteins and Protein Mixtures: Human albumin (FV), IgG, and IgM were used as
received from Sigma-Aldrich and were the highest purity available (>96%) as assessed by SDS
PAGE. Mass, concentration, and molecular weights supplied with purified proteins were
accepted without further confirmation. Human platelet-poor plasma (citrated) was prepared from
outdated (within 2 days of expiration) lots obtained from the Hershey Medical Center Blood
Bank. Human serum was prepared in 15 mL batches by recalcification with 0.1 M CaCl2 at 5:1
v/v plasma:calcium ratio in clean-glass scintillation vials for about 15 min. Ref. 31 discloses all
details related to protein-solution preparation including serial dilutions of protein stock solutions
(usually 10 mg/mL) that were performed in 96-well microtiter plates by (typically) 50:50
dilution in phosphate buffered saline solution (PBS). PBS was prepared from powder (Sigma
Aldrich) in distilled-deionized (18 MΩ) water. Interfacial tension of PBS and water was checked
periodically by Wilhelmy-balance tensiometry.
Liquid-Vapor Interfacial Tension Measurements: LV interfacial tensions lvγ reported in this
work were measured by pendant-drop tensiometry (PDT) using a commercial automated
tensiometer (First Ten Angstroms Inc., Portsmouth VA) applying techniques discussed in detail
elsewhere.1 Briefly, the tensiometer employed a Tecan liquid-handling robot to aspirate between
10-12 µL of solutions contained in a 96-well microtiter plate prepared by the serial-dilution
protocol mentioned above. The robot was used to reproducibly transfer the tip with fluid
contents into a humidified (99+ % RH) analysis chamber and dispense between 6-11 µL pendant
drops (smaller drop volume required for lower interfacial tensions) within the focal plane of a
90
Page 109
magnifying camera. These and all other aspects of pendant-drop analysis were performed under
computer control. Precision of lvγ was about 0.5 mN/m based on repeated measurement of the
same pendant drop. The instrument was calibrated against pure water interfacial tension and
further confirmed on occasion against Wilhelmy-balance tensiometry. The analysis chamber
was thermostated to a lower-limit of 25±1 oC by means of a computer-controlled resistive heater.
Upper-temperature limit was, however, not controlled but rather floated with laboratory
temperature, which occasionally drifted as high as 29 oC during summer months. Thus, reported
lvγ values are probably not more accurate than about 1 mN/m on an inter-sample basis
considering the small but measurable variation of water interfacial tension with temperature.
This range of accuracy is deemed adequate to the conclusions of this report which do not
strongly depend on more highly-accurate lvγ that is quite difficult to achieve on a routine basis
with the multiplicity of protein solutions investigated herein.
Computation and Data Representation: Computational, statistical, and theoretical methods
used in this work have been discussed in detail elsewhere.5,32,33 Briefly, time-dependent lvγ data
corresponding to solutions at different w/v concentration were recovered from PDT files and
correlated with concentrations, leading to a matrix of results with row values representing
concentration and time (in sec) as column values. It was generally observed that
BC
lvγ data takes
on a sigmoidal shape when plotted on logarithmic-concentration axes,5,32 with a well-defined
low-concentration asymptote lv
oγ and a high-concentration asymptote 'lv
γ . Successive non-linear
least-squares fitting of a four-parameter logistic equation
' / 2( [( ) /(1 (ln / ln ) )] )Mlv lv lv B B lvC Cπ 'γ γ γ γ°= − + + to concentration-dependent lvγ data for each
91
Page 110
time within the observation interval quantified lv
oγ and 'lv
γ parameters with a measure of
statistical uncertainty. Fitting also recovered a parameter measuring concentration-at-half-
maximal-change in interfacial activity, (where and / 2ln BCΠ max1/2/ 2Π = Π max 'lv lvγ γ°Π ≡ − ), as
well as a parameter M that measured steepness of the sigmoidal curve. This empirical, multi-
parameter fitting to concentration-dependent lvγ data was a purely pragmatic strategy that
permitted quantification of best-fit protein and surfactant characteristics but is not a theory-based
analysis.5,32,33 Three-dimensional (3D) representations of time-and-concentration-dependent
lvγ data were created in Sigma Plot (v8) from the data matrix discussed above and overlain onto
fitted-mesh data computed from least-squares fitting. Two-dimensional (2D) representations
were created from the same data matrices at selected observation times.
3.3. Theory
Protein Adsorption Model: Previous work developed a model of protein adsorption predicated
on the interfacial packing of hydrated spherical molecules with dimensions scaling as a function
of MW.1,31 This strategy was similar to that adopted by Ostuni et al.34 in which sphere packing
was taken to be the simplest, physically-relevant model that might yield semiquantitative
description of general trends in protein adsorption. This model was not designed to account for
the myriad complexity and variations among proteins that no doubt invalidate such a simple
conceptual construction at a detailed level of investigation. However, general predictions were
found to explain adsorption energetics of a broad spectrum of plasma proteins spanning nearly
three decades in molecular weight (MW). Briefly outlining the core ideas behind the model for
the purposes of this paper, the LV surface was modeled as a 3D interphase region with volume
(in cm3) that separates bulk-solution and bulk-vapor phases. Protein molecules with radius IV
92
Page 111
-8 1/36.72×10v MWr = (packing-volume radius in cm for MW expressed in kDa) adsorb from the
bulk phase into this interphase region, occupying one or more layers depending on protein size
(MW) and solution concentration. Stated somewhat more precisely, protein partitions from the
bulk phase to the interphase region, achieving a fixed concentration ratio governed by a partition
coefficient ; where is the interphase concentration (/IP C C≡ B IIC /I IC n V≡ if is the total
number of moles of protein within the interphase) and is the corresponding bulk
concentration (both in moles/cm3). Interestingly, it was found that was essentially invariant
among diverse group of proteins studied ( ~ 150), meaning that proteins adsorb to the LV
interface at concentrations exceeding 150-fold bulk-solution concentration. Protein size and
repulsion between molecules place an upper bound on maximal interphase concentration denoted
. can also be expressed in terms of fractional volume occupied by protein
In
BC
P
P
maxIC max
IC
max maxp IC VΦ = p (dimensionless); where protein molar volume 34/3p v AV rπ= N (in cm3/mole) if NA
is the Avogadro number. Elaboration of this model and calibration to experimental neutron-
reflectivity data on albumin adsorption revealed that and was, like , essentially
invariant among diverse group of proteins studied. In other words, the LV-interphase capacity
was found to be limited by the extent to which this interphase can be dehydrated through
displacement of water by adsorbed protein molecules. Thus, the controlling role of water in
protein adsorption was emphasized, in general agreement with independently-developed
theory.35
max ~ 1/3pΦ P
maxpΦ can be further quantified in the more familiar units of weight/volume (w/v) concentration
by expanding the definition above explicitly in terms of : maxIW vr
93
Page 112
( )3max max max 8 2 max
max 4 3
4 16.72X10 7.65X10 ~3 3
4.36X10 kg/cm = 436 mg/mL
p I p I A I
I
C V C MWN W
W
π −
−
⎡ ⎤Φ = = =⎢ ⎥⎣ ⎦⇒ =
(1)
where Eq. (1) recognizes that molar concentration is converted to w/v concentration by MW.
Importantly, Eq. (1) reveals that a proteinaceous interphase saturates at a fixed w/v (not molar)
concentration and corroborates the conclusion drawn from diverse literature sources that
adsorbed protein concentrations can be surprisingly large.36 Eq. (1) also anticipates the
experimental observation that lvγ curves for diverse proteins spanning three decades of MW
appear more similar than dissimilar when scaled on a w/v basis31 because the maximum
interphase concentration is very similar for all proteins in w/v units.
Protein Mixtures – Binary Solutions: A fixed interphase capacity for protein coupled with a
nearly constant partition coefficient imposes significant restrictions on the fractional contribution
of individual proteins adsorbing to the LV surface from mixed solution. Consider first a binary
solution comprised of proteins “i” and “j” with different MW, each at a bulk w/v concentration
equal or exceeding so that interphase saturation is assured. Accordingly, Eq.
(1) must be rewritten to accommodate contributions from i and j, each occupying space dictated
by the product
max max /B IW W= P
I pC V :
( )3max 8
, , , , , ,
2, , , ,
4 6.72X10317.65X10 ~ 436 mg/mL3
p I i p i I j p j A I i i I j j
I i I j I i I j
C V C V N C MW C MW
W W W W
π − ⎡ ⎤Φ = + = +⎣ ⎦
⎡ ⎤ ⎡ ⎤= + ⇒ + =⎣ ⎦ ⎣ ⎦
(2)
Eq. (2) states that constant maxpΦ forces the interphase to be populated by both i and j proteins
such that the summed weight concentrations equals the fixed interphase capacity of ~ 436
94
Page 113
mg/mL. Given that is approximately constant for all proteins and both i, j are at equal bulk
concentration sufficient to individually fill the interphase (by model construction), it seems
reasonable to assume that each protein must compete equally for space within the interphase.
Hence, at equilibrium, proteins i, j must be represented at the surface by equal w/v
concentrations. It was thus concluded that
P
maxBW
max max, , B
1 1= = = (PW )2 2I i I j IW W W . Notably, the
interphase concentration of either protein adsorbed from the binary solution is half that adsorbed
from a single-protein solution.
If, however, the ith protein comprising the binary solution is below and thus not capable of
individually saturating the interphase, it cannot compete for space as effectively as in the
preceding proposition, contributing at most ½ . Again in consideration of the fact that is
approximately constant for all proteins, it seems reasonable that proteins i, j compete for space
within the interphase on a purely concentration basis so that
maxBW
,B iPW P
( ) (max max, , , ,
12I I i I j B i BW W W P W W= + = + )j . Thus, the jth protein dominates the saturated interphase
(on a w/v basis) by an amount proportionate to the weight excess of protein j over i in the bulk
solution. Now, if neither protein i nor j individually exceed but , then
the logic of the mixing model insists that each protein competes for space according to
maxBW max
, ,( )B i B j BW W W+ ≥
( )max, ,
12I B iW P W W= + B j .
A survey of many different purified blood-plasma proteins spanning three decades in MW shows
that concentration-dependence of lvγ was very similar among this disparate group of molecules.1
95
Page 114
However, no two proteins were found to be identical in this regard. Instead, it was found that
each protein retained a kind of ‘interfacial signature’ written in the tension at interphase
saturation 'lv
γ (occurring at ) that falls within the 20 mN/m band characteristic of all
proteins studied.1,31 If i and j are two such proteins in a binary mixture, then it can be expected
that this interfacial-tension signature will be expressed in a manner dependent on relative
proportions of i and j. That is to say, if
maxBW
( )max 'i
olv lv iγ γΠ ≡ − and ( )max '
j
olv lv jγ γΠ ≡ − are spreading
pressures of pure i and j at for each (where maxBW o
lvγ = 71.97 mN/m at 25 oC is the interfacial
tension of phosphate-buffer-saline diluent), then the observed spreading pressure
( )max 'oobs lv lv obs
γ γΠ ≡ − of an i, j mixture should vary with the relative proportion of each component
within the interphase. Expressing this proportion as a weight fraction ,
,max
, ,I i
I i
I i I j
Wf
W W⎛ ⎞
≡ ⎜ ⎟⎜ ⎟+⎝ ⎠ and
recalling that ,
,,
i j
i j
Ii j
B
WP W
⎛ ⎞≡ ⎜⎝ ⎠
⎟ , then it follows that , ,
,max max
, ,I i B i
B i
B i B j
Wf f
W W⎛ ⎞
= ⎜ ⎟⎜ ⎟+⎝ ⎠≡ (where the
superscript ‘max’ is retained to emphasize the restriction that ( ) max, ,I i I j IW W W+ ≥ ). It can be
expected that should vary in some way with the bulk composition maxobsΠ
,
maxB i
f . We are unaware
of any theoretical precedent for such a combining formula for interfacial tensions and so tender
the linear-combination of Eq. (3):
(3) max max max max max max max max, , ,(1 ) ( )obs i I j j I j i B jf f fΠ =Π − +Π =Π − ∆Π
where max max maxi j∆Π ≡Π −Π . Eq. (3) stipulates that varies between the two boundaries
and
maxobsΠ
maxi
Π maxjΠ as a function of weight-fraction composition, assuming of course that the mixing
rule of Eq. (2) and subordinate relationships discussed above are valid.
96
Page 115
Protein Mixtures – Multi-component Solutions: The logic applied above to derive the binary
mixing rule can be extended to a more complex solution of m proteins that collectively saturate
the interphase, leading to a generalized mixing rule applicable to multi-component protein
solutions:
( )
4max max
2
6 3
1 41.5 10
3 10 (kg/cm for MW in kDa) = 3 (mg/mL)
i i i
m m m
I B I B Ii i i
P mW W W W Wm m P X
X m m
−
−
−
= = ⇒ =
=
∑ ∑ ∑ ∼ .36 10X m (4)
Eq. (4) states that the w/v distribution of proteins within the LV interphase of a solution of m
proteins (at equilibrium) is identical to that of the bulk phase. But the w/v concentration of any
particular protein is diluted by a factor of m relative to the maximal interphase concentration that
would have otherwise been achieved from a pure, single-component solution of any particular
solution constituent. That is to say, the effective partition coefficient effPPm
≡ for a particular
protein in an m component solution is lower than the constant partition coefficient for a
purified, single-component solution. This is a direct outcome of a competition among proteins
on an equal w/v concentration basis for a fixed fraction of space within the interphase volume.
P
3.4. Results
Plasma, Serum, and Purified Proteins: Fig. 1 collects time-and-concentration-dependent
‘ lvγ curves’ for human immunoglobulin G (hIgG, panel A), human-blood plasma (HP, panel B),
and serum derived from this plasma (HS, panel C). Results are given in both three-dimensional
(3D, lvγ as a function of time and concentration) and two-dimensional (2D, lvγ as a function
concentration at specified times) representations. Note that the logarithmic-solute-dilution
97
Page 116
ordinate l in Fig. 1 is expressed in either w/v or v/v units of parts-per-trillion (PPT, grams
solute/1012 grams solution for purified proteins and mL/1012 mL solution for plasma/serum).
Both purified-protein solutions and protein mixtures exhibited the biosurfactant property of
adsorbing to the LV interphase, causing a reduction in
n BC
lvγ as a function of bulk solution
concentration . Adsorption results in sigmoidally-shaped, concentration-dependent BC lvγ curves
on a l axis, with a well-defined low-concentration asymptote n BClv
oγ and a high-concentration
asymptote 'lv
γ .5
We observed that most proteins within the 10 1000MW≤ ≤ kDa achieve a limiting 'lv
γ within
the 1 hr observation period employed in this work.1 Results shown in Fig. 1A for hIgG is
somewhat exceptional in this regard and arguably did not reach equilibrium. Either the bulk
solution concentration was insufficient to fully saturate the surface (in spite of being near a
solubility limit) or longer drop age was required to achieve equilibrium. Analysis disclosed in
ref. 31 strongly suggests that the latter is more likely, with slight but detectable change in 'lv
γ
possibly due to slow change in adsorbate configuration at the LV surface. In any event, 'lv
γ
parameters collected in Table 1 for three separate preparations of hIgG should be interpreted as
projected equilibrium values based on statistical fitting of data, as described in the Methods and
Materials section. Characteristic parameters listed in Table 1 for albumin, plasma, and serum are
more certain in this regard because a secure limiting 'lv
γ was achieved (see Fig. 1). Fig. 2
graphically compares equilibrium, concentration-dependent lvγ data for hIgG, plasma, and serum
on a single set of axis where the surrounding band represents 99% confidence intervals around
98
Page 117
the best-fit human-plasma data listed in Table 1. It is apparent from this data that concentration-
dependent lvγ of hIgG, plasma, and serum cannot be confidently distinguished.
Binary Protein Mixtures: Fig. 3 compares time-dependent lvγ of hIgM and FV HSA solutions
mixed in various proportions at fixed total protein concentration (see ref. 1 for more details of
HSA and IgM interfacial properties). Fig. 3A,B corresponds to experiments performed at a total
protein concentration of 2.1 mg/mL whereas Fig. 3C,D corresponds to 27 µg/mL total protein.
These results were representative of a broader experimental agenda summarized in Table 2. At
each composition ranging from 100% HSA to 100% hIgM (column 1 of Table 2), lvγ was
observed to asymptotically approach a characteristic steady-state value 'lv
γ . Comparison of Fig.
3A and 3.3C shows that whereas steady state was arguably reached at 2.1 mg/mL total protein,
lvγ drifted continuously lower with time at 27 µg/mL total protein. For the 2.1 mg/mL total
protein case, steady-state 'lv
γ was estimated by simply averaging the final 25 lvγ observations.
Results were expressed in terms of steady-state spreading pressure ( )'oobs lv lvγ γΠ = − listed in
columns 3-4 of Table 2; where mN/m consistent with the interfacial tension of water at
25 oC. Fig. 3B plots against % HSA composition, where the line drawn through the data
corresponds to Eq. (3) of the theory section (error bars correspond to the standard deviation of
the mean
71.9olvγ ≡
obsΠ
lvγ ). It is emphasized that this line is not a statistical fit but rather an analytic function
since Eq. (3) contains no parameters that are not experimentally determined.
99
Page 118
Equilibrium could not be reliably estimated in the 27 µg/mL total protein case because obsΠ
lvγ did not achieve steady-state. However, it was noted that data corresponding to t > 900 sec
was quite linear on t1/2 coordinate (Fig. 3D, see annotations) following a lag phase that was
especially noticeable in the 100% IgM case (columns 4-5 of Table 2 compile linear-least-squares
parameters of corresponding to t1/2 > 30 data). Interestingly, this lag phase substantially
disappeared upon mixing 25% albumin with 75% IgM and the time decay in lvγ was very similar
to that observed for 100% albumin solutions. In fact, slopes of the t1/2 curves for each protein
composition were statistically identical.
3.5. Discussion
Plasma and Serum: An extensive survey of concentration-dependent lvγ of human-blood
proteins spanning nearly 3 decades of MW (10 1000MW≤ ≤ ) has revealed only modest
differences within this diverse group.1 Herein we report that concentration-dependent lvγ for
plasma and serum are effectively the same (see Figs. 1 and 2), even though serum is
compositionally distinct from plasma by virtue of being depleted of fibrinogen - one of the
twelve most abundant proteins (2.5-4.5 mg/mL).37 Taken together, experimental results show
that lvγ of blood plasma and serum are very similar to that of purified constituents. These
findings supplement the long-known, but heretofore unexplained, observation that lvγ of plasma
derived from different (normal) mammalian species (bovine, ovine, canine, human…) fall within
a narrow 5 mN/m window,38-45 in spite of significant differences in plasma proteome among
species.46
100
Page 119
The similarity between purified protein solutions and complex mixtures stands in strong contrast
to the general expectation that compositional/structural differences among proteins should also
result in quite different adsorption energetics and commensurately different concentration-
dependent lvγ .1 Indeed, preferential/selective adsorption of proteins has long been linked to
different biological responses evoked by different materials (see ref. 2 and citations therein).
However, detailed analysis of lvγ data strongly suggests that the interaction energetics of water
with (globular blood) proteins do not, in fact, vary substantially across a broad span of MW.1,31
This conserved amphilicity among different proteins manifests itself in a substantially invariant
partition coefficient ; where and are interphase and bulk solution
concentrations, respectively. Hence, all proteins adsorb to the LV interface at the same ratio-to-
bulk concentration and there is no energetic reason to expect selective adsorption of any
particular protein from the mixture. Furthermore, as long as the bulk solution contains sufficient
total protein concentration to saturate the interphase, then saturating interfacial tension
/ 150I BP C C= ∼ IC BC
'lv
γ will
not vary significantly with bulk phase composition.
At 60-85 mg/mL total protein (including fibrinogen),47 plasma and serum is well over the ~ 3
mg/mL required to saturate the LV surface. According to the discussion above, depletion or
concentration of one particular protein over another will not measurably affect lvγ . So it
happens that concentration-dependent lvγ of blood plasma is nearly identical to that of serum,
even though serum is substantially depleted of fibrinogen. This further explains how it happens
that lvγ does not significantly vary among mammalian species with different blood-protein
composition. Simply stated, any combination of blood-protein constituents behave similarly in
101
Page 120
water because individual constituents behave similarly. This extension of the venerable similia
similibus solventur (like dissolves like) rule of miscibility occurs because the energetics of
hydrophobic hydration48 of blood proteins is approximately constant across a broad range of
MW.1,31
Mixing rules articulated in the Theory section suggest that protein adsorption to the LV surface
from multi-component solutions can be accurately viewed as a competition for space within the
interphase region. Competition is on a on a w/v basis, not molar, so that each competing protein
is represented within the interphase at the same w/v fraction as in the bulk solution phase at
equilibrium. The plasma/serum proteome is comprised of at least 490 proteins, with a natural
abundance that varies over more than 10 orders of magnitude.49 Only the highest-concentration
members of the proteome can be expected to measurably affect concentration-dependent lvγ .
For example, we have reported that blood factor XII is only weakly surface-active at
physiological concentration of 4 mg/100 mL.31 Bearing this in mind, Eq. (4) interprets total
plasma/serum protein as mg/mL, or 20 < m < 28, which is roughly consistent
with the 30 classical plasma proteins37 that occupy the first five decades of physiological
concentration.49 In other words, the effective partition coefficient
60 85i
m
Bi
W< <∑
150~ 530eff
PPm
≡ = for
important coagulation proteins such as FXII at a hydrophobic surface. We thus conclude that
statistical representation of yet rarer plasma proteins within this hydrophobic interphase must be
vanishingly small. Depletion of coagulation proteins in the conversion of plasma to serum
certainly changes m but does not alter the total w/v composition within the interphase because
. As a consequence concentration-dependent maxB BW W∑ lvγ curves of plasma and serum are
102
Page 121
nearly identical because other protein constituents compete for the interfacial vacancies
effectively created by removal of proteins consumed in the coagulation process (e.g. conversion
of fibrinogen to insoluble fibrin).
Binary Protein Mixtures and the Vroman Effect: Mixing two proteins with slightly different
characteristic 'lv
γ in different proportions at fixed total protein concentration provides a means of
testing mixing rules articulated in the Theory section by using interfacial tension as a kind of
tracer of interphase composition. Fig. 3 summarizes results of such an approach at two total
protein concentrations. Fig. 3A shows that limiting lvγ is achieved at 2.1 mg/mL for 100% hIgM
or HSA. Fig. 3B shows that Eq. (3) is in nearly quantitative adherence to the data listed in Table
2, demonstrating that the weight-fraction combining formula for the interfacial tension of protein
mixtures closely simulates reality; at least for the 2.1 mg/mL HSA/hIgM solutions that come to
equilibrium within the time frame of lvγ observation (1 hr). It is thus concluded that the binary
mixing rule of Eq. (2) and subordinate assumptions accurately specify the interphase protein
composition at equilibrium. However, steady-state is not achieved for 27 µg/mL total-protein
solutions regardless of HSA/hIgM relative composition.
It is noteworthy that the lag phase in lvγ dynamics observed in the 100% hIgM case (see
annotations in Fig. 3D) was completely eliminated upon replacement with only 25% albumin
(while maintaining constant total protein composition). Little doubt this occurred because
diffusion/mass transfer of HSA molecules (66.3 kDa) to the interphase region was much faster
than that of hIgM (1000 kDa), so that initial kinetics was dominated by HSA adsorption at t <
900 sec. However, from the discussion above, it is apparent that steady-state interphase
103
Page 122
composition is a mixture controlled by w/v proportions of the bulk solution, not the dynamics
that lead to the final composition. Presumably then, transient accumulation of HSA within the
interphase is eventually accommodated by dilution with hIgM. This adsorption-displacement
mechanism is consistent with the Vroman effect mentioned in the Introduction section.
However, Vroman effect at the LV interface is herein interpreted as a process of adjusting
interphase composition to achieve the composition dictated by mixing rules rather than
attributing the cause to specifics of molecular composition or molecular characteristics (see as
examples refs. 30,50,51 and citations therein).
It is of further interest that post-lag-phase kinetic data was quite linear on t1/2 coordinates for all
protein compositions listed in Table 2 (see (Fig. 3D), suggesting that approach to steady state
was dominated by diffusion and followed Dtπ
kinetics. However, slopes through this data
region were statistically identical for all total-protein compositions ranging from 100% hIgM to
100% FV HSA (Table 2). This finding is inconsistent with the substantial size disparity between
these two proteins. Thus, we suspect that linearity on t1/2 coordinates is happenstance and that
kinetics are rather controlled by an adsorption process, not simple diffusion, possibly related to
molecular exchange reactions occurring within the various layers comprising the mixed
interphase. However interpreted, it is clear that much more work is required to evaluate
mechanistic alternatives.
104
Page 123
3.6. Conclusions
A relatively simple model of protein adsorption to the liquid-vapor (LV) interface leads to
mixing rules stipulating the equilibrium protein composition of the interphase region formed by
adsorption from a solution of m constituents. Proteins compete for space at the LV interphase on
a weight, not molar, concentration basis. As a consequence, the equilibrium weight-fraction
composition of the interphase is identical to that of the bulk phase. However, interphase
concentration of any particular protein is diluted by a factor of m relative to that which would
have otherwise been achieved from a pure, single-component solution. That is to say, each
protein of an m protein mixture achieves a interphase concentration that is dictated by an
effective partition coefficient
IC
effPPm
≡ ; where I
B
CP C= and is the bulk-protein
concentration. For complex biological fluids such as blood plasma and serum, mixing rules thus
imply that dilute members of the proteome are overwhelmed at the LV interphase by the thirty
classical plasma proteins occupying the first-five decades of physiological concentration. Liquid-
vapor interfacial tension
BC
lvγ of single-protein solutions, binary-protein mixtures, blood plasma
and serum measured by pendant drop tensiometry is completely consistent with mixing theory in
that steady-state concentration-dependent lvγ among these specimens cannot be clearly
distinguished when scaled by a w/v concentration. Furthermore, equilibrium (steady-state) lvγ
of albumin and IgM binary mixtures precisely follows a simple combining rule predicated on
mixing theory. Adsorption-kinetics studies of these binary solutions strongly suggest that slow-
moving IgM molecules displace faster-moving albumin molecules in a Vroman-effect-like
process leading to steady state. The Vroman effect is thus interpreted as a natural outcome of
surface reorganization to achieve the equilibrium interphase composition dictated by a firm set of
mixing rules.
105
Page 124
Citations
(1) Krishnan, A.; Sturgeon, J.; Siedlecki, C. A.; Vogler, E. A. Scaled Interfacial
Activity of Proteins at the Liquid-Vapor Interface,J. Biomed. Mat. Res. 2004, 68A, 544.
(2) Horbett, T. A. Biological Activity of Adsorbed Proteins. In Biopolymers at
Interfaces; Malmsten, M., Ed.; Marcel Dekker: New York, 1998; Vol. Surfactant science series
Vol. 75; pp 393.
(3) Castner, D. G.; Ratner, B. D. Biomedical surface science: Foundations to
frontiers,Surface Science 2002, 500, 28.
(4) Vogler, E. A. How Water Wets Biomaterials. In Water in Biomaterials Surface
Science; Morra, M., Ed.; John Wiley and Sons: New York, 2001; pp 269.
(5) Vogler, E. A. Interfacial Chemistry in Biomaterials Science. In Wettability; Berg,
J., Ed.; Marcel Dekker: New York, 1993; Vol. 49; pp 184.
(6) Biopolymers at Interfaces; Malmsten, M., Ed.; Marcel Dekker: New York, 1998,
pp 656.
(7) Protein Adsorption on Biomaterials; Cooper, S. L.; Peppas, N. A.; Hoffman, A.
S.; Ratner, B. D., Eds.; Am. Chem. Soc.: Washington D. C., 1982; Vol. 199, pp 234.
(8) Proteins at Interfraces: Physicochemical and Biochemical Studies; Brash, J. L.;
Horbett, T. A., Eds.; Am. Chem. Soc.: Washington DC, 1987.
(9) Surface and Interfacial Aspects of Biomedical Polymers: Protein Adsorption;
Andrade, J. D., Ed.; Plenum Press: New York, 1985; Vol. 1-2, pp 1.
(10) Vogler, E. A.; Martin, D. A.; Montgomery, D. B.; Graper, J. C.; Sugg, H. W. A
Graphical Method for Predicting Protein and Surfactant Adsorption Properties, Langmuir 1993,
9, 497.
106
Page 125
(11) Brash, J.; Lyman, D. Adsorption of Proteins and Lipids to Nonbiological
Surfaces. In The Chemistry of Biosurfaces; Brash, J. L., Ed.; Marcel Dekker: new York, 1971; pp
177.
(12) Vroman, L. What Factors Determine Thrombogenicity?,Bull. N. Y. Acad. Med.
1972, 48, 302.
(13) Vroman, L.; Adams, A. L.; Klings, M.; Fischer, G. Fibrinogen, Globulins,
albumins, and Plasma at Interfaces. In Applied Chemistry at Protein Interfaces: A Symposium at
the 166th Meeting of the American Chemical Society; American Chemical Society: Washington,
DC, 1975; Vol. Adv. in Chem Series 145; pp 255.
(14) Horbett, T. Protein Adsorption on Biomaterials. In Biomaterials: Interfacial
Phenomena and Applications; Cooper, S. L., Peppas, N. A., Hoffman, A. S., Ratner, B. D., Eds.;
Am. Chem. Soc.: Washington D. C., 1982; Vol. 199; pp 234.
(15) Brash, J.; Hove, P. t. Effect of Plasma Dilution on Adsorption of Fibrinogen to
Solid Surfaces,Thromb. Haemostas. 1984, 51, 326.
(16) Lensen, H. G. W.; Bargman, D.; Bergveld, P.; Smolders, C. A.; Feijen, J. High-
performance Liquid Chromatography as a Technique to Measure the Competitive Adsorption of
Plasma Proteins onto Laticies,J. Colloid and Interface Sci. 1984, 99, 1.
(17) Vroman, L.; Adams, A. Adsorption of Proteins Out of Plasma and Solutions in
Narrow Spaces,J. Colloid and Interface Sci. 1986, 111, 391.
(18) Wojciechowski, P.; Hove, P. T.; Brash, J. L. Phenomenology and Mechanism of
the Transient adsorption of Fibirinogen from Plasma (Vroman Effect),J. Colloid and Interface
Sci. 1986, 111, 455.
(19) Elwing, H.; Askendal, A.; Lundstrom, I. Competition Between Adsorbed
Fibrinogen and High-molecular-weight Kininogen on Solid Surfaces Incubated in Human
107
Page 126
Plasma (the Vroman Effect): Influence of Solid Surface Wettability,J. Biomed. Mat. Res. 1987,
21, 1023.
(20) Shirahama, H.; Lyklema, J.; Norde, W. Comparative Protein Adsorption in Model
Systems,J. Colloid and Interface Sci. 1990, 139, 177.
(21) Leonard, E. F.; Vroman, L. Is the Vroman Effect of Importance in the Interaction
of Blood with Artificial Materials,J. Biomaterial Sci. Polym. ed. 1991, 3, 95.
(22) Wahlgren, M.; Arnebrant, T. Protein Adsorption to Solid Surfaces,Tibtech 1991,
9, 201.
(23) Wojciechowski, P.; Brash, J. L. The Vroman Effect in Tube Geometry: The
Influence of Flow on Protein Adsorption Measurements,J. Biomater. Sci. Polymer Edn. 1991, 2,
203.
(24) Brash, J. L.; Hove, P. T. Protein Adsorption Studies on "Standard" Polymeric
Materials,J. Biomater. Sci. Polymr. Edn. 1993, 4, 591.
(25) Vroman, L. Letter to the Editors,J. Biomat. Sci. Polym. Ed. 1994, 6, 223.
(26) Claesson, P. M.; Blomberg, E.; Froberg, J. C.; Nylander, T.; Arnebrant, T. Protein
Interactions at Solid Surfaces,Adv. Collid and Interface Sci. 1995, 57, 161.
(27) Lin, J. C.; Cooper, S. L. In Vitro Fibrinogen Adsorption from Various Dilutions
of Human Blood Plasma on Glow Discharge Modified Polyethylene,J. Colloid and Interface Sci.
1996, 182, 315.
(28) Lee, J. H.; Lee, H. B. Platelet Adhesion onto Wettability Gradient Surfaces in the
Absence and Presence of Plasma Proteins,J. Biomed. Mat. Res. 1998, 41, 304.
(29) Jung, S.-Y.; Lim, S.-M.; Albertorio, F.; Kim, G.; Gurau, M. C.; Yang, R. D.;
Holden, M. A.; Cremer, P. S. The Vroman Effect: A Molecular Level Description of Fibrinogen
Displacement,J. Am. Chem. Soc. 2003, 125, 12782.
108
Page 127
(30) Derand, H.; Malmsten, M. Protein Interfacial Behavior in Microfabricated
Analysis Systems and Microarrays. In Biopolymers at Interfaces; Malmsten, M., Ed.; Marcel
Dekker: New York, 1998; Vol. Surfactant science series Vol. 75; pp 393.
(31) Krishnan, A.; Siedlecki, C.; Vogler, E. A. Traube-Rule Interpretation of Protein
Adsorption to the Liquid-Vapor Interface,Lagmuir 2003, 19, 10342.
(32) Vogler, E. A. Practical Use of Concentration-Dependent Contact Angles as a
Measure of Solid-Liquid Adsorption I: Theoretical Aspects, Langmuir 1992, 8, 2005.
(33) Vogler, E. A. Practical Use of Concentration-Dependent Contact Angles as a
Measure of Solid-Liquid Adsorption II: Experimental Aspects, Langmuir 1992, 8, 2013.
(34) Ostuni, E.; Grzybowski, B. A.; Mrksich, M.; Roberts, C. S.; Whitesides, G. M.
Adsorption of Proteins to Hydrophobic Sites on Mixed Self-Assembled Monolayers,Langmuir
2003, 19, 1861.
(35) Rao, C. S.; Damodaran, S. Is Surface Pressure a Measure of Interfacial Water
Activity? Evidence from Protein Adsorption Behavior at Interfaces,Langmuir 2000, 16, 9468.
(36) Vogler, E. A. Structure and Reactivity of Water at Biomaterial Surfaces,Adv.
Colloid and Interface Sci. 1998, 74, 69.
(37) Putnam, F. W. Alpha, Beta, Gamma, Omega - The Roster of the Plasma Proteins.
In The Plasma Proteins: Structure, Function, and Genetic Control; Putnam, F. W., Ed.;
Academic Press: New York, 1975; Vol. 1; pp 58.
(38) Morgan, J. L. R.; Woodward, H. E. The Weight of a Falling Drop and the Laws of
Tate,J. Am. Chem. Soc. 1913, 35, 1249.
(39) DuNouy, P. L. Surface Tension of Serum. XIII. On Certain Physicochemical
Changes in Serum as a Result of Immunization,J. Exp. Med. 1925, 41, 779.
(40) Harkins, H. N.; Harkins, W. D. The Surface Tension of Blood Serum, and the
Determination of the Surface Tension of Biological Fluids,J. Clin. Invest. 1929, 7, 263.
109
Page 128
(41) W.D.Harkins; F.E.Brown. The Drop Weight Method For The Determination Of
Surface Tension.,J. Am. Chem. Soc. 1916, 38, 228.
(42) W.D.Harkins; F.E.Brown. A Simple Apparatus For The Accurate And Easy
Determination Of Surface Tension, With A Metal Thermoregulator For The Quick Adjustment Of
Temperature.,J. Am. Chem. Soc. 1916, 38, 246.
(43) Zozaya, J. A Physicochemical Study Of Blood Sera,J. Biol. Chem 1935, 110, 599
(44) Zozaya, J. A Physicochemical Study Of Blood Sera II : Analysis of 500 cases,J.
Phys. Chem 1938, 42, 191.
(45) Zozaya, J. A Physicochemical Study Of Blood Sera III: Analysis of One Hundred
Cases,J. Phys. Chem 1938, 42, 657.
(46) Swenson, M. J. Physiological Properties and Cellular and Chemical Constituents
of Blood. In Duke's Physiology of Domestic Animals; Swenson, M. J., Ed.; Cornell University
Press: London, 1977.
(47) Adkins, J. N.; Varnum, S. M.; Auberry, K. J.; Moore, R. J.; Angell, N. H.; Smith,
R. D.; Springer, D. L.; Pounds, J. G. Toward a Human Blood Serum Proteom,Molecular and
Cellular Proteomics 2002, 1, 947.
(48) Yaminsky, V. V.; Vogler, E. A. Hydrophobic Hydration,Current Opinion in
Colloid and Interface Sci. 2001, 6, 342.
(49) Anderson, N. L.; Anderson, N. G. The Human Plasma Proteome:History,
Character, and Diagnostic Prospects,Molecular and Cellular Proteomics 2002, 1, 845.
(50) Malmsten, M. Formation of Adsorbed Protein Layers,Journal of Colloid and
Interface Science 1998, 207, 186.
(51) Lassen, B.; Malmsten, M. Structure of Protein Layers during Competitive
Adsorption,Journal of Colloid and Interface Science 1996, 180, 339.
110
Page 129
TABLE I: PROTEIN PARAMETERS NAME OF PROTEIN
(acronym) γo
lv (mN/m)
γ'lv
(mN/m) / 2ln BC
π
(PPT)
M (dimension-
less)
maxΠ
(mN/m)
Prep 1
72.3±1.2 50.3±1.2
16.32±0.28 -9.9±2.5 21.4±1.2HUMAN SERUM ALBUMIN Fraction V (FV HSA)
Prep 2 70.8±1.1 46.2±2.5 16.61±0.51 -7.3±2.2 25.5±2.5Prep 1 70.48±0.57 48.7±3.2 17.99±0.71 -8.6±2.1 23.1±3.2Prep 2 71.13±0.57 51.6±1.9 18.60±0.39 -10.4±2.7 20.1±1.9
HUMAN IgG (hIgG)
Prep 3 71.09±0.42 56.48±0.92 19.72±0.19 -20.1±5.1 15.21±0.92Prep 1 70.98±0.39 51.4±1.2 16.82±0.19 -13.2±3.5 20.3±1.2Prep 2 71.65±0.55 50.2±3.1 18.52±0.35 -14.2±4.2 21.5±3.1
HUMAN IgM (hIgM)
Prep 3 70.51±0.59 55.4±1.3 17.59±0.12 -11.7±3.3 16.3±1.3Prep 1 71.70±0.62 48.55±0.71 19.56±0.19 -23.3±3.6 23.15±0.71HUMAN PLASMA (HP) Prep 2 71.38±0.74 45.5±1.1 19.19±0.26 -10.9±1.6 26.5±1.1Prep 1 70.54±0.46 47.61±0.62 19.91±0.17 -23.4±3.7 24.08±0.62HUMAN SERUM (HS) Prep 2 72.64±0.72 45.64±0.69 18.47±0.18 -13.4±1.6 26.33±0.69
111
Page 130
Table II: Time-Dependent γlv of FV-HSA in hIgM Solutions 2.1 mg/mL Total Protein Steady-State Parameters
27 µg/mL Total Protein Kinetic Parameters
% FV HSA in hIgM
γ′lv (mN/m)
Πobs (mN/m)
slope of t1/2>30
R2 (%)
0 56.21±0.22 15.76±0.22 -0.14±0.01 9525 54.59±0.17 17.39±0.17 -0.15±0.01 9450 53.92±0.11 18.17±0.11 -0.11±0.01 8675 52.15±0.12 19.82±0.12 -0.15±0.01 92100 51.42±0.17 20.55±0.17 -0.16±0.01 87
112
Page 131
Figure 1: Interfacial tension profiles in 3D (γlv as a function of analysis time (drop age) and
logarithmic (natural) solution concentration ) and 2D (γlv as a function of logarithmic solution
concentration at selected times) formats comparing (human) immunoglobulin-G (hIgG, panel A,
preparation 1, Table 1), plasma (HP, panel B, preparation 1, Table 1), and serum (HS, panel C,
preparation 1, Table 1). In each case, solute concentration is expressed in either w/v or v/v units
of parts-per-trillion (PPT, grams solute/1012 grams solution for hIgG and mL/1012 mL solution for
plasma/serum). Symbols in 2D panels represent time slices through 3D representations (filled circle
= 0.25 sec, open circle = 900 sec, filled triangles = 1800 sec, and open triangles = 3594 sec;
annotations in panel A indicate maximum and half-maximum spreading pressure). Similar
interfacial activity is observed for both protein mixtures as well as pure protein solutions.
BC
BC
BC
113
Page 132
6 8 10 12 14 16 18 20 22 24 2650
55
60
65
70
75
45
50
55
60
65
70
75
1000
2000
3000
4000
810
1214
1618
2022
2426
28
8 10 12 14 16 18 20 22 24 26 2845
50
55
60
65
70
75
8 10 12 14 16 18 20 22 24 26 2845
50
55
60
65
70
75
50
55
60
65
70
75
1000
2000
3000
4000
5
10
15
20
25
γ lv(m
N/m
)
Elapsed Time (sec) lnCB(CB
in PPT)
γ lv(m
N/m
)
Elapsed Time (sec) lnCB(CB
in PPT)
45
50
55
60
65
70
75
1000
2000
3000
4000
810
1214
1618
2022
2426
28
γ lv(m
N/m
)
Elapsed Time (sec) lnCB(CB
in PPT)
γ l v(m
N/m
)
lnCB (CB in PPT)
γ l v(m
N/m
)
lnCB (CB in PPT)
γ l v(m
N/m
)
lnCB (CB in PPT)
Πmax
1/2Πmax
lnCBπ/2
γ ’
γ o
114
Page 133
Figure 2: Comparison of steady-state, concentration-dependent lvγ data for (human) plasma (HP,
preparation 2, Table 1), serum (HS, preparation 2, Table 1), and IgG (hIgG, preparation 3, Table 1)
on a single concentration axis, showing that protein mixtures cannot be confidently distinguished
from a purified protein. Band represents 99% confidence intervals around best-fit-human plasma
data. (open circle = HP, filled square = HS, filled triangle = hIgG).
115
Page 134
lnCB (CB in PPT)8 10 12 14 16 18 20 22 24 26 28
γ lv (m
N/m
)
40
45
50
55
60
65
70
75
116
Page 135
Figure 3: Interfacial tension lvγ of (human) FV HSA and hIgM mixtures in different proportions (A,
B at 2.1mg/mL; C, D at 27 µg/mL total protein concentration). Symbols represent different
proportions of FV HSA in hIgM (filled circle = 100% , open square = 25%, filled triangle = 0% FV
HSA in hIgM). Equilibrium (steady state) is reached within the 3600 sec drop age of the PDT
mixture experiment at 2mg/mL (Panel A), while lvγ drifted continuously lower with time at 27
µg/mL (Panel C). Panel B plots the observed spreading pressure ( obsΠ ) as a function of proportion
of FV HSA in hIgM, with error bars corresponding to the standard deviation of the mean lvγ . Line
representing Eq.3 (see theory) demonstrates close correlation with experimental results. Panel D
plots lvγ as a function of t1/2 , revealing a linear trend (following a lag phase of t < 900 sec) that is
statistically identical for each of the proportions of FV HSA in hIgM. See Table 2 for parameters
from linear-fit to data for t > 900 seconds.
117
Page 136
A
C
B
D
γ lv(m
N/m
)
Time (seconds)0 1000 2000 3000 4000
γ lv (m
N/m
)
50
55
60
65
70
75
% Albumin (FV HSA)0 20 40 60 80 100
Πobs (
mN
/m)
15
16
17
18
19
20
21
Time (seconds)0 1000 2000 3000 4000
γ lv(m
N/m
)
60
65
70
75
0 10 20 30 40 50 6060
65
70
75
Lag Phase
Time1/2 (√sec)
118
Page 137
Glossary of Symbols
BC Bulk solution concentration (moles/volume) maxBC Bulk solution concentration at limiting interfacial tension (moles/volume)
/ 2BCπ Bulk solution concentration at half-maximal-change in interfacial activity (moles/volume)
IC Interphase concentration (moles/volume) maxIC Maximal interphase Concentration (moles/volume)
D Diffusion Coefficient max,I if Weight fraction of protein i within the interphase max,I jf Weight fraction of protein j within the interphase max,B if Weight fraction of protein i within the bulk
max,B jf Weight fraction of protein j within the bulk
pΦ Volume fraction of protein in the interphase maxpΦ Maximal volume fraction of protein in the interphase
γlv Liquid-vapor (LV) interfacial tension (mN/m) γo
lv Low-concentration asymptote of a concentration-dependent γlv curve (mN/m) γ'
lv High-concentration asymptote of a concentration-dependent γlv curve (mN/m) m Number of components in a multi-component solution M Parameter fitted to concentration-dependent γlv curve
In Moles of protein within the interphase
NA Avogadro number P Partition coefficient, /I BP C C≡
effP Effective Partition coefficient of a protein in a multi-component solution, effPPm
≡
Π Spreading pressure (mN/m), Π = γolv - γ'
lv maxΠ Maximum Spreading pressure (mN/m) maxiΠ
Maximum Spreading pressure of protein i in a binary mixture of proteins i and j (mN/m) maxjΠ
max
Maximum Spreading pressure of protein j in a binary mixture of proteins i and j (mN/m)
∆Π Difference in spreading pressure between 2 proteins in a binary mixture of proteins i and j
max max maxi j∆Π ≡ Π −Π ( mN/m)
maxobsΠ Maximum Observed Spreading pressure (mN/m)
vr Protein radius (cm)
t Time (seconds) t1/2 Sqrt(time) (√seconds)
IV Interphase volume (cm3)
pV Protein molar volume (cm3/mole) max
BW Bulk weight/volume concentration max
IW Interphase weight/volume concentration
119
Page 138
Chapter 4
Liquid-Vapor Interfacial Tension of Blood Plasma, Serum and Purified Protein Constituents Thereof
Abstract
A systematic study of water-air (liquid-vapor, LV) interfacial tension lv
γ of blood plasma and serum
derived from four different mammalian species (human, bovine, ovine and equine) reveals nearly
identical concentration-dependence (ln
lv
B
dd C
γ ; where is plasma/serum dilution expressed in v/v
concentration units). Comparison of results to a previously-published survey of purified human-blood
proteins reveals that
BC
lnlv
B
dd C
γ of plasma and serum is surprisingly similar to that of purified protein
constituents. It is thus concluded that any combination of blood-protein constituents will be substantially
similar because ln
lv
B
dd C
γ of individual proteins are very similar. Experimental results are further interpreted
in terms of a recently-developed theory emphasizing the controlling role of water in protein adsorption.
Accordingly, the LV interphase saturates with protein adsorbed from bulk solution at a fixed weight-
volume concentration (~436 mg/mL) independent of protein identity or mixture. As a direct
consequence, ln
lv
B
dd C
γ of purified proteins closely resembles that of mixed solutions and does not depend
on the relative proportions of individual proteins comprising a mixture. Thus variations in the plasma
proteome between species are not reflected in ln
lv
B
dd C
γ nor is serum different from plasma in this regard,
despite being depleted of coagulation proteins (e.g. fibrinogen). A comparison of pendant-drop and
Wilhelmy-balance tensiometry as tools for assessing protein lv
γ shows that measurement conditions
employed in the typical Wilhelmy plate approach fails to achieve the steady-state adsorption state that is
accessible to pendant-drop tensiometry.
120
Page 139
4.1. Introduction
Clinical interest in the water-air (liquid-vapor, LV) interfacial tension lv
γ of blood plasma and
serum extends back at least eight decades to the pioneering work of Morgan and Woodward
who, in 1913, used the venerable drop-weight method to demonstrate that lv
γ of blood serum
was much lower than that of water 1. Related work further showed that pathological conditions
such as syphilis, typhoid, tuberculosis, and cancer led to statistically-significant reduction in
serum lv
γ . Otherwise, however, it was found that plasma/serum lv
γ was remarkably consistent
within and among species (human, canine, porcine, equine and ovine); with a lower lv
γ limit near
45 mN/m and an upper bound no greater than 48 mN/m for normal donors. Studies carried out
between 1916-1929 by thought leaders of the day such as William Harkins 2,3 and Pierre
DuNouy 4,5 debated the best method for measuring equilibrium lv
γ of biological fluids (see also
the 1929 work of Jolin 6). DuNuoy and Harkins reported that lvγ of plasma was about 10 mN/m
higher than that reported by Morgan and Woodward. Still later in 1935, Zozaya undertook a
comprehensive study of human blood serum, reporting an average value of 54.2 mN/m 7,8.
Recent work by Kratochvil et al. reports values within the 60-68 mN/m range 9,10; with yet
higher values for plasma derived from patients with disease conditions such as rheumatoid
arthritis, proliferative glomerulonephritis, some tumors of the central nervous system, and
disorders of the urogenital tract.
Our main interest in blood plasma and serum interfacial tension lies not in the dissimilarities
observed between normal and pathological groups but rather in the impressive similarity in lv
γ of
plasma and serum prepared from normal blood of diverse species. We find this consistency
121
Page 140
remarkable in view of the substantial differences in plasma proteome across species 11. And of
course serum is substantially depleted of fibrinogen relative to plasma, removing one of the five
most abundant proteins (2.5-4.5 mg/mL) 12. Specifically, we are curious to know in detail how it
happens that lv
γ values for these proteinaceous mixtures are so similar in light of the general
expectation that compositional/structural differences among proteins should result in quite
different adsorption energetics and commensurately different concentration-dependent lvγ .
Stated somewhat more precisely, we wish to know the ‘mixing rules’ that relate protein type or
MW and bulk-phase composition to observed lv
γ and how these rules explain adsorption from
complex proteinaceous milieu such as blood plasma and serum 13.
This paper reports a systematic survey of concentration-dependent water-air (liquid-vapor, LV)
interfacial tension lvγ of blood plasma and serum derived from human and animal species,
measured by both pendant drop and Wilhelmy balance tensiometry (PDT and WBT,
respectively). PDT results generally corroborate that of Morgan and Woodward mentioned
above in that we find considerable consistency in interfacial tension across species with an
average lv
γ ~ 45 mN/m. Comparison of PDT and WBT results suggest that historical lack of
agreement between investigators studying plasma/serum lvγ is related to the slow achievement
of steady-state protein adsorption that effectively invalidates tensiometric methods in which the
LV interface is continuously moving or forming (as in typical applications of WBT or drop-
weight tensiometry). We further report that concentration-dependent lvγ of plasma and serum is
surprisingly similar to that of purified constituents by comparing results to survey of human-
122
Page 141
blood proteins 14. A newly-developed theory of protein adsorption 13,15 is employed to reconcile
experimental findings.
4.2. Materials and Methods
Purified Proteins and Protein Mixtures: Human platelet-poor plasma (citrated) was prepared
from outdated (within 2 days of expiration) lots obtained from the Hershey Medical Center
Blood Bank. Human serum was prepared in 15 mL batches by recalcification with 0.1 M CaCl2
at 5:1 v/v plasma:calcium ratio in clean glass scintillation vials for about 15 min. Bovine, ovine
and equine plasma and serum were used as received from Hemaresource and Supply Inc.
(Aurora, OR) and were not subject to any additional fractionation/purification steps. Purified
bovine albumin, both Fraction V (FV) and Fatty Acid Free (FAF),were used as-received from
Sigma-Aldrich and were the highest purity available (>96% as assessed by SDS PAGE). Mass,
concentration, and molecular weights supplied with purified proteins were accepted without
further confirmation. Ref. 14 discloses details of protein purity and protein-solution preparation
including serial dilutions of protein stock solutions (usually 10 mg/mL) that were performed in
96-well microtiter plates by (typically) 50:50 dilution in phosphate buffered saline solution
(PBS) prepared from powder (Sigma Aldrich) in distilled-deionized (18 MΩ) water (interfacial
tension of PBS and water was checked periodically by Wilhelmy-balance tensiometry).
Liquid-Vapor Interfacial Tension Measurements: LV interfacial tensions lv
γ reported in this
work were measured by either Wilhelmy-balance tensiometry (WBT) or pendant-drop
tensiometry (PDT). Unless specifically indicated otherwise, results refer to PDT performed on a
commercial automated tensiometer (First Ten Angstroms Inc., Portsmouth VA). Briefly, the
123
Page 142
tensiometer employed a Tecan liquid-handling robot to aspirate between 10-12 µL of solutions
contained in a 96-well microtiter plate prepared by the serial-dilution protocol mentioned above.
The robot was used to reproducibly transfer the tip with fluid contents into a humidified (99+ %
RH) analysis chamber and dispense between 6-11 µL pendant drops (smaller drop volume
required for lower interfacial tensions) within the focal plane of a magnifying camera. These and
all other aspects of pendant-drop analysis were performed under computer control. Precision of
lvγ was about 0.5 mN/m based on repeated measurement of the same pendant drop. The
instrument was calibrated against pure water interfacial tension and further confirmed on
occasion against WBT. The analysis chamber was thermostated to a lower-limit of 25±1 oC by
means of a computer-controlled resistive heater. Upper-temperature limit was, however, not
controlled but rather floated with laboratory temperature, which occasionally drifted as high as
29 oC during summer months. Thus, reported lv
γ values are probably not more accurate than
about 1 mN/m on an inter-sample basis considering the small but measurable variation of water
interfacial tension with temperature. This range of accuracy is deemed adequate to the
conclusions of this report which do not strongly depend on more accurate lv
γ that is difficult to
achieve on a routine basis with the multiplicity of protein solutions investigated herein.
WBT was performed using a commercial computer-controlled instrument (Camtel CDCA 100,
Royston UK) applying techniques discussed in detail elsewhere 14. Solvent-and-plasma-
discharge-cleaned glass coverslips were used as the plate (Fisher brand 22X30 mm #1) and
solutions (approximately 10 mL) were contained in disposable polystyrene beakers (Fisher)
previously determined not to measurably affect interfacial tension of water contained therein.
No attempt was made to thermostat the balance and all reported measurements were obtained at
124
Page 143
ambient laboratory temperature. Also, no attempt was made to correct for the (presumably small
but not measured) variation in the perimeter of glass coverslips used as plates in the Wilhelmy
method.
Computation and Data Representation: Computational, statistical, and theoretical methods
used in this work have been discussed in detail elsewhere 16. Briefly, time-dependent lv
γ data
corresponding to solutions at different w/v or v/v concentration (for purified proteins or
protein mixtures respectively) were recovered from PDT files and correlated with concentrations,
leading to a matrix of results with row values representing concentration and time (seconds) as
column values. It was generally observed that
BC
lvγ data take on a sigmoidal shape when plotted
on logarithmic-concentration axes 16, with a well-defined low-concentration asymptote lv
oγ and a
high-concentration asymptote 'lv
γ . Successive non-linear least-squares fitting of a four-
parameter logistic equation ' / 2( [( ) /(1 (ln / ln ) )] )Mlv lv lv B B lvC Cπ 'γ γ γ γ°= − + + to concentration-
dependent lv
γ data for each time within the observation interval quantifiedlv
oγ and 'lv
γ parameters
with a measure of statistical uncertainty. Fitting also recovered a parameter measuring
concentration-at-half-maximal-change in interfacial activity, (where and / 2ln BCΠ max1/2/ 2Π = Π
max 'lv lvγ γ°Π ≡ − ), as well as a parameter M that measured steepness of the sigmoidal curve. This
empirical, multi-parameter fitting to concentration-dependent lv
γ data was a purely pragmatic
strategy that permitted quantification of best-fit protein and surfactant characteristics but is not a
theory-based analysis 16. Three-dimensional (3D) representations of time-and-concentration-
dependent lv
γ data were created in Sigma Plot (v8) from the data matrix discussed above and
125
Page 144
overlain onto fitted-mesh data computed from least-squares fitting. Two-dimensional (2D)
representations were created from the same data matrices at selected observation times.
4.3. Results
The principal experimental observations of this work were time- and concentration-
dependent water-air (liquid-vapor, LV) interfacial tension lv
γ of human and animal (bovine,
ovine, equine) blood plasma and serum. lvγ of serially-diluted, whole plasma or serum was
measured using either or both pendant-drop (PDT) and Wilhelmy-balance tensiometry (WBT),
as detailed in the Materials and Methods section, resulting in graphical constructions herein
referred to as ‘ lvγ curves’. Figures 1-3 are lvγ curves summarizing experimental results. Table
I compiles quantitative results from statistical fitting of steady-state (equilibrium) lv
γ data for
each species studied. Purified proteins listed in Table I (FV and FAF BSA) supplement a
previously-published survey of purified blood proteins spanning three decades in molecular
weight (MW) 14.
Fig. 1 compiles representative PDT results for human (HS, panel A), ovine (OS, panel B), and
equine blood serum (ES, panel C). Concentration-dependent lv
γ was observed to follow a
sigmoidal-like function on logarithmic concentration axis; yielding parameters lv
oγ , 'lv
γ , ,
and M when statistically-fit to a four-parameter logistic equation as described in Materials and
Methods. In each case represented in Fig. 1,
/ 2ln BCΠ
lvγ was observed to change with time to a final,
steady state 'lv
γ value. Dynamics were undoubtedly due to protein mass-transfer and adsorption-
kinetic effects. Characteristic lvγ -curve parameters (see Methods and Materials) listed in
126
Page 145
columns 2-6 of Table I compare PDT and WBT results. Parameters for PDT represent the
mean of the final 25 lv
γ curves recorded within the 1-hour observation time of the PDT
experiment, with standard deviation of the mean lvγ used as a measure of statistical uncertainty.
Parameters for WBT result from best fit to a single, concentration-dependent lv
γ curve because
no time dependence was recorded in WBT experiments. Here, uncertainty was taken to be the
standard-error-of-the-fit to the four-parameter logistic equation (Methods and Materials). Note
that WBT was applied only to plasma and serum solutions because the high volume requirement
(~ 10 mL) made WBT impractical for purified proteins available in only small quantities.
Replicate preparations for HP, HS, and albumin (bovine FV and FAF) provide a sense for the
variation in results associated with the whole analytical process leading from concentrate
preparation, serial dilution, and finally lv
γ measurement. Close inspection of columns 2 and 3 of
Table I reveals that lv
oγ parameters (pure PBS) obtained by PDT and WBT were not significantly
different. However, WBT 'lv
γ values (column 3) were frequently (9/12 cases) higher than PDT
by about 10 mN/m. This discrepancy between techniques propagates directly into differences in
values listed in column 6. Likewise, (column 4) and M (column 5) parameter
estimates from PDT and WBT
maxΠ / 2ln BCΠ
lvγ curves were in substantial disagreement. Taken together, this
data shows that PDT and WBT give different measures of concentration-dependent lvγ for
protein mixtures. In fact, we have found that PDT lvγ curves most strongly resemble that of
WBT at early observation times within the 1 hr PDT measurement window (not shown),
suggesting that lack of agreement between PDT and WBT was related to dynamic effects (mass
transport and adsorption kinetics).
127
Page 146
Fig. 2 graphically compares representative PDT steady-state lv
γ curves for human, bovine, ovine
and equine plasma serum on a single set of axis where the surrounding band encloses data within
99% confidence intervals around the best-fit human-plasma data listed in Table I. Fig. 2
demonstrates that plasma and serum of diverse species could not be confidently distinguished
based on this data. Fig. 3 is similar to Fig. 2 comparing new-born, calf, and adult bovine
plasma/serum; where the band encloses 99% confidence intervals around the best-fit, adult-
bovine-plasma data listed in Table I. Fig. 3 demonstrates that plasma and serum derived from
different age groups of a single species could not be confidently distinguished based on this data.
However, the high-concentration asymptote 'lv
γ among bovine species appears not as well-
defined as observed for other species studied (Fig. 1), for as-yet unresolved reasons. However,
Figs. 1-3 collectively show that there is a striking similarity in lvγ curves for plasma and serum
across both donor species and age. Serum was, of course, compositionally distinct from plasma
by virtue of being depleted of fibrinogen in the process of coagulating plasma.
4.4. Discussion
Quantitative Comparison of PDT and WBT: It is common knowledge in modern surface
science that proteins exhibit slow (relative to low MW surfactants) mass transport and adsorption
kinetics that depend strongly on molecular size (MW; see, for example, refs. 17,18 and citations
therein). These dynamics are responsible for the time dependence observed in interfacial
tensions 19. In the early 1900’s, however, these phenomena were being observed for the first
time (through the pioneering work of DuNouy, Morgan, and Harkins briefly reviewed in the
Introduction section), as were consequences of changing LV surface area during lvγ
measurement. Meniscus stretching in WBT measurements or expansion of droplets in drop-
128
Page 147
weight tensiometry conspires with adsorption kinetics by inducing movement of protein to
freshly-formed surface (see refs. 19,20 for more discussion). As a consequence, adsorption may
not reach equilibrium and lvγ not achieve the lowest possible value. Thus, historical debate in
the literature regarding the equilibrium value of plasma/serum lvγ is not surprising in retrospect,
given the widespread reliance on either drop-weight or DuNouy ring tensiometry in that era.
Discrepancies among more recent investigators 9,10 may also be related to dynamic effects in
plasma/serum lvγ measurements.
We attribute the significant differences between WBT and PDT measurement of concentration-
dependent lvγ of plasma/serum quantified in Table I to a failure to achieve steady-state
adsorption in WBT measurements 14. By contrast, the stagnant drop used in PDT yields a
verifiable steady-state (equilibrium; see Fig. 1) and a commensurately lower 'lv
γ than observed in
WBT. Furthermore, we contend that WBT, as applied in this work, does not measure adsorption
kinetics in the same way as PDT due to quite different mass-transfer and adsorption processes
occurring at the moving plate-meniscus region compared to the stagnant-drop interface. These
differences are negligible at very low protein concentrations (WBT and PDT each yielding lv
oγ ~
72 mN/m consistent with pure PBS) but become increasingly important at higher concentration;
leading to significant discrepancies in 'lv
γ , , and M between tensiometric methods 14.
Interestingly, the average PDT
/ 2ln BCΠ
'lv
γ ~ 45 mN/m was in close (but undoubtedly fortuitous)
agreement with the work of Morgan and Woodward 1. WBT 'lv
γ ~ 52 mN/m closely matches that
of Harkins 3, presumably because WBT and drop-weight tensiometry (as applied by
investigators) undershoots steady state in approximately the same way. Hence, we contend that
129
Page 148
neither drop-weight nor WBT (with a continuously moving solid-liquid interface) are appropriate
methods for measuring protein lvγ14,16,21.
Concentration-Dependent lvγ of Plasma, Serum, and Protein Constituents Thereof:
Similarity in concentration-dependent lvγ of blood plasma and serum obtained from normal
donors of diverse species and age groups is very intriguing in light of the substantial differences
in protein composition. Observations collected in Figs. 1-3 corroborating general trends of
experimental work dating back to the early 1900’s are all the more compelling in light of our
recent findings that ln
lv
B
dd C
γ of a broad range of purified blood-protein constituents are likewise
similar 14. Furthermore, we find that the saturating minimum interfacial tension 'lv
γ falls within a
relatively narrow 20 mN/m band characteristic of all proteins and mixtures studied. Experiment
thus suggests that ln
lv
B
dd C
γ of any combination of blood-proteins is very similar because ln
lv
B
dd C
γ of
individual protein constituents are very similar 14,15. All taken together, we find this evidence
suggestive of a heretofore unresolved mechanistic commonality underlying protein adsorption
from complex mixtures to the LV surface.
Our recently-developed theory of protein adsorption to the LV surface 13,15 asserts that the
mechanistic commonality mentioned above is the behavior of water at interfaces 22-24. Theory
suggests that interfacial capacity for protein is controlled by the extent to which interfacial water
can be displaced by adsorbing protein molecules. This maximal interfacial capacity can be
expressed either as a maximal volume fraction or, equivalently, a maximum weight/volume (not
molar) concentration denoted at which maxIW '
lvγ occurs. Calibration of theory to experimental
130
Page 149
neutron-reflectivity or light scattering data has revealed that ~ 436 mg/mL, corroborating
the conclusion drawn from diverse literature sources that adsorbed protein concentrations can be
surprisingly large 22. Importantly, is found not to be dependent on protein identity or MW
but rather is a generic, water-limited adsorption capacity for protein. Furthermore, can be
attained by any mixture of proteins, which is of relevance in the interpretation of concentration-
dependent
maxIW
maxIW
maxIW
lvγ of multi-component protein mixtures such as blood plasma or serum, as further
discussed below.
First, fixed immediately explains the experimental observation that maxIW lvγ curves for diverse
purified proteins spanning three decades of MW appear more similar than dissimilar when scaled
on a w/v basis 15. Serial dilution of a protein solution at surface-saturating concentration
exhibiting the characteristic interfacial tension maxIW '
lvγ will trace similar concentration
dependence because ln
lv
B
dd C
γ of individual proteins are very similar. Second, fixed
rationalizes the experimental observation that maxIW lvγ curves for plasma and serum are
substantially similar, regardless of species or age of normal donor. At 60-85 mg/mL total protein
(including fibrinogen) 25, plasma and serum is well over the ~ 3 mg/mL required to saturate the
LV surface at , achieving minimum interfacial tension maxIW '
lvγ (see Fig. 1A). Depletion of
coagulation proteins in the conversion of plasma to serum certainly changes the number and
concentration of individual protein constituents in bulk solution, but does not alter because
the bulk-solution concentration is well above that required to saturate the LV surface. As a
consequence, concentration-dependent
maxIW
lvγ curves of plasma and serum are nearly identical
131
Page 150
because other protein constituents compete for the interfacial vacancies effectively created by
removal of proteins consumed in the coagulation process (e.g. conversion of fibrinogen to
insoluble fibrin). Third, although variations in plasma proteome among species and age groups
lead to a different weight-fraction distribution of proteins in the bulk phase and surface, these
differences do not affect surface saturation ( ~436 mg/mL). And, because maxIW
lnlv
B
dd C
γ of
individual protein constituents are very similar, the net observed lvγ curves for plasma derived
from different species are not significantly different.
However, fixed does not explain why maxIW lvγ of plasma/serum from abnormal (pathological)
donors is (reportedly) different from that of normal donors (see Introduction). Perhaps disease
states ‘contaminate’ plasma with unknown compounds that affect lvγ or accurate measurement
of plasma lvγ . Given the rather substantial impact methods of lvγ measurement have on results,
we are inclined to suspect that some or all of the 5-10 mN/m discrepancies between normal and
pathological plasma lvγ can be traced directly to metrological issues. Values as high as 60-68
mN/m 9,10 cannot be reconciled with our theoretical interpretation of plasma lvγ . In a more
general sense, it is difficult to rationalize how plasma lvγ can rise to such high levels without
invoking an improbable, wholesale dilution of blood. Another experimental observation not
reconciled by theory is failure of bovine plasma (at various ages) to achieve a sharp plateau (Fig.
3). Bovine plasma is unlike that of other species studied in this regard (compare Figs 1-2) for as
yet unresolved reasons.
132
Page 151
4.5. Conclusions
The principal conclusion to be drawn from this and related work 14,15 is that differences in
concentration-dependent water-air (liquid-vapor, LV) interfacial tension ln
lv
B
dd C
γ among blood
plasma, serum, and purified constituents thereof are surprisingly small. Likewise, differences in
lnlv
B
dd C
γ among plasma and serum derived from disparate species (bovine, ovine, human) or within
a species at different stages of development (new-born, calf and adult bovine) are not resolvable
within 99% statistical confidence. Although these experimental observations extend and
corroborate results of work published in the early part of the 20th century 1-4,6, collective
implications for protein-adsorption mechanisms have apparently been considered only recently
13. Our interpretation is that the insensitivity of ln
lv
B
dd C
γ to substantial differences in plasma
proteome among donor species, and the obvious difference between plasma and serum chemistry
within these groups, arises from an invariance in protein amphilicity (interaction energetics with
water) with protein type (molecular weight or size) 14.
Adsorption of proteins from heterogeneous aqueous solution can be accurately viewed as a
competition for space in the LV surface region 13. LV surfaces of concentrated protein solutions
such as plasma or serum are always saturated with protein. Thus, enrichment or depletion of any
particular protein in bulk solution does not have a significant effect on ln
lv
B
dd C
γ because
substitution of one protein for another within the surface region does not affect surface
saturation.
133
Page 152
Acknowledgments
This work was supported, in part, by the National Institute of Health PHS 5 R01 HL 69965-03,
and by Johnson &Johnson through the Focused Giving Grant Program. Authors appreciate
additional support from the Materials Research Institute and Departments of Bioengineering and
Materials Science and Engineering, Penn State University. Authors gratefully acknowledge the
assistance of Dr. Roger Woodward in instrument design and implementation.
134
Page 153
Citations
(1) Morgan, J. L. R.; Woodward, H. E. The Weight of a Falling Drop and the Laws of
Tate,J. Am. Chem. Soc. 1913, 35, 1249.
(2) W.D.Harkins; F.E.Brown. A Simple Apparatus For The Accurate And Easy
Determination Of Surface Tension, With A Metal Thermoregulator For The Quick Adjustment Of
Temperature.,J. Am. Chem. Soc. 1916, 38, 246.
(3) Harkins, H. N.; Harkins, W. D. The Surface Tension of Blood Serum, and the
Determination of the Surface Tension of Biological Fluids,J. Clin. Invest. 1929, 7, 263.
(4) Nouy, P. L. D. Surface Equilibria of Biological and Organic Colloids; The
Chemical Catalog Co.: New York, 1926; Vol. 27.
(5) DuNouy, P. L. Surface Tension of Serum. XIII. On Certain Physicochemical
Changes in Serum as a Result of Immunization,J. Exp. Med. 1925, 41, 779.
(6) Jolin, J. M. Interfacial Adsorption as a Function of the Concentration of Colloidal
Solutions,J. Biol. Chem. 1929, 84, 543.
(7) Zozaya, J. A Physiochemical Study of Blood Sera, 1935; Vol. 110.
(8) Zozaya, J. A Physicochemical Study Of Blood Sera II : Analysis of 500 cases,J.
Phys. Chem 1938, 42, 191.
(9) Hrncir, E.; Rosina, J. Surface Tension of Blood,Pysiol. Res. 1997, 46, 319.
(10) Kratochvil, A.; Hrncir, E. Correlation Between the Blood Surface Tension and the
Activity of Some Enzymes,Physiol. Res. 2001, 50, 433.
135
Page 154
(11) Swenson, M. J. Physiological Properties and Cellular and Chemical Constituents
of Blood. In Duke's Physiology of Domestic Animals; Swenson, M. J., Ed.; Cornell University
Press: London, 1977.
(12) Putnam, F. W. Alpha, Beta, Gamma, Omega - The Roster of the Plasma Proteins.
In The Plasma Proteins: Structure, Function, and Genetic Control; Putnam, F. W., Ed.;
Academic Press: New York, 1975; Vol. 1; pp 58.
(13) Krishnan, A.; Siedlecki, C. A.; Vogler, E. A. Mixology of Protein Solutions and
the Vroman Effect,Langmuir in press.
(14) Krishnan, A.; Sturgeon, J.; Siedlecki, C. A.; Vogler, E. A. Scaled Interfacial
Activity of Proteins at the Liquid-Vapor Interface,J. Biomed. Mat. Res. 2004, 68A, 544.
(15) Krishnan, A.; Siedlecki, C.; Vogler, E. A. Traube-Rule Interpretation of Protein
Adsorption to the Liquid-Vapor Interface,Lagmuir 2003, 19, 10342.
(16) Vogler, E. A. Practical Use of Concentration-Dependent Contact Angles as a
Measure of Solid-Liquid Adsorption I: Theoretical Aspects, Langmuir 1992, 8, 2005.
(17) Ramsden, J.; Roush, D.; Gill, D.; Kurrat, R.; Wilson, R. Protein Adsorption
Kinetics Drastically Altered by Repositioning a Single Charge,J. Am. Chem. Soc. 1995, 117,
8511.
(18) Ramsden, J. J. Protein Adsorption Kinetics. In Biopolymers at Interfaces;
Malmsten, M., Ed.; Marcel Dekker: New York, 1998; Vol. Surfactant science series Vol. 75; pp
199.
(19) Vogler, E. A. Interfacial Chemistry in Biomaterials Science. In Wettability; Berg,
J., Ed.; Marcel Dekker: New York, 1993; Vol. 49; pp 184.
136
Page 155
(20) Valkovska, D. S.; Shearman, G. C.; Bain, C. D.; Darton, R. C.; Eastoe, J.
Adsorption of Ionic Surfactants at an Expanding Air-Water Interface,Langmuir 2004, Langmuir,
ASAP Article 10.1021/la035739b S0743-7463(03)05739-1
Web Release Date: April 21, 2004.
(21) Vogler, E. A. Practical Use of Concentration-Dependent Contact Angles as a
Measure of Solid-Liquid Adsorption II: Experimental Aspects, Langmuir 1992, 8, 2013.
(22) Vogler, E. A. Structure and Reactivity of Water at Biomaterial Surfaces,Adv.
Colloid and Interface Sci. 1998, 74, 69.
(23) Vogler, E. A. Water and the Acute Biological Response to Surfaces,J. Biomat.
Sci. Polym. Edn. 1999, 10, 1015.
(24) Vogler, E. A. How Water Wets Biomaterials. In Water in Biomaterials Surface
Science; Morra, M., Ed.; John Wiley and Sons: New York, 2001; pp 269.
(25) Adkins, J. N.; Varnum, S. M.; Auberry, K. J.; Moore, R. J.; Angell, N. H.; Smith,
R. D.; Springer, D. L.; Pounds, J. G. Toward a Human Blood Serum Proteom,Molecular and
Cellular Proteomics 2002, 1, 947.
137
Page 156
Table 1 Comparison of Pendant-Drop Tensiometry (PDT) and Wilhelmy Balance Tensiomtery (WBT) of Purified Proteins and Protein Mixtures
γolv
(mN/m) γ'
lv (mN/m)
ln CBΠ/2
(PPT)
M (dimensionless)
Πmax (mN/m)
NAME
PDT WBT PDT WBT PDT WBT PDT WBT PDT WBTPrep 1 71.7±0.6 72.4±0.5 48.6±0.7 48.5±3.9 19.6±0.18 23.6±0.9 -23.6±3.6 -10.8±2.8 23.1±0.7 23.5±3.9 HUMAN PLASMA
(HP) Prep 2 71.4±0.7 - 45.5±1.1 - 19.19±0.3 - -10.9±1.6 - 26.5±1.1 -Prep 1 70.5±0.5 73.1±0.6 47.6±0.6 43.0±6.1 19.9±0.2 24.1±1.1 -23.4±3.7 -10.3±3.8 24.1±0.6 28.9±6.1 HUMAN SERUM
(HS) Prep 2 72.6±0.7 - 45.6±0.7 - 18.5±0.2 - -13.4±1.6 - 26.3±0.7 -OVINE PLASMA
(OP) 71.8±0.6 72.7±0.1 44.8±0.8 47.2±0.7 20.2±0.2 23.5±0.1 -15.5±2.1 -18.2±1.2 26.9±0.9 24.8±0.7
OVINE SERUM (OS)
71.4±0.3 72.6±0.2 44.8±0.9 56.4±0.7 20.5±0.2 21.6±0.3 -12.0±1.1 -14.8±2.1 26.9±0.9 15.5±0.7
EQUINE PLASMA (EP)
70.5±0.7 72.9±0.4 47.5±1.1 56.3±0.6 18.6±0.3 20.3±0.6 -14.7±3.1 -20.9±4.6 24.4±1.1 15.6±0.6
EQUINE SERUM (ES)
70.2±0.6 73.1±0.2 44.6±0.7 55.6±1.1 18.2±0.2 22.4±0.4 -14.0±1.7 -11.9±2.0 27.4±0.7 16.3±1.1
ADULT BOVINE PLASMA (BP)
72.5±0.8 73.3±0.3 38.4±4.1 48.7±4.8 21.7±0.8 24.1±1.2 -7.1±1.4 -9.4±1.6 33.5±4.1 23.2±4.8
ADULT BOVINE SERUM (BS)
71.1±0.8 72.8±0.1 41.3±2.4 58.9±0.4 20.4±0.5 21.6±0.2 -8.0±1.3 -17.5±1.9 30.6±2.4 13.0±0.4
CALF PLASMA (CP)
70.5±0.5 73.1±0.2 42.5±2.2 54.1±2.5 20.6±0.5 23.9±0.7 -8.1±1.2 -11.5±1.9 29.4±2.2 17.8±2.5
CALF SERUM (CS)
70.1±0.5 72.4±0.2 44.7±1.2 59.6±0.6 19.9±0.3 21.9±0.3 -11.1±1.6 -17.1±2.8 27.2±1.2 12.3±0.6
NEW-BORN CALF PLASMA (NBCP)
72.1±0.8 72.9±0.2 32.4±7.3 49.2±3.8 23.2±1.6 24.6±0.9 -5.7±1.1 -9.8±1.6 39.6±7.3 22.7±3.8
NEW-BORN CALF SERUM (NBCS)
73.2±2.1 72.8±0.3 37.8±6.2 57.2±2.1 21.3±1.2 21.8±0.7 -5.8±1.7 -12.9±2.1 34.2±6.2 14.7±2.1
Prep 1 71.2±0.3 - 49.7±1.1 - 17.9±0.4 - -8.0±1.1 - 21.9±1.1 -Fraction V (FV BSA) Prep 2 71.2±0.5 - 53.1±0.6 - 15.6±0.3 - -13.6±2.9 - 18.8±0.6 -
Prep 1 71.4±0.2 - 51.2±0.5 - 17.8±0.2 - -11.6±1.1 - 20.5±0.5 -
BOVINE SERUM ALBUMIN
Fatty Acid Free (FAF BSA) Prep 2 71.2±0.6 - 52.9±0.6 - 16.6±0.2 - -14.3±2.7 - 19.0±0.6 -
138
Page 157
Figure 1: Interfacial tension profiles in 3D (lv
γ as a function of analysis time (drop age) and
logarithmic (natural) solution concentration ) and 2D (BClv
γ as a function of logarithmic solution
concentration at selected times) formats comparing human (HS, panel A, preparation 2, Table I),
ovine (OS, panel B), and equine (ES, panel C) serum. In each case, solute concentration is
expressed in v/v units of parts-per-trillion (PPT, mL/1012 mL solution). Symbols in 2D panels
represent time slices through 3D representations (filled circle = 0.25 sec, open circle = 900 sec, filled
triangles = 1800 sec, and open triangles = 3594 sec; annotations in panel A indicate maximum
( ) and half-maximum spreading pressure (1/2
BC
BC
maxΠ maxΠ )). Concentration-dependent interfacial
tensions of blood serum are nearly identical across diverse species.
139
Page 158
8 10 12 14 16 18 20 22 24 26 2840
45
50
55
60
65
70
75
8 10 12 14 16 18 20 22 24 26 2840
45
50
55
60
65
70
75
γ lv(m
N/m
)
Elapsed Time (sec) lnCB(CB
in PPT)
γ lv(m
N/m
)
Elapsed Time (sec)lnCB
(CBin PPT)
γ lv(m
N/m
)
Elapsed Time (sec) lnCB(CB
in PPT)
γ l v(m
N/m
)
lnCB (CB in PPT)
Πmax
lnCBπ/2
1/2Πmax
γ o
γ ’
γ l v(m
N/m
)
lnCB (CB in PPT)
γ l v(m
N/m
)
lnCB (CB in PPT)
3 mg/mL
8 10 12 14 16 18 20 22 24 26 2840
45
50
55
60
65
70
75
140
Page 159
Figure 2: Comparison of steady-state, concentration-dependent lv
γ data for human
(HP, filled circle, preparation 2, Table I), ovine (OP, open circle), equine (EP, open square) and
bovine (BP, open triangle) plasma on a single concentration axis. Band represents 99% confidence
intervals around best-fit-human plasma data, suggesting that species cannot be confidently
distinguished from this data. In each case, solute concentration is expressed in v/v units of parts-
per-trillion (PPT, mL/1012 mL solution).
BC
141
Page 160
ln CB (CB in PPT)
8 10 12 14 16 18 20 22 24 26 28
γ lv (d
ynes
/cm
)
40
45
50
55
60
65
70
75γ lv
(mN
/m)
142
Page 161
Figure 3: Comparison of steady-state (t = 3600 sec), concentration-dependent lv
γ data for bovine
plasma collected at different ages. Filled circles = adult bovine plasma (BP), open squares = calf
plasma (CP) and open triangle = new-born calf plasma (NBCP). Band represents 99% confidence
intervals around adult plasma, suggesting that age groups cannot be confidently distinguished from
this data. In each case, solute concentration is expressed in v/v units of parts-per-trillion (PPT,
mL/1012 mL solution).
BC
143
Page 162
ln CB (CB in PPT)
8 10 12 14 16 18 20 22 24 26 28
γ lv (m
N/m
)
30
40
50
60
70
80
144
Page 163
Chapter 5
Scaled Interfacial Activity of Proteins at a Hydrophobic Solid/Aqueous-Buffer Interface
Abstract
Contact-angle goniometry confirms that interfacial energetics of protein adsorption to the hydrophobic
solid-water (solid-liquid, SL) surface is not fundamentally different than adsorption to the water-air
(liquid-vapor, LV) interface measured by pendant-drop tensiometry. Adsorption isotherms of 9 globular
blood proteins with molecular weight (MW) spanning 10-1000 kDa on methyl-terminated self-assembled
monolayer surfaces demonstrate that (i) proteins are weak surfactants, reducing contact angles by no more
than about 15o at maximum solution concentrations (~10 mg/mL); (ii) the corresponding dynamic range
of spreading pressure < 20 mN/m; and (iii) the maximum spreading pressure for these diverse
proteins falls within a relatively narrow 5 mN/m band. As with adsorption to the LV interface, we find
that concentration scaling substantially alters perception of protein interfacial activity measured by
aΠ maxaΠ
aΠ .
Proteins appear more similar than dissimilar on a weight/volume basis whereas molarity scaling reveals a
systematic ordering by MW, suggesting that adsorption is substantially driven by solution concentration
rather than diversity in protein amphilicity. Scaling as a ratio-to-physiological-concentration
demonstrates that certain proteins exhibit at-and-well-below physiological concentration whereas
others require substantially higher solution concentration to attain . Important among this latter
category of proteins is blood factor XII, assumed by the classical biochemical mechanism of plasma
coagulation to be highly surface active, even in the presence of overwhelming concentrations of other
blood constituents such as albumin and immunoglobulin that are shown by this work to be among the
class of highly-surface-active proteins at physiologic concentration. The overarching interpretation of
this work is that water plays a dominant, controlling role in the adsorption of globular-blood proteins to
hydrophobic surfaces and that energetics of hydration control the amount of protein adsorbed to poorly-
water-wettable biomaterials.
maxaΠ
maxaΠ
145
Page 164
5.1. Introduction
The protein adsorption problem – how (glyco)proteins selectively collect at biomaterial surfaces
from complex solutions such as blood; the structure-property relationships connecting surface
chemistry/energy to the extent and specificity of protein adsorption; and the manner by which
surface-bound protein directs ‘biological responses’ such as blood coagulation, cell/tissue
adherence, or fouling of medical devices – remains one of the quintessential unsolved mysteries
of biomaterials surface science. And yet a full understanding of protein adsorption is essential to
prospective, fundamentals-driven design of biomaterials. This is because protein adsorption is
among the first molecular-level interactions with a biomaterial that ultimately lead to
biocompatibility - or lack thereof (see, for example, refs. 1-5 and citations therein).
Our work probing each of the above aspects of the protein adsorption problem strongly
implicates water as a moderating or mediating agent.6-10 We have pursued the long-standing
hypothesis that surface interactions with water and reorganization of ions near the water-
contacting surface precede protein adsorption,11 forming a hydration layer extending some
(generally unknown) distance from the water-contacting surface with which protein molecules
interact.10 This layer is variously referred to as bound water12-14 or vicinal water6,15 or as an
interphase;16,17 depending on the context and application. However termed, we find that vicinal
water controls protein adsorption to surfaces by resisting displacement with adsorbing protein
molecules. In turn, resistance to displacement depends on the affinity of water for the
surface,10,17 and so protein adsorption is found to scale with surface energy (water wettability).18-
20 According to this view, water-wettable surfaces (a.k.a hydrophilic)21 with strongly-bound
vicinal water adsorb little-or-no protein directly onto the surface; although this does not
146
Page 165
necessarily rule out collection of protein near the surface in a manner that does not require
dehydration of the surface.6,10,22-24 By contrast, proteins can adsorb directly onto poorly-water-
wettable (hydrophobic) surfaces by displacing relatively weakly-bound vicinal water.18-20
Detailed examination of these basic principles operating at the water-air (liquid-vapor, LV)
interface, a molecularly-smooth hydrophobic surface, strongly suggests that water does indeed
orchestrate a clearly-discernable, systematic pattern in protein adsorption.25 Specifically, we find
that: (i) variation in globular blood protein “amphilicity” (interaction energetics with water) with
composition spanning 3 decades of molecular weight (MW) is surprisingly modest; (ii) the
equilibrium partition coefficient (ratio of interphase-to-bulk concentration) is relatively
constant across this diverse group of proteins with P ~ 150 taken as nominal
value); (iii) interphase capacity for protein is limited by the extent to which the LV surface can
be dehydrated by displacement of interfacial water by adsorbing protein; and that (iv) molar
concentrations required to fill the LV interphase follow a “homology in protein size” consistent
with packing hydrated spheroidal molecules within this space.16 This latter effect is particularly
interesting because it predicts that molar-interphase concentrations scale inversely with protein
MW and, as a consequence, multiple layers of higher-MW proteins (MW > 125 kDa) are
required to fully fill the LV surface. For example, one molecular layer of albumin (MW = 66.3
kDa) is predicted to fully saturate the LV surface whereas two layers of IgG (MW = 160 kDa)
are required (both of which have been confirmed experimentally),26,27 and five layers of IgM
(MW = 1000 kDa) form at the saturated LV surface16 (which apparently awaits experimental
verification).
P
2(10 10 ;P< < 3
147
Page 166
It turns out that fixed LV surface capacity for protein at approximately constant imposes
significant constraints on the protein adsorption problem. That is to say, because protein
adsorption is more about solvent than adsorbate, a tractable quasi-thermodynamic theory
describes a phenomenon that would otherwise be overwhelmingly complex for more than just a
few proteins in solution. In fact, a straightforward set of “mixing rules” stipulates both
concentration and weight-fraction distribution of proteins adsorbed to the LV interphase from
multi-component aqueous solutions such as blood plasma or serum at equilibrium.28 These
mixing rules rationalize the long-known but otherwise unexplained observations that (i) LV
interfacial tension
P
lvγ of blood plasma and serum is nearly identical, in spite of the fact that
serum is substantially depleted of coagulation proteins such as fibrinogen; and (ii) lvγ of plasma
and serum derived from human, bovine, ovine, and equine blood is practically identical, even
though there are substantial differences in the plasma proteome among these species.29 Thus, in
summary, we find that protein adsorption to the LV surface, including certain aspects of the
Vroman effect,28 can be quite well understood on the basis of the behavior of water at surfaces.
This paper discloses results of an investigation of protein adsorption to a well-defined,
hydrophobic solid-water (solid-liquid, SL) interface. Methyl-terminated self-assembled thiol
monolayers (SAMs) on gold-coated semiconductor-grade silicon wafers exhibiting water contact
angles are used as test substrata. Time-and-concentration-dependent contact angles are
used to measure adsorption energetics of (globular) proteins spanning 3 decades in MW in a
manner that parallels the above-cited studies of protein adsorption to the LV surface. We find
that the basic pattern observed at the LV surface is repeated at the hydrophobic SL surface,
110oaθ ∼
148
Page 167
supporting our contention that water is the significant controller of protein adsorption to
biomaterial surfaces.
5.2. Materials and Methods
Purified Proteins and Synthetic Surfactants: Table 1 compiles pertinent details on proteins
and surfactants used in this work. Protein purity was certified by the vendor to be no less than
the respective values specified in Column 4 of Table 1, as ascertained by electrophoresis (SDS-
PAGE or IEP). Mass, concentration, and molecular weights supplied with purified proteins were
accepted without further confirmation. Issues associated with protein purity, especially
contamination with surfactants, and the potential effect on measured interfacial tensions were
discussed in detail in ref. 25. The single value given in Table 1 for physiological concentration
of human proteins (Column 5) applied in this work was middle of the range listed by Putnam.30
Serial dilutions of protein stock solutions (usually 10 mg/mL) were performed in 96-well
microtiter plates by (typically) 50:50 dilution in phosphate buffered saline solution (0.01 M PBS,
0.14 M NaCl, 0.003M KCl) prepared from powder (Sigma Aldrich) in distilled-deionized (18
MΩ) water using procedures detailed in ref. 25 (interfacial tension of PBS and water was
checked periodically by Wilhelmy-balance tensiometry). Between 24-30 dilutions were
prepared in this manner, covering a dynamic range between 10-10 to 1 % (w/v), taking care to
mix each dilution by repeated pipette aspiration and avoiding foaming of concentrated solutions.
Surfaces: Methyl-terminated self assembled monolayer surfaces (SAMs) were prepared
according to standard methods of surface engineering. Details involved have been reported
elsewhere.31-35 Alkanethiol (Aldrich Chemical Co., Milwaukee, WI) and ethanol (commercial
149
Page 168
reagent-grade) were used as-received, without further purification. Samples were stored in the
thiol solution until use, and were rinsed with ethanol just prior to an experiment.
Tensiometry & Goniometry: Liquid-vapor interfacial tensions required by this work were
measured by Pendant Drop Tensiometry (PDT) as described in refs. 16,25,28,29. Contact angle
and wettability methods applied in this work have been disclosed in detail elsewhere, including
verification that measured advancing angles ( aθ ) were in statistical agreement with that obtained
by Wilhelmy balance tensiometry.36,37 Receding angles ( rθ ) were shown to be not as reliable as
aθ . Consequently, only aθ was analyzed in this work. Briefly, for the purposes of this paper, aθ
measurements were made using a commercial automated tilting-plate goniometer (TPG, First
Ten Angstroms Inc., Portsmouth VA). The goniometer employed a Tecan liquid-handling robot
to aspirate 12 µL of solutions contained in a 96-well microtiter plate prepared by the serial-
dilution protocol mentioned above. We found that dip-coating of disposable polypropylene tips
in a commercial perfluorocarbon hydrophobizing agent (NYEBAR, NYE Lubricants Inc.;
Bedford, MA) followed by water wash and air drying greatly aided dispensing of drops,
especially at the highest protein concentrations (lowest lvγ ). This coating procedure was shown
not to measurably affect interfacial tensions or contact angles. The robot was used to
reproducibly transfer the tip with fluid contents into a humidified (99+ % RH) analysis chamber
and dispense 10 µL drops of protein solution onto the surface of test substrata (see below) held
within the focal plane of a magnifying camera. These and all other aspects of tilting-plate
goniometry were performed under computer control. Proprietary algorithms supplied by the
vendor were used to deduce contact angles from drop images captured at a programmed rate by a
frame grabber. Typically, 600 images were captured at a rate of 1 image every 6 sec following
150
Page 169
0.25 sec delay to permit vibrations of the expelled drop to dampen. Drop evaporation rates
within the humidified chamber deduced from computed-drop volumes (based on image analysis)
were observed to vary with solute concentration, generally ranging from approximately 25
nL/min for pure water to 10 nL/min for solute solutions > 0.1% w/v. The impact of this
evaporation rate over the 60 min time frame of the experiment was apparently negligible, as
gauged from the behavior of purified surfactants discussed in the results section and in ref. 37.
Precision of aθ was about 0.5o based on repeated measurement of the same drop. The analysis
chamber was thermostated to a lower-limit of 25±1 oC by means of a computer-controlled
resistive heater. Upper-temperature limit was not controlled but rather floated with laboratory
temperature, which occasionally drifted as high as 29 oC during summer months. Thus, reported
aθ values were probably not more accurate than about 1o on an inter-sample basis considering
the small, but measurable, variation of water interfacial tension with temperature. This range of
accuracy was deemed adequate to the conclusions of this report which do not strongly depend on
more highly accurate aθ that is difficult to achieve on a routine basis. Instead, veracity of
arguments raised herein depend more on a breadth of reliable measurements made across the
general family of human proteins.
Test substrata were held on a rotating, tilting-plate platform driven by stepper motors under
computer control. Substrata were allowed to come to equilibrium within the sample-chamber
environment for no less than 30 min before contact angle measurements were initiated. The
platform was programmed to tilt at 1o/sec from horizontal to 25o after the drop was deposited on
the surface by the robot. The optimal (incipient rolling) tilt angle was found to be 25o and 15o
for solutions of proteins and surfactants, respectively. The first 120 sec (20 images) monitored
151
Page 170
evolution of the advancing angle. At the end of the 1 hr aθ measurement period, the platform
was programmed to return to horizontal and rotate 15o to the next analysis position along the
periphery of the semiconductor wafer. This process was repeated for all dilutions of the protein
under study so that results reported for each protein were obtained on a single test surface,
eliminating the possibility of substratum-to-substratum variation within reported results. We
observed that the contact angle of a pure PBS droplet slowly decreased with time from the initial
value of 108º< oaθ <106º at t = 0 to 104º< o
aθ <102º at t = 1 hr; where oaθ is the pure buffer contact
angle and the range of reported results corresponds to all of the 17 methyl-terminated SAM
surfaces analyzed during the course of this work. We attribute this systematically-varying
wettability to slow “hydration” of SAM surfaces, which may include dissolution of thiol from
the surface into solution, but have no specific proof this was the cause. This same phenomenon
apparently affects measurement of protein-solution contact angles because we observed that the
whole contact angle isotherm ( aθ vs. concentration) slowly shifted lower with time (see Fig. 1B).
We do not believe this slight but apparently unavoidable attribute of thiol-SAMs on silicon
wafers negatively affects the veracity of conclusions drawn herein which were based on final,
steady-state measurements made at ~ 1 hr analysis time.
Computation and Data Representation: Computational, statistical, and theoretical methods
used in this work have been discussed in detail elsewhere.17-19 In brief, time-dependent aθ data
corresponding to protein dilutions (see above) were recovered from TPG files and correlated
with concentrations, leading to a matrix of results with row values representing concentration
and time (in sec) as column values. It was generally observed that aθ isotherms were sigmoidal
in shape when plotted on logarithmic-concentration axes,17,18 with well-defined low-
152
Page 171
concentration asymptotes oaθ and high-concentration asymptotes '
aθ (see Fig. 1 for examples).
Successive non-linear least-squares fitting of a four-parameter logistic equation
''
/ 21 (ln / ln )[ a a
a MB BC Cθ θ ]aθ θΘ
−=
++ to contact angle isotherms data for each time within the
observation interval quantified oaθ and '
aθ parameters with a measure of statistical uncertainty.
Fitting also recovered a parameter measuring concentration-at-half-maximal-change in aθ ,
/ 2 max max 'ln (where / 2 1/2 and )BC a aθ θΘ Θ = Θ Θ ≡ − , as well as a parameter M that measured
steepness of the sigmoidal curve. This multi-parameter fitting to concentration-dependent aθ
data was a purely pragmatic strategy that permitted quantification of best-fit protein and
surfactant characteristics but is not a theory-based analysis.17-19 Three-dimensional (3D)
representations of time-and-concentration aθ data were created in Sigma Plot (v8) from the data
matrix discussed above and overlain onto fitted-mesh data computed from least-squares fitting.
Two-dimensional (2D) representations were created from the same data matrices at selected
observation times. Measured aθ were converted to advancing adhesion tension coslva aτ γ= θ for
general interpretation;17 where lvγ is the interfacial tension of the contact-angle fluid. Adhesion
tensions coslv
o oa
oaτ γ= θ '
a (pure saline) and ' ' coslvaτ γ= θ (at the minimum contact angle observed
'aθ ) were computed with fitted parameters
lvγ and '
lvγ reported in ref. 25 for the proteins under
investigation. Smoothed adhesion-tension isotherms ( aτ vs. l ) were computed from
smoothed
n BC
aθ obtained from aθ isotherms above, using smoothed lvγ values computed from best-
fit parameters reported in ref. 25. Likewise, smoothed spreading pressure isotherms
( vs. ) were computed from smoothed aΠ ln BC aτ curves where ( )a a aτ τΠ ≡ − .
153
Page 172
5.3. Results and Discussion
Results and discussion are combined into one section because it is efficient to introduce and
discuss the different facets of the work in the sequence that follows and then combine separate
observations in the Conclusions section. The presentation follows the basic outline used in a
companion paper published in this journal describing protein adsorption to the LV surface.25
First, general characteristics of the quantitative data are described, comparing proteins to a
surfactant reference compound and placing data into an overall context for interpretation.
Results are then interpreted graphically by scaling concentration-dependent SL interfacial
tensions in three different ways that give different insights into protein interfacial activity and
provoke interpretation in terms of the behavior of water at surfaces.
General Aspects of the Data: Table 2 compiles quantitative results of this work. Contact angle
parameters oaθ , '
aθ , and listed in cols 2-5 of Table 2 are the mean fitted values
corresponding to final 25
/ 2ln BCΘ M
aθ curves recorded within the 60-minute time frame of the TPG
experiment. Listed error is standard deviation of this mean. Corresponding adhesion tensions aτ
and 'aτ (Columns 6, 7) were computed from o
aθ and 'aθ values, respectively, with uncertainty
estimates computed by propagation of error in aθ and lvγ measurements (Methods and
Materials). Maximum “spreading pressure” ( )max 'a a aτ τΠ ≡ − (Column 8) was computed directly
from aforementioned aτ values and associated uncertainty again estimated by propagation of
error. Replicate protein preparations were studied for Ub, FV HSA, FXII, IgM and α2-
macroglobulin. Different vendors were used as a means of controlling for discrepancies that
might arise from sourcing (Table 1). In consideration of all sources of error ranging from
154
Page 173
solution preparation to data reduction (including purity of commercial protein preparations
discussed in ref. 25), we conclude that variation associated with manipulation and dilution of
protein concentrates (~ 10 mg/mL; includes transfer losses by adsorption to pipettes, vials, and
wells; slight but inevitable foaming of proteins brought into solution from powder; etc.)
overwhelms aθ measurement error discussed in the Materials and Methods and that differences
between preparations or vendors were insufficient to affect basic conclusions of this work.
Quantitative Comparison of Proteins and Surfactants: Concentration-dependent contact
angles of protein and surfactant solutions ( aθ isotherms) on methyl-terminated SAMs fell into
one of two categories, identified herein as Type 1, 2. Type 1 aθ curves were clearly sigmoidal
with distinct low- and high-concentration plateau (see, as examples, Figs. 1 A and B) measured
by oaθ and '
aθ parameters. Steady-state was apparently achieved in Type 1 adsorption at-or-
before 1 hr drop age whereupon kinetic effects in aθ were no longer resolvable at any
concentration (less than about 1o). No semblance of a 'aθ plateau was reached at the highest
concentrations studied for Type 2 proteins (ubiquitin and α2-macroglobulin; see Fig. 1C for an
example). Only graphical estimates are provided in Table 2 for Type 2 protein parameters since
firm values could not be ascertained by statistical fitting procedures described in the Methods
and Materials section. No attempt was made to estimate the exponential parameter M for Type 2
proteins. It was not evident from this work whether these proteins would exhibit Type 1
behavior if yet-higher concentrations were available for study. We note, however, that kinetic
effects had fully dampened for Type 2 adsorption within the interval 3500< t <3600 sec of the
TPG experiment. This strongly suggests that steady-state had in fact been achieved, but that
155
Page 174
higher solution concentrations were required to saturate the surface and achieve a verifiable 'aθ
plateau. Moreover, we note that large proteins such as IgM achieved steady state over the 60
min observation interval, confirming that mass transport and adsorption kinetics could indeed be
completed within the time frame of the TPG experiment, even for much larger proteins. We thus
conclude that Type 2 adsorption was concentration- rather than time-limited. Indeed, theoretical
interpretation of protein adsorption to the LV interface suggests that surface-saturating
concentrations for small proteins such as ubiquitin (10.7 kDa) exceed solubility limits,16
explaining why a verifiable 'aθ plateau was not achieved for this protein. This same argument
cannot be applied to results obtained for a molecule as large as α2-macroglobulin (725 kDa),
however, and the outcome for this protein stands exceptional, not only to others listed in Table 1
but also to studies of adsorption of this protein to the LV surface.16
oaθ (column 2, Table 2) is a measure of variability in surface-to-surface preparation procedures
measured with a droplet of pure PBS in contact with the surface for 1 hr. Scanning down the
rows of column 2, it is apparent that oaθ data fell between 104o and 100o. Much of this
variability can probably be attributed to differences in substratum “hydration” that gives rise to a
small but clearly-observable decrease in oaθ with time (see arrow annotation, Fig. 1B and
Methods and Materials). Adsorption of either protein or surfactant to the solid surface from
aqueous solution leads to measurable, concentration-dependent decrease in aθ to lower limit
values 'aθ collected in column 3. In the case of proteins, this decrease in contact angle was quite
modest, generally less than 15o, and showed little discernable trend among the proteins listed in
Table 1. By contrast, the surfactant reference standard SDS gave rise to about 44o decrease in aθ .
156
Page 175
Adsorption energetics are best gauged in terms of adhesion tension coslva aτ γ= θ because τ is
linearly related to free energy of adsorption that simultaneously accounts for adsorption to
the LV and SL surface.6,17-19 Columns 6 and 7 of Table 2 collect
adsG∆
aτ and 'aτ parameters
(corresponding to measured oaθ and '
aθ ) and converts these to “spreading pressure”
(max 'a a )aτ τΠ ≡ − in column 8. Examination of values shows that albumin and α2-
macroglobulin exhibited the strongest biosurfactancy whereas C1q was weakest on this scale.
However, from a broader perspective, it is apparent that proteins studied were more alike than
dissimilar, as has been noted in adsorption to the LV surface.16,25,28,29 Proteins clearly exhibited
modest surfactancy compared to SDS for which = 31 mN/m. The free energy of protein
adsorption to the hydrophobic surface must be commensurately modest and,
based on a partition coefficient (see Introduction), ; consistent
with estimates for lysozyme, myoglobin, and α-amylase determined by hydrophobic interaction
chromatography.38
maxaΠ
maxaΠ
lnoadsG RT∆ = − P
T150P ∼ ln 5oadsG RT P R∆ = − −∼
With the above in mind, it is of interest to estimate the extent that adsorption depletes a fluid
phase in contact with a hydrophobic surface because it provides a tangible sense of protein
surfactancy. Adopting 2 mg/m2 as a nominal protein concentration adsorbed to the surface of a
hypothetical 10 µL spherical drop (2.2X10⁻⁵ m2 surface area) from a surface-saturating 3 mg/mL
bulk-phase composition (e.g. albumin adsorbed to the LV surface as determined by neutron
reflectometry),16,26 it is evident that only 47 ng or about 0.15 % of bulk-phase protein is
removed by adsorption. Thus, it can be concluded that protein adsorbed from a contact-angle
droplet to a hydrophobic surface does not significantly deplete the bulk fluid phase. That is to
157
Page 176
say, proteins are weak surfactants. Indeed, it may be reasonably concluded from this simple
analysis that proteins do not adsorb avidly to hydrophobic surfaces, as is commonly
acknowledged,39,40 if solution depletion is used as the measure of adsorption. At the same time,
however, it must be borne in mind that a partition coefficient means that interphase
concentrations expressed in mass or moles per-unit-volume (not mass or moles per-unit-surface
area) are 150X bulk-phase compositions (i.e. ~ 450 mg/mL at surface saturation).16,28 Certainly,
from this point of view, proteins do adsorb avidly to a hydrophobic surface. These seemingly
divergent perspectives of protein adsorption can be reconciled by recognizing that the (LV or
SL) interphase is very thin, between 1 and 5 molecular layers for the proteins studied herein,16
with a commensurately low total volume that effectively magnifies surface concentrations
expressed in per-unit-volume dimensions. Thus, even though protein saturates a hydrophobic
interphase at volume fractions16 as high as 1/3, the total mass of protein within this interphase is
sparingly small in comparison to that contained in a macroscopic volume of bulk solution.
150P ∼
It is of special interest to the development of hemocompatible materials that FXII did not exhibit
extraordinary adsorption behavior ( ~ 15 mN/m) because FXII adsorption from whole
blood or plasma to procoagulant materials is thought to potentiate the intrinsic pathway of
coagulation. As will be discussed subsequently, FXII surface activity is substantially mitigated
by a low-physiologic concentration that does not sustain a high level of interfacial activity.
maxaΠ
Graphical Interpretation of Results: Time-and-concentration-dependent aθ for the anionic
surfactant SDS, purified protein HSA (Fraction V, FV HSA), and α2-macroglobulin are
compared in Fig. 1 in both three-dimensional (3D, aθ as a function of time and concentration)
158
Page 177
and two-dimensional (2D, aθ as a function concentration at specified times) representations.
Examining first 3D and 2D representations of SDS interfacial activity (Fig. 1A) which serves as
a reference compound, it was observed that the aθ curve was sigmoidal in shape, with a well-
defined low-concentration asymptote oaθ and a high-concentration asymptote '
aθ characteristic of
Type 1 adsorption. In this latter regard, SDS and HSA exhibited similar concentration-limiting
behavior (compare Fig. 1 A and B) that is typically interpreted as formation of a critical micelle
concentration (CMC), at least for surfactants41. This paper provides no evidence of micelles, for
either proteins or surfactants, and so only acknowledges a limiting behavior at which further
increase in solute concentration did not measurably change aθ . Unlike SDS, however,
adsorption/mass transfer kinetics significantly affected early-time aθ measurements of HSA
solutions, although steady state was achieved well before the final observation time at 3600 sec.
Kinetic effects were even more pronounced for large proteins such as α2-macroglobulin (Fig.
1C) for which Type 2 adsorption behavior was observed. Thus Fig. 1 captures the significant
adsorption trends quantified in Table 2.
Scaled Interfacial Activity: Fig. 2 traces the sequential interpretation of steady-state,
concentration-dependent aθ data (Fig. 2A, observed at 1 hr drop age) in terms of aτ (Fig. 2B)
and spreading pressure (Fig. 2C) isotherms for the proteolytic enzyme thrombin (blood
factor FIIa). Smooth curves through the data (see Methods and Materials) provide guides to the
eye. Figs. 3 A, B and C compare curves for proteins selected from Table 1 to cover the full
range of molecular weight (MW) studied in this work. Concentration is scaled in three different
ways in Fig. 3 for direct comparison; by weight (Fig. 3A), molarity (Fig. 3B), and ratio-to-
aΠ
aΠ
159
Page 178
physiological concentration, PC (Fig. 3C). Only smoothed curves corresponding to steady-state
(equilibrium) are shown for the sake of clarity, but representative aθ , aτ and curves with
authentic data are amply illustrated in Figs. 1 and 2. The following discusses results of each
scaling method in order of appearance on Fig. 3. These different scaling methods sharpen
general impressions about the energetics of protein adsorption that are particularly pertinent to
the controlling role of water in protein adsorption discussed in the Introduction.
aΠ
Fig. 3A compares curves with expressed in parts-per-trillion (i.e. PPT, grams solute/1012
g solvent, so that the ln scale has positive values at all concentrations). Weight scaling is
applicable to purified proteins, protein mixtures, and surfactants alike, permitting comparison of
interfacial activity on a single concentration axis.17-19 Two features are readily apparent from
Fig. 3A. First, the dynamic range of
aΠ BC
BC
aΠ ~ 20 mN/m is consistent with weak surfactancy, as
discussed in the previous section, and is similar to that observed for these proteins at the LV
surface (15 < < 30 mN/m). Second, lies within a relatively narrow 5 mN/m band for
this diverse set of proteins (with spanning nearly three orders of magnitude; see Table 1).
Thus, it is evident from Fig. 3A that, on a weight basis, proteins exhibit quite similar SL
interfacial activity, mirroring the general experience with these proteins at the LV surface.25
Bearing in mind the great range in MW spanned by proteins in Fig. 3, it is reasonable to
conclude that commensurate variability in protein structure does not confer widely varying SL
interfacial activity; at least not in comparison to the full range available to ordinary surfactants.
aΠ maxaΠ
MW
However convenient weight scaling may be, it is nevertheless true that free-energy and
stoichiometry scale on a molar basis. Thus, for the purpose of better understanding interfacial
160
Page 179
energetics, it is useful to express bulk concentration in molar units. We have chosen to
express solute dilution in picomoles/L (i.e. picomolarity, pM
BC
BC , 10-12 moles solute/L solution so
that the scale has positive values for all dilutions) for solutes with a known (nominal) MW.
This approach is applicable to purified proteins and surfactants but not to chemically-undefined
protein mixtures such as plasma and serum. Variability in interfacial activity among the diverse
purified proteins reported in Fig. 3 is much more evident on a molar than weight basis (compare
Fig. 3A to Fig. 3B). Of course, molar scaling does not alter observations regarding the range of
mentioned above, but it does effectively expand the concentration axis by moving higher-
MW proteins (such as IgM) to the left and lower-MW proteins (such as albumin and ubiquitin) to
the right. It is evident from Fig. 3B that high-MW proteins reduce
ln BC
aΠ
aΠ at lower molarity than
low-MW proteins, again repeating a general observation made at the LV surface for these
proteins. The inference taken from Fig. 3B is that protein concentration required to reduce aΠ
to a specified value decreases with MW in a manner loosely consistent with the addition of a
generic amino-acid-building-block having an “average amphilicity” that increases MW but does
not radically change protein interfacial activity. Otherwise, if MW increased by addition of
amino-acid-building-blocks with highly-variable amphilicity, then aΠ would be expected to be a
much stronger function of protein MW than is observed in Fig. 3B. Thus, it appears that molar
variability in is achieved by aggregating greater mass of similar amphiphilic character, as
opposed to accumulating greater amphilicity with increasing MW.
aΠ
Weight and molar scaling are very useful experimental and conceptual constructs that may turn
out to have little direct relevance to the in vivo biological response to materials because these
161
Page 180
scales do not account for the widely-varying natural abundance of the many different proteins
comprising the mammalian proteome.42 Thus, for the purpose of better understanding protein
interfacial activity within a physiologic context, we have found it useful to ratio to nominal
(mean) physiological concentration
BC
PC and express on a logarithmic scale
( ). In this way, the physiologic condition can be readily identified at
= 0 with more-dilute-protein solutions lying to the left (negative
/BC CP
)( /B Plog C C ( )/B Plog C C
( )/B Plog C C values) and more-
concentrated solutions lying to the right (positive ( )/B Plog C C values; see dashed vertical line
on Fig. 3C). This approach is applicable to purified proteins for which humoral or cellular
concentrations are known. Thus, Fig. 3C reveals a different kind of diversity in protein
interfacial activity than discussed above in reference to weight or molar scales. Certain proteins,
notably albumin, IgG and IgM, produced the full range well below physiologic
concentration ( data lies substantially to the left of
maxaΠ
aΠ ( )/B Plog C C = 0). By contrast, C1q and
prothrombin (FII) required full physiological concentration to express whereas ubiquitin
was not fully surface active at-and-well-above physiologic concentration. Again, these results
closely correspond to the behavior noted at the LV surface. And just as observed at the LV
surface, only a limited portion of the available range was exhibited by blood factor XII (
maxaΠ
maxaΠ aΠ
data lie to the right of = 0), as will be discussed separately below in reference to
Fig. 4 because this has special significance in blood coagulation. Thus, it appears that
is a pragmatic scaling of interfacial activity with relevance to biomedical materials
that reveals concentration-driven diversity in interfacial activity observed among humoral and
cellular proteins.
( /B Plog C C )
)( /B Plog C C
162
Page 181
Fig. 4 summarizes results obtained for blood factor FXII. Activation of FXII by
contact/adsorption to procoagulant surfaces is thought to potentiate the intrinsic pathway of
blood coagulation (see refs. 43,44 and citations therein). Thus, understanding interfacial activity
of FXII is important toward a full appreciation of the contact activation mechanism45-47 and
anticoagulation as well.48 Fig. 4 is prepared in basically the same format as Fig. 3C except that
curves here correspond to different observation times up to 1 hr drop age and demonstrates
that FXII was not achieved at physiological concentrations. Moreover, was achieved
only after long equilibration times (> 1800 sec). These adsorption kinetics must be interpreted in
terms of the blood-plasma-coagulation process that can be complete within 300 sec or so when
plasma is saturated with high-surface-area procoagulants.46 Results obtained with purified FXII
are thus seemingly inconsistent with the traditional biochemical mechanism of contact activation
of blood plasma coagulation that asserts rapid FXII adsorption onto hydrophilic procoagulant
surfaces. FXII adsorption, and FXIIa desorption for that matter, must occur in the presence of
overwhelming concentrations of other blood proteins, notably albumin and IgG that this work
demonstrates to be much more surface active on both molar and physiological-concentration
scales (Fig. 3B, C). Furthermore, we note that FXII adsorption to the SL interface is not rapid
relative to other proteins such as albumin, as might be expected for a protein with putatively
enhanced interfacial activity. Although mechanisms of adsorption to hydrophilic (efficient
procoagulant) surfaces are not necessarily the same as those leading to adsorption to
hydrophobic (inefficient procoagulant) surfaces, it is the general experience that much more
protein is adsorbed to hydrophobic surfaces.39,47 On this basis, we expect that FXII would
exhibit even less adsorption to hydrophilic procoagulants than we observe at the hydrophobic SL
aΠ
maxaΠ max
aΠ
163
Page 182
surface within a time-frame relevant to coagulation. All taken together, these studies of FXII
adsorption to the hydrophobic SL and LV interfaces support our contention that FXII does not
adsorb directly onto hydrophilic procoagulant surfaces in a manner that displaces water (surface
dehydration) and that contact activation of FXII → FXIIa occurs by some process other than
suggested by the traditional mechanism.46-48
5.4. Conclusions
Concentration-dependent contact angles aθ of buffered-protein solutions on methyl-terminated
self assembled monolayer (SAM) surfaces have been measured for selected globular-blood
proteins spanning 3 decades in molecular weight (MW). Observed protein aθ was reduced by
no more than 15o at maximum protein concentrations (~10 mg/mL). Adsorption energetics were
interpreted in terms of adhesion tension coslva aτ γ≡ θ and spreading pressure ( )a a aτ τΠ ≡ −
adsorption isotherms; where lvγ is concentration-dependent liquid-vapor (LV) interfacial tension
of the fluid phase, 'aτ is the adhesion tension corresponding to minimum contact angle '
aθ , and
aτ is the adhesion tension of pure buffer. Results closely mirrored that reported in a companion
paper published in this journal describing protein adsorption to the hydrophobic water-air
(liquid-vapor, LV) interface.25 On this basis, it is concluded that the physical chemistry of
protein adsorption to the solid-liquid (SL) interface is not remarkably different than that
controlling protein adsorption to the LV interface. In particular, it was found that maximum
spreading pressure fell within a relatively narrow max10 20a< Π < mN/m band for all proteins
studied. Results confirm that proteins are, in general, weak surfactants in comparison to
synthetic detergents (represented herein by the surfactant reference compound sodium dodecyl
164
Page 183
sulfate, SDS). The free energy of adsorption to hydrophobic surfaces is thus found to be quite
modest ( ) and the total protein adsorbed from a contact-angle droplet a small
percentage of the total available in solution. However, adsorbed concentrations in mass or moles
per-unit-volume are surprisingly large (~450 mg/mL)6,16,28 because adsorbate collects within an
thin (SL or LV) interphase, arguably no more than a few protein molecular layers thick.
5oadsG∆ −∼ RT
Three different methods of scaling isotherms were explored: weight, molarity, and ratio-to-
physiologic concentration. On a weight basis, proteins among the group studied appeared more
similar than dissimilar, especially when viewed from the perspective of the full range available
to synthetic surfactants. We interpret this observation to mean that there is insufficient
amphiphilic diversity (variation in the interaction energetics with water) among the proteins
studied to support wide-ranging interfacial activity at the hydrophobic SL interface, even though
protein composition varied significantly among proteins studied. Molar scaling revealed that SL
interfacial activity followed a progression in MW, with the concentration required to reach a
specified value decreasing with increasing MW. This progression in MW is interpreted to
mean that molar variability in is achieved by aggregating greater mass of similar amphiphilic
character (blocks of amino acids), as opposed to accumulating greater amphilicity with MW.
The significance of this observation is that it suggests that the structural variability that confers
profoundly different bioactivity does not greatly affect interaction energetics in water that drive
adsorption to the LV interface. Scaling interfacial activity to physiological concentration
revealed that certain proteins, such as albumin and IgG, achieved at-and-well below
physiologic concentration whereas others, notably blood factor XII (Hageman factor), required
aΠ
aΠ
aΠ
maxaΠ
165
Page 184
concentration by almost two-fold above the nominal-physiologic concentration to express the
full range of characteristic of this protein. maxaΠ
In summary, results reported herein support the overall conclusion that combinations and
permutations of the 20 naturally-occurring amino acids comprising the primary sequence of
mammalian proteins is insufficient to support widely-varying interfacial activity at hydrophobic
surfaces (LV or SL), no matter how these sequences happen to fold into higher-order structure.25
Furthermore, we contend that protein concentration, not diversity in molecular structure, is the
significant energetic driver of adsorption to hydrophobic surfaces. The overarching
interpretation is that water plays a dominate, controlling role in the adsorption of globular blood
proteins to hydrophobic surfaces and that the mechanism of protein adsorption can be quite
comprehensively understood from this perspective.
Outcomes of this work are in general agreement with other investigations of the interfacial
energetics of protein adsorption. In particular, the pioneering work of Tripp, Magda, and
Andrade49 revealing that “…mesoequilibrium surface tension [of 8 globular proteins]…did not
vary greatly between different proteins…” is relevant to this investigation. The term
‘mesoequilibrium’ was wisely applied by Tripp et al. because, in general, it is technically
challenging to unambiguously prove fully-reversible adsorption (or thermodynamic reversibility
of any process for that matter). And in the particular case of proteins, there is the expectation
from a burgeoning literature base that proteins ‘denature’ over time (see ref. 50 and citations
therein). Denaturation can include changes in molar free volume/interfacial area, loss of higher-
order structure with concomitant change in specific bioactivity, and irreversible adsorption. Of
166
Page 185
course, tensiometric methods applied by Tripp et al. and us are effectively blind to these
molecular processes, except insofar as denaturation may lead to time-varying interfacial tensions
and contact angles. Our measurements achieved, or asymptotically approached, a well-defined
steady-state within the hour observation window applied, suggesting that putative ‘denaturation
processes’ either had an insignificant impact on results or occurred significantly faster/slower
than the time frame of experimentation. Given the similarity in adsorption energetics to
hydrophobic LV and SL surfaces among the broad array of proteins studied (including those of
Trip et al.), and the general expectation that denaturation is a slow process, we are inclined to
conclude that either denaturation did not significantly affect results (perhaps accounting for
small-but-measurable differences among proteins) or the denaturation effect was astonishingly
similar among very different proteins. With regard to irreversible adsorption, we note that
experiments examining competitive adsorption between albumin and IgM at the LV surface
demonstrated protein displacement (Vroman effect) that followed a simple mass-balance
exchange,28 strongly suggesting that neither albumin nor IgM was irreversibly adsorbed to this
surface.
Even in view of the similarity among studies of the interfacial energetics of protein adsorption to
hydrophobic surfaces, it is difficult to fully reconcile our findings with all other previous
investigations of protein adsorption. But then it is also challenging to find substantive
commonality within and among this prior art,6 let alone extend its margins to embrace new
findings. Thus, there should be little surprise that results reported herein may seem exceptional
relative to certain particular studies selected from this expansive literature base. In this
connection, it seems useful to step back from the details momentarily and point out that relating
167
Page 186
mass to energy inventories of protein adsorption will require more than casual comparison of
experimental results. For this purpose, a theory of protein adsorption is required. And until such
a theory is available, comparison of mass measurements (by solution depletion, gravimetry, or
spectroscopy for examples) to interfacial energetics (by calorimetry, chromatography, or
tensiometry for examples) should be made with due caution.
168
Page 187
Citations
(1) Horbett, T. Protein Adsorption on Biomaterials. In Biomaterials: Interfacial
Phenomena and Applications; Cooper, S. L., Peppas, N. A., Hoffman, A. S., Ratner, B. D., Eds.;
Am. Chem. Soc.: Washington D. C., 1982; Vol. 199; pp 234.
(2) Ratner, B. D.; Castner, D. G.; Horbett, T. A.; Lenk, T. J.; Lewis, K. B.; Rapoza,
R. J. Biomolecules and Surfaces,J. Vac. Sci. Technol. 1990, A 8, 2306.
(3) Horbett, T. A. Principles Underlying the Role of Adsorbed Plasma Proteins in
Blood Interactions with Foreign Materials,Cardiovac. Pathol. 1993, 2, 137S.
(4) Biopolymers at Interfaces; Malmsten, M., Ed.; Marcel Dekker: New York, 1998,
pp 656.
(5) Horbett, T. A. Biological Activity of Adsorbed Proteins. In Biopolymers at
Interfaces; Malmsten, M., Ed.; Marcel Dekker: New York, 1998; Vol. Surfactant science series
Vol. 75; pp 393.
(6) Vogler, E. A. Structure and Reactivity of Water at Biomaterial Surfaces,Adv.
Colloid and Interface Sci. 1998, 74, 69.
(7) Vogler, E. A. Water and the Acute Biological Response to Surfaces,J. Biomat.
Sci. Polym. Edn. 1999, 10, 1015.
169
Page 188
(8) Vogler, E. A. Role of Water in Biomaterials. In Biomaterials Science: An
Introduction to Materials in Medicine; 2 ed.; Ratner, B., Hoffman, A., Eds.; Elsevier Academic
Press: San Diego, 2004.
(9) Vogler, E. A. Biological Properties of Water. In Water in Biomaterials Surface
Science; Morra, M., Ed.; John Wiley and Sons: New York, 2001; pp 4.
(10) Vogler, E. A. How Water Wets Biomaterials. In Water in Biomaterials Surface
Science; Morra, M., Ed.; John Wiley and Sons: New York, 2001; pp 269.
(11) Andrade, J. D.; Hlady, V. Protein Adsorption and Materials Biocompatibility: A
Tutorial Review and Suggested Mechanisms,Adv. Polym. Sci. 1986, 79, 3.
(12) Nandi, N.; Bagchi, B. Dielectric Relaxation of Biological Water,J. Phys. Chem. B
1997, 101, 10954.
(13) Cho, E. C.; Kim, Y. D.; Cho, K. Effect of Bound Water Structure on the Protein
Substrate Interaction and Protein Adsorption Behavior,Polymer Preprints 2003, 44, 173.
(14) Garcia, C.; Anderson, J. M.; Barenberg, S. A. Hemocompatibility: Effect of
Structured Water,Trans. Am. Soc. Intern. Organs 1980, 26, 294.
(15) Pollack, G. H. Cells, Gels, and the Engines of Life: A New, Unifying Approach to
Cell Function; Ebner & Sons: Seattle, 2001.
(16) Krishnan, A.; Siedlecki, C.; Vogler, E. A. Traube-Rule Interpretation of Protein
Adsorption to the Liquid-Vapor Interface,Lagmuir 2003, 19, 10342.
170
Page 189
(17) Vogler, E. A. Interfacial Chemistry in Biomaterials Science. In Wettability; Berg,
J., Ed.; Marcel Dekker: New York, 1993; Vol. 49; pp 184.
(18) Vogler, E. A. Practical Use of Concentration-Dependent Contact Angles as a
Measure of Solid-Liquid Adsorption I: Theoretical Aspects, Langmuir 1992, 8, 2005.
(19) Vogler, E. A. Practical Use of Concentration-Dependent Contact Angles as a
Measure of Solid-Liquid Adsorption II: Experimental Aspects, Langmuir 1992, 8, 2013.
(20) Vogler, E. A.; Martin, D. A.; Montgomery, D. B.; Graper, J. C.; Sugg, H. W. A
Graphical Method for Predicting Protein and Surfactant Adsorption Properties, Langmuir 1993,
9, 497.
(21) Vogler, E. A. On the Origins of Water Wetting Terminology. In Water in
Biomaterials Surface Science; Morra, M., Ed.; John Wiley and Sons: New York, 2001; pp 150.
(22) Crystall, B.; Rumbles, G.; Smith, T.; Phillips, D. Time Resolved Evanescent Wave
Induced Fluorescent Measurements of Surface Adsorbed Bovine Serum Albumin,J. Colloid and
Interface Sci. 1993, 155, 247.
(23) Walton, A. G.; Maenpa, F. C. Application of Fluorescence Spectroscopy to the
Study of Proteins at Interfaces,J. Colloid and Interface Sci. 1979, 72, 265.
(24) Xu, X.-H. N.; Yeung, E. S. Long-range Electrostatic Trapping of Single-Protein
Molecules at a Liquid-Solid Interface,Science 1998, 281, 1650.
(25) Krishnan, A.; Sturgeon, J.; Siedlecki, C. A.; Vogler, E. A. Scaled Interfacial
Activity of Proteins at the Liquid-Vapor Interface,J. Biomed. Mat. Res. 2004, 68A, 544.
171
Page 190
(26) Lu, J. R.; Su, T. J.; Penfold, J. Adsorption of Serum Albumins at the Air/Water
Interface,Langmuir 1999, 15, 6975.
(27) Zhou, C.; Friedt, J.-M.; Angelova, A.; Choi, K.-H.; Laureyn, W.; Frederix, F.;
Francis, L. A.; Campitelli, A.; Engelborghs, Y.; Borghs, G. Human Immunoglobulin Adsorption
Investigated by Means of Quartz Crystal Microbalance Dissipation, Atomic Force Microscopy,
Surface Acoustic Wave, and Surface Plasmon Resonance Techniques,Langmuir 2004, ASAP
Article 10.1021/la036251d S0743-7463(03)06251-6.
(28) Krishnan, A.; Siedlecki, C. A.; Vogler, E. A. Mixology of Protein Solutions and
the Vroman Effect,Langmuir 2004, 20, 5071.
(29) Krishnan, A.; Wilson, A.; Sturgeon, J.; Siedlecki, C. A.; Vogler, E. A. Liquid-
Vapor Interfacial Tension of Blood Plasma, Serum and Purified Protein Constituents
Thereof,Biomaterials 2005, 26, 3445.
(30) Putnam, F. W. Alpha, Beta, Gamma, Omega - The Roster of the Plasma Proteins.
In The Plasma Proteins: Structure, Function, and Genetic Control; Putnam, F. W., Ed.;
Academic Press: New York, 1975; Vol. 1; pp 58.
(31) Allara, D. L.; Nuzzo, R. G. Spontaneously Organized Molecular Assemblies. 2.
Quantitative Infrared Spectroscopic Determination of
Equilibrium Structures of Solution-Adsorbed n -Alkan oic Acids on an Oxidized Aluminum
Surface,Langmuir 1985, Vol. 1, 52.
(32) Nuzzo, R. G.; Allara, D. L. Adsorption of Bifunctional Organic Disulfides on
Gold Surfaces,J. Am. Chem. Soc 1983, Vol. 105, 4481.
172
Page 191
(33) Nuzzo, R. G.; Fusco, F. A.; Allara, D. L. Spontaneously Organized Molecular
Assemblies. 3. Preparation and Properties of Solution Adsorbed Monolayers of Organic
Disulfides on Gold Surfaces,J. Am. Chem. Soc. 1987, 109, 2358.
(34) Nuzzo, R. G.; Dubois, L. H.; Allara, D. L. Fundamental Studies of Microscopic
Wetting on Organic Surfaces. 1. Formation and Structural Characterization of a Self-Consistent
Series of Polyfunctional Organic Monolayers,J. Am. Chem. SOC 1990, 112, 558.
(35) Porter, M. D.; Bright, T. B.; Allara, D. L.; Chidseyi, C. E. D. Spontaneously
Organized Molecular Assemblies. 4. Structural Characterization of n-Alkyl Thiol Monolayers on
Gold by Optical Ellipsometry, Infrared Spectroscopy, and Electrochemistry,J. Am. Chem. Soc
1987, 109, 3559.
(36) Krishnan, A.; Liu, Y.-H.; Cha, P.; Allara, D. L.; Vogler, E. A. An Evaluation of
Goniometric Methods,J. Colloid and Interf. Sci. 2005, in review.
(37) Krishnan, A.; Liu, Y.-H.; Cha, P.; Allara, D. L.; Vogler, E. A. Interfacial
Energetics of Globular-Blood Protein Adsorption to a Hydrophobic Solid-Water
Surface,Langmuir 2005, in review.
(38) Wen-Yih Chen, H.-M. H., Chien-Chen Lin, Fu-Yung Lin, and Yu-Chia Chan.
Effect of Temperature on Hydrophobic Interaction between Proteins and Hydrophobic
Adsorbents: Studies by Isothermal Titration Calorimetry and the van't Hoff Equation,Langmuir
2003, 19, 9395.
173
Page 192
(39) Hoffman, A. S.; Ratner, B. D. Nonfouling Surfaces. In Biomaterials Science: An
Introduction to Materials in Medicine; 2 ed.; Ratner, B., Hoffman, A., Eds.; Elsevier Academic
Press: San Diego, 2004.
(40) Horbett, T. A. The Role of Adsorbed Proteins in Tissue Response to Biomaterials.
In Biomaterials Science: An Introduction to Materials in Medicine; 2 ed.; Ratner, B., Hoffman,
A., Eds.; Elsevier Academic Press: San Diego, 2004.
(41) Rosen, M. J. Surfactants and Interfacial Phenomena; Wiley: New York, 1978.
(42) Anderson, N. L.; Anderson, N. G. The Human Plasma Proteome:History,
Character, and Diagnostic Prospects,Molecular and Cellular Proteomics 2002, 1, 845.
(43) Mitropoulos, K. A. The Levels of FXIIa Generated in Hyman Plasma on an
Electronegative Surface are Insensitive to Wide Variation in the Conventration of FXII,
Prekallikrein, High Moleuclar Weight Kininogen or FXI,Thromb. Haemost. 1999, 82, 1033.
(44) Mitropoulos, K. A. High Affinity Binding of Factor FXIIa to an Electronegative
Surface Controls the Rates of Factor XII and Prekallirien Activation in vitro,Thrombosis
Research 1999, 94, 117.
(45) Zhuo, R.; Miller, R.; Bussard, K. M.; Siedlecki, C. A.; Vogler, E. A.
Procoagulant Stimulus Processing by the Intrinsic Pathway of Blood Plasma
Coagulation,Biomaterials 2004, in press.
174
Page 193
(46) Vogler, E. A.; Graper, J. C.; Harper, G. R.; Lander, L. M.; Brittain, W. J. Contact
Activation of the Plasma Coagulation Cascade.1. Procoagulant Surface Energy and Chemistry,
J. Biomed. Mat. Res. 1995, 29, 1005.
(47) Vogler, E. A.; Graper, J. C.; Sugg, H. W.; Lander, L. M.; Brittain, W. J. Contact
Activation of the Plasma Coagulation Cascade.2. Protein Adsorption on Procoagulant
Surfaces,J. Biomed. Mat. Res. 1995, 29, 1017.
(48) Vogler, E. A.; Nadeau, J. G.; Graper, J. C. Contact Activation of the Plasma
Coagulation Cascade. 3. Biophysical Aspects of Thrombin Binding Anticoagulants,J. Biomed.
Mat. Res. 1997, 40, 92.
(49) Tripp, B. C.; Magda, J. J.; Andrade, J. D. Adsorption of Globular Proteins at the
Air/Water Interface as Measured via Dynamic Surface Tension: Concnetration Dependence,
Mass-transfer Considerations, and Adsorption Kinetics,J. Colloid and Interface Sci. 1995, 173,
16.
(50) Birdi, K. S. Lipid and biopolymer monolayers at liquid interfaces; Plenum Press:
New York, 1989.
175
Page 194
Table 1: Purified Proteins & Surfactants
NAME OF PROTEIN/SURFACTANT
(acronym)
MOLECULAR WEIGHT
(kDa)
AS-RECEIVED
FORM (mg/mL)
PURITY (electrophoresis)
or ACTIVITY
PHYSIOLOGIC CONCENTRATION
mg/100mL (nominal value)
VENDOR
Prep 1 98% Sigma Aldrich
UBIQUITIN (Ub)
Prep 2
10.7 Powder
95%
10-20 (15)
EMD Biosciences
THROMBIN (FIIa) 35.6 Powder 1411 NIH units/mg N/A Sigma Aldrich
Prep 1 Powder 98% HUMAN SERUM ALBUMIN Fraction V (FV HSA) Prep 2
66.3
Powder 98%
3500-5500 (4500)
MP Biomedicals
PROTHROMBIN (FII) 72 Powder 7.5 units/mg protein 5-10 (7.5)
Sigma Aldrich
Prep 1 Solution (2.1)
FACTOR XII (FXII)
Prep 2
78
Solution (5.5)
95% (4) Hematologic Technologies
HUMAN IgG (IgG) 160 Powder 97% 800-1800 (1300)
Sigma Aldrich
FIBRINOGEN (Fb) 340 Powder 70% clottable protein 200-450 (325)
Sigma Aldrich
COMPLEMENT COMPONENT C1q (C1q)
400 Solution (1.1)
Single band by immunoelectrophoresis
10-25 (17.5)
Sigma Aldrich
Prep 1 Sigma Aldrich
Prep 2 Sigma Aldrich
α2-MACROGLOBULIN
(αmac)
Prep 3
725
Powder
98% 150-350 (250)
MP Biomedicals
Prep 1 Solution (0.8)
98% Sigma Aldrich
HUMAN IgM (IgM)
Prep 2
1000
Solution (5.1)
Single band by immunoelectrophoresis
60-250 (155)
MP Biomedicals
SODIUM DODECYL SULFATE (SDS)
0.28 Powder N/A N/A Sigma Aldrich
TWEEN 20 (TWN20) 1.23 Neat N/A N/A Sigma Aldrich
176
Page 195
TABLE 2: STEADY-STATE PROTEIN ADSORPTION PARAMETERS
NAME OF PROTEIN/SURFACTANT
(acronym) aθ(degrees)
'aθ
(degrees)
/ 2ln BCΘ PPT (pM)
M (dimension-
less)
aτ (mN/m)
'aτ
(mN/m)
maxaΠ
(mN/m)
maxln BC (pM)
Prep 1 100.9±0.5 75 19(17)
-
-14 7 21 19UBIQUITIN (Ub)*
Prep 2 102.2±0.9 75 19(17)
-
-15 12 27 19
THROMBIN (FIIa) 99.8±0.5 84.6±0.9 17.5±0.2 (13.9±0.2)
-25.0±8.5 -12.3±0.6 4.5±0.7 16.7±0.9 15.1±0.2
Prep 1
103.3±0.8 88.3±0.8 15.9±0.3 (11.7±0.3)
-14.1±5.7 -16.3±0.9 1.4±0.6 17.7±1.2 13.6±0.3HUMAN SERUM
ALBUMIN
FV HSA
Prep 2
104.5±0.8 88.5±0.6 15.7±0.3(11.5±0.3)
-11.6±3.0 -17.7±0.9 1.2±.5 18.9±1.1 13.7±0.3
PROTHROMBIN (FII) 100.6±0.5 86.5±0.9 15.1±0.4 (10.8±0.4)
-10.1±2.7 -12.9±0.6 2.6±0.7 15.6±0.9 13.2±0.4
Prep 1 102.9±0.5 94.8±1.0
15.6±0.5 (11.3±0.5)
-17.9±1.2 -15.6 -3.1 12.5 12.7±0.5FACTOR XII*
Prep 2 102.0±0.4 88.2±0.8 15.7±0.4(11.3±0.4)
-10.9±3.3 -14.6 1.2 15.8 13.6±0.4
HUMAN IgG (IgG) 103.7±0.7 94.9±1.4 15.1±0.9(10.1±0.9)
-6.9±4.7 -16.8±0.9 -4.4±1.3 12.4±1.5 13.3±0.9
FIBRINOGEN 103.9±0.6 85.3±.9 15.5±0.3(9.8±0.3)
-6.4±1.3 -16.8±0.8 -3.8±0.8 20.7±1.1 13.2±0.3
COMPLEMENT COMPONENT C1q (C1q)
102.6±0.4 95.3±0.7 15.6±0.4(9.6±0.4)
-12.1±5.6 -15.6±0.5 -5.0±0.7 10.6±0.8 11.4±0.4
Prep 1 101.9±0.5 Prep 2 100.2±0.9
α2-MACROGLOBULIN* (α mac)
Prep 3 103.2±0.5
86
19 (13)
-
-15
4
19
17
Prep 1 102.7±0.6 91.3±1.6 15.5±0.5(8.7±0.5)
-7.4±2.9 -15.7±0.7 -1.1±1.4 14.6±1.6 11.3±0.5HUMAN IgM (IgM)
Prep 2 102.4±0.6 87.8±2.0 15.9±0.6(9.2±0.7)
-4.9±1.6 -15.4±0.7 1.9±1.7 17.3±1.9 12.6±0.8
SODIUM DODECYL SULFATE (SDS) 100.1±1.9 56.0±2.3 17.7±0.4(18.9±0.4)
-17.3±4.6 -12.5±2.3 18.7±1.1 31.2±2.6 21.4±0.4
TWEEN 20 (TWN20) 97.1±0.6 65.1±0.7 16.4±0.3(16.2±0.1)
-23.4±3.3 -8.9±0.8 14.6±0.5 23.5±0.6 17.8±0.1
Notes: * Parameters are graphical estimates of fitted parameters. See Results section.
177
Page 196
Figure 1: Contact angle isotherms in 3D ( aθ as a function of analysis time (drop age) and
logarithmic (natural) solution concentration ) and 2D (BC aθ as a function of logarithmic solution
concentration at selected times) formats comparing sodium dodecyl sulfate (SDS, panel A),
human serum albumin (FV HSA, panel B, preparation 1, Table 2), and α2-macroglobulin (panel C,
preparation 1, Table 2). In each case, solute concentration is expressed in picomoles/L (pM
BC
BC ) on
a natural logarithmic scale. Symbols in 2D panels represent time slices through 3D representations
(filled circle = 0.25 sec, open circle = 900 sec, filled triangles = 1800 sec, and open triangles = 3594
sec; annotations in panel A indicate maximum and half-maximum contact angle reduction). Notice
that adsorption kinetics dominated α2-macroglobulin adsorption whereas steady-state was achieved
within about 1000 sec for HSA, and nearly no adsorption kinetics is detected for SDS. Note also
decrease in aθ with time, attributed to slow hydration of the SAM surface (arrow annotation, Panel
B; see Results section).
178
Page 197
2 4 6 8 10 12 14 16 18 20 22
θ a (d
egre
es)
80
85
90
95
100
105
110
10 12 14 16 18 20 22 24 26 28
θ a (d
egre
es)
40
50
60
70
80
90
100
110
2 4 6 8 10 12 14 16 18 20
θ a (d
egre
es)
80
85
90
95
100
105
110
A
B
lnCB ( CB in pM)
aθ
'aθ
maxaθ
max1
2 aθ
/ 2ln BCΘ
lnCB ( CB in pM)
hydration time
C
adsorption time
lnCB ( CB in pM)
179
Page 198
Figure 2: Sequential interpretation of a steady-state (3600 sec drop age) contact angle adsorption
isotherm for thrombin (FIIa) - Panel A, advancing contact angles, aθ ; panel B, advancing adhesion
tension, aτ ; panel C, advancing spreading pressure aΠ . Smoothed curves through the data are
guides to the eye. Annotations identify low- and high- concentration asymptotes for contact angles
( aθ , 'aθ ), adhesion tensions ( aτ , '
aτ ) respectively, and maximum spreading pressure that are
used to characterize isotherms (Table 2).
maxaΠ
180
Page 199
lnCB (CB in pM)2 4 6 8 10 12 14 16 18 20 22
Πa (
mN
/m)
0
5
10
15
θ a (de
gree
s)
80
85
90
95
100
105
110
τ a (m
N/m
)
-15
-10
-5
0
5
aθ
max 'a a aτ τΠ = −
A
B
C
'aθ
aτ
'aτ
181
Page 200
Figure 3: Spreading pressure isotherms scaled three different ways for selected proteins
spanning three decades in molecular weight – by natural logarithmic weight-volume (panel A),
picomolarity (panel B), and logarithmic (base 10) ratio-to-physiological concentration (panel C).
Smooth curves are guides to the eye. Protein interfacial activity appears more similar than dissimilar
when viewed on a weight basis but diversity among proteins becomes more apparent when scaled on
a molar or ratio-to-physiological concentration. Physiologic scaling (panel C) shows that FV HSA,
IgG, and IgM (preparations 1, Table 1) were fully surface active at-and-below physiological
concentrations whereas C1q, FII, and Ub required nearly 2X concentration to achieve maximum
spreading pressure.
aΠ
182
Page 201
lnC B (C B in P P T)
6 8 10 12 14 16 18 20 22 24 26
Πa (m
N/m
)
0
5
10
15
20
FVH SAU b
F II
IgMIgG
C 1q
lnC B (C B in pM )
2 4 6 8 10 12 14 16 18 20 22
Πa (m
N/m
)
0
5
10
15
20U bFV H SA
C 1q
FII
IgMIgG
log [C B/C P]
-8 -6 -4 -2 0 2
Πa (
mN
/m)
0
5
10
15
20
FVH SA
IgM
IgG
U b
FII
C 1q
A
B
C
183
Page 202
Figure 4: Spreading pressure isotherms of blood factor FXII (preparation 1, Table 1), scaled as
a ratio-to-physiological concentration. Smooth curves at 0.25, 900, 1800, and 3594 sec drop age
illustrate FXII adsorption kinetics. FXII is weakly surface active at physiologic concentrations (see
Fig. 3 for comparison to other proteins such as FVHSA, IgG). Note that maximum spreading
pressure was achieved only at two decades of concentration higher than physiologic concentration.
aΠ
184
Page 203
log [CB/CP]
-4 -2 0 2
Πa (
mN
/m)
0
2
4
6
8
10
12
14
16
18
185
Page 204
Chapter 6
Interfacial Energetics of Globular-Blood Protein Adsorption to a Hydrophobic Solid/Aqueous-Buffer Interface
Abstract
Adsorption isotherms of nine (9) globular proteins with molecular weight (MW) spanning 10-1000 kDa
confirm that interfacial energetics of protein adsorption to a hydrophobic solid/aqueous-buffer (solid-liquid,
SL) interface are not fundamentally different than adsorption to the water-air (liquid-vapor, LV) interface.
Adsorption dynamics dampen to a steady-state (equilibrium) within a 1 hr observation time and protein
adsorption appears to be reversible, following expectations of Gibbs’ adsorption isotherm. Adsorption
Isotherms constructed from concentration-dependent advancing contact angles aθ of buffered-protein
solutions on methyl-terminated, self-assembled monolayer surfaces show that maximum advancing spreading
pressure, , falls within a relatively narrow maxaΠ max10 20a< Π < mN/m band characteristic of all proteins
studied, mirroring results obtained at the LV surface. Furthermore, aΠ isotherms exhibited a ‘Traube-rule-
like’ progression in similar to the ordering observed at the LV surface wherein molar concentrations
required to reach a specified spreading pressure
MW
aΠ decreased with increasing MW. Finally, neither Gibbs’
surface excess quantities [ ]sl svΓ − Γ nor lvΓ varied significantly with protein MW. The ratio
[ ]sl sv
lv
⎧ ⎫Γ − Γ⎨ Γ⎩ ⎭
⎬~ 1, implying both that and chemical activity of protein at SL and LV surfaces was
identical. These results are collectively interpreted to mean that water controls protein adsorption to
hydrophobic surfaces and that the mechanism of protein adsorption can be understood from this perspective
for a diverse set of proteins with very different composition.
0svΓ ∼
186
Page 205
6.1. Introduction
Protein adsorption is one of the most fundamental, unsolved problems in biomaterials surface
science 1,2. Practical importance of the problem is related to the fact that protein adsorption is among
the first steps in the acute biological response to materials that dictates biocompatibility, and hence
utility in medical-device applications. As a consequence of these scientific and pragmatic factors,
the protein-adsorption problem has attracted considerable research attention from diverse fields of
inquiry ranging from biomaterials to physics. An undercurrent flowing through much of this
research seems to be that the amount of protein adsorbed to a surface is primarily controlled by
short-range, pair-wise interactions between protein molecules and adsorbent surface (consider, for
example, the RSA model of protein adsorption). Adsorbed protein is frequently assumed to be
irreversibly surface bound in a monolayer arrangement; see for example 3 and citations therein.
However, presumption of irreversible adsorption remains controversial in the literature 2 and
multilayering of protein has been experimentally demonstrated in a number of cases 2,4-9.
Furthermore, the apparent specificity/selectivity of adsorption from multi-component solutions is
frequently attributed to variations in protein molecular structure that give rise to differential
interactions with a particular adsorbent.
It is our contention that this view of protein adsorption to surfaces does not properly account for the
role of water in the process and, in so doing, fails to discern unifying trends in protein adsorption 10-
14. For example, literature illustrations depict protein and adsorbent surfaces without juxtaposing
hydration layers, one layer for protein and one for surface, and do not contemplate how these layers
are displaced or coalesced as protein and surface come into close contact. Many modern
computational models probing surface-protein interactions regard water as a complicating feature
187
Page 206
that can be ignored for the sake of reasonable computational time; see refs. 15-17 and citations therein.
When water is included in such models, it is usually only those molecules directly adjacent to the
protein that comprise the ‘bound-water layer’, classically measured by δ in grams-water-per-gram-
protein 18-20; where δ ~ 0.35 g/g is found to be a representative average value 20. This protein-bound
water layer falls well short of the volume which must be displaced when a protein molecule
approaches a hydrated adsorbent surface. That is to say, since two objects cannot occupy the same
space at the same time, a volume of interfacial water at least equal to the partial specific volume
( cm
ov
0.70 0.75ov≤ ≤ 3/g protein) of the adsorbing protein must move 21. If protein adsorbs in
multilayers, then clearly much more water must be displaced. Some or all of this interfacial water is
bound to the adsorbent surface to an extent that varies with surface energy 2,22. Consequently,
protein adsorption is found to scale with water wettability 23-25, underscoring need to incorporate
surface hydration explicitly into protein-adsorption models. Indeed, accounting for water in protein
adsorption has become a significant preoccupation of quartz crystal microbalance (QCM)
practitioners because QCM not only measures adsorbed protein mass but also “trapped”26 or “intra-
layer”27 or “hydrodynamically coupled”28 water.
We have made use of a simplified ‘core-shell’ model of globular proteins in which spheroidal
molecules are represented as a packed core surrounded by a hydration shell. The core has a radius
that scales with molecular weight ( ) and the hydration shell has a thickness such that the
ensemble radius
vr1/ 3MW
vR rχ= equals the hydrodynamic radius 10; where χ is taken to be a generic
factor for all proteins. Calibration to human serum albumin (FV HSA) dimensions reveals that R =
1.3 (30% larger than ) and contains about 0.9 g water/g protein. Hence, the hydration layer
accommodated by this model is ~ 3X greater than
vr vr
δ . Calibrated to neutron-reflectivity (NR) of
188
Page 207
albumin adsorption to surfaces, this model suggests that protein saturates the hydrophobic surface
region by packing to nearly face-centered-cubic (FCC) concentrations wherein hydration shells
touch but do not overlap 10. We propose that osmotic repulsion among hydrated protein molecules
limits interphase capacity. Stated another way, protein adsorption is limited by the extent to which
the hydrophobic interface can be dehydrated through displacement of interfacial water by adsorbing
protein. Accordingly, protein adsorption is viewed as being more about solvent than protein itself; a
perspective in sharp contrast to the prevailing paradigm mentioned above.
This water-oriented perspective on protein adsorption presents a considerable simplification of the
protein-adsorption process and, as a result, a tractable quasi-thermodynamic theory can be sketched
out for a phenomenon that would otherwise be overwhelmingly complex for more than just a few
proteins in solution. We find that this theory naturally explains the experimentally-observed
‘Traube-rule progression’ in which molar concentrations required to fill the liquid-vapor (LV)
surface follow a homology in protein size, consistent with packing hydrated spheroidal molecules
within this space 10. A relatively straightforward set of “mixing rules” follow directly, stipulating
both concentration and weight-fraction distribution of proteins adsorbed to the LV surface from
multi-component aqueous solutions such as blood plasma or serum 12. These mixing rules
rationalize the long-known-but-otherwise-unexplained observations that (i) LV interfacial tension
lvγ of blood plasma and serum is nearly identical, in spite of the fact that serum is substantially
depleted of coagulation proteins such as fibrinogen; and (ii) lvγ of plasma and serum derived from
human, bovine, ovine, and equine blood is practically identical, even though there are substantial
differences in plasma proteome among these species 13.
189
Page 208
This paper discloses results of an investigation of globular-blood protein adsorption to a well-
defined, hydrophobic solid/aqueous-buffer (solid-liquid, SL) interface. Methyl-terminated, self-
assembled thiol monolayers (SAMs) on gold-coated semiconductor-grade silicon wafers exhibiting
water contact angles are used as test substrata. Time-and-concentration-dependent contact
angles measure adsorption energetics of (globular) proteins spanning 3 decades in MW in a manner
parallel to the above-cited studies of protein adsorption to the LV surface. We find that the basic
pattern observed at the LV surface is repeated at the hydrophobic SL surface, supporting our
contention that water is the significant controller of protein adsorption to surfaces.
110oaθ ∼
6.2. Materials and Methods
Purified Proteins and Synthetic Surfactants: Table 1 compiles pertinent details on proteins and
surfactants used in this work. Protein purity was certified by the vendor to be no less than the
respective values listed in Column 4 of Table 1, as ascertained by electrophoresis (SDS-PAGE or
IEP). Mass, concentration, and molecular weights supplied with purified proteins were accepted
without further confirmation. Issues associated with protein purity, especially contamination with
surfactants, and the potential effect on measured interfacial tensions have been discussed elsewhere
11. The single value given in Table 1 (Column 5) for physiological concentration of human proteins
applied in this work was middle of the range listed by Putnam 29. Serial dilutions of protein stock
solutions (usually 10 mg/mL) were performed in 96-well microtiter plates by (typically) 50:50
dilution in phosphate buffered saline solution (PBS; 0.14 M NaCl, 0.003M KCl) prepared from
powder (Sigma Aldrich) in distilled-deionized (18.2 MΩ-cm) water using procedures detailed in ref.
11. Between 24-30 dilutions were prepared in this manner, covering a dynamic range between 10-10
190
Page 209
to 1 % (w/v), taking care to mix each dilution by repeated pipette aspiration and avoiding foaming of
concentrated solutions.
Surfaces: Methyl-terminated, self-assembled monolayer surfaces (SAMs) were prepared according
to standard methods of surface engineering 30-34. Briefly, silicon wafers were pre-cleaned in hot 1:4
H2O2 (30%)/H2SO4 followed by rinsing with distilled-deionized H2O and absolute ethanol. Gold-
coated wafers were prepared by vapor deposition of chromium and gold (99.99% purity) from
resistively-heated tungsten boats onto clean 3-in. diameter silicon wafers at about 1 x 10⁻⁸ torr base
pressure in a cryogenically pumped deposition chamber. The sample was not allowed to rise above
~40oC during the evaporation. Film thicknesses, monitored with a quartz crystal oscillator, were
typically 15 nm and 200 nm for chromium and gold, respectively. Chromium was deposited prior to
gold to enhance adhesion to the substrate. After deposition, the chamber was backfilled with
research-grade nitrogen. Gold-coated samples were removed and immersed in 1mM solutions of 1-
hexadecanethiol (CH3(CH2)15SH) in ethanol, contained in glass jars at ambient temperature, for at
least 3 days.
The alkanethiol (Aldrich Chemical Co., Milwaukee, WI) and ethanol (commercial reagent-grade)
were used as-received, without further purification. Samples were stored in the thiol solution until
use and were rinsed with ethanol just prior to an experiment.
Tensiometry & Goniometry: Liquid-vapor interfacial tensions required by this work were
measured by Pendant Drop Tensiometry (PDT) as described in refs. 10,11. Tilting-Plate Goniometry
(TPG) was performed using a commercial-automated goniometer (First Ten Angstroms Inc.,
Portsmouth, VA). Advancing contact angles ( aθ ) applied in this work have been verified to be in
191
Page 210
statistical agreement with those obtained by Wilhelmy Balance Tensiometry (WBT) and Captive-
Drop Goniometry (CDG), as detailed in ref. 35. Receding angles ( rθ ) were shown to be not as
reliable as aθ and, as a consequence, only aθ was analyzed in this work. The tilting-plate goniometer
(TPG) employed a Tecan liquid-handling robot to aspirate 12 µL of solutions contained in a 96-well
microtiter plate prepared by the serial-dilution protocol mentioned above. The robot was used to
reproducibly transfer the tip with fluid contents into a humidified (99+ % RH) analysis chamber and
dispense 10 µL drops of protein solution onto the surface of test substrata (see below) held within the
focal plane of a magnifying camera. These and all other aspects of TPG were performed under
computer control. Proprietary algorithms supplied by the vendor were used to deduce contact angles
from drop images captured at a programmed rate by a frame grabber. Typically, 600 images were
captured at a rate of 1 image every 6 sec following 20 sec delay to permit vibrations of the expelled
drop to dampen. Drop evaporation rates within the humidified chamber deduced from computed-
drop volumes (based on image analysis) were observed to vary with solute concentration, generally
ranging from approximately 25 nL/min for pure water to 10 nL/min for solute solutions > 0.1% w/v.
The impact of this evaporation rate over the 60 min time frame of the experiment was apparently
negligible, as gauged from the behavior of purified surfactants discussed in the Results section.
Precision of aθ was about 0.5o based on repeated measurement of the same drop. The analysis
chamber was thermostated to a lower-limit of 25±1 oC by means of a computer-controlled resistive
heater. Upper-temperature limit was not controlled but rather floated with laboratory temperature,
which occasionally drifted as high as 29 oC during summer months. Thus, reported aθ values were
probably not more accurate than about 1o on an inter-sample basis considering the small, but
measurable, variation of water interfacial tension with temperature. This range of accuracy was
deemed adequate to the conclusions of this report which do not strongly depend on more highly
192
Page 211
accurate aθ that is difficult to achieve on a routine basis. Instead, veracity of arguments raised
herein depend more on a breadth of reliable measurements made across the general family of human
proteins.
Test substrata were held on a rotating, tilting-plate platform driven by stepper motors under
computer control. Substrata were allowed to come to equilibrium within the sample-chamber
environment for no less than 30 min before contact angle measurements were initiated. The
platform was programmed to tilt at 1o/sec from horizontal to 25o after the drop was deposited on the
surface by the robot. The optimal (incipient rolling) tilt angle was found to be 25o and 15o for
solutions of proteins and surfactants respectively. The first 20 images monitored evolution of the
advancing angle. At the end of the 1 hr aθ measurement period, the platform was programmed to
return to horizontal and rotate 15o to the next analysis position along the periphery of the
semiconductor wafer. This process was repeated for all dilutions of the protein under study so that
results reported for each protein were obtained on a single test surface, eliminating the possibility of
substratum-to-substratum variation within reported results.
aθ measurements by TPG employed in this work were verified against Wilhelmy-balance
tensiometry (WBT) and found to agree within a percentage difference of 2.5±1.9% for
3550 120aθ< < . It is worthwhile mentioning in this context that WBT itself is inappropriate for
studies of protein adsorption at the SL interface (at least as applied herein) because (i) the technique
requires thin plates that are difficult to two-side coat with gold for thiol-SAM preparation, (ii) WBT
generally requires high solution volumes (~ 10 mL) that greatly exceed availability of purified
proteins, and (iii) the moving three-phase line deposits solute (protein or surfactant) at the SV
193
Page 212
interface making interpretation of the Gibbs’ surface excess parameter [ ]sl svΓ − Γ highly ambiguous
1. Overall, we have found the tilting-plate method applicable to measuring adsorption, at least for
hydrophobic surfaces, and suitable for 1 hr equilibration times if a humidified chamber is used to
control evaporation 23,24. However, it was observed that SAM surfaces were slightly unstable and
subject to “hydration” that led to a systematic decrease in water/PBS contact angles with time.
These hydration dynamics were observed to be more pronounced on SAM surfaces that had been
incubated for long periods (> 3 d) in the 100% RH atmosphere of the PDT analysis chamber (not
shown). However, we do not believe this slight but apparently unavoidable attribute of SAMs on
silicon wafers negatively affects the veracity of conclusions based on final, steady-state aΠ
measurements made at ~ 1 hr analysis time.
Computation and Data Representation: Computational, statistical, and theoretical methods used
in this work have been discussed in detail elsewhere 1,10,11,14,23,24. Briefly, time-dependent aθ data
corresponding to protein dilutions (see above) were recovered from TPG files and correlated with
concentrations, leading to a matrix of results with row values representing concentration and time (in
sec) as column values. It was generally observed that aθ isotherms were sigmoidal in shape when
plotted on logarithmic-concentration axes 1,23, with well-defined low-concentration asymptote oaθ
and high-concentration asymptote 'aθ (see Fig. 1). Successive non-linear least-squares fitting of a
four-parameter logistic equation '
'/ 21 (ln / ln )
[ a aa M
B BC Cθ θ ]aθ θΘ
−=
++ to contact angle isotherms data for
each time within the observation interval quantified parameters oaθ and '
aθ with a measure of
statistical uncertainty. Fitting also recovered a parameter measuring concentration-at-half-maximal-
194
Page 213
change in aθ , / 2 max max 'ln (where / 2 1/2 and )BC a aθ θΘ Θ = Θ Θ ≡ − , as well as a parameter M that
measured steepness of the sigmoidal curve. This multi-parameter fitting to concentration-dependent
aθ data was a purely pragmatic strategy that permitted quantification of best-fit protein and
surfactant characteristics but is not a theory-based analysis 1,10,11,13,23,24. Three-dimensional (3D)
representations of time-and-concentration-dependent aθ data were created in Sigma Plot (v8) from
the data matrix discussed above and overlain onto fitted-mesh computed from least-squares fitting.
Two-dimensional (2D) representations were created from the same data matrices at selected
observation times. Measured aθ were converted to advancing adhesion tension coslva aτ γ= θ for
general interpretation 1; where lvγ was the interfacial tension of the contact-angle fluid. Adhesion
tensions, coslv
o oa
oaτ γ= θ '
a (pure saline) and ' ' coslvaτ γ= θ (at the minimum contact angle observed '
aθ )
were computed with fitted parameters lv
γ and 'lv
γ reported in refs. 10,11 for the proteins under
investigation. Smoothed adhesion-tension isotherms ( aτ vs. l ) were computed from smoothed n BC
aθ using smoothed lvγ values computed from best-fit parameters reported in refs. 10,11. Likewise,
smoothed spreading pressure isotherms ( aΠ vs. ) were computed from smoothed ln BC aτ curves,
where ( )a a aτ τΠ ≡ − .
6.3. Theory
Adsorption Isotherms: Adsorption of surface-active solutes (surfactants, where the term includes
both synthetic detergents and proteins) can affect liquid-vapor (LV), solid-vapor (SV), or solid-
liquid (SL) interfacial tensions, thus producing a change in measured contact angles θ as given by
the Young equation coslv sv slτ γ θ γ γ≡ = − ; where τ is adhesion tension and γ is the interfacial
195
Page 214
tension at the interface denoted by subscripts. Thus, contact angles can be used to monitor
adsorption to solid surfaces; see refs. 1,23,24 and citations therein. Contact-angle isotherms are
graphical constructions that monitor effects of adsorption by plotting advancing contact angles aθ
against l (see Fig. 1 for examples); where surfactant bulk-phase concentrations range from
10
n BC BC
-10 to 1 % (w/v, see Materials and Methods). Contact-angle isotherms were sequentially
interpreted in terms of adhesion tension ( aτ vs. ) and spreading pressure ( vs. ln )
isotherms; where
ln BC aΠ BC
coslva aτ γ θ≡ , ( )o
a a aτ τΠ = − , lvγ is the LV interfacial tension of the fluid at ,
and
BC
oaτ is the adhesion tension of pure buffer . We monitored time
dependence of all three isotherm forms but herein interpret only final measurements that achieve or
approach steady-state (equilibrium). Issues associated with adsorption reversibility are discussed in
the Results section. Secure interpretation of measured
( 71.97mN/m at 20 C)lv
oγ =
aθ in terms of aτ depends on accurate
knowledge of lvγ at the bulk-phase surfactant concentration in equilibrium with SL and LV
interfaces. Thus, solute depletion of the bulk phase by adsorption may require correction of as-
prepared bulk-phase concentration . However, agreement between (uncorrected) tensiometry and
instrumental methods of measuring adsorption for surfactants (see Table 3) suggests solute-depletion
was not a serious issue for surfactant standards. Likewise, for the case of protein adsorption, it can
be concluded from a simple calculation that solute depletion was not a serious problem requiring
correction
BC
14.
Gibbs’ Surface Excess: Practical use of concentration-dependent contact angles as a measure of
adsorption to the solid-liquid (SL) interface has been discussed at length elsewhere; see, for
examples, refs. 1,23,24 and citations therein. Briefly, for the purposes of this paper, the amount of
196
Page 215
solute adsorbed to SV and SL interfaces is measured by the Gibbs’ surface excess quantities svΓ and
slΓ , respectively, in units of moles/area (the subscript “a” specifying advancing contact angles is not
carried in symbology for the sake of notational compactness). The difference [Γ ]sl svΓ − Γ (but not
separate excess parameters) can be computed from data comprising contact-angle isotherms using
Eq. (1):
[ ] [ ] [sl
sincos
lnlv a a
sv lv aB
dRT d C
γ θ θ ]θ⎧ ⎫⎛ ⎞⎪Γ −Γ = − + Γ⎨ ⎜ ⎟⎪ ⎪⎝ ⎠⎩ ⎭
⎪⎬
B
(1)
where / lnad d Cθ is the slope of a contact-angle isotherm. 1ln
lvlv
B
dRT d C
γ⎛ ⎞Γ = − ⎜
⎝ ⎠⎟ is the surface
excess at the LV interface determined from separate measurement of concentration-dependent lvγ of
the solute under study 10. This form of the Gibbs’ adsorption isotherm is appropriate for a single,
isomerically-pure non-ionizing solute or a polyelectrolyte in swamping salt concentrations of buffer
salts 10,36. It is also important to stress that [ ]sl svΓ − Γ and lvΓ values obtained without correcting
concentration for solute activity are “apparent” surface excess values that can substantially
deviate from actual surface excess calculated from
BC
( )/ad dθ µ and lvdd
γµ
⎛⎜⎝ ⎠
⎞⎟ ; where µ is activity-
corrected chemical potential 10,37,38. However, previous work suggests that the discrepancy between
apparent and actual is roughly constant for the proteins of this study and apparent surface excess
was about 56X larger than actual surface excess
lvΓ
10. We thus assume that apparent [ ]sl svΓ − Γ is also
~56X larger than actual, activity-corrected surface excess because the ratio [ ]sl sv
lv
⎧ ⎫Γ − Γ⎨ ⎬Γ⎩ ⎭
~1 (see
below). Comparison to instrumental measures of adsorption confirms this factor (see Table 3,
Results section).
197
Page 216
For relatively hydrophobic surfaces exhibiting aθ > 60o and under experimental conditions that
avoid inadvertent mechanical deposition of solute at the (SV) interface, as through drop movement
on the surface or evaporation for examples, it has been shown that svΓ ~ 0 and
[ ]sl slsvΓ − Γ → Γ 1,23,24. Under the additional restrictions that (i) solute activities at SL and LV
interfaces are approximately equal and (ii) slΓ ~ lvΓ , it can be expected that [ ]sl sv
lv
⎧ ⎫Γ − Γ⎨ ⎬Γ⎩ ⎭
~ 1.
Experimental results confirm that these stringent physical conditions prevail and it is therefore
concluded that apparent [ ]sl slsvΓ − Γ Γ∼ for proteins reported herein.
Theory of Protein Adsorption: Previous work disclosed a theory of protein adsorption to the LV
surface 10 that appears to be directly applicable to adsorption to the SL surface with little-or-no
modification because apparent [ ]sl svΓ − Γ can be directly interpreted in terms of , as discussed
above. This protein-adsorption theory was based on two related experimental observations and
implications thereof; namely, (i) a surprisingly slight variation in concentration dependence of
slΓ
lvγ
among the same diverse globular proteins studied herein (Tables 1, 2) and (ii) a substantially
constant, MW-independent value of the apparent Gibbs’ surface excess lvΓ = 179 ± 27
picomoles/cm2. This work demonstrates parallel behavior at the hydrophobic SL surface with (i)
only modest variation in isotherms (Tables 1, 2) and (ii) a substantially constant value of the
apparent Gibbs’ surface excess [
aΠ
]sl svΓ − Γ = 175 ± 33 picomoles/cm2 (Table 3, Fig. 5). Protein
adsorption theory asserts that these experimental observations are outcomes of a relatively constant
partition coefficient that entrains protein within a 3D P interphase separating surface regions from
198
Page 217
bulk phases (bulk-solution from bulk-vapor for the LV surface or bulk-solution from bulk-solid for
the SL surface). This “Guggenheim” interphase treatment, which is especially relevant to the
adsorption of large solutes such as proteins, is to be contrasted with the more familiar 2D interface
“Langmuir” paradigm in which the surface is construed to be a planar area with negligible thickness;
see ref. 2 for more discussion. The 3D interphase is proposed to thicken with increasing protein size
because volume occupied by adsorbed-protein molecules scales in proportion to MW according to
the well-known relationships among MW, solvent-exposed area, volume, and packing density 39. As
a consequence of these relationships, molar interphase concentrations of larger proteins are lower
than that of smaller proteins at constant
IC
I
B
CP C≡ . In fact, varies inversely with MW and this
leads directly to the Traube-rule-like ordering for proteins mentioned in the Introduction. Protein
size and repulsion between molecules within the 3D interphase place an upper bound on maximal
interphase concentration denoted . Interphase saturation occurs at and corresponds to the
bulk concentration at which the limiting adhesion tension
IC
maxIC max
IC
maxBC '
aτ is achieved (i.e. the concentration
at maximum spreading pressure ( )max ' oa a aτ τΠ = − ). Calibration of theory to neutron-reflectometry 40
and quasi-electric light scattering 41,42 of albumin adsorbed to the LV surface at suggests that
hydrated spheroidal protein molecules achieve nearly FCC densities or, equivalently, that core
proteins pack with an efficiency factor
maxIC
ε ~ 0.45. is an experimental parameter that can be
estimated from concentration-dependent
maxBC
aθ curves (see Appendix 7.1) and is related to
through the partition coefficient . Eq. (2) states relationships among packing
densities, molecular dimensions (
maxIC
max max/I BP C C≡
MW ), and in the form of a logarithmic expression that is
convenient to apply to concentration-dependent
maxBC
aθ data:
199
Page 218
( ) ( ) ( )max
max 11ln ln ln 9.68 10 ln ln / ln 27.6 ln /IB
CC X MW P MWP ε ε⎛ ⎞= = − + = − + + P⎡ ⎤⎜ ⎟ ⎣ ⎦⎝ ⎠ (2)
Assuming that / Pε is constant for all proteins within this study, Eq. (2) predicts a linear
relationship between and maxln BC ln MW with a slope of – 1 10. A value for the unknown ratio / Pε
can be extracted from the intercept (see Results section).
6.4. Results
SAM Stability: Pure PBS buffer contact angles on SAMs were observed to monotonically decrease
with observation time while interfacial tension lvγ (measured by PDT) remained constant, as shown
in Fig. 2 (compare open and closed circles). Specifically, it was observed that oaθ of a pure PBS
droplet slowly decreased with time from the initial value of 108º< oaθ <106º at t = 0 to
104º< oaθ <102º at = 1 hr; where t o
aθ is the pure buffer contact angle. The range of reported results
corresponds to all 17 methyl-terminated SAM surfaces analyzed during the course of this work.
This phenomenon attributed to SAM “hydration” apparently affected time-dependent measurement
of protein-solution contact angles because we observed that the whole contact angle isotherm ( aθ vs.
concentration) slowly shifted lower with time (see Fig. 1, annotation in Panel B). Steady-state
spreading pressure isotherms effectively correct for the SAM hydration effect in the adsorption
measurement by normalizing to final
aΠ
oaτ ; that is ( )o
a a aτ τΠ = − . A similar strategy was applied to
analysis of protein adsorption kinetics, as further illustrated in Fig. 2 (compare closed triangles and
open triangles). At any time t , reduction in pure PBS contact angle due to hydration (closed circles,
Fig. 2) was added to the recorded aθ for a protein-containing solution (closed triangles) to ‘correct’
observed aθ for the hydration effect (open triangles). This correction procedure typically eliminated
the long-term drift in aθ observed for protein-containing solutions (see filled triangles, Fig. 2 for
200
Page 219
example), suggesting that protein adsorption kinetics had, in fact, dampened within the 1 hr
observation period; as had been generally observed for adsorption of these same proteins at the LV
surface 10,11.
General Aspects of the Data: Table 2 compiles quantitative results of this work. Replicate protein
preparations were studied for Ub, FV HSA, FXII, IgM and α2-macroglobulin. Different vendors
were used as a means of controlling for discrepancies that might arise from sourcing (Table 1).
Contact angle parameters oaθ , '
aθ , and M listed in cols 2-5 of Table 2 are the mean fitted
values corresponding to final 25
/ 2ln BCΘ
aθ curves recorded within the 60-minute time frame of the TPG
experiment. Listed error is standard deviation of this mean. Corresponding adhesion tensions aτ and
'aτ (Columns 6, 7) were computed from o
aθ and 'aθ values, respectively, with uncertainty estimates
computed by propagation of error in aθ and lvγ measurements (Materials and Methods). Maximum
“spreading pressure” ( )max 'a a aτ τΠ ≡ − (Column 8) was computed directly from aforementioned
aτ values and associated uncertainty again estimated by propagation of error. Only computed
estimates of aτ , 'aτ and parameters are provided for FXII since the requiredmax
aΠ lvγ values were
graphical estimates 10,11. Parameters for ubiquitin and α2-macroglobulin are also graphical estimates
from the steady-state, concentration-dependent aθ curve since surface saturation was not reached
within solubility limits for low-MW proteins at the SL interface (as discussed in Appendix 7.3).
Therefore, firm values could not be ascertained by statistical-fitting procedures described in
Materials and Methods section.
201
Page 220
Adsorption Reversibility: Fully-reversible adsorption is technically challenging to unambiguously
prove. Assumption of reversible adsorption, and hence achievement of thermodynamic equilibrium
applied herein, is supported by the following experimental observations:
1. Concentration-dependent lvγ and aθ of proteins spanning 3 decades in MW (referred to as
‘protein’ or ‘proteins’ below) were like those obtained with small-molecule surfactants in that
both followed expectations of Gibbs’ adsorption isotherm 23,24, with a linear-like decrease in
lvγ and aθ as a function of concentration expressed on a logarithmic concentration axis. Surface
excess values ( and [lvΓ ]sl svΓ −Γ ; see next section) computed from Gibbs’ isotherm for
surfactant standards agreed with instrumental methods of analysis within experimental error.
Surface excess values for proteins adsorbed to LV and SL surfaces were statistically identical.
2. Concentration-dependant lvγ and aθ continuously decreased as a function of solution
concentration, well past the concentration required to fill the surface at theoretical monolayer
coverage anticipated for irreversible adsorption.
3. Proteins were observed to be weak surfactants with a commensurately low partition coefficient
deduced from concentration-dependent lvγ and aθ measurements. Free energy of protein
adsorption to hydrophobic LV and SL surfaces calculated from partition coefficients agree with
values measured by hydrophobic interaction chromatography 9.
4. Quantitative aspects of protein and surfactant standards adsorbed to hydrophobic LV and SL
surfaces were identical within experimental error. Protein adsorption to hydrophobic LV and SL
surfaces followed a ‘Traube-like’ ordering wherein the molar concentration required to achieve
an arbitrary spreading pressure decreased in regular progression with MW.
5. Competitive-protein adsorption experiments at hydrophobic LV and SL surfaces demonstrate
protein displacement that follows a simple mass-balance exchange.
202
Page 221
These lines of evidence support our contention that protein adsorption was reversible under the
experimental conditions applied herein and corroborate the conclusion drawn by other investigators
employing very different experimental methods that irreversible adsorption is not an inherent
property of proteins 6,43-46; see also 2 for a review and citations therein.
Contact-angle Isotherms: Time-and-concentration-dependent aθ for the nonionic surfactant
Tween-20 (MW= 1226Da), and purified proteins, prothrombin (FII; MW = 72kDa) and IgM (MW
=1000kDa) are compared in Fig. 1 in both three-dimensional (3D, aθ as a function of time and
concentration) and two-dimensional (2D, aθ as a function of concentration at specified times)
representations. Note that the logarithmic-solute-concentration ordinate ln in Fig. 1 is expressed
in picomolarity units (p
BC
M, 10-12 moles solute/L solution; see Materials and Methods section for
computational and data representation details). Examining first 3D and 2D representations of
Tween-20 surfactancy (Fig. 1A) which serves as a reference compound, it was observed that the aθ
curve was sigmoidal in shape, with a well-defined low-concentration asymptote oaθ and a high-
concentration asymptote 'aθ . In this latter regard, Tween-20 exhibited concentration-limiting
behavior that is typically interpreted as achievement of a critical micelle concentration (CMC), at
least for surfactants. This paper provides no evidence of micelles, for either proteins or surfactants,
and so only acknowledges a limiting behavior at which further increase in solute concentration did
not measurably change aθ . Smooth curves through the data of Fig. 1 result from least-squares fitting
of the four-parameter logistic equation described in Materials and Methods.
203
Page 222
Results for all proteins were similar to the surfactant standard Tween-20 (as illustrated for FII and
IgM in Fig. 1B and 1C, respectively) in that sigmoidal-shaped aθ isotherms connected low- and
high-concentration asymptotes. Significantly more pronounced time dependence in aθ was observed
for proteins, however, especially for intermediate concentrations (in addition to the hydration effects
mentioned above). These dynamics were undoubtedly due to rate-limiting, mass-transfer and
adsorption steps that slowly brought large macromolecules to LV and SL interfaces relative to the
small-molecule reference compound Tween-20 for which only limited dynamics were observed.
Observation of time-dependence was important in this particular work only in so far as data
demonstrate that aθ dynamics dampen within the time frame of experimentation, achieving or
approaching steady-state (equilibrium) within the 1 hr observation window. In fact, data collected in
Table 2 refers only to steady-state measurements. The bulk-solution concentration at which the
limiting 'aθ occurs ( ) is of theoretical interest in this work and was estimated from fitted
parameters compiled in Table 2, as described in the Appendix 7.1.
maxln BC
Adhesion Tension and Spreading Pressure Isotherms: Fig. 3 traces sequential interpretation of
steady-state (1 hr drop age), concentration-dependent aθ data (Panel A) in terms of concentration-
dependent aτ (Panel B) and spreading pressure aΠ (Panel C) for human serum albumin (FV HSA).
Steady-state (equilibrium) spreading pressure isotherms aΠ were used as the basis of comparison of
protein adsorption for the compounds listed in Table 1. Fig. 4 collects aΠ isotherms for selected
proteins spanning the molecular weight range 10 < MW < 1000 kDa showing only smoothed curves
for the sake of clarity, but representative aθ , aτ , and aΠ isotherms with authentic data are amply
illustrated in Figs. 1, 3. The dynamic range of aΠ ~ 20 mN/m was similar to that observed for these
204
Page 223
proteins at the LV surface and fell within a relatively narrow 5 mN/m band for the diverse set
of proteins studied
maxaΠ
10. Furthermore, the same ‘Traube-rule’ ordering of protein adsorption observed
at the LV interface was repeated at the SL interface in that high-MW proteins reduce to any
arbitrary value at lower molarity than low-MW proteins, as suggested by the horizontal arrow
annotation on Fig. 4.
aΠ
Apparent Gibbs’ Surface Excess: Adsorption to the solid-liquid (SL) interface was measured
through the apparent Gibbs’ excess parameter [ ]sl svΓ − Γ computed using Eq. (1) applied to contact-
angle isotherms (see Appendix 7.2 for example calculations). As noted in the Theory Section, the
term “apparent” alerts the reader to the fact that casual application of Gibbs’ adsorption isotherm
using instead of activity treats solutes (proteins and surfactants) as isomerically-pure, non-
ionized polyelectrolytes
BC
37 at infinite dilution with unit activity coefficients 38. Table 3 collects
results for proteins and the small-molecule surfactant standards SDS and Tween-20. used in
calculation of [
lvΓ
]sl svΓ − Γ and [ ]sl sv
lv
⎧ ⎫Γ − Γ⎨ Γ⎩ ⎭
⎬ for surfactant standards was 342±10 and 455±17
picomole/cm2 for SDS and Tween-20, respectively, and were measured by PDT specifically for this
work. [ ]sl svΓ − Γ for proteins were computed using the average lvΓ = 179 ± 27 picomoles/cm2
previously reported to be characteristic of the proteins listed in Table 1 10. Table 3 also lists results
of independent measures of adsorption, slC , for a few of the compounds listed in Table 3 to be
compared to apparent [ ]sl svΓ − Γ measured by TPG. Note that results for small molecule surfactants
SDS and Tween 20 were in good agreement with TPG (i.e. [ ]sl sv
slC⎧ ⎫Γ −Γ⎨ ⎬⎩ ⎭
~0.99±0.01; rows 10, 11
205
Page 224
column 6). However, results for proteins (rows 1-9, column 6) were in substantial disagreement (i.e.
[ ]sl sv
slC⎧ ⎫Γ −Γ⎨⎩ ⎭
⎬ = 62.5±14.9). Fig. 5 shows that dependence of apparent [MW ]sl svΓ − Γ (panel A)
and (panel B) as well as the ratio lvΓ[ ]sl sv
lv
⎧ ⎫Γ − Γ⎨ ⎬Γ⎩ ⎭
(panel C) was flat for proteins listed in Table 1
yielding [ ]sl ~ 1sv
lv
⎧ ⎫Γ −Γ⎨ Γ⎩ ⎭
⎬ (see Theory section).
A Traube-Rule-Analog for Protein Adsorption and Partition Coefficient: Fig. 6 plots
data compiled in Table 2 for proteins at the solid-liquid (SL) interface (panel A), and compares with
results from the liquid-vapor (LV) interface collected in panel B
maxln BC
10,11 on natural logarithmic
coordinates compatible with Eq. (2) of the Theory section (data corresponding to ubiquitin was
estimated as described in the Appendix 7.3). Protein data fell within a monotonically-decreasing
band generally consistent with the anticipation of a unit slope and positive intercept
Comparison to Eq. (2) revealed that
from the nominal intercept value and, by assuming
max 2[ln ( 1.3 0.2) ln (19.8 1.0); 78%]BC MW R= − ± + ± =
4/ ~ 4.1 10Pε −× ε ~ 0.45 (as discussed in the
Theory section), estimated ~ 1,100.P
Competitive Protein Adsorption: We have observed that 'aτ for all of the diverse proteins studied
herein fell within a relatively narrow 10 mN/m band. However, no two proteins were found to be
identical in this regard, mirroring results obtained for these same proteins adsorbed to the
hydrophobic LV surface 10-12. In fact, we found that this ‘interfacial signature’ could be used
as a kind of tracer in competitive-adsorption experiments revealing the composition of the interphase
206
Page 225
formed by adsorption from binary protein mixtures. These mixing experiments also demonstrate
that one protein can displace another, strongly indicating that proteins were not irreversibly adsorbed
to the surface. Fig. 7 examines time-dependent adhesion tension and spreading pressure of hIgM
and FV HSA solutions mixed in various proportions at a fixed total protein concentration of 5
mg/mL; see ref. 11 for more details of HSA and IgM interfacial properties. Protein-adsorption
kinetics led to time-dependent aτ (corrected for SAM hydration, see above) wherein adhesion
tension was observed to quickly rise from 20oaτ −∼ mN/m characteristic of pure PBS on the SAM
surface to a steady-state (equilibrium) 'aτ characteristic of that protein solution, as illustrated in Fig.
7A for 100% albumin (circles), 50:50 albumin:IgM (diamonds), and 100% IgM (squares). Fig. 7B
plots observed steady-state (1 hr) spreading pressure obsΠ at varying weight-fraction albumin
compositions albf in hIgM (expressed as per-cent of 5 mg/mL total protein). These results strongly
suggest that competitive adsorption between proteins leads to displacement of hIgM by albumin
through a process that strictly follows the wt/v concentration of competing proteins and clearly
indicate that IgM was not irreversibly adsorbed.
6.5. Discussion
Adsorption Isotherms: Adsorption isotherms constructed from concentration-dependent contact
angles ( aθ , aτ , and , see Figs. 1,3 and 4) for the proteins studied herein exhibited many
similarities to concentration-dependent
aΠ
lvγ reported previously 10. Maximum spreading pressure,
, fell within a relatively narrow maxaΠ max10 20a< Π < mN/m band characteristic of all proteins
studied, just as observed at the LV surface. Furthermore, aΠ isotherms exhibited the ‘Traube-rule-
like’ progression in MW observed at the LV surface wherein the molar concentration required to
207
Page 226
reach a specified value decreased with increasing MW. Bearing in mind the great range in MW
spanned by proteins in Fig. 4, it is reasonable to conclude that commensurate variability in protein
composition did not confer widely-varying SL interfacial activity; at least not in comparison to the
full range available to ordinary surfactants. The inference taken from the Traube-rule-like
progression is that protein concentration required to reduce
aΠ
aΠ to a specified value decreases with
in a manner loosely consistent with the addition of a generic amino-acid-building-block having
an “average amphilicity” that increases but does not radically change protein amphilicity.
Otherwise, if increased by addition of amino-acid-building-blocks with highly-variable
amphilicity, then would be expected to be a much stronger function of protein than is
observed. Thus, it appears that molar variability in
MW
MW
MW
aΠ MW
aΠ is achieved by aggregating greater mass of
similar amphiphilic character, as opposed to accumulating greater amphilicity with increasing . MW
Apparent Gibbs’ Surface Excess: Adsorption measurements by concentration-dependent contact
angles were in good agreement with literature values for the surfactant standards SDS and
Tween-20, as listed in Table 3. Close agreement between apparent [ ]sl svΓ − Γ and slC from
alternative methods suggests that (i) assumptions of purity and unitary activity coefficients were
reasonable for these small molecules and (ii) solute deposition at the SV interface was negligible
(see Theory section). However, [ ]sl svΓ − Γ for proteins were quite different than values drawn from
comparable literature sources, as was observed to be the case for apparent 10lvΓ . No doubt proteins
violate assumptions of ideality and unitary activity coefficients 47,48, causing apparent [ ]sl svΓ − Γ to
deviate substantially from real, activity-corrected surface excess. Previous work showed that
apparent and real for proteins were different by a factor of about 56 and that apparent lvΓ lvΓ was
208
Page 227
approximately constant across the span of protein MW studied 10. Apparent [ ]sl svΓ − Γ was found to
differ from independent measures by a factor of 62.5±14.9, as inferred from the mean [ ]sl sv
slC⎧ ⎫Γ −Γ⎨ ⎬⎩ ⎭
ratio for proteins (see column 6, rows 1-9, Table 3), consistent with estimates from the LV interface
above. Fig. 5 plots apparent [ ]sl svΓ − Γ and lvΓ , and the ratio [ ]sl sv
lv
⎧ ⎫Γ − Γ⎨ ⎬Γ⎩ ⎭
as a function of MW
showing that ~ [lvΓ ]sl svΓ − Γ and that, as a consequence, [ ]sl sv
lv
⎧ ⎫Γ − Γ⎨ ⎬Γ⎩ ⎭
~ 1. We thus conclude that
[ ]sl svΓ − Γ ~ slΓ ~ for the globular proteins studied herein. By contrast, lvΓ[ ]sl sv
lv
⎧ ⎫Γ − Γ⎨ Γ⎩ ⎭
⎬=3.8±0.1
for Tween 20 (row 11, column 4, Table 3) suggesting nearly 4X concentration at the SL interface
over LV, consistent with results reported for Tween-80 at silanated glass surfaces 1.
A Traube-Rule-Analog for Protein Adsorption and Partition Coefficient: A flat trend in lvΓ
and slΓ with is consistent with an interphase concentration (in units of moles/cmMW IC 3) scaling
inversely with and an interphase thickness MW Ω (in units of cm) that scales directly with .
This is because (when the partition coefficient ) and dependence cancels
MW
ICΓ = Ω 1P >> MW 10. In
other words, the interphase thickens as adsorbed proteins become larger and Gibbs’ dividing plane
descends deeper into the surface region 1,23,24. Interpreted in terms of the theory of protein
adsorption briefly outlined in the Theory section, hydrated spheroidal protein molecules with net
radius R scaling as a function of pack into the interphase to a concentration limited by
osmotic repulsion between molecules. Or stated another way, is limited by the extent to which
the interphase can be dehydrated by protein displacement of interfacial water. Interphase
1/ 3MW maxIC
maxIC
209
Page 228
dehydration is more related to the properties of water than the proteins themselves and so the
partition coefficient I
B
CP C≡ is observed to be approximately constant among the proteins
investigated.
Fig. 6A plots data compiled in Table 2 on logarithmic coordinates compatible with Eq. (2) of
the Theory section. Proteins fell within a monotonically-decreasing band roughly consistent with the
anticipation of a unit slope and positive intercept
. A similar trend was observed for protein
adsorption at the LV surface, shown in Fig. 6B. Interpretation of these results must take into account
that the highly-simplified model of adsorption treats proteins as uniform hard spheres and does not
attempt to account for structural complexities of real molecules, or unfolding (denaturation) that may
occur upon packing within the surface region. Hence failure of data to quantitatively adhere to
Eq. (2) is hardly surprising. Even so, results for Ub were significantly off the trend obtained at the
LV surface (compare to Figs 6A, B), possibly signaling that this small protein does not retain a
spherical geometry at the SL surface. Clearly, more work is required to further test such speculation
and expand the range of proteins explored. However, even in light of scatter in the data of Fig. 6A,
it is of interest to estimate
maxBC
max 2[ln ( 1.3 0.2) ln (19.8 1.0); 78%]BC MW R= − ± + ± =
4/ ~ 4.1 10Pε −× from the nominal intercept value and, by assuming
ε ~ 0.45 (see Theory section), estimate ; which is within an order-of-magnitude of the
estimate from analysis of protein adsorption to the LV surface and from neutron
reflectometry of albumin adsorption to the LV surface
1,100P ∼
150P ∼ 5000P ∼
10. Clearly, goniometry is not a good method
for deducing partition coefficients, but it is of continued interest to compute protein adsorption
energetics based on these rough estimates. With , the free energy of protein adsorption 210 10P< < 3
210
Page 229
to the hydrophobic surface is very modest, lying within the
range
lnoadsG RT∆ = − P
47 oadsRT G RT− < ∆ < − . This is consistent with estimates for lysozyme, myoglobin, and α-
amylase adsorption to hydrophobic surfaces ( ) measured by hydrophobic interaction
chromatography
5oadsG∆ −∼ RT
9. Thus, a conclusion that can be drawn, in spite of rather poor estimates of , is
that adsorption of proteins to a hydrophobic surface is energetically favorable by only small
multiples of thermal energy RT and apparently does not vary significantly among proteins.
P
According to Eq. (2) and Fig. 6, low-MW proteins require greater bulk-phase concentrations to
saturate the SL (or LV) interphase than higher-MW proteins. Given that values plotted in
Fig. 6 approach 1 % w/v, it is reasonable to anticipate that extrapolated values for yet-lower-
MW proteins must equal or exceed protein-solubility limits. As a consequence, surface saturation
and the related limiting is not expected for low-MW proteins at fixed . In this regard, it is
noteworthy that isotherms for low-MW proteins such as ubiquitin (10.7 kDa) fail to achieve a
limiting at any concentration below the solubility limit, as was observed for concentration-
dependent
maxBC
maxBC
maxaΠ P
aΠ
maxaΠ
lvγ .
Competitive Protein Adsorption: Fig. 7 is strong evidence that there is ready exchange of albumin
and IgM at the SAM surface, with relative amounts of adsorbed protein following a simple linear
combining rule expressed in weight-fraction protein in the bulk phase. Taken together with related
observations summarized in the Theory section, we are led to conclude that protein adsorption to
hydrophobic SAM surfaces was substantially reversible under the experimental conditions employed
in this work. The word ‘substantially’ is purposely used here because evidence at hand does not
211
Page 230
guarantee that every adsorbed protein molecule was reversibly bound to the surface (or within the
surface region). Indeed, some unknown fraction of adsorbed protein could be irreversibly bound to
surface defects which are undetected by tensiometric methods applied herein. However, given the
exquisite quality of SAM surfaces and similarity of results obtained at molecularly-smooth LV
surfaces, this putative fraction of irreversibly-bound protein must be vanishingly small.
6.6. Conclusions
Interfacial energetics of protein adsorption from aqueous-buffer solutions to hydrophobic methyl-
terminated SAM surfaces are strikingly similar to the interfacial energetics of protein adsorption to
the hydrophobic air-water surface. The observed ‘Traube-rule-like’ progression in interfacial-
tension reduction ( lvγ and aτ ), conserved partition coefficient , and constant Gibbs’ surface
excess ( and
P
lvΓ slΓ ) for globular proteins spanning 3 decades in all occur because water
controls the energetics of the adsorption process. Hence, protein adsorption to hydrophobic surfaces
has more to do with water than the proteins themselves. A relatively straightforward theory of
protein adsorption predicated on the interfacial packing of hydrated spherical molecules with
dimensions scaling as a function of accounts for the essential physical chemistry of protein
adsorption and rationalizes significant experimental observations. From this theory it is evident that
displacement of interfacial water by hydrated proteins adsorbing from solution places an energetic
cap on protein adsorption to hydrophobic surfaces (
MW
MW
7 oads 4RT G R− < ∆ < − T ). This phenomenon is
generic to all proteins. Thus, globular-blood protein adsorption to hydrophobic surfaces is not found
to significantly vary among diverse protein types.
212
Page 231
Variations from general trends discussed above may reflect deviations in protein geometry from
simple spheres and/or tendency of some proteins to adopt a more spread/compact configuration
(denature) in the adsorbed state. Indeed, there is the expectation from a burgeoning literature base
that proteins ‘denature’ over time 49. Denaturation can include changes in molar free
volume/interfacial area, loss of higher-order structure with concomitant change in specific
bioactivity, and irreversible adsorption. Of course, tensiometric methods are effectively blind to
these molecular processes, except insofar as denaturation may lead to time-varying interfacial
tensions and contact angles. Our measurements achieved, or asymptotically approached, a well-
defined steady-state within the hour observation window applied, suggesting that putative
‘denaturation processes’ either had an insignificant impact on results or occurred significantly
faster/slower than the time frame of experimentation. Given the similarity in adsorption energetics
to hydrophobic LV and SL surfaces among the broad array of proteins studied and the general
expectation that denaturation is a slow process, we are inclined to conclude that either denaturation
did not significantly affect results (perhaps accounting for small-but-measurable differences among
proteins) or the denaturation effect was astonishingly similar among very different proteins. With
regard to irreversible adsorption, we note that experiments examining competitive adsorption
between albumin and IgM at the LV surface demonstrated protein displacement (Vroman effect) that
followed a simple mass-balance exchange 12, strongly suggesting that neither albumin nor IgM was
irreversibly adsorbed to this surface.
213
Page 232
6.7. Appendix
6.7.1. Estimation of maxBC
maxBC was calculated from the slope of an advancing contact angle aθ isotherm ln
a
BCθ∆
∆ and
fitted data (Table 2) by evaluating Eq. A1 at half-maximal change in aθ , which occurs at a bulk-
phase composition / 2 max max 'ln (where / 2 1/2 and )B aC aθ θΘ Θ = Θ Θ ≡ − :
( )/ 2 / 2
''
' *
max max
maxmax / 2
2ln ln ln ln ln
ln ln2
a aa
a aa
BB B B B
B B
RTSC C C C C
C CRTS
θ θθθ θθ
Θ Θ
Θ
⎛ ⎞⎛ ⎞+−⎜ ⎟⎜ ⎟− ⎝ ⎠∆ ⎝ ⎠= − = =∆ ⎡ ⎤ ⎡ ⎤− −⎣ ⎦ ⎣ ⎦
Θ⇒ = +
………..…….. Eq. A1
where the terms 1ln
a
B
SRT C
θ∆⎛ ⎞≡ −⎜ ⎟ ∆⎝ ⎠, and / 2* measured at lna a BCθ θ Θ≡ max '
a aθ θΘ ≡ − . All of the
parameters in the RHS of Eq. A1 are derived from non-linear, least-squares fitting of aθ isotherms to
the four-parameter logistic equation described in the Materials and Methods section. Confidence in
values listed in Table 2 and plotted in Fig. 6 was computed by propagation of the standard
errors in best-fit parameters through Eq. A1, as given by Eq. A2. In consideration of all sources of
experimental error, we conclude that estimates are no better than about 20%.
maxBC
maxln BC
( )max '
2
2'2 2 2 2
2 2ln ln
1
4B a aB
a aSC C SRTS θ θ
θ θ 2σ σ σ σΘ °
° −= + − − σ
⎡ ⎤⎛ ⎞⎢ ⎥⎜ ⎟
⎝ ⎠⎢ ⎥⎣ ⎦ ………….......Eq. A2
where σ ’s represent standard errors in and the best-fit parameters ,maxln BC / 2ln BCΘaθ , '
aθ and as
denoted by subscripts.
S
214
Page 233
6.7.2. Estimation of [ ]sl svΓ − Γ
The apparent Gibbs’ surface excess [ ]sl svΓ − Γ was computed from Eq. 1 of the Theory section for
each of the proteins and surfactants listed in Table 3. The following steps illustrate surface excess
calculations for FV HSA (preparation 1, Table 2) at the solid-liquid (SL) interface. Fit of aθ
isotherm data plotted in Fig. 3 yielded , , , 103.3 0.8oaθ = ± ' 88.3 0.8aθ = ± / 2ln 15.9 0.3BCΘ = ±
and . Inflections in the 14.1 5.7M = − ± aθ curve were located at 1 13.7X = and
(dimensionless), yielding a slope estimate from the finite difference with calculated
uncertainty as
2 10.9X = 'S
' 2.95 0.04deg 0.050 0.007radaSXθ∆
≡ = − ± = − ±∆
;
where 2 1
2and X = X -Xa a aX Xθ θ θ∆ = − ∆ 1 . Values for aθ were calculated from the characteristic
parameters above, conveniently evaluated at where the logistic equation simplifies to / 2ln lnB BC CΘ=
'*
2aa a
aθ θθ θ⎛ ⎞+
= = ⎜ ⎟⎝ ⎠
. Thus, * *103.3 88.3 95.8 ;sin 0.99;cos 0.102a aθ θ *
aθ+
= = = = − . The required
term lvγ was calculated from a comparable logistic equation for lvγ isotherms, using LV fitted
parameters,10,11 but evaluated at as / 2ln ln 11.7B BC CΘ= =
7.3
70.8 46.246.2 61.1mN/m
1 (12.4 /11.7)[ ]lvγ −
−= +
+= .
Using determined from ref. 2179pmol/cmlvΓ = 10, Eq. 1 was computed as
[ ] [ ] [ ]2
2sl 7 12
61.1sin 95.8 /( 0.05) 179cos95.8 145 /
(8.31 10 )(298.15)(10 ) /sv
ergs cmpmol cm
ergs pmol−
⎧ ⎫⎪ ⎪Γ −Γ = − − + =⎨ ⎬×⎪ ⎪⎩ ⎭
Uncertainty in [ ]sl svΓ − Γ was computed by propagation of error into [ ]sl sv∆Γ = Γ −Γ as:
'
2 2 22 2 2 2sin sin
cos sin cosln ln lv
a a lv a lv aa lv a S
B B
d dRT d C RT d C RTγ θ
θ θ γ θ γ θ 2 2aσ σ θ θ σ σ σ
∆Γ Γ= + + Γ + +⎡ ⎤ ⎡ ⎤ ⎡ ⎤⎢ ⎥ ⎢ ⎥ ⎢ ⎥⎣ ⎦⎣ ⎦ ⎣ ⎦
θ
215
Page 234
……………….Eq. A3
where '
lna
B
dSd C
θ≡ .The σ terms for , and lv a Sγ θ ′were computed from
'2 2
2
4lv lv
lvγ
γ γσ σ
σ+
= and '
2 22
4a
a
aθ θθ
σ σσ
+= ; where ', and ,lv lv a a
'γ γ θ θ are fitted parameters from lvγ and
aθ isotherms; as described above. Uncertainty in slope '
'
2 22
2a
S Xaθ θ
σ σσ
+=
∆. Thus, uncertainty in ∆Γ is
given by:
2 2
2 22 2
2
2
5 2
5
sin 95.8 61.1sin 95.8(27) cos
(2.48 10 ) (2.48 10 )
61.1cos95.8 179sin 95.8
(2.48 10 )
( 0.05) (1.88) (5.1 10 ) 95.82
( 0.05) (9.8 10 ) 324.95
18.02
σ
σ
∆Γ
∆Γ
− −
−
−
−
= + +× ×
+×
⎡ ⎤ ⎡ ⎤− ×⎢ ⎥ ⎢ ⎥⎣ ⎦ ⎣ ⎦
⎡ ⎤+ − × =⎢ ⎥⎣ ⎦=
where 7 12 2(8.31 10 )(298.15)(10 ) 2.48 10 /RT − ergs pmol−= × = × .
Thus, [ ] 2sl 145 18 /sv pmol cmΓ −Γ = ± as reported in Table 3 (row 4 column 2).
6.7.3. Estimation of parameters of Ubiquitin and α2-macroglobulin
Parameters for ubiquitin and α2-macroglobulin listed in Tables 2-3 and shown in Figs. 4-6 were
graphical estimates from the steady-state, concentration-dependent aθ curve. Firm values could not
be ascertained by statistical-fitting procedures described in Materials and Methods because surface
saturation was not reached within solubility limits for this protein. Thus, well-defined high
concentration asymptotes, 'aθ were not achieved at physically-realizable concentrations. Hence, aθ
measured at the highest-concentration studied was used as an estimate for 'aθ . Adhesion tensions
were computed accordingly, with graphical estimates from lvγ isotherm as coslv
o oa a
oτ γ= θ and
216
Page 235
' ' 'acos
lvaτ γ θ= / 2ln BCΘ. and ln
a
B
dd C
θ parameters were estimated by graphical location of inflection
points on the aθ curve. These estimates were used in the calculation of and [maxBC ]sl svΓ − Γ
parameters, as described in Appendix 7.1 and 7.2.
217
Page 236
(1) Vogler, E. A. Interfacial Chemistry in Biomaterials Science. In Wettability; Berg, J., Ed.; Marcel Dekker: New York, 1993; Vol. 49; pp 184.
(2) Vogler, E. A. Structure and Reactivity of Water at Biomaterial Surfaces,Adv. Colloid and Interface Sci. 1998, 74, 69.
(3) Dee, K. C.; Puleo, D. A.; Bizios, R. An Introduction to Tissue-Biomaterial Interactions; Wiley-Liss: Hoboken, N.J., 2002.
(4) Zhou, C.; Friedt, J.-M.; Angelova, A.; Choi, K.-H.; Laureyn, W.; Frederix, F.; Francis, L. A.; Campitelli, A.; Engelborghs, Y.; Borghs, G. Human Immunoglobulin Adsorption Investigated by Means of Quartz Crystal Microbalance Dissipation, Atomic Force Microscopy, Surface Acoustic Wave, and Surface Plasmon Resonance Techniques,Langmuir 2004, ASAP Article 10.1021/la036251d S0743-7463(03)06251-6.
(5) Jeon, J.; Superline, R.; Raghavan, S. Quantitative Analysis of Adsorbed Serum Albumin on Segmented Polyurethane Using FT-IR/ATR Spectroscopy,Applied Spectroscopy 1992, 46, 1644.
(6) Graham, D. E.; Phillips, M. C. Proteins at Liquid Interfaces,J. Colloid and Interface Sci. 1979, 70, 415.
(7) Claesson, P. M.; Blomberg, E.; Froberg, J. C.; Nylander, T.; Arnebrant, T. Protein Interactions at Solid Surfaces,Adv. Collid and Interface Sci. 1995, 57, 161.
(8) Brynda, E.; Cepalova, N.; Stol, M. Equilibrium Adsorption of Human Serum Albumin and Human Fibrinogen on Hydrophobic and Hydrophilic Surfaces,J. Biomed. Mat. Sci. 1984, 18, 685.
(9) Wen-Yih Chen, H.-M. H., Chien-Chen Lin, Fu-Yung Lin, and Yu-Chia Chan. Effect of Temperature on Hydrophobic Interaction between Proteins and Hydrophobic Adsorbents: Studies by Isothermal Titration Calorimetry and the van't Hoff Equation,Langmuir 2003, 19, 9395.
(10) Krishnan, A.; Siedlecki, C.; Vogler, E. A. Traube-Rule Interpretation of Protein Adsorption to the Liquid-Vapor Interface,Langmuir 2003, 19, 10342.
(11) Krishnan, A.; Sturgeon, J.; Siedlecki, C. A.; Vogler, E. A. Scaled Interfacial Activity of Proteins at the Liquid-Vapor Interface,J. Biomed. Mat. Res. 2004, 68A, 544.
218
Page 237
(12) Krishnan, A.; Siedlecki, C. A.; Vogler, E. A. Mixology of Protein Solutions and the Vroman Effect,Langmuir 2004, 20, 5071.
(13) Krishnan, A.; Wilson, A.; Sturgeon, J.; Siedlecki, C. A.; Vogler, E. A. Liquid-Vapor Interfacial Tension of Blood Plasma, Serum and Purified Protein Constituents Thereof,Biomaterials 2005, 26, 3445.
(14) Krishnan, A.; Liu, Y.-H.; Cha, P.; Allara, D. L.; Vogler, E. A. Scaled Interfacial Activity of Proteins at a Hydrophobic Solid/Aqueous-Buffer Interface,J. Biomed. Mater. Res. 2005, in press.
(15) Vasquez, M.; Nemethyt, G.; Scheraga, H. A. Conformational Energy Calculations on Polypeptides and Proteins,Chem. Rev. 1994, 94, 2183.
(16) Head-Gordon, T.; Hura, G. Water Structure from Scattering Experiments and Simulation,Chem. Rev. 2002, 102, 2651.
(17) Cramer, C. J.; Truhlar, D. G. Implicit Solvation Models: Equilibria, Structure, Spectra, and Dynamics,Chem. Rev. 1999, 99, 2161.
(18) Garcia de la Torre, J. Hydration from hydrodynamics. General considerations and applications of bead modelling to globular proteins,Biophysical Chemistry 2001, 93, 159.
(19) Harding, S. E. The hydration problem in solution biophysics: an introduction,Biophysical Chemistry 2001, 93, 87.
(20) Durchschlag, H.; Zipper, P. Comparative investigations of biopolymer hydration by physicochemical and modeling techniques,Biophys. Chem. 2001, 93, 141.
(21) Chalikian, T. V.; Breslauer, K. J. On Volume Changes Accompanying Conformational Transistions of Biopolymers,Biopolymers 1996, 39, 619.
(22) Vogler, E. A. How Water Wets Biomaterials. In Water in Biomaterials Surface Science; Morra, M., Ed.; John Wiley and Sons: New York, 2001; pp 269.
(23) Vogler, E. A. Practical Use of Concentration-Dependent Contact Angles as a Measure of Solid-Liquid Adsorption I: Theoretical Aspects, Langmuir 1992, 8, 2005.
219
Page 238
(24) Vogler, E. A. Practical Use of Concentration-Dependent Contact Angles as a Measure of Solid-Liquid Adsorption II: Experimental Aspects, Langmuir 1992, 8, 2013.
(25) Vogler, E. A.; Martin, D. A.; Montgomery, D. B.; Graper, J. C.; Sugg, H. W. A Graphical Method for Predicting Protein and Surfactant Adsorption Properties, Langmuir 1993, 9, 497.
(26) Hook, F.; Kasemo, B. Variations in Coupled Water, Viscoelastic Properties, and Film Thickness of a Mefp-1 Protein Film during Adsorption and Cross-Linking: A Quartz Crystal Microbalance with Dissipation Monitoring, Ellipsometry, and Surface Plasmon Resonance Study,Anal. Chem. 2001, 73, 5796
(27) Hook, F.; Rodahl, M.; Brzezinski, P.; Kasemo, B. Energy Dissipation Kinetics for Protein and Antibody-Antigen Adsorption under Shear Oscillation on a Quartz Crystal Microbalance,Langmuir 1998, 14, 729.
(28) Hook, F.; Voros, J.; Rodahl, M.; Kurrat, R.; Boni, P.; Ramsden, J. J.; Textor, M.; Spencer, N. D.; Tengvall, P.; Gold, J.; Kasemo, B. A comparative study of protein adsorption on titanium oxide surfaces using in situ ellipsometry, optical waveguide lightmode spectroscopy, and quartz crystal microbalance/dissipation,Colloids and Surfaces B: Biointerfaces 2002, 24, 155.
(29) Putnam, F. W. Alpha, Beta, Gamma, Omega - The Roster of the Plasma Proteins. In The Plasma Proteins: Structure, Function, and Genetic Control; Putnam, F. W., Ed.; Academic Press: New York, 1975; Vol. 1; pp 58.
(30) Porter, M. D.; Bright, T. B.; Allara, D. L.; Chidseyi, C. E. D. Spontaneously Organized Molecular Assemblies. 4. Structural Characterization of n-Alkyl Thiol Monolayers on Gold by Optical Ellipsometry, Infrared Spectroscopy, and Electrochemistry,J. Am. Chem. Soc 1987, 109, 3559.
(31) Nuzzo, R. G.; Dubois, L. H.; Allara, D. L. Fundamental Studies of Microscopic Wetting on Organic Surfaces. 1. Formation and Structural Characterization of a Self-Consistent Series of Polyfunctional Organic Monolayers,J. Am. Chem. SOC 1990, 112, 558.
(32) Nuzzo, R. G.; Fusco, F. A.; Allara, D. L. Spontaneously Organized Molecular Assemblies. 3. Preparation and Properties of Solution Adsorbed Monolayers of Organic Disulfides on Gold Surfaces,J. Am. Chem. Soc. 1987, 109, 2358.
(33) Nuzzo, R. G.; Allara, D. L. Adsorption of Bifunctional Organic Disulfides on Gold Surfaces,J. Am. Chem. Soc 1983, Vol. 105, 4481.
220
Page 239
(34) Allara, D. L.; Nuzzo, R. G. Spontaneously Organized Molecular Assemblies. 2. Quantitative Infrared Spectroscopic Determination of Equilibrium Structures of Solution-Adsorbed n -Alkan oic Acids on an Oxidized Aluminum Surface,Langmuir 1985, Vol. 1, 52.
(35) Krishnan, A.; Liu, Y.-H.; Cha, P.; Allara, D. L.; Vogler, E. A. An Evaluation of Goniometric Methods,J. Colloid and Interf. Sci. 2005, in review.
(36) Rosen, M. J. Surfactants and Interfacial Phenomena; Wiley: New York, 1978.
(37) Frommer, M. A.; Miller, I. R. Adsorption of DNA at the Air-Water Interface,J. Phys. Chem. 1968, 72, 2862.
(38) Strey, R.; Vilsanen, Y.; Aratono, M.; Kratohvil, J. P.; Yin, Q.; Friberg, S. E. On the Necessity of Using Activities in the Gibbs Equation,J. Phys. Chem. B. 1999, 103, 9112.
(39) Richards, F. M. Areas, Volumes, Packing and Protein Structure,Ann. Rev. Biophys. Bioeng. 1977, 6, 151.
(40) Lu, J. R.; Su, T. J.; Penfold, J. Adsorption of Serum Albumins at the Air/Water Interface,Langmuir 1999, 15, 6975.
(41) Helfrich, J. P.; Jones, W. R. High-Sensitivity Protein Aggregate Chracterization Using Flow-Mode Static and Dynamic Laser Light Scattering Detection Coupled to a Size Exclusion Chromatograph. In Am. Biotech. Lab, 1999; pp 26.
(42) Helfrich, J. P. Flow-Mode Dynamic Laser Light Scattering Technology for 21st Century Biomolecular Characterization,Am. Biothech. Lab 1998, 16, 64.
(43) Kamyshny, A.; Lagerge, S.; Partyka, S.; Relkin, P.; Magdassi, S. Adsorption of Native and Hydrophobized Human IgG onto Silica: Isotherms, Calorimetry, and Biological Activity,Langmuir 2001, 17, 8242
(44) Brash, J. L. Protein Adsorption at the Solid-Solution Interface in Relation to Blood-Material Interactions. In ACS Symposium Series; American Chemical Society: Washington D. C., 1987; Vol. 343; pp 490.
221
Page 240
(45) Duinhoven, S.; Poort, R.; Voet, G. V. d.; Agterof, W.; Norde, W.; Lyklema, J. Driving Forces for Enzyme Adsorption at Solid-Liquid Interfaces. 1. The Serine Protease Savinase,J. Colloid and Interface Sci. 1995, 170, 340.
(46) Castillo, E.; Koenig, J.; Anderson, J. Protein Adsorption on Hydrogels II. Reversible and Irreversible Interactions Between Lysozyme and Soft Contact Lens Surfaces,Biomaterials 1985, 6, 338.
(47) Wills, P. R.; Comper, W. D.; Winzor, D. J. Thermodynamic Non-ideality in Macromolecular Solutions: Interpretation of Virial Coefficients,Archives of Biochem. and Biophys. 1993, 300, 206.
(48) Knezic, D. Thermodynamic Properties of Supersaturated Protein Solutions. Ph. D., Polytechnic University, 2002.
(49) Birdi, K. S. Lipid and biopolymer monolayers at liquid interfaces; Plenum Press: New York, 1989.
222
Page 241
Table 1: Purified Proteins & Surfactants
NAME OF PROTEIN/SURFACTANT
(acronym)
MOLECULAR WEIGHT
(kDa)
AS-RECEIVED
FORM (mg/mL)
PURITY (electrophoresis)
or ACTIVITY
PHYSIOLOGIC CONCENTRATION
mg/100mL (nominal value)
VENDOR
Prep 1 98% Sigma Aldrich
UBIQUITIN (Ub)
Prep 2
10.7 Powder
95%
10-20 (15)
EMD Biosciences
THROMBIN (FIIa) 35.6 Powder 1411 NIH units/mg N/A Sigma Aldrich
Prep 1 Powder 98% HUMAN SERUM ALBUMIN Fraction V (FV HSA) Prep 2
66.3
Powder 98%
3500-5500 (4500)
MP Biomedicals
PROTHROMBIN (FII) 72 Powder 7.5 units/mg protein 5-10 (7.5)
Sigma Aldrich
Prep 1 Solution (2.1)
FACTOR XII (FXII)
Prep 2
78
Solution (5.5)
95% (4) Hematologic Technologies
HUMAN IgG (IgG) 160 Powder 97% 800-1800 (1300)
Sigma Aldrich
FIBRINOGEN (Fb) 340 Powder 70% clottable protein 200-450 (325)
Sigma Aldrich
COMPLEMENT COMPONENT C1q (C1q)
400 Solution (1.1)
Single band by immunoelectrophoresis
10-25 (17.5)
Sigma Aldrich
Prep 1 Sigma Aldrich
Prep 2 Sigma Aldrich
α2-MACROGLOBULIN
(αmac)
Prep 3
725
Powder
98% 150-350 (250)
MP Biomedicals
Prep 1 Solution (0.8)
98% Sigma Aldrich
HUMAN IgM (IgM)
Prep 2
1000
Solution (5.1)
Single band by immunoelectrophoresis
60-250 (155)
MP Biomedicals
SODIUM DODECYL SULFATE (SDS)
0.28 Powder N/A N/A Sigma Aldrich
TWEEN 20 (TWN20) 1.23 Neat N/A N/A Sigma Aldrich
223
Page 242
TABLE 2: STEADY-STATE PROTEIN ADSORPTION PARAMETERS
NAME OF PROTEIN/SURFACTANT
(acronym) aθ(degrees)
'aθ
(degrees)
/ 2ln BCΘ PPT (pM)
M (dimension-
less)
aτ (mN/m)
'aτ
(mN/m)
maxaΠ
(mN/m)
maxln BC (pM)
Prep 1 100.9±0.5 75 19(17)
-
-14 7 21 19UBIQUITIN (Ub)*
Prep 2 102.2±0.9 75 19(17)
-
-15 12 27 19
THROMBIN (FIIa) 99.8±0.5 84.6±0.9 17.5±0.2 (13.9±0.2)
-25.0±8.5 -12.3±0.6 4.5±0.7 16.7±0.9 15.1±0.2
Prep 1
103.3±0.8 88.3±0.8 15.9±0.3 (11.7±0.3)
-14.1±5.7 -16.3±0.9 1.4±0.6 17.7±1.2 13.6±0.3HUMAN SERUM
ALBUMIN
FV HSA
Prep 2
104.5±0.8 88.5±0.6 15.7±0.3(11.5±0.3)
-11.6±3.0 -17.7±0.9 1.2±.5 18.9±1.1 13.7±0.3
PROTHROMBIN (FII) 100.6±0.5 86.5±0.9 15.1±0.4 (10.8±0.4)
-10.1±2.7 -12.9±0.6 2.6±0.7 15.6±0.9 13.2±0.4
Prep 1 102.9±0.5 94.8±1.0
15.6±0.5 (11.3±0.5)
-17.9±1.2 -15.6 -3.1 12.5 12.7±0.5FACTOR XII*
Prep 2 102.0±0.4 88.2±0.8 15.7±0.4(11.3±0.4)
-10.9±3.3 -14.6 1.2 15.8 13.6±0.4
HUMAN IgG (IgG) 103.7±0.7 94.9±1.4 15.1±0.9(10.1±0.9)
-6.9±4.7 -16.8±0.9 -4.4±1.3 12.4±1.5 13.3±0.9
FIBRINOGEN 103.9±0.6 85.3±.9 15.5±0.3(9.8±0.3)
-6.4±1.3 -16.8±0.8 -3.8±0.8 20.7±1.1 13.2±0.3
COMPLEMENT COMPONENT C1q (C1q)
102.6±0.4 95.3±0.7 15.6±0.4(9.6±0.4)
-12.1±5.6 -15.6±0.5 -5.0±0.7 10.6±0.8 11.4±0.4
Prep 1 101.9±0.5 Prep 2 100.2±0.9
α2-MACROGLOBULIN* (α mac)
Prep 3 103.2±0.5
86
19 (13)
-
-15
4
19
17
Prep 1 102.7±0.6 91.3±1.6 15.5±0.5(8.7±0.5)
-7.4±2.9 -15.7±0.7 -1.1±1.4 14.6±1.6 11.3±0.5HUMAN IgM (IgM)
Prep 2 102.4±0.6 87.8±2.0 15.9±0.6(9.2±0.7)
-4.9±1.6 -15.4±0.7 1.9±1.7 17.3±1.9 12.6±0.8
SODIUM DODECYL SULFATE (SDS) 100.1±1.9 56.0±2.3 17.7±0.4(18.9±0.4)
-17.3±4.6 -12.5±2.3 18.7±1.1 31.2±2.6 21.4±0.4
TWEEN 20 (TWN20) 97.1±0.6 65.1±0.7 16.4±0.3(16.2±0.1)
-23.4±3.3 -8.9±0.8 14.6±0.5 23.5±0.6 17.8±0.1
Notes: * Parameters are graphical estimates of fitted parameters. See Results section.
224
Page 243
TABLE 3: GIBBS’ SURFACE EXCESS Apparent Surface Excess†
(picomoles/cm2) Comparison to Literature values NAME OF
PROTEIN/SURFACTANT (acronym)
SL SV[ ]Γ − Γ
LVΓ
SL SV
LV
[ ]Γ − Γ
Γ
⎧ ⎫⎨ ⎬⎩ ⎭
SLC
(picomoles/cm2)
SL SV
SL
[
CΓ − Γ ]
Technique (Citation)
Prep 1 224 1.3 UBIQUITIN (Ub)* Prep 2 193 1.1
THROMBIN (FIIa) 308±34 1.7±0.3
-
-
-
Prep 1
145±18 0.8±0.2 60 HUMAN SERUM ALBUMIN
FV HSA Prep 2
196±21 1.1±0.2
2.4
80
XR 68
PROTHROMBIN (FII) 146±17 0.8±0.2 - - - Prep 1 136 0.8 FACTOR XII* Prep 2 153 0.9
- - -
4.5
44 QCM 4
HUMAN IgG (IgG) 198±37
1.1±0.3 2.9
66 SAW 4
COMPLEMENT COMPONENT C1q (C1q)
117±28 0.7±0.2 - - -
Prep 1 Prep 2
α2-MACROGLOBULIN*
(αmac) Prep 3
130
0.7
-
-
-
Prep 1 222±42 1.2±0.3 HUMAN IgM (IgM) Prep 2 101±27
179±27
0.6±0.2 - - -
SODIUM DODECYL SULFATE (SDS)
276±14 342±10 1.2±0.2 280
0.98 SPR 69
TWEEN 20 (TWEEN-20) 120±16 455±17 3.8±0.1 120
1.00 SPR 69
Notes:* Parameters are graphical estimates of fitted parameters. See Results section † Apparent or is computed without activity correction (see Theory section).
SL SV[ ]Γ − Γ
LVΓ
225
Page 244
Figure 1: Advancing contact angle isotherms in 3D ( aθ as a function of analysis time (drop age)
and logarithmic (natural) solution concentration ) and 2D (BC aθ as a function of logarithmic
solution concentration at selected times) formats comparing Tween-20 (Panel A ,TWEEN-20,
Table 2), prothrombin (Panel B, FII, Table 2), and immunoglobulin-M (Panel C, IgM, preparation 2,
Table 2) adsorption to a methyl-terminated SAM surface. In each case, solute concentration is
expressed in picomoles/L (pM
BC
BC
) on a natural logarithmic scale. Symbols in 2D panels represent time
slices through 3D representations (filled circle = 0.25 sec, open circle = 900 sec, filled triangles =
1800 sec, and open triangles = 3594 sec; annotations in Panel A indicate maximum and half-
maximum contact angle reduction, maxa
θ and max12 aθ respectively. Notice that adsorption kinetics
dominated IgM adsorption whereas steady-state was achieved within about 1000 sec for FII, and
nearly no adsorption kinetics is detected for Tween-20. Note also decrease in aθ with time,
attributed to slow hydration of the SAM surface (Panel B, arrow annotation; see Results section for
more discussion).
226
Page 245
2 4 6 8 10 12 14 16 18
θ a (d
egre
es)
80
85
90
95
100
105
110
6 8 10 12 14 16 18 20 22 24 26
θ a (d
egre
es)
60
70
80
90
100
110
2 4 6 8 10 12 14 16 18 20
θ a (d
egre
es)
80
85
90
95
100
105
110
adsorption time
A
C
B
lnCB ( CB in pM)
aθ
'aθ
maxaθ
max1
2 aθ
/ 2ln BCΘ
hydration time
lnCB ( CB in pM)
lnCB ( CB in pM)
227
Page 246
Figure 2: Advancing PBS contact angles oaθ (left axis, closed circles) on 1-hexadecane thiol SAMs
on gold decrease monotonically with observation time while liquid-vapor interfacial tension, lvγ
(right axis, open circles) remains constant, suggesting time-dependent “hydration” of the SAM
surface. SAM hydration also affects aθ adsorption isotherms shown in Fig. 1 (arrow annotation,
Panel B). SAM hydration dynamics were separated from protein adsorption kinetics by ‘correcting’
observed change in aθ (closed triangles, corresponding to 40 mg/mL albumin in PBS) for the
decrease in oaθ observed in control experiments with pure buffer (yielding open triangles).
228
Page 247
Time ( seconds)
0 1000 2000 3000 4000
γ lv (m
N/m
)
60
62
64
66
68
70
72
74
θ a (d
egre
es)
90
92
94
96
98
100
102
104
106
108
110
229
Page 248
Figure 3: Sequential interpretation of a steady-state (3600 sec drop age) contact angle adsorption
isotherm for human serum albumin (FV HSA, preparation 2, Table 2); Panel A, advancing contact
angles, aθ ; Panel B, advancing adhesion tension, aτ ; Panel C, advancing spreading pressure aΠ .
Smoothed curves through the data serve as guides to the eye. Annotations identify low- and high-
concentration asymptotes for contact angles ( aθ , 'aθ ), adhesion tensions ( aτ , '
aτ ) and maximum
spreading pressure that are used to characterize isotherms (Table 2). maxaΠ
230
Page 249
ln CB (CB in pM)
2 4 6 8 10 12 14 16 18 20 22
Πa
(mN
/m)
0
5
10
15
20
τ a (m
N/m
)
-15
-10
-5
0
5
θ a (d
egre
es)
80
85
90
95
100
105
110
aθ
'aθ
'aτ
aτ
max 'a a aτ τΠ = −
A
B
C
231
Page 250
Figure 4: Comparison of steady-state spreading pressure aΠ isotherms for selected proteins
spanning three decades in molecular weight (Table 1). Smooth curves are guides to the eye (see
Figs. 1 and 3 for similar plots including authentic data and Table 2 for statistics of fit). Molar
scaling reveals an ordering among diverse proteins, similar to the ‘Traube-rule’ observed for proteins
at the liquid-vapor interface wherein molar concentration required to reach a specified value
decreased with increasing MW (arrow).
aΠ
232
Page 251
lnC B (C B in pM )
2 4 6 8 10 12 14 16 18 20 22
Πa (m
N/m
)
0
5
10
15
20U bFV H SA
C 1q
FII
IgMIgG
233
Page 252
Figure 5: Apparent Gibbs’ surface excess scaled by protein at the solid-liquid (SL)
(
MW
[ ]sl svΓ − Γ , panel A) and the liquid-vapor (LV) interfaces ( lvΓ , panel B) for multiple protein
preparations (open circle = preparation 1, filled circle = preparation 2, filled triangle = preparation 3;
see Tables 1, 3). Panel C plots the ratio of the surface excess parameters yielding [ ]sl ~ 1sv
lv
⎧ ⎫Γ −Γ⎨ ⎬Γ⎩ ⎭
.
Insets expand region and dashed lines represent arithmetic mean of the respective surface
excess values listed in Table 3 (see Appendix 7.2 for sample calculations). Apparent (panel B) is
reproduced 10 for comparison to [
low-MW
lvΓ
]sl svΓ − Γ . Apparent surface excess [ ]sl svΓ − Γ and , as well as
the ratio
lvΓ
[ ]sl sv
lv
⎧ ⎫Γ −Γ⎨ Γ⎩ ⎭
⎬ , were found to be independent of protein (see Theory and Discussion
sections).
MW
234
Page 253
0 200 400 600 800 1000
[ΓSL
- ΓSV
]
Γ L
V
0.5
1.0
1.5
2.0
2.5
IgG
C1q α-mac
IgM
0 20 40 60 800.0
0.5
1.0
1.5
2.0
2.5
3.0
Ub
FIIa
FVHSA FII
UbFIIa
FVHSA FAF HSA
FII
IgG
C1q α-mac IgM
Γ LV
100
200
300
400
0 40 8050
100
150
200
250
300
30 40 50 60 70 80-100
0
100
200
300
[ΓSL
- Γ S
V]
100
200
300
400
IgG
C1q α-mac
IgM
0 20 40 60 80100
150
200
250
300
350
FIIFV HSA
FIIa
Ub
Fb
Fb
Fb
A
B
C
FXII
1.0±0.2
178±26
172±29
FXII
MW (kDa)
App
aren
t Sur
face
Exc
ess (
pico
mol
es/c
m2 )
235
Page 254
Figure 6: Relationship between the surface-saturating bulk solution concentration and protein
(natural logarithmic scale) at the solid-liquid (SL, panel A) and liquid-vapor interfaces (LV,
panel B) for multiple protein preparations (open circle = preparation 1, filled circle = preparation 2,
filled triangle = preparation 3). Error bars represent uncertainty computed by propagation of
experimental errors into compiled values (see Table 2 and Appendix 7.1 for representative
calculations). Panel B is reproduced from 10 for the purpose of comparing the LV and SL interfaces.
Linear regression through the SL data yielded
compared to for the LV interface, consistent
with the expectation of unit slope and a positive intercept (see Theory and Discussion sections). Note
that low-MW proteins require greater bulk-phase concentrations to saturate the interphase than
higher-MW proteins.
maxBC
MW
maxln BC
max 2[ln ( 1.3 0.2) ln (19.8 1.0); 78%]BC MW R= − ± + ± =
max 2[ln ( 1.4 0.2) ln (21.8 1.3); 72%]BC MW R= − ± + ± =
236
Page 255
Solid
-Liq
uid
Inte
rpha
se
lnC
Bm
ax (p
M)
10
12
14
16
18
2 3 4 5 6 7
10
12
14
16
18
Liqu
id-V
apor
Inte
rpha
se
lnC
Bm
ax (p
M)
lnMW (MW in kDa)
FVHSA
FAFHSA
FII
IgG
IgM
C1q
α-mac
FIIaUb
FVHSA
IgG
IgM
C1q
FIIa
Ub
FII FXII
Fb
Fb
A
B
237
Page 256
Figure 7: Time-dependent adhesion tension aτ (Panel A) of pure albumin (circles), pure hIgM
(squares), and a 50:50 mixture of albumin in hIgM (diamonds) at constant 5mg/mL total protein.
Note that aτ of the 50:50 mixture fell between the pure protein solutions. Observed spreading
pressure (Panel B) followed a simple linear combining rule expressed in weight-fraction
protein in the bulk phase ; where
obsΠ
(obs alb IgMfΠ =Π − ∆Π) ( )alb IgM∆Π = Π −Π , or refer to
at 100% albumin ( ) or 100% IgM (
albΠ IgMΠ
obsΠ 0IgMf = 1IgMf = ), respectively. Error bars represent
standard deviation of the mean of the final 25 obsΠ values observed at 1hr equilibration time.
238
Page 257
A
B
Time (seconds)
0 1000 2000 3000 4000
τ a (m
N/m
)
-18
-16
-14
-12
-10
-8
-6
-4
-2
0
2
% FV HSA in IgM
0 20 40 60 80 100
Πob
s (m
N/m
)
4
6
8
10
12
14
16
18
239
Page 258
Glossary of Symbols
BC Bulk solution concentration (moles/volume) maxB
C Bulk solution concentration at limiting interfacial tension or contact angle (moles/volume)
IC Interphase concentration (moles/volume) maxIC Maximal interphase concentration (moles/volume)
/ 2BCΘ Bulk solution concentration at half-maximal-change in contact angle (moles/volume)
slC Independent measure of protein adsorption χ Proportionality constant, / vR rχ ≡ ε Packing efficiency
oadsG∆ Free energy of protein adsorption
lvγ Liquid-vapor (LV) interfacial tension (mN/m)
slγ Solid-liquid (SL) interfacial tension (mN/m)
svγ Solid-vapor (SV) interfacial tension (mN/m)
lvγ Low-concentration asymptote of a concentration-dependent lvγ curve (mN/m)
'lv
γ High-concentration asymptote of a concentration-dependent lvγ curve (mN/m)
lvΓ Apparent Gibbs’ surface excess calculated at the liquid-vapor (LV) interface (moles/area)
[ ]sl svΓ − Γ Apparent Gibbs’ surface excess calculated at the solid-liquid (SL) interface (moles/area)
M Parameter fitted to concentration-dependent lvγ or aθ curve µ Activity-corrected chemical potential P
Partition coefficient, I
B
CP C≡
aΠ Advancing spreading pressure (mN/m) maxaΠ Maximum advancing spreading pressure (mN/m)
vr Protein radius (cm)
R Effective radius (cm), vR rχ≡ RT Product of Universal gas constant and Kelvin temperature (ergs/mol) S
Parameter computed from slope of aθ isotherm 1
lna
B
SRT C
θ∆−=
∆ (moles/area)
aτ Advancing adhesion tension (mN/m) oaτ Low-concentration asymptote of a concentration-dependent aτ curve (mN/m); cos
lv
o oa a
oτ γ θ= 'aτ High-concentration asymptote of a concentration-dependent aτ curve (mN/m); ' ' cos
lva a'τ γ θ=
aθ Advancing contact angle (degrees)
aθ Low-concentration asymptote of a concentration-dependent aθ curve (degrees) 'aθ High-concentration asymptote of a concentration-dependent aθ curve (degrees) *aθ
Advancing contact angle at half-maximal change in aθ isotherm '
* (degrees)2
a aa
θ θθ⎛ ⎞+
= ⎜ ⎟⎝ ⎠
Ω Total interphase thickness (cm)
240
Page 259
Chapter 7
An Evaluation of Methods for Contact Angle Measurement
Abstract
A systematic comparison of Wilhelmy-balance tensiometry (WBT), tilting-plate goniometry (TPG) and
captive-drop goniometry (CDG), using a variety of silane-treated glass surfaces of variable wetting
characteristics is reported. WBT was assumed to be the benchmark of comparison (gold standard).
Advancing angles measured by TPG and CDG were in statistical agreement with corresponding WBT
measurements. In contrast, receding angles from both goniometric techniques were systematically higher
than WBT.
241
Page 260
7.1. Introduction
Investigators seeking to apply standard tools of contact angle and wettability (tensiometry) in
studies of surface phenomena are frequently confronted with a hard choice among a variety of
techniques and instrumentation vendors. Among the many tensiometric methods that have been
developed over the years, contact angle goniometry and Wilhelmy balance tensiometry have
become the standard and most popular methods (see refs. 1-3 and citations therein). In
goniometry, a back-lit drop (silhouette) is optically imaged and the angle subtended by the drop
at the point of solid-liquid contact (on left and right sides) estimated with an optical goniometer
(manual) or by image analysis (computerized). Wilhelmy balance tensiometry measures wetting
forces along the perimeter of a regularly-shaped object (typically a plate or cylinder) as it is
immersed into or emersed from the wetting liquid (see ref. 2 for a brief tutorial). Modern
computerized instrumentation has greatly reduced labor and subjectivity of goniometric and
balance techniques, but there are a number of analytical subtleties that can be easily overlooked
in instrument setup and operation. For example, in goniometry, it is essential to establish an
accurate baseline between the drop and surface and choose the correct point of contact. These
two aspects are intertwined and both require that the observer must be looking down on the drop
at a slight angle above (not below) the horizon. Otherwise, the base of the drop can be cropped
by the horizon and finding the maximum profile width becomes highly ambiguous. In Wilhelmy
balance tensiometry (WBT), buoyancy correction requires accurate knowledge of the wetted
perimeter and point of liquid-plate contact; both of which insist that the test plate or cylinder
enter and exit the fluid perpendicularly.
242
Page 261
Measurement of advancing and receding contact angles, aθ and rθ respectively, is an essential
aspect of tensiometry because these are the two reproducible angles that characterize wetting.
No doubt WBT is the most accurate and least subjective approach to measuring hysteresis
( a rθ θ∆ = − ) because the three-phase (solid-liquid-vapor) line is in wholesale motion, assuring
achievement of maximal aθ and minimum rθ . As a consequence, WBT is a reasonable choice
as a benchmark of comparison for goniometric methods.3 Two goniometric methods widely
applied in commercial instruments to measure aθ and rθ are the captive-drop (CDG) and tilting
plate (TPG) goniometric techniques. In CDG, a drop is held in place on a surface under study
with a fine needle connected to a syringe. Advancing angles aθ are read by slightly filling the
drop, advancing liquid over the surface. Receding angles rθ are read by removing liquid from
the drop, receding liquid from the surface. Maximum aθ and minimum rθ is assured by
incrementally increasing volume added or removed, respectively, until no change in angles is
observed. Care must be taken with CDG to use a needle diameter that is a very small portion of
the drop diameter. We have found that if the needle diameter exceeds a few tens of microns,
drop shape can be significantly affected and introduce serious errors into the estimation of aθ
and rθ . TPG measures left and right sides of a drop as the surface under study is tilted with
respect to the optical axis so fluid accumulates in the leading (advancing) edge of the drop and
drains from the trailing (receding) edge. Maximum aθ and minimum rθ are attained when the
drop is at a point of ‘incipient motion’; that is, just at the point when the drop rolls out of the
observation window. Needless to say, finding the point of incipient motion is experimentally
inconvenient. A typical remedy for a particular surface under investigation is to plot observed
contact angle against tilt angle to find a tilt smaller than required to induce drop rolling yet large
243
Page 262
enough that an incremental increase or decrease in tilt does not observably change left-and-right
angles. Thus, finding maximal aθ and minimum rθ is yet another subtlety of the goniometric
methods that warrants verification against WBT for stringent work. Lander et. al.3
systematically compared hysteresis measured by CDG and TPG to WBT using a
hexadecylsilane-coated glass and silicon wafers as a model surface. Using a multiplicity of
similarly-prepared surfaces and hundreds of contact angle measurements, Lander found that
WBT and TPG gave statistically-identical results whereas CDG consistently underestimated aθ
and over estimated rθ .
Primary objective of this paper is to expand on the work of Lander et. al. by comparing
goniometric technique (CDG and TPG) hysteresis measurements to Wilhelmy-balance
tensiometry (WBT) using a variety of surfaces spanning a broad range of water wettability. We
find good agreement among CDG, TPG, and WBT in measured advancing angles aθ ,
corroborating Lander’s results. However, in contrast to Lander’s findings, receding contact
angles rθ measured by both CDG and TPG were found to be systematically offset from that of
WBT and were highly variable relative to aθ measurements. Thus, this work recommends
neither CDG nor TPG for accurate measurement of receding contact angles or contact angle
hysteresis.
7.2. Materials and Methods
Surfaces: Glass cover slips (Fisher Brand 22 x 30 x 0.1 mm) were used as substrata for the
comparative analysis of contact angle measurements between tilting-plate goniometry (TPG),
captive-drop goniometry (CDG) and Wilhelmy-balance tensiometry (WBT). As-received slides
244
Page 263
were cleaned by 3X sequential rinses in each of water, isopropanol and chloroform, and plasma-
discharge treated for ~5min in a Harrick Plasma cleaner (Ossining, NY) at 100 mTorr air.
Distilled-deionized (18.2 MΩ-cm) water was used as test-solution for contact angle
measurements. Surfaces of varying water wettability (50o< aθ <120o) were prepared by
silanization of clean glass cover slips. Three kinds of hydrophobic surfaces were prepared using
(i) octadecyltrichlorosilane (OTS; aθ ~110o), (ii) aminopropyltriethoxysilane (APTES; aθ ~70o)
and (iii) 0.2% solution of 1, 1, pentadecafluorooctylmethacrylate in trichlorotrifluoroethane
(NYEBAR; aθ ~120o; commercial fluorocarbon polymer coating fluid; Nye Lubricants,
Fairhaven MA). Clean glass coverslips were silanated by a 2 hr reaction with 5% OTS in
chloroform or 5 min reaction with 2% APTES in acetone. Silanated glass slides were 3X rinsed
in chloroform (OTS) or acetone (APTES) before being cured in a vacuum oven at 110oC for 24
hr to ensure stable surface chemistry. NYEBAR surfaces were prepared by immersing OTS
surfaces in NYEBAR solution for about 10 min with subsequent air-drying. Surfaces with
incrementally-increasing wettability (90o> aθ >45o) were prepared by chemical oxidation of OTS
surfaces. Cured OTS surfaces were immersed at 5-minute intervals in 50% solution of
H2SO4/Cr2O3 in water, followed by 3X sequential wash in ethanol, and air drying.
Tensiometry: Wilhelmy-balance tensiometry (WBT) was performed using a commercial
computer-controlled instrument (Camtel CDCA 100, Royston UK) using solvent-and-plasma-
discharge-cleaned glass coverslips as the plate. The balance was calibrated with standard
weights thereby accounting for local variation in the force of gravity. No attempt was made to
thermostat the balance and all reported measurements were made at ambient laboratory
temperature. Also, no attempt was made to correct for the (presumably small but not measured)
245
Page 264
variation in the perimeter of the glass coverslips. Solutions (approximately 10 mL) were
contained in disposable polystyrene beakers (Fisher) previously determined not to measurably
affect interfacial tension of water contained therein. Advancing and receding contact angles
were calculated from the last of three immersion and emersion force measurements respectively,
using a force-balance equation corrected for buoyancy (by extrapolation to zero volume);
coslvf Pγ θ= ; where is the force in mN, f lvγ is the surface tension of water at 71.9 mN/m at
25 ºC, is the perimeter (wetted length) of the glass coverslip (44.2mm, for a thickness of
0.1mm) and
P
θ is either advancing ( aθ ) or receding ( rθ ) contact angle.
Goniometry: Tilting-plate goniometry (TPG) was performed using a commercial-automated
goniometer (First Ten Angstroms Inc., Portsmouth, VA). The tilting-plate goniometer (TPG)
employed a Tecan liquid-handling robot to aspirate 12 µL of water contained in a 96-well
microtiter plate. The robot was used to reproducibly transfer the tip with fluid contents into a
humidified (99+ % RH) analysis chamber and dispense 10 µL drops onto the surface of test
substrata (see below) held within the focal plane of a magnifying camera. These and all other
aspects of TPG were performed under computer control. Proprietary algorithms supplied by the
vendor were used to deduce contact angles from drop images captured at a programmed rate by a
frame grabber. Typically, 300 images were captured at a rate of 1 image every 6 sec following
0.25 sec delay to permit vibrations of the expelled drop to dampen. Drop evaporation rates
within the humidified chamber deduced from computed-drop volumes (based on image analysis)
were approximately 25 nL/min for pure water. Precision of aθ was about 0.5o based on repeated
measurement of the same drop. The analysis chamber was thermostated to a lower-limit of 25±1
oC by means of a computer-controlled resistive heater. Upper-temperature limit was not
246
Page 265
controlled but rather floated with laboratory temperature, which occasionally drifted as high as
29 oC during summer months. Thus, reported aθ values were probably not more accurate than
about 1o on an inter-sample basis considering the small, but measurable, variation of water
interfacial tension with temperature. Test substrata were held on a rotating, tilting-plate platform
driven by stepper motors under computer control. Substrata were allowed to come to
equilibrium within the sample-chamber environment for no less than 30 min before contact angle
measurements were initiated. The platform was programmed to tilt at 1o/sec from horizontal to
25o after the drop was deposited on the surface by the robot. The first 120 sec (20 images)
monitored evolution of the advancing angle.
Captive-drop goniometry (CDG) was implemented using a home-built goniometer, as described
elsewhere.4 Briefly, CDG involved capturing the droplet on the test surface with a fine needle
connected to a 50µL syringe. aθ or rθ was read by adding or withdrawing water from the drop,
respectively. Contact angles were measured from images captured by a CCD camera when
observable motion had ceased.
7.3. Results and Discussion
Table 1 collects advancing ( aθ ) and receding ( rθ ) contact angles of water on silane-treated and
surface-modified, silane-treated glass coverslips with varying water-wettability created for the
purpose of comparing goniometric techniques (see Materials and Methods). Fig. 1 compares
goniometry (TPG and CDG) to WBT where data falling along the diagonal corresponds to
perfect agreement among techniques. Inspection of the data trends reveal that aθ measured by
247
Page 266
goniometric methods were in close agreement with WBT (and therefore regarded accurate) but
rθ was more noisy and systematically offset from WBT (and therefore regarded not accurate).
We attribute failure to achieve a stable lower-bound rθ to a three-phase-line-pinning
phenomenon5-7 that requires wholesale drop motion to overcome energetic barriers to formation
of a uniform drop perimeter.
7.4. Conclusions
No single contact angle adequately characterizes wettability of a surface. Instead, a maximal
advancing angle aθ and minimum receding angle rθ are required, with a range of metastable
contact angles observable between these two bounds. An important question that arises in
detailed analysis of contact angles and in choice among contact angle methods asks which
technique offers the most accurate and precise measures of contact angle hysteresis.
Comparison of aθ measured by tilting-plate goniometry (TPG) and the popular captive drop
goniometry (CDG) to Wilhelmy balance tensiometry (WBT) confirms statistical agreement
among methods for aθ . However, rθ measurements by TPG and CDG were systematically
offset from the benchmark WBT and exhibited greater variability.
248
Page 267
Citations
(1) Martin, D. A.; Vogler, E. A. Immersion Depth Independent Computer Analysis of
Wilhelmy Balance Hysteresis Curves,Langmuir 1991, 7, 422.
(2) Vogler, E. A. Interfacial Chemistry in Biomaterials Science. In Wettability; Berg,
J., Ed.; Marcel Dekker: New York, 1993; Vol. 49; pp 184.
(3) Lander, L. M.; Siewierski, L. M.; Brittain, W. J.; Vogler, E. A. A Systematic
Comparison of Contact Angle Methods,Langmuir 1993, 9, 2237.
(4) Bain, C. D.; Troughton, E. B.; Tao, Y.-T.; Evall, J.; Whitesides, G. M.; Nuzzo, R.
G. Formation of Monolayer Films by the Spontaneous Assembly of Organic Thiols from Solution
onto Gold,J. Am. Chem. Soc. 1989, 111, 321.
(5) Sauer, B. B.; Carney, T. E. Dynamic Contact Angle Measurements on Glass
Fibers Influence of Fiber Diameter on Hysteresis and Contact Line Pinning,Langmuir 1990, 6,
1002.
(6) Gennes, P. G. d. Wetting: Statistics and Dynamics,Rev. Mod. Phys. 1985, 57,
827.
(7) Woodward, J. T.; Gwin, H.; Schwartz, D. K. Contact Angles on Surfaces with
Mesoscopic Chemical Heterogeneity,Langmuir 2000, 16, 2957.
249
Page 268
TABLE 1: Comparison Of Contact Angle Measurements by Tilting-Plate (TPG), Captive-Drop Goniometry (CDG) and Wilhelmy-Balance Tensiometry (WBT). Surface Method θa WBT θr WBT θa TPG
(% diff from θa WBT)
θr TPG (% diff from
θr WBT)
θa CDG (% diff
θa WBT)
θr CDG(% diff
θr WBT 1a Nyebar* on OTS 120.1 84.1 120.2
(-0.1) 116.5 (38.5)
112.6 (-6.3)
81.4 (-3.1)
2a OTS 100.0 71.9 99.1 (-0.9)
96.0 (33.5)
96.1 (-3.9)
91.0 (26.6)
2b OTS 109.1 75.7 102.9 (-5.6)
95.1 (25.6)
105.4 (-3.5)
87.7 (15.9)
2c OTS 101.8 78.8 102.6 (0.8)
91.5 (16.1)
100.4 (-1.3)
91.5 (16.2)
2d OTS 101.2 79.8 99.6 (-1.5)
91.1 (14.1)
98.5 (-2.6)
92.2 (15.4)
3a APTES 76.4 44.3 73.4 (-3.9)
60.9 (37.5)
85.7 (12.2)
63.2 (42.6)
3b APTES 74.9 34.9 72.7 (-2.9)
63.3 (81.1)
69.7 (-7.1)
44.4 (26.9)
3c APTES 76.3 44.2 71.6 (-6.1)
70.1 (58.6)
72.1 (-5.6)
61.8 (39.7)
4a Oxidized OTS1†
5min 77.3 53.5 70.3
(-9.0) 61.4
(14.9) 75.2
(-2.75) 54.1 (1.2)
4b Oxidized OTS† 5min
93.1 56.1 92.6 (-0.5)
82.1 (46.3)
87.4 (-6.2)
80.1 (42.8)
5a Oxidized OTS†
10min 58.5 30.0 56.5
(-3.4) 33.0
(10.1) 58.3 (-0.4)
42.6 (42.2)
5b Oxidized OTS†
10min 82.1 58.5 76.4
(-6.9) 65.4
(11.8) 71.9
(-12.5) 54.6 (-6.6)
6a Oxidized OTS†
15min 51.6 28.2 50.2
(-2.6) 21.2
(-24.6) 48.6 (-5.7)
22.4 (-20.7)
6b Oxidized OTS†
15min 76.1 59.4 72.0
(-5.4) 68.4
(15.0) 66.5
(-12.7) 53.4
(-10.1) 7a Oxidized OTS†
20min 50.2 25.2 51.0
(1.6) 34.0
(36.0) 49.7 (-0.8)
32.2 (27.8)
7b Oxidized OTS†
20min 70.3 44.0 71.1
(1.1) 66.0
(49.9) 79.5
(12.9) 69.0
(56.8) 8a Oxidized OTS†
25min 48.4 23.1 48.0
(-0.8) 31.3
(35.5) 45.6 (-5.8)
35.7 (54.7)
8b Oxidized OTS†
25min 71.8 39.8 62.9
(-12.4) 59.9
(50.4) 64.9 (-9.5)
46.1 (15.6)
Notes: * 1, 1, pentadecafluorooctylmethacrylate deposited on OTS-treated glass. † Octadecyltrichlorosilane (OTS) treated glass-slide dipped in CrO4/H2SO4 solution for specified times.
250
Page 269
Figure 1: Comparison of advancing ( aθ , panel A) and receding ( rθ , panel B) contact angles from
goniometric techniques – tilting-plate (TPG, closed circles) and captive-drop (CDG, open circles), to
Wilhelmy-balance tensiometry (WBT). Diagonal lines correspond to ideal 1:1 correlation between
the techniques. aθ measured by goniometric methods (TPG and CDG) were in statistical agreement
with WBT, whereas rθ measurements were systematically offset from WBT. Linear regression
through advancing angles of TPG and CDG vs. WBT (panel A) yielded
and
respectively. Corresponding results for receding
angles (panel B) of TPG and CDG vs. WBT yielded
and respectively.
2[ (0.99 0.03) ( 2.3 2.9); 98%]TPG WBTa a Rθ θ= ± + − ± =
2[ (0.93 0.06) (2.2 5.0); 94%]CDG WBTa a Rθ θ= ± + ± =
2[ (1.2 0.1) (5.3 6.5); 83%]TPG WBTr r Rθ θ= ± + ± =
2[ (0.9 0.1) (10.1 6.7); 78%]CDG WBTr r Rθ θ= ± + ± =
251
Page 270
θa (WBT)
40 60 80 100 120 140
θ a (T
PG
and
CD
G)
40
60
80
100
120
140
A
θr (WBT)
20 30 40 50 60 70 80 90
θ r (T
PG
and
CD
G)
20
30
40
50
60
70
80
90
B
252
Page 271
Chapter 8
Interfacial Energetics of Blood Plasma and Serum at a Hydrophobic Solid/Aqueous-Buffer Interface
Abstract
Adsorption isotherms of blood plasma and serum derived from four different mammalian species (human,
bovine, ovine and equine) confirm that interfacial energetics of protein adsorption to a hydrophobic solid-
water (solid-liquid, SL) interface are not fundamentally different than adsorption to the water-air (liquid-
vapor, LV) interface. Comparison of results to a previously-published survey of purified human-blood
proteins at the two surfaces reveals that interfacial energetics of plasma and serum is strikingly similar to
that of purified protein constituents at both LV and SL surfaces. Adsorption isotherms constructed from
concentration-dependent advancing contact angles aθ and adhesion tensions aτ of buffered-plasma and -
serum solutions on methyl-terminated, self-assembled monolayer surfaces show that maximum advancing
spreading pressure, , falls within a relatively narrow maxaΠ max15 25a< Π < mN/m band, mirroring results
obtained at the LV surface. It is thus concluded that any combination of blood-protein constituents will
be substantially similar because concentration-dependence ln
a
B
dd C
τ of individual proteins are very similar.
Experimental results are further interpreted in terms of a recently-developed theory emphasizing the
controlling role of water in protein adsorption. Accordingly, a hydrophobic interphase saturates with
protein adsorbed from bulk solution at a fixed weight-volume concentration (~436 mg/mL) independent
of protein identity or mixture. As a direct consequence, ln
a
B
dd C
τ of purified proteins closely resembles that
of mixed solutions and does not depend on the relative proportions of individual proteins comprising a
mixture. Thus variations in the plasma proteome between species are not reflected in ln
a
B
dd C
τ nor is serum
different from plasma in this regard, despite being depleted of coagulation proteins (e.g. fibrinogen).
253
Page 272
8.1. Introduction
Significant challenge of work outlined in this thesis has been to understand and interpret protein
adsorption from multi-component solutions onto solid surfaces of more practical relevance to
biomaterials. A common theme in studies of competitive nature of protein adsorption has been
the need to elucidate specific interactions between diverse surfaces and different plasma proteins.
Early observations include the “Vroman effect” (see refs. 1-21 and citations therein) wherein Leo
Vroman observed that adsorption from plasma or serum occurred through a complex series of
adsorption-displacement steps in which low-molecular-weight (MW) proteins arriving first at a
surface are displaced by relatively higher MW proteins arriving later. Bagnall and coworkers22-24
preceded Vroman with both in vitro and in vivo measurements of interfacial tensions (solid-
liquid, liquid-vapor) of plasma proteins (purified albumin, IgG and binary mixtures thereof)
reporting constant free energies of adsorption at model hydrophobic surfaces including implant
polymers. Even clinical interest in the water-air (liquid-vapor, LV) interfacial tension lv
γ of
blood plasma and serum can be traced back at least eight decades to comprehensive studies from
Morgan and Woodward25 on human serum and later, by Harkins26,27 and DuNouy28,29 on
appropriate methods for equilibrium lv
γ measurements of biological fluids. A detailed review of
early literature has already been outlined in our recent work30 on water-air (liquid-vapor, LV)
interfacial tensions of blood plasma and serum from four different species. Biomaterials research
has since explored protein adsorption from plasma/serum solutions at varying levels of molecular
complexity using a multitude of techniques including ellipsometry31, internal reflection
spectroscopy21 and surface plasmon resonance32.
254
Page 273
What is apparently lacking in this expansive literature base is a unifying theory applicable to
both mass and energy inventories of protein adsorption from purified protein solutions as well as
whole-blood plasma and serum. Our recent investigations on adsorption energetics of nine
purified proteins (spanning three-orders-of-magnitude) revealed remarkable
scaling relationships at two hydrophobic surfaces (liquid-vapor, LV and solid-liquid, SL).
Significant experimental outcomes from both single protein solutions33,34 as well as complex
protein mixtures30,35 were rationalized using a tractable quasi-thermodynamic theory of protein
adsorption based on simple close-packing of protein molecules within a three-dimensional
interphase.
This paper supplements previous work with adsorption energetics of whole-blood plasma and
serum from human and animal species to a well-defined, hydrophobic solid-water (solid-liquid,
SL) interface. Time-and-concentration-dependent contact angles are used to compare interfacial
energetics of plasma and serum with purified proteins, in a manner that parallels previous
studies30,33-37 of protein adsorption to the LV surface. Similarity in adsorption energetics revealed
in this and previous work, not only among purified proteins33,34,36,37 but also for multi-protein
mixtures30,35 such as plasma and serum at two hydrophobic surfaces, is remarkable in view of the
substantial differences in plasma proteome across species. 38 Furthermore, work outlined in this
paper accommodates principal outcomes from our theory of competitive protein adsorption33,35
previously confirmed at the LV surface.
255
Page 274
8.2. Materials and Methods
Plasma/Serum: Human platelet-poor plasma (citrated) was prepared from outdated (within 2
days of expiration) lots obtained from the Hershey Medical Center Blood Bank. Human serum
was prepared in 15 mL batches by recalcification with 0.1 M CaCl2 at 5:1 v/v plasma:calcium
ratio in clean glass scintillation vials for about 15 min. Bovine, ovine and equine plasma and
serum were used as received from Hemaresource and Supply Inc. (Aurora, OR) and were not
subject to any additional fractionation/purification steps. Ref. 34 discloses details of protein
purity and protein-solution preparation including serial dilutions of protein stock solutions
(usually 10 mg/mL) that were performed in 96-well microtiter plates by (typically) 50:50
dilution in phosphate buffered saline solution (PBS) prepared from powder (Sigma Aldrich) in
distilled-deionized (18 MΩ) water (interfacial tension of PBS and water was checked
periodically by Wilhelmy-balance tensiometry).
Surfaces: Methyl-terminated self assembled monolayer surfaces (SAMs) were prepared
according to standard methods of surface engineering. Details involved have been reported
elsewhere.39-43 Alkanethiol (Aldrich Chemical Co., Milwaukee, WI) and ethanol (commercial
reagent-grade) were used as-received, without further purification. Samples were stored in the
thiol solution until use, and were rinsed with ethanol just prior to an experiment.
Tensiometry & Goniometry: Liquid-vapor interfacial tensions required by this work were
measured by Pendant Drop Tensiometry (PDT) as described in refs. 34,35,44,45. Contact angle and
wettability methods applied in this work have been disclosed in detail elsewhere, including
verification that measured advancing angles ( aθ ) were in statistical agreement with that obtained
256
Page 275
by Wilhelmy balance tensiometry.36,46 Receding angles ( rθ ) were shown to be not as reliable as
aθ . Consequently, only aθ was analyzed in this work. Briefly, for the purposes of this paper, aθ
measurements were made using a commercial automated tilting-plate goniometer (TPG, First
Ten Angstroms Inc., Portsmouth VA). The goniometer employed a Tecan liquid-handling robot
to aspirate 12 µL of solutions contained in a 96-well microtiter plate prepared by the serial-
dilution protocol mentioned above. The robot was used to reproducibly transfer the tip with fluid
contents into a humidified (99+ % RH) analysis chamber and dispense 10 µL drops of protein
solution onto the surface of test substrata held within the focal plane of a magnifying camera.
These and all other aspects of tilting-plate goniometry were performed under computer control.
Proprietary algorithms supplied by the vendor were used to deduce contact angles from drop
images captured at a programmed rate by a frame grabber. Typically, 600 images were captured
at a rate of 1 image every 6 sec following 20 sec delay to permit vibrations of the expelled drop
to dampen. Precision of aθ was about 0.5o based on repeated measurement of the same drop.
The analysis chamber was thermostated to a lower-limit of 25±1 oC by means of a computer-
controlled resistive heater. Thus, reported aθ values were probably not more accurate than about
1o on an inter-sample basis considering the small, but measurable, variation of water interfacial
tension with temperature. This range of accuracy was deemed adequate to the conclusions of this
report which do not strongly depend on more highly accurate aθ that is difficult to achieve on a
routine basis. Instead, veracity of arguments raised herein depend more on a breadth of reliable
measurements made across the general family of human proteins.
257
Page 276
Test substrata were held on a rotating, tilting-plate platform driven by stepper motors under
computer control. Substrata were allowed to come to equilibrium within the sample-chamber
environment for no less than 30 min before contact angle measurements were initiated. The
platform was programmed to tilt at 1o/sec from horizontal to 25o after the drop was deposited on
the surface by the robot. The first 120 sec (20 images) monitored evolution of the advancing
angle. At the end of the 1 hr aθ measurement period, the platform was programmed to return to
horizontal and rotate 15o to the next analysis position along the periphery of the semiconductor
wafer. This process was repeated for all dilutions of the protein solution under study so that
results reported for each plasma/serum were obtained on a single test surface, eliminating the
possibility of substratum-to-substratum variation within reported results. We observed that the
contact angle of a pure PBS droplet slowly decreased with time from the initial value of
108º< oaθ <106º at t = 0 to 104º< o
aθ <102º at t = 1 hr; where oaθ is the pure buffer contact angle
and the range of reported results corresponds to all of the 8 methyl-terminated SAM surfaces
analyzed during the course of this work. We attribute this systematically-varying wettability to
slow “hydration” of SAM surfaces, which may include dissolution of thiol from the surface into
solution, but have no specific proof this was the cause. We do not believe this slight but
apparently unavoidable attribute of thiol-SAMs on silicon wafers negatively affects the veracity
of conclusions drawn herein which were based on final, steady-state measurements made at ~ 1
hr analysis time.
Computation and Data Representation: Computational, statistical, and theoretical methods
used in this work have been discussed in detail elsewhere.47-49 In brief, time-dependent aθ data
corresponding to protein dilutions (see above) were recovered from TPG files and correlated
258
Page 277
with concentrations, leading to a matrix of results with row values representing concentration
and time (in sec) as column values. It was generally observed that aθ isotherms were sigmoidal
in shape when plotted on logarithmic-concentration axes,47,49 with well-defined low-
concentration asymptotes oaθ and high-concentration asymptotes '
aθ (see Fig. 1 for examples).
Successive non-linear least-squares fitting of a four-parameter logistic equation
''
/ 21 (ln / ln )[ a a
a MB BC Cθ θ ]aθ θΘ
−=
++ to contact angle isotherms data for each time within the
observation interval quantified oaθ and '
aθ parameters with a measure of statistical uncertainty.
Fitting also recovered a parameter measuring concentration-at-half-maximal-change in aθ ,
/ 2 max max 'ln (where / 2 1/2 and )BC a aθ θΘ Θ = Θ Θ ≡ − , as well as a parameter M that measured
steepness of the sigmoidal curve. This multi-parameter fitting to concentration-dependent aθ
data was a purely pragmatic strategy that permitted quantification of best-fit protein and
surfactant characteristics but is not a theory-based analysis.47-49 Three-dimensional (3D)
representations of time-and-concentration aθ data were created in Sigma Plot (v8) from the data
matrix discussed above and overlain onto fitted-mesh data computed from least-squares fitting.
Two-dimensional (2D) representations were created from the same data matrices at selected
observation times. Measured aθ were converted to advancing adhesion tension coslva aτ γ= θ for
general interpretation;49 where lvγ is the interfacial tension of the contact-angle fluid. Adhesion
tensions coslv
o oa
oaτ γ= θ '
a (pure saline) and ' ' coslvaτ γ= θ (at the minimum contact angle observed
'aθ ) were computed with fitted parameters
lvγ and '
lvγ reported in ref. 34 for the proteins under
investigation. Smoothed adhesion-tension isotherms ( aτ vs. l ) were computed from n BC
259
Page 278
smoothed aθ obtained from aθ isotherms above, using smoothed lvγ values computed from best-
fit parameters reported in ref. 34. Likewise, smoothed spreading pressure isotherms
( vs. ) were computed from smoothed aΠ ln BC aτ curves where ( )a a aτ τΠ ≡ − .
8.3. Results
Contact-Angle Isotherms: The principal experimental observations of this work were time-
and concentration-dependent solid-water (solid-liquid, SL) contact angles aθ of human and
animal (bovine, ovine, equine) blood plasma and serum. aθ of serially-diluted, whole plasma or
serum was measured using tilting-plate goniometry (TPG) as detailed in the Materials and
Methods section, resulting in graphical constructions herein referred to as ‘ aθ curves’. Table 1
compiles quantitative results of this work. Contact angle parameters oaθ , '
aθ , and
listed in cols 2-5 of Table 1 are the mean fitted values corresponding to final 25
/ 2ln BCΘ
M aθ curves
recorded within the 60-minute time frame of the TPG experiment. Listed error is standard
deviation of this mean. Corresponding adhesion tensions aτ and 'aτ (Columns 6, 7) were
computed from oaθ and '
aθ values, respectively, with uncertainty estimates computed by
propagation of error in aθ and lvγ measurements (Methods and Materials). Maximum “spreading
pressure” (max 'a a )aτ τΠ ≡ − (Column 8) was computed directly from aforementioned aτ values
and associated uncertainty again estimated by propagation of error.
Figure 1 compiles representative TPG results for human (HS, panel A), bovine (BS, panel B),
and equine blood serum (ES, panel C). Concentration-dependent aθ was observed to follow a
260
Page 279
sigmoidal-like function on logarithmic concentration axis; yielding parameters oaθ , '
aθ ,
and when statistically-fit to a four-parameter logistic equation as described in Materials and
Methods. In each case represented in Fig. 1,
/ 2ln BCΘ
M
aθ was observed to change with time to a final,
steady state 'aθ value. Dynamics were undoubtedly due to protein mass-transfer and adsorption-
kinetic effects. We also note that the phenomenon of “SAM hydration” discussed previously,
affects measurement of protein-solution contact angles because we observed that the whole
contact angle isotherm ( aθ vs. concentration) slowly shifted lower with time (see Fig. 1B).
Observation of time-dependence was important in this particular work only in so far as data
demonstrate that aθ dynamics dampen within the time frame of experimentation, achieving or
approaching steady-state (equilibrium) within the 1 hr observation window. In fact, data
collected in Table 1 refers only to steady-state measurements.
Adhesion-Tension and Spreading-Pressure Isotherms: Figure 2 traces sequential
interpretation of steady-state (1 hr drop age), concentration-dependent aθ data (Panel A) in terms
of concentration-dependent aτ (Panel B) and spreading pressure aΠ (Panel C) for human serum
(HS). Smooth curves through the data serve as guides to the eye. Steady-state (equilibrium)
spreading pressure isotherms were used as the basis of comparison of protein adsorption for
the compounds listed in Table 1. Fig. 3 graphically compares steady-state concentration-
dependent data (SL interface, panel A) to
aΠ
aΠ lvγ (LV interface, panel B) between a purified
protein, human immunoglobulin-G (IgG, MW=160kDa) to human plasma and serum on a single
set of axis where the surrounding band(s) represents 99% confidence intervals around the best-fit
human-plasma data listed in Table 1. It is clearly evident that concentration-dependent aΠ or
261
Page 280
lvγ of IgG, plasma and serum cannot be confidently distinguished based on this data. Fig. 4 is
similar in construct to Fig. 3 in that it graphically compares representative TPG steady-state aΠ
curves (SL interface, panel A) to lvγ (LV interface, panel B) for human, bovine, ovine and
equine plasma on a single set of axis. Again, the surrounding band encloses data within 99%
confidence intervals around the best-fit human-plasma data listed in Table 1. Figs. 1-4
collectively show that there is a striking similarity in interfacial energetics at two hydrophobic
surfaces ( or aΠ lvγ ) between whole-blood plasma, serum and purified-protein constituents.
Serum, of course, is compositionally distinct from plasma by virtue of being depleted of
fibrinogen in the process of coagulating plasma.
8.4. Discussion
Concentration-Dependent of Plasma, Serum, and Protein Constituents Thereof:
Similarity in concentration-dependent
aΠ
aΠ of blood plasma and serum obtained from normal
donors of diverse species is very intriguing in light of the substantial differences in protein
composition. Observations collected in Figs. 1-4 corroborating general trends of experimental
work dating back to the early 1900’s25,27,29,50,51 are all the more compelling in light of our recent
findings that ln
a
B
dd C
τ of a broad range of purified blood-protein constituents are likewise similar
34. Furthermore, we find that the saturating spreading pressures falls within a relatively
narrow 5 mN/m band characteristic of all proteins and mixtures studied. Experiment thus
suggests that
maxaΠ
lna
B
dd C
τ of any combination of blood-proteins is very similar because ln
a
B
dd C
τ of
individual protein constituents are very similar 34,44. All taken together, we find this evidence
262
Page 281
suggestive of a heretofore unresolved mechanistic commonality underlying protein adsorption
from complex mixtures to a hydrophobic surface.
Our recently-developed theory of protein adsorption to two hydrophobic surfaces (liquid-vapor,
LV and solid-liquid, SL surfaces) 44 asserts that the mechanistic commonality mentioned above
is the behavior of water at interfaces 52-54. Theory suggests that interfacial capacity for protein is
controlled by the extent to which interfacial water can be displaced by adsorbing protein
molecules. This maximal interfacial capacity can be expressed either as a maximal volume
fraction or, equivalently, a maximum weight/volume (not molar) concentration denoted at
which
maxIW
'aτ occurs. Calibration of theory to experimental neutron-reflectivity or light scattering
data has revealed that ~ 436 mg/mL, corroborating the conclusion drawn from diverse
literature sources that adsorbed protein concentrations can be surprisingly large 52. Importantly,
is found not to be dependent on protein identity or MW but rather is a generic, water-
limited adsorption capacity for protein. Furthermore, can be attained by any mixture of
proteins, which is of relevance in the interpretation of concentration-dependent interfacial
tensions (
maxIW
maxIW
maxIW
lvγ ) or adhesion tensions ( aτ ) of multi-component protein mixtures such as blood
plasma or serum, as further discussed below.
First, fixed immediately explains the experimental observation that maxIW aΠ curves for diverse
purified proteins spanning three decades of MW appear more similar than dissimilar when scaled
on a w/v basis 44. Serial dilution of a protein solution at surface-saturating concentration
exhibiting the characteristic adhesion tension maxIW '
aτ will trace similar concentration
263
Page 282
dependence because ln
a
B
dd C
τ of individual proteins are very similar. Second, fixed
rationalizes the experimental observation that
maxIW
aΠ curves for plasma and serum are substantially
similar, regardless of species. At 60-85 mg/mL total protein (including fibrinogen) 55, plasma
and serum is well over the ~ 3 mg/mL required to saturate a hydrophobic surface at ,
achieving minimum adhesion tension
maxIW
'aτ (see Fig. 1A). Depletion of coagulation proteins in the
conversion of plasma to serum certainly changes the number and concentration of individual
protein constituents in bulk solution, but does not alter because the bulk-solution
concentration is well above that required to saturate a hydrophobic surface. As a consequence,
concentration-dependent curves of plasma and serum are nearly identical because other
protein constituents compete for the interfacial vacancies effectively created by removal of
proteins consumed in the coagulation process (e.g. conversion of fibrinogen to insoluble fibrin).
Third, although variations in plasma proteome among species lead to a different weight-fraction
distribution of proteins in the bulk phase and surface, these differences do not affect surface
saturation ( ~436 mg/mL). And, because
maxIW
aΠ
maxIW
lna
B
dd C
τ of individual protein constituents are very
similar, the net observed curves for plasma derived from different species are not
significantly different.
aΠ
264
Page 283
8.5. Conclusions
The principal conclusion drawn from this and related work 34,44 is that interfacial energetics of
whole-blood plasma, serum and purified-protein constituents is strikingly similar across species
at two hydrophobic surfaces studied herein (liquid-vapor, LV and solid-liquid, SL). Differences
in concentration-dependent solid-water (solid-liquid, SL) interfacial energetics among plasma
and serum from disparate species (human, bovine, ovine and equine) are not resolvable within
99% statistical confidence. Substantially conserved concentration-dependence ln
lv
B
dd C
γ (LV
interfacial tensions) or ln
a
B
dd C
τ (SL adhesion tensions) despite differences in plasma proteome
among donor species is interpreted as a direct consequence of an invariant protein amphilicity
(interaction energetics with water) with varying protein type (molecular weight or size) 34.
Adsorption of proteins from heterogeneous aqueous solution can be accurately viewed as a
competition for space in the hydrophobic surface region . Hydrophobic surfaces with
concentrated protein solutions such as plasma or serum are always saturated with protein. Thus,
enrichment or depletion of any particular protein in bulk solution does not have a significant
effect on ln
lv
B
dd C
γ or ln
a
B
dd C
τ because substitution of one protein for another within the surface
region does not affect surface saturation.
265
Page 284
Citations
(1) Brash, J.; Lyman, D. Adsorption of Proteins and Lipids to Nonbiological
Surfaces. In The Chemistry of Biosurfaces; Brash, J. L., Ed.; Marcel Dekker: new York, 1971; pp
177.
(2) Vroman, L. What Factors Determine Thrombogenicity?,Bull. N. Y. Acad. Med.
1972, 48, 302.
(3) Vroman, L.; Adams, A. L.; Klings, M.; Fischer, G. Fibrinogen, Globulins,
albumins, and Plasma at Interfaces. In Applied Chemistry at Protein Interfaces: A Symposium at
the 166th Meeting of the American Chemical Society; American Chemical Society: Washington,
DC, 1975; Vol. Adv. in Chem Series 145; pp 255.
(4) Protein Adsorption on Biomaterials; Cooper, S. L.; Peppas, N. A.; Hoffman, A.
S.; Ratner, B. D., Eds.; Am. Chem. Soc.: Washington D. C., 1982; Vol. 199, pp 234.
(5) Horbett, T. Protein Adsorption on Biomaterials. In Biomaterials: Interfacial
Phenomena and Applications; Cooper, S. L., Peppas, N. A., Hoffman, A. S., Ratner, B. D., Eds.;
Am. Chem. Soc.: Washington D. C., 1982; Vol. 199; pp 234.
(6) Brash, J.; Hove, P. t. Effect of Plasma Dilution on Adsorption of Fibrinogen to
Solid Surfaces,Thromb. Haemostas. 1984, 51, 326.
(7) Lensen, H. G. W.; Bargman, D.; Bergveld, P.; Smolders, C. A.; Feijen, J. High-
performance Liquid Chromatography as a Technique to Measure the Competitive Adsorption of
Plasma Proteins onto Laticies,J. Colloid and Interface Sci. 1984, 99, 1.
(8) Vroman, L.; Adams, A. Adsorption of Proteins Out of Plasma and Solutions in
Narrow Spaces,J. Colloid and Interface Sci. 1986, 111, 391.
266
Page 285
(9) Wojciechowski, P.; Hove, P. T.; Brash, J. L. Phenomenology and Mechanism of
the Transient adsorption of Fibirinogen from Plasma (Vroman Effect),J. Colloid and Interface
Sci. 1986, 111, 455.
(10) Elwing, H.; Askendal, A.; Lundstrom, I. Competition Between Adsorbed
Fibrinogen and High-molecular-weight Kininogen on Solid Surfaces Incubated in Human
Plasma (the Vroman Effect): Influence of Solid Surface Wettability,J. Biomed. Mat. Res. 1987,
21, 1023.
(11) Shirahama, H.; Lyklema, J.; Norde, W. Comparative Protein Adsorption in Model
Systems,J. Colloid and Interface Sci. 1990, 139, 177.
(12) Leonard, E. F.; Vroman, L. Is the Vroman Effect of Importance in the Interaction
of Blood with Artificial Materials,J. Biomaterial Sci. Polym. ed. 1991, 3, 95.
(13) Wahlgren, M.; Arnebrant, T. Protein Adsorption to Solid Surfaces,Tibtech 1991,
9, 201.
(14) Wojciechowski, P.; Brash, J. L. The Vroman Effect in Tube Geometry: The
Influence of Flow on Protein Adsorption Measurements,J. Biomater. Sci. Polymer Edn. 1991, 2,
203.
(15) Brash, J. L.; Hove, P. T. Protein Adsorption Studies on "Standard" Polymeric
Materials,J. Biomater. Sci. Polymr. Edn. 1993, 4, 591.
(16) Vroman, L. Letter to the Editors,J. Biomat. Sci. Polym. Ed. 1994, 6, 223.
(17) Claesson, P. M.; Blomberg, E.; Froberg, J. C.; Nylander, T.; Arnebrant, T. Protein
Interactions at Solid Surfaces,Adv. Collid and Interface Sci. 1995, 57, 161.
267
Page 286
(18) Lin, J. C.; Cooper, S. L. In Vitro Fibrinogen Adsorption from Various Dilutions
of Human Blood Plasma on Glow Discharge Modified Polyethylene,J. Colloid and Interface Sci.
1996, 182, 315.
(19) Lee, J. H.; Lee, H. B. Platelet Adhesion onto Wettability Gradient Surfaces in the
Absence and Presence of Plasma Proteins,J. Biomed. Mat. Res. 1998, 41, 304.
(20) Jung, S.-Y.; Lim, S.-M.; Albertorio, F.; Kim, G.; Gurau, M. C.; Yang, R. D.;
Holden, M. A.; Cremer, P. S. The Vroman Effect: A Molecular Level Description of Fibrinogen
Displacement,J. Am. Chem. Soc. 2003, 125, 12782.
(21) Biopolymers at Interfaces; Malmsten, M., Ed.; Marcel Dekker: New York, 1998,
pp 656.
(22) Bagnall, R. D. Adsorption of Plasma Proteins on Hydrophobic
Surfaces. I. Albumin and gamma-Globulin,J. Biomed. Mat. Res. 1977, 11, 947.
(23) Bagnall, R. D.; Annis, J. A. D.; Sherliker, S. J. Adsorption of plasma proteins on
hydrophobic
surfaces. IV. Contact angle studies on implanted polymers,J. Biomed. Mat. Res. 1980, 14, 1.
(24) Brash, J. L.; Lyman, D. J. Adsorption of Plasma Proteins in Solution
to Uncharged, Hydrophobic Polymer Surfaces,J. Biomed. Mat. Res. 1969, 3, 175.
(25) Morgan, J. L. R.; Woodward, H. E. The Weight of a Falling Drop and the Laws of
Tate,J. Am. Chem. Soc. 1913, 35, 1249.
(26) W.D.Harkins; F.E.Brown. A Simple Apparatus For The Accurate And Easy
Determination Of Surface Tension, With A Metal Thermoregulator For The Quick Adjustment Of
Temperature.,J. Am. Chem. Soc. 1916, 38, 246.
268
Page 287
(27) Harkins, H. N.; Harkins, W. D. The Surface Tension of Blood Serum, and the
Determination of the Surface Tension of Biological Fluids,J. Clin. Invest. 1929, 7, 263.
(28) Nouy, P. L. D. Surface Equilibria of Biological and Organic Colloids; The
Chemical Catalog Co.: New York, 1926; Vol. 27.
(29) DuNouy, P. L. Surface Tension of Serum. XIII. On Certain Physicochemical
Changes in Serum as a Result of Immunization,J. Exp. Med. 1925, 41, 779.
(30) Krishnan, A.; Wilson, A.; Sturgeon, J.; Siedlecki, C. A.; Vogler, E. A. Liquid-
Vapor Interfacial Tension of Blood Plasma, Serum and Purified Protein Constituents
Thereof,Biomaterials 2005, 26, 3445.
(31) Tengvall, P.; Lundstrom, I.; Liedberg, B. Protein adsorption studies on model
organic surfaces: an ellipsometric and infrared spectroscopic approach,Biomaterials 1998, 19,
407.
(32) Green, R. J.; Davies, M. C.; Roberts, C. J.; Tendler, S. J. B. Competitive protein
Adsorption as observed by surface plasmon resonance,Biomaterials 1999, 20, 385.
(33) Krishnan, A.; Siedlecki, C. A.; Vogler, E. A. Traube-Rule Interpretation of
Protein Adsorption to the Liquid-Vapor Interface,Langmuir 2003, 19, 10342.
(34) Krishnan, A.; Sturgeon, J.; Siedlecki, C. A.; Vogler, E. A. Scaled Interfacial
Activity of Proteins at the Liquid-Vapor Interface,J. Biomed. Mat. Res. 2004, 68A, 544.
(35) Krishnan, A.; Siedlecki, C. A.; Vogler, E. A. Mixology of Protein Solutions and
the Vroman Effect,Langmuir 2004, 20, 5071.
(36) Krishnan, A.; Liu, Y.-H.; Cha, P.; Allara, D. L.; Vogler, E. A. Scaled Interfacial
Activity of Proteins at a Hydrophobic Solid-Water Interface,J. Biomed. Mater. Res. In Press
2005.
269
Page 288
(37) Krishnan, A.; Liu, Y.-H.; Cha, P.; Allara, D. L.; Vogler, E. A. Interfacial
Energetics of Protein Adsorption to the Hydrophobic Solid-Water Surface,Journal of Royal
Society Interface In Press 2005.
(38) Swenson, M. J. Physiological Properties and Cellular and Chemical Constituents
of Blood. In Duke's Physiology of Domestic Animals; Swenson, M. J., Ed.; Cornell University
Press: London, 1977.
(39) Allara, D. L.; Nuzzo, R. G. Spontaneously Organized Molecular Assemblies. 2.
Quantitative Infrared Spectroscopic Determination of
Equilibrium Structures of Solution-Adsorbed n -Alkan oic Acids on an Oxidized Aluminum
Surface,Langmuir 1985, Vol. 1, 52.
(40) Nuzzo, R. G.; Allara, D. L. Adsorption of Bifunctional Organic Disulfides on
Gold Surfaces,J. Am. Chem. Soc 1983, Vol. 105, 4481.
(41) Nuzzo, R. G.; Fusco, F. A.; Allara, D. L. Spontaneously Organized Molecular
Assemblies. 3. Preparation and Properties of Solution Adsorbed Monolayers of Organic
Disulfides on Gold Surfaces,J. Am. Chem. Soc. 1987, 109, 2358.
(42) Nuzzo, R. G.; Dubois, L. H.; Allara, D. L. Fundamental Studies of Microscopic
Wetting on Organic Surfaces. 1. Formation and Structural Characterization of a Self-Consistent
Series of Polyfunctional Organic Monolayers,J. Am. Chem. SOC 1990, 112, 558.
(43) Porter, M. D.; Bright, T. B.; Allara, D. L.; Chidseyi, C. E. D. Spontaneously
Organized Molecular Assemblies. 4. Structural Characterization of n-Alkyl Thiol Monolayers on
Gold by Optical Ellipsometry, Infrared Spectroscopy, and Electrochemistry,J. Am. Chem. Soc
1987, 109, 3559.
270
Page 289
(44) Krishnan, A.; Siedlecki, C.; Vogler, E. A. Traube-Rule Interpretation of Protein
Adsorption to the Liquid-Vapor Interface,Lagmuir 2003, 19, 10342.
(45) Krishnan, A.; Wilson, A.; Sturgeon, J.; Siedlecki, C. A.; Vogler, E. A. Liquid-
Vapor Interfacial Tension of Blood Plasma, Serum and Purified Protein Constituents
Thereof,Biomaterials 2005, 26, 3445.
(46) Krishnan, A.; Liu, Y.-H.; Cha, P.; Allara, D. L.; Vogler, E. A. An Evaluation of
Goniometric Methods,J. Colloid and Interf. Sci. 2005, in review.
(47) Vogler, E. A. Practical Use of Concentration-Dependent Contact Angles as a
Measure of Solid-Liquid Adsorption I: Theoretical Aspects, Langmuir 1992, 8, 2005.
(48) Vogler, E. A. Practical Use of Concentration-Dependent Contact Angles as a
Measure of Solid-Liquid Adsorption II: Experimental Aspects, Langmuir 1992, 8, 2013.
(49) Vogler, E. A. Interfacial Chemistry in Biomaterials Science. In Wettability; Berg,
J., Ed.; Marcel Dekker: New York, 1993; Vol. 49; pp 184.
(50) Morgan, J. L. R.; Woodward, H. E. The Weight Of A Falling Drop And The Laws
Of Tate. XI. The Drop Weight And Surface Tension Of Blood Serum,J. Am. Chem. Soc. 1913, 35,
1249.
(51) DuNuoy, P. L. Surface Tension of Serum,Journal of Experimental Medicine 1925,
41, 663.
(52) Vogler, E. A. Structure and Reactivity of Water at Biomaterial Surfaces,Adv.
Colloid and Interface Sci. 1998, 74, 69.
(53) Vogler, E. A. Water and the Acute Biological Response to Surfaces,J. Biomat.
Sci. Polym. Edn. 1999, 10, 1015.
271
Page 290
(54) Vogler, E. A. How Water Wets Biomaterials. In Water in Biomaterials Surface
Science; Morra, M., Ed.; John Wiley and Sons: New York, 2001; pp 269.
(55) Adkins, J. N.; Varnum, S. M.; Auberry, K. J.; Moore, R. J.; Angell, N. H.; Smith,
R. D.; Springer, D. L.; Pounds, J. G. Toward a Human Blood Serum Proteom,Molecular and
Cellular Proteomics 2002, 1, 947.
272
Page 291
TABLE 1: STEADY-STATE PLASMA/SERUM ADSORPTION PARAMETERS
TYPE
(acronym) aθ(degrees)
'aθ
(degrees)
/ 2ln BCΘ PPT
M (dimension-
less)
aτ (mN/m)
'aτ
(mN/m)
maxaΠ
(mN/m)
HUMAN PLASMA (HP) 104.2±0.6 79.6±1.6 20.1±0.4 -9.2±1.6 -17.6±0.8 8.8±1.4 26.4±1.9 HUMAN SERUM (HS) 100.4±0.9 77.7±1.0 17.5±0.3 -13.6±3.2 -12.7±1.1 10.1±0.8 22.9±1.4
BOVINE PLASMA (BP) 100.5±0.6 76.6±1.8 20.3±0.5 -9.8±1.8 -13.2±0.8 8.9±1.5 22.1±1.7
BOVINE SERUM (BS) 101.6±0.6 86.4±0.8 17.7±0.4 -12.9±3.1 -14.3±0.7 2.6±0.6 16.9±0.9 EQUINE PLASMA (EP) 101.4±0.5 80.2±0.5 18.1±0.2 -36.1±7.3 -13.6±0.6 8.1±0.4 21.6±1.1 EQUINE SERUM (ES) 100.6±0.5 79.1±0.9 18.9±0.3 -9.4±1.2 -12.9±0.4 8.4±0.6 20.7±0.7 OVINE PLASMA (OP) 100.9±0.5 86.1±1.1 21.1±0.4 -20.8±6.6 -13.6±0.6 3.0±0.9 16.6±1.1 OVINE SERUM (OS) 101.7±0.5 85.5±0.9 19.9±0.3 -14.9±3.3 -14.5±0.6 3.5±0.7 17.9±0.9
Notes: Listed data result from statistical fit (see Materials and Methods)
273
Page 292
Figure 1: Advancing contact angle isotherms in 3D ( aθ as a function of analysis time (drop age) and
logarithmic (natural) solution concentration ) and 2D (BC aθ as a function of logarithmic solution
concentration at selected times) formats comparing human (HS, panel A, Table 1), ovine (OS,
panel B), and equine (ES, panel C) serum. In each case, solute concentration is expressed in v/v
units of parts-per-trillion (PPT, mL/10
BC
BC
12 mL solution). Symbols in 2D panels represent time slices
through 3D representations (filled circle = 0.25 sec, open circle = 900 sec, filled triangles = 1800
sec, and open triangles = 3594 sec; annotations in Panel A indicate maximum and half-maximum
contact angle reduction, maxa
θ and max12 aθ respectively. Note also decrease in aθ with time,
attributed to slow hydration of the SAM surface (Panel B, arrow annotation; see Results section for
more discussion).
274
Page 293
A
B
ln CB (CB in PPT)
8 10 12 14 16 18 20 22 24 26 28
θ a (d
egre
es)
70
75
80
85
90
95
100
105
110
ln CB (CB in PPT)
8 10 12 14 16 18 20 22 24 26 28
θ a (d
egre
es)
70
80
90
100
110
aθ
'aθ
maxaθ
max1
2 aθ
/ 2ln BCΘ
hydration time
lnCB ( CB in PPT)
lnCB ( CB in PPT)
C
8 10 12 14 16 18 20 22 24 26 28
θ a (d
egre
es)
70
80
90
100
110
adsorption time
lnCB ( CB in PPT)
275
Page 294
Figure 2: Sequential interpretation of a steady-state (3600 sec drop age) contact angle adsorption
isotherm for human serum (HS, Table 1); Panel A, advancing contact angles, aθ ; Panel B, advancing
adhesion tension, aτ ; Panel C, advancing spreading pressure aΠ . Smoothed curves through the data
serve as guides to the eye. Annotations identify low- and high- concentration asymptotes for contact
angles ( aθ , 'aθ ), adhesion tensions ( aτ , '
aτ ) and maximum spreading pressure that are used to
characterize isotherms (Table 1).
maxaΠ
276
Page 295
θ a (d
egre
es)
75
80
85
90
95
100
105
τ a (m
N/m
)
-10
-5
0
5
10
ln CB (CB in PPT)
8 10 12 14 16 18 20 22 24 26 28
Πa
(mN
/m)
0
5
10
15
20
25
aθ
'aθ
'aτ
aτ
max 'a a aτ τΠ = −
A
B
C
277
Page 296
Figure 3: Comparison of steady-state, concentration-dependent aΠ (panel A) as well as lvγ (panel
B) data for (human) plasma (HP, Table 1), serum (HS), and IgG (hIgG) on a single concentration
axis, showing that protein mixtures cannot be confidently distinguished from a purified protein at
two hydrophobic surfaces. Band represents 99% confidence intervals around best-fit-human plasma
data. (closed circle = HP, open square = HS, open triangle = hIgG). Notice that maximum spreading
pressure is conserved at about 25mN/m at the two hydrophobic surfaces for a purified protein
as well as complex protein mixtures, plasma and serum.
maxaΠ
278
Page 297
8 10 12 14 16 18 20 22 24 26 28
γ lv (m
N/m
)
45
50
55
60
65
70
ln CB (CB in PPT)
Πa
(mN
/m)
0
5
10
15
20
25
30
max ~ 25 mN/mΠ
max ~ 25 mN/mΠ
LIQUID-VAPOR
SOLID-LIQUID
279
Page 298
Figure 4: Comparison of steady-state, concentration-dependent aΠ (panel A) as well as lvγ data for
human (HP, filled circle, Table 1), ovine (OP, open triangle), equine (EP, open square) and bovine
(BP, open circle) plasma on a single concentration axis. Band represents 99% confidence intervals
around best-fit-human plasma data, suggesting that species cannot be confidently distinguished from
this data. In each case, solute concentration is expressed in v/v units of parts-per-trillion (PPT,
mL/10
BC
12 mL solution). Notice that maximum spreading pressure is conserved at about
25mN/m at the two hydrophobic surfaces regardless of species differences.
maxaΠ
280
Page 299
ln CB (CB in PPT)
8 10 12 14 16 18 20 22 24 26 28
γ lv (m
N/m
)
45
50
55
60
65
70
Πa
(mN
/m)
0
5
10
15
20
25
30
max ~ 25 mN/mΠ
LIQUID-VAPOR
max ~ 25 mN/mΠ
SOLID-LIQUID
281
Page 300
Chapter 9
Energy and Mass Balance for Protein Adsorption to Hydrophobic Surfaces from Aqueous-Buffer Solution
Abstract
Mass of adsorbed protein derived from a simple sphere-packing model based on energetics of
protein adsorption closely matches experimental results from high-precision quartz crystal
microbalance (QCM) technique. Results from four purified proteins, human serum albumin (FV
HSA), Fibrinogen (Fb) and Immunoglobulins (IgG; IgM) have been used to compare theory to
experiment by computing total mass of adsorbed protein as well as water molecules within the
interphase. Outcomes from the comparison of these two complementary methods (biophysical
theory to a modern surface-analytical tool) not only reinforce the basic principles of the protein
adsorption model but also constitute first steps towards achieving a complete mass and energy
inventory necessary for a comprehensive understanding of the protein adsorption process.
9.1. Introduction
A critical need in the development of successful biomaterials is firm structure-property relationships
that link the propensity of a material to promote protein adsorption to measurable surface
characteristics such as surface chemistry and energy (water wettability). Our recent work on
interfacial energetics has revealed a pattern in protein adsorption understandable in terms of known
physical principles of amphilicity (interaction energetics with water) and surfactancy (propensity to
adsorb to surfaces). Surprisingly perhaps, we find that protein adsorption has more to do with the
properties of water, the universal biological solvent,1 than the molecular properties of proteins per
se. This suggests that surface aspects of the protein-adsorption problem have, in fact, a general
282
Page 301
solution that can be articulated in a set of tangible biophysical rules or laws. Indeed, we find that
that a relatively straightforward theory of protein adsorption applies to complex proteinaceous
mixtures such as blood plasma or serum, not just single-protein solutions, suggesting that these rules
will have practical medical utility that transcends the physical chemistry that underlies theory.
It is our contention that a comprehensive understanding of the protein adsorption process will require
both a complete mass and energy inventory. A number of modern methods are available to measure
the mass of protein adsorbed (see, for example, ref. 2 and citations therein) including ellipsometry,
IR spectroscopy, surface plasmon resonance, and reflectometry. This work focuses on the
application of high precision quartz crystal microbalance (QCM) techniques, including QCM arrays,
as described in the following sections. This is a very well established method that has minimal
complexities in the experiments and interpretation compared to other methods, thus serving to make
the systematics of our approach optimally efficient. There are but two basic methods to measure
interfacial energetics of protein adsorption: tensiometry (contact angle and wetting techniques) and
microcalorimetry. We advocate use of tensiometry herein because it is particularly well-suited for
micro-scale measurements of adsorption of proteins available only in small quantities on well-
defined surfaces with low surface area prepared using modern methods of surface engineering.3,4
Also, experience from recent work on energetics has refined interpretation of tensiometric results in
terms of protein adsorption.5-9 Hence, a novelty of this work is the concerted application of methods
that will provide both the needed mass and energy inventory.
There are many different ways to measure adsorption and these different techniques have assorted
advantages/drawbacks (esp. surface sensitivity).4 Results are not typically intercomparable, and this
283
Page 302
has no doubt contributed to the general lack of consensus within the protein-adsorption literature
(see review ref. 10 and citations therein). Adsorption mechanisms can be broadly classified into
chemisorption and physisorption categories, although protein adsorption need not occur exclusively
through one mechanism or another. Adsorption through the former process leads to more strongly-
bound adsorbate than through the latter. The need to account for weakly-bound, physisorbed protein
emphasizes the use of in situ techniques that do not perturb/destroy structure of the interfacial layer
into which protein becomes entrained.10 This work focuses on gravimetry and tensiometry, two
complementary in situ techniques measuring adsorbate mass and adsorption energetics, respectively.
Quartz-crystal microbalance (QCM) techniques have emerged as highly sensitive means of detecting
and monitoring adsorption to solid surfaces11-15and will be used in our studies to measure adsorbed
protein mass. A useful experimental attribute of QCM is that it can be successfully married with
surface engineering methods (e.g. self-assembled monolayer or SAM technology). The basic QCM
measurement consists of applying an AC voltage, generally in the 5-10 MHz frequency region but
often higher, to an AT-cut thin quartz crystal 16A6 with metal electrodes, typically gold, and tracking
the resonant frequency of the crystal using a simple oscillator circuit. Observed frequency shift is
proportional to change in mass, such as by adsorption of molecules.17
Tensiometry or goniometry involves measurement of time-and-concentration-dependent interfacial
tensions (LV) or contact angles (SL) respectively, of protein-solutions. A substantial amount of
work on energetics of protein adsorption to the two hydrophobic surfaces (LV and SL) have already
been outlined in Chapters 1-8. This chapter focuses mostly on testing and interpreting our theory of
protein adsorption in terms of adsorbate mass measurements from QCM. QCM and tensiometry are
284
Page 303
highly complementary techniques because results can be co-interpreted in terms of a complete mass-
energy inventory that is essential to secure identification of adsorption mechanisms, thickness of the
adsorbate layer(s), and protein organization within adsorbed layer(s). The same techniques can be
applied equally, without modification, to purified-protein solutions and multi-component protein
solutions such as plasma/serum that are especially biomedically relevant.
9.2. Materials and Methods
Quartz Crystal Microbalance: Details of the quartz crystal microbalance (QCM) technique have
been described elsewhere15,18. The basic QCM measurement consists of applying an AC voltage,
generally in the 5-10 MHz frequency region, to an AT-cut thin quartz crystal (~ 1mm) with metal
electrodes on both sides, typically gold, and tracking the resonant frequency of the crystal using a
simple oscillator circuit. When the mass of the electrodes change, such as by adsorption of protein
molecules, the frequency shifts proportionally.17,19 Shift in the resonance frequency of the quartz
crystal can be used to calculate the adsorbed mass using the classical Sauerbrey relationship17,19
20
Q
f mfNρ
− ∆∆ = ; where 0f is the resonant frequency of the oscillator, and N is a frequency constant of
the quartz crystal. The mass sensitivity constant 20
QNC
fρ−
= is equal to 17.7 ng/(cm2.Hz) at
. Thus, total mass of adsorbed protein can be computed as .
QCM response as a function of time was monitored for each of 24-30 serial protein dilutions
covering a dynamic range between 10
0 5MHzf = 217.7 /m f ng cm∆ = −∆ ×
-10 to 1 % (w/v), constituting a complete protein adsorption
isotherm. About 500 µL of protein solution was pipetted into the closed sample cell at the start of
data collection. At the end of an hour-long measurement period (equilibrium), data collection is
285
Page 304
discontinued and solution replaced with the next higher concentration with intermediate buffer rinses
(3X).
Proteins: Purified proteins, human serum albumin (FV HSA), Fibrinogen, IgG and IgM were used
as-received from Sigma-Aldrich and were the highest purity available (>96% as assessed by SDS
PAGE). Mass, concentration, and molecular weights supplied with the proteins were accepted
without further confirmation.
Surfaces: Methyl-terminated self-assembled monolayer surfaces were prepared on the quartz-
crystal sensor element of the QCM apparatus using standard surface engineering techniques outlined
elsewhere20-24. Briefly, the sensor element was pre-cleaned in hot 1:4 H2O2 (30%)/H2SO4 solution.
The cleaned crystal surface was rinsed with absolute ethanol and immediately immersed in 1mM
solutions of 1-hexadecanethiol (CH3(CH2)15SH) in ethanol for 3 days. After SAM formation, the
samples were rinsed with ethanol and dried with nitrogen.
QCM Gravimetry: An important attribute of this part of the work on QCM gravimetry is that it
involves collaborative efforts with Liu and Allara of the Molecular Surface Science Laboratory.
This collaboration is ongoing from our recent work on self-assembled monolayers as model
substrates for protein adsorption studies at the SL interface. Methyl-terminated hexadecane thiol
SAM surfaces will be prepared on QCM crystals using standard techniques described in previous
sections. Initial studies measuring protein adsorption by QCM will deploy a micro liquid cell and
computer-controlled QCM setup. QCM response as a function of time will be monitored for each of
24-30 serial dilutions covering a dynamic range between 10-10 to 1 % (w/v), constituting an
286
Page 305
adsorption isotherm for each test surface. Analysis will proceed from most dilute (control blank) to
most concentrated (~1%). Briefly outlining the experimental protocol, ~ 500 µL of protein solution
will be pipetted into the closed sample cell at the time data collection is started. After equilibrium is
achieved (≤ 1 hour based on preliminary data), data collection will be discontinued and the solution
replaced with the next higher in the series with 3X serial buffer rinse between serially-increasing
solution concentrations but avoiding desiccation of the sample cell.
Co-interpretation of QCM and Tensiometric Data: This part of the work, will, for the first time,
permit sensible co-interpretation of QCM (mass) and goniometric (energy) data because the theory
of adsorption that will be applied to both is written in tangible terms of adsorbate surface
concentration (in moles/volume), and not in the more abstract notion of adsorbate surface density (in
moles/area) typically used in the interpretation of small-molecule adsorption. Importantly,
tensiometry and QCM are independent and highly complementary techniques from which a
comprehensive energy-mass inventory can be assembled that tests adsorption mechanisms.
9.3. Theory of Protein Adsorption
Previous work7,8,25,26 probing energetics of protein adsorption to the water-air (liquid-vapor, LV) as
well as solid-water (solid-liquid, SL) interphases using tensiometric techniques has revealed
important biophysical relationships among diverse proteins spanning three decades in molecular
weight (MW). Significant results from this work have led to a model of protein adsorption based on
close-packing of oblate-spheroid, globular protein molecules (approximately spherical in aqueous
solution). Consequently, globular proteins are modeled as spheres with radius
(packing-volume radius in cm for MW in kDa). At surface-saturating protein concentrations, this
8 16.72 10vr M−= × / 3W
287
Page 306
model suggests that proteins with hydration shells pack within the interphase to nearly face-
centered-cubic (FCC) concentrations. Thus, the model envisions close-packing of hydrated protein
molecules of characteristic radius vR rχ≡ where χ represents excluded volume surrounding each
molecule. Maximal interphase concentrations of hydrated proteins (radius, R) was reasoned to be
proportional to the maximum conceivable concentrations resulting from face-centered cubic packing
of core proteins (radius ) through a packing-efficiency parameter. This packing-efficiency factor vr
ε was estimated to be 0.45 from independent calibration to two sources from neutron-
reflectometry27 and quasi-electric light scattering28,29 respectively. All features of the protein
adsorption model are clearly detailed in refs. 7,8,25,26. Select aspects of the model relevant to this
work are reproduced herein.
Interphase Protein-Water Mass Proportions: Equation 1 computes the maximal interphase
concentration of hydrated proteins, per unit volume of the interphase corresponding to the core
protein thickness ( ). follows an inverse function of protein MW and is related by the
packing efficiency parameter
maxIC
2 vrmaxIC
ε -
8
max 38 1/3 33
(4 molecules) 0.17 molecules 9.68 10 ( /(6.72 10 )(2 2)I
v
C pMW MWr
ε ε ε−
×= = =
×)mol cm ………..Eq. 1
The theory also derives volume fractions of adsorbed protein and the proportions of water molecules
within the interphase. At interphase saturation ( ), the maximum volume fraction of protein
is 0.
maxIC
maxpΦ 74ε or . Thus, maximum volume fraction of adsorbed protein
is constant irrespective of protein MW. Knowledge of protein volume fraction can be extended to
compute volume fractions of bound- as well as free-water within the interphase, thus generating an
max 0.33 when = 0.45p εΦ =
288
Page 307
interphase-protein-water-inventory. Table 1 shows the proportions of protein and water within the
interphase in terms of volumes, moles and mass as determined from respective volume fractions.
Computations from the packing model can be used to predict mass proportions of protein and water
derived experimentally from QCM techniques.
9.4. Results and Discussion
Figure 1 plots shift in resonance frequency ( f∆ ) for two purified proteins measured using QCM
techniques described in Materials and Methods. Mass of adsorbed protein can be computed from the
frequency shift using the Sauerbrey equation17 (see Materials and Methods). Accordingly,
maximum adsorbed-protein mass was computed using the high-concentration parameter from a four-
parameter sigmoidal fit to data for each of the four proteins. Results were found to be consistent
with recent literature
f∆
18 as well. Table 2 compares mass proportions of protein and water calculated
from the adsorption model to total mass from QCM measurements. Moles (columns 5-7) and mass
(columns 8-10) proportions of protein, bound water and free water were computed per unit area of
the interphase (see Table 1 and Eq. 2 for respective formulations). The sum total mass of core
protein, bound water and free water (column 12) serves for direct comparison to QCM results
(column 13). Remarkable statistical agreement was seen for FVHSA (MW=66.3kDa), IgG
(MW=160kDa) and Fb (MW=340kDa) in comparing mass computed from model to that from
experiment. However, adsorbate-mass measured for IgM (MW=1000 kDa) falls short of the
computed theoretical value by over 60mg/m2 (row 4 Table 2). This substantial mismatch is
speculated to be an outcome of the exceptionally large size of IgM30 and the expectation from theory
that it occupies five whole layers at the interphase31. Further limitations from the QCM
experimental techniques, such as viscocity or extent of dissipation32,33 is also speculated and
289
Page 308
warrants further investigation. Figure 2 compares adsorption isotherms for FV HSA from
goniometry ( vs. ) to those from QCM (aΠ ln BC f∆ vs. ) with concentration scaled in w/v
units. Similarity in adsorption trends from two different techniques is evident in Fig. 2 and this is
particularly useful in co-interpretation of data derived from energetics and mass.
ln BC
9.5. Conclusions
Close agreement was seen between theory and experiment in calculations of mass of protein and
water within a hydrophobic interphase. A relatively-simple model of protein adsorption derived
from tensiometric data computes mass proportions of protein and water within a hydrophobic
interphase. Calculations from the model demonstrated significant statistical match with
experimental mass measurements from quartz-crystal microbalance technique for three out of four
purified proteins studied (FVHSA, Fb and IgG). Further investigations refining both theory and
QCM experimental techniques is expected to resolve any discrepancies between the theoretical and
experimental outcomes for purified proteins as well as multi-protein mixtures, plasma and serum.
290
Page 309
Citations
(1) Vogler, E. A. Biological Properties of Water. In Water in Biomaterials Surface
Science; Morra, M., Ed.; John Wiley and Sons: New York, 2001; pp 4.
(2) Biopolymers at Interfaces; Malmsten, M., Ed.; Marcel Dekker: New York, 1998, pp
656.
(3) Vogler, E. A. Practical Use of Concentration-Dependent Contact Angles as a
Measure of Solid-Liquid Adsorption II: Experimental Aspects, Langmuir 1992, 8, 2013.
(4) Vogler, E. A. Interfacial Chemistry in Biomaterials Science. In Wettability; Berg, J.,
Ed.; Marcel Dekker: New York, 1993; Vol. 49; pp 184.
(5) Vogler, E. A. Practical Use of Concentration-Dependent Contact Angles as a
Measure of Solid-Liquid Adsorption I: Theoretical Aspects, Langmuir 1992, 8, 2005.
(6) Vogler, E. A.; Martin, D. A.; Montgomery, D. B.; Graper, J. C.; Sugg, H. W. A
Graphical Method for Predicting Protein and Surfactant Adsorption Properties, Langmuir 1993, 9,
497.
(7) Krishnan, A.; Liu, Y.-H.; Cha, P.; Allara, D. L.; Vogler, E. A. Scaled Interfacial
Activity of Proteins at a Hydrophobic Solid-Water Interface,J. Biomed. Mater. Res. In Press 2005.
(8) Krishnan, A.; Liu, Y.-H.; Cha, P.; Allara, D. L.; Vogler, E. A. Interfacial Energetics
of Protein Adsorption to the Hydrophobic Solid-Water Surface,Journal of Royal Society Interface In
Press 2005.
(9) Krishnan, A.; Sturgeon, J.; Siedlecki, C. A.; Vogler, E. A. Scaled Interfacial Activity
of Proteins at the Liquid-Vapor Interface,J. Biomed. Mat. Res. 2004, 68A, 544.
(10) Vogler, E. A. Structure and Reactivity of Water at Biomaterial Surfaces,Adv. Colloid
and Interface Sci. 1998, 74, 69.
291
Page 310
(11) Ballantine, D. S. Acoustic Wave Sensors-Theory, Design, and Physico-Chemical
Applications; Academic Press, 1996.
(12) Lu, C.; Czanderna, A. W. Applications of Piezoelectric Quartz Crystal
Microbalances; Elsevier: New York, 1984.
(13) Henry, C. Measuring the Masses: Quartz Crystal Microbalances,Anal Chem. 1996,
625A.
(14) Handley, J. Quartz Crystal Microbalances,Anal Chem. 2001, 225A.
(15) Sullivan, C. K. O.; Guilbault, G. G. Commercial Quartz Crystal Microbalances-
Theory and Applications,Biosensors and Bioelectronics 1999, 14, 663.
(16) Bottom, V. E. Introduction to Quartz Crystal Unit Design; Van Nostrand Reinhold:
New York, 1982.
(17) Sauerbrey, G. Z. Verwendung von Schwing Quarzen zer Wagung dunner Schichten
und zur Mikrowagung,zeitschrift für Physik 1959, 155, 206.
(18) Zhou, C.; Friedt, J.; Angelova, A.; Choi, K.; Laureyn, W.; Frederix, F.; Francis, L.
A.; Campitelli, A.; Engelborghs, Y.; Borghs, G. Human Immunoglobulin Adsorption Investigated by
Means
of Quartz Crystal Microbalance Dissipation, Atomic Force
Microscopy, Surface Acoustic Wave, and Surface Plasmon
Resonance Techniques,Langmuir 2004, 20, 5870.
(19) Muratsugu, M.; Ohta, F.; Miya, Y.; Hosokawa, T.; Kurosawa, S.; Kamo, N.; Ikedat,
H. Quartz Crystal Microbalance for the Detection of Microgram
Quantities of Human Serum Albumin: Relationship between the
Frequency Change and the Mass of Protein Adsorbed,Anal. Chem. 1999, 65, 2933.
292
Page 311
(20) Allara, D. L.; Nuzzo, R. G. Spontaneously Organized Molecular Assemblies. 2.
Quantitative Infrared Spectroscopic Determination of
Equilibrium Structures of Solution-Adsorbed n -Alkan oic Acids on an Oxidized Aluminum
Surface,Langmuir 1985, Vol. 1, 52.
(21) Nuzzo, R. G.; Allara, D. L. Adsorption of Bifunctional Organic Disulfides on Gold
Surfaces,J. Am. Chem. Soc 1983, Vol. 105, 4481.
(22) Nuzzo, R. G.; Fusco, F. A.; Allara, D. L. Spontaneously Organized Molecular
Assemblies. 3. Preparation and Properties of Solution Adsorbed Monolayers of Organic Disulfides
on Gold Surfaces,J. Am. Chem. Soc. 1987, 109, 2358.
(23) Nuzzo, R. G.; Dubois, L. H.; Allara, D. L. Fundamental Studies of Microscopic
Wetting on Organic Surfaces. 1. Formation and Structural Characterization of a Self-Consistent
Series of Polyfunctional Organic Monolayers,J. Am. Chem. SOC 1990, 112, 558.
(24) Porter, M. D.; Bright, T. B.; Allara, D. L.; Chidseyi, C. E. D. Spontaneously
Organized Molecular Assemblies. 4. Structural Characterization of n-Alkyl Thiol Monolayers on
Gold by Optical Ellipsometry, Infrared Spectroscopy, and Electrochemistry,J. Am. Chem. Soc 1987,
109, 3559.
(25) Krishnan, A.; Siedlecki, C.; Vogler, E. A. Traube-Rule Interpretation of Protein
Adsorption to the Liquid-Vapor Interface,Langmuir 2003, 19, 10342.
(26) Krishnan, A.; Siedlecki, C. A.; Vogler, E. A. Mixology of Protein Solutions and the
Vroman Effect,Langmuir 2004, 20, 5071.
(27) Lu, J. R.; Su, T. J.; Penfold, J. Adsorption of Serum Albumins at the Air/Water
Interface,Langmuir 1999, 15, 6975.
(28) Helfrich, J. P.; Harvard, T.; Jones, B. Hydrodynamic Radius Characterization of
biomolecules and nanoparticles,Am. Biotech. Lab 1999, 16, 64.
293
Page 312
(29) Helfrich, J. P. Flow-mode dynamic laser light scattering
technology for 21st century biomolecular characterization.,Am. Biotech. Lab 1998, 16, 64.
(30) Anderson, N. L.; Anderson, N. G. The Human Plasma Proteome:History, Character,
and Diagnostic Prospects,Molecular and Cellular Proteomics 2002, 1, 845.
(31) Krishnan, A.; Siedlecki, C. A.; Vogler, E. A. Traube-Rule Interpretation of Protein
Adsorption to the Liquid-Vapor Interface,Langmuir 2003, 19, 10342.
(32) Hook, F.; Rodahl, M.; Brzezinski, P.; Kasemo, B. Energy Dissipation Kinetics for
Protein and Antibody-Antigen Adsorption under Shear Oscillation on a Quartz Crystal
Microbalance,Langmuir 1998, 14, 729.
(33) Rodahl, M.; Hook, F.; Fredriksson, C.; Keller, C. A.; Krozer, A.; Brzezinski, P.;
Voinova, M.; Kasemoa, B. Simultaneous frequency and dissipation factor QCM
measurements of biomolecular adsorption and cell adhesion,Faraday Discussions 1997, 107, 229.
294
Page 313
Table 1: Interphase Protein-Water Inventory
Type Volume fraction (cm3)
Moles within Interphase
(moles)
Mass within Interphase
(grams) Protein max max max0.33p I IV VΦ = max0.33 I p
p
VMW
ρ
max0.33 I pV ρ
Bound water max max max0.41I IV VχΦ = max0.41 I w
w
VMW
ρ max0.41 I wV ρ
Interfacial free water max max max0.26IFW I IV VΦ = max0.26 I w
w
VMW
ρ max0.26 I wV ρ
Notes: Interphase volume V = thickness of hydrated protein layer (cm) X area (A) of interphase (cm2) maxI
, MWρ represent density and molecular weight of protein or water as denoted by subscripts p or w respectively.
295
Page 314
Table 2: Mass Proportions of Protein and Water within the Interphase – Theory and Experiment
Per Unit Area of Interphase Moles
(pmol/cm2) Mass
(mg/m2)
Protein pMW
(kDa)
maxrV
(cm3) [2 Area]vr ×
maxIV
(cm3) [2 Area]R × Protein Bound
water Free
water Protein Bound
water Free water
Number of layers
(model)
Total*
QCM mass
(mg/m2)
FVHSA
66.3 75.4 10 A−× 77.2 10 A−× 3.6 41.6 10× 41.1 10×
2.4 2.9 1.9 1 7.2 7.3±1.2
IgG
160 77.2 10 A−× 79.3 10 A−× 1.9 42.1 10× 41.3 10× 3.2 3.8 2.4 2 18.8 19.5±2.3
Fb 340
712.2 0 A− 1.2 4.1 5.0 3.2 3 36.9 32.8±1.8 79.4 10 A−× 1×
42.8 10× 41.8 10×
IgM 1000 713.4 0 A− 717.4 0 A− 0.6 5.9 7.2 4.5 5 88.1 24.2±0.9 1×
1×
44.0 10× 42.5 10×
max
max
2
2
2
Notes: thickness of core protein layer (cm) area (A) of interphase (cm )
thickness of hydrated protein layer (cm) area (A) of interphase (cm )
* Total mass (mg/m ) = 1
r
I
V
V
= ×
= ×
layer mass (Protein + Bound water+ Free water) Numb
er of layers×
296
Page 315
Figure 1: Comparison of resonance frequency shift ( f∆ ) for two purified proteins FV HSA
(MW=66.3kDa, closed triangles) and IgG (MW= 160kDa, closed circles) measured from quartz
crystal microbalance. Smooth curves result from sigmoidal fit to the data. Steady-state, limiting
frequency measurements can be used to deduce adsorbed protein mass from Sauerbrey equation (see
Materials and Methods)
297
Page 316
lnCB (CB in PPT)
5 10 15 20 25
- ∆f (
Hz)
-20
0
20
40
60
80
100
120
298
Page 317
Figure 2: Comparison of adsorption isotherms from QCM (resonance frequency shift, f∆ , open
circles) with goniometry (spreading pressure, aΠ , closed circles) for albumin (FV HSA). Smooth
curves result from sigmoidal fit to the data.
299
Page 318
ln CB (CB in PPT)
5 10 15 20 25
− ∆
f (H
z)
-10
0
10
20
30
40
50
Πa
(mN
/m)
0
10
20
30
40
300
Page 319
VITA Anandi Krishnan
Anandi Krishnan was born at Tirunelveli in Southern India on the 19th of June 1978.
She is the elder of three children, and spent her early years in Trivandrum, Kerala – the
so-called God’s Own Country. She later moved with her family to Kuwait, where she
was pampered through high-school at the Indian School, Kuwait. She managed to
study a bit and landed an admission to the Govt. College of Engineering, Trivandrum –
where she spent four joyous years under her grandmother’s care. Graduating with a
Bachelor of Technology degree in Electrical and Electronics Engineering in 2000, she
spent a short stint in software engineering at Bangalore, India. Later in the Fall of
2001, she and her husband moved to the United States of America to pursue graduate
studies. She has since been pursuing her Ph. D in Bioengineering at Penn State under
the able guidance of Dr. Erwin Vogler of the Department of Materials Science and
Engineering. Anandi’s research interests include biomaterials, medical devices and their
clinical applications in cardiovascular health and disease. In addition to simple books,
such as those of Italo Calvino or R.K. Narayan, Anandi enjoys carnatic music.
Some Publications and Presentations - PUBLICATIONS 1. Krishnan A, Siedlecki CA, Vogler EA
2. Krishnan A, Sturgeon J, Siedlecki CA, Vogler EA
3. Krishnan A, Siedlecki CA, Vogler EA
4. Krishnan A, Wilson A, Sturgeon J, Siedlecki CA,
Vogler EA 5. Krishnan A, Liu YH, Cha P, Allara D, Vogler EA
6. Krishnan A, Liu YH, Cha P, Allara D, Vogler EA
7. Krishnan A, Liu YH, Cha P, Allara D, Vogler EA
Traube-Rule Interpretation of Protein Adsorption to the Liquid-Vapor Interface. Langmuir; 19:10342-10352, 2003 Scaled Interfacial Activity of Proteins at the Liquid-Vapor Interface. J. Biomed. Mat. Res.; 68A:544-557, 2004 Mixology of Protein Solutions and the Vroman Effect. Langmuir; 20: 5071-5078, 2004 Liquid-Vapor Interfacial Tensions of Blood Plasma, Serum and Purified Protein Constituents Thereof ; Biomaterials; 26; 3445-3453, 2004 Scaled Interfacial Activity of Proteins at a Hydrophobic Solid-Water Interface. J.Biomed.Mater.Res. In Press, May 2005 Interfacial Energetics of Proteins at a Hydrophobic Solid-Water Interface. Journal of the Royal Society - Interface. In Press, May 2005 An Evaluation of Goniometric Methods Colloids and Surfaces. In Press, May 2005
PRESENTATIONS 1. Controlling Role of Water in Protein Adsorption Oral Presentation, AVS 51st International Symposium
Anaheim, CA; November 2004 2. Mixology of Protein Solutions and the Vroman
Effect Poster Presentation, Gordon Research Conference on Chemistry at Interfaces; Meriden NH; August 2004
3. Traube-Rule for Protein Adsorption Poster Presentation, Gordon Research Conference on Biomaterials Plymouth, NH; July 2003