65
Protein Appetite and Leveraging Richard D. Mattes, MPH, PhD, RD Purdue University West Lafayette, IN, USA May 5-6, 2015 Laboratory for Sensory and Ingestive Studies

Protein Appetiteand Leveraging
Richard D. Mattes, MPH, PhD, RDPurdue University
West Lafayette, IN, USAMay 5-6, 2015
Laboratory for Sensory and Ingestive Studies

Is a Calorie a Calorie?

Average bond energies, kcal/moleC-H 98O-H 110C-C 80C-O 78H-H 103C-N 65O=O 116 (2 x 58)C=O 187* (2 x 93.5)C=C 145 (2 x 72.5)
(* as found in CO2)

Dietary Approaches to Optimize Health
Dietary level
• Nutrients/food constituents
• Foods
• Diets
Examples
• Protein, Fiber, Calcium, Capsaicin
• Fruits, Vegetables, w\Whole Grains
• Glycemic Index, Vegan, Energy Density
Common assumption: A Calorie A Calorie

Protein Appetite
SpecificNon-Specific

Protein Appetite
SpecificNon-Specific

Deutsch et al., Physiol & Behav 1989;46:619-624

DiBattista D. Physiol & Behav 1991; 49: 263-269.
Rats and Mice
12 day restriction period
Protein-restricted – 1 hour access/24hr
Carbohydrate-restricted – 1 hour access/24hr

Jen et al., Physiol & Behav 1985;34:655-659
Ad Lib intake + Infusion CHO - 28-77%en FAT - 16-65%en PRO - 7-36%en

Mellinkoff et al., J Appl Physiol 1956;8:535-538

Vazquez et al., Physiol & Behav1982;28:513-519. Soup +
MSGSoup + Casein
Hydrolysate
113 infants with marasmus87 healthy control infants
60 second feeding trials

Murphy & Withee J Gerontol 1987;42:73-77
N = 20 18-26y/oN = 20 65-83y/o

Griffioen-Roose et al., AJCN 2012;95:32-38
37 lean adultsIso-energetic diets - 14 d 0.5g protein/kg BW/d – 2.5d 2.0g protein/kg BW/d – 2.5d
13% increase on low protein (p<0.001)
NS

Coelho et al., Appetite 2006;47: 352-360.
89 female undergraduates
• Protein restricted - 3d• Limit animal protein
• Carbohydrate restricted - 3d• Limit high CHO foods
• Control
0
20
40
60
80
100
0.00 2.00 4.00 6.00 8.00 10.00 12.00 14.00
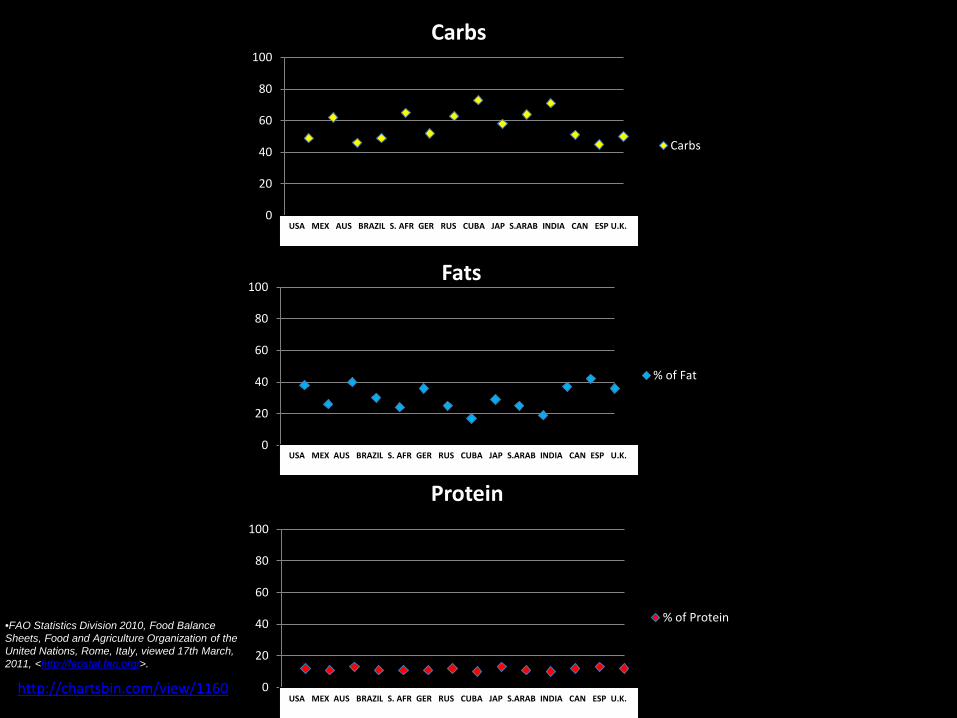
Carbs
Carbs
0
20
40
60
80
100
0 2 4 6 8 10 12 14
Fats
% of Fat
0
20
40
60
80
100
0 2 4 6 8 10 12 14
Protein
% of Protein
USA MEX AUS BRAZIL S. AFR GER RUS CUBA JAP S.ARAB INDIA CAN ESP U.K.
USA MEX AUS BRAZIL S. AFR GER RUS CUBA JAP S.ARAB INDIA CAN ESP U.K.
USA MEX AUS BRAZIL S. AFR GER RUS CUBA JAP S.ARAB INDIA CAN ESP U.K.http://chartsbin.com/view/1160
•FAO Statistics Division 2010, Food Balance Sheets, Food and Agriculture Organization of the United Nations, Rome, Italy, viewed 17th March, 2011, <http://faostat.fao.org/>.

Simpson & RaubenheimerObes Rev 2005;6:133-142
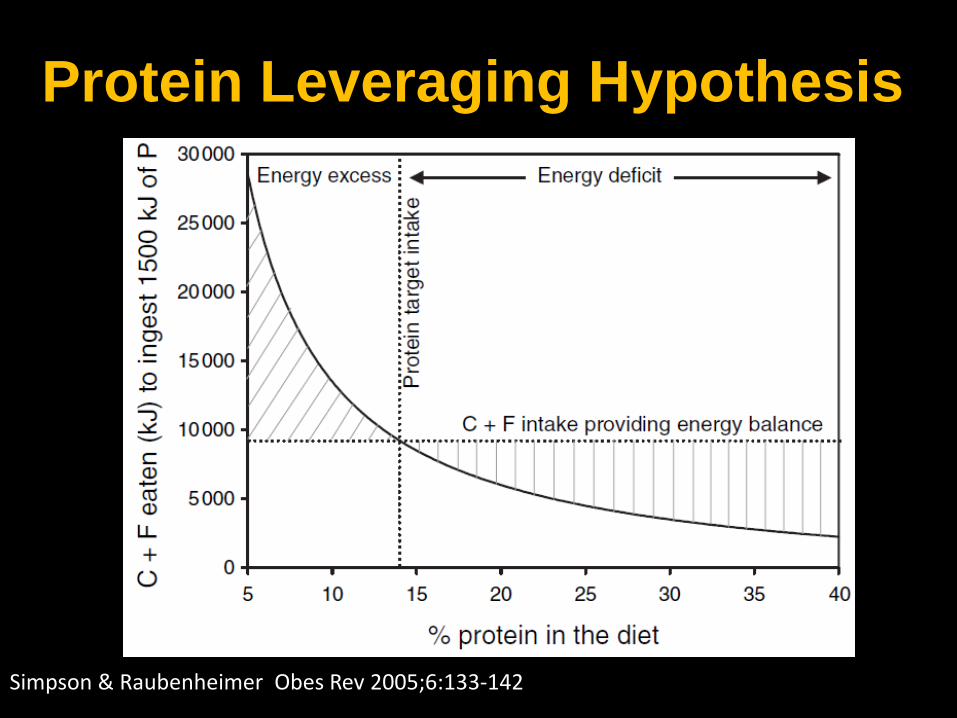
Simpson & Raubenheimer Obes Rev 2005;6:133-142
Protein Leveraging Hypothesis

Gosby et al., PLoS ONE 2011;6:e25929

Total energy and nutrient intakes over the 4-day 10%, 15% and 25% protein ad-libitum study periods
Gosby AK, Conigrave AD, Lau NS, Iglesias MA, et al. (2011) Testing Protein Leverage in Lean Humans: A Randomized Controlled Experimental Study. PLoS ONE 6(10): e25929. doi:10.1371/journal.pone.0025929http://www.plosone.org/article/info:doi/10.1371/journal.pone.0025929

Martens et al., AJCN 2013;97:86-93
5%en Protein15%en Protein
30%en Protein

Martens et al., Am J ClinNutr 2013;97:86-93
40 male, 39 female adultsNormal weight12 day RCT

Martens et al;, Am J Clin Nutr 2014;99:1397-1406.

Protein Appetite
SpecificNon-Specific

Hypothesis
• Quantity per meal• Daily amount• Pattern of use• Food source• Food form • Mode of action
Protein is a modifiable dietary constituent that may aid in weight management while contributing
positively to diet quality• Appetitive Sensations
• Food Choice
• Post-Prandial Thermogenesis
• Resting Energy Expenditure
• Substrate Oxidation

Appetite• Hunger – Initiation of ingestive event –
energy-based• Desire to Eat - Initiation of ingestive event –
cognitive/sensory-based• Fullness – Termination of ingestive event• Prospective Consumption – Projected portion
size

High Protein Diets & Weight Loss
mo Atkins Zone LEARN Ornish p
2 1381 1455 1476 1408 .526 1538 1503 1598 1553 .64
mo Atkins Zone LEARN Ornish p
2 34.6 34.5 34.8 34.7 .88
6 34.3 34.4 34.8 34.6 .65
Energy Intake (Kcals/d)
Energy Expenditure (Kcals/kg/d)
“The greater satiety from the higher protein content of the Atkins diet may have contributed to the benefits observed for that group”
Gardner et al., JAMA 2007;297:969-977.

Weigle et al., AJCN 2005;82:41-48

Santesso et al., Eur j Clin Nutr 2012;66:780-788
(38 studies)
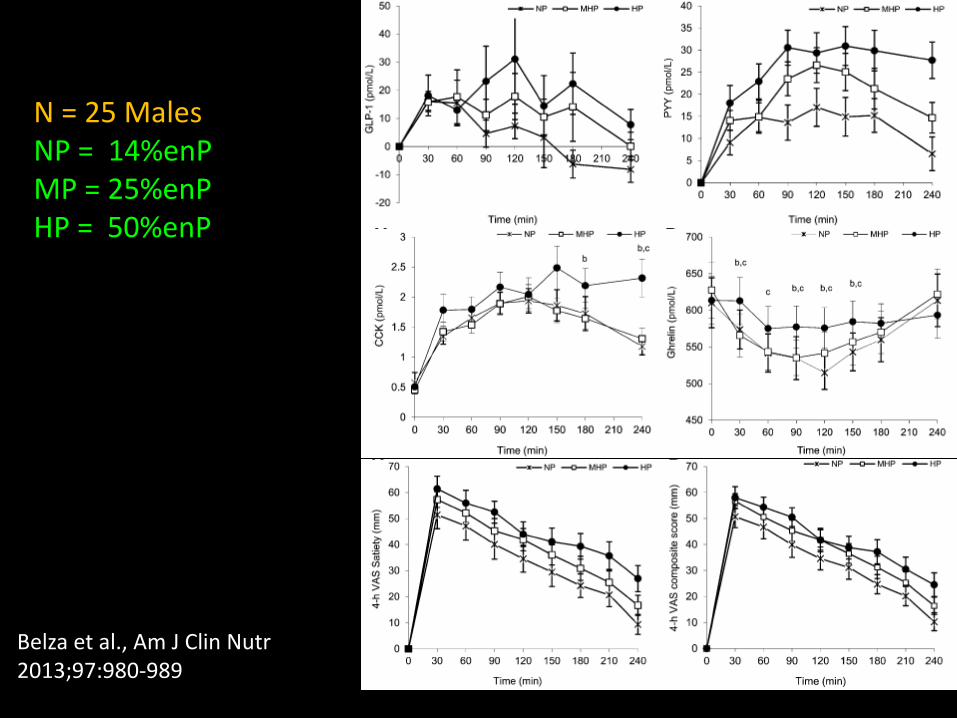
Belza et al., Am J Clin Nutr2013;97:980-989
N = 25 MalesNP = 14%enPMP = 25%enPHP = 50%enP

Brennan et al., Am J Physiol2011;303:G129-G140
N = 16 Lean, 16 Obese Adults
HF = 6.2gP (~12%en)HC = 9.8gP (~17%en)HP = 23.3gP (~44%en)
LP = 6.2gP (~12%en)AP = 15.2gP (~29%en)HP = 23.3gP (~44%en)

Brennan et al., Am J Physiol2011;303:G129-G140
N = 16 Lean, 16 Obese AdultsHF = 6.2gP (~12%en)HC = 9.8gP (~17%en)HP = 23.3gP (~44%en)

Brennan et al., Am J Physiol2011;303:G129-G140
N = 16 Lean, 16 Obese AdultsLP = 6.2gP (~12%en)AP = 15.2gP (~29%en)HP = 23.3gP (~44%en)

Energy Intake

Recent ReviewLeidy et al., AJCN – Protein Summit 2
• Acute feeding trial >120 minutes• Low and high protein isoenergetic meals• Protein differential >10g• <40% of meal as fat• Outcomes of: appetite ratings, food intake, or
measured hormones • 24 Studies

Percent Favoring High ProteinOutcome Percent of Studies
Hunger (reduction) 35%
Fullness (increase) 55%
Ghrelin (reduction) 37%
GLP-1 (increase) 47%
PYY (increase) 47%
Food Intake (reduction) 18%

Authors Duration Effects on Satiety Effect on Food Intake
Johnson, 1993Poppitt, 1998Porrini, 1995Rolls, 1988Stubbs, 1996Stubbs, 1999Johnstone, 1996Barkling, 1990DeGraaf, 1992Geliebter, 1978Long, 2000Hill, 1986Holt, 1995Vanderwater, 1994Westerterp-Plantenga, 1999Booth, 1970Ludwig, 1999Araya, 2000Porrini, 1997Teff, 1989
90m90m2h2h5h24h15d4hday70m13h/13d1h2h2m24h2.5h5h3.5h2h3h
IncreaseIncreaseIncreaseIncreaseIncreaseIncreaseIncrease
NSNSNS
I (acute) D (chronic)IncreaseIncreaseIncreaseIncrease
-----
DecreaseDecreaseDecreaseDecrease
NSNSNS
DecreaseNSNS-----
DecreaseDecreaseDecrease
NSNS
Summary of Protein Appetite Research
Eisenstein et al., Nutr Rev 2002; 60:189-20036

Authors Form Effect on Hunger Effect on Food Intake
Booth et al.
Hill & Blundell
Hill & Blundell
Rolls et al.
Barkeling et al.
Stubbs et al.
Vanderwater & Vickers
Johnson & Vickers
Poppitt et al.
Lambert et al.
Latner & Schwarts
Driver
de Graaf et al.
Stockley et al.
Sunkin & Garrow
Geilebter
Rumpler et al.
Solid
Solid
Solid
Solid
Solid
Solid
Solid
Solid
Solid
Liquid
Liquid
Liquid
Liquid
Liquid
Liquid
Liquid
Liquid (34g)
Decrease
Decrease
Decrease
=
Decrease
Decrease
Decrease
Decrease
Decrease
Decrease
=
=
=
Decrease
Decrease
Decrease
Decrease
=
Decrease
Decrease
Decrease
Decrease
=
=
=
=
=
Summary of Protein Appetite Research
Eisenstein et al., Nutr Rev 2002; 60:189-20037

0
500
1000
1500
2000
2500
3000
3500
4000
Kca
lsEnergy Intake
(N=40)
Liquid
Solid
Liquid
Solid
Liquid
Solid
Carbohydrate Fat Protein
**
*
(Watermellon) (Coconut) (Dairy)

Body Weight

Rate of Weight Loss is Unaffected by Dietary Macronutrient Content
Kinsell, et al Metabolism 13:195, 1964.
160
180
200
220
240
260
280
0 10 20 30 40 50 60 70 80
Days
Fat 12-83%en
Protein 14-36%en
Carbohydrate 3-64%en

In Energy Balance, Weight is Unaffected by Diet Composition
Leibel, et al Am J Clin Nutr 55:350, 1992.
N=16: 13 adults, 3 children
Intervention:15-56 days
Protein: 15%en

Energy Intake of Trappist Nuns Unaffected by Diet Composition
Van Stratum Am J Clin Nutr 31:206, 1978
N=22
Fat: 24 vs 47%en
Protein: 18%en

Dansinger et al., JAMA 2005;293:43-53

Sacks et al., NEJM 2009;360:859-873

Sacks et al., NEJM 2009;360:859-873

Wycherley et al., Am J Clin Nutr 2012; 96:1281-1298

Wycherley et al., Am J Clin Nutr 2012; 96:1281-1298
Fat Mass

Wycherley et al., Am J Clin Nutr 2012; 96:1281-1298
Fat-Free Mass

Dong et al. Br J Nutr 2013; 110:781-189
Patients with Type 2 Diabetes

Santesso et al., Eur JClin Nutr2012;66:780-788
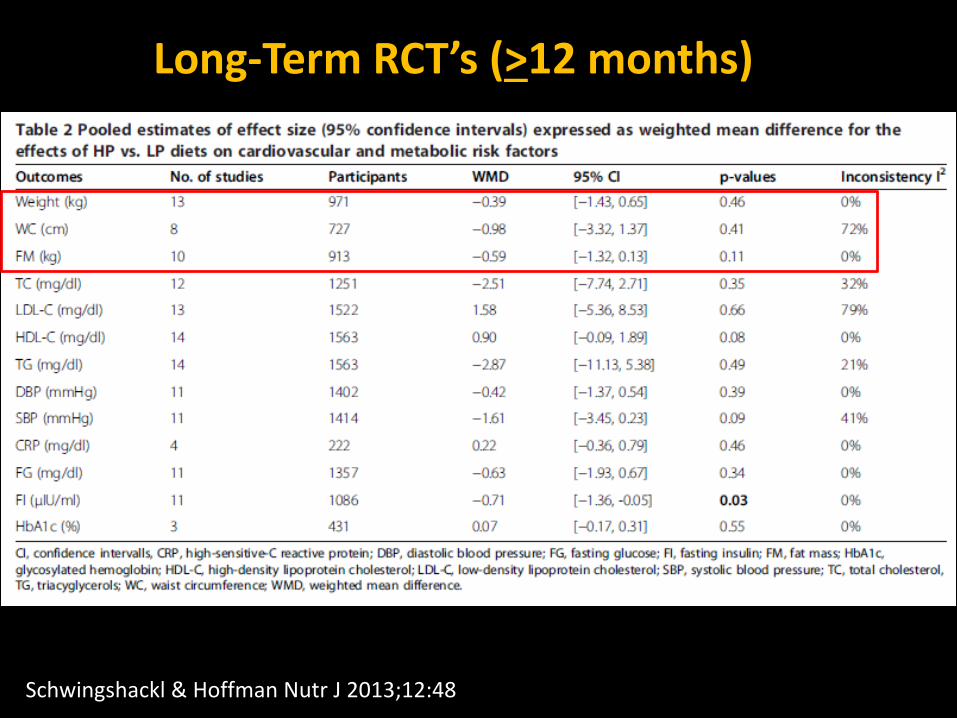
Schwingshackl & Hoffman Nutr J 2013;12:48
Long-Term RCT’s (>12 months)

Clifton et al., Nutr Metab & Cardiovasc Dis 2014;24:224-235

Clifton et al., Nutr Metab 7 Cardiovassc Dis 2014;24:224-235
Long-Term Weight Maintenance ( Follow-up >12 months)

ThermogenicEffect of Feeding

Ravn et al., Food Nutr Res 2013;57: 19676
TEF and Appetite

Weigle et al., AJCN 2005;82:41-48

Table 3. Thermic Effect of Feeding (TEF)____________________________________________________________________________
Author Duration (hours) Diet TEF %____________________________________________________________________________Crovetti10 7.0 68% P, 19% F, 12% C 11.0
69% C, 21% F, 10% P 4.070% F, 21% C, 9% P 4.2
Swaminathan20 1.5 100% P 6.3100% C 3.3100% F 1.012% P, 33% F, 55% C 5.4
Welle21 4.0 100% P 10.3100% C 7.3100% F 6.5
Schutz22 4.0 14% P, 59% C, 27% F 6.55% P, 64% C, 31% F 3.5
Robinson23 9.0 77% P, 7% F, 16% C 11.577% C, 7% F, 16% P 8.0
Karst24 6.0 100% P 20.7100% C 4.7
Nair25 2.6 100% P 15.0100% C 6.0100% F 7.0
Westerterp26 24.0 29% P, 61% C, 10% F 14.69% P, 30% C, 61% F 10.5
Hendler27 3.0 95% P, 2% C, 3% F 4.041% P, 55% C, 4% F 5.8
Steiniger28 6.0 100% P 22.0100% C 5.7
P = protein, F = fat, C = carbohydrate
Eisenstein et al., Nutr Rev 2002;60:189-200

Thermogenic Contribution to Energy Balance
2000 Diet Kcal (15%P; 30%F; 55%F) 130 Kcals2000 Diet Kcal (30%P; 30%F; 40%F) 153 Kcals
TEF = 0.132P(g) + 0.051F(g) + 0.054C(g)
*Requires ~2-fold increase in Energy from Protein

REE

Wycherley et al., Am J Clin Nutr 2012; 96:1281-1298
Resting Energy Expenditure

Leidy et al., Obesity 2007;15:421-429
46 overweight-obese f adult females
12 week 750kcal deficit diet
18%en or 30%en Protein
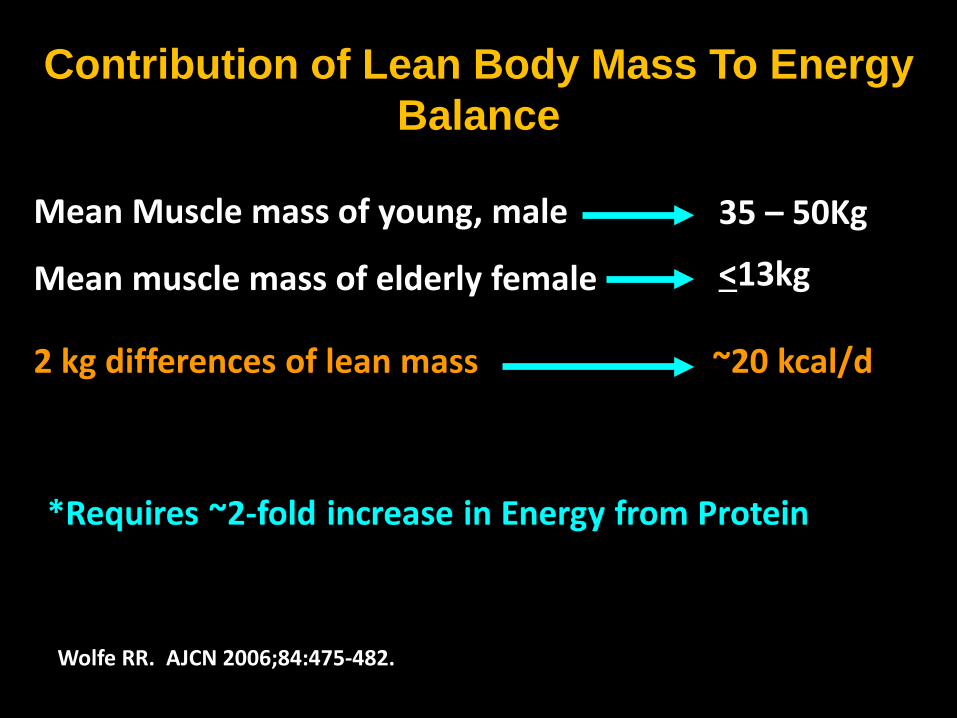
Contribution of Lean Body Mass To Energy Balance
Mean Muscle mass of young, male
Mean muscle mass of elderly female
35 – 50Kg
<13kg
2 kg differences of lean mass ~20 kcal/d
Wolfe RR. AJCN 2006;84:475-482.

Summary• Higher protein diets:• May enhance fullness under selected conditions• Have higher thermogenic properties that may modestly
aid weight loss or maintenance• Are associated with greater retention of lean body
mass and higher resting energy expenditure• May be associated with lower energy intake acutely• May promote modest reduction of body weight and fat
mass • May aid weight maintenance

Small Changes:
Are They Meaningful?

Future Directions:Leveraging Protein for Weight management
Quantify the contributions from:– Each mode of action– Satiety, palatability, and protein balance– Protein sources, food form, pattern of intake– Individual differences


