32
Protein Classification A comparison of function inference techniques
| Date post: | 22-Dec-2015 |
| Category: |
Documents |
| View: | 231 times |
| Download: | 4 times |

Protein Classification
A comparison of function inference techniques
Why do we need automated classification? Sequencing a genome is only the
first step. Between 35-50% of the proteins in
sequenced genomes have no assigned functionality.
Direct observation of function is costly, time consuming, and difficult.

Protein DomainsThe tertiary structure of many proteins is built from several domains.
Often each domain has a separate function to perform for the protein, such as:
•binding a small ligand (e.g., a peptide in the molecule shown here)
•spanning the plasma membrane (transmembrane proteins)
•containing the catalytic site (enzymes)
•DNA-binding (in transcription factors)
•providing a surface to bind specifically to another protein
In some (but not all) cases, each domain in a protein is encoded by a separate exon in the gene encoding that protein.
Inference through sequence similarity
ProtoMap: Automatic Classification of Protein
Sequences, a Hierarchy of Protein Families, and Local Maps of the Protein Space
(1999)

Final Goal

Observations Sometimes you don’t know where
the domains are. It is generally accepted that two
sequences with over 30% identity are likely to have the same fold.
Homologous proteins have similar functions.
Homology is a transitive relationship.

Departures Authors do not attempt to define protein
domains or motifs. Not dependant on predefined groups or
classifications. Chart the space of all proteins in
SWISSPROT, as opposed to individual families
Produce global organization of sequences.

Algorithm Overview We construct a weighted graph
where the nodes are protein sequences and the edges are similarity scores.
Cluster the network considering only those edges above some threshold.
Decrease similarity threshold and repeat.
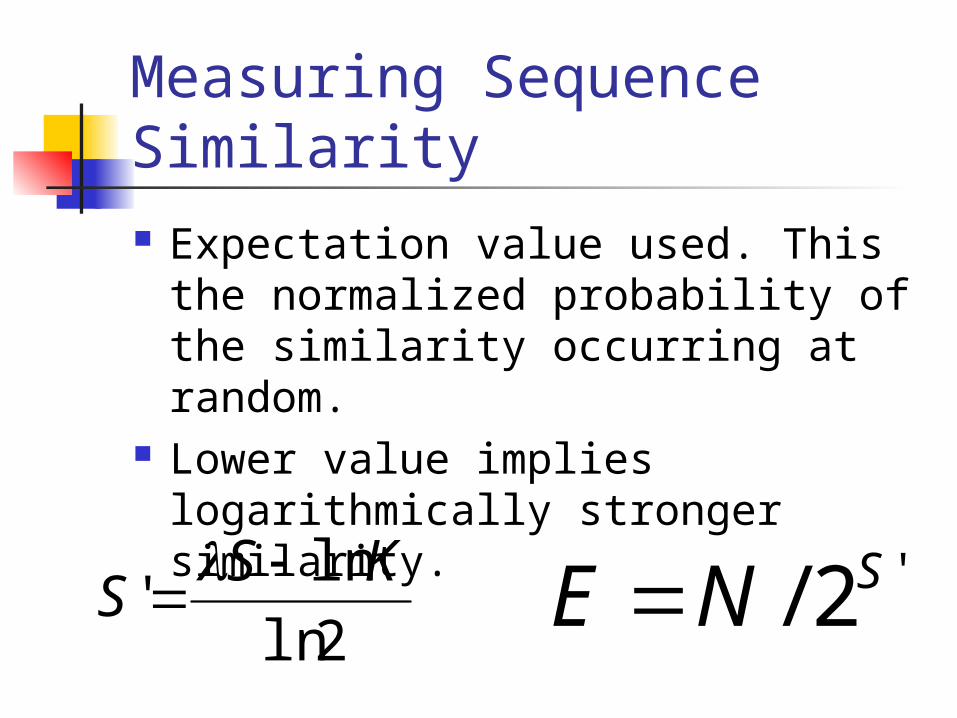
Measuring Sequence Similarity Expectation value used. This the
normalized probability of the similarity occurring at random.
Lower value implies logarithmically stronger similarity.
2ln
ln'
KSS
'2/ SNE
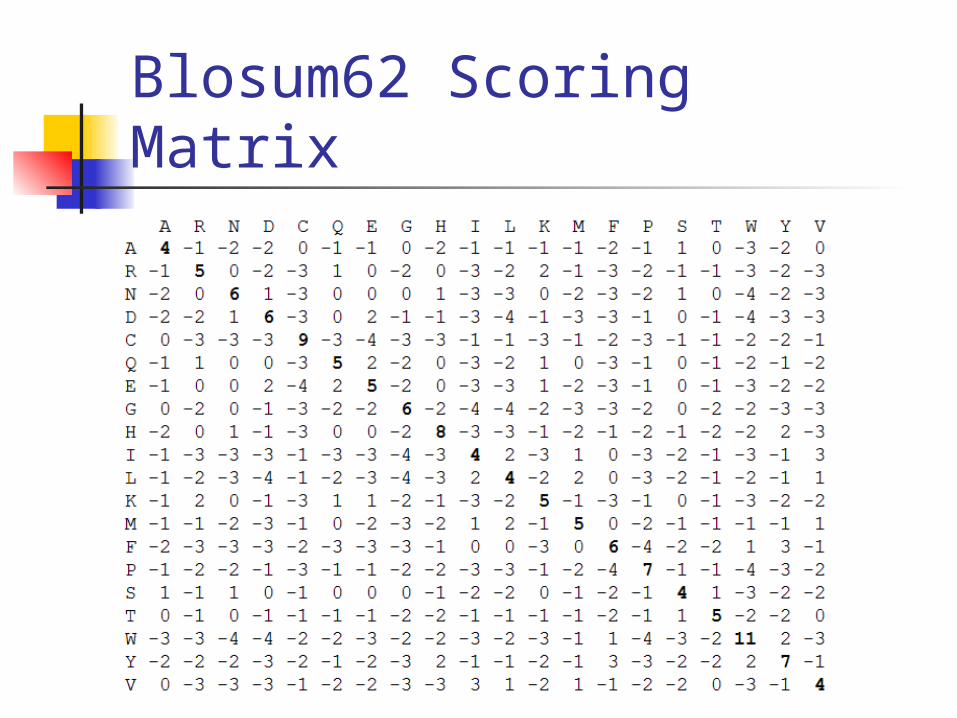
Blosum62 Scoring Matrix
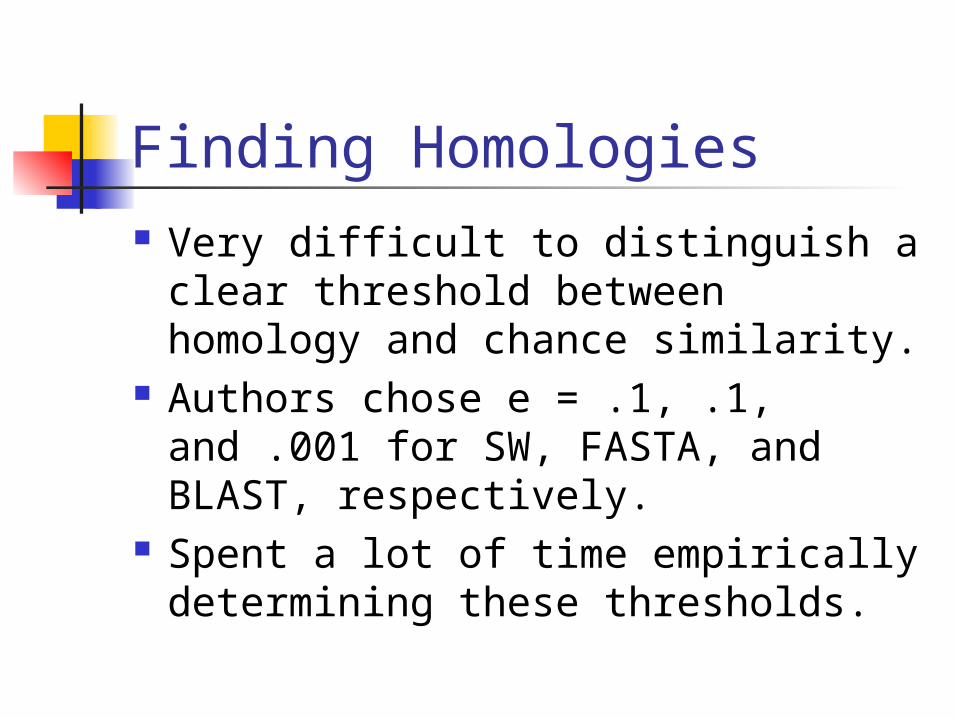
Finding Homologies Very difficult to distinguish a clear
threshold between homology and chance similarity.
Authors chose e = .1, .1, and .001 for SW, FASTA, and BLAST, respectively.
Spent a lot of time empirically determining these thresholds.

ClusteringClustering is done iteratively.
Start with a threshold of E < 10-100
Cluster and increase threshold by a factor of 105
Sublinear threshold prevents the collapse of sequence space
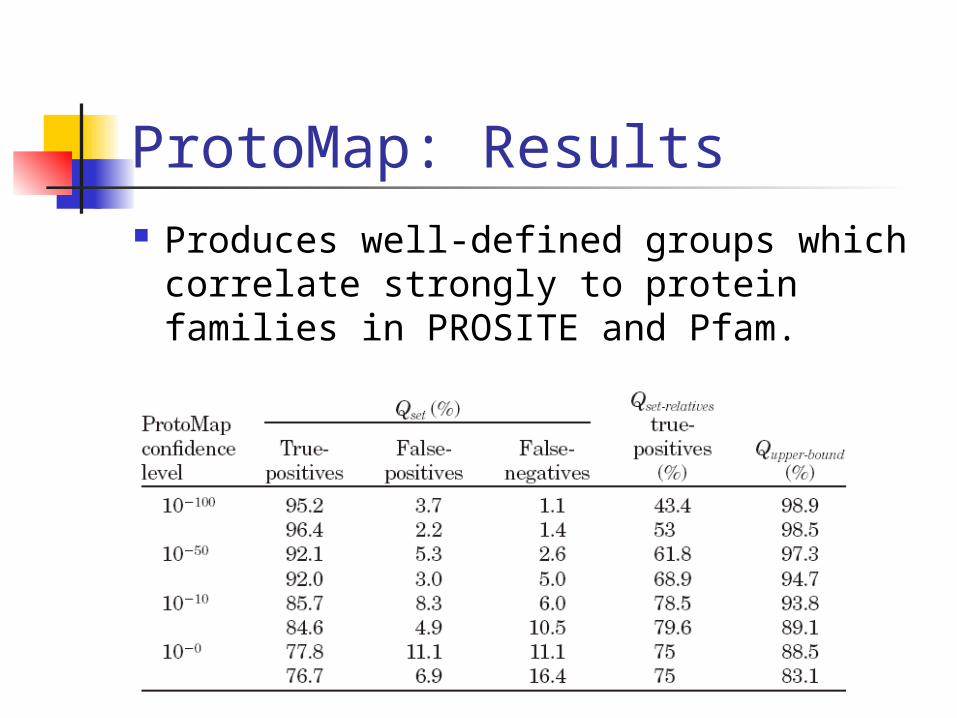
ProtoMap: Results Produces well-defined groups
which correlate strongly to protein families in PROSITE and Pfam.

Results:Immunoglobin Superfamily

ProtoMap: Limitations
Analysis performs poorly by families dominated by short/local domains (PH, EGF, ER_TARGET, C2, SH2, SH3, ect…)
High scoring, low complexity segments can lead to nonhomogeneous clusters.
“Hard” clustering vs. “Soft” clustering Has difficulty classifying multidomain
proteins.
ProtoMap: Future Directions
3D structure/fold Biological function Domain content Cellular location Tissue specificity Source organism Metabolic pathways
Inference through protein interaction networks
Functional Classification of Proteins for the Prediction of
Cellular Function from a Protein-Protein Interaction
Network (2003)
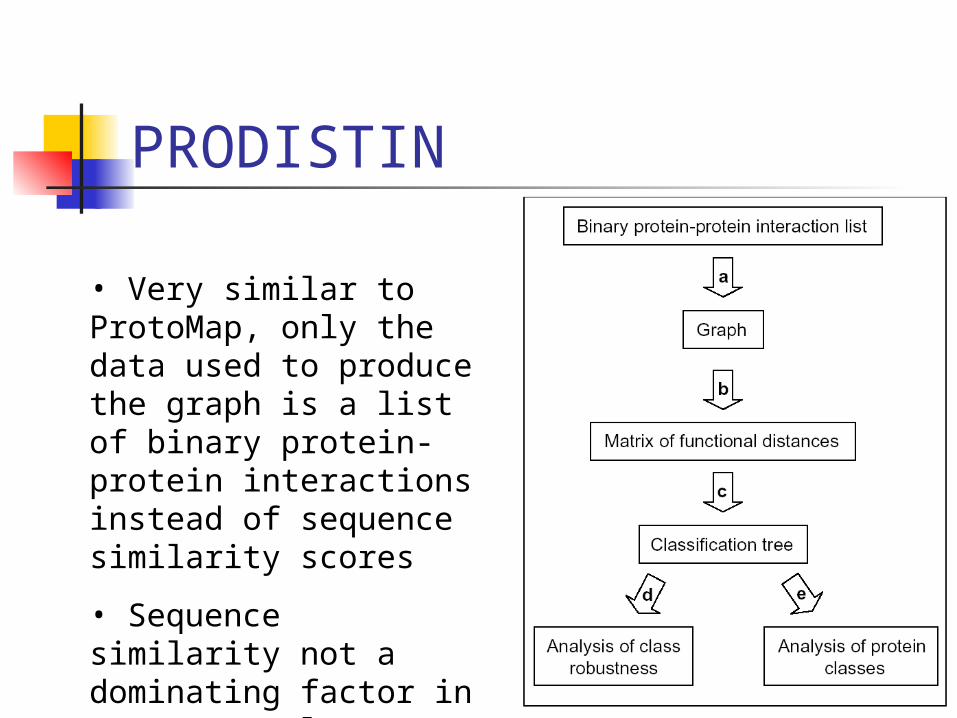
PRODISTIN
• Very similar to ProtoMap, only the data used to produce the graph is a list of binary protein-protein interactions instead of sequence similarity scores
• Sequence similarity not a dominating factor in PRODISTIN clusters
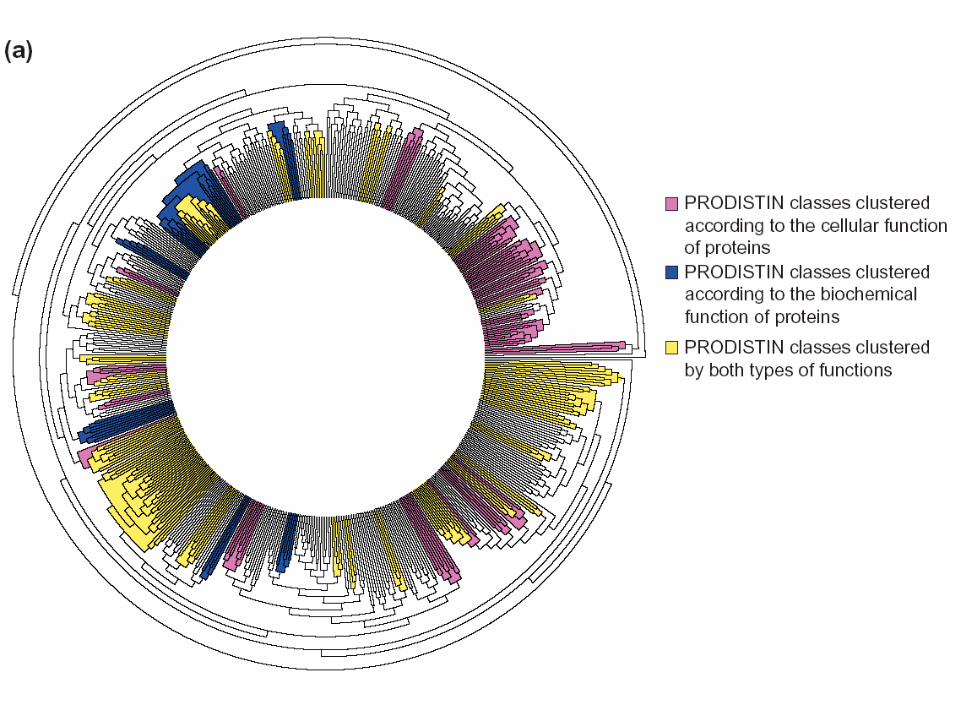


PRODISTIN Results
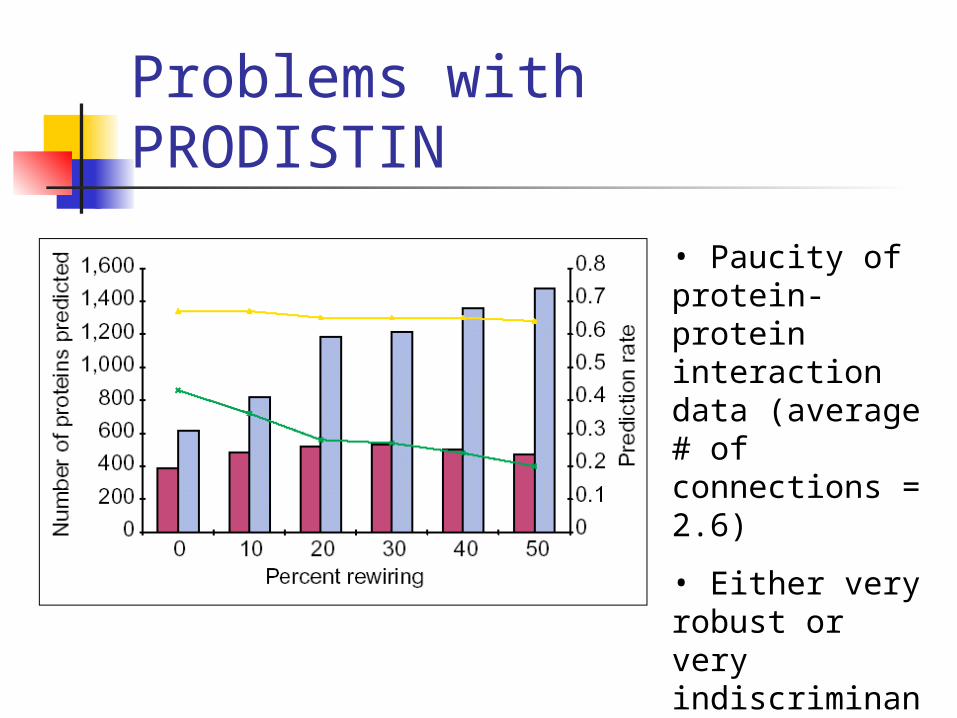
Problems with PRODISTIN
• Paucity of protein-protein interaction data (average # of connections = 2.6)
• Either very robust or very indiscriminant
Problems: Multidomain and Nonlocal Proteins
• protein kinases
• hydrolases
• ubiquitin…
PRODISTIN: Present problems in clustering by biochemical function
ProtoMap: Can create undesired connection among unrelated groups

Scale-Free Networks
j j
i
k
k~P(linking to node
i)
• Node connection probability follows a power law distribution
• Maximum degree of separation grows as O(lg n)
• Highly robust under noise, except at hubs and superhubs.
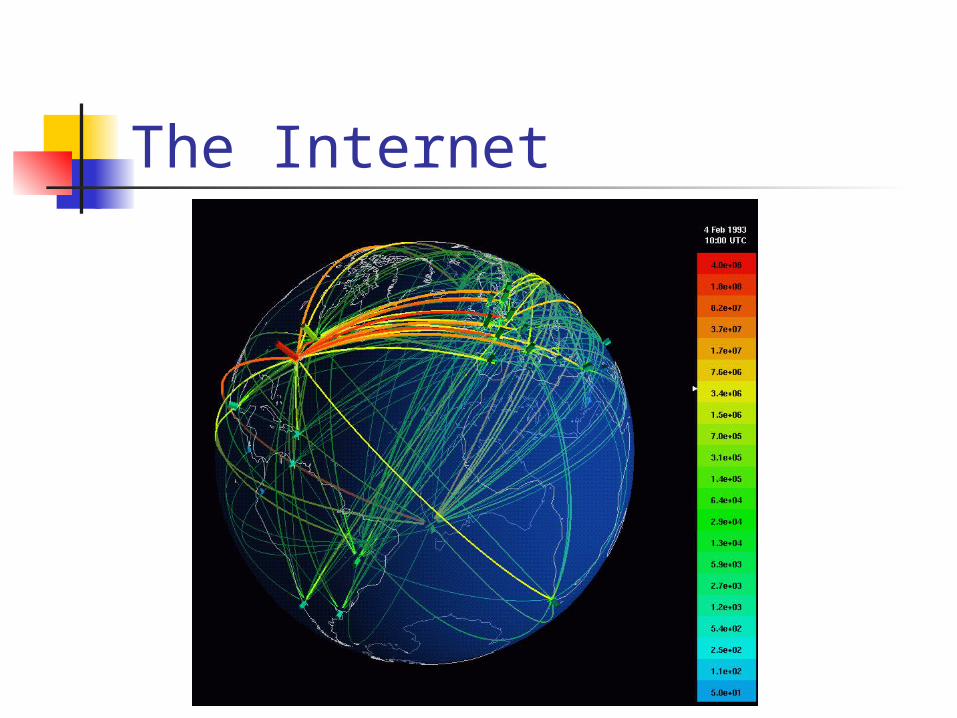
The Internet
The Movies

Social Networks
Metabolic Networks
http://biocomplexity.indiana.edu/research/bionet/
• The E. coli metabolic network is scale-free.
• Actually, the metabolic networks of all organisms in all three domains of life appear to be scale-free (43 examined)
• The network diameter of all 43 metabolic networks is the same, irrespective of the number of proteins involved.
• Is this counter-intuitive? Yes.

Protein Domain Networks
http://mbe.oupjournals.org/cgi/content/full/18/9/1694
• Protein Domains – Nature’s take on writing modular code
• Reconciles apparent paradox of a fixed network diameter across species – despite vast differences in complexity (some human proteins have 130 domains)
• Occurrence of specific protein domains in multidomain proteins is scale-free.

Protein Domain Graphs
• Prosite domains have a distribution following the power-law function f(x) = a(b + x)-c, with c = .89. There are few highly connected domains and many rarely connected ones.
• ProDom and Pfam domains follow the power function
kkP )(
y = 2.5 for ProDom
y = 1.7 for Pfam
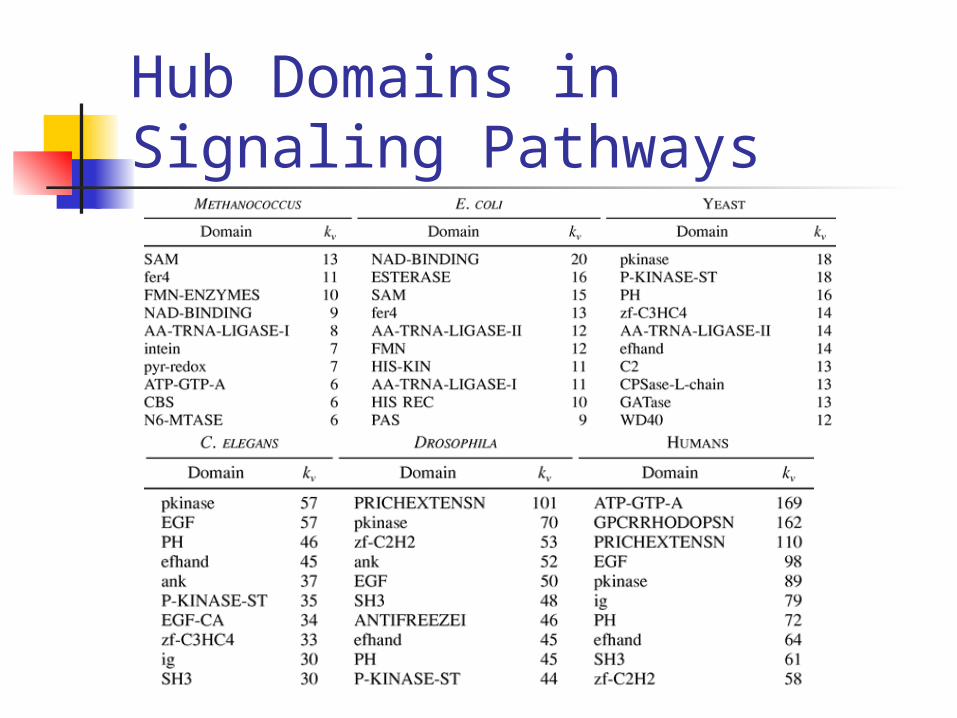
Hub Domains in Signaling Pathways

Conclusions• The accuracy of both ProtoMap and PRODISTIN is limited because they make the tacit assumption of a random network topology.
• Protein-Protein interaction networks have scale-free topology, foiling PRODISTIN
• Protein Domain networks have scale-free topology, foiling ProtoMap
• Any protein classification algorithm that performs better than ProtoMap is probably going to have to address this issue.


