ARTICLE Protein conformational flexibility modulates kinetics and thermodynamics of drug binding M. Amaral 1,2,10 , D.B. Kokh 3 , J. Bomke 4 , A. Wegener 2 , H.P. Buchstaller 5 , H.M. Eggenweiler 5 , P. Matias 1,6 , C. Sirrenberg 7 , R.C. Wade 3,8,9 & M. Frech 2 Structure-based drug design has often been restricted by the rather static picture of protein–ligand complexes presented by crystal structures, despite the widely accepted importance of protein flexibility in biomolecular recognition. Here we report a detailed experimental and computational study of the drug target, human heat shock protein 90, to explore the contribution of protein dynamics to the binding thermodynamics and kinetics of drug-like compounds. We observe that their binding properties depend on whether the protein has a loop or a helical conformation in the binding site of the ligand-bound state. Compounds bound to the helical conformation display slow association and dissociation rates, high-affinity and high cellular efficacy, and predominantly entropically driven binding. An important entropic contribution comes from the greater flexibility of the helical relative to the loop conformation in the ligand-bound state. This unusual mechanism suggests increasing target flexibility in the bound state by ligand design as a new strategy for drug discovery. DOI: 10.1038/s41467-017-02258-w OPEN 1 iBET - Instituto de Biologia Experimental e Tecnológica, Oeiras 2780–157, Portugal. 2 Molecular Interactions and Biophysics, Merck KGaA, Darmstadt 64293, Germany. 3 Molecular and Cellular Modeling Group, Heidelberg Institute for Theoretical Studies, Heidelberg 69118, Germany. 4 Molecular Pharmacology, Merck KGaA, Darmstadt 64293, Germany. 5 Medicinal Chemistry, Merck KGaA, Darmstadt 64293, Germany. 6 ITQB - Instituto de Tecnologia Química e Biológica António Xavier, Universidade Nova de Lisboa, Oeiras 2780-157, Portugal. 7 Cellular Pharmacology - Oncology, Merck KGaA, Darmstadt 64293, Germany. 8 Zentrum für Molekulare Biologie, DKFZ-ZMBH Alliance, Heidelberg University, Heidelberg 69120, Germany. 9 Interdisciplinary Center for Scientific Computing, Heidelberg University, Heidelberg 69120, Germany. 10 Present address: Sanofi-Aventis Deutschland GmbH, R&D, Biologics Research/Protein Therapeutics, Frankfurt am Main 65926, Germany. M. Amaral and D. B. Kokh contributed equally to this work. Correspondence and requests for materials should be addressed to M.A. (email: marta.amaral@sanofi.com) or to R.C.W. (email: [email protected]) NATURE COMMUNICATIONS | 8: 2276 | DOI: 10.1038/s41467-017-02258-w | www.nature.com/naturecommunications 1 1234567890
Transcript
ARTICLE
Protein conformational flexibility modulateskinetics and thermodynamics of drug bindingM. Amaral 1,2,10, D.B. Kokh 3, J. Bomke4, A. Wegener2, H.P. Buchstaller5, H.M. Eggenweiler5, P. Matias 1,6,
C. Sirrenberg7, R.C. Wade 3,8,9 & M. Frech2
Structure-based drug design has often been restricted by the rather static picture of
protein–ligand complexes presented by crystal structures, despite the widely accepted
importance of protein flexibility in biomolecular recognition. Here we report a detailed
experimental and computational study of the drug target, human heat shock protein 90, to
explore the contribution of protein dynamics to the binding thermodynamics and kinetics of
drug-like compounds. We observe that their binding properties depend on whether the
protein has a loop or a helical conformation in the binding site of the ligand-bound state.
Compounds bound to the helical conformation display slow association and dissociation
rates, high-affinity and high cellular efficacy, and predominantly entropically driven binding.
An important entropic contribution comes from the greater flexibility of the helical relative to
the loop conformation in the ligand-bound state. This unusual mechanism suggests
increasing target flexibility in the bound state by ligand design as a new strategy for drug
discovery.
DOI: 10.1038/s41467-017-02258-w OPEN
1 iBET - Instituto de Biologia Experimental e Tecnológica, Oeiras 2780–157, Portugal. 2Molecular Interactions and Biophysics, Merck KGaA, Darmstadt64293, Germany. 3Molecular and Cellular Modeling Group, Heidelberg Institute for Theoretical Studies, Heidelberg 69118, Germany. 4MolecularPharmacology, Merck KGaA, Darmstadt 64293, Germany. 5Medicinal Chemistry, Merck KGaA, Darmstadt 64293, Germany. 6 ITQB - Instituto deTecnologia Química e Biológica António Xavier, Universidade Nova de Lisboa, Oeiras 2780-157, Portugal. 7 Cellular Pharmacology - Oncology, Merck KGaA,Darmstadt 64293, Germany. 8 Zentrum für Molekulare Biologie, DKFZ-ZMBH Alliance, Heidelberg University, Heidelberg 69120, Germany. 9 InterdisciplinaryCenter for Scientific Computing, Heidelberg University, Heidelberg 69120, Germany. 10Present address: Sanofi-Aventis Deutschland GmbH, R&D, BiologicsResearch/Protein Therapeutics, Frankfurt am Main 65926, Germany. M. Amaral and D. B. Kokh contributed equally to this work. Correspondence andrequests for materials should be addressed to M.A. (email: [email protected]) or to R.C.W. (email: [email protected])
Understanding protein–drug binding mechanisms, andcharacterizing their thermodynamics and kinetics arefundamental prerequisites to developing effective drug
discovery procedures and, indeed, to developing effective drugs. Ithas been demonstrated that the duration of the pharmacologicalaction1–4 of a drug molecule is frequently related to its targetresidence time, τ (= 1/koff, where koff is the rate constant fordissociation of the drug–target complex), rather than its bindingaffinity (which determines the equilibrium dissociation constant,KD)5,6. Moreover, drug–target binding kinetics (characterized byassociation, kon, and dissociation, koff, rate constants) have beenshown to be relevant for predicting drug efficacy and off-targettoxicity1,7.
A commonly used strategy in drug design is to modify a leadcompound to increase the binding affinity (i.e., minimize KD) bystabilizing the bound ground state, denoted GS in Fig. 1a, whichshows a simple 1-barrier free energy profile for binding. However,an improvement in binding affinity does not necessarily lead to aprolongation of the residence time, since the ground state stabi-lization may be compensated by stabilization of the transitionstate (TS in Fig. 1a). On the other hand, τ can be increased bydestabilizing the transition state, and simultaneously slowing theassociation rate, while preserving the same binding affinity. Inone of the very few publications on this topic, it was shown thatboth transition state destabilization and ground state stabilization
contributed to the prolongation of the residence times of 27 drugsand inhibitors of various enzymes. However, the underlyingmechanisms of transition state stabilization or destabilization arenot well understood8. Perhaps the most compelling evidence ofthe influence of transition state destabilization in the modulationof residence time comes from a recent study carried out bySpagnuolo et al., in which they developed triazole-containingdiphenyl ether compounds with increased residence times onInhA and slower association rates but little changed bindingaffinities9.
From a thermodynamic perspective, the early stages of liganddesign and optimization typically focus on drug–target interac-tions in the binding site and their enthalpic optimization10.Entropy is primarily considered in terms of solvation of hydro-phobic groups, while target flexibility is rarely taken into account.The generally rather static view of the binding event has been putinto question by several studies of the contribution of targetconformational entropy to the free energy of protein–ligandassociation11–17. Nonetheless, analysis of various databases18,with data from isothermal titration calorimetry (ITC) measure-ments on the thermodynamics of ligand binding to proteinsconfirms that strong entropic binders driven by conformationalflexibility are still hardly represented19.
Binding kinetics and thermodynamics can also be affected byprotein flexibility, but this aspect has only been addressed
Free
ene
rgy
TS
a b
or kon
kon [L]
kC1 [L]
kC1[L]
k1 [L]
k1[L]
k–C1
k–1
k–C
k–C1k–C
k–1k–2
kC
kC
k2
k2
k–2kon [L]
∝
∝
–ΔGon
–ΔGoff
ΔG off
ΔG on
ΔG D
–ΔGD
kT
kT
kT
e
e
e=
koff
koff
koff
KD
Reaction coordinate
Protein-ligand distance/reactioncoordinate
Experimentallyobservable
Pro
tein
inte
rnal
deg
rees
of fr
eedo
m
GS
Conformationalselection
Conformationalselection
R + L
R + L
Rc + L
Rc + L
Rc + L
Rc + L
RL
RL
RL
RL
[RL]#
[RL]#
Induced fit
Induced fit
Fig. 1 Models of drug–target binding. a Schematic diagram of a one-barrier drug–target binding free energy profile. A one-step model with one free energybarrier is used to derive the experimental rate constants. The figure and equations show how the steady-state rate constants relate to the free energydifferences shown. The residence time of a drug bound to its target, τ (which is the reciprocal of the rate constant for dissociation of the drug–targetcomplex, koff), results from the “difference” in free energy between the transition state (TS) and the bound ground state (GS), ΔGoff. The red arrowsindicate that prolongation of the τ can be achieved by stabilizing the GS (increasing the magnitude of ΔGD), destabilizing the TS (increasing ΔGon) or acombination of both (i.e., Koff / e
�ΔGoffkT ¼ KDe
�ΔGonkT ). b Diagram schematically illustrating different mechanisms of drug binding involving protein
conformational changes. R and RC denote two different conformations of the protein, the latter requires conformational changes for ligand binding. Thesemay occur by conformational selection (blue path) or by induced fit upon formation of an encounter complex [RL]# (red path), or by a combination of thetwo mechanisms. Binding proceeds through an energetically unfavorable intermediate state (TS in panel A or a local minimum in a 2 (or more)-stepbinding free energy profile) that, in the conformational selection and induced fit mechanisms, corresponds, respectively, to the R+L or [RL]# state of thesystem); the final complex is denoted by [RL]. kC/–C and k2/−2 are the rates of intrinsic and ligand-induced protein conformational transitions, respectively;k1/−1 and kC1/−C1 are rates of formation of the bound and encounter complexes, assuming that the protein is in conformations R and RC, respectively; koff andkon are experimentally observed off- and on–binding rates. The gray path and third equation describe the pseudo-one-step binding process shown in (a) isused to derive the experimental rate constants
sporadically in the literature13,20,21. Analysis of enzyme inhibitionkinetics reported in ref. 22 suggests that slow inhibition is oftenassociated with a two-step binding process, where the first step offast binding to an intermediate state is followed by a slow proteinconformational adjustment, leading to a final bound complex. Incontrast, Pargellis et al. have shown that the origin of the slowbinding kinetics of a diaryl urea class of allosteric highly potentinhibitors against p38 MAP kinase is due to the large con-formational change of the DFG motif, which occurs only rarely inthe protein apo state, gating selection of a protein conformationcompatible with inhibitor binding20. These examples representtwo main approaches to describing the contribution of the targetflexibility to molecular recognition: induced-fit23 and conforma-tional selection24, respectively (Fig. 1b). However, the majority ofprotein–ligand-binding events cannot be exclusively assigned toone of these models and are likely to involve both mechanisms,with conformational selection and induced adjustments pro-moting complex formation25,26.
Here we report the investigation of the role of protein flexibilityin the modulation of binding kinetics and equilibrium thermo-dynamics of drug binding to heat shock protein 90 (HSP90).
HSP90 is one of the most abundant proteins in the cytoplasm ofeukaryotic cells, comprising 2–5% of cytosolic protein under non-stressed conditions27. It is a ubiquitous molecular chaperoneintimately involved in a variety of pathways, including cell sig-naling, proliferation and survival, and protein folding. It hasemerged over the last 25 years as a potential target for thetreatment of cancer28–33. HSP90 forms flexible homodimers,where each monomer consists of three domains that are linkedby flexible regions31,34–36. The N-terminal domain of HSP90(N-HSP90) contains the nucleotide-binding site, which has beenthe target site for drugs interfering with ATP binding and ATPaseactivity.
The unbound N-HSP90 has a highly flexible lid segmentcomprising residues 107–14137. Structures of N-HSP90 in theapo-form and complexed with a variety of small molecules showremarkable plasticity, particularly in residues 104–111 located inα-helix3, that adopt “loop-in” or “loop-out” conformations38
(Table 1, Fig. 2). More recently, crystal structures have revealedligands occupying an additional binding subpocket created by therearrangement of residues 104–111 into a continuous helicalconformation39–42 (Fig. 2; compounds bound to helical and loop-
Table 1 Chemical structure of compounds 1–20 with R1 and R2 substitutions
O
NNN
NN
O
O
O
O
R1
R2
1,3-11,13-18,20 2,12,19
R1
R2
Loop binders are numbered 1–6, helix-binders are numbered 7–20
in conformations will be referred hereafter as “helix-binders” and“loop-binders”, respectively). Significantly, different thermo-dynamic profiles were observed for the binding of differentmolecules to N-HSP90. Specifically, the entropic contribution tobinding may be unfavorable (as for ADP43) or favorable (as forAMPPCP37,44 and macrocyclic compounds43), suggesting differ-ent effects of local protein conformations.
The mechanism by which N-HSP90 flexibility affects smallmolecule binding is not completely clear. Several studies haveshown that the molecular recognition and binding of the flexiblelid segment with different substrates and inhibitors is likely toinvolve both induced-fit and conformational selection mechan-isms. Whereas Gooljarsingh et al. demonstrated that the bindingof geldanamycin to Hsp90 is indicative of a two-step bindingmodel with induced-fit44, equilibrium and kinetic studies byOnuoha et al. on the geldanamycin derivative 17-DMAG bindingto HSP90 are consistent with a single-step process34. NMR37 andMD45 studies provide further evidence that the N-terminaldomain of Hsp90 in its free state may exist in different con-formations, with the lid segment undergoing internal motions onthe µs–ms time scale, and the ligand-binding event modifying thepopulation distribution towards more stable conformations.
The remarkable flexibility of the binding pocket of N-HSP90was the decisive factor in leading us to investigate the kinetics andthermodynamics of inhibitor binding in more detail, as well as theimpact of this plasticity on the common understanding ofdrug–target interactions. Moreover, it has been demonstrated inprevious studies that tumor reduction directly relates to the levelof HSP90 occupancy46. Importantly, the degradation of HSP90client proteins was observed even after the drug had been clearedfrom the plasma and significantly reduced in the tumor, whichclearly shows the importance of a slow inhibitor unbinding rate.
Here we report a detailed experimental and computationalcharacterization of the binding properties of 20 members of aresorcinol class of HSP90 inhibitors (Table 1). We found that theinhibitors display a diverse range of kinetic and thermodynamicprofiles. We carried out mutagenesis experiments to gain insightsinto the effects of protein flexibility on ligand binding. We dis-covered high-affinity compounds with long-residence times,whose binding is mainly entropically driven and is favored by theconformational flexibility of the ligand-bound protein. This studyreveals an unusual mechanism of binding of small molecules to aprotein target, which can be considered along with other strate-gies in drug design projects.
ResultsCrystal structures of ligand-free and bound forms of N-HSP90.For 7 of the 20 compounds, it was possible to obtain crystalstructures of the complexes bound to N-HSP90 with loop-in (1,6) and helical (8, 14, 16, 18, and 20) conformations of the α3-helix region (loop- and helix-binders, respectively; SupplementaryTable 1). All ligands occupy the ADP-binding site and formtypical interactions, which include hydrogen bonds of the 2-hydroxyl group of the resorcinol ring with the side chain of D93and with a water molecule that generally mediates interactionswith G97 (Fig. 2a and Supplementary Fig. 1). The 4-hydroxylgroup of the resorcinol ring forms a hydrogen bond with S52through another ordered water molecule. The main differencebetween the structures is the conformation of residues 104–111,which can adopt either helical or loop-in conformations. Incomplexes with compounds whose R1 substituent exceeds oneatom (compounds 8, 14, 16, 18, and 20), these residues have thehelical conformation with an adjacent hydrophobic pocket linedby the side chains of M98, L107, F138, Y139, V150, and W162.Considering their R1 substituent, compounds 9–11, 13–17, and
19 were also expected to form complexes with residues 104–111of N-HSP90 in the helical conformation and were thereforeassigned as helix-binders. Steric clashes between the ligands andresidues 105–107 would prohibit these complexes from existing ina loop-in conformation (Supplementary Fig. 2). Similarly, com-pounds 2–5 were assigned as loop-in binders based on thesimilarity in size of their R1 substituent to compounds 1 and 6,for which crystal structures were determined.
In agreement with previous studies38, unbound N-HSP90 has aloop-in conformation in the α-helix3 region. As previouslymentioned in the Introduction, it is likely that the N-terminaldomain of Hsp90 may exist in a combination of differentconformational states in its free state. The binding of a specificcompound may alter the protein conformational distribution byincreasing the population of states that are rarely observed (i.e.,much less populated) in the unbound state. The fact that thehelical conformation has not been observed in crystal structuresof apo N-HSP90 indicates that this conformational state mightexist as a transient conformation with a higher free energy andtherefore be less populated.
Thermodynamic profiles of N-HSP90 inhibitors. The thermo-dynamic profiles of the binding of the 20 resorcinol ligands to N-HSP90 obtained by isothermal titration calorimetry (ITC) aredepicted in Fig. 3 (see also Supplementary Fig. 3 and Supple-mentary Table 2) and quantify the energetic differences betweentwo states in equilibrium (free state and bound state).
The variations amongst the compounds show enthalpy-entropy compensation47,48. Measurements under different bufferconditions to account for possible superposition of protonationeffects on the recorded heat signal (Supplementary Fig. 4)indicate that the enthalpy-entropy compensation is a property ofthe complexes rather than solely a manifestation of themeasurement procedure. Interestingly, there is a strong differencein the binding thermodynamics of loop-in and helix-bindingcompounds. Specifically, “loop-in” binding compounds areprimarily enthalpically driven, with favorable or small entropiccontributions. In contrast, for the helix-binding compounds,there is a large favorable entropic contribution to binding, andmost of them have a binding enthalpy penalty. This switch inthermodynamic profile is thus directly related to the conforma-tion of the α-helix3 region with compensating differences inenthalpy and entropy of about 60 kJ mol−1 between loop-in andhelix-binders. To explore the mechanism underlying this effect,we evaluated the different entropy components that maycontribute to the ligand-binding entropy.
Generally, the entropy change upon binding may arise from areduction in translational and rotational degrees of freedom, analteration of the conformational flexibility of the bindingpartners, and from the reorganization of their solvation shellsupon binding. Favorable entropic contributions to the bindingenergy are usually considered to be driven by desolvation effectsas the burial of hydrophobic surfaces leads to the displacement ofstructured water molecules into the bulk solvent49. We thereforefirst compared the solvation properties of the inhibitors and ofthe loop-in and helical conformations of N-HSP90. Foruncharged compounds, desolvation is a hydrophobic effect thatis predominantly entropic and thus the desolvation free energycan provide a good estimation of the entropy change due to thesolvent. In Fig. 4a, computed desolvation energies are comparedwith experimental values of −TΔS for all compounds studied(data are also given in Supplementary Table 4). Due to thegenerally larger size of the helix-binders in comparison with theloop-in-binding compounds, their desolvation is more
energetically unfavorable. This trend is opposite to that for thebinding entropies derived from ITC measurements.
Differences in the entropic contribution to binding energy ofloop-in- and helix-binders may also arise from structuraldifferences in the hydration shells of the loop-in and helicalcomplexes, particularly because an additional hydrophobic pocketis formed in the latter case. To estimate the correspondingentropic difference, we compared the hydration shells of the twoprotein conformations. Since the nucleotide-binding pocket partis conserved in both loop-in and helical structures, we focusedsolely on the difference in the water molecules trapped on theprotein surface around the flexible part of the α-helix3 region,whose entropy is much lower than in the bulk solvent. Thepositions of the stable water sites were evaluated from explicitsolvent MD trajectories and compared with 3D-RISM50 compu-tations based on the first-principle theory of solvation. Remark-ably, both methods reveal very similar positions of the water sitesaround the flexible α-helix3 region, with no significant differencesin the number of stable water sites being observed in the twoprotein conformations (4–7 sites, see Fig. 4b, c and Supplemen-tary Table 5). The predicted water sites agree well with statisticalanalysis of the positions of water molecules in 16 PDB structures(8 from each conformational type of the complex as listed inSupplementary Table 6 and Supplementary Fig. 5c, d). However,the total number of water sites in loop-in crystal structures islarger than in helical ones (10 and 6, respectively; seeSupplementary Table 5) albeit with a lower population of theformer with respect to those in the hydrophobic pocket of thehelix-type structures (see analysis in Supplementary Fig. 5e),which may level the solvent entropy for both types of structures.Thus, we can conclude that the difference between loop-inand helical conformations in just four stable water sites isthe greatest possible and an upper limit of the correspondingentropic contribution to the binding energy difference for loop-in relative to helical structures can be estimated as 34 kJ mol−1
(a typical entropy penalty per trapped water molecule is about8.4 kJ mol−1 ref. 51). This value is notably smaller than thedifference between the average entropic binding energy term forloop-in- and helix-binders (about 60 mol−1, Fig. 3a) and thuscannot alone explain the large difference in the thermodynamicprofiles of loop-in- and helix-binders.
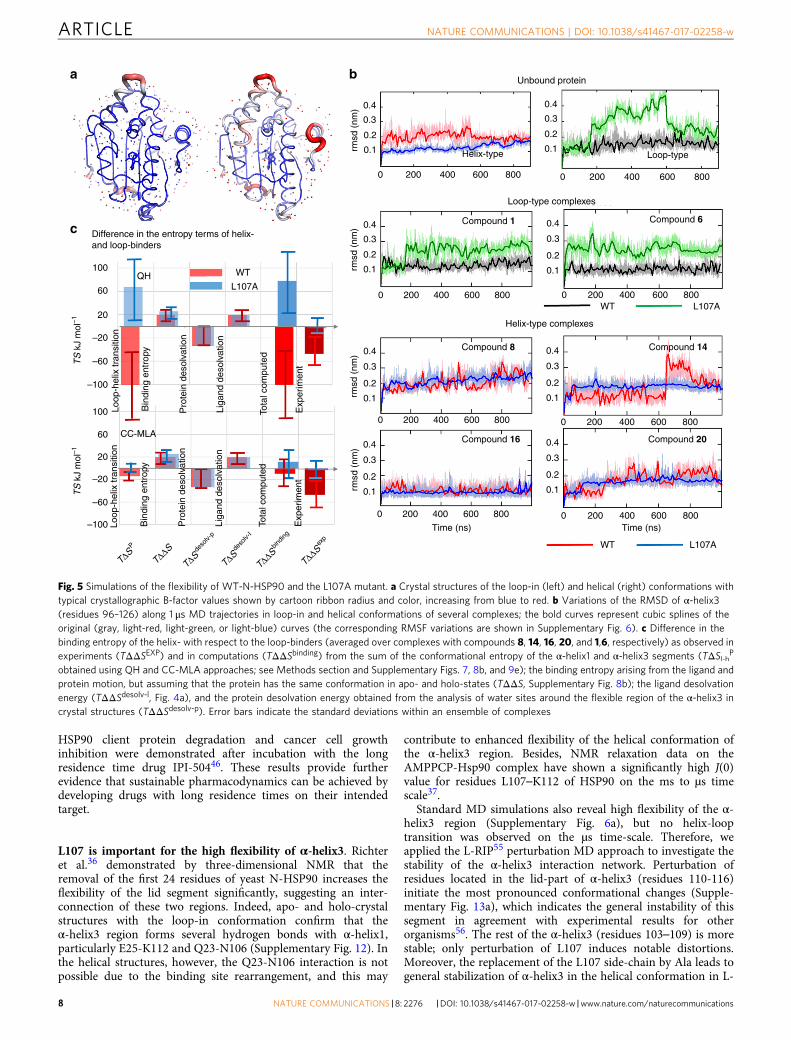
Protein flexibility is another possible contributor to favorablebinding entropy. As previously mentioned, the N-HSP90 crystalstructures show higher B-factors for residues 103–111 (Fig. 5a) inthe helical conformation, suggesting greater structural flexibilityof this region compared to the loop-in conformation. Consis-tently, MD simulations of WT N-HSP90 reveal generally highermobility of α-helix3 in the helical relative to the loop-inconformations (Fig. 5b and Supplementary Fig. 6a).
Generally, computation of the binding entropy from MDsimulations requires sampling of both the bound and free statesof the binding partners. However, the apo state of N-HSP90may have different conformations that interconvert on thetimescale of micro-seconds or longer. Sampling of such rareevents is not computationally feasible. To overcome thislimitation, one can approximate the difference in the bindingentropy of loop-in and helix-binding compounds arising fromthe protein and ligand degrees of freedom as the sum of twoterms (see details in Supplementary Fig. 7): (i) the differencebetween the ligand-binding entropy to the loop-in and helical-conformations, which includes the effect of the reduction oftranslational and rotational degrees of freedom, as well as ofreduction of the ligand and protein (mainly side-chain) flexibilityin a complex, assuming that the protein conformation is notchanged upon binding; and (ii) the difference in the proteinentropy in two conformations of the N-HSP90 complex. The firstterm was computed in a rigid rotor, harmonic oscillatorapproximation using the MM-PBSA program52. This part ofthe conformational entropy causes a binding energy penalty thatis on average about 20 kJ mol−1 greater for the helix- than for the
a b
c
Q123
A141
N51
S52
D93
G97
F138
W162N51
S52
L107
G97
D93
L107
A101
Fig. 2 Comparison of different conformations of N-HSP90. a Overlay of three N-HSP90 crystal structures in complex with compounds 1 (black), 20 (red)and geldanamycin (wheat, PDB 1YET), representing loop-in, helical and loop-out conformations, respectively. The protein structures are shown in grayexcept α-helix3 (residues 101–123) and the lid segment (residues 107–141). A detailed view of the different conformations of α-helix3 is given in the inset.b Protein-ligand interactions representative of the loop-in conformation (compound 1). c Protein-ligand interactions representative of the helicalconformation (compound 20). Dashed lines indicate interactions (blue: hydrogen bonds, yellow: aromatic, brown: hydrophobic). 2Fo-Fc electron densitymaps, contoured at 1.5σ, are shown in gray around each ligand
loop-binders (see average difference plotted in Fig. 5c andindividual terms for each compound in Supplementary Fig. 8a),mainly due to the larger size and the greater flexibility of thehelix-binders in solution.
Estimation of the entropy difference between the loop-in andhelical conformations of the protein in the bound state iscomputationally very challenging because the long time-scaleconformational changes should be taken into account. We usedtwo computational methods that employ different approaches for
reduction of the degrees of freedom to be sampled (see Methodssection and Supplementary Methods for more details): (i) therigid rotor quasi-harmonic, QH, approximation that usuallyprovides an upper limit to the conformational entropy of globalprotein motions53, and (ii) the Correlation-Corrected MultibodyLocal Approximation (CC-MLA)54 method that yields theentropy of protein torsion angle degrees of freedom. Althoughthe latter method is potentially more accurate, it does not takeinto account global backbone oscillations in the present
20a
c d
e
b
5
4
Enthalpy dominant
Entropy dominantEntropy dominant
Enthalpy dominantΔH=–TΔS ΔH=–TΔS
2 31
6
19
35
4 2
18 1514
6
20
19
111617
109
12
81
2012
15
1118
17 16
149 7
810
13
10
0
20 30 40100
ΔH (kJ mol–1)
–TΔS
(kJ
mol
–1)
–TΔS
(kJ
mol
–1)
ΔH (kJ mol–1)
–10
–10
–20
–20
–30
–30
–40
–40
–50
–50
–60
–60 20 30 40100–10–20–30–40–50–60
–70
1
0
6
5
4
3
1
0
–1
–2
–3
–4
–5
2
–1
–2
kcal
/mol
e of
inje
ctan
tD
iffer
ence
ene
rgy
valu
es (
kJ m
ol–1
)
kcal
/mol
e of
inje
ctan
t
–3
–4
–5
–6
–8
0.0
60
40
2 4 6
5
13
2
5
13 6 4 2 3
1 5 1919 1812 208
15149
0117
191611
12
12170
11 12016
1814 158
9
9
201011
1618 15
14 8
17
64
20
0
–20
–40
–60
Loop-binders Helix-binders
0.5 1.0 1.5
Molar ratio Molar ratio
Compound1
Compound16
HSP90K
D
WT
(M) (kJ/M) (kJ/M) (kJ/M)ΔG
ΔΔH ΔΔG ΔΔGΔΔHΔ(–TΔS) Δ(–TΔS)
ΔH –TΔS
HSP90 (M)
KD
(kJ/M) (kJ/M) (kJ/M)
ΔG ΔH –TΔS
1.4E-7
3.4E-7
1.7E-8 –45.3
–45.1
21.4 –66.9
–14.8 –30.51.3E-8
L107A
WT
L107A
–39.1 –29.1
–29.7
–10.1
–7.5–37.1
2.0 2.5 3.0 0.0 0.5 1.0 1.5 2.0 2.53.5
–7
20
10
0
–10
–20
–30
–40
–50
–60
–70
Fig. 3 Thermodynamic profiles of N-HSP90 inhibitors measured by ITC. The enthalpic and entropic components of the binding free energy are shown in aand b for for WT N-HSP90, and the L107A mutant, respectively. The dashed diagonal line (ΔH=−TΔS) divides the plot into two main areas where theenthalpy (gray) or the entropy (red) dominate the binding free energy (ΔG). Compounds 1–6 are loop binders and are colored black and compounds 7–20are helix-binders and are colored red. c, d Isothermal titration calorimetry fitting curves for compounds 1 (c) and 16 (d) bound to WT N-HSP90 (full circles)and to the L107A mutant (open circles) with thermodynamic parameters shown in the respective tables. e Box plot showing the difference in the enthalpy(ΔΔH), entropy (Δ(−TΔS)) and binding free energy (ΔΔG) for L07A relative to WT for loop- (colored black) and helix-binders (colored red). The boxesdenote the 25th and 75th percentiles and the error bars the 5th and 95th percentiles
model and tends to be negatively biased under samplinglimitations and, therefore provides an estimate of the lowerlimit of the conformational entropy. Remarkably, both methodsshow a higher entropy of the helical conformation relative to theloop-in one, although the absolute values differ significantly(105 kJ mol−1 and 14 kJ mol−1 on average in binding free energydifference in the QH and CC-MLA simulations, respectivelySupplementary Figs. 8b and 9). Summing up all the entropy termsdiscussed above gives a total estimated difference in the bindingfree energy of loop-in and helix-binders of about 101 and10 kJ mol−1 for the QH and CC-MLA method used, respectively(see Fig. 5c). As upper and lower limits of the possible entropiccontribution, these values are consistent with the averageexperimental value of 43± 10 kJ mol−1 for the same compounds(Fig. 5c).
These computations strongly suggest that the gain in entropydue to the switch of the protein upon ligand binding from theloop-in to the helical conformation can overcome the entropyloss due to complex stabilization as well as the contribution ofdesolvation effects to the entropy change.
Kinetic behavior of N-HSP90 inhibitors and ex vivo efficacy.The results of binding kinetic measurements depicted in Fig. 6(and given in Supplementary Table 3, see also SupplementaryFig. 10) reveal trends in the inhibitor binding characteristics thatvary with the binding site conformation. The kinetic constantswere derived assuming a 1-step model as illustrated in Fig. 1b,while multiple-step models could not be distinguished from themeasured experimental data. The majority of the helix-binders(7–20) have lower association and dissociation rate constants forbinding to WT N-HSP90 than the loop-binders (1–6, Fig. 6a),suggesting different binding mechanisms. Compounds that bindto the helical conformation can reach up to 650-fold slowerdissociation rates when compared to compounds that bind to theloop-in conformation.
In order to identify the energetic factors involved in theresidence time prolongation, it is important to recall at this stagethat, in the one-step model used to derive the experimentalkinetic constants (Fig. 1a), the kinetic barrier to dissociation canbe increased by stabilizing the ground state enzyme-inhibitorcomplex (by increasing thermodynamic affinities), by destabiliz-ing the transition state (by decreasing association rates) or by acombination of both. By plotting kon (Fig. 6a) and KD (Fig. 6b)against koff, we can see that overall, koff shows a weak correlationwith KD and kon, for WT N-HSP90 (slope and regression analysisin Fig. 6a, b), which indicates that τ prolongation is influenced bya combination of ground state stabilization and transition statedestabilization.
While it is a common assumption that drug–target residencetime prolongation can be achieved by maximizing drug–targetaffinity (ground-state stabilization of the enzyme−inhibitorcomplex), due to invariance of the kon, this study providesevidence that kon can vary significantly, indicating transition statedestabilization playing a role in prolongation of residence time.Helix-binders reach up to 230-fold slower association rates, whencompared to loop-binders, indicating a higher transition stateenergy barrier for helix-binders, as depicted in the right-handpanel of Fig. 6.
Considering that the helical conformation of N-HSP90 is notobserved in crystal structures of the unbound state, it is plausibleto assume that protein dynamics, particularly the helix-looptransition, might play a major role in the modulation of thetransition state. This conclusion is also supported by severalstudies that provide evidence that slow binding kinetics can beintimately connected to large conformational changes requiredfor the binding of small molecules20,22.
The prolonged τ of the current resorcinol series was alsoreflected in a sustained inhibitory effect as measured byintracellular upregulation of HSP70 in A2780 cells, (Supplemen-tary Table 7 and Supplementary Fig. 11). This observation is inagreement with the study performed by Tillotson et al., where
Desolvation free energy vsbinding entropy
–70 –50
–TΔS kJ mol–1
ΔGD
ES
OLV
kJ
mol
–1
–30 –10 1065
85
105
125
0% 50% 100% Population
a b cLoop-type complexes Helix-type complexes
Fig. 4 Simulation of the protein and ligand hydration effects. a Relation between the computed desolvation free energy of the inhibitors (seeMethods section) and their measured binding entropy in ITC experiments. Compounds assigned as loop-binders are colored black and compoundsassigned as helix-binders are colored red. Error bars show the root mean squared error of 3D-RISM predictions against experiment (RMSE=5.4 kJ mol−1 asreported in ref. 50). Black and red dashed lines indicate the average values of the desolvation energy and binding entropy for loop- and helix-binders, andthe arrows show the corresponding differences between loop- and helix-binding compounds, as observed in experiment (gray) and in computations (lightred). b, c Conserved water sites observed in loop-in (b) and helical (c) crystal structures (listed in Supplementary Table 5). The degree of conservation isvisualized by increasing size and color; only water sites within 0.8 nm of N106 are shown. In the insets, water sites predicted by GIST68 are depicted byblue mesh iso-surfaces at a water density value twice that of bulk water; the oxygen atoms of the crystallographic water sites are represented by redspheres; red arrows indicate the positions of stable water sites predicted by 3D-RISM simulations66 (for details, see Supplementary Information)
HSP90 client protein degradation and cancer cell growthinhibition were demonstrated after incubation with the longresidence time drug IPI-50446. These results provide furtherevidence that sustainable pharmacodynamics can be achieved bydeveloping drugs with long residence times on their intendedtarget.
L107 is important for the high flexibility of α-helix3. Richteret al.36 demonstrated by three-dimensional NMR that theremoval of the first 24 residues of yeast N-HSP90 increases theflexibility of the lid segment significantly, suggesting an inter-connection of these two regions. Indeed, apo- and holo-crystalstructures with the loop-in conformation confirm that theα-helix3 region forms several hydrogen bonds with α-helix1,particularly E25-K112 and Q23-N106 (Supplementary Fig. 12). Inthe helical structures, however, the Q23-N106 interaction is notpossible due to the binding site rearrangement, and this may
contribute to enhanced flexibility of the helical conformation ofthe α-helix3 region. Besides, NMR relaxation data on theAMPPCP-Hsp90 complex have shown a significantly high J(0)value for residues L107–K112 of HSP90 on the ms to µs timescale37.
Standard MD simulations also reveal high flexibility of the α-helix3 region (Supplementary Fig. 6a), but no helix-looptransition was observed on the µs time-scale. Therefore, weapplied the L-RIP55 perturbation MD approach to investigate thestability of the α-helix3 interaction network. Perturbation ofresidues located in the lid-part of α-helix3 (residues 110-116)initiate the most pronounced conformational changes (Supple-mentary Fig. 13a), which indicates the general instability of thissegment in agreement with experimental results for otherorganisms56. The rest of the α-helix3 (residues 103–109) is morestable; only perturbation of L107 induces notable distortions.Moreover, the replacement of the L107 side-chain by Ala leads togeneral stabilization of α-helix3 in the helical conformation in L-
0.4
ba
c
0.3
0.2
0.1
0.4
Unbound protein
Loop-type complexes
Helix-type complexes
0.3
0.2
0.1rmsd
(nm
)
0.4
0.3
0.2
0.1
60
20
TS
kJ
mol
–1T
S k
J m
ol–1
–20
–60
–100
100
60 CC-MLA
20
–20
–60
–100
TΔSP
TΔΔS
TΔSde
solv-
p
TΔSde
solv-
I
TΔΔSbin
ding
TΔΔSex
p
100
Difference in the entropy terms of helix-and loop-binders
QH WT
L107A
Bin
ding
ent
ropy
Loop
-hel
ix tr
ansi
tion
Loop
-hel
ix tr
ansi
tion
Pro
tein
des
olva
tion
Liga
nd d
esol
vatio
n
Tota
l com
pute
d
Exp
erim
ent
Bin
ding
ent
ropy
Pro
tein
des
olva
tion
Liga
nd d
esol
vatio
n
Tota
l com
pute
d
Exp
erim
ent
0.4
0.3
0.2
0.1
0.4
0.3
0.2
0.1
0.4
0.3
0.2
0.1
0.4
0.3
0.2
0.1
0.4
0.3
0.2
0.1
rmsd
(nm
)rm
sd (
nm)
rmsd
(nm
)
0 200 400 600 800 0 200 400 600
Loop-typeHelix-type
800
0 200 400 600 800
0 200 400 600 800
0 200 400
Time (ns) Time (ns)
WT L107A
L107A
600 800 0 200 400 600 800
0 200 400 600 800
0 200WT
Compound 6Compound 1
Compound 8 Compound 14
Compound 20Compound 16
400 600 800
Fig. 5 Simulations of the flexibility of WT-N-HSP90 and the L107A mutant. a Crystal structures of the loop-in (left) and helical (right) conformations withtypical crystallographic B-factor values shown by cartoon ribbon radius and color, increasing from blue to red. b Variations of the RMSD of α-helix3(residues 96–126) along 1 μs MD trajectories in loop-in and helical conformations of several complexes; the bold curves represent cubic splines of theoriginal (gray, light-red, light-green, or light-blue) curves (the corresponding RMSF variations are shown in Supplementary Fig. 6). c Difference in thebinding entropy of the helix- with respect to the loop-binders (averaged over complexes with compounds 8, 14, 16, 20, and 1,6, respectively) as observed inexperiments (TΔΔSEXP) and in computations (TΔΔSbinding) from the sum of the conformational entropy of the α-helix1 and α-helix3 segments (TΔSl-hP
obtained using QH and CC-MLA approaches; see Methods section and Supplementary Figs. 7, 8b, and 9e); the binding entropy arising from the ligand andprotein motion, but assuming that the protein has the same conformation in apo- and holo-states (TΔΔS, Supplementary Fig. 8b); the ligand desolvationenergy (TΔΔSdesolv-l, Fig. 4a), and the protein desolvation energy obtained from the analysis of water sites around the flexible region of the α-helix3 incrystal structures (TΔΔSdesolv-p). Error bars indicate the standard deviations within an ensemble of complexes
RIP simulations (Supplementary Fig. 13b), which suggests thatL107 might play a major role in determining the structural anddynamic properties of α-helix3.
The L107A mutation alters α-helix3 conformational stability.We determined crystal structures of the N-HSP90-L107A mutantin the apo-state and in complexes with representative loop- (1, 6)and helix-binding (14, 16, 20) compounds. The crystal structureof the unbound L107A mutant (PDB code 5J80) closely resemblesthat of the WT apo-protein, with A107 occupying the sameposition as L107 in the WT (Supplementary Fig. 14). However,the complexes with the loop binding compounds 1 and 6 exist intwo alternate conformations after L107A mutation: loop-in and
loop-out (Fig. 6e), with increased mobility as indicated by higherlocal B-factors. The complexes of the mutant with helix-bindingcompounds revealed no significant differences when compared tothe WT in terms of ligand-binding mode. However, the A107side-chain does not occupy the position of L107, but is rotatedtowards α-helix1, forming an additional interaction between Q23of α-helix3 and α-helix1 either through a water bridge or back-bone interactions (Supplementary Fig. 12b) and allowing N106 tooccupy the position of L107 in WT N-HSP90. Besides, the shapeof the binding pocket is changed in the helical conformation,causing a partial closure of the transient hydrophobic pocketand consequently, a more compact and rigid conformation(Fig. 6f).
108a b
dc
e f
107
106 20
19 179 12 6
21
11
19
20
18
1316 10
96
1215 14
78
2 Free
ene
rgy
Free
ene
rgy
54
13
17
45
3
1014
1118 16
78
y = 0.37x + 6.16R =0.48R
2=0.24
y = 5.59x + 0.007
19
13 111620
17
14 9 10
8
76
42
12
515 9
1012
68 7 3
2 4
1
5
14
1718 16
131120
19
3 1
15
18
R=0.017
R2=2.85E-4
y = 0.63x – 6.20
TS
Reaction
coordinate
Reaction
coordinate
WT
TS
L107A mutant
GS
GS
R =0.69
R2=0.47
y = 0.99x – 5.6R=0.93
R2=0.87
15
13105
104
103
108
107
10–5
10–6
10–7
10–8
10–9
10–10
106
105
104
103
10–5
10–6
10–7
10–8
10–9
10–10
1E-4 1E-3 0.01 0.1 1
1
1E-4 1E-3 0.01koff (s
–1)koff (s–1)
1E-4 1E-3
Loop-type complexes Helix-type complexes
L107WT WTA107 L107A
A107
L107A
L107
L107A
N106N106
0.01 0.1 11E-4 1E-3 0.01 0.1
koff (s–1) koff (s
–1)
k on (M
s–1
)k on
(Ms–1
)
KD
(M)
KD
(M)
0.1 1
Fig. 6 Contributions of thermodynamic affinity and association kinetics to the modulation of dissociation rate constants. a-d Logarithmic plots showingcorrelation of dissociation rate constant koff (x axis) with the association rate constant, kon, and the dissociation constant, KD, (y axis) of compounds 1–20determined by SPR for N-HSP90 WT (a, b) and L107A mutant (c, d). Points representing compounds assigned as loop-binders are colored black andcompounds assigned as helix-binders are colored red. The black line is the linear regression with R2 representing the coefficient of determination and R thecorrelation coefficient. The gray lines represent the 99% upper and lower confidence intervals. The error bars represent the standard deviation of at leastthree measurements. The red and black shaded regions highlight the different kinetic profiles of helix- and loop-binders, respectively. koff is not stronglycorrelated either with kon or with KD for N-HSP90 WT. Thus, an increase of residence time is driven by a combination of GS stabilization and TSdestabilization. For the L107A mutant, koff is strongly correlated with KD (R=0.69 for WT and R=0.93 for L107A) and not correlated with kon (R=0.48 forWT and R=0.017 for L107A), indicating that residence time is mainly driven by GS stabilization. These relations are shown on the right in schematic pseudo1-step free energy profiles for the binding reaction of helix- and loop-binders (shown in red and black, respectively; the filled area indicates the energydistribution among the entire compound series) Red and black dashed lines indicate average free energy values for the helix-and loop-binders, respectively.e, f The binding pocket shape observed in the crystal structures of N-HSP90 WT and L107A mutant for loop- and helical- complexes (e, f, respectively).Two alternative conformations observed in the crystal structures are shown for the L107A mutant co-crystallized with compound 6 in e The molecularsurface of the protein is colored from red to white indicating increasing hydrophobicity
Thermodynamic analysis supports key role of L107. ITCexperiments for compounds 1–20 reveal different effects of theL107A mutation on the thermodynamics of loop- and helix-binders. Figure 3c, d demonstrate this for two representativeloop- and helix-binders (compounds 1 and 16, respectively).Although the binding affinity is marginally impaired for the N-HSP90-L107A-complex with compound 1, the thermodynamicprofile is very similar to that of the WT, with a major contribu-tion of enthalpy to the binding. This suggests that loop-bindersdo not change the conformational distribution of the proteinupon binding significantly, or that the thermodynamics of thebound- and unbound-states of the protein are similar (theavailable crystal structures suggest that the unbound state may bein either loop-in or loop-out conformations, see Fig. 2b). Theseresults also support the hypothesis that interactions between α-helix1 and α-helix3 might be one of the main driving forces forthe stability of the lid segment, as both conformations preservethe interactions between the two helices in WT and the L107Amutant (see Supplementary Fig. 12).
On the other hand, the thermodynamic profile of compound16 binding to the L107A mutant is very different from that to WT(Fig. 3d). It binds to WT N-HSP90 in an endothermic reactionwith a favorable entropic contribution and an enthalpic penalty,whereas the binding to N-HSP90-L107A is exothermic with afavorable enthalpy and a reduction of the favorable entropiccontributions. This behavior was observed for all other helix-binders, with the exception of compound 9 (Fig. 3b), whichsuggests that the switch between the endo- and exothermic profileis largely driven by the conformational rearrangement of theprotein due to the L107A mutation.
In agreement with these observations, the MD simulations ofthe complexes, as well as of the unbound protein, demonstrateless protein mobility in the helical conformation and strongdestabilization of the loop-in conformations upon L107Amutation (shown in Fig. 5b, Supplementary Fig. 6). The lattereffect leads to a switch from the loop-in towards an intermediatebetween loop-out and helical conformations in simulations(Supplementary Fig. 6d). Accordingly, the computed entropy ofthe complex in the helical conformation decreases, while that forthe loop conformation increases, leading to a change in thethermodynamic profile of loop- and helix-binders upon muta-tion. This tendency is clearly observed regardless of the approachused for the entropy estimation (see Fig. 5c and SupplementaryFigs. 8b and 9d showing the entropy of the loop-in and helicalconformations of the protein obtained using QH and CC-MLAapproaches). A change of the conformational stability uponmutation must also cause alteration of the conformationalensemble of the unbound protein in the direction of higherpopulation of the helical conformation (even if such conforma-tions exist only transiently) relative to the loop conformation,which should facilitate binding of the helix-binders. This isindeed the case as will be discussed below.
The L107A mutation alters the transition barriers. The resultsof kinetic studies of the N-HSP90-L107A mutant binding to thesame series of compounds depicted in Fig. 6, SupplementaryFig. 15 and summarized in Supplementary Table 3, show a sys-tematic increase of dissociation rates upon protein mutation forthe majority of the compounds, both helix- and loop-binders.Interestingly, association rates increase upon L107A mutation forthe helix-binders, whereas for the loop-binders, the kon valuesdecreased (Fig. 6 and Supplementary Fig. 15). Consequently, thekon values of the loop and helix-binders all fall in the same range,with similar transition state barriers (Fig. 6c).
As mentioned above, this result may be explained by thechange in the conformational distribution of the unbound N-HSP90 upon mutation. If we assume a conformation selectionmodel for the protein–ligand-binding event (Fig. 1b), a gain instability of the helical conformation in the L107A mutant can beexpected to cause an increase of its population in the apo-stateand, as a result, a lower transition state barrier reflected by higherkon values for all helix-binders (assuming that the ligand-bindingprocess is faster than the transition between conformations). Onthe other hand, destabilization of the loop-in conformation in theL107A mutant may lead to a decrease of the kon value for theloop-binders and consequently an increase in the transitionbarrier.
Overall, a strong correlation between koff and KD is observed inFig. 6d (R = 0.92 and slope of linear regression 0.99), whichindicates that the τ of compounds interacting with the L107Amutant is mainly driven by ground state stabilization, whereas thecontribution from compound-dependent transition state desta-bilization is greatly reduced when compared to WT protein (R =0.017 and slope of linear regression 0.007 for kon and KD)(Fig. 6c). The latter observation suggests a reduction of theinduced-fit effect that causes ligand-dependent association ratesand an increase in the role of conformational selection.Identification of the binding mechanism, assuming that con-formational selection and induced fit scenario can be clearlydistinguished, would require experimental characterization of thechanges in the pseudo-first-order rate constant kobs with thecompound concentration using stopped-flow kinetics and amulti-step model for analysis of the experimental data. Even inthis case, however, as has been pointed out in ref. 57,unambiguous identification of the mechanism may not be feasibleif koff is slower than the rate of conformational transitions, whichis the case for the compounds under study (taken into accountthat transitions between states in the unbound protein occur onthe ms-μs time-scale37).
A detailed analysis of the thermodynamic properties thatcontrol the transition state using temperature-dependent Eyringanalysis of SPR data would provide additional insights into themechanism of ligand binding58 and will be the focus of furtherstudies. Nevertheless, the data presented here, along withobservations for other protein–ligand systems1,2,8,9,21, providestrong support for the key role that the conformational dynamicsof ligand–protein complexes play in the modulation of thetransition state and consequently in determining the drug–targetresidence time.
DiscussionWe have described an interdisciplinary study that elucidates themechanism of drug binding to N-HSP90. We discovered long-residence time and high-affinity compounds with cellular efficacy,whose binding is mainly entropically driven. A key favorableentropic contribution arises from the conformational flexibility ofthe target in the bound state. These results illustrate that,although tighter interactions make binding more favorable, thethermodynamic signature of a strong binder does not have to bedominated by an enthalpic term. Particularly important for moredisordered proteins59 is that increasing the entropic contributionof the protein in the ligand-bound state can provide an attractiveoptimization strategy in drug design, as expansion of the numberof available conformational states in the bound complex pro-motes the binding event. Furthermore, this study clearlydemonstrates the importance of combining thermodynamic andkinetic analysis for the understanding of the dynamics of drugbinding and unbinding processes. Indeed, our analysis indicatesthat the compound-dependent protein conformations (loop-in
and helical) in the bound state affect both equilibrium thermo-dynamics and binding kinetics. We find that compounds withentropically driven binding also have slow association and dis-sociation rates. This implies that tuning the protein conforma-tional dynamics by ligand binding, e.g. by incorporatingfunctional groups that make contacts that favor a more flexibleconformation of the protein over a less flexible one, can providemechanisms for modulation of the transition state for binding,and thus improving not only the binding affinity but also thelifetime of a protein–drug complex and consequently increasingdrug efficacy.
MethodsProtein expression and purification. Human N-HSP90 WT and the L107Amutant were expressed and purified by Instituto de Biologia Experimental eTecnológica and Proteros Biostructures GmbH, respectively.
Site-directed mutagenesis of Leu107 to Alanine (see Supplementary Table 8 forprimers description) was performed with the Quick Change II XL from AgilentTechnologies according to the manufacturer’s instructions.
Human N-HSP90 WT (NP_005339, α isoform 2) and L107A (aa 9–236) werecloned into pET28a including an N-terminal HIS-TEV-tag and expressed inEscherichia coli BL21 (DE3) RIL competent cells from Agilent Technologies, whichwere initially cultured in LB medium to OD600 of ∼0.5 at 37 °C, followed byadditional growth while cooling to 18 °C to an OD600 of ∼0.8 before induction with0.1 mM IPTG overnight. Cells were collected by centrifugation and resuspended inlysis buffer (2x Dulbecco´s PBS pH 7.4, 20 mM Imidazole, 10% glycerol, 1 mMTCEP, Complete tablets (Roche) and DNase). Cells were lysed by sonication andthe cell lysate was cleared by centrifugation at 75,000 × g for 45 min at 4 °C.
The supernatant was loaded onto a Ni-NTA affinity column and the targetprotein was eluted in a linear gradient with buffer 2x Dulbecco´s PBS pH 7.4,500 mM Imidazole, 10% glycerol, 1 mM TCEP. Peak fractions were desalted bydialysis and treated with TEV protease 50 U per mg protein at 4 °C overnight forhistidine tag removal.
The cleaved proteins were separated by passing through Ni-Sepharose resin andfurther purified using size-exclusion chromatography (Superdex S-200). Theresultant pure recombinant HSP90 was stored at −80 °C in a buffer containing30 mM HEPES/NaOH, pH 7.5, 150 mM NaCl, 1 mM TCEP, 10% Glycerol.
Crystallization and structure determination. N-HSP90 WT (40 mgmL−1) wasmixed in a 1:1 (v/v) ratio with the reservoir solution (H1 PACT: 100 mM Bis-Trisbuffer pH 8.5, 20% PEG 3350, 200 mM NaF). Crystals were obtained using thehanging drop vapor diffusion method and equilibrating against 1 ml of the reser-voir solution at 4 °C. For complex formation, selected compounds were soaked intocrystals in a concentration range of 1–10 mM for one to seven days. The sameconditions were used to obtain the structures of the L107A mutant. The resultingcrystals were cryo-protected in mother liquor with 30% PEG 3,350, and flash-frozen in liquid nitrogen for synchrotron X-ray data collection.
All data sets were collected at 100 K on beamline SLS × 106 and processed withthe XDS software package60. The structures were solved by molecular replacement,using BUSTER61. Model building was performed in Coot, with compounds andwaters fitted into the initial |Fo|–|Fc| map, and the structures were refined usingBUSTER. The coordinates of the apo and holo-structures of N-HSP90 have beendeposited in the RCSB Protein Data Bank. The refinement statistics and PDBaccession codes are given in Supplementary Table 1.
Isothermal titration calorimetry. All the titration experiments were performedusing the VP-ITC system from Malvern in 30 mM Hepes buffer pH 7.50, 150 mMNaCl and 0.5 mM TCEP. Protein was prepared by dialysis for 24 h against 1 liter of30 mM Hepes pH 7.50, 150 mM NaCl and 0.5 mM TCEP. The final protein con-centration in the sample cell as determined by the Bradford Assay was 50 μM.Ligand stock solutions of 10 mM in DMSO were diluted to 5 µM concentrationswith ITC buffer and adjusted to 2% (v/v) DMSO. Both the titrate and titrantsolutions were degassed prior to loading the calorimeter cell and injection syringe.
For buffer dependency titration experiments, buffer exchange to either Tris,Tricine or Pipes buffer was performed by dialysis. The same protocol was followedas previously described for compounds 1 and 16 (Supplementary Fig. 12).
The integrated heat data were fit with a one-site binding model using theOrigin-7 software provided with the Malvern VP-ITC. Protein concentration wascorrected by titration of a reference compound and normalized for theconcentration of each ligand. All ligands bound to N-HSP90 have a stoichiometryof approximately unity.
Surface plasmon resonance. SPR measurements were performed on a Biacore4000 instrument from GE Healthcare. Recombinant N-HSP90 [His-Tev-huHsp90(9–236)] was immobilized on a Biacore CM5 chip at 25 °C at a flow rate of 10 µLmin−1 using amine coupling at pH 4.50 according to Biacore’s standard
protocol. HBS-N (10 mM Hepes pH 7.40, 0.15 M NaCl) served as runningbuffer during immobilization. N-HSP90 was applied at a concentration of 20 µg.mL−1 in a buffer containing a 75-fold excess of 17-Dimethylaminoethylamino-17-demethoxygeldanamycin (17-DMAG). An unmodified carboxydextran matrixserved as a reference surface. Hsp90 inhibitors stored as 10 mM stock solutions in100% dimethyl sulfoxide (DMSO) were dissolved in running buffer (20 mMHEPES pH 7.50, 150 mM NaCl, 0.05% Tween 20, 1 mM DTT, 0.1 mM EDTA, 2%DMSO) and analyzed using two-fold dilution series. Kinetic titration experimentswere performed at 25 °C with a flow rate of 30 µL min−1, a sample contact time of120 s and a dissociation time between 300 and 600 s.
The data sets were processed and analyzed using the Biacore 4000 Evaluationsoftware, version 1.1. Solvent corrected and double-referenced association anddissociation phase data were fitted to a simple 1:1 interaction model with masstransport limitations. Two state-reaction could not be distinguished from themeasured experimental data.
The correlation of dissociation constants obtained from SPR and ITCexperiments is given in Supplementary Fig. 16.
Ex vivo HSP90 activity determined by Hsp70 upregulation. A2780 cells wereplated in a volume of 180 µl in 96-well plates and incubated at 37 °C (in DMEMsupplemented with 5% fetal bovine serum). 20 µl per well of medium includingserial dilutions of the compounds were added to the culture plates and incubationwas continued further for 24 h. The cells were fixed with formaldehyde for 30 minat room temperature. The plates were blocked for 1 h at room temperature withPBS containing 0.1% Triton® X-100 and 5% BSA and subsequently incubated withHsp70 antibodies (Stressgene), anti mouse IgG-HRP and chemiluminescent sub-strate. All measurements were performed in duplicates.
Chemistry. Information on the synthesis of chemical compounds is provided inWIPO (2006), WO2006/087077. Analytical data is provided in the SupplementaryNote 1. 1H NMR spectra were recorded at 300 K unless otherwise specified using aBruker Avance DPX 300, AV 400, DPX 500 spectrometer (TMS as an internalstandard). 1 H NMR chemical shifts are reported in parts per million (ppm). 1HNMR data is reported as chemical shift (dH), relative integral, multiplicity (s =singlet, d = doublet, t = triplet, q = quartet, dd = doublet of doublets, ddd = doubletof doublet of doublets, dt = doublet of triplets, td = triplet of doublets, tt = triplet oftriplets, qd = quartet of doublets) and coupling constant (J Hz). All of the com-pounds reported in the manuscript have a purity ≥ 95% unless noted otherwise.
Structure preparation and explicit solvent MD simulations. Simulations wereperformed for compounds in complex with WT N-HSP90 and with its L107Amutant. For this, the crystal structures solved in the present study (1, 6, 8, 14, 16,and 20 for WT N-HSP90, and 16 and 20 for the L107A mutant) were employed.For simulations of the complexes of the L107A mutant with compounds 1, 6, 8, 14,we generated starting structures from the crystal structures of the WT N-HSP90 bytruncating the sidechain of L107 to alanine. Crystallographic water moleculeslocated between the protein and the ligand as well as in binding sub-pockets at α-helix3 were explicitly included in starting structures for explicit solvent MDsimulations. We employed Amber ff14SB62 and GAFF63 force fields for the proteinand compounds, respectively. Atomic partial charges were computed for theligands using the Restrained Electrostatic Potential (RESP) method as implementedin the R.E.D. webserver64. Two trajectories of about 1 µs with a step of 2 fs weresimulated for each ligand using GROMACS 5.0.565 software. Technical details ofMD simulations are given in Supplementary Information.
Perturbation implicit solvent MD simulations. A non-equilibrium MD method,Langevin-Rotamerically Induced Perturbation (L-RIP) approach55, was applied toexplore the conformational flexibility of the α-helix3 region in N-HSP90. For thesesimulations crystal structures of the complexes of compound 16 and PDB 1YER(for a helix- and loop-type conformations, respectively) were employed. The L107Amutant structures were obtained by truncating the L107 side-chain to alanine.Ligand atoms and water molecules were removed. The structures were energyminimized, gradually heated to 300 K, and equilibrated, first under constantenergy conditions (5 ps) and then with Langevin dynamics (damping coefficient of10 ps−1). Then a L-RIP perturbation simulation was started: in each pulse, the totalkinetic energy of a single residue in the binding site with a rotatable side chain wasapplied only to the rotational degree of freedom of the torsion angle, χ. A short0.3 ps implicit solvent MD relaxation step with a Langevin thermostat (dampingcoefficient of 1 ps−1) was applied to let the excess kinetic energy in the side-chainrotation be transferred to nearby residues. This perturbation-relaxation procedurewas repeated 1000 times for every rotatable residue in the α-helix3 site (K100-K116). The last snapshots of each pulse were combined into a L-RIP trajectory. 10L-RIP trajectories were generated for each perturbed residue. The average RMSD ofthe residues in α-helix3 over all 10 trajectories for each perturbed residue wascomputed and is plotted in Supplementary Fig. 13.
Computation of desolvation free energies of compounds. The desolvation freeenergy of a compound, was estimated as the hydration free energy taken with theopposite sign. Hydration free energies of all the compounds were computed using
the version of the three-dimensional reference interaction site model, 3D-RISM50,as implemented in MOE66. The 3D-RISM method gives the spatial density of thesolvent atoms in the presence of the solute potential described by a standard force-field (a 12–6 Lennard-Jones term and a Coulombic term with AM1-BCC semi-empirical charges were used in the present calculations). The solvation free energycomprises electrostatic and non-polar solvation components, where the latter werecorrected in ref. 50 by introducing an additional scaled density correlation functionwith a scaling coefficient obtained by fitting the 3D-RISM solvation energy to themolecule solvation energy computed using free energy perturbation for a set of 504organic molecules. The root mean squared error (RMSE) of the 3D-RISM solvationenergies was 1.29 and 0.93 kcal mol−1 against experimental and free energy per-turbation results.
Protein hydration shell analysis using crystal structures. The water networkaround the flexible region of α-helix3 (residues 105–111) depends on its con-formation and, therefore, may cause differences in the binding entropy. To esti-mate this difference, relative populations of water sites in crystal structures ofcomplexes with loop and helix-binding compounds were analyzed using theWaTCH tool67 for a set of 16 crystal structures. Specifically, 11 PDB structures(Supplementary Table 6) with helical and loop-in conformations were selectedfrom different studies to avoid bias in the assignment of water positions; addi-tionally, 5 structures solved in the present study (for compounds 1, 6, 14, 16, 20)were included in the set. The relative population density values computed withWaTCH for stable water sites that are close to the middle of α-helix3 (within0.8 nm of N106) and that are different for complexes with loop and helix-bindingcompounds (shown in Fig. 4b, c) are summarized in Supplementary Table 5.
Protein hydration shell analysis using MD simulations. The structural andthermodynamic properties of the water molecules were analyzed using the GridInhomogeneous Solvation Theory (GIST) method68 implemented in the Ambertools package69. In the GIST approach, an explicit solvent MD trajectory is used formapping the water density onto a 3D grid, then the structural and thermodynamicproperties of water are computed for each grid cell. For GIST analysis, the first5000 snapshots from production trajectories starting from each of the PDBstructures co-crystallized with helix- and loop-in conformations of the binding site,and superimposed using the protein backbone were used. The protein structurewas not restrained, but was stable enough over a time-scale of 10 ns to obtain areliable water distribution; continuation of the trajectory to 40 ns led to an ~2-folddecrease of the water site populations. For GIST simulations, a cubic grid of size163 Å3 and spacing 0.5 Å was centered on the mid-point of the L107 and L106 Cαatoms. A default reference density of TIP3P water molecules, 0.0329 molecules/Å3
in bulk, was used. Identified water sites situated either between α-helix1 and α-helix3 or between α-helix3 and the beta-strands beneath are given in Supple-mentary Table 5. We did not include water sites in the ATP-binding pocket sincethey are dependent on the ligand bound and do not represent a general differencebetween the helical and loop-in structures.
Protein hydration shell analysis using 3D-RISM. 3D-RISM analysis of the sol-vent density implemented in MOE software66 was carried out using availablestructures with helical and loop-in conformations of the binding site (8, 14, 16, 20and 1, 6, respectively). The method provides occupancies and energies of the mostenergetically stable water molecules. The following parameters were used in thecalulations: salt concentration of 100 mM, 9–6 Lennard-Jones potential with a cut-off of 12 Å, and default charge generation procedure; only water molecules asso-ciated with the positions of crystallographic water sites in the structures of thecomplexes were considered. The total number of stable water sites at the densityiso-value of 1.5 found for helix-type complexes 8, 16, 14, 18, and 20 was 4, 6, 4, 6,and 6, respectively, and 5 for both loop-type complexes with compounds 1 and 6.The computed binding free energies of the detected water sites for the compounds16 and 1 are given in Supplementary Table 5 as an example.
Computation of conformational entropy. The computation model for estimationof relative binding entropy is schematically illustrated in Supplementary Fig. 7.Specifically, the difference between the entropic contribution to the binding freeenergies of the loop- and helix-binding compounds was computed as the sum oftwo terms: TΔSl-hbinding = TΔΔSl-h + TΔSPl-h, where TΔΔSl-h = TΔSl −TΔSh – isthe difference in ligand binding free energy due to the change of ligand and proteinconformational entropy, which arises from the short time-scale vibrational degreesof freedom of the protein (particularly, from side-chain motions), as well as fromthe loss of rotational and translational entropy of the ligand upon binding, andTΔSl-hP is the free energy term arising from the difference in entropy between theloop-in and the helical conformations of the protein. The choice of the compu-tational method employed for estimation of the TΔΔSl-h and TΔSPl-h terms as wellas limitations of the method employed in the present study are discussed inSupplementary Methods.
Particularly, we employed the harmonic (H) rigid body approximation andNormal Mode Analysis (NMA) as implemented in the MMPBSA.py script52 fromAmber tools69 for the estimation of the ΔSl and ΔSh terms. This script provides thecomplete binding entropy as the difference between the entropies of the
protein–ligand bound state and the free protein and ligand, including the rotationaland translation entropy change upon complex formation. For NMA-Hcomputations, 50 frames were extracted from the first 10 ns of the MD trajectoriesat equal time intervals. Since we do not have reliable information on the free stateof the protein, we used the same snapshots for computing the entropy of both thefree and the bound states of the protein and ligand by just extracting thecorresponding binding partner from the structure. Mean binding entropy valuescomputed for 50 frames and the standard deviation are shown in SupplementaryFig. 8a.
Two different methods, (1) quasi-harmonic approximation, QH, and (2)correlation-corrected multibody local approximations, CC-MLA54, were used forcomputing the difference in entropy between the loop-in and the helicalconformations of the protein, TΔSPl-h. Computation of the protein entropyrequires extensive sampling of multiple degrees of freedom and can be extremelycomputationally demanding. In the present case, however, the sampling spacecould be reduced. Indeed, there are several flexible elements of the protein structureand some of them, such as the protein termini and the C terminus of α-helix2,demonstrate motion in all complexes, which is not correlated with the motion of α-helix3 (vectors obtained from PCA are illustrated in Supplementary Fig. 6c, d), butmake a sizeable contribution to the computed entropy values. To reduce theuncertainty of the entropy calculations, we considered only α-helix3 and α-helix1 segments (residues 96–126 and 36–41, respectively), whose motion iscorrelated and directly relevant to distinguishing between the conformationalflexibility of the helical and loop-in structures. For estimating the entropydifference, we used an average value over complexes (either helix or loop-in type)employed in simulations (i.e., 1, 6, 8, 16, 14, 18, and 20).
For QH computations, we employed atomic coordinates of non-hydrogenatoms in a 1 µs MD trajectory. Four trajectory segments were analyzed(200–500 ns, 400–700 ns, 200–700 ns, and 100–800 ns with snapshots extracted at20 ps intervals) to evaluate average entropy values and their standard deviation foreach complex (Supplementary Fig. 8b). A covariance matrix was constructed anddiagonalized using “g_covar” and entropy calculations were performed using the“g_anaeig” tools of Gromacs65 package.
For CC-MLA computations, we employed two 1 μs MD trajectories for eachcomplex with snapshots extracted with a 4 ps stride, and torsion angles involvingonly heavy atoms were sampled. The computed entropy values as a function of thesimulated trajectory length illustrated in Supplementary Fig. 9a, b show clear butslow convergence that is not completely reached even with 500,000 snapshots fromtwo trajectories, each of 1 μs. Simulations at different thresholds were carried out(illustrated in Supplementary Fig. 9c, d) and the minimum value for a particularcomplex (see Supplementary Fig. 9e) was used for entropy estimation, as suggestedby the authors of the method54.
Data availability. The coordinates and structure factors have been deposited in theProtein Data Bank under accession codes: 5J2V, 5J64, 5J2X, 5J86, 5J2, 5J9X, 5J86,5J20, 5J80, 5J8U, 5J8M, 5J6N, 5J6L, 5J6M. Other data are available from the cor-responding authors upon reasonable request.
Received: 16 November 2016 Accepted: 16 November 2017
References1. Tummino, P. J. & Copeland, R. A. Residence time of receptor-ligand
complexes and its effect on biological function. Biochemistry 47, 5481–5492(2008).
2. Copeland, R. A., Pompliano, D. L. & Meek, T. D. Drug-target residence timeand its implications for lead optimization. Nat. Rev. Drug. Discov. 5, 730–739(2006).
3. Maschera, B. et al. Human immunodeficiency virus: Mutations in the viralprotease that confer resistance to saquinavir increase the dissociation rateconstant of the protease-saquinavir complex. J. Biol. Chem. 271, 33231–33235(1996).
4. Swinney, D. C. Biochemical mechanisms of drug action: what does it take forsuccess? Nat. Rev. Drug. Discov. 3, 801–808 (2004).
5. Copeland, R. A. Evaluation of Enzyme Inhibitors in Drug Discovery: A Guide forMedicina Chemists and Pharmacologists. (Wiley, New York, 2013).
6. Keserü, G., Swinney, D. C., Mannhold, R., Kubinyi, H. & Folkers, G.Thermodynamics and Kinetics of Drug Binding. (Wiley-VCH, Weinheim, 2015).
7. Lu, H. et al. Slow-onset inhibition of the fabI enoyl reductase from francisellatularensis: Residence time and in vivo activity. Acs. Chem. Biol. 4, 221–231(2009).
8. Lu, H. & Tonge, P. J. Drug-target residence time: critical information for leadoptimization. Curr. Opin. Chem. Biol. 14, 467–474 (2010).
9. Spagnuolo, L. A. et al. Evaluating the contribution of transition statedestabilization to changes in the residence time of triazole-based InhAinhibitors. J. Am. Chem. Soc. 139, 3417–3429 (2017).
10. Ruben, A. J., Kiso, Y. & Freire, E. Overcoming roadblocks in leadoptimization: a thermodynamic perspective. Chem. Biol. Drug. Des. 67, 2–4(2006).
11. Zídek, L., Novotny, M. V. & Stone, M. J. Increased protein backboneconformational entropy upon hydrophobic ligand binding. Nat. Struct. Biol. 6,1118–1121 (1999).
12. Diehl, C. et al. Protein flexibility and conformational entropy in ligand designtargeting the carbohydrate recognition domain of galectin-3. J. Am. Chem. Soc.132, 14577–14589 (2010).
13. Teague, S. J. Implications of protein flexibility for drug discovery. Nat. Rev.Drug. Discov. 2, 527–541 (2003).
14. Frederick, K. K., Marlow, M. S., Valentine, K. G. & Wand, A. J.Conformational entropy in molecular recognition by proteins. Nature 448,325–329 (2007).
15. Wand, A. J., Moorman, V. R. & Harpole, K. W. in Dynamics in EnzymeCatalysis Vol. 337 (eds Klinman, J. & Hammes-Schiffer, S.) Ch. 3 (Springer-Verlag Berlin Heidelberg, Heidelberg, 2013).
16. Tzeng, S.-R. & Kalodimos, C. G. Protein activity regulation by conformationalentropy. Nature 488, 236–240 (2012).
17. Tzeng, S.-R. & Kalodimos, C. G. Dynamic activation of an allosteric regulatoryprotein. Nature 462, 368–372 (2009).
18. Gilson, M. K. et al. BindingDB in 2015: A public database for medicinalchemistry, computational chemistry and systems pharmacology. Nucleic AcidsRes. 44, D1045–D1053 (2015).
19. Olsson, T. S. G., Williams, M. A., Pitt, W. R. & Ladbury, J. E. Thethermodynamics of protein-ligand interaction and solvation: insights for liganddesign. J. Mol. Biol. 384, 1002–1017 (2008).
20. Pargellis, C. et al. Inhibition of p38 MAP kinase by utilizing a novel allostericbinding site. Nat. Struct. Biol. 9, 268–272 (2002).
21. Copeland, R. A. Conformational adaptation in drug-target interactions andresidence time. Future Med. Chem. 3, 1491–1501 (2011).
22. Garvey, E. P. Structural mechanisms of slow-onset, two-step enzyme inhibition.Curr. Chem. Biol. 4, 64–73 (2010).
23. Monod, J., Wyman, J. & Changeux, J. P. On the nature of allosteric transitions:a plausible model. J. Mol. Biol. 12, 88–118 (1965).
24. Koshland, D. E. Application of a theory of enzyme specificity to proteinsynthesis. Proc. Natl Acad. Sci. USA. 44, 98–104 (1958).
25. Greives, N. & Zhou, H.-X. Both protein dynamics and ligand concentration canshift the binding mechanism between conformational selection and induced fit.Proc. Natl Acad. Sci. USA. 111, 10197–10202 (2014).
26. Hammes, G. G. G. G., Chang, Y.-C. & Oas, T. G. Conformational selection orinduced fit: a flux description of reaction mechanism. Proc. Natl Acad. Sci. USA.106, 13737–13741 (2009).
27. Csermely, P., Schnaider, T., Soti, C., Prohászka, Z. & Nardai, G. The 90-kDamolecular chaperone family. Pharmacol. Ther. 79, 129–168 (1998).
28. Scheibel, T. et al. ATP-binding properties of human Hsp90. J. Biol. Chem. 272,18608–18613 (1997).
29. Pearl, L. H., Prodromou, C. & Workman, P. The Hsp90 molecular chaperone:an open and shut case for treatment. Biochem. J. 410, 439–453 (2008).
30. Li, J. et al. Structure insights into mechanisms of ATP hydrolysis and theactivation of human heat-shock protein 90. Biochim. Biophys. Acta 44, 300–306(2012).
31. Didenko, T., Duarte, A. M. S., Karagöz, G. E. & Rüdiger, S. G. D.Hsp90 structure and function studied by NMR spectroscopy. Biochim. Biophys.Acta - Mol. Cell Res. 1823, 636–647 (2012).
32. Li, Y., Zhang, T., Schwartz, S. J. & Sun, D. New developments in Hsp90inhibitors as anti-cancer therapeutics: Mechanisms, clinical perspective andmore potential. Drug Resist. Updat. 12, 17–27 (2009).
33. Whitesell, L. & Lindquist, S. L. HSP90 and the chaperoning of cancer. Nat. Rev.Cancer 5, 761–772 (2005).
34. Onuoha, S. C. et al. Mechanistic studies on Hsp90 inhibition by ansamycinderivatives. J. Mol. Biol. 372, 287–297 (2007).
35. Krukenberg, K., Street, T. O., Lavery, L. & Agard, D. Conformationaldynamics of the molecular chaperone Hsp90. Q. Rev. Biophys. 44, 1–27(2011).
36. Richter, K., Reinstein, J. & Buchner, J. N-terminal residues regulate thecatalytic efficiency of the Hsp90 ATPase cycle. J. Biol. Chem. 277, 44905–44910(2002).
37. Zhang, H. et al. A dynamic view of ATP-coupled functioning cycle of hsp90 n-terminal domain. Sci. Rep. 5, 9542 (2015).
38. Stebbins, C. E. et al. Crystal structure of an Hsp90–Geldanamycin complex:targeting of a protein chaperone by an antitumor agent. Cell 89, 239–250(1997).
39. Immormino, R. M., Kang, Y., Chiosis, G. & Gewirth, D. T. Structural andquantum chemical studies of 8-aryl-sulfanyl adenine class Hsp90 inhibitors. J.Med. Chem. 49, 4953–4960 (2006).
40. Wright, L. et al. Structure-activity relationships in purine-based inhibitorbinding to HSP90 isoforms. Chem. Biol. 11, 775–785 (2004).
41. Neubert, T. et al. Discovery of novel oxazepine and diazepine carboxamides astwo new classes of heat shock protein 90 inhibitors. Bioorg. Med. Chem. Lett.25, 1338–1342 (2015).
42. Ernst, J. T. et al. Correlation between chemotype-dependent bindingconformations of HSP90a/b and isoform selectivity-Implications for thestructure-based design of HSP90a/b selective inhibitors for treatingneurodegenerative diseases. Bioorg. Med. Chem. Lett. 24, 204–208(2014).
43. Nilapwar, S. et al. Structural-thermodynamic relationships of interactionsin the N-terminal atp-binding domain of Hsp90. J. Mol. Biol. 392, 923–936(2009).
44. Gooljarsingh, L. T. et al. A biochemical rationale for the anticancer effects ofHsp90 inhibitors: slow, tight binding inhibition by geldanamycin and itsanalogues. Proc. Natl. Acad. Sci. USA 103, 7625–7630 (2006).
45. Morra, G., Verkhivker, G. & Colombo, G. Modeling signal propagationmechanisms and ligand-based conformational dynamics of the Hsp90molecular chaperone full-length dimer. PLoS Comput. Biol. 5, e1000323(2009).
46. Tillotson, B. et al. Hsp90 (Heat Shock Protein 90) inhibitor occupancy is adirect determinant of client protein degradation and tumor growth arrestin vivo. J. Biol. Chem. 285, 39835–39843 (2010).
47. Starikov, E. B. & Nordén, B. Enthalpy-entropy compensation: A phantom orsomething useful? J. Phys. Chem. B. 111, 14431–14435 (2007).
48. Dunitz, J. D. Win some, lose some: enthalpy-entropy compensation in weakintermolecular interactions. Chem. Biol. 2, 709–712 (1995).
49. Bezerra, G. A. et al. Entropy-driven binding of opioid peptides induces a largedomain motion in human dipeptidyl peptidase III. Proc. Natl Acad. Sci. USA109, 6525–6530 (2012).
50. Truchon, J.-F., Pettitt, B. M. & Labute, P. A cavity corrected 3D-RISMfunctional for accurate solvation free energies. J. Chem. Theory Comput. 10,934–941 (2014).
51. Huggins, D. J. Quantifying the entropy of binding for water moleculesin protein cavities by computing correlations. Biophys. J. 108, 928–936(2015).
52. Miller, B. R. et al. MMPBSA.py: An efficient program for end-state free energycalculations. J. Chem. Theory Comput. 8, 3314–3321 (2012).
53. Chang, C. E., Chen, W. & Gilson, M. K. Evaluating the accuracy of thequasiharmonic approximation. J. Chem. Theory Comput. 1, 1017–1028(2005).
54. Suárez, E., Díaz, N., Méndez, J. & Suárez, D. CENCALC: A computational toolfor conformational entropy calculations from molecular simulations. J. Comput.Chem. 34, 2041–2054 (2013).
55. Kokh, D. B., Czodrowski, P., Rippmann, F. & Wade, R. C. Perturbationapproaches for exploring protein binding site flexibility to predict transientbinding pockets. J. Chem. Theory Comput. 12, 4100–4113 (2016).
56. Shiau, A. K., Harris, S. F., Southworth, D. R. & Agard, D. A. Structural Analysisof E. coli hsp90 reveals dramatic nucleotide-dependent conformationalreardrangements. Cell 127, 329–340 (2006).
57. Vogt, A. D. & Di Cera, E. Conformational selection or induced fit?A critical appraisal of the kinetic mechanism. Biochemistry 51, 5894–5902(2012).
58. Klein, T. et al. Structural and dynamic insights into the energetics ofactivation loop rearrangement in FGFR1 kinase. Nat. Commun. 6, 7877(2015).
59. Heller, G. T., Sormanni, P. & Vendruscolo, M. Targeting disorderedproteins with small molecules using entropy. Trends Biochem. Sci. 40, 491–496(2015).
60. Kabsch, W. XDS. Acta Crystallogr D. Biol. Crystallogr 66, 125–132 (2010).61. Bricogne, G. et al. Buster v. 2.11.6 (Global Phasing Ltd. 2016).62. Lindorff-Larsen, K. et al. Improved side-chain torsion potentials for the Amber
ff99SB protein force field. Proteins Struct. Funct. Bioinforma. 78, 1950–1958(2010).
63. Wang, J., Wolf, R. M., Caldwell, J. W., Kollman, P. A. & Case, D. A.Development and testing of a general amber force field. J. Comput. Chem. 25,1157–1174 (2004).
64. Dupradeau, F. Y. et al. The R.E.D. tools: advances in RESP and ESP chargederivation and force field library building. Phys. Chem. Chem. Phys. 12,7821–7839 (2010).
65. Abraham, M. J. et al. Gromacs: High performance molecular simulationsthrough multi-level parallelism from laptops to supercomputers. SoftwareX1–2, 19–25 (2015).
67. Sanschagrin, P. C. & Kuhn, L. A. Cluster analysis of consensus water sites inthrombin and trypsin shows conservation between serine proteases andcontributions to ligand specificity. Protein Sci. 7, 2054–2064 (1998).
68. Nguyen, C. N., Young, T. K. & Gilson, M. K. Grid inhomogeneous solvationtheory: hydration structure and thermodynamics of the miniature receptorcucurbit[7]uril. J. Chem. Phys. 137, 44101 (2012).
69. Case, D. A. et al. AMBER 2015 (University of California, San Francisco,2015).
AcknowledgementsThis work was supported by the EU/EFPIA Innovative Medicines Initiative (IMI) JointUndertaking, K4DD (grant no. 115366). This paper reflects only the authors’ views andneither the IMI nor the European Commission is liable for any use that may be made ofthe information contained herein. We thank S. Kashif Sadiq and Neil Bruce for usefulsuggestion on the manuscript preparation. D.B.K. and R.C.W. gratefully acknowledge thesupport of the Klaus Tschira Foundation. M.A. thanks Ann-Sophie Frombach for helpingwith SPR and ITC experiments and Tiago Bandeiras for carrying DSF assays on WT andL107A-HSP90.
Author contributionsM.F. and R.C.W.: Initiated the project. M.A.: Designed and performed theexperiments, analyzed the data and wrote the manuscript. D.B.K.: Carried out theoreticalcomputations, analyzed the data and wrote the manuscript. R.C.W.: Supervised thecomputational work, helped with interpretation of theoretical results and in writing themanuscript. J.B, A.W. and M.F.: Supervised the experimental work and helped in theinterpretation of experimental results. P.M.: Helped in the interpretation of crystal-lographic data. H.M.E. and H.P.B.: Developed the HSP90 inhibitors described in thisarticle. C.S.: Developed the HSP90 cellular assays.
Additional informationSupplementary Information accompanies this paper at https://doi.org/10.1038/s41467-017-02258-w.
Competing interests: The authors declare no competing financial interests.
Reprints and permission information is available online at http://npg.nature.com/reprintsandpermissions/
Publisher's note: Springer Nature remains neutral with regard to jurisdictional claims inpublished maps and institutional affiliations.
Open Access This article is licensed under a Creative CommonsAttribution 4.0 International License, which permits use, sharing,
adaptation, distribution and reproduction in any medium or format, as long as you giveappropriate credit to the original author(s) and the source, provide a link to the CreativeCommons license, and indicate if changes were made. The images or other third partymaterial in this article are included in the article’s Creative Commons license, unlessindicated otherwise in a credit line to the material. If material is not included in thearticle’s Creative Commons license and your intended use is not permitted by statutoryregulation or exceeds the permitted use, you will need to obtain permission directly fromthe copyright holder. To view a copy of this license, visit http://creativecommons.org/licenses/by/4.0/.