Protein Crystallization As a Process Step in a Novel Meso OscillatoryFlow Reactor: Study of Lysozyme Phase BehaviorFilipa Castro,*,†,‡ Antonio Ferreira,† Jose A. Teixeira,‡ and Fernando Rocha†
†LEPABELaboratory for Process Engineering, Environment, Biotechnology and Energy, Faculty of Engineering of the University ofPorto, Universiyt of Porto, Rua Roberto Frias, s/n, 4200-465 Porto, Portugal‡CEBCentre for Biological Engineering, University of Minho, Campus de Gualtar, 4710-057 Braga, Portugal
ABSTRACT: In the present work, it is reported for the firsttime the study of the applicability of a novel meso oscillatoryflow reactor (meso-OFR) for protein crystallization as aprocess step. Crystallization assays carried out in the designeddevice enabled to derive a two-dimensional lysozyme phasediagram (lysozyme concentration against sodium chlorideconcentration). Results evidence the formation of several typesof crystals (different size and shape), with a strong influence ofsalt concentration on crystal shape. Results also show thatlysozyme remains active at the end of the experiments.Furthermore, it was possible to verify the reduction of the metastability zone when compared to lysozyme crystallizationconducted under quiescent conditions. Induction times were also measured by online monitoring of the turbidity of thecrystallization solution, obtained values being between 41 and 900 min. Beyond providing improved understanding of proteinphase behavior under oscillatory flow mixing, the results are very promising regarding the feasibility of the designed methodologyfor protein crystallization as a process step.
■ INTRODUCTION
Protein crystallization has been focused on the production ofdiffraction-quality single crystals for protein structure determi-nation by crystallography.1−3 Research conducted during thelast years has led to improved methodologies for theproduction of high-quality protein crystals allowing obtaininghigh-quality X-ray diffraction patterns, and leading thus toinformation on structure biology.3 However, protein crystal-lization also offers many advantages as a means of proteinpurification at the industrial scale. Compared to conventionalpurification techniques, such as chromatography, crystallizationis a cost-effective alternative since high-purity proteins can beobtained from a single-step operation.2,4−8 Further, proteincrystals have a longer storage life and greater purity than thedissolved form, which opens up the number of potentialapplications for the pharmaceutical industry, from formulationand storage of proteins to drug delivery.1,4,9
Unlike protein structure determination, where single, large,stable, and well-diffracting crystals are required and usuallyobtained by slow-growing processes, rapid and quantitativecrystallization is needed for large-scale protein purificationprocesses. As most of the industrial processes, recovery yield, aswell as purity must be high and the crystallization time low, sothat growth kinetics should be fast (hours).2,4,10,11 Moreover,reagents must be inexpensive, compounds should be ofpharmaceutical grade and proteins must not lose their potencyafter crystals are redissolved.1,11 In contrast to structuralanalysis, large single crystal shape is not as important, butcrystals with a certain size, shape, and mechanical strength are
desirable, so that they can be easily separated from their motherliquor, namely by filtration or centrifugation.1,2,10−12
Identification of crystallization conditions of a protein is stilldifficult, particularly for purification purposes where thecrystallization step has to meet specific requirements.4,11,13 Itrequires knowledge about the thermodynamic properties of theprotein solution, concentration of the protein, temperature andcharacteristics of the solvent (e.g., pH, ionic strength, bufferconcentration and identity, and any additives).3,14 Thetraditional method to study protein solubility, in response todifferent operating conditions, is to construct a phase diagram,commonly protein concentration against precipitant agentconcentration. A phase diagram is divided by the solubilitycurve into two areas corresponding to undersaturated andsupersaturated state of a protein solution. The supersaturatedarea comprises of the metastable, nucleation and precipitationzones.3,10,11,13,14 In the nucleation and precipitation zones theprotein is either crystalline or precipitated, whereas in themetastable zone the probability of nucleation occurrence is verylow but already existing crystals could grow.3 However,complete phase diagrams for prediction of protein crystal-lization are rarely available and crystallization conditions areusually found by a trial-and-error approach. The few reportspublished include the work of Hekmat12 and Smejkal5 on thecrystallization of lysozyme, the works of Smejkal9 and Hebel15
Received: February 17, 2016Revised: April 15, 2016Published: May 11, 2016
both on the crystallization of therapeutic antibodies and morerecently the study conducted by Huettmann11 on thecrystallization of interferon gamma.While protein crystallization is usually performed under
quiescent conditions, protein crystallization as a process steprequires a minimum of agitation. Otherwise crystals sink to thebottom, grow into each other and the crystal growth is diffusionlimited leading to long process durations or low yields.9,16
Studies concerning the influence of the type and degree ofagitation on protein crystallization can be found in theliterature. A reduced nucleation time was observed in anunbaffled stirred vessel,17 in a wave shaker18 and underoscillatory flow.16 Smejkal et al.5 observed a significantly fasteronset of the crystallization of lysozyme and Fab-fragment of thetherapeutic antibody Canakinumab in stirred vessels whencompared to nonagitated systems. Besides, authors verified thatfurther increase of the agitation rate resulted in the decrease oflysozyme crystallization onset. In contrast, a prolongednucleation time was verified in a rotary shaker19 and undermechanical vibration.20 Vekilov and Rosenberger21 suggestedthat lysozyme growth cessation and deceleration were due toconvection-enhanced supply of impurities to the interface.Shear forces were also related to limit the attachment oflysozyme growth units.22
Another key issue concerns the scalability of the process.1,11
Protein crystallization on process scale is usually performed instirred tank crystallizers. Commonly suggested scale-up criteriasuch as minimum agitation rate to keep the crystals insuspension or impeller tip speed are not always successful andsometimes the scale-up criterion has to be based onexperimental data.9,23 Moreover, large stirred tanks are usuallycharacterized by low mixing efficiency that gives rise to excesslocal concentrations,4 and in its turn leads to spontaneousnucleation. Besides, shear stresses exerted by the impellers canlead to protein denaturation and damaged crystals.4,7 Anotherimportant concern is the fact that often limited amounts ofprotein are available, making difficult the implementation ofexperiments on a large scale.So far, only a few reports have been published on protein
crystallization as a process step. The most prominent exampleis the industrial implementation of the crystallization process ofinsulin.23 Other examples include studies on the crystallizationof lysozyme,5,12,15,24−26 ovalbumin,17 L-methionine γ-lyase,27
fungal lipases,10,28 and urate oxidase.29 Studies have also beenreported on more complex proteins like monoclonal antibod-ies,9,11,30 more difficult to crystallize due to their large size andstructural flexibility.15 More recently, Neugebauer and Kinast7
reported the development of a tubular-plug flow crystallizer forthe continuous lysozyme crystallization. Although the studiespublished show the feasibility of protein crystallization as ameans of purification, further work is required to establish thelatter as an alternative to the existing downstream processingtechniques. A limited number of works were performed underwell-defined and scalable operating conditions.7 In addition,some of the reports lack information about protein phasebehavior, crystallization kinetics and yield,31 and flowconditions.29 Furthermore, rather long process durations orlow yields were observed in most cases.9,16,29−31
To overcome some of the gaps observed in commoncrystallizers, a novel meso oscillatory flow reactor (meso-OFR)was developed by members of the present research team.32 Thedevice is operated under oscillatory flow mixing that has beenproved to result into significant enhancement in processes such
as mass transfer and particle mixing,33,34 particularly relevantfor crystallization processes. Indeed, significant enhancement incrystal characteristics and reduction of operation time havebeen reported for the crystallization of hydroxyapatite.35,36 Inaddition, the reactor can be easily scaled up by the addition inseries of other identical meso-OFR unities. In this context, thepresent work aims to study, for the first time, the applicabilityof the meso-OFR on protein crystallization for purificationpurposes. Lysozyme was used as a protein crystallization model.Like any industrial process it is intended to obtain maximumyield and purification, and to achieve this rapidly. Control ofcrystal size is as well important. Optimization with respect to allthese criteria has to be based on a fundamental understandingof the process, that is, knowledge of the phase diagram andkinetics. For this, different experimental conditions werescreened by varying protein and precipitating agent concen-tration in order to derive a sufficiently quantitative crystal-lization phase diagram of the protein under study. Inductiontimes were measured by online monitoring of the turbidity ofthe crystallization solution. The obtained crystals werecharacterized by optical microscopy and their activity wasmeasured. Additionally, crystal yield was estimated.
■ MATERIALS AND METHODSProtein and Chemicals. Chicken egg-white lysozyme was
purchased from Sigma-Aldrich (Fluka-62971, Germany, lot no.BCBJ2814 V) and was used without further purification. One stocksolution of 0.2 M sodium acetate buffer at pH 4.7 was prepared usingsodium acetate trihydrate from Sigma-Aldrich (99,5%, Germany) andglacial acetic acid from Merck (100%, Germany) to adjust the pH.Sodium chloride was obtained from Panreac AppliChem (99,5%,Germany). Several lysozyme (5−50 mg.mL−1) and sodium chloride(2.5−6% (w/v)) solutions were prepared in the sodium acetate buffersolution, pH of the sodium chloride solution being posteriorlyadjusted with a 1 M hydroxide sodium (Pronolab, Portugal) solution.All the solutions were prepared in ultrapure water (Milli Q water,resistivity of 18.2 MΩ.cm−1 at 25 °C) and filtered through a 0.2 μmcutoff membrane (Sigma-Aldrich, Whatman, Germany). Lysozymeconcentrations were measured by UV spectroscopy (ScanSpec UV−vis, Sarspec, Portugal) at 280 nm using a known extinction coefficient(2.5 L·g−1·cm−1).9
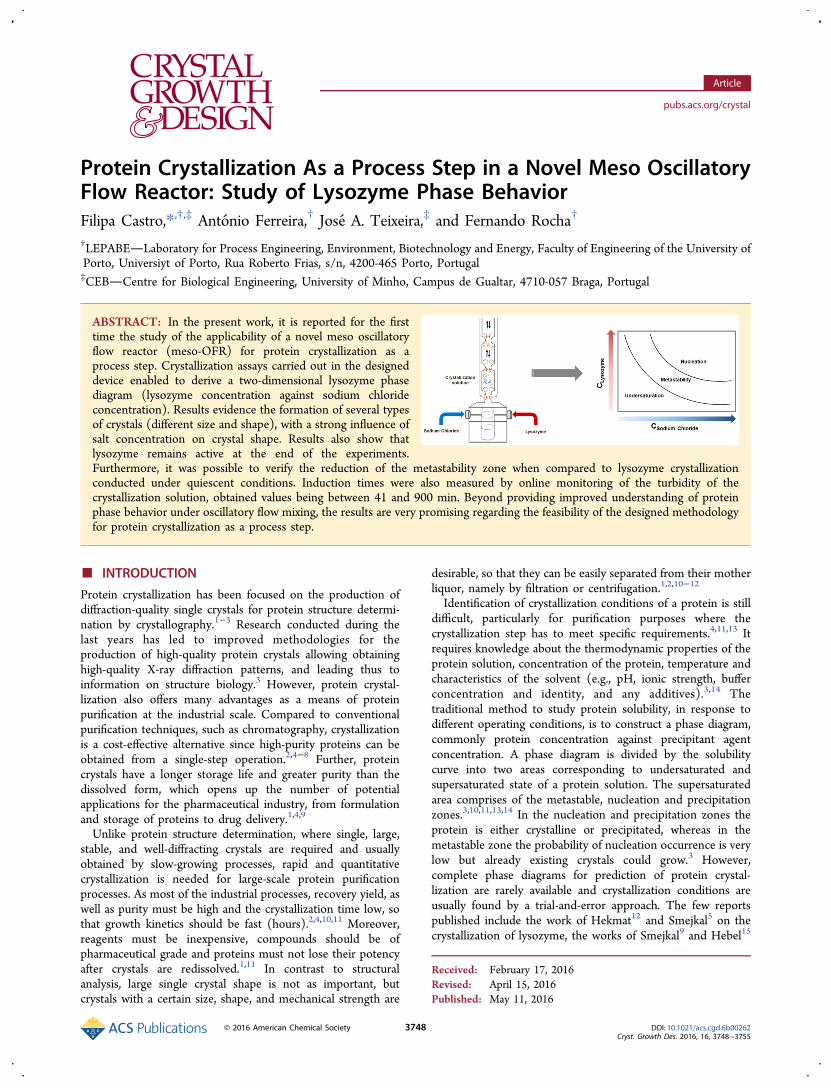
Experimental Installation. Lysozyme crystallization trials werecarried out in the experimental setup represented in Figure 1. Itinvolves the meso-OFR placed vertically, a mixing chamber and ameasuring cell connected to a spectrometer for turbidity measurement.The device consists of a 35 cm long and 3 mm internal diameter glassjacketed tube provided with smooth periodic constrictions (SPC) andhas an approximate volume of 4 mL (Figure 1). The crystallizationsolution was oscillated using a piston moved by a stirring motor (CATR100C, United States of America). The oscillating device was custom-built. The reactor is operated under oscillatory flow mixing, controlledby the oscillation frequency ( f) and amplitude (x0) that were fixed at1.83 Hz and 4 mm, respectively. The value of the amplitudecorresponds to the center-to-peak amplitude, and the measurementswere performed in the tube without constrictions. Reactants were fedinto the setup by means of a syringe pump (NE-4000, New Era,United States of America). Reactants were tempered and temperatureinside the meso-OFR was regulated by a thermostatic bath (Huber,Ministat 125, Germany) maintained at 20 °C.
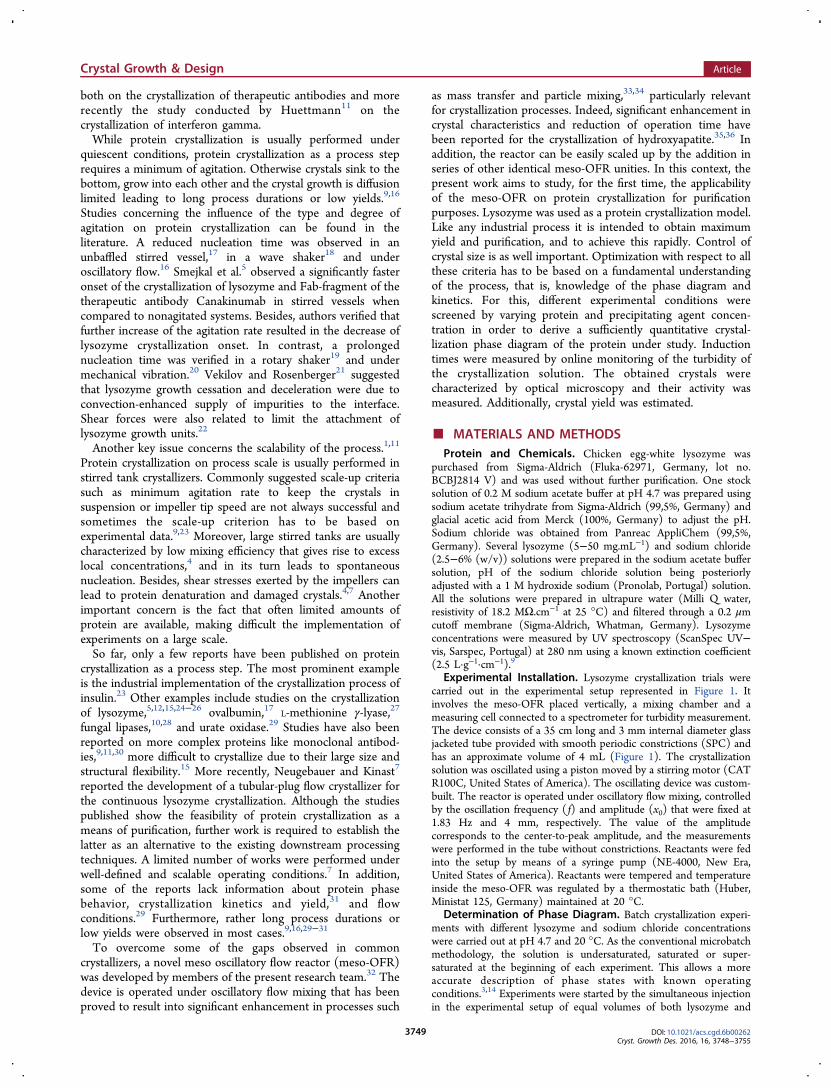
Determination of Phase Diagram. Batch crystallization experi-ments with different lysozyme and sodium chloride concentrationswere carried out at pH 4.7 and 20 °C. As the conventional microbatchmethodology, the solution is undersaturated, saturated or super-saturated at the beginning of each experiment. This allows a moreaccurate description of phase states with known operatingconditions.3,14 Experiments were started by the simultaneous injectionin the experimental setup of equal volumes of both lysozyme and
sodium chloride solutions. After 24h of incubation, samples wereinvestigated for crystals, precipitates or other structures by opticalmicroscopy (Standard 20, Zeiss, Germany). The supernatant wasfiltered and diluted with ultrapure water for lysozyme concentrationdetermination by UV absorbance (λ= 280 nm). This procedure wascarried out at least three times for each initial supersaturation
=⎛⎝⎜
⎞⎠⎟S
Ci solubility
lysozyme initial
lysozyme. Then, a phase diagram was assembled (Figure 2).
Induction Time. Induction time (tind) is known as the periodbetween the establishment of supersaturation and the detection of anew phase.37,38 Increase of the crystals number in solution can bedetected by measuring the turbidity of the crystallization solution,once the formation of a crystal suspension is expected to decrease lighttransmission. tind can thus be determined by using the change in thetransmission of light. In this way, online measurement of the turbidityof the crystallization solution was carried out with a spectrometer(ScanSpec UV−vis, Sarspec, Portugal) at 400 nm to monitor thecrystallization process
τ = ×d
A2.303
(1)
where τ = turbidity, d = scattering path length (path length of themeasuring cell being 0.4 cm), and A = absorbance.
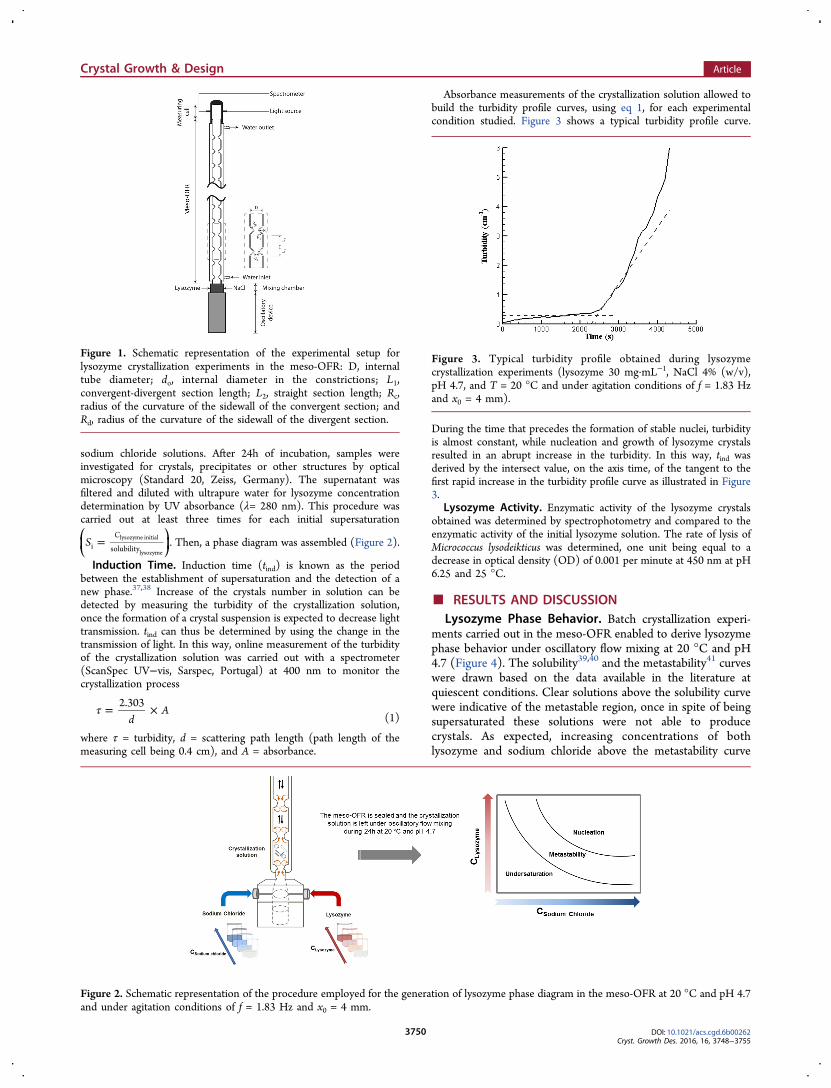
Absorbance measurements of the crystallization solution allowed tobuild the turbidity profile curves, using eq 1, for each experimentalcondition studied. Figure 3 shows a typical turbidity profile curve.
During the time that precedes the formation of stable nuclei, turbidityis almost constant, while nucleation and growth of lysozyme crystalsresulted in an abrupt increase in the turbidity. In this way, tind wasderived by the intersect value, on the axis time, of the tangent to thefirst rapid increase in the turbidity profile curve as illustrated in Figure3.
Lysozyme Activity. Enzymatic activity of the lysozyme crystalsobtained was determined by spectrophotometry and compared to theenzymatic activity of the initial lysozyme solution. The rate of lysis ofMicrococcus lysodeikticus was determined, one unit being equal to adecrease in optical density (OD) of 0.001 per minute at 450 nm at pH6.25 and 25 °C.
■ RESULTS AND DISCUSSIONLysozyme Phase Behavior. Batch crystallization experi-
ments carried out in the meso-OFR enabled to derive lysozymephase behavior under oscillatory flow mixing at 20 °C and pH4.7 (Figure 4). The solubility39,40 and the metastability41 curveswere drawn based on the data available in the literature atquiescent conditions. Clear solutions above the solubility curvewere indicative of the metastable region, once in spite of beingsupersaturated these solutions were not able to producecrystals. As expected, increasing concentrations of bothlysozyme and sodium chloride above the metastability curve
Figure 1. Schematic representation of the experimental setup forlysozyme crystallization experiments in the meso-OFR: D, internaltube diameter; do, internal diameter in the constrictions; L1,convergent-divergent section length; L2, straight section length; Rc,radius of the curvature of the sidewall of the convergent section; andRd, radius of the curvature of the sidewall of the divergent section.
Figure 2. Schematic representation of the procedure employed for the generation of lysozyme phase diagram in the meso-OFR at 20 °C and pH 4.7and under agitation conditions of f = 1.83 Hz and x0 = 4 mm.
Figure 3. Typical turbidity profile obtained during lysozymecrystallization experiments (lysozyme 30 mg·mL−1, NaCl 4% (w/v),pH 4.7, and T = 20 °C and under agitation conditions of f = 1.83 Hzand x0 = 4 mm).
led to crystallization and further increase to simultaneouscrystallization and precipitation. Several types of crystals wereobserved, from tetragonal, orthorhombic and needle-shapedcrystals to microcrystals and precipitate, depending on bothreactants concentration but mostly on salt concentration(Figure 5). For sodium chloride concentrations below andequal to 3% (w/v), essentially tetragonal crystals wereobserved. One can also verify that crystals with different sizes(about 5 to 15 μm) and aggregated crystals were obtained. Forsodium chloride concentration of 4% (w/v) and lysozymeconcentration between 15 and 25 mg.mL−1, samples wereconstituted by well-defined tetragonal and orthorhombiccrystals with typical size around 10 μm and needle-shapedcrystals. Images also demonstrate the generation of aggregatedmicrocrystals (with typical size about 3 μm) for higherlysozyme concentration (30 mg.mL−1). For high concen-trations of sodium chloride (≥5% (w/v)) and low concen-tration of lysozyme (10 to 15 mg·mL−1) mainly needles withregular size and shape were formed, while increasing lysozymeconcentration led to precipitation.As known, crystallization of a protein involves reduction of
the solubility of the protein, namely by the addition ofprecipitant agents.3 In the case of sodium chloride, the
solvation layer around protein molecules is reduced, givingthus rise to solubility decrease. In this way, a direct relationshipwas verified between salt concentration and the appearance oflysozyme crystals. Results obtained also demonstrated a stronginfluence of salt concentration on the shape of lysozymecrystals. Under quiescent conditions, experimental conditionsstudied should only lead to the formation of tetragonallysozyme crystals.39−41 However, for concentrations of sodiumchloride equal and superior to 4% (w/v) samples containneedle-shaped crystals. Bhamidi et al.42 suggested that needleswere an unstable polymorph of lysozyme that slowly wouldconvert to the tetragonal form. However, observations done onthe collect suspensions kept during several months did notprove this hypothesis for all the cases.In the present work lysozyme crystals are subjected to fluid
shear forces induced by oscillatory flow mixing and solid−liquidinterfaces. Lysozyme crystals collide with parts of the glass wallsof the meso-OFR and with each other. In this way, crystallinefragments could be created by attrition leading to secondarynucleation that gives rise to excess nucleation and suppressesgrowth, and in its turn lead to small size crystals.43 Indeed,protein crystals are generally more fragile than crystals ofinorganic and small organic molecules because of their highsolvent content,44 so that they are highly likely to fractureduring collision with each other or the crystallizationequipment. Experimental results suggest the occurrence of astrong nucleation, since most of the experimental conditionsstudied led to the formation of a high number of small crystalsand crystals with different sizes (Figure 5).As shown in Figure 5, some aggregation could be observed.
In what concerns protein crystals aggregation, literature reportsmany factors that can induce particle aggregation. Kusters etal.45 suggested that aggregation for lysozyme crystals with adiameter in the range of 1−100 μm is mainly induced by shearforces according to its Kolmogorov microscale. Other studies46
demonstrated that shear alone do not cause aggregationalthough prolonged exposure resulted in some minor reversibleaggregation. In the present work, besides the fact that thelysozyme crystals have an average size in the order of 10 μm(see Table 2), they are also subjected to shear stress, which mayexplain their aggregation.
Figure 4. Lysozyme phase behavior in the meso-OFR at pH 4.7 and20 °C under agitation conditions of f = 1.83 Hz and x0 = 4 mm.
Figure 5. Lysozyme crystals obtained in the meso-OFR at pH 4.7 and 20 °C under agitation conditions of f = 1.83 Hz and x0 = 4 mm. Lysozymeconcentrations used are mentioned in each picture.
Lysozyme Activity. Regarding the activity of the crystalscollected, the results revealed that the protein collected is stillactive, since most of the samples exhibited at least 80% ofactivity when compared to the initial lysozyme solution.It is commonly believed that denaturation is a prerequisite
for aggregation, once small perturbations in protein structuremay expose hydrophobic surfaces, causing self-interactions andconsequential aggregation.46 According to the literature,47 longexposure time at solid−liquid interfaces48 and a moving gas−liquid interface46,49−52 can cause damage to proteins. It has alsobeen reported that this phenomenon is mainly due to thehydrophobic character of such interfaces.46 In the meso-OFR,lysozyme crystals are subjected to fluid shear forces and solid−liquid interfaces. Furthermore, they are exposed to air−liquidinterfaces, although there have been attempts to minimizethem, once reactants were carefully injected in the system toavoid bubbles and the reactor was almost completely full. Giventhe little loss of activity, the aggregation observed may bemainly explained by exposure to shear stress as alreadysuggested above.Metastability Curve Determination. On the basis of
lysozyme phase behavior (Figure 4), it was possible todetermine the metastability curve based on the minimumsodium chloride concentration needed for nucleation atdifferent lysozyme concentrations. Given the uncertaintyassociated with the experimental results and the stochasticnature of nucleation, a potential range for the metastabilitycurve was represented (error bars). These results, as well as thesolubility and metastability curves reported in the literature formicrobatch experiments39,40 were linearized (see Figure 6)according to Martins et al.40 equation
=⎛⎝⎜
⎞⎠⎟C A
BC
explysozymeNaCl (2)
where Clysozyme is the lysozyme concentration in milligrams permilliliter, and CNaCl is the concentration of sodium chloride inpercentage units (w/v). The values of the constants A and Bthat best fit the experimental results are given in Table 1.
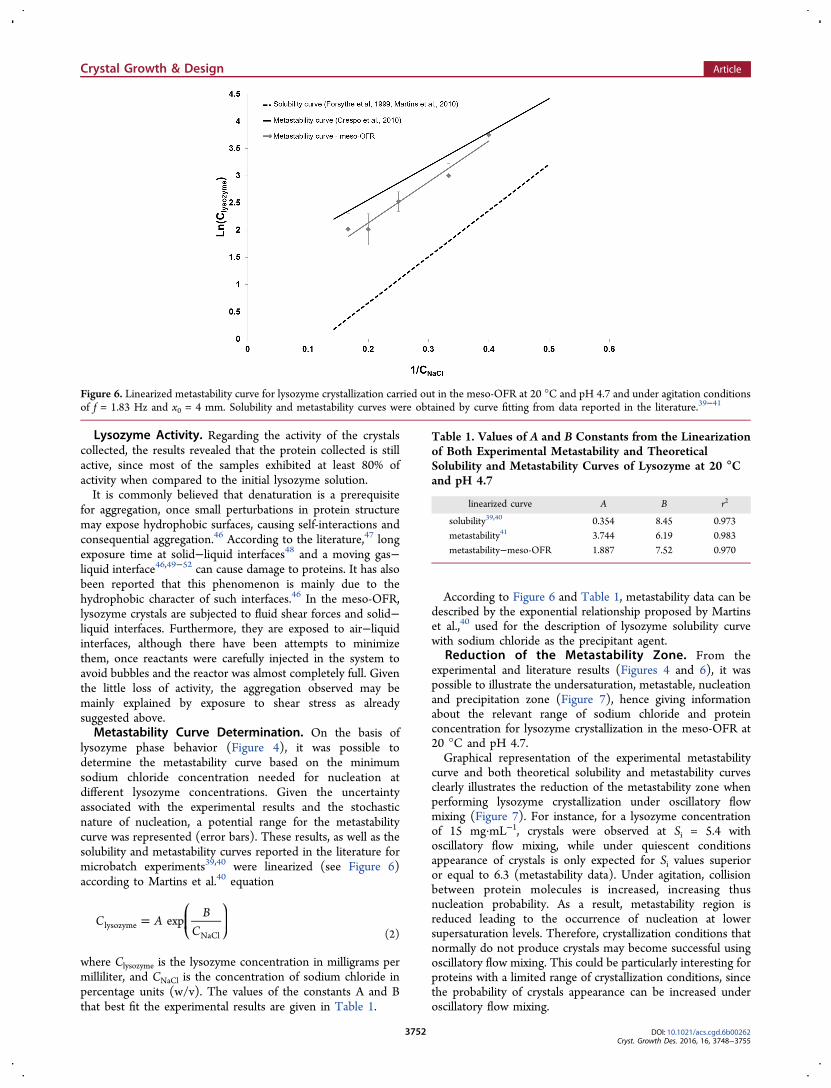
According to Figure 6 and Table 1, metastability data can bedescribed by the exponential relationship proposed by Martinset al.,40 used for the description of lysozyme solubility curvewith sodium chloride as the precipitant agent.
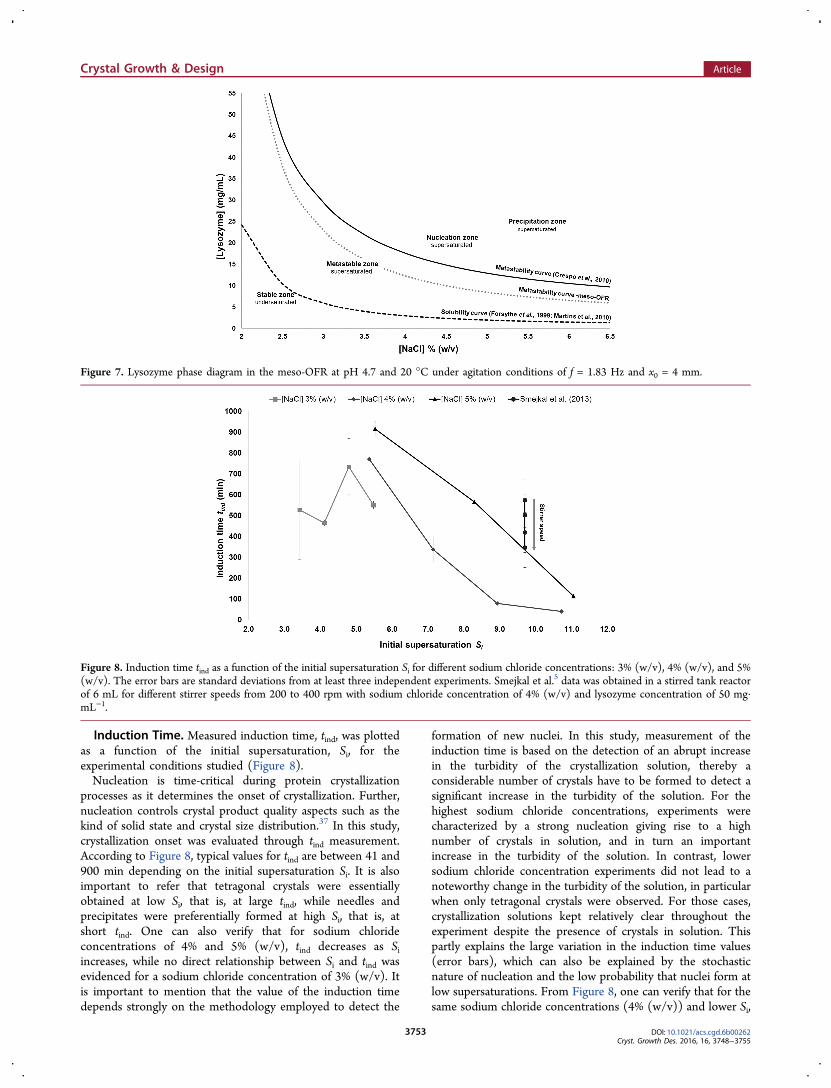
Reduction of the Metastability Zone. From theexperimental and literature results (Figures 4 and 6), it waspossible to illustrate the undersaturation, metastable, nucleationand precipitation zone (Figure 7), hence giving informationabout the relevant range of sodium chloride and proteinconcentration for lysozyme crystallization in the meso-OFR at20 °C and pH 4.7.Graphical representation of the experimental metastability
curve and both theoretical solubility and metastability curvesclearly illustrates the reduction of the metastability zone whenperforming lysozyme crystallization under oscillatory flowmixing (Figure 7). For instance, for a lysozyme concentrationof 15 mg·mL−1, crystals were observed at Si = 5.4 withoscillatory flow mixing, while under quiescent conditionsappearance of crystals is only expected for Si values superioror equal to 6.3 (metastability data). Under agitation, collisionbetween protein molecules is increased, increasing thusnucleation probability. As a result, metastability region isreduced leading to the occurrence of nucleation at lowersupersaturation levels. Therefore, crystallization conditions thatnormally do not produce crystals may become successful usingoscillatory flow mixing. This could be particularly interesting forproteins with a limited range of crystallization conditions, sincethe probability of crystals appearance can be increased underoscillatory flow mixing.
Figure 6. Linearized metastability curve for lysozyme crystallization carried out in the meso-OFR at 20 °C and pH 4.7 and under agitation conditionsof f = 1.83 Hz and x0 = 4 mm. Solubility and metastability curves were obtained by curve fitting from data reported in the literature.39−41
Table 1. Values of A and B Constants from the Linearizationof Both Experimental Metastability and TheoreticalSolubility and Metastability Curves of Lysozyme at 20 °Cand pH 4.7
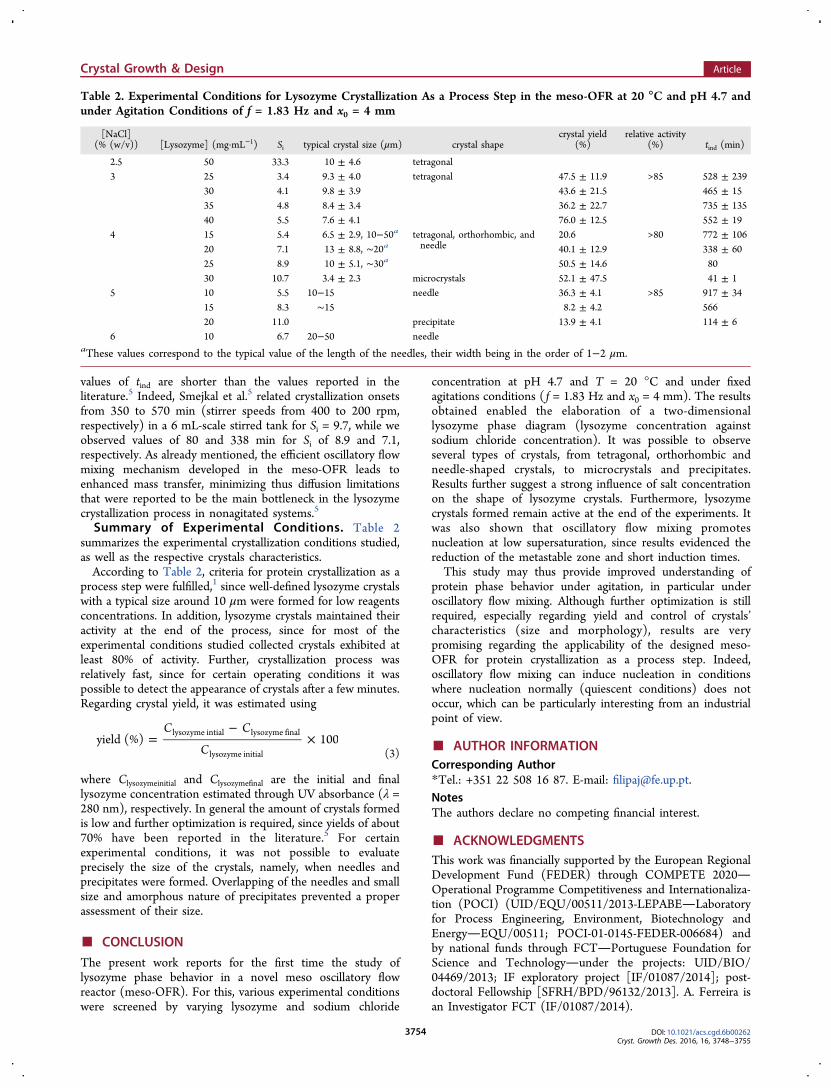
Induction Time. Measured induction time, tind, was plottedas a function of the initial supersaturation, Si, for theexperimental conditions studied (Figure 8).Nucleation is time-critical during protein crystallization
processes as it determines the onset of crystallization. Further,nucleation controls crystal product quality aspects such as thekind of solid state and crystal size distribution.37 In this study,crystallization onset was evaluated through tind measurement.According to Figure 8, typical values for tind are between 41 and900 min depending on the initial supersaturation Si. It is alsoimportant to refer that tetragonal crystals were essentiallyobtained at low Si, that is, at large tind, while needles andprecipitates were preferentially formed at high Si, that is, atshort tind. One can also verify that for sodium chlorideconcentrations of 4% and 5% (w/v), tind decreases as Siincreases, while no direct relationship between Si and tind wasevidenced for a sodium chloride concentration of 3% (w/v). Itis important to mention that the value of the induction timedepends strongly on the methodology employed to detect the
formation of new nuclei. In this study, measurement of theinduction time is based on the detection of an abrupt increasein the turbidity of the crystallization solution, thereby aconsiderable number of crystals have to be formed to detect asignificant increase in the turbidity of the solution. For thehighest sodium chloride concentrations, experiments werecharacterized by a strong nucleation giving rise to a highnumber of crystals in solution, and in turn an importantincrease in the turbidity of the solution. In contrast, lowersodium chloride concentration experiments did not lead to anoteworthy change in the turbidity of the solution, in particularwhen only tetragonal crystals were observed. For those cases,crystallization solutions kept relatively clear throughout theexperiment despite the presence of crystals in solution. Thispartly explains the large variation in the induction time values(error bars), which can also be explained by the stochasticnature of nucleation and the low probability that nuclei form atlow supersaturations. From Figure 8, one can verify that for thesame sodium chloride concentrations (4% (w/v)) and lower Si,
Figure 7. Lysozyme phase diagram in the meso-OFR at pH 4.7 and 20 °C under agitation conditions of f = 1.83 Hz and x0 = 4 mm.
Figure 8. Induction time tind as a function of the initial supersaturation Si for different sodium chloride concentrations: 3% (w/v), 4% (w/v), and 5%(w/v). The error bars are standard deviations from at least three independent experiments. Smejkal et al.5 data was obtained in a stirred tank reactorof 6 mL for different stirrer speeds from 200 to 400 rpm with sodium chloride concentration of 4% (w/v) and lysozyme concentration of 50 mg·mL−1.
values of tind are shorter than the values reported in theliterature.5 Indeed, Smejkal et al.5 related crystallization onsetsfrom 350 to 570 min (stirrer speeds from 400 to 200 rpm,respectively) in a 6 mL-scale stirred tank for Si = 9.7, while weobserved values of 80 and 338 min for Si of 8.9 and 7.1,respectively. As already mentioned, the efficient oscillatory flowmixing mechanism developed in the meso-OFR leads toenhanced mass transfer, minimizing thus diffusion limitationsthat were reported to be the main bottleneck in the lysozymecrystallization process in nonagitated systems.5
Summary of Experimental Conditions. Table 2summarizes the experimental crystallization conditions studied,as well as the respective crystals characteristics.According to Table 2, criteria for protein crystallization as a
process step were fulfilled,1 since well-defined lysozyme crystalswith a typical size around 10 μm were formed for low reagentsconcentrations. In addition, lysozyme crystals maintained theiractivity at the end of the process, since for most of theexperimental conditions studied collected crystals exhibited atleast 80% of activity. Further, crystallization process wasrelatively fast, since for certain operating conditions it waspossible to detect the appearance of crystals after a few minutes.Regarding crystal yield, it was estimated using
=−
×C C
Cyield (%) 100lysozyme intial lysozyme final
lysozyme initial (3)
where Clysozymeinitial and Clysozymefinal are the initial and finallysozyme concentration estimated through UV absorbance (λ =280 nm), respectively. In general the amount of crystals formedis low and further optimization is required, since yields of about70% have been reported in the literature.5 For certainexperimental conditions, it was not possible to evaluateprecisely the size of the crystals, namely, when needles andprecipitates were formed. Overlapping of the needles and smallsize and amorphous nature of precipitates prevented a properassessment of their size.
■ CONCLUSION
The present work reports for the first time the study oflysozyme phase behavior in a novel meso oscillatory flowreactor (meso-OFR). For this, various experimental conditionswere screened by varying lysozyme and sodium chloride
concentration at pH 4.7 and T = 20 °C and under fixedagitations conditions ( f = 1.83 Hz and x0 = 4 mm). The resultsobtained enabled the elaboration of a two-dimensionallysozyme phase diagram (lysozyme concentration againstsodium chloride concentration). It was possible to observeseveral types of crystals, from tetragonal, orthorhombic andneedle-shaped crystals, to microcrystals and precipitates.Results further suggest a strong influence of salt concentrationon the shape of lysozyme crystals. Furthermore, lysozymecrystals formed remain active at the end of the experiments. Itwas also shown that oscillatory flow mixing promotesnucleation at low supersaturation, since results evidenced thereduction of the metastable zone and short induction times.This study may thus provide improved understanding of
protein phase behavior under agitation, in particular underoscillatory flow mixing. Although further optimization is stillrequired, especially regarding yield and control of crystals’characteristics (size and morphology), results are verypromising regarding the applicability of the designed meso-OFR for protein crystallization as a process step. Indeed,oscillatory flow mixing can induce nucleation in conditionswhere nucleation normally (quiescent conditions) does notoccur, which can be particularly interesting from an industrialpoint of view.
■ ACKNOWLEDGMENTSThis work was financially supported by the European RegionalDevelopment Fund (FEDER) through COMPETE 2020Operational Programme Competitiveness and Internationaliza-tion (POCI) (UID/EQU/00511/2013-LEPABELaboratoryfor Process Engineering, Environment, Biotechnology andEnergyEQU/00511; POCI-01-0145-FEDER-006684) andby national funds through FCTPortuguese Foundation forScience and Technologyunder the projects: UID/BIO/04469/2013; IF exploratory project [IF/01087/2014]; post-doctoral Fellowship [SFRH/BPD/96132/2013]. A. Ferreira isan Investigator FCT (IF/01087/2014).
Table 2. Experimental Conditions for Lysozyme Crystallization As a Process Step in the meso-OFR at 20 °C and pH 4.7 andunder Agitation Conditions of f = 1.83 Hz and x0 = 4 mm
■ REFERENCES(1) Etzel, M. R. In Process Scale Bioseparations for theBiopharmaceutical Industry; Taylor & Francis Group, LLC, 2007; pp159−178.(2) Lee, E. K.; Kim, W. Protein Crystallization for Large-ScaleBioseparation; Marcel Dekker, 2003.(3) McPherson, A.; Gavira, J. a. Acta Crystallogr., Sect. F: Struct. Biol.Commun. 2014, 70, 2−20.(4) Schmidt, S.; Havekost, D.; Kaiser, K.; Kauling, J.; Henzler, H.-J.Eng. Life Sci. 2005, 5, 273−276.(5) Smejkal, B.; Helk, B.; Rondeau, J.-M.; Anton, S.; Wilke, A.;Scheyerer, P.; Fries, J.; Hekmat, D.; Weuster-Botz, D. Biotechnol.Bioeng. 2013, 110, 1956−1963.(6) Thommes, J.; Etzel, M. Biotechnol. Prog. 2007, 23, 42−45.(7) Neugebauer, P.; Khinast, J. G. Cryst. Growth Des. 2015, 15,1089−1095.(8) Shenoy, B.; Wang, Y.; Shan, W.; Margolin, A. L. Biotechnol.Bioeng. 2001, 73, 358−369.(9) Smejkal, B.; Agrawal, N. J.; Helk, B.; Schulz, H.; Giffard, M.;Mechelke, M.; Ortner, F.; Heckmeier, P.; Trout, B. L.; Hekmat, D.Biotechnol. Bioeng. 2013, 110, 2452−2461.(10) Jacobsen, C.; Garside, J.; Hoare, M. Biotechnol. Bioeng. 1998, 57,667−675.(11) Huettmann, H.; Zich, S.; Berkemeyer, M.; Buchinger, W.;Jungbauer, A. Chem. Eng. Sci. 2015, 126, 341−348.(12) Hekmat, D.; Hebel, D.; Schmid, H.; Weuster-Botz, D. ProcessBiochem. 2007, 42, 1649−1654.(13) Anderson, M. J.; Hansen, C. L.; Quake, S. R. Proc. Natl. Acad.Sci. U. S. A. 2006, 103, 16746−16751.(14) Asherie, N. Methods 2004, 34, 266−272.(15) Hebel, D.; Huber, S.; Stanislawski, B.; Hekmat, D. J. Biotechnol.2013, 166, 206−211.(16) Parambil, J. V.; Schaepertoens, M.; Williams, D. R.; Heng, J. Y.Y. Cryst. Growth Des. 2011, 11, 4353−4359.(17) Judge, R. A.; Johns, M. R.; White, E. T. Biotechnol. Bioeng. 1995,48, 316−323.(18) Yaoi, M.; Adachi, H.; Takano, K.; Matsumura, H.; Inoue, T.;Mori, Y.; Sasaki, T. Jpn. J. Appl. Phys. 2004, 43, 1318.(19) Murai, R.; Yoshikawa, H. Y.; Kawahara, H.; Maki, S.; Sugiyama,S.; Kitatani, T.; Adachi, H.; Takano, K.; Matsumura, H.; Murakami, S.;Inoue, T.; Sasaki, T.; Mori, Y. J. Cryst. Growth 2008, 310, 2168−2172.(20) Lu, Q.-Q.; Yin, D. C.; Liu, Y. M.; Wang, X. K.; Yang, P. F.; Liu,Z. T.; Shang, P. J. Appl. Crystallogr. 2010, 43, 473−482.(21) Vekilov, P. G.; Rosenberger, F. J. Cryst. Growth 1998, 186, 251−261.(22) Pusey, M.; Witherow, W.; Naumann, R. J. Cryst. Growth 1988,90, 105−111.(23) Harrison, R.; Todd, P.; Rudge, S.; Petrides, D. BioseparationScience and Engineering; Oxford University Press: New York, 2015.(24) Carbone, M. N.; Etzel, M. R. Biotechnol. Bioeng. 2006, 93, 1221−1224.(25) Lorber, B.; Skouri, M.; Munch, J.-P.; Giege, R. J. Cryst. Growth1993, 128, 1203−1211.(26) Judge, R. A.; Forsythe, E. L.; Pusey, M. L. Biotechnol. Bioeng.1998, 59, 776−785.(27) Takakura, T.; Ito, T.; Yagi, S.; Notsu, Y.; Itakura, T.; Nakamura,T.; Inagaki, K.; Esaki, N.; Hoffman, R. M.; Takimoto, A. Appl.Microbiol. Biotechnol. 2006, 70, 183−192.(28) Lee, T.; Vaghjiani, J.; Lye, G.; Turner, M. Enzyme Microb.Technol. 2000, 26, 582−592.(29) Giffard, M.; Ferte, N.; Ragot, F.; El Hajji, M.; Castro, B.;Bonnete, F. PLoS One 2011, 6, e19013.(30) Zang, Y.; Kammerer, B.; Eisenkolb, M.; Lohr, K.; Kiefer, H.PLoS One 2011, 6, e25282.(31) Trilisky, E.; Gillespie, R.; Osslund, T. D.; Vunnum, S. Biotechnol.Prog. 2011, 27, 1054−1067.(32) Ferreira, A.; Rocha, F.; Teixeira, J. A.; Vicente, A. Apparatus formixing improvement based on oscillatory flow reactors provided withsmooth periodic constrictions. Int. Patent WO/2015/056156, 2014.
(33) Harvey, A.; Mackley, M. R.; Reis, N.; Teixeira, J. A.; Vicente, A.A. In Proceedings of the 30th Conference SSCHE, Tatranske Matliare(SK), 26−30 May 2003; pp 26−30.(34) Ferreira, A.; Teixeira, J. A.; Rocha, F. Chem. Eng. J. 2015, 262,499−508.(35) Castro, F.; Ferreira, A.; Rocha, F.; Vicente, A.; Teixeira, J. A.AIChE J. 2013, 59, 4483−4493.(36) Castro, F.; Ferreira, A.; Rocha, F.; Vicente, A.; Teixeira, J. A. Ind.Eng. Chem. Res. 2013, 52, 9816−9821.(37) Jiang, S.; Ter Horst, J. H. Cryst. Growth Des. 2011, 11, 256−261.(38) Di Profio, G.; Curcio, E.; Cassetta, A.; Lamba, D.; Drioli, E. J.Cryst. Growth 2003, 257, 359−369.(39) Forsythe, E. L.; Judge, R. a.; Pusey, M. L. J. Chem. Eng. Data1999, 44, 637−640.(40) Martins, P. M.; Rocha, F.; Damas, A. M. PLoS One 2008, 3,e1998.(41) Crespo, R.; Martins, P. M.; Gales, L.; Rocha, F.; Damas, A. M. J.Appl. Crystallogr. 2010, 43, 1419−1425.(42) Bhamidi, V.; Skrzypczak-Jankun, E.; Schall, C. A. J. Cryst. Growth2001, 232, 77−85.(43) Tait, S.; White, E. T.; Litster, J. D. Cryst. Growth Des. 2009, 9,2198−2206.(44) McPherson, A. Crystallization of Biological Macromolecules; ColdSpring Harbor: New York, 1999.(45) Kusters, K. A.; Wijers, J. G.; Thoenes, D. Chem. Eng. Sci. 1997,52, 107−121.(46) Thomas, C. R.; Geer, D. Biotechnol. Lett. 2011, 33, 443−456.(47) Bee, J. S.; Stevenson, J. L.; Mehta, B.; Svitel, J.; Pollastrini, J.;Platz, R.; Freund, E.; Carpenter, J. F.; Randolph, T. W. Biotechnol.Bioeng. 2009, 103, 936−943.(48) Sandwick, R. K.; Schray, K. J. J. Colloid Interface Sci. 1987, 115,130−138.(49) Caussette, M.; Gaunand, A.; Planche, H.; Colombie, S.; Monsan,P.; Lindet, B. Enzyme Microb. Technol. 1999, 24, 412−418.(50) Caussette, M.; Gaunand, A.; Planche, H.; Monsan, P.; Lindet, B.Ann. N. Y. Acad. Sci. 1998, 864, 228−233.(51) Colombie, S.; Gaunand, A.; Lindet, B. Enzyme Microb. Technol.2001, 28, 820−826.(52) Postel, C.; Abillon, O.; Desbat, B. J. Colloid Interface Sci. 2003,266, 74−81.
![Protein Crystallography - instruct.uwo.ca · Protein Crystallization • Principles of protein solubility [PPt] [protein] Undersaturated solubility Supersaturated Precipitation Nucleation](https://static.documents.pub/doc/80x56/5e18b58cfac19c6065246f42/protein-crystallography-protein-crystallization-a-principles-of-protein-solubility.jpg)


