Protein In-Cell NMR in Escherichia coli Christopher O. Barnes A thesis submitted to the faculty of the University of North Carolina at Chapel Hill in partial fulfillment of the requirements for the degree of Masters of Arts in the Department of Chemistry. Chapel Hill 2010 Approved by Advisor: Professor Gary J. Pielak, Ph.D. Reader: Professor Todd L. Austell, Ph.D. Reader: Professor Matthew R. Redinbo, Ph.D.
Transcript
Protein In-Cell NMR in Escherichia coli
Christopher O. Barnes
A thesis submitted to the faculty of the University of North Carolina at Chapel Hill in
partial fulfillment of the requirements for the degree of Masters of Arts in the Department
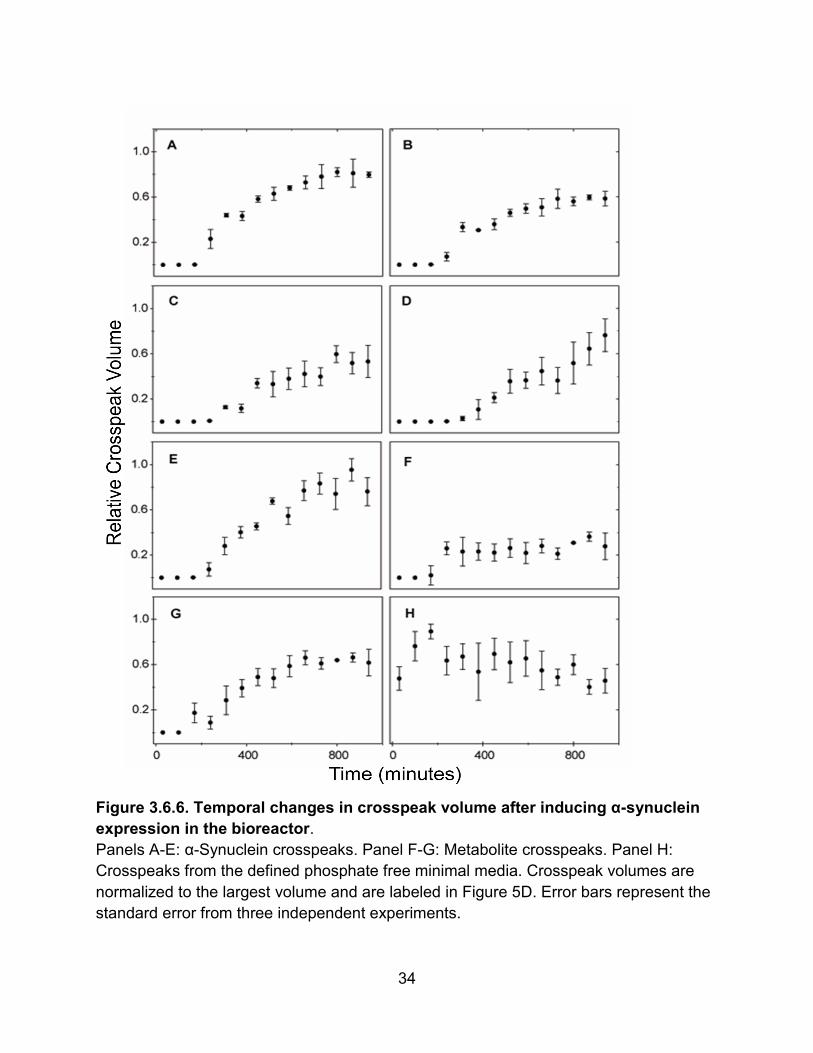
Supernatant samples for NMR experiments comprised 90:10 (v:v) mixture of
supernatant: D2O in a standard 5 mm NMR tube. 1H-15N HMQC spectra were acquired
as described above. Cell lysate samples for NMR experiments comprised 90:10 (v:v)
mixture of cell lysate: D2O in a standard 5 mm NMR tube. 1H-15N HMQC spectra were
acquired as described above.
2.3 Results and Discussion
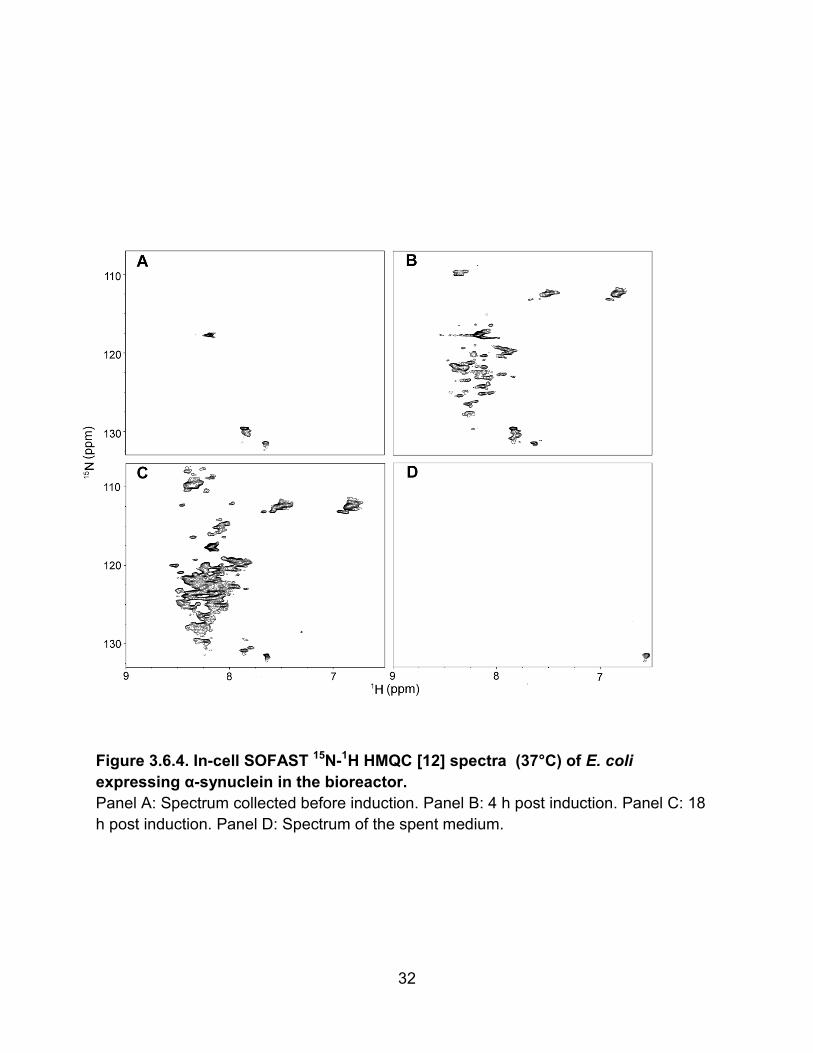
1H-15N SOFAST HMQC spectra of E. coli expressing the periplasmic protein
HdeA were obtained 3 h after inducing with IPTG (Fig 2.5.1). Protein resonances were
visible in the cell slurry (Fig 2.5.1A). To check for leakage, the slurry was centrifuged
and a spectrum of the supernatant acquired. The spectrum of the slurry showed a
strong protein signal (Fig 1B), similar to that observed in the lysate (Fig 1C). The
observation of HdeA crosspeaks in the supernatant indicates leakage. The approximate
periplasmic protein concentration after 3 h of expression is shown in Table 2.6.1.
To assess if expression levels contribute to leakage, the spectrum of the cell
slurry that had been allowed to express HdeA for only 1.5 h was acquired (Fig 2.5.2).
Crosspeaks characteristic of HdeA are not observed (Fig 2.5.2A,B) but metabolite
signals are observed [36]. In comparison, the lysate contains resonances typical of
9
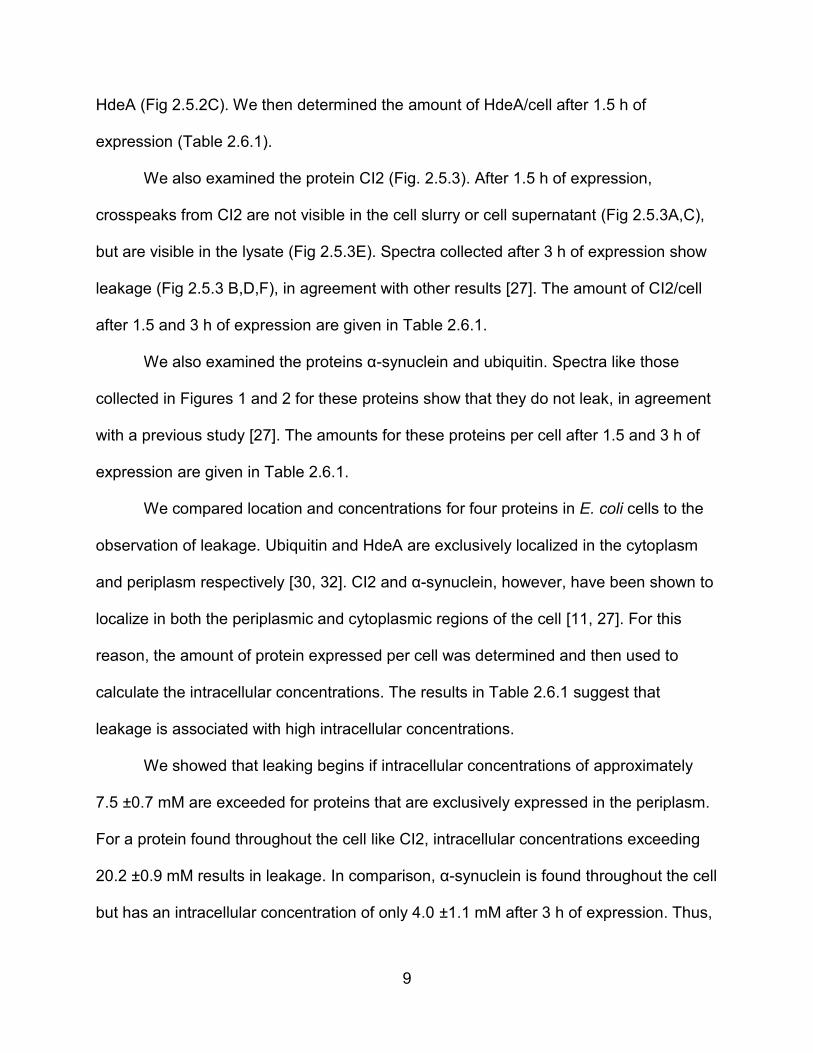
HdeA (Fig 2.5.2C). We then determined the amount of HdeA/cell after 1.5 h of
expression (Table 2.6.1).
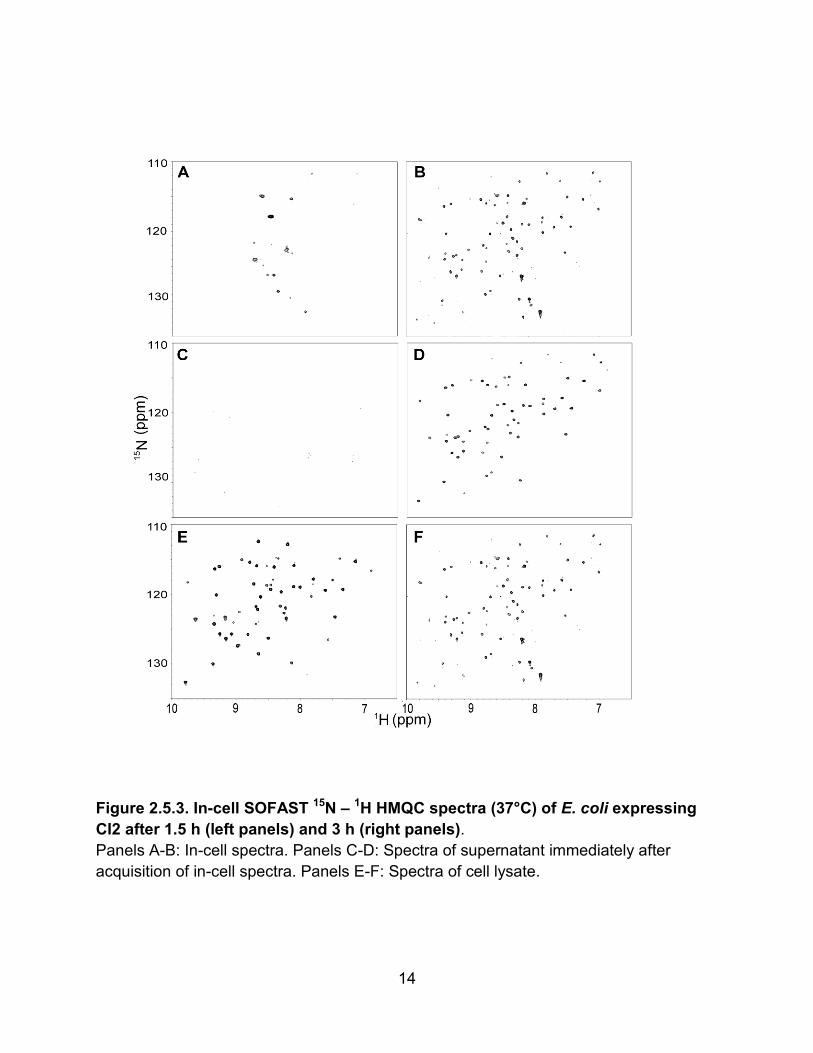
We also examined the protein CI2 (Fig. 2.5.3). After 1.5 h of expression,
crosspeaks from CI2 are not visible in the cell slurry or cell supernatant (Fig 2.5.3A,C),
but are visible in the lysate (Fig 2.5.3E). Spectra collected after 3 h of expression show
leakage (Fig 2.5.3 B,D,F), in agreement with other results [27]. The amount of CI2/cell
after 1.5 and 3 h of expression are given in Table 2.6.1.
We also examined the proteins α-synuclein and ubiquitin. Spectra like those
collected in Figures 1 and 2 for these proteins show that they do not leak, in agreement
with a previous study [27]. The amounts for these proteins per cell after 1.5 and 3 h of
expression are given in Table 2.6.1.
We compared location and concentrations for four proteins in E. coli cells to the
observation of leakage. Ubiquitin and HdeA are exclusively localized in the cytoplasm
and periplasm respectively [30, 32]. CI2 and α-synuclein, however, have been shown to
localize in both the periplasmic and cytoplasmic regions of the cell [11, 27]. For this
reason, the amount of protein expressed per cell was determined and then used to
calculate the intracellular concentrations. The results in Table 2.6.1 suggest that
leakage is associated with high intracellular concentrations.
We showed that leaking begins if intracellular concentrations of approximately
7.5 ±0.7 mM are exceeded for proteins that are exclusively expressed in the periplasm.
For a protein found throughout the cell like CI2, intracellular concentrations exceeding
20.2 ±0.9 mM results in leakage. In comparison, α-synuclein is found throughout the cell
but has an intracellular concentration of only 4.0 ±1.1 mM after 3 h of expression. Thus,
10
leakage does not occur for proteins expressed at lower levels. Our conclusion is
supported by previous results on CI2, which showed this protein does not leak when
expressed using the less efficient trifluoromethyl-L-phenylalanine expression system
[27].
Assuming that expression of other proteins is decreased to maintain the 400 g/L
cellular concentration while our protein is overexpressed, we were able to determine the
percentage of our protein’s mass to the mass of total cellular protein. We calculated that
20-25% of the macromolecular mass in the cell is our protein before leaking begins. For
the protein CI2, leaking is observed at the intracellular concentrations of 20.2 ±1.0 mM,
which equates to approximately 37%.
Although highly expressed proteins leak, the mechanism is unknown. Li et al
estimated that the total amount of CI2 found in the supernatant of the cell slurry is
approximately 5-10% [27]. Previous in-cell NMR experiments performed in E. coli show
that approximately 90-95% of the cells remain viable [37]. These data suggest that the
CI2 found in the supernatant is the product of cell lysis. CI2, normally a cytoplasmic
protein, is also found within the periplasmic space after overexpression [27]. This
observation suggests that passive exocytosis may also contribute to protein leakage.
2.4 Conclusion
In summary, we have shown that overexpression can lead to leakage if the
intracellular concentration of the protein exceeds ~10 mM. In-cell NMR experiments in
E. coli should consider this expression limit so that valid data are obtained within the
cell. For globular proteins, the leaked protein contributes to 100% of the 1H -15N NMR
11
spectrum because the intracellular environment broadens 1H -15N crosspeaks beyond
detection [27]. Future in-cell NMR experiments in E.coli cells should consider
intracellular concentrations low enough to obtain valid in-cell data.
12
2.5 Figures
Figure 2.3.1. In-cell SOFAST 15N – 1H HMQC spectra (37°C) of E. coli expressing HdeA after 1.5 h. Panel A: In-cell spectrum. Panel B: Spectrum of supernatant acquired immediately after acquisition of in-cell spectrum. Panel C: Spectrum of cell lysate.
13
Figure 2.2.3. In-cell SOFAST 15N – 1H HMQC spectra (37°C) of E. coli expressing
HdeA after 1.5 h.
The panels are described as in the legend to Figure 2.1.
14
Figure 2.5.3. In-cell SOFAST 15N – 1H HMQC spectra (37°C) of E. coli expressing
CI2 after 1.5 h (left panels) and 3 h (right panels).
Panels A-B: In-cell spectra. Panels C-D: Spectra of supernatant immediately after
acquisition of in-cell spectra. Panels E-F: Spectra of cell lysate.
15
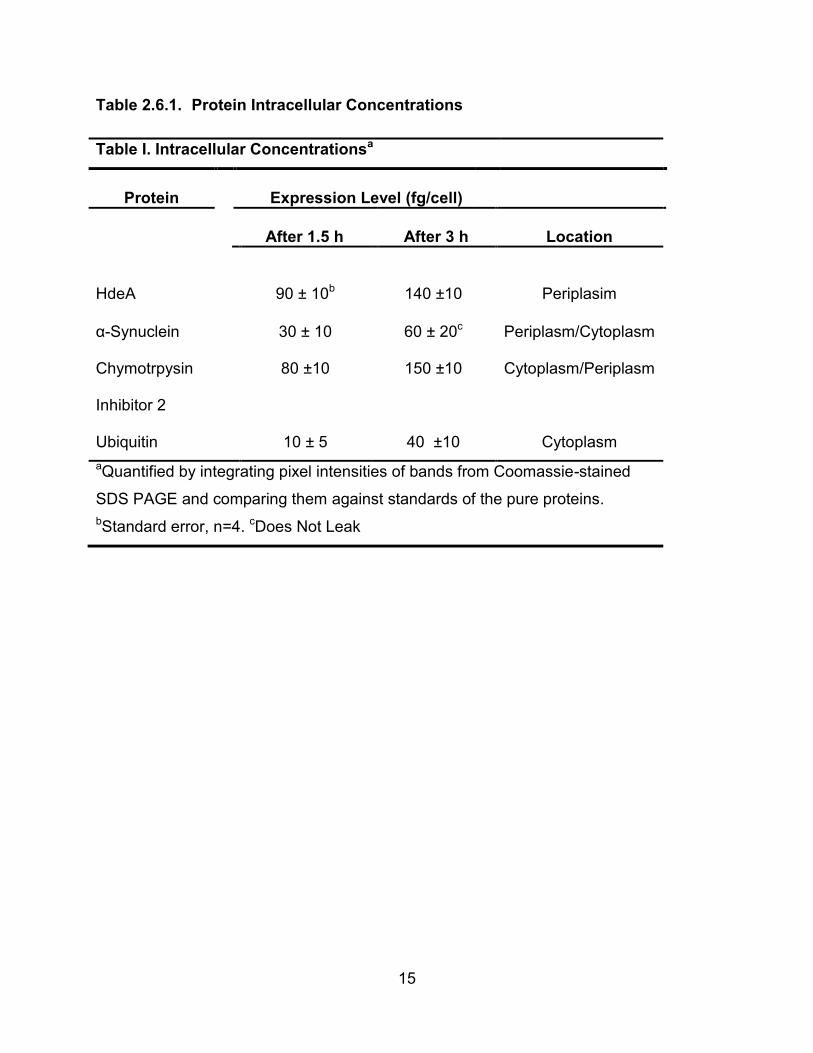
Table 2.6.1. Protein Intracellular Concentrations
Table I. Intracellular Concentrationsa
Protein
Expression Level (fg/cell)
After 1.5 h
After 3 h
Location
HdeA
90 ± 10b
140 ±10
Periplasim
α-Synuclein 30 ± 10 60 ± 20c Periplasm/Cytoplasm
Chymotrpysin
Inhibitor 2
80 ±10 150 ±10 Cytoplasm/Periplasm
Ubiquitin 10 ± 5 40 ±10 Cytoplasm
aQuantified by integrating pixel intensities of bands from Coomassie-stained
SDS PAGE and comparing them against standards of the pure proteins.
bStandard error, n=4. cDoes Not Leak
3 A Bioreactor for in-cell protein NMR
3.1 Introduction
Most biophysical experiments on investigate proteins are conducted in dilute
solution. Most proteins, however, serve their physiologically relevant function in cells,
which have a complex crowded environment that affect several protein properties
compared to dilute solution [38-41]. For this reason, there is an increasing interest in
studying proteins inside living cells. Nuclear magnetic resonance spectroscopy (NMR)
has become a popular tool for experiments on living cells because it provides atomic-
level information about cellular components and is nondestructive [42].
A disadvantage of NMR spectroscopy is its low sensitivity. Selective isotopic
enrichment or labeling of the targeted species with an NMR active nucleus (e.g., 15N,
13C or 19F) is one way around this problem. Serber et al. suggest that the minimum
concentration of the protein under study should be at least ~150 µM for 15N enrichment
or ~50 µM for 13C enrichment [21]. Therefore, the target protein must be overexpressed
or introduced into the cell by other means (e.g., micro injection, cell penetrating peptides
[42]). To increase sensitivity further, high cell densities (109-1011 cells/mL) are used, and
the data are time averaged.
Current experimental setups for protein in cell NMR have several drawbacks.
First, the lack of aeration and the high cell density create an anaerobic environment.
Second, metabolites and waste products accumulate. These characteristics can
decrease cell viability, limiting the cell types that can be used, and make it difficult to
17
monitor temporal changes. Overcoming these challenges requires an NMR compatible
device that maintains cell viability.
Devices with these characteristics have been developed. One type is an in-
magnet bioreactor that enables growth of microorganisms to a high density [43, 44].
Another type is a perfusion system that flows media down through immobilized cells
[45, 46]. These devices tend to be complex and difficult to fabricate. Furthermore, they
are designed for studying metabolism.
Here, we describe a circulating encapsulated cells (CEC) bioreactor and
accessories for in-cell protein NMR. The instrument comprises parts that are
commercially available or easily fabricated. The expression of the natively disordered
human protein α-synuclein in Escherichia coli is used to demonstrate its capabilities. α-
Synuclein is a 14.5 kDa protein implicated in the pathogenesis of Parkinson’s disease
[47]. The expression of the plasmid borne α-synuclein gene is controlled by a lactose
inducible, phage T7 promoter. We investigate the bioreactor’s ability to maintain cell
viability and measure the accumulation of α-synuclein with time.
3.2 Materials and Methods
3.2.1 Purification of wild type α-synuclein for in vitro experiments
The pT7-7 plasmid containing the α-synuclein gene was transformed into E. coli
Bl-21 (DE3) Gold cells (Strategene). Plasmid containing cells were selected with 0.1
mg/mL ampicillin. A 5 mL overnight culture was grown from a single colony and used to
inoculate a 50 mL culture of Spectra 9 15N-enriched media (Cambridge Isotope
18
Laboratories) at 37°C in a rotary shaker (225 rpm, New Burnswick Scientific, Model I-
26). The saturated overnight culture was used to inoculate 1 L of M9 minimal media [48]
containing 1 g/L 15NH4Cl. After reaching an absorbance at 600 nm (A600) of 0.8-1.0, the
culture was induced with isopropyl β-D-thiogalactopyranoside (IPTG) to a final
concentration of 1 mM. The culture was placed in the rotary shaker (225 rpm) at 37°C.
After 5 h the cultures were pelleted using a swinging bucket centrifuge (Sorvall
RC-3B, H6000A rotor) at 1600g for 30 min at 4°C and the pellet was stored at -20°C.
The pellet was resuspended in 30 mL of lysis buffer (50 mM Tris, 150 mM NaCl, 1 mM
phenylmethanesulfonyl fluoride, 0.4 g/L lysozyme, pH 8.0). RNase and DNase were
added to a final concentration of 0.02 g/L each. The samples were stirred (250 rpm) at
4°C for 20 min. The lysate was sonicated (Branson Ultrasonics, Fischer Scientific)
continuously for 5 min, boiled in a water bath for 20 min, and then centrifuged at
13,000g for 30 min at 4°C (SS-34 rotor). The supernatant was subjected to streptomycin
sulfate precipitation (10 g/L) and centrifuged for 30 min at 4°C. The supernatant was
subjected to (NH4)2SO4 precipitation (361 g/L) and centrifuged again for 30 min at 4°C.
The pellet was resuspended in 20 mM sodium phosphate buffer (pH 7.4) and dialyzed
(Thermo Scientific, 3500 MWCO) overnight, with stirring at 4°C, against the same
buffer.
The protein was further purified by anion exchange chromatography
(GEHealtcare, Q Sepharose HiPrep 16/10 column) with a 0-1 M linear gradient of NaCl
in 20 mM phosphate buffer (pH 7.4). Fractions were subjected to SDS-PAGE on an
18% gel with Commassie blilliant blue staining. Fractions containing α-synuclein were
pooled and dialyzed against water overnight, with stirring, at 4°C. The protein was
19
concentrated in a YM-3 Centricon filter (Millipore, MWCO 3500) using centrifugation at
1000g (SS-34 rotor) for 1 h at 4°C. The purity of the protein was determined by SDS-
PAGE with Coomassie staining. The pure α-synuclein was lyophilized (Labconco) and
stored at -20°C. The yield was 35-60 mg of pure α-synuclein per liter of saturated cell
culture.
3.2.2 Cultivation of E. coli for in-cell NMR experiments
A 5 mL overnight culture was grown from a single colony and used to inoculate a
500-mL Erlenmeyer flask containing 50 mL of isotopically enriched media, as described
above. After the culture reached an A600 of 0.8-1.0, the cells were induced with IPTG to
a final concentration of 1 mM. Expression was allowed to proceed for 4 h. The cells
were gently harvested by using the swinging bucket centrifuge for 30 min at 4°C. The
pellet was resuspended in 1 mL of spent media.
3.2.3 Cultivation and encapsulation of E. coli for NMR bioreactor
experiments
A 5 mL overnight culture was grown from a single colony as described above and
used to inoculate 150 mL of Luria Broth (10 mg/mL Tryptone, 5 mg/mL yeast extract, 10
mg/mL NaCl) at 37°C. The culture was grown in the rotary shaker (225 rpm) to an A600
of 0.8-1.0. The cells were gently harvested in the swinging bucket centrifuge for 20 min
at 4°C and resuspended in 1 mL of spent media. The resuspended cells were mixed
with a 2% w/v alginate (Sigma) solution in 20 mM phosphate, 150 mM NaCl (pH 7.4) to
give a final concentration of 1% alginate (50:50 mixture alginate:cell slurry).
20
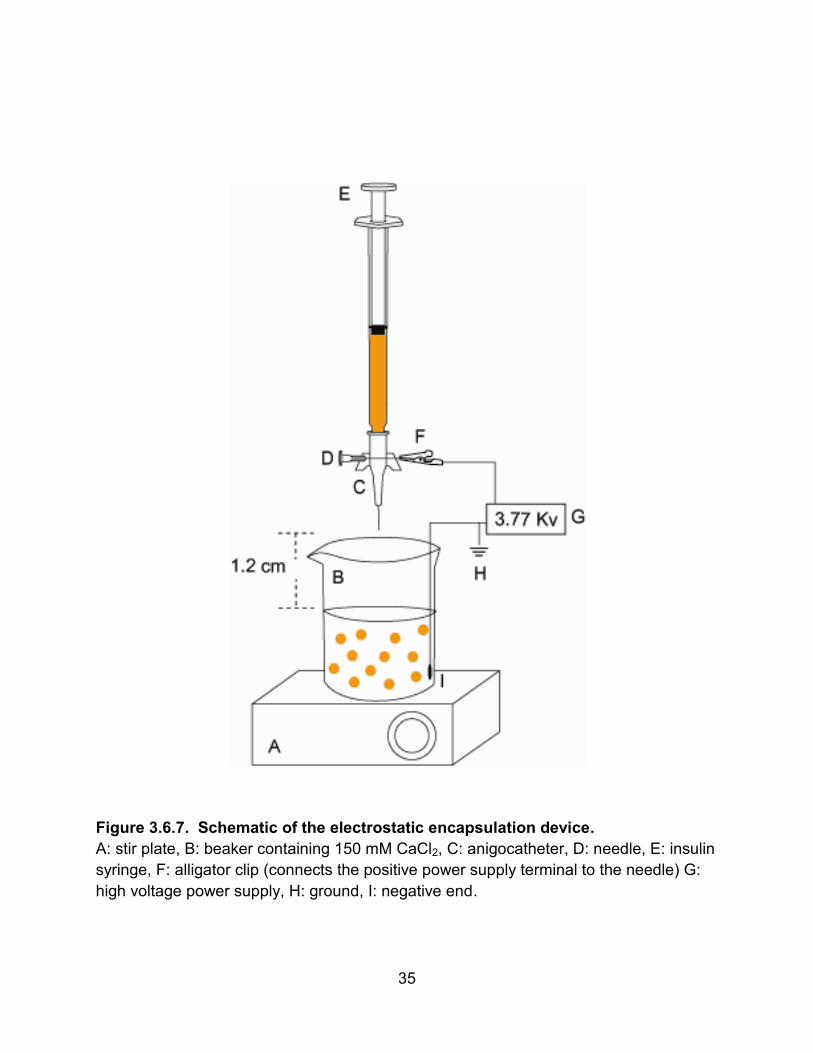
The electrostatic encapsulation device (Fig. 3.5.7) comprised a 1 mL insulin
syringe (BD), a 24 gauge winged anigocatheter (0.7 x 19 mm tip, Braun), a 23 gauge
needle (BD), a syringe pump (Braintree Scientific 8000), and an adjustable high voltage
power supply (Spellman SL10). The insulin syringe, equipped with the needle, was
loaded with the cell/alginate mixture. The other needle, which was inserted horizontally
through the center of the angiocatheter, was connected to the positive pole of the power
supply. The negative pole of the power supply was placed into the 150 mM CaCl2
solution. The syringe containing the mixture was inserted into the top of the
angiocatheter and placed onto the pump. The syringe pump was set to a rate of 0.714
mL/min, the power supply voltage to 3.35 kV, and the stir-plate to approximately 300
rpm. The tip of the angiocatheter was centered 1.2 cm above a 250 mL beaker
containing 150 mL of 150 mM CaCl2. The mixture was forced through the tip of the
angiocatheter and streamed into the CaCl2 solution. The Ca2+ polymerizes the alginate
which, in turn, forms encapsulated beads containing the cells. The encapsulated cells
were retrieved with suction and placed in a 15 mL Falcon tube containing 150 mM
CaCl2 solution for transport to the NMR spectrometer.
The CaCl2 solution was removed and the encapsulated cells were washed with
the phosphate-free minimal medium. The phosphate-free minimal medium consisted of
100 mM HEPES (pH 7.4), 150 mM CaCl2, phosphate-free M9 salts [1mg/mL 15NH4Cl, 2
mM MgCl2, 1 µg/mL thiamine, 2 % v:v 10x 15N-enriched Bioexpress 1000 media
(Cambridge Isotope Laboratories)] and 0.1 mg/mL ampicillin. After washing, the
encapsulated cells were placed inside the bioreactor, which was then placed into the
spectrometer. After acquiring the initial spectrum, lactose was added to a final
21
concentration of 1% w/v. The lactose acts as an inducer and the sole carbon source.
For each spectrum, the pump circulated medium through the system at a rate of 45
mL/min for 30 min. Five min were allotted for the encapsulated cells to settle into the
detection region of the bioreactor. As a control the procedure was repeated for E. coli
containing the pUC18 plasmid.
3.2.4 NMR
Data were acquired at the UNC Biomeolcular NMR facility on a Varian Inova 600
MHz NMR spectrometer. Data were processed and visualized with NMRpipe and
NMRviewJ, respectively [34, 35].
Samples for dilute solution spectra comprised a 90:10 (v:v, pH 7.4) mixture of
purified 200 µM α-synuclein solution: D2O in a standard 5 mm NMR tube. 1H-15N HSQC
spectra were acquired at 10oC [1] with a 5 mm Varian Triax triple resonance probe (1H
syringe, F: alligator clip (connects the positive power supply terminal to the needle) G:
high voltage power supply, H: ground, I: negative end.
36
References
1. Cayley, D.S., Guttman, H. J., and Record, M.T., Jr., Biophysical characterization of changes in amounts and activity of Escherichia coli cell and compartment water and turgor pressure in response to osmotic stress. Biophys. J., 2000. 78: p. 1748-1764.
2. Luby-Phelps, K., Cytoarchitecture and physical properties of cytoplasm: Volume,
3. Laurent, T.C., An early look at macromolecular crowding. Biophys. Chem., 1995.
57: p. 7-14. 4. Rohwer, J.M., Postma, P.W., Kholodenko, B.N., and Westerhoff, H.V.,
Implications of macromolecular crowding for signal transduction and metabolite channeling. Proc. Natl. Acad. Sci U.S.A., 1998. 95: p. 10547-10552.
5. Phillip, Y., Sherman, E., Haran, G., and Schreiber, G., Common crowding agents
have only a small effect on protein-protein interactions. Biophys. J., 2009. 97(3): p. 875-885.
6. Acerenza, L., and Grana, M., On the origins of a crowded cytoplasm. J. Mol.
Evol., 2006. 63: p. 583-590. 7. Elowitz, M.B., Surette, M.G., Wolf, P.E., Stock, J.B., and Leibler, S., Protein
mobility in the cytoplasm of Escherichia coli. J. Bacteriol., 1999. 181: p. 197-203. 8. Lavalette, D., Hink, M.A., Tourbez, M., Tetreau, C., and Visser, A.J., Proteins as
9. Li, C., Wang, Y., and Pielak, G.J., Translational and rotational diffusion of a small
globular protein under crowded conditions. J. Phys. Chem., 2009. 113: p. 13390-13392.
10. Mullineaux, C.W., Nenninger, A., Ray, N., and Robinson, C., Diffusion of green
fluorescent protein in three cell environments in Escherichia coli. J. Bacteriol., 2006. 188: p. 3442-3448.
11. Slade, K.M., Baker, R., Chua, M., Thompson, N.L., & Pielak, G.J., Effects of
Recombinant Protein Expression on Green Fluorescent Protein Diffusion in Escherichia coli. Biochemistry, 2009. 48: p. 5083-5089.
37
12. Dyson, J.H., and Wright, P.E., Insights into the structure and dynamics of unfolded proteins fom nuclear magnetic resonance. Adv. Protein Chem, 2002: p. 311-340.
13. Minton, A.P., Models for excluded volume interaction between an unfolded
protein and rigid macromolecular cosolutes: Macromolecular crowding and protein stability revisted. Biophys. J., 2005. 88: p. 971-985.
in living cells. Proc. Natl. Acad. Sci. U.S.A., 2002. 99: p. 12681-12684. 23. McNulty, B.C., Tripathy, A., Young, G.B., Charlton, L.C., Orans, J., & Pielak,
G.J., Temperature-induced reversible conformational change in the first 100 residues of alpha-synuclein. Protein Sci, 2006. 15: p. 602-608.
38
24. Pielak, G.J., Li, C., Miklos, A.C., Schlesinger, A.P., Slade, K.M., Wang, G., & Zigoneanu, I.G., Protein Nuclear Magnetic Resonance under Physiological Conditions. Biochemistry, 2009. 28: p. 226-234.
25. Inomata, K., Ohno, A., Tochio, H., Isogai, S., Tenno, T., Nakase, I., Takeuchi, T.,
Futaki, S., Ito, Y., Hiroaki, H., & Shirakawa, M. , High-resolution Multi-dimensional NMR Spectroscopy of Proteins in Human Cells. Nature, 2009. 458: p. 106-109.
26. Selenko, P., & Wagner, G., Looking into live cells with in-cell NMR spectroscopy.
J. Struct. Bio., 2007. 158(2): p. 244-253. 27. Li, C., Wang, Wang, Y., Creager-Allen, R., Lutz, E.A., Scronce, H., Slade, K.M.,
Ruf, R.A.S., Mehl, R.A., & Pielak, G.J., Protein 19F NMR in Escherichia coli. J. Am. Chem. Soc., 2009. 132: p. 321-327.
MacDonald, J.M., & Pielak, G.J., Differential dynamical effects of macromolecular crowding on an intrinsically disordered protein and a globular protein: implications for in-cell NMR spectroscopy. J. Am. Chem. Soc., 2008. 130: p. 6310-6311.
29. Pielak, G.J., Retraction: Protein dynamics in living cells. Biochemistry, 2007.
46(27): p. 8206. 30. Gajiwala, K.S., & Burley, S.K., HDEA, a periplasmic protein that supports acid
resistance in pathogeneic enteric bacteria. J. Mol. Biol., 2000. 295: p. 605-612. 31. Jackson, S.E., and Fersht, A.R., Folding of chymotrypsin inhibitor 2. 1. Evidence
for a two-state transition. Biochemistry, 1991. 30(43): p. 10428-35. 32. Hochstrasser, M., Origin and function of ubiquitin-like proteins. Nature, 2009.
458: p. 422-429. 33. Bainer, R., Park, H., & Cluzel, P., A High-throughput Capillary Assay for Bacterial
Chemotaxis. J. Microbiol. Methods, 2003. 55: p. 315-319. 34. Delaglio, F., et al., NMRPipe: A multidimensional spectral processing system
based on UNIX pipes. Journal of Biomolecular NMR, 1995. 6(3): p. 277-293. 35. Johnson, B.A. and R.A. Blevins, NMR View: A computer program for the
visualization and analysis of NMR data. Journal of Biomolecular NMR, 1994. 4(5): p. 603-614.
36. Bryant, J.E., Lecomte, J.T., Lee, A.L., Young, G.B., and Pielak, G.J., Protein
dynamics in living cells. Biochemistry, 2005. 44: p. 9275-9279.
39
37. Sharaf, N.G., Barnes, C.O., Charlton, L.M., Young, G.B., & Pielak, G.J., A Bioreactor for Protein In-Cell NMR. J. Mag. Res., 2010. 202(2): p. 140-146.
38. McNulty, B.C., et al., Temperature-induced reversible conformational change in
the first 100 residues of alpha-synuclein. Protein Science, 2006. 15(3): p. 602-608.
39. Charlton, L.M., et al., Residue-level Interrogation of macromolecular crowding
effects on protein stability. Journal of the American Chemical Society, 2008. 130(21): p. 6826-6830.
40. Ai, X., et al., 15N NMR spin relaxation dispersion study of the molecular crowding
effects on protein folding under native conditions. Journal of the American Chemical Society, 2006. 128(12): p. 3916-3917.
41. Homouz, D., et al., Crowded, cell-like environment induces shape changes in
aspherical protein. proceedings of the National Academy of Sciences of the United States of America, 2008. 105(33): p. 11754-11759.
42. Pielak, G.J., et al., Protein nuclear magnetic resonance under physiological
conditions. Biochemsitry, 2009. 48(2): p. 226-234. 43. Hartbrich, A., et al., Development and application of a membrane cyclone reactor
for in-vivo NMR spectroscopy with high microbial cell densities. Biotechnology and Bioengineering, 1996. 51(6): p. 624-635.
44. Majors, P.D., J.S. McLean, and J.C.M. Scholten, NMR bioreactor development
for live in-situ microbial functional analysis. Journal of Magnetic Resonance, 2008. 192(1): p. 159-166.
45. Dahan-Grobgeld, E., et al., Reversible induction of ATP synthesis by DNA
damage and repair in Escherichia coli. In-vivo NMR studies. Journal of Biological Chemistry, 1998. 273(46): p. 30232-30238.
46. Hesse, S.J.A., et al., Measurement of intracellular (compartmental) pH by 31P
NMR in Aspergillus niger. Journal of Biotechnology, 2000. 77(1): p. 5-15. 47. Lang, A.E. and A.M. Lozano, Parkinson's disease- first of two parts. The New
England Journal of Medicine, 1998. 339(15): p. 1044-1053. 48. Serber, Z., et al., Evaluation of parameters critical to observing proteins inside
living Escherichia coli by in-cell NMR spectroscopy. journal of the American Chemical Society, 2001. 123(37): p. 8895-8901.
40
49. Bodenhausen, G. and D.J. Ruben, Natural abundance nitrogen-15 NMR by enhanced heteronuclear spectroscopy. Chemical Physics Letters, 1980. 69(1): p. 185-189.
50. Kay, L., P. Keifer, and T. Saarinen, Pure absorption gradient enhanced
heteronuclear single quantum correlation spectroscopy with improved sensitivity. Journal of the American Chemical Society, 1992. 114(26): p. 10663-10665.
51. Schanda, P. and B. Brutscher, Very fast two-dimensional NMR spectroscopy for
real-time investigation of dynamic events in proteins on the time scale of seconds. Journal of the American Chemical Society, 2005. 127(22): p. 8014-8015.
52. Dulieu, C., D. Poncelet, and R.J. Neufeld, Encapsulation and immobiliation
techniques. In Cell encapsulation technology and therapeutics W.M. Kuthreiber, R.P. Lanza, and W.L. Chick, Editors. 1999, Birkhauser: Boston p. 3-17.
53. Li, C., et al., Differential dynamical effects of macromolecular crowding on an intrinsically disordered protein and a globular protein: implications for in-cell NMR spectroscopy. Journal of the American Chemical Society, 2008. 130(20): p. 6310-6311.
54. Slade, K.M., et al., Effects of Recombinant Protein Expression on Green
Fluorescent Protein Diffusion in Escherichia coli. Biochemistry, 2009. 48(23): p. 5083-5089.
55. Vieira, J. and J. Messing, The pUC plasmids, an M13mp7-derived system for
insertion mutagenesis and sequencing with synthetic universal primers. Gene, 1982. 19(3): p. 259-268.