ARTICLE Received 24 Aug 2013 | Accepted 14 Mar 2014 | Published 11 Apr 2014 Protein interaction network of alternatively spliced isoforms from brain links genetic risk factors for autism Roser Corominas 1, *, Xinping Yang 2,3, *, Guan Ning Lin 1, *, Shuli Kang 1, *, Yun Shen 2,3 , Lila Ghamsari 2,3,w , Martin Broly 2,3 , Maria Rodriguez 2,3 , Stanley Tam 2,3 , Shelly A. Trigg 2,3,w , Changyu Fan 2,3 , Song Yi 2,3 , Murat Tasan 4 , Irma Lemmens 5 , Xingyan Kuang 6 , Nan Zhao 6 , Dheeraj Malhotra 7 , Jacob J. Michaelson 7,w , Vladimir Vacic 8 , Michael A. Calderwood 2,3 , Frederick P. Roth 2,3,4 , Jan Tavernier 5 , Steve Horvath 9 , Kourosh Salehi-Ashtiani 2,3,w , Dmitry Korkin 6 , Jonathan Sebat 7 , David E. Hill 2,3 , Tong Hao 2,3 , Marc Vidal 2,3 & Lilia M. Iakoucheva 1 Increased risk for autism spectrum disorders (ASD) is attributed to hundreds of genetic loci. The convergence of ASD variants have been investigated using various approaches, including protein interactions extracted from the published literature. However, these datasets are frequently incomplete, carry biases and are limited to interactions of a single splicing isoform, which may not be expressed in the disease-relevant tissue. Here we introduce a new interactome mapping approach by experimentally identifying interactions between brain-expressed alternatively spliced variants of ASD risk factors. The Autism Spliceform Interaction Network reveals that almost half of the detected interactions and about 30% of the newly identified interacting partners represent contribution from splicing variants, emphasizing the importance of isoform networks. Isoform interactions greatly contribute to establishing direct physical connections between proteins from the de novo autism CNVs. Our findings demonstrate the critical role of spliceform networks for translating genetic knowledge into a better understanding of human diseases. DOI: 10.1038/ncomms4650 OPEN 1 Department of Psychiatry, University of California San Diego, La Jolla, California 92093, USA. 2 Center for Cancer Systems Biology (CCSB) and Department of Cancer Biology, Dana-Farber Cancer Institute, Boston, Massachusetts 02115, USA. 3 Department of Genetics, Harvard Medical School, Boston, Massachusetts 02115, USA. 4 Donnelly Centre and Departments of Molecular Genetics & Computer Science, University of Toronto, and Samuel Lunenfeld Research Institute, Mt. Sinai Hospital, Toronto, Ontario, Canada M5S 3E1. 5 Department of Medical Protein Research, VIB, and Department of Biochemistry, Faculty of Medicine and Health Sciences, Ghent University, Ghent B-9000, Belgium. 6 Department of Computer Science and Informatics Institute, University of Missouri, Columbia, Missouri 65203, USA. 7 Beyster Center for Genomics of Psychiatric Diseases and Department of Psychiatry, University of California San Diego, La Jolla, California 92093, USA. 8 New York Genome Center, New York, New York 10013, USA. 9 Department of Human Genetics and Biostatistics, University of California, Los Angeles, California 90095, USA. * These authors contributed equally to this work. w Present addresses: Columbia University, New York, New York 10032, USA (L.G.); Salk Institute for Biological Studies, La Jolla, California 92037, USA (S.A.T.); Department of Psychiatry, Universityof Iowa, Iowa City, Iowa 52242, USA (J.J.M.); Division of Science and Math, and Center for Genomics and Systems Biology, New York University Abu Dhabi, P.O. Box 129188, Abu Dhabi, United Arab Emirates (K.S.A.). Correspondence and requests for materials should be addressed to T.H. (email: [email protected]) or to M.V. (email: [email protected]) or to L.M.I. (email: [email protected]). NATURE COMMUNICATIONS | 5:3650 | DOI: 10.1038/ncomms4650 | www.nature.com/naturecommunications 1 & 2014 Macmillan Publishers Limited. All rights reserved.
Transcript
ARTICLE
Received 24 Aug 2013 | Accepted 14 Mar 2014 | Published 11 Apr 2014
Protein interaction network of alternatively splicedisoforms from brain links genetic risk factorsfor autismRoser Corominas1,*, Xinping Yang2,3,*, Guan Ning Lin1,*, Shuli Kang1,*, Yun Shen2,3, Lila Ghamsari2,3,w,
Martin Broly2,3, Maria Rodriguez2,3, Stanley Tam2,3, Shelly A. Trigg2,3,w, Changyu Fan2,3, Song Yi2,3,
Murat Tasan4, Irma Lemmens5, Xingyan Kuang6, Nan Zhao6, Dheeraj Malhotra7, Jacob J. Michaelson7,w,
Vladimir Vacic8, Michael A. Calderwood2,3, Frederick P. Roth2,3,4, Jan Tavernier5, Steve Horvath9,
Kourosh Salehi-Ashtiani2,3,w, Dmitry Korkin6, Jonathan Sebat7, David E. Hill2,3, Tong Hao2,3, Marc Vidal2,3
& Lilia M. Iakoucheva1
Increased risk for autism spectrum disorders (ASD) is attributed to hundreds of genetic loci.
The convergence of ASD variants have been investigated using various approaches, including
protein interactions extracted from the published literature. However, these datasets are
frequently incomplete, carry biases and are limited to interactions of a single splicing isoform,
which may not be expressed in the disease-relevant tissue. Here we introduce a new
interactome mapping approach by experimentally identifying interactions between
brain-expressed alternatively spliced variants of ASD risk factors. The Autism Spliceform
Interaction Network reveals that almost half of the detected interactions and about 30% of
the newly identified interacting partners represent contribution from splicing variants,
emphasizing the importance of isoform networks. Isoform interactions greatly contribute to
establishing direct physical connections between proteins from the de novo autism CNVs.
Our findings demonstrate the critical role of spliceform networks for translating genetic
knowledge into a better understanding of human diseases.
DOI: 10.1038/ncomms4650 OPEN
1 Department of Psychiatry, University of California San Diego, La Jolla, California 92093, USA. 2 Center for Cancer Systems Biology (CCSB) and Departmentof Cancer Biology, Dana-Farber Cancer Institute, Boston, Massachusetts 02115, USA. 3 Department of Genetics, Harvard Medical School, Boston,Massachusetts 02115, USA. 4 Donnelly Centre and Departments of Molecular Genetics & Computer Science, University of Toronto, and Samuel LunenfeldResearch Institute, Mt. Sinai Hospital, Toronto, Ontario, Canada M5S 3E1. 5 Department of Medical Protein Research, VIB, and Department of Biochemistry,Faculty of Medicine and Health Sciences, Ghent University, Ghent B-9000, Belgium. 6 Department of Computer Science and Informatics Institute, Universityof Missouri, Columbia, Missouri 65203, USA. 7 Beyster Center for Genomics of Psychiatric Diseases and Department of Psychiatry, University of CaliforniaSan Diego, La Jolla, California 92093, USA. 8 New York Genome Center, New York, New York 10013, USA. 9 Department of Human Genetics and Biostatistics,University of California, Los Angeles, California 90095, USA. * These authors contributed equally to this work. w Present addresses: Columbia University, NewYork, New York 10032, USA (L.G.); Salk Institute for Biological Studies, La Jolla, California 92037, USA (S.A.T.); Department of Psychiatry, University of Iowa,Iowa City, Iowa 52242, USA (J.J.M.); Division of Science and Math, and Center for Genomics and Systems Biology, New York University Abu Dhabi, P.O. Box129188, Abu Dhabi, United Arab Emirates (K.S.A.). Correspondence and requests for materials should be addressed to T.H. (email:[email protected]) or to M.V. (email: [email protected]) or to L.M.I. (email: [email protected]).
Autism spectrum disorder (ASD) is a broad class ofneurodevelopmental disorders with a common set of corefeatures including social impairments, communication
difficulties and repetitive behaviours. The genetic aetiology ofASDs is also highly heterogeneous and can be attributed tohundreds of genes, of which only a small fraction have sufficientgenetic evidence to be considered as causative. Some of the mostwell-documented autism risk factors include genes associatedwith rare syndromic forms of ASD (MECP2, FMR1, PTEN),synaptic cell adhesion and scaffolding molecules (NLGN3,NLGN4, NRXN1, CNTNAP2, SHANK3) and genes with de novomutations (CHD8, SCN2A, DYRK1A among others) recentlyidentified in exome-sequencing studies1–4. Copy numbervariation (CNV)5–7 and genome-wide association studies8–10
have discovered rare and common variants, respectively, thatconfer varying effects on ASD risk in the general population.
The heterogeneity of genes implicated in ASD stimulatedintensive testing of the pathway convergence hypotheses11. Theexperimental and computational approaches including genecoexpression12,13, functional annotations14,15, mouse modelphenotypes16 and protein–protein interactions (PPIs)3,17,18 wereused to search for molecular processes and pathways shared bythe ASD risk factors. With regard to convergence at the proteininteractions level, only one experimental PPI study of 35syndromic ASD genes is currently available17; all other PPIstudies in ASD to date have been based on the interactionsextracted from the published literature. However, literature PPIdatasets are known to be incomplete and inherently biased19.For example, the largest database of autism candidate genes,‘Simons foundation autism research initiative (SFARI) gene’(https://sfari.org/resources/sfari-gene), contains human binaryphysical protein interaction annotations for only 24% (131/546,June 2013 release) of its entries. The annotations of interactionsbetween ASD genes, which is even more important fordiscovering the desired convergence, is scarcer still—only 9%(50/546) of SFARI proteins are annotated as interacting with eachother. In addition, literature interactions carry a wide range ofother biases: highly studied proteins have a greater number ofinteractions, computationally predicted, erroneously annotatedand non-binary interactions may be included in the analyses19,20.
Most importantly, the interactions of the alternative spliceforms of genes have not been systematically incorporatedinto disease networks, even though most human genes arealternatively spliced21,22. Historically, only a single so-called‘reference’ isoform of each gene (or its fragments) has been usedin the disease PPI network studies17,23–25.
Here we apply a novel approach to mapping an ASDinteractome network by experimentally testing multiple naturallyoccurring brain-expressed alternatively spliced isoforms of nearly200 autism candidate genes for interactions. In addition, we alsotest all cloned splicing isoforms of these genes for interactionsagainst themselves and identify important novel PPIs betweenvariants of the ASD risk factors. We demonstrate that theresulting Autism Spliceform Interaction Network (ASIN) pro-vides greater detail and depth around ASD proteins than theconventional PPI networks. ASIN directly connects genes from alarge number of ASD-relevant CNVs into a single connectedcomponent. We identify two proteins as important connectorsbetween CNV loci, and implicate new players in ASD. Overall,our isoform-based autism interactome provides the detailed andunprecedented look at the cellular network involving a largenumber of ASD risk factors.
ResultsConstructing autism brain-expressed isoform ORF library. Toobtain a network of physical interactions between proteins
implicated in autism, we performed global interactome mappingfor 191 autism candidate genes and their cloned brain-expressedsplice variants (Fig. 1a). The list of selected ASD risk factors(Methods, Supplementary Data 1) consisted of genes associatedwith syndromic forms of ASD (for example, TSC2 and FMR1; atotal of 24); genes affected by the de novo CNVs (for example,ARID1B and A2BP1 also known as RBFOX1; a total of 65) orrecurrent CNVs (for example, PTCHD1 and CNTN4; a total of27); genes carrying rare mutations in autism patients (forexample, SCN2A and GRIN2A; a total of 25), and genes withsuggestive evidence for association with autism (for example,CDH9 and CDH10; a total of 50). Recently, a rapidly growingnumber of genes have been implicated in ASD with varyingdegrees of confidence: from very strong for a handful of thesyndromic genes to suggestive for hundreds of genes from theCNV and the genetic-association studies. As a result, an attemptto prioritize ASD candidate genes is inevitably subjected to arange of biases. Here, we decided to create a broad list of non-syndromic ASD candidates by including all genes with suggestiveevidence that were available in the published literature at the timewhen this study began (early 2010), in addition to the genes withstrong evidence from the syndromic ASD studies. Since our studybegan before the publication of ASD exome sequencing studies1–
4, the new genes with de novo mutations identified in these studieswere not included in our candidate gene list.
Using total RNA (Clontech, Stratagene) purified from thepooled foetal and adult whole brain samples (Methods) andapplying a high-throughput isoform discovery pipeline and deep-well next-generation sequencing26, we successfully cloned 373brain-expressed splicing isoforms corresponding to 124 autismcandidate genes (Supplementary Fig. 1). To further increase thecoverage, the set of cloned isoforms was supplemented withadditional open reading frames (ORFs) from the humanORFeome 5.1 (ref. 27) resulting in a library of 422 splicingisoforms for 168 genes (ASD422, Fig. 1a, Supplementary Data 2).While the isoform space coverage in our study is limited to anaverage of B2.5 isoforms per gene, the advantage of ourapproach lies in the creation of the physical collection of thefull-length splicing isoforms that is not available from the RNA-seq studies.
By comparing the full-length sequences of the cloned isoformsto the full-length sequences annotated in six public databases(consensus coding sequence (CCDS), RefSeq, GenCode, UCSC,MGS and ORFeome) we observed that over 60% of the clonedisoforms are novel—that is, have not previously been reported inany of these databases (Fig. 1b). The distribution of novel andknown cloned splicing variants among different subclasses ofgenes selected for this study was fairly uniform, and only geneswith rare mutations had slightly decreased fraction of clonednovel isoforms (Fig. 1b). Considering that the brain is among thetissues with the highest frequency of alternative splicing events22,the large number of novel isoforms that we cloned was notunexpected. Furthermore, the high fraction of novel brain-expressed isoforms is consistent with a previous study that alsoidentified the highest proportion of novel isoforms in the brainwhile investigating five different tissue types26.
We examined the splicing patterns by which novel isoformswere produced. We observed that according to previouslyintroduced classification21, most novel isoforms were generatedusing either ‘bounded’ exons (47%) that contain partial fragmentsof known exons, or by reshuffling of known exons (32%)(Fig. 1b). The remaining isoforms had at least one new exon (8%)that did not overlap with any known exons, or had an ‘extended’exon (13%) consisting of a known exon extended with theadjacent novel exonic region. The cloned splicing variants ofthree genes (NDE1, RIMS3 and RAPGEF4) demonstrate that
isoforms may carry different types of exons or combinations ofexons (Fig. 1c).
Autism spliceform interaction network. To build an autismspliceform interaction network (ASIN), the ASD422 isoform librarywas tested in two independent high-throughput yeast-two-hybrid(Y2H) screens (Fig. 1a). The first screen tested 422 ORFs forinteractions against the human ORFeome 5.1 (ref. 27) comprisingB15,000 ORFs. The second screen tested interactions among theASD422 ORFs themselves. Isoform interactions identified in thesescreens using next-generation sequencing were subsequentlyconfirmed by Sanger sequencing (Supplementary Fig. 2, Methods).
To increase confidence of detected isoform interactions and toensure that interaction changes are indeed owing to alternativeexon usage by the isoforms, all corresponding protein isoformsfor any given gene were Y2H-retested four times in a pair-wiseformat against the full series of interactors of any protein isoformof that gene found in the primary screens, thereby controlling forpotential biases owing to sampling sensitivity (that is, all isoformsagainst all interaction partners of any isoform of that gene). Onlythe interactions that scored positive at least three times in theretests were retained, and only those isoforms with at least oneinteracting partner were used for the subsequent analyses. Finally,the isoforms without any interacting partners were eliminated
Autism spliceforminteraction network
(ASIN)
191 ASD risk factorsisoform discovery
a
b
c
ASD422 vs
ASD422
91 PPIs
ASD422 vsORFeome582 PPIs
ASD422
ASD422
422 Isoforms
hORFeome~15,000 Clones
72
106
3018
Exon usage Exon types
40%Known
60%Novel
0
20
40
60
80
100Cloned isoforms
Novel isoforms
Per
cent
age
Bounded
Shuffled
A
B
C
Isolated
Shuffled
Shuffled
A
Exons
B
C
D
A
B
C Shuffled
Extended
NDE1
RIMS3
RAPGEF4Exons
Exons
Isof
orm
sIs
ofor
ms
Isof
orm
s
Syndr
omic
De no
vo C
NV
Recur
rent
CNV
Rare
mut
ation
s
Sugge
stive
Total
Known isoforms
IsolatedExtendedBoundedShuffled
629 PPIs
Y2H PPI screens
Figure 1 | Splicing isoform cloning and construction of autism spliceform network. (a) The experimental pipeline used to construct ASIN.
High-throughput splice isoform discovery and cloning was performed for 191 ASD risk factors using total RNA purified from the pooled foetal
and adult whole brain samples. A total of 422 splicing isoforms of these genes were assayed by Y2H screens for interactions against 15,000 human
ORFs (ASD422 versus ORFeome) and against themselves (ASD422 versus ASD422) to construct the ASIN with 629 isoform-level PPIs. (b) Novelty
assessment of the discovered splice isoforms. Isoform novelty was evaluated based on the annotations from six public databases. The ratios of known
and novel cloned isoforms among different categories of ASD risk factors is uniform, with genes with rare mutations having slightly lower number of
cloned novel isoforms. Exons used to generate novel isoforms were assigned in the following order: ‘isolated’, ‘extended’, ‘bounded’ and ‘shuffled’.
The majority of novel isoforms were generated using ‘bounded’ exons. (c) The examples of cloned isoforms carrying four types of exons. An intronic
region of NDE1 is converted into a coding region (‘isolated’); the exon 2 of RIMS3 is extended with an intronic region (‘extended’); the partial deletion
of the first two exons of RAPGEF4 (‘bounded’) and a novel exonic combinations in all three genes (‘shuffled’) are shown. The introns are not to scale.
from the analyses and were not considered as having lostinteractions (that is, negatives).
We detected 506 positive physical binary PPIs (correspondingto 629 isoform-level PPIs) between 71 baits (autism risk factors)and 291 preys (genes from the human ORFeome collection orfrom ASD422 isoform library; Supplementary Data 3–5). Most(463/506 or 91.5%) of the detected PPIs were novel, based on acomparison with a comprehensive literature-curated interactiondataset (LCI) of over 35,000 high-confident physical binaryinteractions assembled from seven public databases (MIPS,BIND, DIP, MINT, IntAct, BioGRID and PDB) (SupplementaryMethods).
Validation of ASIN interactions by mammalian PPI trap assay.To ensure that we have constructed a high-quality network, 312interaction pairs corresponding to 62% of gene-level interactionsin ASIN were retested in an orthogonal assay, mammalian PPItrap assay (MAPPIT)28, and then benchmarked against a positivereference set (PRS) and a random reference set (RRS), consistingof B500 and B700 protein pairs, respectively. The ASINvalidation set was assembled by following a two-tier procedure(Methods) and consisted of the interacting protein pairs unique ata gene-level but at the same time represented by a diverse set ofthe isoforms. The validation rate of ASIN interactions was similarto that of PRS (nASIN¼ 312 versus nPRS¼ 460, WilcoxonP¼ 0.85) and was significantly higher than that of RRS(nASIN¼ 312 versus nRRS¼ 698, Wilcoxon P¼ 1.78 � 10� 11;Fig. 2a). The precision of ASIN (89.2%) estimated at the RRSrecall rate of 0.01 was comparable to that of two otherinteractome networks, human (79%)29 and Arabidopsis (80%)30.
To confirm the biological relevance of the detected inter-actions, we also examined coexpression, coregulation andcofunctional annotation of all ASIN protein pairs using GeneOntology (GO) terms (Methods). Interacting protein pairs fromASIN were significantly enriched in the coexpressed pairs, in thepairs that share transcription factor-binding sites and in the pairswith shared GO terms when compared with random pairs ofproteins (Fig. 2b). Furthermore, the interacting protein pairs fromASIN formed binary protein complexes with experimentallysolved or homology-modelled structures more frequently than
random pairs (Methods). High retest rate of ASIN interactionsin the mammalian system together with its enrichment in pairswith shared functional annotations and structures suggest thatASIN is a high-quality network of biologically-relevant interac-tions. Most importantly, ASIN is the first high-resolution diseasenetwork built using multiple full-length splicing isoforms ofhundreds of genes, all derived from a disease-relevant braintissue.
Splicing isoform interactions expand ASIN. Typically, a PPIscreen will test only a single ‘reference’ isoform of each gene. Weinvestigated whether additional isoform interactions detected inour study expand this ‘reference’ network and add new isoform-specific PPIs. We constructed the ‘reference’ ASIN network byincluding only interactions corresponding to a single, ‘reference’isoform (typically CCDS ORF) of each ASIN gene (Fig. 3a). Weobserved that this ‘reference’ network comprises approximatelyhalf of all detected PPIs. The remaining 46% of the isoform-levelPPIs, corresponding to 33% of the gene-level PPIs, would nothave been identified if we only screened ‘reference’ isoform ofeach gene for interactions (Fig. 3b). Notably, many PPIs that wehave identified were derived exclusively from the non-referenceisoforms, emphasizing the importance of isoform screening forbuilding more complete PPI networks.
In addition to expanding the ‘reference’ network, new ASINPPIs also expanded the LCI network of previously reportedhigh-quality binary physical interactions from the publishedliterature (Supplementary Methods). ASIN interactions increasedthe public network of interactions by 51% by adding 463 novelpreviously unreported physical associations (Fig. 3c). For someimportant ASD risk factors, such as forkhead box protein P2(FOXP2) and A2BP1, the ASIN doubled and tripled the numberof previously known interactions, respectively. In addition,28% of the interactions we detected involve genes for which nointeractions have been reported in the public databases, forexample TBX6 and DGCR6 among the others.
The mechanism by which splicing could influence PPIs andexpand networks is directly related to the retention and loss ofspecific exons. For example, the A2BP1 gene coding for theataxin-2 binding protein 1 has 16 coding exons, and at least five
0
1
2
3
Rel
ativ
e en
richm
ent
Gene
onto
logyFra
ctio
n of
pai
rs r
ecov
ered
(%
)
PRSRRS
ASIN
1% RRS
1 2 3 4 5
0
20
40
a b
30
10
Score threshold (a.u.)
2.2x10⁻⁴
1.8x10⁻²
5.9x10⁻⁴
3.6x10⁻⁹
7.4x10⁻⁴
1.6x10⁻⁴
Coexp
ress
ed
Coreg
ulate
d
Costru
ctura
l cov
erag
e
Co-CC
Co-M
F
Co-BP
Figure 2 | Autism spliceform network quality assessment. (a) ASIN validation rate in the orthogonal mammalian system MAPPIT. Y-axis shows the
fraction of ASIN, positive reference protein pairs set (PRS) and random reference set (RRS) pairs recovered by MAPPITat increasing RRS recovery rates; 1%
RRS recovery rate is indicated by a vertical dotted line. The shading indicates standard error of the proportion. The validation success rate of ASIN is
comparable with the rate of true-positive interactions (nASIN¼ 312 versus nRRS¼698 P¼ 1.78 � 10� 11; nASIN¼ 312 versus nPRS¼460 P¼0.85; nPRS¼460
versus nRRS¼ 698 P¼8.1 � 10� 12; two-sided Wilcoxon rank sum tests). (b) Interacting ASIN pairs are significantly enriched in coexpressed, coregulated
and co-GO-annotated protein pairs, as well as in protein pairs forming binary complexes with experimentally solved or homology-modelled structures.
The comparison was performed against the background control dataset that consisted of B1.2 million non-redundant protein pairs generated by pairing
each ASIN protein with each protein from the human ORFeome 5.1. P-values were calculated using one-tailed Fisher’s exact test.
of them could be alternatively spliced. We cloned two newisoforms of A2BP1, A2BP1_A and A2BP1_B (Fig. 3d). When wetested different isoforms of A2BP1 for interactions, we observedsignificant variability in their interaction partners: only threeinteraction partners were shared among three isoforms, twopartners were shared among two isoforms, and four partners wereexclusively interacting with only one isoform (Fig. 3d). Further
analysis demonstrated that inclusion or exclusion of specificexons is directly correlated with the observed PPI differences ofthe isoforms: differential usage of exon 8 influences interactionwith CRX1; of exon 10a—with BHLHE40; of exon 10b—with fourunique partners. These results suggest that differential exon usageby the splice variants could expand or even alter PPI networks,which may have important consequences for cellular function
and non-reference isoforms PPIs (blue edges). The network represents an isoform-level network (for the edges) and a gene-level network (for the nodes).
The isoforms of the same gene were collapsed into one network node. The interactions from the non-reference isoforms almost doubled the number of
ASIN PPIs. Five out of seven interacting partners of the general transcription factor GTF2I were identified by screening its non-reference isoforms (inset I),
whereas the majority of interacting partners of the syntaxin protein, STX1A, were identified using its reference isoform (inset II). (b) The histogram
represents the number of the isoform-level PPIs (a total of 629) in ASIN coloured according to the isoform type, reference (tan) or non-reference
(light blue). The Venn diagram below represents the number of the gene-level PPIs (a total of 506) in ASIN coloured according to the isoform type,
reference (tan) or non-reference (light blue). Some genes have PPIs shared by the reference and the non-reference isoforms. (c) Newly identified
ASIN interactions (red edges) expand known binary interactions extracted from the published literature (grey edges) by 51%. Inset I shows newly
identified (red) and known (grey) interactions of the Forkhead box protein FOXP2; Inset II shows new (red) and known (grey) interactions of the T-box
transcription factor TBX6 and RNA-binding protein A2BP1. (d) Alternatively spliced isoforms of A2BP1 protein and their interaction partners. Primers were
designed to amplify the A2BP1 ORF that uses the downstream start site (CCDS10531) of the A2BP1 gene with 15 exons that could be alternatively used. The
cloned A2BP1 isoforms (two isoforms have novel exon combinations) have three alternatively spliced exons, and inclusion or exclusion of specific exons
influences interaction patterns of the isoforms. Alternatively spliced exon 8 (blue, chr16:7680605-7680685); exon 10a (orange, chr16: 7714931-7714970)
and exon 10b (green, chr16:7721559-7721601) mediate interactions of the isoforms with different binding partners. The genomic coordinates of exons
correspond to hg19 assembly. The interactions (that is, edges) are a consensus of three independent experiments performed in triplicate.
and disease, as was previously demonstrated for two splicingisoforms of the pyruvate kinase in cancer31.
ASIN preys are enriched in genes from rare de novo CNVs.Approximately half of autism risk factors (that is, ASIN baits)selected for this study are located within rare de novo or recurrentCNVs that have been identified in the patients, with many ofthem conferring high risk for ASD (Supplementary Data 1). Thus,the ASIN network contains information on protein interactionsof genes from different CNV loci. We investigated whether therewas evidence of genetic association with ASD among the ‘prey’proteins, that is, the interacting partners of the ASD candidategenes that were identified by an unbiased screen against humanORFeome (B15,000 ORFs).
We assembled a dataset of 198 de novo validated autism CNVscontaining 2,267 genes by combining CNV discovery results fromfive studies5–7,14,32. Two larger networks, Human Interactomespace II 2011 (HI-II-11) and literature LCI were used as controlsfor this analysis (Methods). We then mapped the genes from denovo CNVs to the ASIN and HI-II-11 prey space (all ASIN baitswere excluded from this analysis to eliminate the apparent CNVbias of the ASD422 list). We observed a 1.5-fold enrichment ofASIN preys in genes from de novo autism CNVs compared withthe HI-II-11 preys (15.5 versus 10.6%, Fisher’s exact P¼ 0.013;Supplementary Fig. 3a, Supplementary Table 1). Similarsignificant enrichments were observed when ASIN wascompared with the LCI dataset (15.5 versus 10.1%, Fisher’sexact P¼ 0.0047), and when only brain-expressed genes fromall these datasets were analysed (Supplementary Fig. 3b,Supplementary Table 1). These results suggest that proteinsencoded by pathogenic autism CNVs tend to physically interactwith the partners from other ASD CNVs, highlighting functionalconnectivity between CNV risk loci in ASD.
Isoform interactions contribute to de novo CNV–preyconnectivity. To more deeply investigate the role of preys, weprioritized them based on the number of the CNV nodes thatthey connect in ASIN. Our underlying hypothesis is that networkprey proteins connecting greater number of genes from thepathogenic CNVs may represent more interesting targets forfuture studies. Thus, we performed a subsequent analysis bymerging ASIN baits from the same CNVs into the CNV nodes(Fig. 4a). This procedure transformed ASIN into a CNV–preynetwork, where ASIN risk factors (baits) are replaced with 17CNV nodes that are connected through ASIN prey partners bythe isoform interactions. We also constructed 10,000 controlnetworks with the same characteristics as ASIN but using eitherHI-II-11 or LCI interactions (Supplementary Fig. 4a).
We then focused our analysis on preys that link two or moreCNV nodes. We observed that 26 ASIN preys interact with asignificantly larger than expected number of CNV nodes and15/26 (58%) of these preys have at least one interaction supportedby a non-reference bait isoform (Fig. 4b, Methods). For example,the majority (22/34 or 65%) of interactions that connect a highrisk ASD CNV 16p11.2 in the CNV–prey network are derivedexclusively from the non-reference isoforms. This suggests thatisoform interactions significantly contribute to the increasedCNV connectivity observed in ASIN.
Two proteins, GOLGA2 and BZRAP1, linked as many as sixdifferent CNV nodes in ASIN, which is a highly unlikely event tooccur by chance (empirical Po0.0001). In contrast, none of thecontrol networks contained preys that connected more than fourCNV nodes (Supplementary Table 2). Two out of six PPIs ofGOLGA2 and four out of six PPIs of BZRAP1 in the CNV–preynetwork are supported exclusively by the non-reference isoform
interactions and would likely not have been detected by screeningonly the reference isoforms of these genes. Both genes areexpressed in brain, and two recent studies have reported ade novo CNV overlapping with GOLGA2 (refs 6,7). GOLGA2 is acomponent of the Golgi involved in the transport of proteins andlipids, a function that is consistent with its high connectivity.BZRAP1 is a Rab3-interacting molecules (RIM)-binding proteinthat also binds to voltage-gated calcium channels, constituting analternative link between RIM and calcium channels33. It waspreviously suggested as ASD risk factor in a CNV study34. Insummary, the isoform-level PPIs support GOLGA2 and BZRAP1as important connectors between multiple CNVs in ASIN.
An isoform-resolved network directly links de novo autismCNVs. We demonstrated that genes from de novo autism CNVsare connected in ASIN via prey partners. To explore whethergenes from different de novo CNVs directly interact with eachother at the protein level, we extended our analysis by mergingboth ASIN baits and preys into the CNV nodes and constructinga CNV–CNV network (Fig. 4a). The resulting network directlylinked all 27 autism CNVs mapped to ASIN into one connectedcomponent (Fig. 4c). In contrast, the largest connected compo-nent of 10,000 control networks generated by permuting thelocations of CNVs in the genome ranged from 1 to 12, which issignificantly smaller than 27 for ASIN (empirical Po0.0001,Methods, Supplementary Fig. 4b, Supplementary Table 2).
The CNV–CNV network directly connects proteins fromseveral recurrent de novo CNVs (16p11.2 and 22q11.21-22;16p11.2 and 7q31.1-q32.1; 7q31.1-q32.1 and 15q11.1-q13.3). Theanalysis of a more informative isoform-resolved CNV–CNVnetwork indicates that about one third (16/47 or 34%) of the PPIsin this network are supported by the non-reference isoforms ofthe genes that have two or more isoforms cloned in this study(Supplementary Fig. 5). More importantly, the direct CNVconnections are mostly supported by novel interactions fromASIN. For example, connection between the 16p11.2 and22q11.21-22 CNVs is supported by a novel direct interaction ofMajor vault protein (MVP) with RIMS-binding protein 3A(RIMBP3). Likewise, the connection between the 16p11.2 and7q31.1-q32.1 CNVs is supported by a novel direct interaction ofmitogen-activated protein kinase 3 (MAPK3) with FOXP2. Amajor contributor to the high connectivity of 22q11.21-q11.22CNV, which directly links 15 other CNVs, is the DiGeorgesyndrome critical region 6 protein DGCR6, for which noexperimentally detected interactions have been reported beforethis study.
ASIN provides strong support for important functionalprotein-level relationships between a large number of autismCNVs. The observed direct physical associations betweenproteins encoded by individually rare de novo CNVs pointstowards common molecular networks shared among differentASD patients.
ASIN preys as new protein players in autism. Despite a largenumber of preys that we have identified in ASIN (a total of 291),various types of subsequent analyses consistently highlighted asmall subset of preys as being more relevant to ASD (Methods).To prioritize ASIN preys, we ranked them according to tenindependent (median Pearson’s correlation coefficient (PCC)¼� 0.11) sources of evidence for implicating these preys in ASD(Supplementary Fig. 6).
A total of 31 out of 291 ASIN preys, all notably being expressedin brain, accumulated three or more sources of evidence (Fig. 5a,Supplementary Data 6). Whereas 11/31 preys were previouslyimplicated in autism, the remaining 20 are proteins that had not
Figure 4 | Spliceform interactions connect genes from autism CNVs. (a) Schematic representation of the CNV–prey and CNV–CNV networks
construction. The coloured horizontal bars spanning a chromosomal region represent different de novo CNVs identified in ASD patients. Genes from the
same CNVs projected (dashed coloured lines) to the ASIN network are outlined by coloured ellipses. To create a CNV–prey network, baits from the same
CNVs were merged into the CNV nodes (large coloured circles) connected by the PPIs from ASIN, and baits that are not in CNVs were removed. To create a
CNV–CNV network, preys were also grouped into the CNV nodes connected by the ASIN PPIs. (b) The CNV–prey network (left) identifies 26 preys (larger
and darker grey triangles/squares) that bind to significantly greater number of CNV nodes than expected by chance. To identify such preys, the empirical
P-value for each prey was estimated using 10,000 degree-preserving rewired networks with exactly the same properties as ASIN. Only preys binding to
Z2 CNVs are shown. Dark blue edges are PPIs supported exclusively by the non-reference isoforms, tan edges—by the reference isoforms, light blue
edges—by both isoform types. The control network (right) was selected from 10,000 control networks constructed from the randomly selected genomic
regions with the same number of genes with interactions and the same number of interacting partners as in ASIN. This control network represents an
example with the greatest number of preys (a total of three) that interact with four CNV nodes using HI-II-11 interactions. Among 10,000 control networks
not a single network with the preys that interact with 44 CNV nodes was observed. (c) The CNV–CNV network (left) directly links 27 autism CNVs into a
single connected component. Dark blue edges are PPIs supported exclusively by the non-reference isoforms, tan edges—by the reference isoforms, double
edges—by both isoform types. The control network (right) represents the network that connects the largest number of CNV nodes. This network was
selected from 10,000 control CNV–CNV networks constructed using randomly selected genomic regions with the same number of genes with interactions
as in ASIN, connected by HI-II-11 PPIs. All networks were visualized using Cytoscape.
yet been explicitly associated with ASD at the time when thisstudy began. Further investigation of the physical associationsbetween highly ranked preys demonstrated that the majority ofthem (25/31 or 81%) interact with each other through the baitnodes that were also captured in the prey configuration in ourY2H screens (Fig. 5b). More importantly, 82% of the PPIsbetween highly ranked preys are supported exclusively by thenon-reference isoforms, 12% by both, reference and non-reference isoforms and only 6% by exclusively reference isoforms.Furthermore, 58% of the PPIs are supported by the novelisoforms cloned in this study. This suggests that the majority ofthe interactions in this prey network would have escapeddetection in the traditional reference-based PPI screens.
While our study was in progress, some of the ASIN preys havestarted accumulating genetic evidence for autism relevance. Forexample, a highly ranked prey TCF4 was recently identified as astrong autism candidate in the whole genome sequencing ofmonozygotic twins35; five preys (RIMBP3, GOLGA2, MKRN3,C16orf45 and MAGED1) were found within newly reported denovo CNVs6,7,14; and two other preys (CASK and DISC1) wereimplicated in ASD based on a recent exome sequencing study4.
Accumulating evidence suggests that many genetic risk factorsare shared between different neurodevelopmental disorders36–39.We examined whether newly identified ASIN preys are involvedin other neurodevelopmental syndromes characterized bypsychiatric phenotypes, such as intellectual disability, mentalretardation and developmental delay. We observed that ASIN issignificantly enriched in preys involved in these disorderscompared with HI-II-11 (5.2% versus 2.6%, Fisher’s exactP¼ 0.02, Supplementary Table 1, Supplementary Data 7), andthe enrichment is maintained when analysis is restricted to onlybrain-expressed genes (6.1% versus 2.9%, Fisher’s exact P¼ 0.012,Supplementary Table 1, Supplementary Methods).
Among 31 highly ranked ASIN preys, nine are relevant to otherpsychiatric abnormalities (annotated as ‘psychiatric phenotype’in Online Mendelian Inheritance in Man in Fig. 5a). Thetranscription factor TCF4 is involved in Pitt-Hopkins syndrome,which is characterized by mental retardation and distinctivefacial features40. Recently, de novo point mutations of TCF4 havebeen implicated in developmental delay41–43 and autism35, andcommon variants of TCF4 were recurrently implicated inschizophrenia44,45. Similarly, mutations in the transcriptional
ASIN PPI
ASIN PPI with additionalfunctional evidence
ASIN prey
ASIN prey (also bait)
DPYSL2
A2BP1
MVP
GOLGA2
NDE1
CRMP1 TRIM37
MKRN3
MAGED1
PIAS2
FOXP2
ZEB2
TCF4
ARNT2
CTBP1
TSC22D4
DLX2
REL
MEOX2
RIMBP3
STX1A
NAPB
DLGAP2 BZRAP1
CAMK2B
BZRAP1
TCF4A2B
P1
SEPT5
CTBP1
PIAS2
GOLGA2
NDE1M
AGED1
STX1A
ZEB2DLGAP2
CAMK2B
MEOX2
RELRIM
BP3
DLX2M
KRN3
FOXP2
TRIM37
NEFLNAPB
TSC22D4
C16or
f45
ARNT2
MVPIP
O13
CRMP1
DPYSL2
AP2B1
Binds multiple CNV nodes in ASINGene expression analysis in ASINHighly connected ASIN preyBinds two interacting ASIN baitsHigh betweennessPresent in autism de novo CNVsBrain preferentially expressedPost-synaptic densityPsychiatric phenotype in OMIMFMRP binding target
Total number of the sources of evidence 5 4 3
NEBL
a
b
Figure 5 | ASIN preys as new protein players in autism. (a) Integrative analysis of ASIN implicates new players that connect autism genetic risk factors at
a protein level. Ten independent sources of evidence (Methods) were used to rank ASIN preys. Thirty one preys accumulated three or more sources of
independent evidence. Eleven preys (bold font) have been previously implicated in autism, whereas the remaining twenty (regular font) are newly
discovered proteins with strong suggestive evidence for involvement in ASD. (b) The isoform-resolved network of binary physical interactions between
highly ranked ASIN preys. Ten proteins in this network were detected in reciprocal configurations (as bait and as prey) in our Y2H screens. The majority of
PPIs are supported by non-reference isoforms (dark blue lines), only two PPIs are supported by the reference isoforms (tan lines), and the remaining four
by both isoform types (light blue lines). Thicker lines represent PPIs that are also supported by at least one additional functional evidence (coexpression,
coregulation, co-GO annotation or complex with solved or homology-modelled structure). The network nodes are grouped according to common functional
annotations of genes that were manually curated from the Genome Browser, Entrez Gene Summary and UniProt: transcription (yellow), synaptic
inhibitor ZEB2 are the cause of Mowat–Wilson syndrome,a complex developmental disorder characterized by mentalretardation, delayed motor development, epilepsy, microcephalyand a wide spectrum of clinically heterogeneous features46. Otherpsychiatric abnormalities with mutations in ASIN preys includePrader–Willi (the 15q11.2 region, which includes MKRN3),speech-language disorder (FOXP2), and lissencephaly (NDE1).In addition, some CNV regions harbouring highly ranked preysare associated with multiple phenotypes. For example, NDE1is located in 16p13.11, a genomic region that is impacted byCNVs in autism7,14, schizophrenia47, mental retardation48,49,attention-deficit hyperactivity disorder50 and epilepsy51.Considering the above observations it is tempting to speculatethat the convergence of the risk factors for genetically- andphenotypically-heterogeneous neurodevelopmental disordersmay occur at the level of protein interaction networks. Insummary, our study emphasizes the importance of isoform-resolved PPI networks for improving understanding of autismalong with other neuropsychiatric diseases.
DiscussionFunctional relationships between genes are difficult to inferthrough genetic approaches alone. Our study illustrates the powerof integrating genetic data with detailed isoform-resolved proteininteraction network to gain better knowledge about ASD. Theautism spliceform network constructed using brain-expressedgene variants is more relevant to ASD than literature-based PPInetworks. ASIN has uncovered new direct physical associationsbetween genes from pathogenic autism CNVs. It also identifiednew interacting partners of ASD risk factors through a largeunbiased screen against thousands of other human genes. Manyof the new interacting partners that we have discovered areinvolved in other neurodevelopmental disorders. Further func-tional analysis of these genes could significantly deepen ourinsight into pathogenesis of ASD and related disorders.
ASIN is a resource with a considerable value for genetics,neurobiology and drug development. The collection of 422 clonedbrain-expressed isoforms of ASD candidate genes, along withthe high-quality interactome consisting of 629 isoform-basedprotein interactions, represents an unprecedented resource forfuture studies of autism. A comparison of ASIN with anotherrecently published autism network focused on 35 syndromicautism genes17 that does not consider interactions from thesplicing isoforms, shows that these two networks are highlycomplementary (Supplementary Fig. 7). Our study furtherhighlights the need to include alternatively spliced isoforms ofgenes in future PPI screens to construct more comprehensivedisease-specific and tissue-specific interactomes. It is essential tofocus the disease network studies on the PPIs relevant to thetissue and pathology. Given that autism is a developmental braindisorder, the interactions identified from the brain-expressedisoforms are more appropriate for the study of ASD than PPIsfrom the public databases that may include interactions from thevariants that are not even expressed in the human brain.Additionally, the changes in interactions of different splicingisoforms should be taken into consideration when generating andinvestigating disease-targeted networks.
The biological relevance of a disease network is of coursedependent on the disease relevance of the genes that were used toconstruct it. Networks built based on the findings from thegenetic studies of complex diseases include a combination of truedisease-associated genes and other non-relevant genes, which areexpected to occur in the genetic data by chance. For example, inrecent exome sequencing studies of ASD, it is estimated that onlya fraction of the mutations detected in the patients (B10–20%)
influence disease risk1,4. Similarly, for CNVs (even ones that havebeen definitively linked to ASD) only a subset of genes within thegenomic region may be relevant to autism. To achieve a balancebetween the number of genes and the strength of evidencesupporting their involvement in ASD, we decided to focus ournetwork on the genetic variants that have strong effects, such asde novo CNVs and those implicated in the syndromic forms ofASD. In addition, we expanded the gene list with genes that havesuggestive evidence, including the results of genome-wideassociation studies and functional studies of individual genes, toencompass a broader spectrum of the disorder. We anticipate thatASIN will be further refined as knowledge of the underlying genescontributing to ASD grows. So far, our study represents asignificant step in this direction.
Disease-centered networks such as ASIN could serve asvaluable exploration tools for future studies. It is likely that somemutations that are currently being identified in ASD patientsthrough exome- and whole-genome sequencing can impact oreven disrupt these networks. Continued progress in genetics willrely heavily on parallel efforts to develop experimental andcomputational methods to distinguish between deleterious andneutral mutations. With the ASIN network constructed, we cannow begin to examine how disease mutations identified in thepatients impact this network, possibly through the interactionperturbation mechanisms. Furthermore, our autism spliceformnetwork is an easily expandable resource that can keep pace withrapid advances in genetics, incorporating new findings as theyemerge. Knowledge of interacting partners of ASD risk factorshas direct implications for the development of therapeutics.A gene that has been firmly implicated in autism may not itself bean ideal drug target; however, an exploration of its interactingpartners may identify more suitable drug targets.
MethodsSelection of the autism risk factors. Manually curated list of ASD risk factorswas compiled in the early 2010 (before the publication of three major de novoCNV6,7,14 and exome sequencing1–4 studies) and consisted of 191 genes withsuggestive evidence for involvement in ASD from earlier literature (SupplementaryData 1). In assembling this list we intentionally aimed at covering as broad varietyof the risk factors for non-syndromic ASD as possible, including those fromdifferent types of CNVs, which lead to the list of genes with variable degree ofconfidence for ASD relevance. Besides syndromic ASD risk factors (B13% of thedataset) and the genes from the de novo (B34%) and rare recurrent CNVs(B14%), the remaining candidates included genes carrying rare high penetrantmutations (B13%) and genes implicated in ASD based on other sources ofevidence such as animal models, alterations in expression in the postmortem brainof ASD patients, genetic association studies and relevance to other psychiatricdisorders (B26%).
Brain-expressed isoform discovery pipeline. The high-throughput splice iso-form discovery pipeline combines high-throughput cloning and next-generationsequencing26. Briefly, primers corresponding to the longest-annotated ORF of eachgene were designed (Supplementary Data 8) and the reverse transcription wasperformed using the total RNA purified from the multiple pooled samples of theadult and the foetal whole normal human brains (purchased from Clontech andStratagene). The adult brain sample contained purified whole brain RNA pooledfrom two healthy donors, an 18 year old male (Clontech) and a 66 year old female(Stratagene). The foetal sample contained purified whole brain RNA pooled at a29.5:1 ratio from 59 spontaneously aborted male/female Caucasian foetuses, 20–33w/o (Clontech), combined with two female foetuses 18 w/o (Stratagene). Reversetranscripts of brain RNAs were used as templates for the PCR amplification withKOD HotStart Polymerase (Novagen) using designed primers. Reversetranscription–PCR products were recombinationally cloned via a Gateway BPreaction (Invitrogen) with the pDONR223 vector and resulting plasmids weresubsequently transformed into Escherichia coli DH5a-competent cells and grownon LB-agar plates overnight at 37 �C. A total of 32 single colonies were picked foreach gene and the ORF inserts were amplified by PCR using pDONR223 universalprimers (M13G forward and reverse). A total of 32 pools of PCR products werecreated by distributing one colony from each gene per pool and DNA productswere purified using MinElute PCR Purification Kit (Qiagen). Roche 454 GS FLXsequencing was performed according to the manufacturer’s instructions. Briefly,DNA libraries were amplified from a single DNA fragment to millions of copies per
bead using emulsion PCR Roche kits (GS Standard DNA Library Preparation kit;GS FLX Standard emPCR kit (Shotgun); GS FLX PicoTiterPlate Kit (70� 75); andGS FLX Standard LR70 Sequencing Kit). Subsequent quality assessment andquantitation were performed by 96-well plate fluorometry using SpectroMax M5(Molecular Devices) and analysed on a Bioanalyzer with Agilent RNA Pico 6000LabChip Kit. Two 454-FLX Titanium sequencing runs (Roche) of 16 regions eachwere carried out at the UCSD GeneChip Microarray Core facility. Subsequently,Sanger sequencing was performed to achieve a better coverage of the 50 and 30 ends.
Splice isoform assembly and annotation. The 454 GS FLX sequencing data wereassembled and analysed to identify full-length alternatively spliced ORFs using thein-house reference-based assembly pipeline (Supplementary Fig. 1, details in theSupplementary Methods). In brief, raw 454 reads were processed and aligned tohuman genome release hg19 using GMAP52. Each genomic position covered by454 reads was annotated as either exonic or intronic based on quality scores.Single-nucleotide polymorphisms and insertion/deletion (indel) variants werecalled using SAMtools53. Additional Sanger sequencing was performed to improvethe assembly quality of the isoform terminal regions and was integrated usingPhred54 and CAP3 (ref. 55). To annotate splicing isoforms, all assembled contigswere grouped into sets of unique isoforms defined by the splicing patterns. Toassess isoform novelty, unique isoform sets were compared with ORF structures ofmRNAs from several major databases including CCDS, RefSeq, UCSC, Gencode(Ensembl), MGC56 and human ORFeome57. Isoforms with exactly the same set ofsplicing sites as annotated mRNAs were considered as known, whereas isoformswith at least one novel splicing site were annotated as novel. The isoforms weretranslated into protein sequences using the BioPython package. All isoforms thatproduced short (o30 amino acid) proteins or had an out-of-frame indels withinthe first 20% of translated protein sequence were removed from subsequentanalysis to ensure high quality of annotation.
Experimental identification of PPIs. The ASD422 ORFs were screened for PPIsagainst the human ORFeome v5.1 (B15,000 ORFs) and against themselves using ahigh-throughput Y2H system, retested and sequence validated (SupplementaryFig. 2, details in the Supplementary Methods). First, ORFs of each isoform(Iso-ORFs) were cherry-picked from Escherichia coli glycerol stocks, cultured andcloned into pDEST-DB and pDEST-AD vectors using the Gateway recombinationLR reaction (Invitrogen). Iso-ORFs in the pDEST vectors were introduced into theyeast strain Y8930 (MATa) to create the bait (DB-X) strains and into Y8800(MATa) to create the prey (AD-Y) strains using lithium acetate transformationmethod. DB-X strains that autoactivated transcription of the Gal1-HIS3 reportergene were detected and removed before the Y2H screens. The individual DB-Xstrains (haploid Y8930 containing Iso-ORFs in the DB vector) were screenedagainst the pools of the AD-Y strains (haploid Y8800 containing human ORFeomev5.1 prey in the AD vector) following standard Y2H protocols58. Positive colonieswere picked and used for making yeast lysates followed by yeast colony-PCR,stitching PCR and 454 GS FLX sequencing59 to identify gene-level interaction pairs(Supplementary Methods). Isoforms of the autism risk factors were also screenedagainst themselves (iso-ORF AD strains pooled). Four rounds of pair-wise Y2Hretests among isoforms of each gene as baits and a union of all interacting partnersfrom ORFeome 5.1/iso-ORF ADs for each gene as preys were performed in matrixformat. Only the interactions that scored positive at least three times in the retestswere retained. Sanger sequencing was performed to confirm ORF-level interactionpairs and to generate a high-confident isoform interactome network.
Validation of Y2H interactions by MAPPIT. To ensure that the interactionsdetected by the Y2H are of a high quality, an orthogonal assay in mammalian cells,MAPPIT28,60, was used to validate the interactions of 312 protein pairs. A randomset of ASIN interactions was selected following two steps. First, 400 gene-levelinteracting protein pairs were randomly selected from the ASIN. Second, for thosepairs where more than one isoform was interacting with the same prey, only asingle isoform was randomly picked for the subsequent validation by MAPPIT. Thefinal validation list, which consisted of 312 interaction pairs, was unique at thegene-level and comparable to the reference sets. However, interactions from thesame gene were represented by different isoforms in some cases. The ASINvalidation rate was compared with the validation rate of the expanded PRSconsisting of B500 positive protein pairs and the expanded RRS consisting ofB700 random protein pairs29,60 using Mann–Whitney–Wilcoxon test.
ASIN quality assessment using functional annotations. We assessed functionalsimilarity of interacting protein pairs using four independent measures:coexpression, coregulation, three branches of shared GO annotations andco-occurrence of interacting proteins within the same protein complex with thesolved or homology-modelled protein structure. The frequencies of cofunctionally-annotated protein pairs in ASIN were compared with those from the randomprotein pairs set containing B1.2 million non-redundant protein pairs generatedby pairing each ASIN protein with each protein from the human ORFeome 5.1.Relative Enrichment (RE) was calculated using the given threshold (PCC Z0.5, or
10th percentile for co-GO):
RE ¼Cp
Np
CrNr
ð1Þ
where Cp is the number of interacting gene pairs with coannotation above thethreshold; Np is the total number of PPI pairs in a network with functional dataavailable for both genes; Cr is the number of random gene pairs with coannotationabove the threshold; Nr is the total number of gene pairs with functional dataavailable for both genes. The statistical significance of the enrichment was calcu-lated using one-tailed Fisher’s exact test.
To identify coexpressed gene pairs, a publicly available human tissue expressionmicroarray dataset was obtained from NCBI Gene Omnibus (GEO accessionGSE7307) and pre-processed using robust multi-array method for backgroundcorrection. Only the expression profiles from 123 healthy tissues were included;disease tissues and treated cell lines were not considered. Data filtering process wasperformed as follows: the probe sets with either 100% ‘absent’ calls across alltissues, or expression values o20 in all samples, or an expression range o100across all tissues were excluded from the analysis. The expression values fromreplicated tissues were averaged into a single value. As a result, the expressionprofiles for 14,958 human genes were obtained. Gene pairs with PCC40.5 wereconsidered to be coexpressed.
To identify coregulated gene pairs, the promoter region of each gene wasdefined as the region spanning 1000 base pairs upstream of the transcription startsite (TSS) and 500 base pairs downstream of the TSS. RefSeq mRNA annotationswere used to determine the TSS of each gene. The clustered transcriptional factor-binding sites were downloaded from the ENCODE website (http://genome.ucs-c.edu/ENCODE/) in BED format. Transcriptional factor-binding sites with BEDscores o800 were discarded as unreliable. The gene pairs with promoter regionsshared by at least one common transcription factor were considered to becoregulated.
To identify co-GO-annotated gene pairs and to determine whether interactingproteins share functional similarity, we analysed annotations extracted from theGO database (http://www.geneontology.org/GO.downloads.database.shtml). GOannotations inferred from Electronic Annotation were excluded from the analysisas unreliable. Three GO branches (molecular function, cellular component andbiological process) were used for the analyses. GO annotations were first filteredbased on information content (IC). The IC of a GO term t is defined as:
IC tð Þ ¼ � ln½pðtÞ� ð2Þwhere p(t) is the fraction of genes annotated with the term t or its descendants. GOterms with ICo 0.95 (that is, those shared by more than 5% of all the annotatedgenes in one GO branch) were discarded to avoid the ‘shallow annotation problem’.After the filtering, Gene Semantic Similarity Analysis and Measurement Toolsmethod61 was implemented to calculate the similarity score of gene pairs in eachGO branch.
To identify protein pairs with solved or modelled structures, for each proteinpair, the structural templates covering the interactions between domains of eachprotein were derived using SUPERFAMILY, DOMMINO62 or PSI-BLAST. Oncethe templates were obtained, the coverage of each template was further expandedby using templates from the PDB (http://www.pdb.org/). A homology model of theinteraction was built using MODELLER63. All isoforms that participate in theinteractions covered by at least one template were analysed. The same pipeline wasused to assess the structural coverage of random background protein pairs.
ASIN analysis using CNV data. A list of 2,267 genes from thede novo validated autism CNVs was assembled by literature curation of major denovo CNV studies5–7,14,32, and a total of 69 genes from this list were successfullymapped to the ASIN.
Since ASIN preys were identified using an unbiased screen against a library ofB15,000 ORFs, we used the comparable but much larger recently constructed HI-II-11 (Supplementary Methods) for comparison with ASIN. Both, HI-II-11 andASIN, share the same prey search space (B15,000 ORFs), and they were bothgenerated in the same laboratory using similar experimental conditions.Furthermore, these two networks have comparable proportions of the brain-expressed preys (85% in ASIN versus 87% in HI-II-11, Supplementary Data 9),making HI-II-11 the best currently available control PPI network for ASIN. Theinteractions from the LCI dataset were used as an additional control(Supplementary Methods).
To construct the CNV–prey network, all baits from the same CNVs weremerged into the CNV nodes. To perform statistical comparisons for Fig. 4b wegenerated control CNV–prey networks containing the same number of CNVs as inthe ASIN CNV–prey network by randomly selecting genomic regions with thesame number of genes with interactions and the same number of interactingpartners as in ASIN. To ensure high quality of control networks, millions of themwere generated to randomly select the sets of 10,000 networks with exactly thesame parameters as ASIN CNV–preys network. Two sets of 10,000 networks eachwere created: one using interactions from the HI-II-11 dataset, and the other usingLCI PPIs. These networks were used to estimate the statistical significance of theASIN preys binding to multiple (Z2) unique CNVs in CNV–prey network(Supplementary Table 2).
The ASIN CNV–CNV network was constructed by merging both ASIN baitsand preys into the CNV nodes. To perform statistical comparisons for Figure 4c wegenerated the sets of 10,000 control CNV–CNV networks containing the samenumber of CNVs as in the ASIN CNV–CNV network by randomly selectinggenomic regions with the same number of genes with interactions as in ASIN. Twosets of 10,000 networks each were created: one using interactions from the HI-II-11dataset, and the other using LCI PPIs. These networks were used to estimate thesize of the largest connected component for comparison with ASIN(Supplementary Table 2).
ASIN prey prioritization. To prioritize ASIN preys for Figure 5a, we ranked themaccording to ten independent sources of evidence, five from our ASIN analyses andfive from the public domain. The ASIN-based sources of evidence included: (1)preys binding to a significantly greater than expected number of ASIN baits fromthe de novo autism CNVs identified from the CNV–prey network (a total of 26);(2) preys significantly enriched in ‘SNARE/syntaxin binding’ and ‘transcriptionfactor binding’ from the gene coexpression and differential expression analysis (atotal of 29); (3) preys binding to a greater than expected number of ASIN baits (atotal of 14); (4) preys binding to two directly interacting ASIN baits and formingnetwork triplets (a total of 25); (5) preys with high network betweenness (a total of22). The literature-derived sources of evidence included: (1) preys from the de novovalidated autism CNVs (a total of 45); (2) preys preferentially expressed in thehuman brain (a total of 46); (3) preys present among post-synaptic density proteinsfrom the human neocortex (a total of 28); (4) preys annotated with psychiatricphenotype in Online Mendelian Inheritance in Man (Supplementary Data 7) (atotal of 15); (5) preys representing fragile X mental retardation protein (FRMP)binding targets (a total of 21).
To collect the sources of evidence we have performed additional ASIN analysesas described below. To annotate preys for the Gene expression analysis in ASINcategory, the unsigned coexpression network for 205 ASIN genes with availablebrain expression values12 was constructed by following the standard WGCNAprocedure64,65. The pair-wise correlation matrix was computed for each gene pair,and an adjacency matrix was calculated by raising the correlation matrix to a powerof 10 using the scale-free topology criterion. Modules were defined as branches ofthe clustering tree and were characterized based on the expression of the moduleeigengene (ME) or the first principle component of the module. To obtainmoderately large and distinct modules, the minimum module size was set to fivegenes and the minimum height for merging modules at 0.25. Genes were assignedto a module if they had a high module membership (kME4 0.7). Five distinctmodules were detected in ASIN, and module 1 was significantly enriched in geneswith ‘SNARE/syntaxin-binding’ and ‘transcription factor-binding’ functions.
To identify differentially-expressed genes that interact in ASIN, brain geneexpression data from autism patients and controls for 9552 genes was obtained12
and processed using the SAM package with the significance threshold of falsediscovery rate (FDR) o0.05 and fold changes 41.3. Two distinct modules ofinteracting proteins, downregulated and upregulated in autism cases, were detectedin ASIN. Functional enrichment analyses were performed for each module fromWGCNA and differential expression analyses using DAVID, and statisticalsignificance threshold was set at Po0.05 after Benjamini–Hochberg correction formultiple comparisons.
To annotate preys for the Highly-connected ASIN prey category, we comparedthe fraction of ASIN and HI-II-11 baits interacting with each ASIN prey that isshared between ASIN and HI-II-11. We found that 14 ASIN preys interact withgreater than expected number of baits (one-tailed Fisher’s exact Po0.05 after falsediscovery rate correction). The analysis was repeated by decreasing ASIN degree orincreasing HI-II-11 degree of each prey by a factor of one to ensure the robustnessof the results.
To annotate preys for the Binds two interacting ASIN baits category, theclustering coefficient Cx of each prey x was calculated as:
Cx ¼2px
NxðNx � 1Þð Þ ð3Þ
where Nx is the number of bait neighbours of x and px is the number of theconnected pairs between all neighbours of x.
To annotate preys for the High betweenness category, a modified betweennesswas calculated by considering all shortest paths between ASIN baits. Thebetweenness of a prey (vertex) v in ASIN network graph G¼ (V, E) was computedas follows:
BðvÞ ¼X
s 6¼ v 6¼ d2V
nsdðvÞnsd
ð4Þ
where nsd is total number of shortest paths from bait s to bait d, and nsd(v) is thenumber of the paths that traverse prey v. The betweenness of a prey v wascalculated by summing B(v) overall pairs of vertices (s,d). High betweenness wasdefined as values in the top 25th percentile of the distribution (B(v)40.027).
To obtain sources of evidence from the literature, the expression profiles of14,958 genes from 37 brain tissues and 86 other tissues (GSE7307 (ref. 66)) werecompared using a method developed by Raychaudhuri et al.67. A total of 2,577genes were identified as Brain preferentially expressed with Po0.01 and 46 ASINpreys overlapped with this list. Post-synaptic density genes from the human
neocortex (hPSD) (a total of 1459) were obtained from Bayes et al.68 and 28 ASINpreys overlapped with this list. To annotate ASIN preys as FRMP-binding target,genes that are FMRP RNA targets in the mouse brain polyribosomes (a total of839) were obtained from Darnell et al.69, and human orthologs of mouse geneswere mapped using Mammalian Orthology from the Mouse Genome Informatics.
References1. Iossifov, I. et al. De novo gene disruptions in children on the autistic spectrum.
Neuron 74, 285–299 (2012).2. Neale, B. M. et al. Patterns and rates of exonic de novo mutations in autism
spectrum disorders. Nature 485, 242–245 (2012).3. O’Roak, B. J. et al. Sporadic autism exomes reveal a highly interconnected
protein network of de novo mutations. Nature 485, 246–250 (2012).4. Sanders, S. J. et al. De novo mutations revealed by whole-exome sequencing are
strongly associated with autism. Nature 485, 237–241 (2012).5. Sebat, J. et al. Strong association of de novo copy number mutations with
autism. Science 316, 445–449 (2007).6. Levy, D. et al. Rare de novo and transmitted copy-number variation in autistic
spectrum disorders. Neuron 70, 886–897 (2011).7. Sanders, S. J. et al. Multiple recurrent de novo CNVs, including duplications of
the 7q11.23 Williams syndrome region, are strongly associated with autism.Neuron 70, 863–885 (2011).
8. Wang, K. et al. Common genetic variants on 5p14.1 associate with autismspectrum disorders. Nature 459, 528–533 (2009).
9. Weiss, L. A., Arking, D. E., Daly, M. J. & Chakravarti, A. A genome-widelinkage and association scan reveals novel loci for autism. Nature 461, 802–808(2009).
10. Anney, R. et al. A genome-wide scan for common alleles affecting risk forautism. Hum. Mol. Genet. 19, 4072–4082 (2010).
11. Berg, J. M. & Geschwind, D. H. Autism genetics: searching for specificity andconvergence. Genome. Biol. 13, 247 (2012).
12. Voineagu, I. et al. Transcriptomic analysis of autistic brain reveals convergentmolecular pathology. Nature 474, 380–384 (2011).
13. Ben-David, E. & Shifman, S. Networks of neuronal genes affected by commonand rare variants in autism spectrum disorders. PLoS Genet. 8, e1002556(2012).
14. Pinto, D. et al. Functional impact of global rare copy number variation inautism spectrum disorders. Nature 466, 368–372 (2010).
15. Gilman, S. R. et al. Rare de novo variants associated with autism implicate alarge functional network of genes involved in formation and function ofsynapses. Neuron 70, 898–907 (2011).
16. Gai, X. et al. Rare structural variation of synapse and neurotransmission genesin autism. Mol. Psychiatry 17, 402–411 (2012).
17. Sakai, Y. et al. Protein interactome reveals converging molecular pathwaysamong autism disorders. Sci. Transl. Med. 3, 86ra49 (2011).
18. Noh, H. J. et al. Network topologies and convergent aetiologies arising fromdeletions and duplications observed in individuals with autism. PLoS Genet.9, e1003523 (2013).
19. Cusick, M. E. et al. Literature-curated protein interaction datasets. Nat.Methods 6, 39–46 (2009).
20. Zhang, Q. C. et al. Structure-based prediction of protein-protein interactions ona genome-wide scale. Nature 490, 556–560 (2012).
21. Wang, E. T. et al. Alternative isoform regulation in human tissuetranscriptomes. Nature 456, 470–476 (2008).
22. Pan, Q., Shai, O., Lee, L. J., Frey, B. J. & Blencowe, B. J. Deep surveying ofalternative splicing complexity in the human transcriptome by high-throughputsequencing. Nat. Genet. 40, 1413–1415 (2008).
23. Lim, J. et al. A protein-protein interaction network for human inherited ataxiasand disorders of Purkinje cell degeneration. Cell 125, 801–814 (2006).
24. Goehler, H. et al. A protein interaction network links GIT1, an enhancerof huntingtin aggregation, to Huntington’s disease. Mol. Cell 15, 853–865(2004).
25. Camargo, L. M. et al. Disrupted in Schizophrenia 1 Interactome: evidence forthe close connectivity of risk genes and a potential synaptic basis forschizophrenia. Mol. Psychiatry 12, 74–86 (2007).
26. Salehi-Ashtiani, K. et al. Isoform discovery by targeted cloning, ‘deep-well’pooling and parallel sequencing. Nat. Methods 5, 597–600 (2008).
27. Yang, X. et al. A public genome-scale lentiviral expression library of humanORFs. Nat. Methods 8, 659–661 (2011).
28. Eyckerman, S. et al. Design and application of a cytokine-receptor-basedinteraction trap. Nat. Cell Biol. 3, 1114–1119 (2001).
29. Venkatesan, K. et al. An empirical framework for binary interactome mapping.Nat. Methods 6, 83–90 (2009).
30. Arabidopsis Interactome Mapping Consortium. Evidence for network evolutionin an Arabidopsis interactome map. Science 333, 601–607 (2011).
31. Christofk, H. R. et al. The M2 splice isoform of pyruvate kinase is important forcancer metabolism and tumour growth. Nature 452, 230–233 (2008).
32. Marshall, C. R. et al. Structural variation of chromosomes in autism spectrumdisorder. Am. J. Hum. Genet. 82, 477–488 (2008).
33. Hibino, H. et al. RIM binding proteins (RBPs) couple Rab3-interactingmolecules (RIMs) to voltage-gated Ca2þ channels. Neuron 34, 411–423 (2002).
34. Bucan, M. et al. Genome-wide analyses of exonic copy number variants in afamily-based study point to novel autism susceptibility genes. PLoS Genet. 5,e1000536 (2009).
35. Michaelson, J. J. et al. Whole-genome sequencing in autism identifies hot spotsfor de novo germline mutation. Cell 151, 1431–1442 (2012).
36. Sebat, J., Levy, D. L. & McCarthy, S. E. Rare structural variants inschizophrenia: one disorder, multiple mutations; one mutation, multipledisorders. Trends Genet. 25, 528–535 (2009).
37. Malhotra, D. & Sebat, J. CNVs: harbingers of a rare variant revolution inpsychiatric genetics. Cell 148, 1223–1241 (2012).
38. Smoller, J. W. et al. Identification of risk loci with shared effects on five majorpsychiatric disorders: a genome-wide analysis. Lancet 381, 1371–1379 (2013).
39. Lee, S. H. et al. Genetic relationship between five psychiatric disordersestimated from genome-wide SNPs. Nat. Genet. 45, 984–994 (2013).
40. Zweier, C. et al. Haploinsufficiency of TCF4 causes syndromal mentalretardation with intermittent hyperventilation (Pitt-Hopkins syndrome). Am. J.Hum. Genet. 80, 994–1001 (2007).
41. Hamdan, F. F. et al. Parent-child exome sequencing identifies a de novotruncating mutation in TCF4 in non-syndromic intellectual disability. Clin.Genet. 83, 198–200 (2012).
42. Need, A. C. et al. Clinical application of exome sequencing in undiagnosedgenetic conditions. J. Med. Genet. 49, 353–361 (2012).
43. Talkowski, M. E. et al. Sequencing chromosomal abnormalities revealsneurodevelopmental loci that confer risk across diagnostic boundaries. Cell 149,525–537 (2012).
44. Stefansson, H. et al. Common variants conferring risk of schizophrenia. Nature460, 744–747 (2009).
45. Steinberg, S. et al. Common variants at VRK2 and TCF4 conferring risk ofschizophrenia. Hum. Mol. Genet. 20, 4076–4081 (2011).
46. Mowat, D. R., Wilson, M. J. & Goossens, M. Mowat-Wilson syndrome. J. Med.Genet. 40, 305–310 (2003).
47. Need, A. C. et al. A genome-wide investigation of SNPs and CNVs inschizophrenia. PLoS Genet. 5, e1000373 (2009).
48. Hannes, F. D. et al. Recurrent reciprocal deletions and duplications of 16p13.11:the deletion is a risk factor for MR/MCA while the duplication may be a rarebenign variant. J. Med. Genet. 46, 223–232 (2009).
49. Ullmann, R. et al. Array CGH identifies reciprocal 16p13.1 duplications anddeletions that predispose to autism and/or mental retardation. Hum. Mutat. 28,674–682 (2007).
50. Williams, N. M. et al. Rare chromosomal deletions and duplications inattention-deficit hyperactivity disorder: a genome-wide analysis. Lancet 376,1401–1408 (2010).
51. Mefford, H. C. et al. Genome-wide copy number variation in epilepsy: novelsusceptibility loci in idiopathic generalized and focal epilepsies. PLoS Genet. 6,e1000962 (2010).
52. Wu, T. D. & Watanabe, C. K. GMAP: a genomic mapping and alignmentprogram for mRNA and EST sequences. Bioinformatics 21, 1859–1875 (2005).
53. Li, H. et al. The Sequence Alignment/Map format and SAMtools.Bioinformatics 25, 2078–2079 (2009).
54. Ewing, B., Hillier, L., Wendl, M. C. & Green, P. Base-calling of automatedsequencer traces using phred. I. Accuracy assessment. Genome Res. 8, 175–185(1998).
55. Huang, X. & Madan, A. CAP3: A DNA sequence assembly program. GenomeRes. 9, 868–877 (1999).
56. Temple, G. et al. The completion of the Mammalian Gene Collection (MGC).Genome Res. 19, 2324–2333 (2009).
57. Lamesch, P. et al. hORFeome v3.1: a resource of human open reading framesrepresenting over 10,000 human genes. Genomics 89, 307–315 (2007).
58. Dreze, M. et al. High-quality binary interactome mapping. Methods Enzymol.470, 281–315 (2010).
59. Yu, H. et al. Next-generation sequencing to generate interactome datasets.Nat. Methods 8, 478–480 (2011).
60. Braun, P. et al. An experimentally derived confidence score for binary protein-protein interactions. Nat. Methods 6, 91–97 (2009).
61. Wang, J. Z., Du, Z., Payattakool, R., Yu, P. S. & Chen, C. F. A new method tomeasure the semantic similarity of GO terms. Bioinformatics 23, 1274–1281(2007).
62. Kuang, X. et al. DOMMINO: a database of macromolecular interactions.Nucleic Acids Res. 40, D501–D506 (2012).
63. Eswar, N. et al. Comparative protein structure modeling using MODELLER.Curr. Protoc. Bioinformatics Chapter 5, Unit 5. 6 (2006).
64. Zhang, B. & Horvath, S. A general framework for weighted gene co-expressionnetwork analysis. Stat. Appl. Genet. Mol. Biol. 4, Article 17, 1544–6115, (2005).
65. Horvath, S. et al. Analysis of oncogenic signaling networks in glioblastomaidentifies ASPM as a molecular target. Proc. Natl Acad. Sci. USA 103,17402–17407 (2006).
66. Roth, R. B. et al. Gene expression analyses reveal molecular relationshipsamong 20 regions of the human CNS. Neurogenetics 7, 67–80 (2006).
67. Raychaudhuri, S. et al. Accurately assessing the risk of schizophrenia conferredby rare copy-number variation affecting genes with brain function. PLoS Genet.6, e1001097 (2010).
68. Bayes, A. et al. Characterization of the proteome, diseases and evolution of thehuman postsynaptic density. Nat. Neurosci. 14, 19–21 (2011).
69. Darnell, J. C. et al. FMRP stalls ribosomal translocation on mRNAs linked tosynaptic function and autism. Cell 146, 247–261 (2011).
AcknowledgementsWe thank all members of the DFCI Center for Cancer Systems Biology (CCSB) forhelpful discussions throughout the course of this project. We also thank Dr JosephGleeson for valuable comments on the manuscript, the members of Dr Sebat laboratoryfor helpful discussions and Abhishek Bhandari, Ashleigh Schaffer and Naiara Akizu fortechnical assistance. This work was supported by NIH grants ARRA R01HD065288 fromNICHD to L.M.I and K.S.-A. and by R01MH091350 from NIMH to L.M.I. and T.H.,R01HG001715 from NHGRI to M.V., D.E.H., F.P.R. and J.T.; by The Ellison Foundation,Boston, MA to M.V.; by Institute Sponsored Research funds from the Dana-FarberCancer Institute Strategic Initiative to M.V.; by NIH (MH076431) and the SimonsFoundation Autism Research Initiative (275724) to J.S.; by a Canadian Institute forAdvanced Research Fellowship and the Canada Excellence Research Chairs Program toF.P.R. and by National Science Foundation grants DBI-0845196 and IOS-1126992 toD.K. I.L. is a postdoctoral fellow with the Fonds voor Wetenschappelijk Onderzoek-Vlaanderen (FWO). M.V. is a ‘‘Chercheur Qualifie Honoraire’’ from the Fonds de laRecherche Scientifique (FRS-FNRS, Wallonia-Brussels Federation, Belgium).
Authors contributionsL.M.I., K.S.-A., M.V. and T.H. conceived the study and designed the experiments andanalyses. R.C., X.Y., G.N.L. and S.K. performed the majority of the experiments andnetwork analyses. Y.S., L.G., M.B., M.R., S.T., S.A.T., C.F., S.Y., M.A.C participated in thehigh-throughput splicing isoforms cloning and Y2H screens. I.L. and J.T. performed andanalysed MAPPIT experiments. M.T. and F.P.R. contributed to data analysis. X.K., N.Z.and D.K. performed structural analyses. D.M., J.J.M., V.V., S.H. and J.S. contributed togenetic and expression network analyses. D.E.H., T.H., M.V. and L.M.I. codirected theproject. All authors discussed the results. R.C., G.N.L., X.Y., M.V. and L.M.I. wrote themanuscript.
Additional informationAccession codes: Isoform nucleotide sequences have been deposited in GenBank underthe accession codes KJ534756 to KJ535094, and in the National Database for AutismResearch NDAR (dataset ID: NDARCOL0001401).
Supplementary Information accompanies this paper at http://www.nature.com/naturecommunications
Competing financial interests: The authors declare no competing financial interests.
Reprints and permission information is available online at http://npg.nature.com/reprintsandpermissions/
How to cite this article: Corominas, R. et al. Protein interaction network of alternativelyspliced isoforms from brain links genetic risk factors for autism. Nat. Commun. 5:3650doi: 10.1038/ncomms4650 (2014).
This work is licensed under a Creative Commons Attribution-NonCommercial-ShareAlike 3.0 Unported License. The images or
other third party material in this article are included in the article’s Creative Commonslicense, unless indicated otherwise in the credit line; if the material is not included underthe Creative Commons license, users will need to obtain permission from the licenseholder to reproduce the material. To view a copy of this license, visit http://creativecommons.org/licenses/by-nc-sa/3.0/


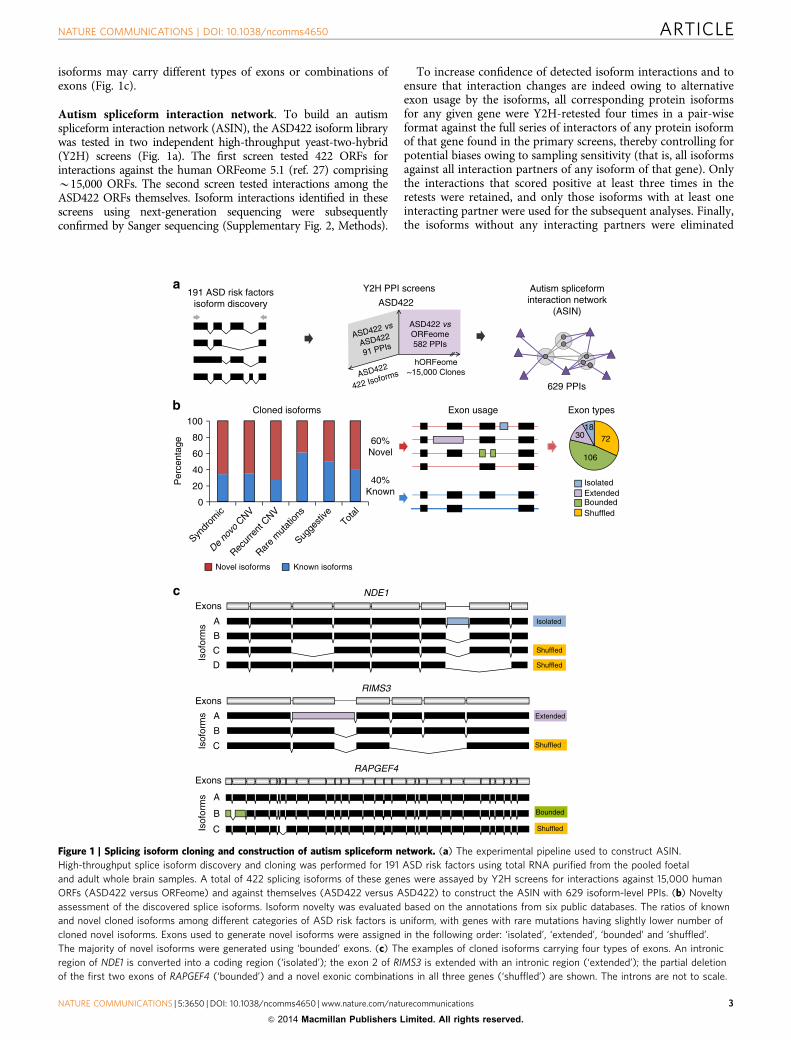

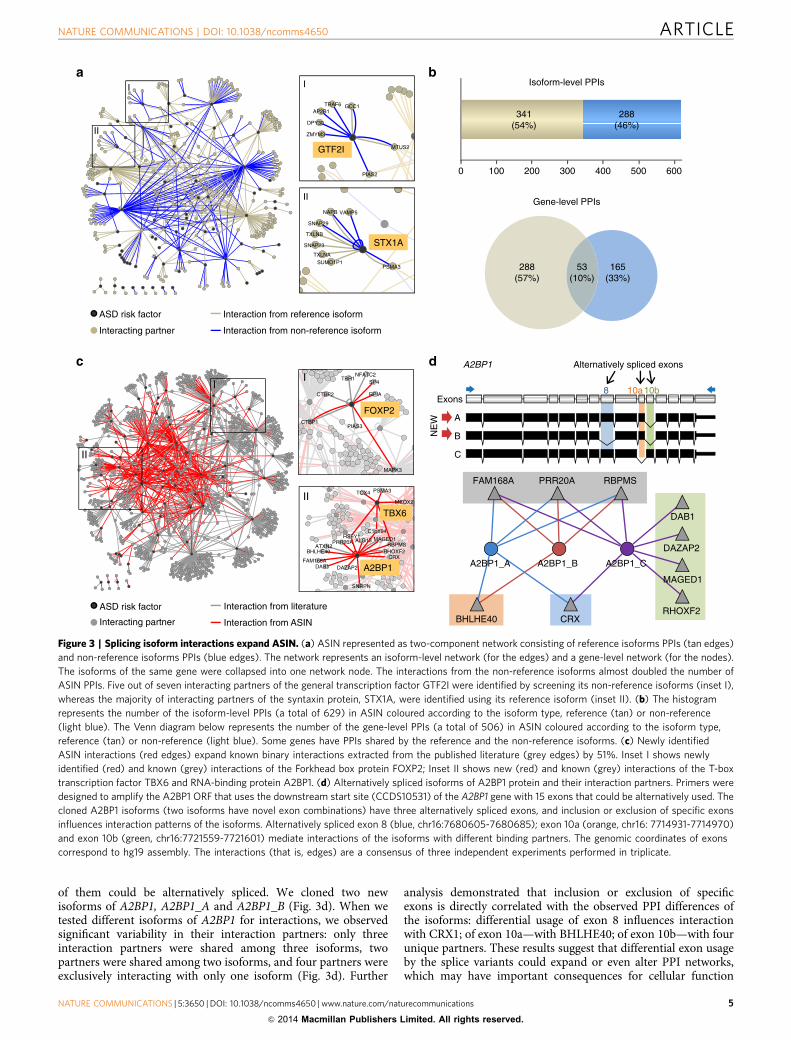


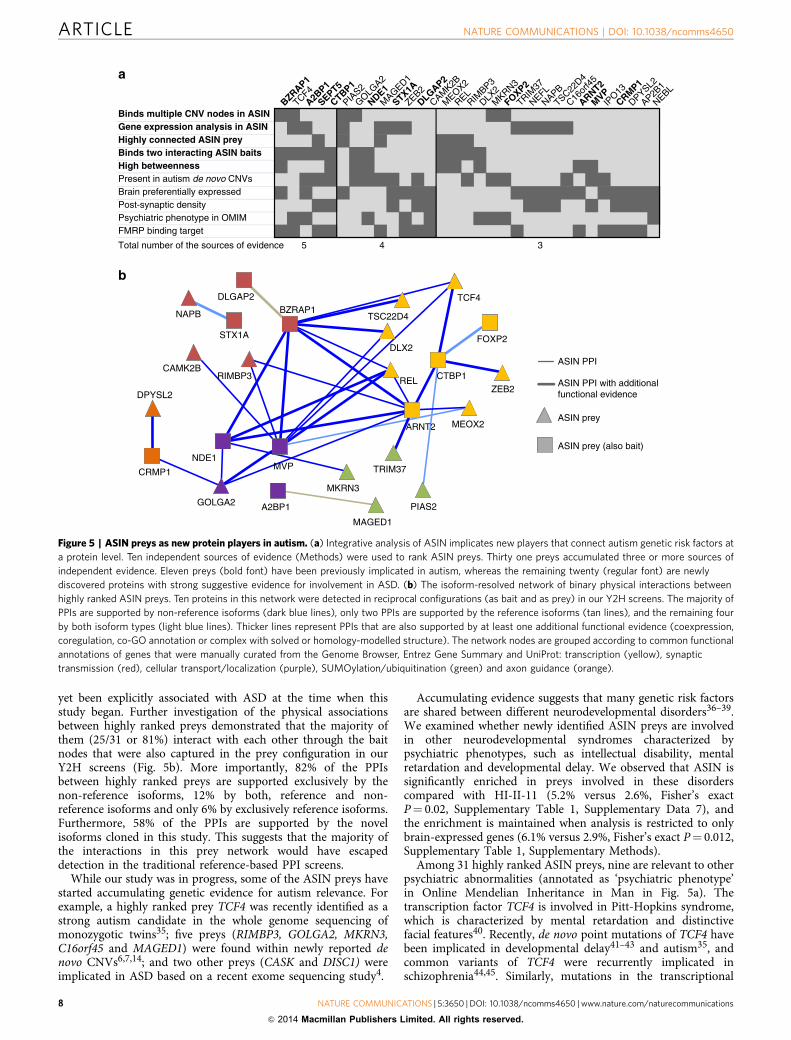


![Welcome [sd44bridge.com] · Spliced Precast Concrete Girder—Constant Depth Virtual rendering of a variable depth spliced precast ... The Four Bears Bridge in North Dakota is an](https://static.documents.pub/doc/80x56/5fe6a8cb1e8b9839ab5ab9ee/welcome-spliced-precast-concrete-girderaconstant-depth-virtual-rendering-of.jpg)


