Band Assignment in Hemoglobin Porphyrin Ring Spectrum: Using Four-Orbital Model of Gouterman
Mohammad Reza Dayer1,*; Ali Akbar Moosavi-Movahedi
2 and Mohammad Saaid Dayer
3
1Department of Biology, Faculty of Sciences, Shahid Chamran University of Ahvaz, Ahvaz, Iran;
2Institute of Biochemis-
try and Biophysics, University of Tehran, Tehran, Iran; 3Department of Parasitology and Medical Entomology, Tarbiat
Modares University, Tehran, Iran
Abstract: Band assignment for oxy, deoxy and methemoglobin using orbital promotion is crucial to understanding
inter-relation of electronic transitions. Spectral changes may be correlated with conformational alterations. Confor-
mational changes of hemoglobin were interpreted using four-orbital model of Gouterman. Our results indicated that
Goutherman model can predict the predominant conformations of hemoglobin.
Keywords: Porphyrin, Hemoglobin spectrum, Gouterman model, Band assignment
INTRODUCTION
The porphyrin molecule is a 24-member ring with 11 conjugated and delocalized double bonds. The electronic absorption spectrum of porphyrin ring shows several transi-tions: Q-band in visible region (490-650 nm), Soret or B band in near-UV (400-436 nm), N, L and M bands in deep UV regions (200-350 nm). In four-orbital model of Martin-Gouterman, Q-band and Soret bands are interpreted as electron transitions [1-10]. In Gouterman model these bands are considered as electronic transitions from two HOMO orbitals (Highest Occupied Molecular Orbital), a1u ( ) and a2u ( ), to two LUMO orbitals (lowest Unoccupied Molecu-lar Orbital), e.g. ( ) orbitals [3-5, 11]. A weak transition from ground state S0 to the first excited state S1 results in four Q-bands with weak intensity. The strong transition from ground state or S0 to the second excited state S2, yields Soret band, with strong intensity [8-9]. Further studies of molecu-lar fluorescence of porphyrins showed that there is another transition at about 630 nm, which is considered as n transition [8, 10-14]. Metal ions like Fe
+2, Zn
+2, Cu
+2 and
Co+2
can be inserted in the center of porphyrin ring via ac-cepting lone pairs electrons of nitrogen atoms, forming met-alloporphyrin. Metalloporphyrin formation blocks n transition and omits the 630 nm band. Four Q-bands of free or porphyrins changed to two bands, and bands, in case of metallation [11, 15]. The Q-bands of porphyrins is sensi-tive to the changes exerted by surroundings, probably through internal nitrogens of porphyrin heterocycle, so Q-band splitting pattern can be considered as an indicator for the interactions between the surroundings and the porphyrin rings [16-24]. The spectrum of normal oxy hemoglobin mim-ics that’s of metalloporphyrins. The first transition in hemo-globin produces Q-bands, band at about 560 nm and band at about 528 nm. The second transition produces B-band or Soret band at about 422 nm. The molecular interpret-
*Address correspondence to this author at the Department of Biology, Fac-
ulty of Sciences, Shahid Chamran University of Ahvaz, Ahvaz, Iran; Tel: +98611-3331045; Fax: +98611-3331045; E -mail: [email protected]
tation of spectral changes in hemoglobin spectra in different physiological and pathological conditions e.g. deoxygenation and oxidation taking in account the conformational changes in globin structure and d orbital hybridization through bands assigning, is not well understood yet. In the present work, using absorption spectra of oxy, deoxy and met-hemoglobin and present a precise model by which the hemoglobin spec-trum could be interpreted in deferent conditions. The gradual alteration in hemoglobin structure also could be followed by this model by a simple absorption spectrum.
METHODS AND MATERIALS
Sodium n-dodecyl sulfate (especially pure grade) was obtained from Sigma. CM-Sephadex and Sephadex G-25 were obtained from Pharmacia fine chemicals. Other rea-gents were of analytical grade. All solutions were prepared with double distilled water.
Hemoglobin Preparation
Human adult hemoglobin (HbA) was prepared from hu-man red blood cells of healthy donors according to the method of Williams et al. [25] and stripped of anions accord-ing to the procedure reported by Riggs [26]. The heparinized blood was washed twice with ten volumes of isotonic saline. The washed, packed cells were lysed with an equal volume of deionized water. The stroma was removed after 1 hour at 0˚C by centrifugation at 10,000 rpm for 25 min. The solution was applied to a Sephadex G-25 column (1.5 45 cm) equili-brated with 0.1 M phosphate buffer pH 7.0. Elution was car-ried out with 0.1 M phosphate buffer pH 7.0 at a flow rate of 25 ml per hours [27]. CM-Sephadex cation exchanger at pH 6.5 was used for further purification of human adult hemo-globin.
Preparation of Hemoglobin Variants:
Fresh human hemoglobin samples equilibrated with air were used as oxy hemoglobin [25]. Deoxy hemoglobin was prepared by addition of enough dithionite to the fresh hemo-
744 Protein & Peptide Letters, 2010, Vol. 17, No. 4 Dayer et al.
globin samples [25]. Cyanomet hemoglobin was prepared by addition of Drabkin's solution to oxy hemoglobin samples [25].
Spectroscopy Experiments
The method of Benesch, et al. [28] was used with minor modifications of equations at pH 7.0. The concentrations of oxy-, deoxy- and met- forms of hemoglobin were determined using a Shimadzu model UV-3100 (Japan) spectrophotome-ter and a thermostatically controlled cell compartment with Haak D8 water bath.
RESULTS AND DISCUSSION:
This paper aimed at understanding the species of hemo-globin through studying the hemoglobin spectra at different conditions, trying to interpret the electronic transitions ac-cording to tertiary structure of hemoglobin, and assigning the absorption bands to these transitions in oxy, deoxy and met conformations of hemoglobin. The visible spectra of hemo-globin originated from electronic transitions of porphyrin ring were studied. It is found that the ligand binding to he-moglobin and the surrounding environment affect the spec-trum pattern.
Visible Spectrum of Porphyrin Ring
Table 1a and Table 1b summarize Soret band, Q-bands (bands I to IV) and n * band wavelengths and mean val-ues for different porphyrins used by Dinello and Chang [19]. Clearly almost all porphyrins show a Soret band in 400-436 nm range with a mean wavelength of 413 nm, four Q-bands include band IV in 497-526 nm range with mean of 504 nm, band III in 532-563 nm range with a mean wavelength of 540 nm, band II in 566-595 nm range with a mean wave-length of 574 nm and band I in 593-650 nm range with a mean wavelength of 596 nm and finally n * transition in 620-630 nm range with a mean wavelength of 623 nm. Fur-thermore, Table 1c shows the collection of epsilon (molar
extinction coefficient) values for four bands of porphyrin studied by Dinello and Chang [19]. Band I among the Q-bands of different porphyrins, has the lowest epsilon value that could be the reason behind its absence from some por-phyrins spectrum (see Table 1c).
Ferrous Ion Binding to Porphyrin Ring
As shown in Table 1d, the binding of Fe+2
to porphyrin ring exerted vast alterations in absorption spectrum of por-phyrin. First of all, as depicted in Scheme 1, Fe
+2 with filled
d orbitals contributed a significant metal d to porphyrin * orbital interaction (metal to ligand back bonding), increasing the energy gap between and * orbital and causing blue shift in porphyrin * transitions both in Soret and Q-bands. In the reverse experiment showed in Fig. (1), using Drabkin's solution to oxidizing ferrous ions caused red shift in Soret band, alike the conversion of metalloporphyrin to free porphyrin and may infer to the release of ferric ion from heme. Second, Table 1d shows that metal binding was fol-lowed by combination of the four split Q-bands to emerge into two bands, namely and bands, which means the blockage nitrogen protonation in following the porphyrin metallation. Fig. (1) curve c depicts the appearance of three Q-bands (except band I) in the presence of Drabkin's solu-tion. Third, Table 1d indicates that the n * transition at about 630 nm was absent in metalloporphyrins in contrast to metalloporphyrins at Table 1a, because of a participation of lone pair electrons of nitrogen atoms in covalent bonding with ferrous ion and as shown in Fig. (1). This band is gradually appeared after ferrous oxidation by Drabkin's solu-tion. The presence or absence of n * band at about 630 nm may be used as a criterion for the conversion of the spec-troscopic properties of metalloporphyrin to free porphyrin.
Effect of Ferricyanide on Hemoglobin Spectrum
In this study, Drabkin's reagent was used for hemoglobin oxidation. As shown in Fig. (1), the intensity of and bands decreased with increasing the Drabkin's solution con-
Table 1a. Q-Bands I to IV, Wavelengths for Different Porphyrins Studied by Dinello and Chang
Porphyrin Substrates Band IV (nm) Band III(nm) Band II(nm) Band I (nm)
A.protoporphyrin 506 541 576 605
B.Deuteroporphyrin 497 539 566 593
C.Hematoporphyrin 499.5 532 569.2 596
D. Mesoporphyrin 498 532 567 595
E. Diacetyldeuteroporphyrin 517 552 587 No Band
F. Diformyldeutroporphyrin 526 562 595 No Band
H. porphyrin c 504 538 570 No Band
J. Uroporphyrin I and III 502 536 572 No Band
K. Coproporphyrin I and III 498 532 566 594
L.Pemptoporphyrin 502 536 572 No Band
Band Assignment in Hemoglobin Porphyrin Ring Spectrum Protein & Peptide Letters, 2010, Vol. 17, No. 4 475
Table 1b. Soret Band, Q-bands (bands I to IV) and n * Band's Mean Values for Different Free Porphyrins Studied by Dinello
and Chang
Band type Absorption wavelength (nm) Mean wavelength (nm)
Soret Band 400-436 413.2
Band IV 497-526 504.9
Band III 532-563.5 540
Band II 566-595 574
Band I 593-650.5 596.6
n * 620-631 623.2
Table 1c. Collection (Molar Extinction Coefficient) Values for four Q Bands of Different Free Porphyrins Studied by Dinello and
Chang
10-3
M-1
cm-1
Porphyrin substrates
Band IV Band III Band II Band I
A.protoporphyrin 14.89 11.87 7.48 2
B.Deuteroporphyrin 14.5 7.84 6.32 1.32
C.Hematoporphyrin 14.7 9.04 6.57 1.26
D. Mesoporphyrin 14.37 10 6.92 1.68
E. Diacetyldeuteroporphyrin 13.3 7.3 6.1 No Band
F. Diformyldeutroporphyrin 12.6 7.7 6.48 No Band
H. porphyrin c 12.1 8.4 6.2 No Band
J. Uroporphyrin I and III 15.8 9.35 6.85 No Band
K. Coproporphyrin I and III 14.34 9.92 7.13 1.48
L.Pemptoporphyrin 13.65 10.4 6.45 No Band
Table 1d. Soret, Alpha and Beta Band's Mean Values for Different Metalloporphyrins Studied by Dinello and Chang
Metalloporphyrin(Fe+2
) Absorption wavelength (nm) Mean wavelength (nm)
Soret Band 405.5-450 422.3
Beta Band 514-549.5 528.1
Alpha Band 544-586.5 560.1
centration and gradually changed to four Q-bands, I to IV at about 596.6 nm, 574 nm, 504.9 nm and 450 nm respectively and n * band at about 623.2 nm. However, at higher con-centration, because of close proximity of band I (597 nm) and n * band (630 nm), the latter band with strong inten-sity overlapped band I with lower intensity, hence its disap-pearance in free heme rings.
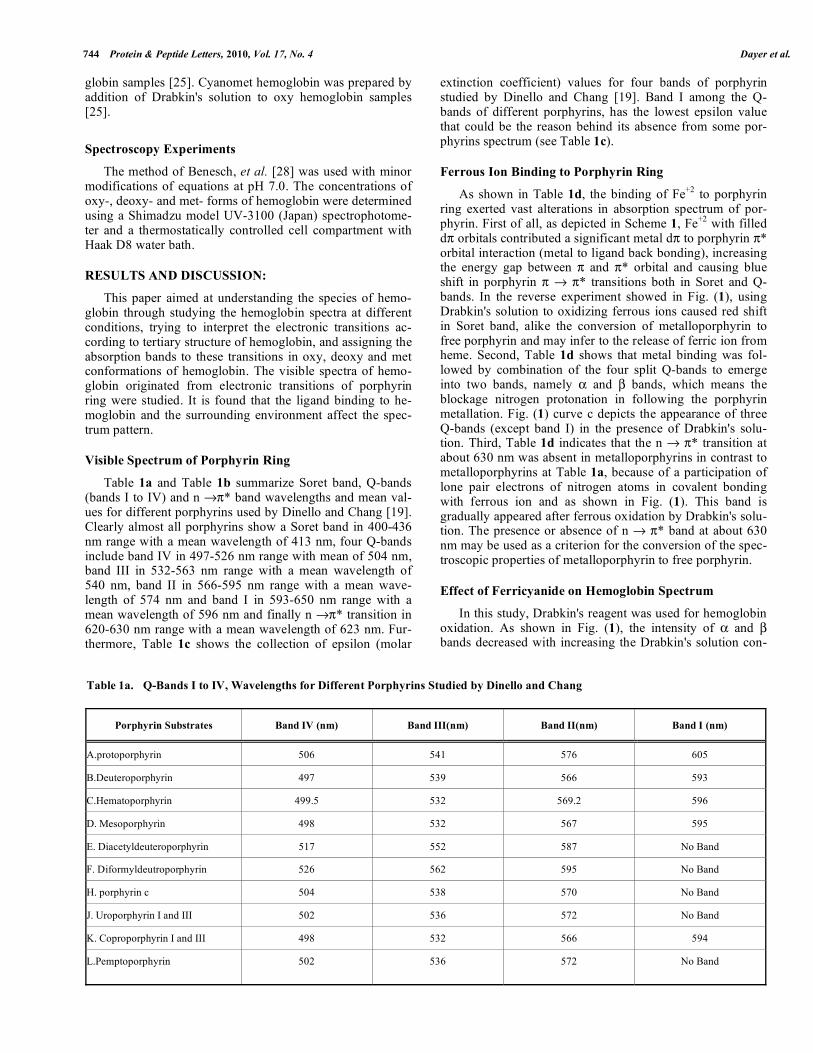
Effect of Acidic pH on Hemoglobin Spectrum
Increasing proton (H+) concentration via affecting hemo-
globin conformation, facilitated the release of oxygen from
hemoglobin and converted oxy to deoxy conformation. Thus, typical spectrum of deoxy hemoglobin may be obtained in acidic condition. Moreover, at more prolonged acidic condi-tions the internal nitrogen atoms of heme ring become proto-nated. The protonation of heme ring led to release of Fe
+2
ion, hence the formation of typical free porphyrin spectrum, with a Soret band, four Q-band and a band at 630 nm, as shown in Fig. (2). To magnifying the small bands the absor-bance difference is drawn instead of simple absorbance against wavelength in Fig. (2). There are two transitions at pH 7 and pH 6 in Q-band region in accordance with normal
476 Protein & Peptide Letters, 2010, Vol. 17, No. 4 Dayer et al.
oxy hemoglobin. At pH 5 the two transitions changed to four bands which shows the release of Fe
+2 from heme ring.
Scheme 1.
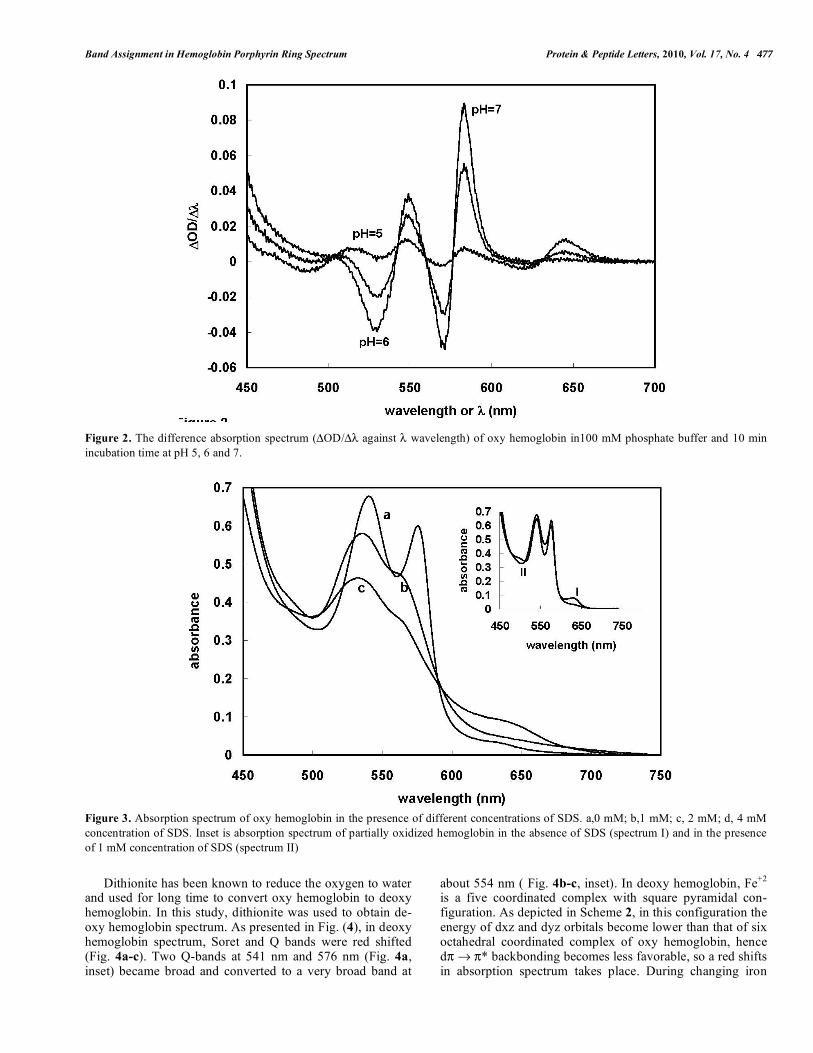
Effect of Sodium Dedecyl Sulfate on Hemoglobin Spec-trum
Sodium dodecyl sulfate (SDS) is an anionic detergent which can denature hemoglobin at > 2 mM concentrations. As already reported [29] 1 mM concentration of SDS, at pH 7, folds the hemoglobin to more compacted deoxy conforma-tion. This effect of SDS is because of repulsive forces be-tween the negatively charged hemoglobin at pH 7 and the negatively charge of SDS. Fig. (3) shows the effect of 1-4 mM concentrations of SDS on UV-Vis spectrum of hemo-
globin. Using the Eq (1) [30] to calculate the oxy, deoxy and met hemoglobin concentrations, we indicated that the deoxy conformation of hemoglobin was the prevalent species at 1 mM concentration of SDS.
[Oxy] = (1.0154A576 0.2772A630 0.742A560) 10-4
[Deoxy] = (1.357A560 0.7376A576 0.6254A630) 10-4
[Met] = (2.6829A630 + 0.174A576 0.3614A560) 10-4
Equation (1)
A small band at 630 nm in HbA sample, inset of Fig. (3), curve I, shows that some populations of oxidized hemoglo-bin are present. The folding effect of SDS in 1 mM concen-tration pushed Fe
+2 ions from out of plane to ring plane as
reported previously [29]. This condition increases the reduc-tion potential of Fe
+3 ions reducing it to Fe
+2 ions via water
oxidation. The n * transition in 1mM concentration of SDS was not observed, inset of Fig. (3), curve II. More in-crease in SDS concentration caused denaturation of hemo-globin protein resulting Fe
+2 settled out of plane (see Fig. 3
curves a to c). This claim is supported by blue shifts in Q and Soret bands (data not shown) and by changing and bands to four bands and the gradual appearance of n * transition in high concentration of SDS.
Effect of Dithionite on Hemoglobin Spectrum
It was shown that in Hypsoporphyrins - open-shell metal-loporphyrins with d
m orbitals (m=6-9 electrons like Fe
+2 with
6 electrons)- d * backbonding increases the energy gap between and * orbitals energy causing blue shift in ab-sorption spectrum (see Scheme 1).
Figure 1. The absorption spectrum of oxy hemoglobin in the presence of different concentrations of Drabkin's solution. Inset shows the red
shift in Soret band in the presence of Drabkin's solution. a, 0 mM; b, 0.5 mM and c, 1.5 mM concentration of Drabkin's solution.
Porphyrin Metal
dxy
dxz, dyz
d
dx2
dx2-y2
Band Assignment in Hemoglobin Porphyrin Ring Spectrum Protein & Peptide Letters, 2010, Vol. 17, No. 4 477
Figure 2. The difference absorption spectrum ( OD/ against wavelength) of oxy hemoglobin in100 mM phosphate buffer and 10 min
incubation time at pH 5, 6 and 7.
Figure 3. Absorption spectrum of oxy hemoglobin in the presence of different concentrations of SDS. a,0 mM; b,1 mM; c, 2 mM; d, 4 mM
concentration of SDS. Inset is absorption spectrum of partially oxidized hemoglobin in the absence of SDS (spectrum I) and in the presence
of 1 mM concentration of SDS (spectrum II)
Dithionite has been known to reduce the oxygen to water and used for long time to convert oxy hemoglobin to deoxy hemoglobin. In this study, dithionite was used to obtain de-oxy hemoglobin spectrum. As presented in Fig. (4), in deoxy hemoglobin spectrum, Soret and Q bands were red shifted (Fig. 4a-c). Two Q-bands at 541 nm and 576 nm (Fig. 4a, inset) became broad and converted to a very broad band at
about 554 nm ( Fig. 4b-c, inset). In deoxy hemoglobin, Fe+2
is a five coordinated complex with square pyramidal con-figuration. As depicted in Scheme 2, in this configuration the energy of dxz and dyz orbitals become lower than that of six octahedral coordinated complex of oxy hemoglobin, hence d * backbonding becomes less favorable, so a red shifts in absorption spectrum takes place. During changing iron
478 Protein & Peptide Letters, 2010, Vol. 17, No. 4 Dayer et al.
configuration, from octahedral to square pyramidal, a grad-ual moving of Fe
+2 ions from inside to outside of ring, be-
cause of the absence of the sixth ligand, makes different con-formational populations with differently positioned Fe
+2 ions.
This phenomenon produces different electronic transitions with slightly different energy causing broadened and over-lapped and bands. This broadening effect is because of oxidation and out going of Fe
+2 in the presence of oxidant
like Drabkin's solution (Fig. 1).
Scheme 2.
CONCLUSION
In biochemical studies, band assignment and interpreta-tion of band changes in physiologically functioning hemo-globin is important for assessment and validation of the ac-cepted models. In this work, oxygenation, deoxygenation and oxidation of hemoglobin were thoroughly studied via absorption spectrum analysis. The collected data was found to be in conformity with others works, indicating that the
hemoglobin absorption spectrum in the range of 350-700 nm could be simply interpreted using the four-orbital model of Gouterman. Our data shows that there are three bands in fully oxygenated hemoglobin, Soret band at about 422 nm, beta band at 540 nm and alpha band at 576 nm. We suggest that deoxygenation of hemoglobin may change the confor-mation of Fe
+2 d-orbitals from octahedral to square pyrami-
dal leading which is weakening of d * backbonding. As shown in Scheme 2, this changes caused a decrease in energy gap between dxy and * orbitals and induced a red shift in absorption spectrum. Moreover, the two bands and changed to a broad band with a maximum at 554 nm. It is well known that there is a slight movement of ferrous ions inside and outside the heme ring upon oxygenation and de-oxygenation respectively. Gradual outside going of Fe
+2 on
deoxygenation produces different populations of hemoglobin with different position of ferrous ions and makes different electronic transitions with slight deference in energy. This may be the cause of broad bands. In met or cyanomethemo-globin, as shown in Fig. (1) at excess concentrations of ferri-cyanide (1.5mM), Fe
+2 went completely out of heme plane
and the spectrum resembled that of free porphyrin ring with a strong and red shifted Soret band at about 413 nm, four Q-bands in 495-650 nm range and n * band at 630 nm which overlapped band I of Q-bands. Finally, it can be con-cluded that conformational changes in hemoglobin during its physiological role are concomitant with band shift and changes in absorption spectrum. Moreover, our finding shows that band alterations upon hemoglobin conformational changes are exerted via axial bands of Fe
+2 ions and changes
the Fe+2
position, but not via heme ring members.
ACKNOWLEDGEMENT
The financial supports of Chamran University of Ahvaz, Research Council of University of Tehran and Iran National Science Foundation (INSF) are gratefully acknowledged.
Figure 4. Absorption spectrum of oxy hemoglobin in the presence of different concentrations of dithionite. a=0 mM, b=0.5 mM concentra-
tion and c=3 mM concentration of dithionite.
eg
t2g
dxz dyz
dxy
dz2
dx2-y2
octahedral square pyramidal
Band Assignment in Hemoglobin Porphyrin Ring Spectrum Protein & Peptide Letters, 2010, Vol. 17, No. 4 479
REFERENCES
[1] Yanhu, K.L.; Yao, W.J.; Luo, Y. Origin of the Q-band splitting in
the absorption spectra of aluminum phthalocyanine chloride. Chem. Phys. Lett., 2007,438, 36-40.
[2] Eaton, W.A.; Hofrichter, J. Polarized absorption and linear dichro-ism spectroscopy of hemoglobin. Methods Enzymol., 1981, 76,