Protein Purification Techniques Using the Intein Self-Cleaving Model Undergraduate Honors Research Thesis Submitted to the Engineering Honors Committee 119 Hitchcock Hall College of Engineering The Ohio State University Columbus, Ohio 43210 Presented in partial fulfillment of the requirements for the designation of “Honors Research Distinction” for the degree of Bachelor of Science in Chemical and Biomolecular Engineering in the College of Engineering at The Ohio State University By Hannah C. Zierden Bachelor of Science in Chemical and Biomolecular Engineering The Ohio State University 2015 Thesis Committee: Dr. David W. Wood, Advisor Dr. Andre Palmer Dr. Michael Paulaitis
Transcript
Protein Purification Techniques Using the Intein Self-Cleaving Model
Undergraduate Honors Research Thesis Submitted to the Engineering Honors Committee
119 Hitchcock Hall College of Engineering
The Ohio State University Columbus, Ohio 43210
Presented in partial fulfillment of the requirements for the designation of “Honors Research Distinction” for the degree of Bachelor of Science in Chemical and Biomolecular Engineering in
the College of Engineering at The Ohio State University
By Hannah C. Zierden
Bachelor of Science in Chemical and Biomolecular Engineering The Ohio State University
2015
Thesis Committee:
Dr. David W. Wood, Advisor
Dr. Andre Palmer
Dr. Michael Paulaitis
Copyright by Hannah Christine Zierden
2015
i
Abstract
A central step in the production of high purity recombinant proteins is their separation
and purification. Recombinant proteins are expressed in host cells from which they are
collected and purified. Purification is necessary to separate target recombinant proteins
from the unwanted contents of the host cells in which they are grown. Common methods
employ several chromatographic steps, which requires optimization, the use of expensive
resins, and large time investments.
Another category of purification utilizes affinity tag sequences. Within this realm,
affinity tags can be used in conjunction within the protein’s naturally occurring, self-
cleaving intein. Using the intein simplifies the purification into a one-step
chromatography purification. In this method, an affinity tag, characterized by its ability
to selectively bind to a specified resin, is fused to a target protein. This allows for the
protein to be selectively separated from unwanted proteins and cell debris. Then, a pH
shift induces the intein’s self-cleaving capabilities, and the target protein can be separated
from the resin and affinity tag.
Non-chromatographic affinity tags exist which eliminate the need for affinity resins. The
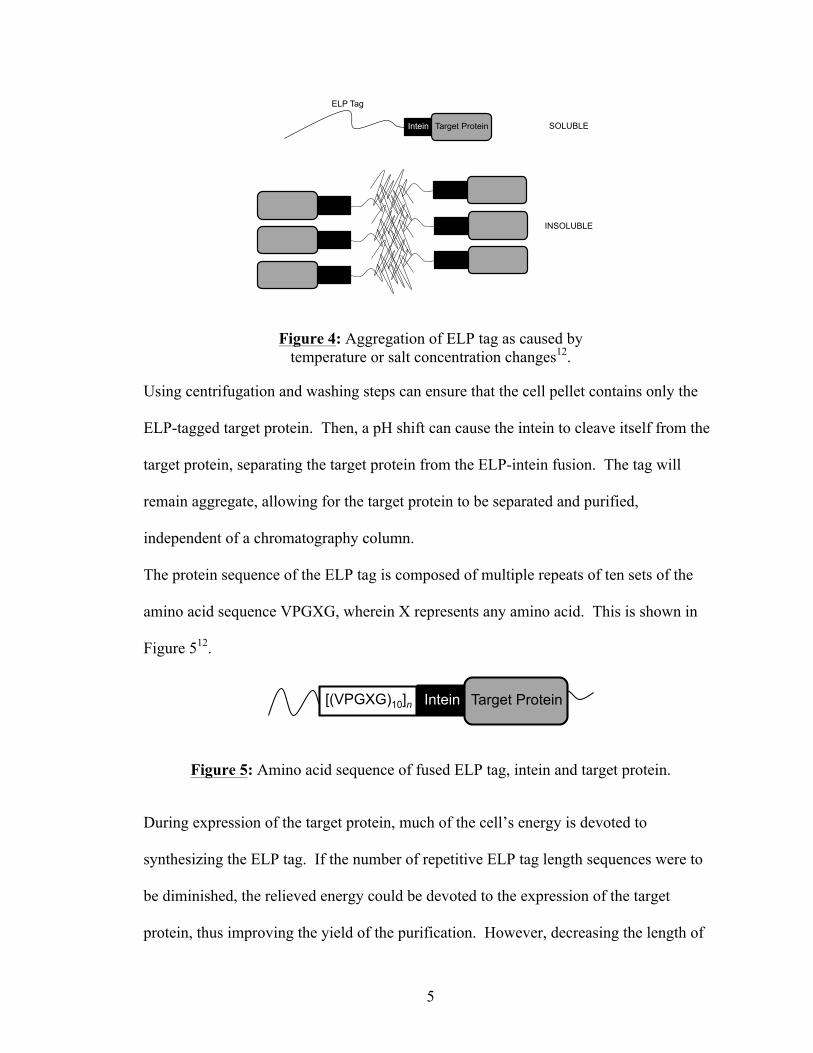
elastin-like polypeptide (ELP) tag is one such sequence. The use of ELP tag with the
self-cleaving intein, makes it possible for purifications to be done independent of an
affinity column. Shifts in salt concentration and pH lead to successful purifications of the
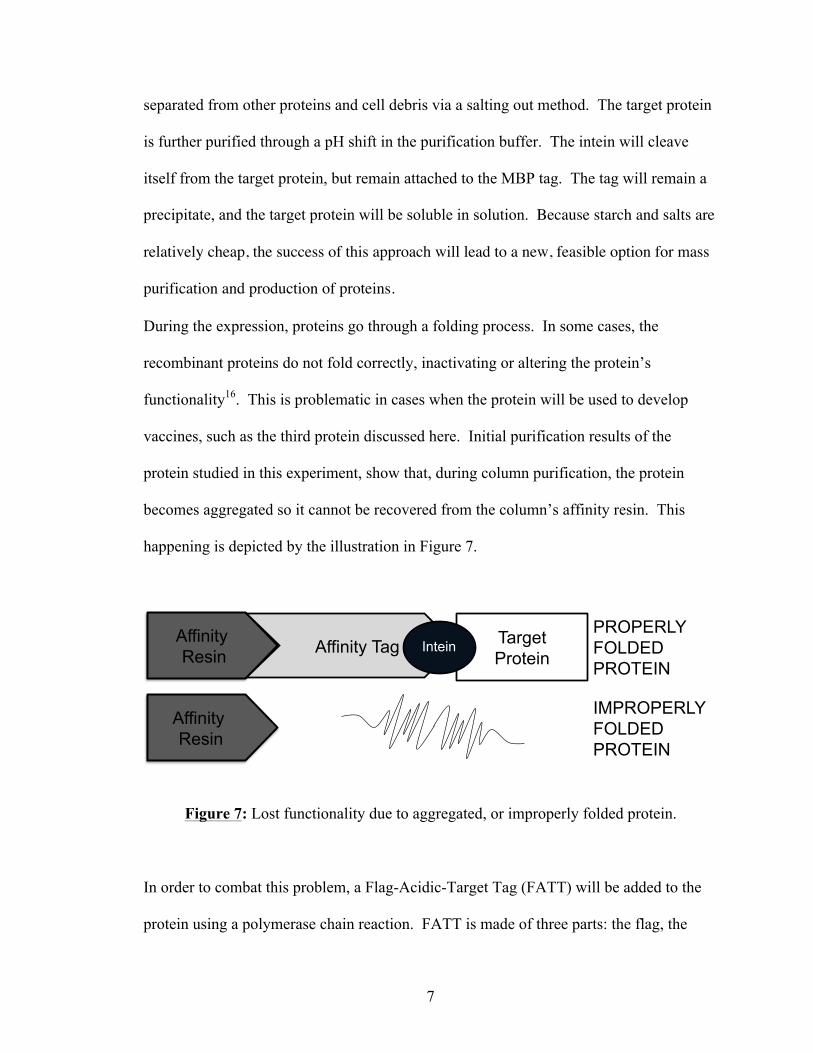
target protein. ELP has a large and repetitive protein sequence which requires large
amounts of energy for synthesis. By shortening the length of ELP, expression can be
increased by freeing some of that energy. In order to test this, and to determine the
ii
optimal ELP tag length, which may be affected by size and solubility of the target
protein, five different ELP tag sizes are studied.
Another tag, the maltose binding protein (MBP) affinity tag, is commonly used in
chromatographic purification processes due to its ability to selectively bind to
immobilized amylose. The MBP-tagged target protein binds to an amylose resin. Then,
a pH shift causes the intein to undergo a cleaving reaction, allowing the target tag to be
separated from the affinity sequence. In an effort to increase the economic feasibility and
simplicity of the MBP purification, the amylose resin is replaced with a starch solution.
The backbone of starch is primarily composed of amylose units. Starch, which contains
negatively charged ionic groups, can be easily salted out of solution. By allowing starch,
in solution, to bind to an MBP-tagged target protein, the target protein can be separated
from other proteins and cell debris via a salting out method. The target protein is further
purified via a pH shift in the purification buffer. Because starch and salts are relatively
cheap, the success of this approach will lead to a new, feasible option for mass
purification and production of proteins.
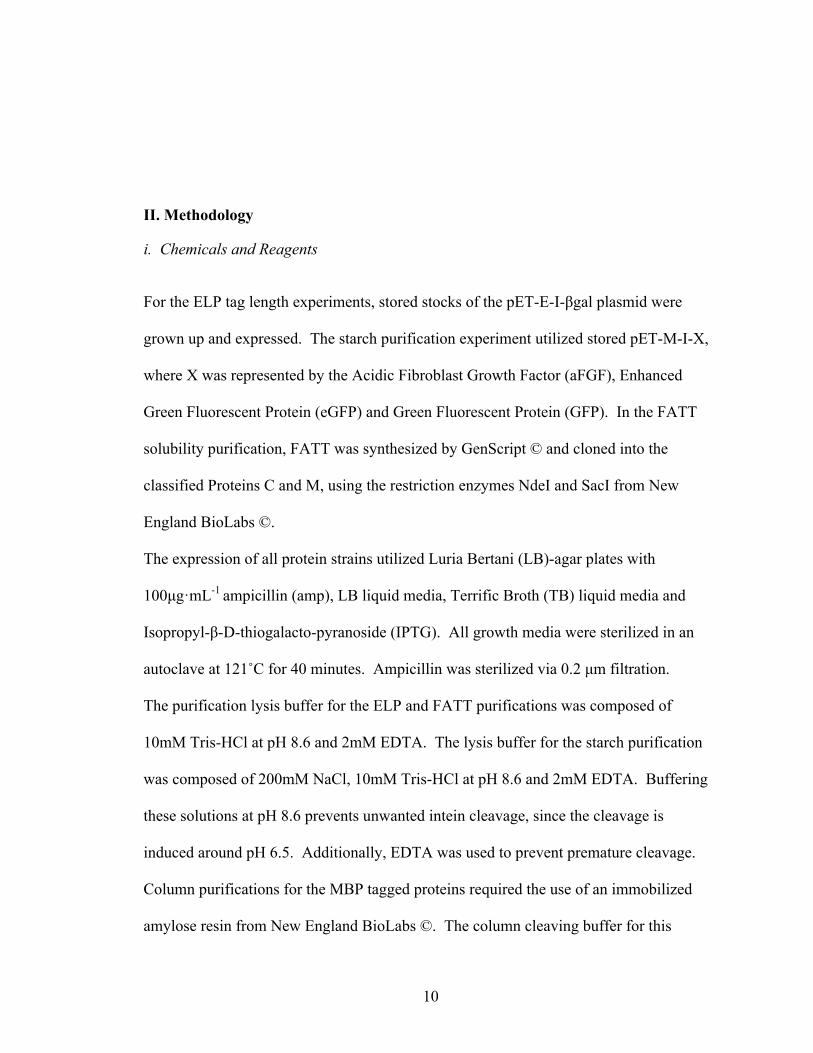
During the expression, proteins go through a folding process. In some cases, the
recombinant proteins do not fold correctly, inactivating or altering the protein’s
functionality. This is problematic in cases when the protein will be used to develop
vaccines, such as the third protein discussed here. Initial results showed that, during
column purification, the protein becomes aggregated so it cannot be recovered from the
column’s affinity resin. In order to combat this problem, a Flag-Acidic-Target Tag
(FATT) will be added to the protein using a polymerase chain reaction. FATT is made of
three parts: the flag, the hyperacidic region and a target tag. The flag makes the tag
iii
easily detected. The hyperacidic region expresses well in E. coli, is also highly charged,
so can be purified in a single step using a standard anion exchange chromatography resin,
and most importantly, has been shown to promote correct protein folding during
expression. It aids in proper refolding of misfolded fusion partners containing disulfide
bonds due to the structure of the hyperacidic region, which acts as a shield-like non-
specific chaperone for the target protein during in vitro expression and refolding. The
tagged protein will be purified using column purification where it will selectively adhere
to the column and be separated at a high purity.
In all three experiments described here, protein yield will be determined using qualitative
methods such as sodium dodecyl sulfate polyacrylamide gel electrophoresis (SDS-
PAGE), and quantitative methods, including activity and Bradford assays.
iv
Acknowledgements
I would like to thank Dr. David Wood for his guidance and support throughout the course
of my undergraduate research career. I would also like to thank Tzu-Chiang Han, Samar
Alsharawi, Dr. Michael Coolbaugh, and Dr. Richard Lease, members of the Wood
Group, for their contributions to my knowledge, understanding, and work. I would like
to thank Ashwin Lahiry, Angela Chen and my family for their moral support. I would
like to especially thank Miriam Shakalli for her help, friendship, and shared love of
Chinese food. Additionally, I would like to thank the Undergraduate Honors Committee
within the College of Engineering at The Ohio State University for their financial support
of my project. Finally, I would like to thank The Ohio State University and the William
G. Lowrie Department of Chemical and Biomolecular Engineering for providing the
resources necessary to become involved with undergraduate research and graduate with
research distinction.
v
Vita
2011 ........................................................................ Cardington-Lincoln Local High School 2015 .................. B.S. Chemical and Biomolecular Engineering, The Ohio State University 2015 to Current ............................ Ph.D. Chemical Engineering, Johns Hopkins University
Fields of Study
Major Field: Chemical and Biomolecular Engineering
vi
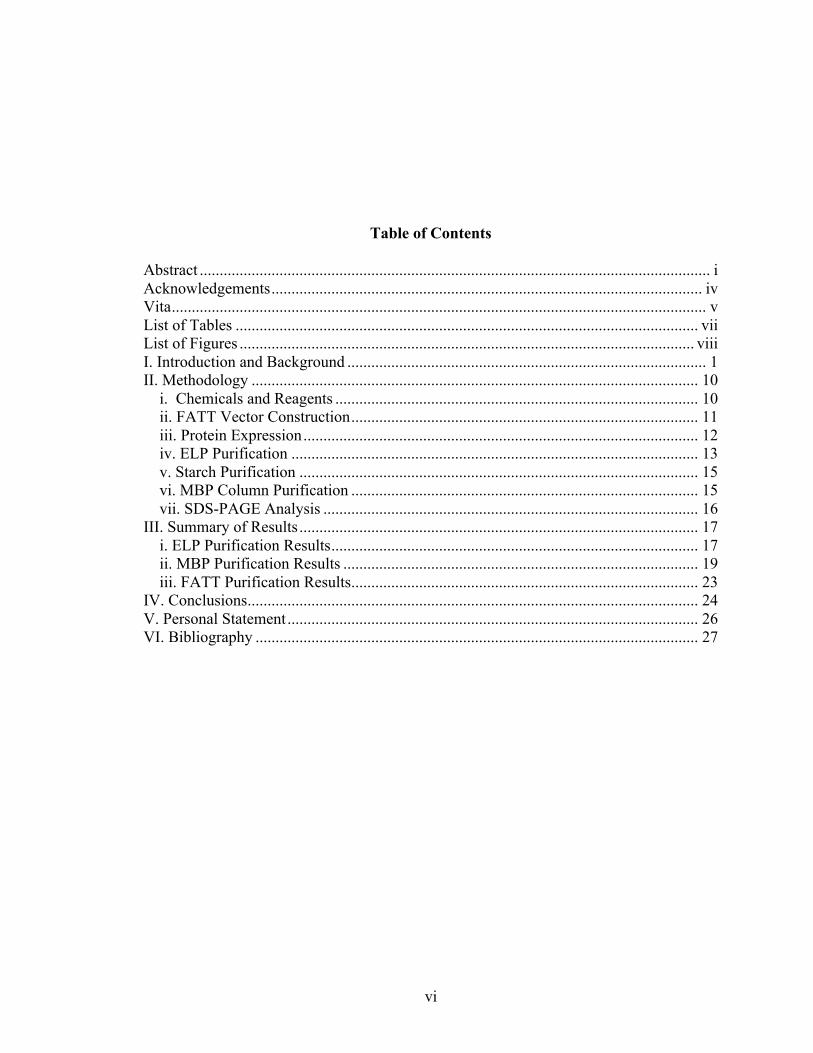
Table of Contents Abstract ................................................................................................................................ i Acknowledgements ............................................................................................................ iv Vita ...................................................................................................................................... v List of Tables .................................................................................................................... vii List of Figures .................................................................................................................. viii I. Introduction and Background .......................................................................................... 1 II. Methodology ................................................................................................................ 10
i. Chemicals and Reagents ........................................................................................... 10 ii. FATT Vector Construction ....................................................................................... 11 iii. Protein Expression ................................................................................................... 12 iv. ELP Purification ...................................................................................................... 13 v. Starch Purification .................................................................................................... 15 vi. MBP Column Purification ....................................................................................... 15 vii. SDS-PAGE Analysis .............................................................................................. 16
III. Summary of Results .................................................................................................... 17 i. ELP Purification Results ............................................................................................ 17 ii. MBP Purification Results ......................................................................................... 19 iii. FATT Purification Results ....................................................................................... 23
IV. Conclusions ................................................................................................................. 24 V. Personal Statement ....................................................................................................... 26 VI. Bibliography ............................................................................................................... 27
vii
List of Tables
Table 1: Commonly used affinity resins and associated costs. ........................................... 4 Table 2: Protein weights in kilodaltons. ........................................................................... 17
viii
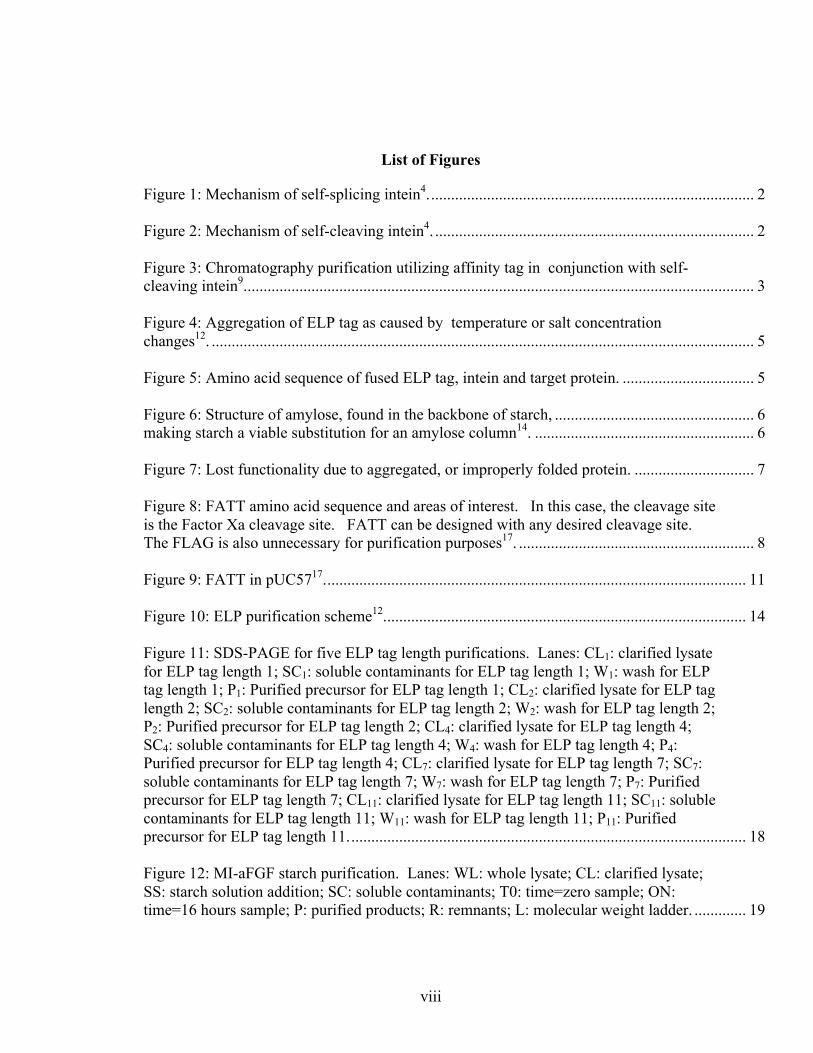
List of Figures
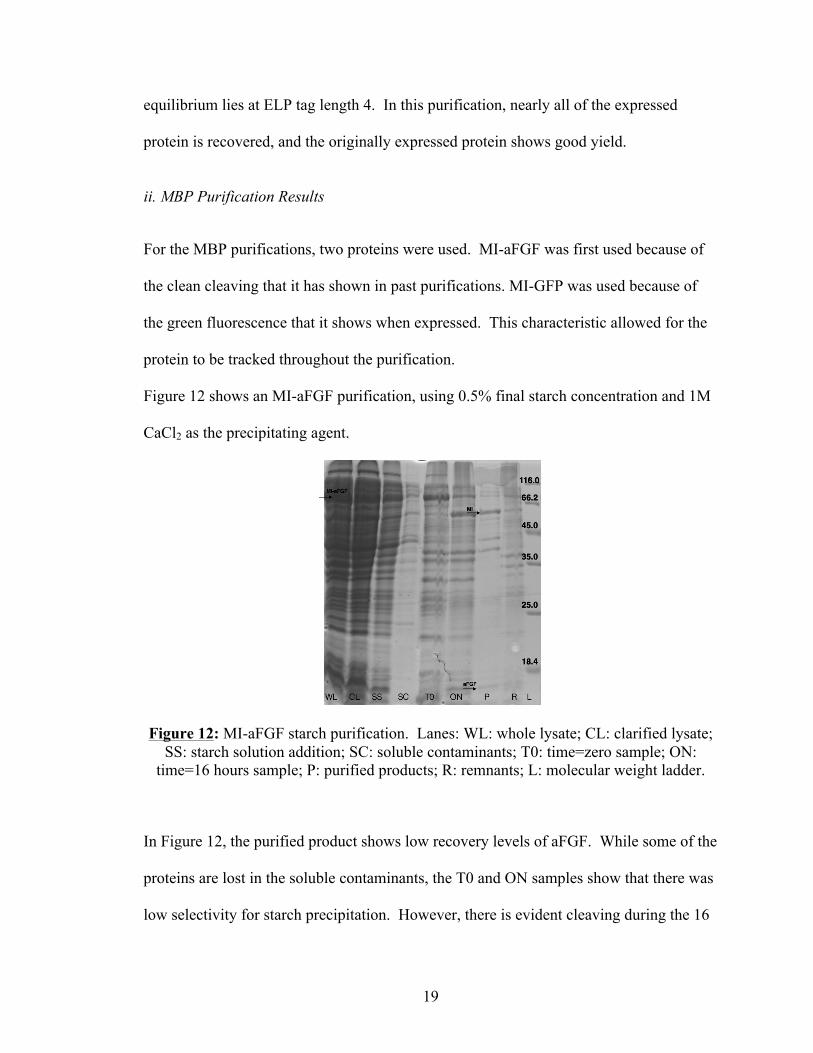
Figure 1: Mechanism of self-splicing intein4. ................................................................................. 2 Figure 2: Mechanism of self-cleaving intein4. ................................................................................ 2 Figure 3: Chromatography purification utilizing affinity tag in conjunction with self- cleaving intein9. ............................................................................................................................... 3 Figure 4: Aggregation of ELP tag as caused by temperature or salt concentration changes12. ........................................................................................................................................ 5 Figure 5: Amino acid sequence of fused ELP tag, intein and target protein. ................................. 5 Figure 6: Structure of amylose, found in the backbone of starch, .................................................. 6 making starch a viable substitution for an amylose column14. ....................................................... 6 Figure 7: Lost functionality due to aggregated, or improperly folded protein. .............................. 7 Figure 8: FATT amino acid sequence and areas of interest. In this case, the cleavage site is the Factor Xa cleavage site. FATT can be designed with any desired cleavage site. The FLAG is also unnecessary for purification purposes17. ........................................................... 8 Figure 9: FATT in pUC5717. ......................................................................................................... 11 Figure 10: ELP purification scheme12. .......................................................................................... 14 Figure 11: SDS-PAGE for five ELP tag length purifications. Lanes: CL1: clarified lysate for ELP tag length 1; SC1: soluble contaminants for ELP tag length 1; W1: wash for ELP tag length 1; P1: Purified precursor for ELP tag length 1; CL2: clarified lysate for ELP tag length 2; SC2: soluble contaminants for ELP tag length 2; W2: wash for ELP tag length 2; P2: Purified precursor for ELP tag length 2; CL4: clarified lysate for ELP tag length 4; SC4: soluble contaminants for ELP tag length 4; W4: wash for ELP tag length 4; P4: Purified precursor for ELP tag length 4; CL7: clarified lysate for ELP tag length 7; SC7: soluble contaminants for ELP tag length 7; W7: wash for ELP tag length 7; P7: Purified precursor for ELP tag length 7; CL11: clarified lysate for ELP tag length 11; SC11: soluble contaminants for ELP tag length 11; W11: wash for ELP tag length 11; P11: Purified precursor for ELP tag length 11. ................................................................................................... 18 Figure 12: MI-aFGF starch purification. Lanes: WL: whole lysate; CL: clarified lysate; SS: starch solution addition; SC: soluble contaminants; T0: time=zero sample; ON: time=16 hours sample; P: purified products; R: remnants; L: molecular weight ladder. ............. 19
ix
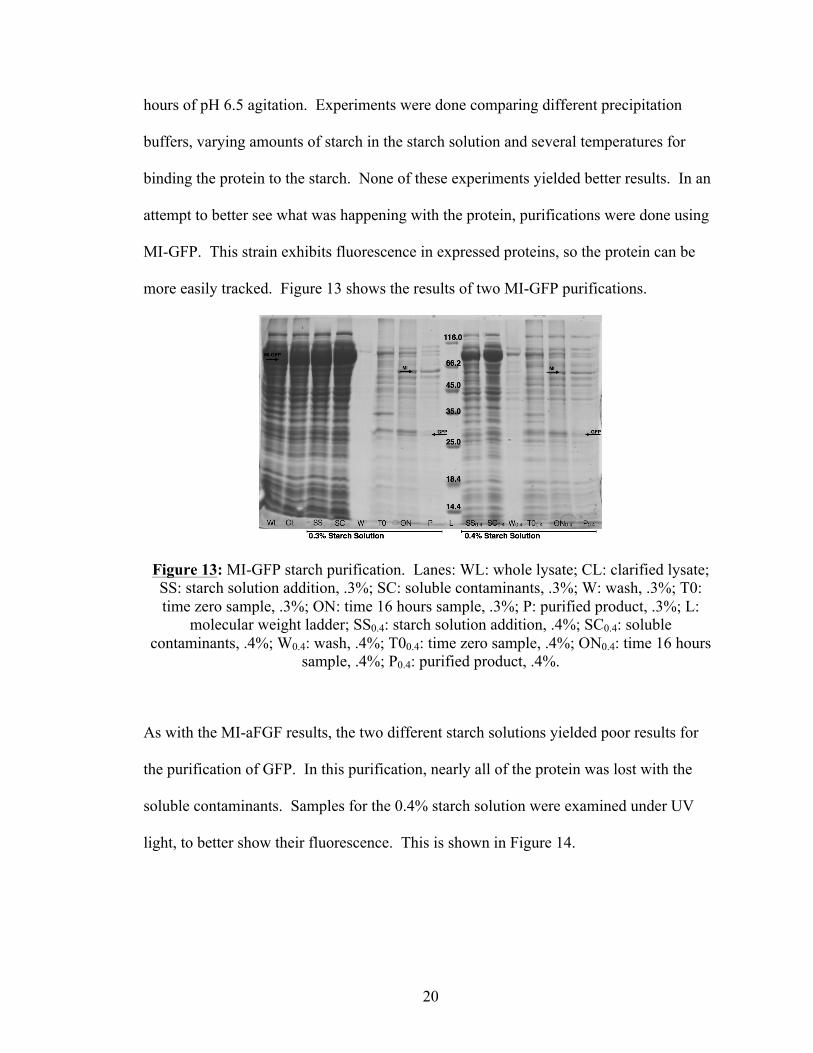
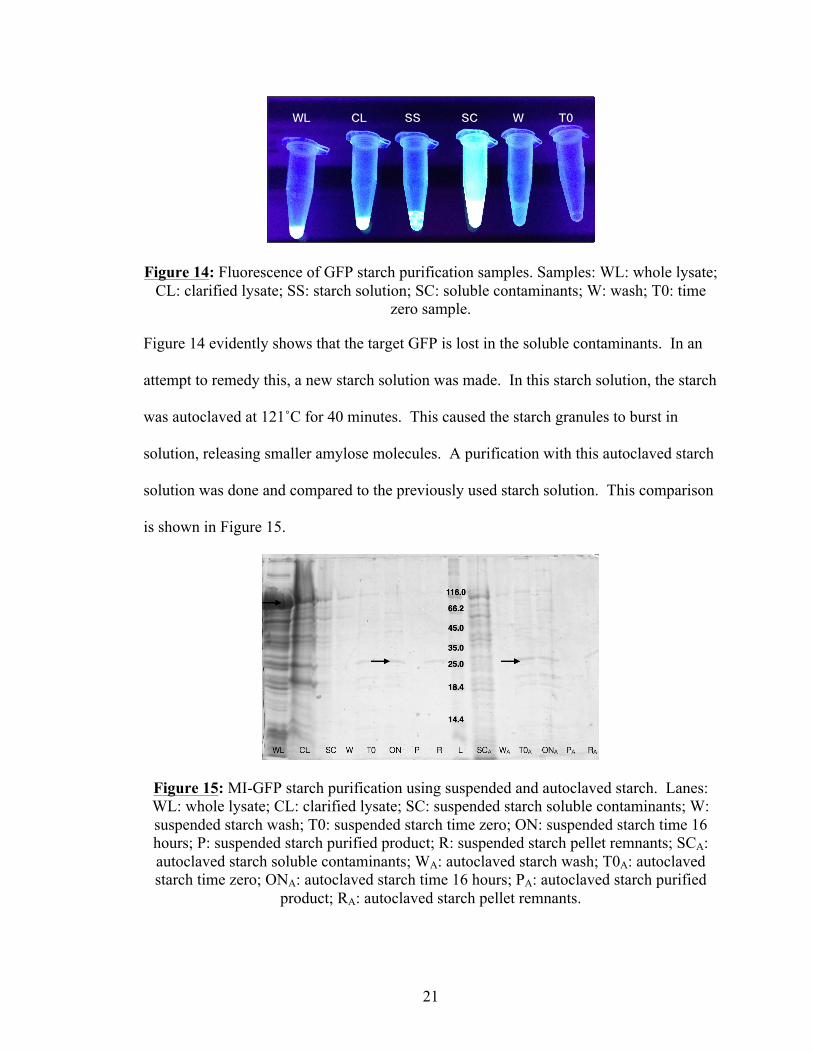
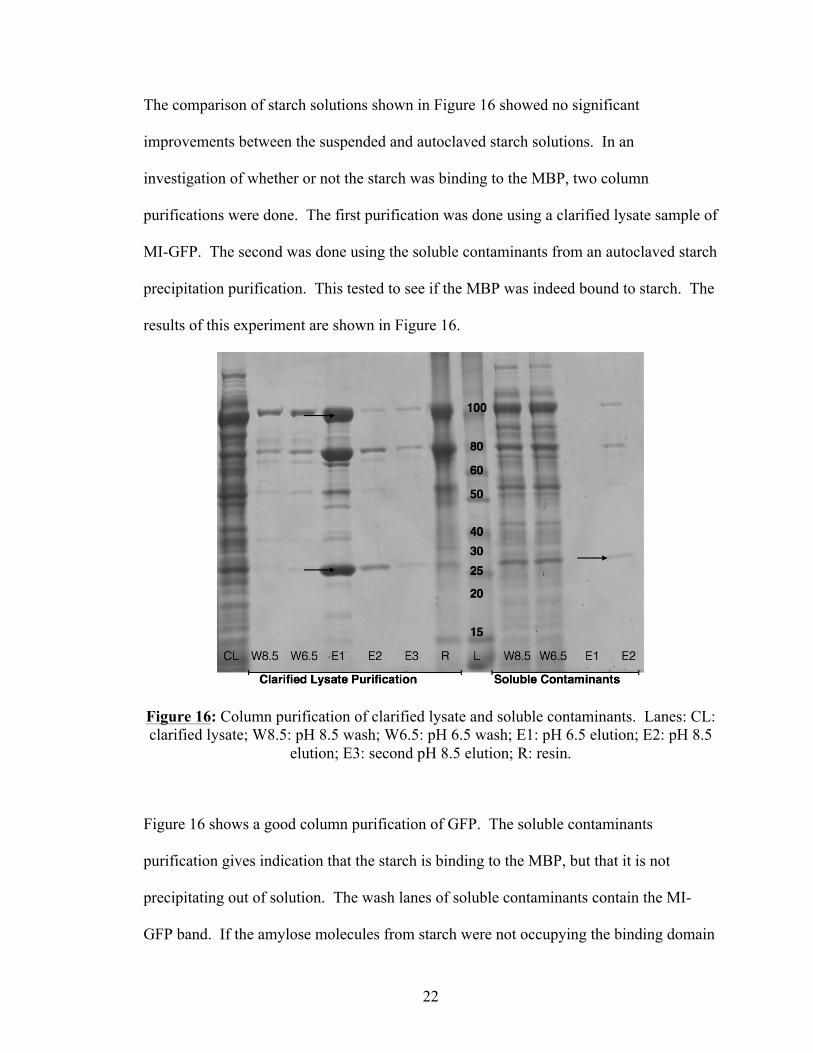
Figure 13: MI-GFP starch purification. Lanes: WL: whole lysate; CL: clarified lysate; SS: starch solution addition, .3%; SC: soluble contaminants, .3%; W: wash, .3%; T0: time zero sample, .3%; ON: time 16 hours sample, .3%; P: purified product, .3%; L: molecular weight ladder; SS0.4: starch solution addition, .4%; SC0.4: soluble contaminants, .4%; W0.4: wash, .4%; T00.4: time zero sample, .4%; ON0.4: time 16 hours sample, .4%; P0.4: purified product, .4%. ...................................................................................... 20 Figure 14: Fluorescence of GFP starch purification samples. Samples: WL: whole lysate; CL: clarified lysate; SS: starch solution; SC: soluble contaminants; W: wash; T0: time zero sample. .................................................................................................................................. 21 Figure 15: MI-GFP starch purification using suspended and autoclaved starch. Lanes: WL: whole lysate; CL: clarified lysate; SC: suspended starch soluble contaminants; W: suspended starch wash; T0: suspended starch time zero; ON: suspended starch time 16 hours; P: suspended starch purified product; R: suspended starch pellet remnants; SCA: autoclaved starch soluble contaminants; WA: autoclaved starch wash; T0A: autoclaved starch time zero; ONA: autoclaved starch time 16 hours; PA: autoclaved starch purified product; RA: autoclaved starch pellet remnants. ........................................................................... 21 Figure 16: Column purification of clarified lysate and soluble contaminants. Lanes: CL: clarified lysate; W8.5: pH 8.5 wash; W6.5: pH 6.5 wash; E1: pH 6.5 elution; E2: pH 8.5 elution; E3: second pH 8.5 elution; R: resin. ................................................................................ 22 Figure 17: Initial purification results for Proteins C and M. Lanes: WL: whole lysate; CL: clarified lysate; SC: soluble contaminants; T0: time zero; ON: final time; P: purified product; R: resin. ........................................................................................................................... 23
1
I. Introduction and Background
A central step in the production of high purity recombinant proteins is their separation
and purification. Purification is necessary to obtain target proteins from the host cells in
which they are grown. Recombinant proteins can be used as antibodies, vaccines,
enzymes and growth factors1. Some common recombinant protein therapeutics include
Amgen’s Erythropoietin, Chiron’s Hepatitis B vaccine and Genentech’s tissue
plasminogen activator1. Without highly effective purification, proteins cannot be utilized
in this broad range of areas. Furthermore, in order to mass-produce high purity
recombinant proteins, the purification methods must be time and cost effective.
A promising tool used in the purification of several proteins is the self-cleaving intein.
This biological macromolecule was developed from the naturally occurring self-splicing
intein. The self-splicing intein, whose name comes from the fact that it is part of the
internal protein, is embedded in-frame within a precursor protein sequence2. Surrounded
by exteins, this segment of the protein splices itself from the N- and C- terminals2. This
reaction begins with an N-O or N-S acyl rearrangement, followed by transesterification, a
cyclization at the C-terminal and an acyl rearrangement3. The resulting protein segments
include a mature protein product, made up of the extein segments, and individual
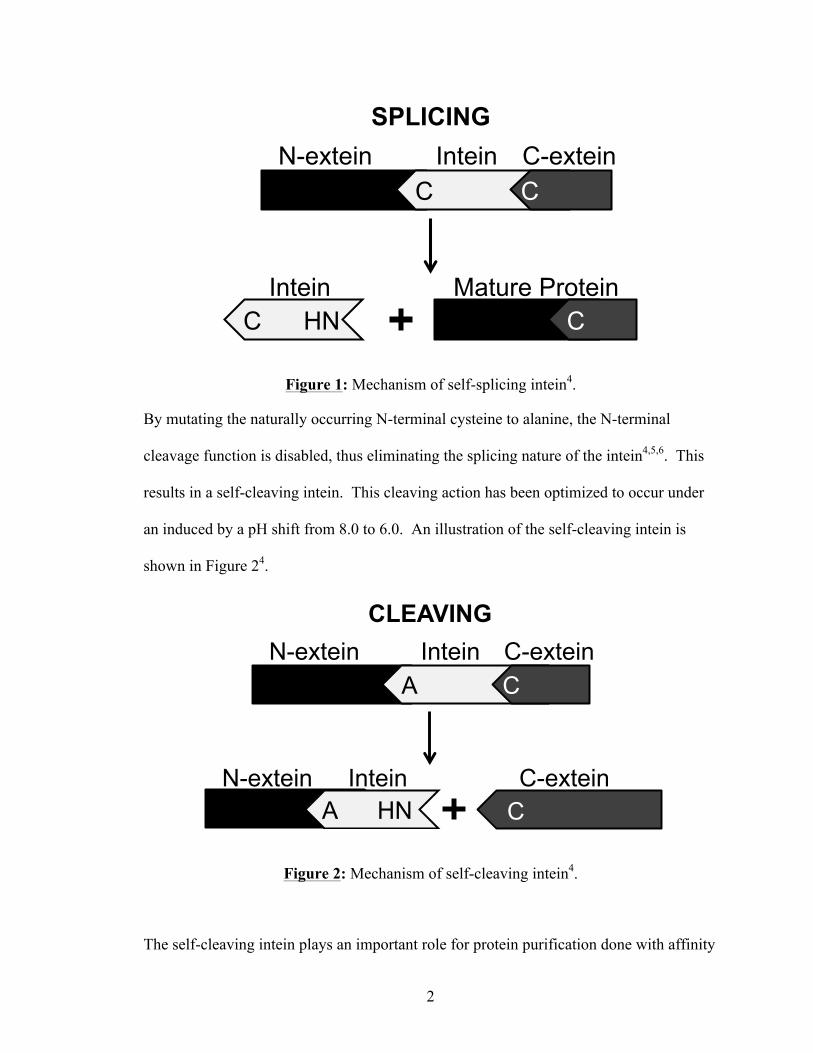
segments of the excised inteins2. Figure 1 shows an illustration of this splicing
mechanism4.
2
Figure 1: Mechanism of self-splicing intein4.
By mutating the naturally occurring N-terminal cysteine to alanine, the N-terminal
cleavage function is disabled, thus eliminating the splicing nature of the intein4,5,6. This
results in a self-cleaving intein. This cleaving action has been optimized to occur under
an induced by a pH shift from 8.0 to 6.0. An illustration of the self-cleaving intein is
shown in Figure 24.
Figure 2: Mechanism of self-cleaving intein4.
The self-cleaving intein plays an important role for protein purification done with affinity
C C N-extein C-extein Intein
Mature Protein C C HN
Intein
SPLICING
A C N-extein C-extein Intein
CLEAVING
C-extein C A HN
Intein N-extein
3
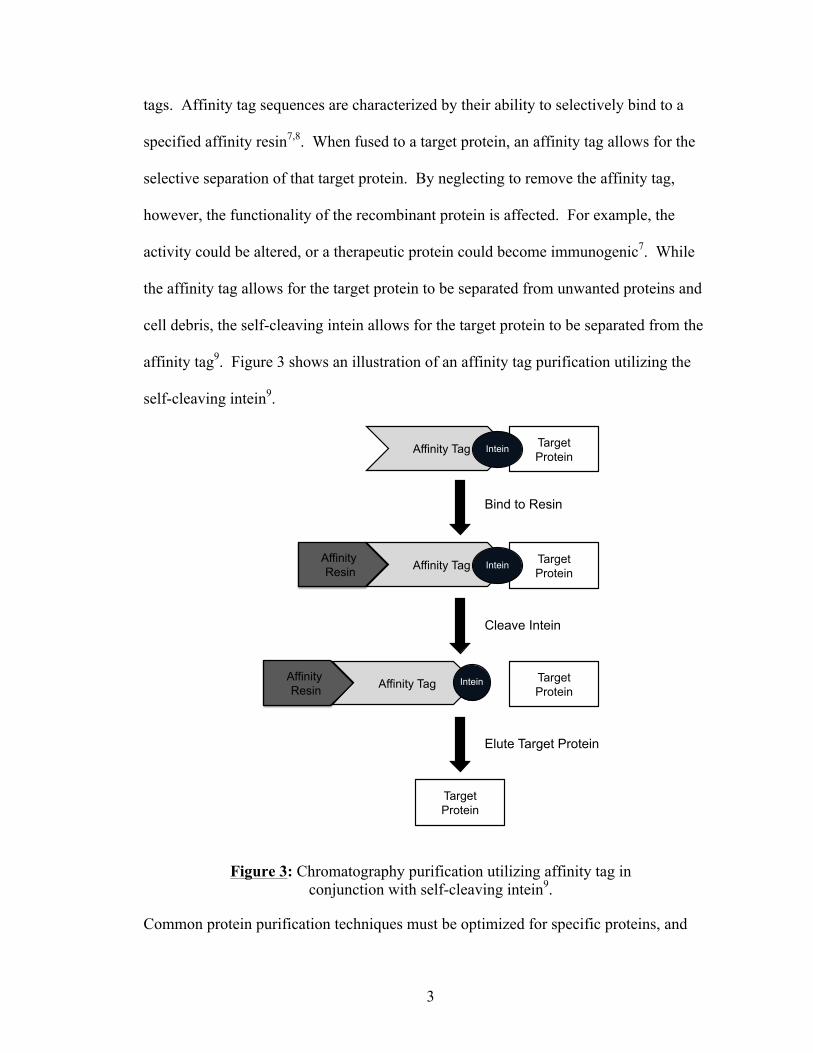
tags. Affinity tag sequences are characterized by their ability to selectively bind to a
specified affinity resin7,8. When fused to a target protein, an affinity tag allows for the
selective separation of that target protein. By neglecting to remove the affinity tag,
however, the functionality of the recombinant protein is affected. For example, the
activity could be altered, or a therapeutic protein could become immunogenic7. While
the affinity tag allows for the target protein to be separated from unwanted proteins and
cell debris, the self-cleaving intein allows for the target protein to be separated from the
affinity tag9. Figure 3 shows an illustration of an affinity tag purification utilizing the
self-cleaving intein9.
Figure 3: Chromatography purification utilizing affinity tag in conjunction with self-cleaving intein9.
Common protein purification techniques must be optimized for specific proteins, and
Bind to Resin
Cleave Intein
Elute Target Protein
Affinity Tag Target Protein
Intein
Affinity Resin Affinity Tag Target
Protein Intein
Affinity Resin Affinity Tag Target
Protein Intein
Target Protein
4
typically consist of several chromatographic steps. These steps involve expensive resins,
large time investments and potentially low yields of the target protein10. Utilizing affinity
tags simplifies the purification of nearly any target protein, but still requires optimization
for the removal of the affinity tag—usually done using a protease enzyme11. Protein
purification is further simplified with the introduction of the intein. A previously multi-
step chromatographic purification becomes a single-step purification when using an
affinity tag in conjunction with the self-cleaving intein7. However, even in this
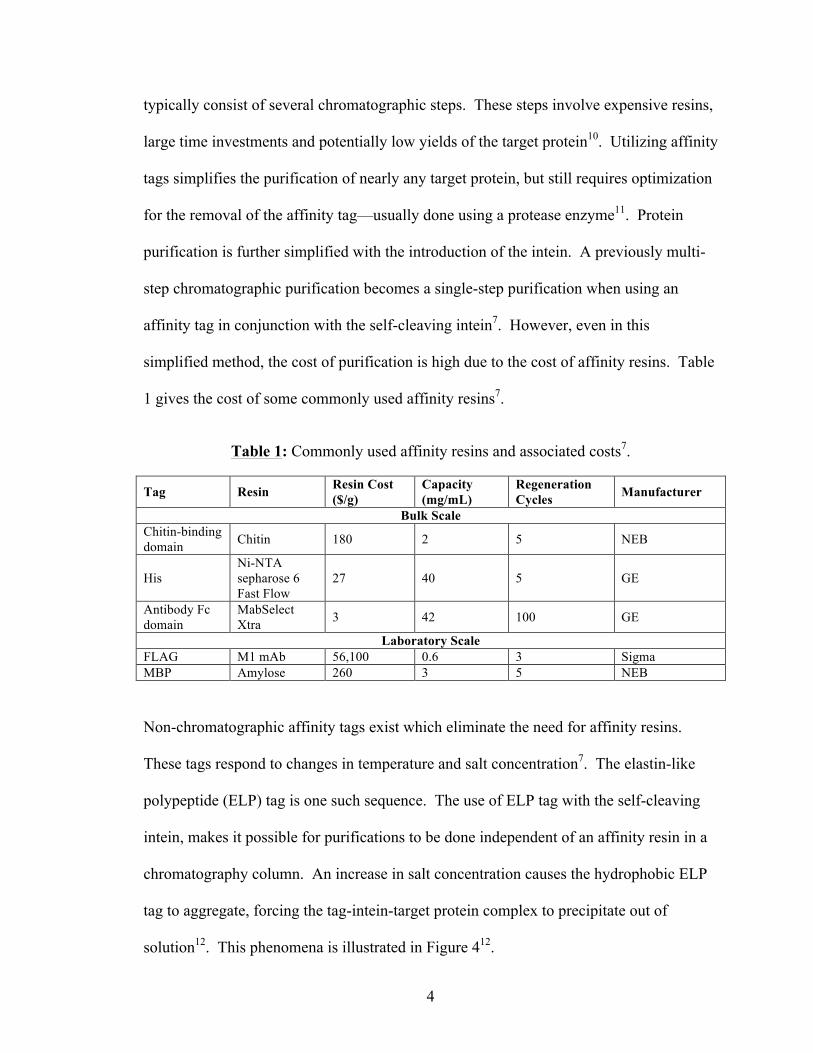
simplified method, the cost of purification is high due to the cost of affinity resins. Table
1 gives the cost of some commonly used affinity resins7.
Table 1: Commonly used affinity resins and associated costs7.
minutes and centrifuging for 1 minute at 2,000g. The supernatant was taken as the resin
sample9.
vii. SDS-PAGE Analysis
In order to check the results of the experiment sodium dodecyl sulfate-polyacrylamide gel
electrophoresis (SDS-PAGE) was used. For each SDS-PAGE, the purification sample
was mixed in a 1:1 ratio with sample buffer and heated at 95˚C for 5 minutes. The
samples were then run on a 5-12% polyacrylamide gel at 200V for 40 minutes. The gel
was stained with Coomassie blue R-250 stain for viewing and analysis.
17
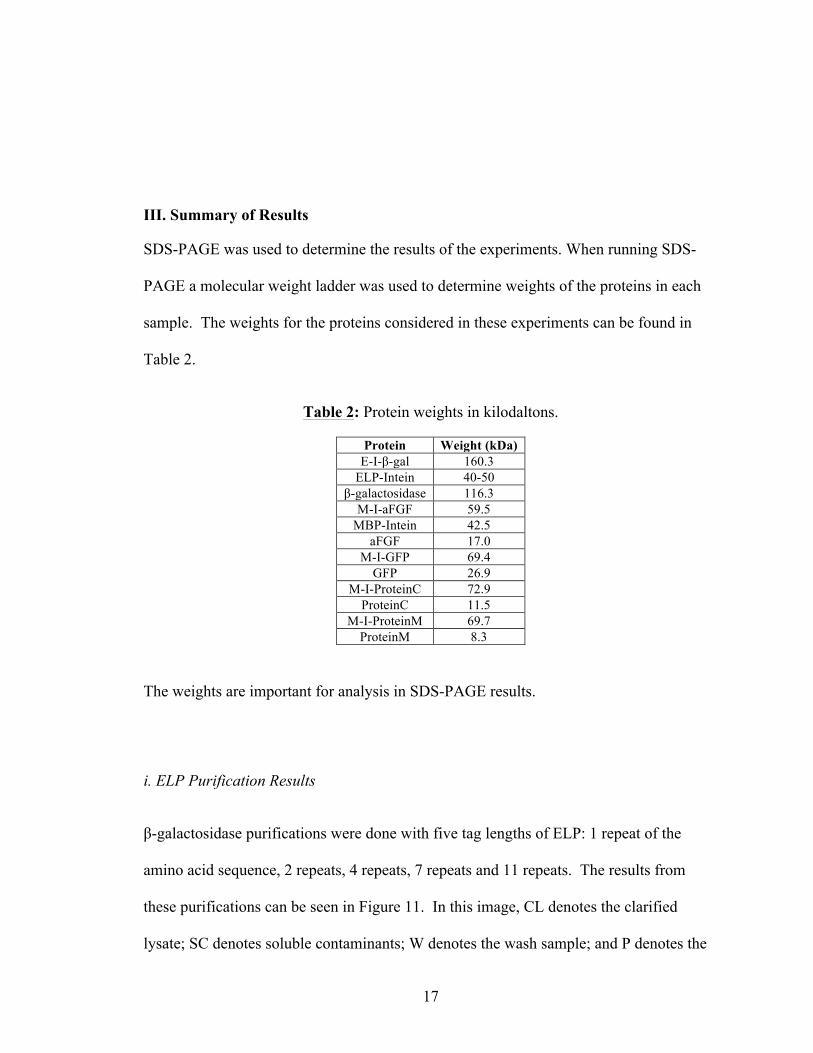
III. Summary of Results
SDS-PAGE was used to determine the results of the experiments. When running SDS-
PAGE a molecular weight ladder was used to determine weights of the proteins in each
sample. The weights for the proteins considered in these experiments can be found in
Table 2.
Table 2: Protein weights in kilodaltons.
Protein Weight (kDa) E-I-β-gal 160.3
ELP-Intein 40-50 β-galactosidase 116.3
M-I-aFGF 59.5 MBP-Intein 42.5
aFGF 17.0 M-I-GFP 69.4
GFP 26.9 M-I-ProteinC 72.9
ProteinC 11.5 M-I-ProteinM 69.7
ProteinM 8.3
The weights are important for analysis in SDS-PAGE results.
i. ELP Purification Results
β-galactosidase purifications were done with five tag lengths of ELP: 1 repeat of the
amino acid sequence, 2 repeats, 4 repeats, 7 repeats and 11 repeats. The results from
these purifications can be seen in Figure 11. In this image, CL denotes the clarified
lysate; SC denotes soluble contaminants; W denotes the wash sample; and P denotes the
18
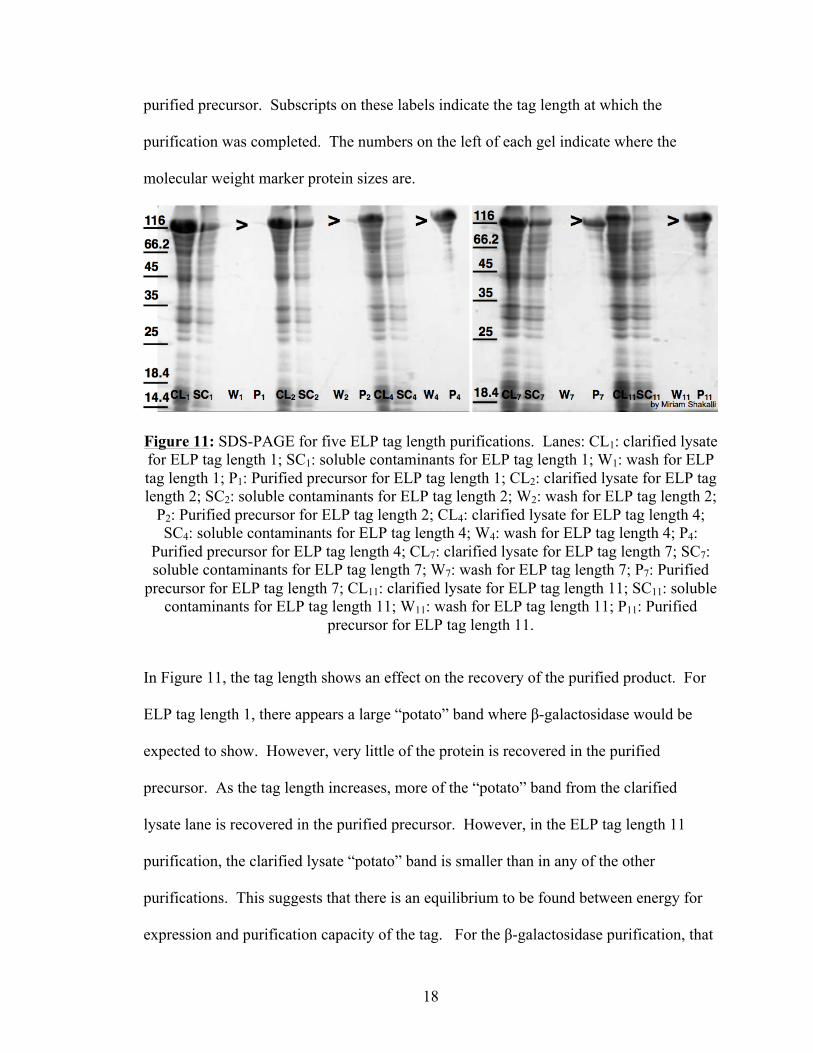
purified precursor. Subscripts on these labels indicate the tag length at which the
purification was completed. The numbers on the left of each gel indicate where the
molecular weight marker protein sizes are.
Figure 11: SDS-PAGE for five ELP tag length purifications. Lanes: CL1: clarified lysate for ELP tag length 1; SC1: soluble contaminants for ELP tag length 1; W1: wash for ELP tag length 1; P1: Purified precursor for ELP tag length 1; CL2: clarified lysate for ELP tag length 2; SC2: soluble contaminants for ELP tag length 2; W2: wash for ELP tag length 2;
P2: Purified precursor for ELP tag length 2; CL4: clarified lysate for ELP tag length 4; SC4: soluble contaminants for ELP tag length 4; W4: wash for ELP tag length 4; P4:
Purified precursor for ELP tag length 4; CL7: clarified lysate for ELP tag length 7; SC7: soluble contaminants for ELP tag length 7; W7: wash for ELP tag length 7; P7: Purified
precursor for ELP tag length 7; CL11: clarified lysate for ELP tag length 11; SC11: soluble contaminants for ELP tag length 11; W11: wash for ELP tag length 11; P11: Purified
precursor for ELP tag length 11.
In Figure 11, the tag length shows an effect on the recovery of the purified product. For
ELP tag length 1, there appears a large “potato” band where β-galactosidase would be
expected to show. However, very little of the protein is recovered in the purified
precursor. As the tag length increases, more of the “potato” band from the clarified
lysate lane is recovered in the purified precursor. However, in the ELP tag length 11
purification, the clarified lysate “potato” band is smaller than in any of the other
purifications. This suggests that there is an equilibrium to be found between energy for
expression and purification capacity of the tag. For the β-galactosidase purification, that
19
equilibrium lies at ELP tag length 4. In this purification, nearly all of the expressed
protein is recovered, and the originally expressed protein shows good yield.
ii. MBP Purification Results
For the MBP purifications, two proteins were used. MI-aFGF was first used because of
the clean cleaving that it has shown in past purifications. MI-GFP was used because of
the green fluorescence that it shows when expressed. This characteristic allowed for the
protein to be tracked throughout the purification.
Figure 12 shows an MI-aFGF purification, using 0.5% final starch concentration and 1M
Figure 16 shows a good column purification of GFP. The soluble contaminants
purification gives indication that the starch is binding to the MBP, but that it is not
precipitating out of solution. The wash lanes of soluble contaminants contain the MI-
GFP band. If the amylose molecules from starch were not occupying the binding domain
23
of the maltose, the purification would have resembled the clarified lysate column
purification. Rather, the soluble contaminants lost nearly all of the protein in the wash
steps. No further purifications were done using starch and precipitating it out of solution.
iii. FATT Purification Results
An initial purification of Proteins C and M was completed using MBP. Figure17 shows
the initial SDS-PAGE results.
Figure 17: Initial purification results for Proteins C and M. Lanes: WL: whole lysate; CL: clarified lysate; SC: soluble contaminants; T0: time zero; ON: final time; P: purified
product; R: resin.
In this purification, there is very little recovery of the target proteins. It is hypothesized
that this is a result of protein insolubility due to improper folding. The FATT
purification is expected to aid in this issue, but was unable to be completed. With more
time, the cloning of FATT into Protein C and M will be completed and a purification will
be done using an anion exchange column.
24
IV. Conclusions and Future Work
A promising tool in protein purification techniques is the self-cleaving intein. When used
in conjunction with affinity tag sequences, this naturally occurring macromolecule leads
to single-step purifications7. Several tags in existence are the elastin-like polypeptide
(ELP), the maltose binding protein (MBP) and the flag acidic target tag (FATT). These
tags aid in the specific separation of target proteins due to their specific separation
characteristics8. The ELP tag can be forced into aggregation with shifts in salt
concentration12. MBP selectively binds to immobilized amylose, making it easily
purified on an amylose affinity column9. FATT is purified on an anion exchange
column17. By fusing any one of these tags to a target protein sequence, that target protein
becomes easily separated from other proteins and cell debris. Use of the self-cleaving
intein allows for tag removal under a pH shift. The tags were used to purify proteins in
several experiments, making up the bulk of this work.
ELP tags are composed of repeating sequences of a 5-member amino acid sequence.
Standard ELP tags include 110 repeats of this sequence. By decreasing the number of
repeats, less energy is required for expression. This increases the yield of target protein
in the cell lysate. Results showed that too few repeats diminishes the ELP’s power to
precipitate and function as a tag. However, as expected, too many repeats decreases the
protein’s expression. It can be concluded, that for β-galactosidase, an ELP tag length of
4 is ideal for purification purposes.
25
MBP is a tag that binds selectively to immobilized amylose14. The backbone of starch is
primarily composed of amylose. By replacing an amylose affinity column with a starch
solution, the target protein can be precipitated using a salting out approach15. This
method improves the cost and efficiency of the purification. Results from this
experiment show that the MBP tagged target proteins bind to starch, but are not salted out
of solution. Future work could be done to investigate better salt precipitation tools. This
would improve the purification and give rise to a new, inexpensive, time-efficient and
feasible method of purification.
The third tag investigated in this study, FATT, aids in the proper folding and refolding of
proteins16,17. Its hyperacidic region acts as a shield to the protein in vitro, allowing it to
fold properly. Because of frame shifts in cloning, the FATT tag purification has yet to be
successful. Future work will include expression of FATT-tagged proteins, and their
purification on anion exchange columns.
26
V. Personal Statement
During my four years at The Ohio State University, I have been provided resources and
given opportunities to develop my scientific interests. I began my undergraduate research
experience with Dr. David Wood in the William G. Lowrie Department of Chemical and
Biomolecular Engineering. Over the past three years I have gained experience and
knowledge in the field of protein purification, specifically in regards to
biopharmaceuticals. I played a role in optimizing the purification method for a protein
marketed by a French vaccine company. I completed many experiments aimed at
investigating the effect of an elastin-like polypeptide (ELP) tag on purification results and
I have transitioned into a mentor for new undergraduate researchers in the laboratory. I
have worked on my own projects regarding the purification of maltose binding protein
(MBP) tagged target proteins using starch and the affect that the flag-acidic target tag
(FATT) has on the folding and refolding of proteins during expression. After my
sophomore year, I was selected to participate in Germany’s DAAD RISE program, where
I further investigated protein purification as I studied the thermodynamics of protein
adsorption. This work provided useful insight into the chromatographic methods used to
purify and separate high purity proteins. These experiences, in addition to my coursework
and efforts towards completing my honors thesis will greatly prepare me for my pursuit
of a PhD. in Chemical Engineering at Johns Hopkins University starting in the fall of
2015.
27
VI. Bibliography
1. Koths, K. (1995). Recombinant proteins for medical use: The attractions and challenges. Current Opinion in Biotechnology, 6, 681-687.
2. Perler, F., Davis, E., Dean, G., Gimble, F., Jack, W., Neff, N., . . . Belfort, M. (1994). Protein splicing elements: Inteins and exteins — a definition of terms and recommended nomenclature. Nucleic Acids Research, 22(7), 1125-1127.
3. Chong, S., Mersha, F., Comb, D., Scott, M., Landry, D., Vence, L., . . . Xu, M. (1997). Single-column purification of free recombinant proteins using a self-cleavable affinity tag derived from a protein splicing element. Gene, 192, 271-281.
4. Wood, D., Wu, W., Belfort, G., Derbyshire, V., & Belfort, M. (1999). A genetic system yields self-cleaving inteins for bioseparations. Nature Biotechnology, 17, 889-892.
5. Shemella, P., Pereira, B., Zhang, Y., Roey, P., Belfort, G., Garde, S., & Nayak, S. (2007). Mechanism for Intein C-Terminal Cleavage: A Proposal from Quantum Mechanical Calculations. Biophysical Journal, 92, 847-853.
6. Wu, W., Wood, D., Belfort, G., Derbyshire, V., & Belfort, M. (2002). Intein-mediated purification of cytotoxic endonuclease I-TevI by insertional inactivation and pH-controllable splicing. Nucleic Acids Research, 30(22), 4864-4871.
7. Fong, B., Wu, W., & Wood, D. (2010). The potential role of self-cleaving purification tags in commercial-scale processes. Trends in Biotechnology, 28(5), 272-279.
8. Banki, M., & Wood, D. (2005). Inteins and affinity resin substitutes for protein purification and scale up. Microbial Cell Factories, 4(32).
9. Wood, D., Derbyshire, V., Wu, W., Chartrain, M., Belfort, M., & Belfort, G. (2000). Optimized Single-Step Affinity Purification with a Self-Cleaving Intein Applied to Human Acidic Fibroblast Growth Factor. Biotechnology Progress, 16, 1055-1063.
10. Banki, M., Gerngross, T., & Wood, D. (2005). Novel and economical purification of recombinant proteins: Intein-mediated protein purification using in vivo polyhydroxybutyrate (PHB) matrix association. Protein Science, 14, 1387-1395.
28
11. Arnau, J., Lauritzen, C., Petersen, G., & Pedersen, J. (2005). Current strategies for the use of affinity tags and tag removal for the purification of recombinant proteins. Protein Expression and Purification, 48, 1-13.
12. Banki, M., Feng, L., & Wood, D. (2005). Simple bioseparations using self-cleaving elastin-like polypeptide tags. Nature Methods, 2(9), 659-662.
13. Young, C., Britton, Z., & Robinson, A. (2012). Recombinant protein expression and purification: A comprehensive review of affinity tags and microbial applications. Biotechnology Journal, 7, 620-634.
14. Raghava, S., Aquil, S., Bhattacharyya, S., Varadarajan, R., & Gupta, M. (2008). Strategy for purifying maltose binding protein fusion proteins by affinity precipitation. Journal of Chromatography A, 1194, 90-95.
15. Zhou, H., Wang, C., Shi, L., Chang, T., Yang, H., & Cui, M. (2014). Effects of salts on physicochemical, microstructural and thermal properties of potato starch. Food Chemistry, 156, 137-143.
16. Wood, D. (2014). New Trends and Affinity Tag Designs for Recombinant Protein Purification. Current Opinion in Structural Biology, 26, 54-61.
17. Sangawa, T., Tabata, S., Suzuki, K., Saheki, Y., Tanaka, K., & Takagi, J. (2013). A multipurpose fusion tag derived from an unstructured and hyperacidic region of the amyloid precursor protein. Protein Science, 22, 840-850.