Protein-Selective Coacervation with Hyaluronic AcidXiaosong Du,† Paul L. Dubin,*,‡ David A. Hoagland,† and Lianhong Sun§
†Department of Polymer Science and Engineering and ‡Department of Chemistry University of Massachusetts, Amherst,Massachusetts, 01003, United States§School of Life Sciences, University of Science and Technology of China, Hefei, Anhui, People’s Republic of China, 230027
*S Supporting Information
ABSTRACT: Selective coacervation with hyaluronic acid(HA), a biocompatible and injectable anionic polysaccharide,was used to isolate a target protein, bovine serum albumin(BSA), with 90% purity from a 1:1 mixture with a secondprotein of similar pI, β-lactoglobulin (BLG). This separationwas attributed to the higher HA-affinity of BSA, arising from itsmore concentrated positive domain. The values of pHcorresponding respectively to the onset of complex formation,coacervation, precipitation, and redissolution (pHc, pHϕ, pHp,and pHd) were determined as a function of ionic strength I.These pH values were related to critical values of proteincharge, Z, and their dependence on I provided some insightsinto the mechanisms of these transitions. The higher polyanion binding affinity of BSA, deduced from its higher values of pHc,was confirmed by isothermal titration calorimetry (ITC). Confocal laser microscopy clearly showed time-dependent coalescenceof vesicular droplets into a continuous film. Comparisons with prior results for the polycation poly(diallyldimethylammoniumchloride) (PDADMAC) show reversal of protein selectivity due to reversal of the polyelectrolyte charge. Stronger binding ofboth proteins to PDADMAC established by ITC may be related to the higher chain flexibility and effective linear charge densityof this polycation.
■ INTRODUCTION
Extensive studies have established selective interactions ofsynthetic polyelectrolytes (PE) with proteins1 that can lead tobiotechnological applications such as efficient purification ofproteins.2 As biodegradable and environmentally friendlymaterials, natural PEs like charged polysaccharides,3 may offerbetter methods of coacervation-based protein purification. Inparticular, hyaluronic acid, an anionic polysaccharide andapproved injectable, offers particular advantages for thepurification of protein drugs. However, relatively little isknown about the relationship between protein-specific affinityand selective coacervation for weak PEs with pH-dependentcharge.4,5
In spite of the growing demand for recombinant proteins,6
protein purification is usually an expensive and slow process.7
Currently, commercial separation techniques include liquidchromatography and membrane separation. Liquid chromatog-raphy is limited by its low-yield and large solventconsumption.8 Membrane-selective separation is limited bythe low binding capacity of proteins and the quality of themembranes.9 Therefore, large-scale and economic separationtechniques are needed. Efficient and highly selective proteinseparation via coacervation provides an important alternative totraditional methods. Another attractive feature of this “softmethod” is that protein stability and bioactivity can be retainedduring the separation process.10
PE/protein complex coacervation is a liquid−liquid phaseseparation occurring through nonspecific electrostatic inter-actions. For protein−PE systems, the protein charge density ispH-dependent, and a critical pH marks the onset of binding ofproteins to polymer chains.11 While this “pHc”, correspondingto an ionic-strength dependent critical local protein surfacecharge density, may occur when the two macromolecules havethe same charge sign,12 phase separation (coacervation) at“pHϕ” requires that the charge of the bound proteinscompensates for the charge of the PE.13 While thisneutralization overcomes repulsion among like-charge com-plexes, the actual driving force for coacervation is the entropyincrease from counterion release.3−14 Centrifugation or settlingthen separates the dilute equilibrium supernatant from a moreconcentrated dense phase “coacervate” that can contain a targetprotein whose pHϕ deviates significantly from other proteinspresent in the same system.Within multiprotein systems, a target protein with higher PE
affinity might be proposed to coacervate more efficiently, thatis, pHϕ depends on pHc; however, while protein net chargeinfluences the former, protein charge anisotropy determines thelatter. In fact, proteins of nearly equal pI can show widedifferences in pHc. The observation of pHc “on the wrong sideof the isoelectric point” suggests the role of a “charge patch”, a
Received: October 10, 2013Published: February 1, 2014
protein region with a local charge density opposite to the globalcharge.11−15 Bovine serum albumin (BSA) with a positived om a i n b i n d s t h e s t r o n g p o l y a n i o n p o l y -(acrylamidomethylpropyl sulfonate) at pH 6.9 (2.0 pH unitsabove pI),11 but the onset of polyanion binding for β-lactoglobulin (BLG) at pH 6.2 occurs at pH − pI = 1.0.16
Through electrostatic modeling, an identical region of positivepotential (∼5 Å from the BSA surface) was found to appear atvarious conditions of pH and salt concentration.15 The chargeanisotropy of a protein defines its “charge complementarity”with a polyelectrolye partner, as influenced by the chargesequences and chain stiffness of the latter. This interaction, acombination of short- and long-range forces, is to bedistinguished from site-specific recognition as for DNA−protein interactions. The consequence of charge complentarityin terms of separation is shown by the ability of the flexiblepolycation poly(diallyldimethylammonium chloride) (PDAD-MAC) to preferentially coacervate BLG from BSA despite thehigher pI of the former (5.2 vs 4.9).2
In this paper we test the hypothesis mentioned above − therelationship among protein charge anisotropy, pHc, pHϕ, andselective coacervation − using hyaluronic acid (HA) to complexwith and separate the two proteins BSA and BLG. While thecorresponding values of pI (4.9 and 5.2) are similar, BSA has awell-defined positive domain (lacking in BLG); and BSA issusceptible to unfolding at low pH. We use turbidimetrictitration to establish conditions for the formation of variousphases whose boundaries are defined by pHc and pHϕ, as wellas conditions for precipitation, interestingly reversible in thiscase. Calorimetry is employed to compare the thermodynamicparameters for the complexation of the two proteins. Theimpact of PE chain stiffness and charge density/sign is assessedby comparison with previous results for these two proteins withthe more flexible and higher charge density synthetic polycationPDADMAC.2 As a weak polyacid, the charge density of the HAchain is sensitive to pH, whereas PDADMAC has a constantcharge density through all pHs. Examination of the HA/proteinsystem can lead to a better understanding of protein binding toweak PEs with a pH-dependent charge.
■ EXPERIMENTAL SECTIONMaterials. Hyaluronic acid (HA, MW 9 × 10⁵), produced by
streptococcus bacteria and purified by filtration through activatedcharcoal, was a gift of Shiseido Co. (Japan). BSA (68 kDa) with totalfree acid content ≤1.2 mg/g was from Roche Diagnostics (Indian-apolis, IN; CAS 9048−46−8). BLG (18 kDa, referred to below as“native BLG”) was a gift from C. Schmitt (Nestle, Lausanne). NaCl,sodium acetate, sodium phosphate (monobasic), and standard NaOH,HCl, and acetic acid solutions were purchased from Fisher Scientific.Milli-Q water was used in all sample preparation. Fluoresceinisothiocyanate (FITC) and rhodamine B isothiocyanate (RITC)were from Sigma-Aldrich (Milwaukee, WI).
Turbidimetric Titrations. Highly precise turbidimetric titrations(%T ± 0.05%) were carried out for solutions containing proteins andpolyelectrolytes in order to determine the points of complex formationand phase separation (pHc, pHϕ). At the temperature range of 23−25°C, no temperature effect could be seen. HA solutions (0.1 g/L, 1.1 ×10⁻⁷ mol/L), BSA protein (1 g/L, 1.5 × 10⁻⁵ mol/L), and BLGprotein (1 g/L, 5.5 × 10⁻⁵ mol/L) were prepared separately at thedesired concentrations of NaCl (25−250 mM), filtered (0.22 μmMillipore), and then mixed at equal volumes to give 10 mL. Additionof 0.01 N HCl with a 2.0 mL Gilmont microburet to a final pH of 2 inincrements of ∼0.1 pH units, with simultaneous monitoring of pH andtransmittance (T), was done while stirring at a speed of about 1000rpm. Transmittance was measured using a Brinkmann PC 800colorimeter equipped with a fiber optics probe (optical path length b =2 cm) and a 450 nm filter, and pH was measured with a Corning 240pH meter. For convenience, the turbidity τ = −ln T/b, is replaced by100%T, which can easily be shown to be linear with τ at %T > 85. Thetitration was completed within 15 min to minimize effects of BLGaggregation. After suitable warm-up, the instrument drift over this timeperiod was verified as less than 0.15 transmittance unit/h. It isimportant to note that solutions with 100%T < 10 (e.g., Figure 1) aretypically optically clear.
Preparation of Mixed Coacervates. To observe separation ofBSA and BLG as a consequence of HA binding and coacervation, BSA,BLG and HA were all mixed together in pH 7, I = 200 mM (NaCl) toyield a solution 5 g/L in BSA, 5 g/L in BLG, and 0.5 g/L in HA. Themixed coacervatate was formed by pH adjustment to 3.5. The resultingturbid suspension was centrifuged (Beckman Coulter Allegra 6R,swing-bucket rotor) for 1 h at 4000 rpm (corresponding to a relativecentrifugal field of 3650 × g), 20 °C to produce optically clear dilute(upper) and dense (lower) phases (supernatant and coacervate,respectively).
Figure 1. Turbidimetric titration of (A) HA/BSA and (B) HA/BLG solutions at different ionic strengths: protein and polymer concentration are 0.5and 0.05 g/L, respectively. pHϕ and pHp are determined as points of departure from lines of zero slope, shown in the insets of (A) for pHϕ of BSA;and (B) for pHp of BLG, both at 100 mM salt.
Size Exclusion Chromatography. To investigate proteincompositions in coacervate and supernatant, we carried out SEC ona prepacked Superose 6 HR 10/30 column using a ShimadzuProminence LC system equipped with a refractive index detector(RID-10A) with 20 μL injections. The mobile phase was 150 mMNaCl + 30 mM Tris buffer (pH 7) at 1 mL/min. Solutions werefiltered (cellulose acetate) prior to injection (20 μL). The coacervatewas analyzed by dissolving 0.1 g of the dense phase in 0.4 mL of 0.2 MNaCl adjusted to pH ∼ 7.Confocal Laser Scanning Microscopy. FITC-labeled BSA and
RITC-labeled BLG were prepared by reaction of FITC/RITCisothiocyanate group (−NCS) with protein amine.17−20 Thefluorescein dye was attached to protein by the thiourea bond. Weprepared a solution of 2 g/L of protein in DI water and dissolve theFITC/RITC in anhydrous DMSO at 1 g/L. Protein or polymer wasthen mixed with FITC/RITC dye in a volume ratio of 20:1. Thecoupling reaction was carried out in the dark for 8 h. Free fluorescencedye was removed by dialysis followed by freeze-drying. The ratio offluorescein dye to protein was ∼0.5, obtained by measuring theabsorbance at 495 and 280 nm. The fluorescence images were takenwith a Leica TCS SP confocal laser scanning microscope with a 50×objective lens in the transmission mode. Emission spectra of FITC-and RITC-labeled proteins were taken over 500−530 and 590−620nm, respectively, with excitation at, respectively, 488 and 548 mm.Computational Methods. Computer modeling was used to
visualize the electrostatic potential around the protein as a function ofpH and ionic strength. DelPhi V98.0 (Molecular Simulations) wasused to calculate electrostatic potential around the protein bynonlinear solution of the Poisson−Boltzmann equation.21 The proteincrystal structures with Protein Data Bank identifications 1AO6 (BSA)were taken from the RCSB Protein Data Bank (http://www.rcsb.org).The charges of amino acids were generated using the spherical-smeared-charged model proposed by Tanford22 utilizing the proteintitration curve of proteins.23,24
Isothermal Titration Calorimetry. ITC was carried out using amodel VP-ITC (Microcal, Northampton, MA). Both protein andpolymer solutions to be used in HA experiments were made in pH 4.3buffer containing 10 mM phosphate and 90 mM NaCl. All solutionswere filtered (0.22 μm Millipore). After instrument stabilization for atleast 1 h at 25 °C, 40 successive 6 μL injections of 1.4 mM BSA orBLG at intervals of 400 s were used to titrate 1.445 mL of 1.1 and 1.5g/L HA, respectively, with stirring at 315 rpm. Prior to data analysis,heats of dilutions were corrected by subtracting values for polymer-freeblank solutions. ITC data analysis requires (1) conversion of rawcalorimetric data (heat evolved or consumed for each titration step,δΔH°) to a binding isotherm, and (2) model-dependent fitting of thebinding isotherm to yield binding site number (size) and bindingconstants from which ΔG° and, hence, ΔS° can be obtained. The firststep (1) is based on the assumption that any decrease in δΔH° relative
to its initial value is due to incomplete binding of the titrant molecules.In Microcal software, step (2) follows a particular model of protein−ligand interactions based on single site binding or multiple identicalsites. In our case, the protein is the ligand and many protein-bindingsites on the polyelectrolyte can affect each other in various cooperativeand anticooperative ways. Following previous literature,25,26 thermo-grams were transformed into binding isotherms. Then the bindingisotherms were fit by the McGhee−Von Hippel model,27 whichdescribes the binding of interacting or independent ligands (proteins)to a homogeneous one-dimensional lattice (polyelectrolyte). Thebinding model takes on the following form:
ν ν νν
= − −− −
−⎡⎣⎢
⎤⎦⎥L
K nn
n(1 )
11 ( 1)
n
obs
1
(1)
where v represents the binding density, that is, the number of proteinsbound per polymer unit, L is the free-protein concentration, n is thebinding site size (number of polymer units per bound proteinmolecule), and Kobs is the intrinsic binding constant.
■ RESULTS AND DISCUSSIONSAs shown in Figures 1 (insets) and 2, these turbidimetrictitrations can be used to determine the pHs of soluble complexformation (pHc) and liquid−liquid phase separation (pHϕ).Differences in binding affinity of BSA versus BLG, qualitativelyobserved from the pHs of complex formation in Figure 2, leadto differences in the pHs of coacervation from Figure 1. WhileBSA is believed to undergo unfolding below pH 4,28,29 this doesnot appear to directly affect complex formation in that theregion of noninteraction (zero slope in Figure 2A) whichdefines pHc is clearly defined for I = 250 mM, where pHc isobserved at pH = 3.7. Direct comparison of Figure 2A and Bshows that the onsets of binding for BSA and BLG are identicalat I < 75 mM, but at higher ionic strength, values of pHc arehigher for BSA meaning that it binds to HA more strongly.pHc
BSA − pHcBLG, which expresses the higher HA affinity of
BSA at I > 75 mM, ranges from 0.3−1.0 for 75 < I < 135 mM.This leads to pHϕ
BSA > pHϕBLG, which indicates selective
coacervation of BSA as the pH is adjusted downward in thepresence of HA. The difference in affinity is sufficiently large athigh ionic strength so that the more weakly binding proteindoes not affect the binding of the stronger one, as seen from theidentical titration curves for HA/BSA in the presence andabsence of BLG at I ≥ 100 mM (Figures S1 and S2). Eventhough the difference in affinity is greatest at high salt, the lowvalues of the turbidity maxima for the two proteins at the
Figure 2. Determination of transitions from noninteracting solution to soluble complex (pHc) for HA with (A) BSA and (B) BLG at different ionicstrength corresponding to soluble complex formation (pHc). Protein and polymer concentrations are 0.5 and 0.05 g/L, respectively.
highest salt concentrations suggest incomplete coacervation ofprotein/polyanion complexes, to the extent that solutions withboth proteins remain optically clear at all pHs at saltconcentrations above those in Figure 2. The important pointis that the greater HA affinity of BSA versus BLG allows thefirst to be selectively coacervated from the second in the rangeof 75 to 135 mM salt.As the pH is decreased further below pHϕ at fixed I < 150,
cotton-like structures appear, and a third transition can beobserved, operationally defined as in the inset of Figure 1B bythe onset of a steep negative slope (dτ/dpH). This “pHp”resembles the transition from fluid to solid in coacervatedroplets observed microscopically for BSA/PDADMAC at highpH30 and designated as pHprecip. The cooperativity of thisprocess is not as well understood as the reversible phenomenapHc or pHϕ. Even more complex kinetics must be involved inthe process of redissolution of the precipitate, which we observeafter several minutes of stirring at ∼pH 2 at which conditionthe unfolding of BSA might play a significant role. The fact thatprecipitation is suppressed at low pH should be attributed tozero number of COO− per HA repeat unit for pH ≪ pKa(∼2.8) where electrostatics are less important. The ease withwhich the precipitate redissolves at pH 2 seems to suggest thatextensive denaturation of the protein does not occur, eventhough CD shows that HA stabilizes a comformer with lesssecondary structure at pH <3.5. This process was observed tobe reversible with respect to pH, consistent with proteinresistance to acid denaturation.31
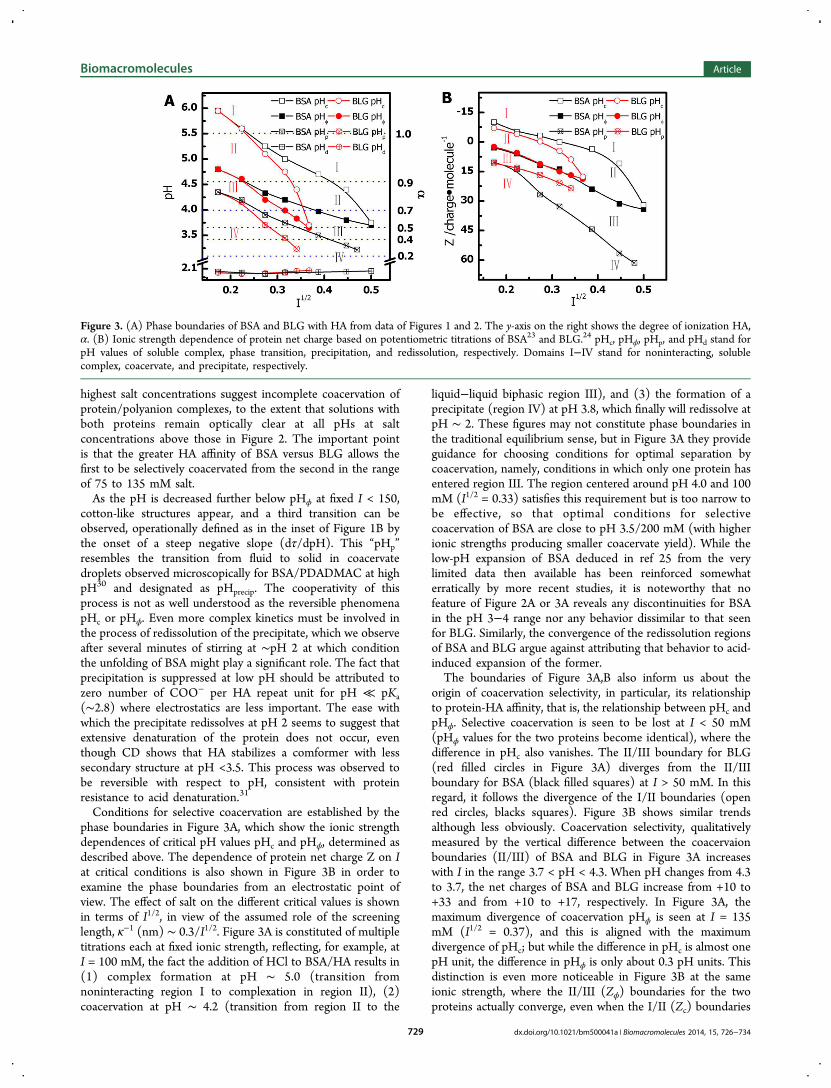
Conditions for selective coacervation are established by thephase boundaries in Figure 3A, which show the ionic strengthdependences of critical pH values pHc and pHϕ, determined asdescribed above. The dependence of protein net charge Z on Iat critical conditions is also shown in Figure 3B in order toexamine the phase boundaries from an electrostatic point ofview. The effect of salt on the different critical values is shownin terms of I1/2, in view of the assumed role of the screeninglength, κ−1 (nm) ∼ 0.3/I1/2. Figure 3A is constituted of multipletitrations each at fixed ionic strength, reflecting, for example, atI = 100 mM, the fact the addition of HCl to BSA/HA results in(1) complex formation at pH ∼ 5.0 (transition fromnoninteracting region I to complexation in region II), (2)coacervation at pH ∼ 4.2 (transition from region II to the
liquid−liquid biphasic region III), and (3) the formation of aprecipitate (region IV) at pH 3.8, which finally will redissolve atpH ∼ 2. These figures may not constitute phase boundaries inthe traditional equilibrium sense, but in Figure 3A they provideguidance for choosing conditions for optimal separation bycoacervation, namely, conditions in which only one protein hasentered region III. The region centered around pH 4.0 and 100mM (I1/2 = 0.33) satisfies this requirement but is too narrow tobe effective, so that optimal conditions for selectivecoacervation of BSA are close to pH 3.5/200 mM (with higherionic strengths producing smaller coacervate yield). While thelow-pH expansion of BSA deduced in ref 25 from the verylimited data then available has been reinforced somewhaterratically by more recent studies, it is noteworthy that nofeature of Figure 2A or 3A reveals any discontinuities for BSAin the pH 3−4 range nor any behavior dissimilar to that seenfor BLG. Similarly, the convergence of the redissolution regionsof BSA and BLG argue against attributing that behavior to acid-induced expansion of the former.The boundaries of Figure 3A,B also inform us about the
origin of coacervation selectivity, in particular, its relationshipto protein-HA affinity, that is, the relationship between pHc andpHϕ. Selective coacervation is seen to be lost at I < 50 mM(pHϕ values for the two proteins become identical), where thedifference in pHc also vanishes. The II/III boundary for BLG(red filled circles in Figure 3A) diverges from the II/IIIboundary for BSA (black filled squares) at I > 50 mM. In thisregard, it follows the divergence of the I/II boundaries (openred circles, blacks squares). Figure 3B shows similar trendsalthough less obviously. Coacervation selectivity, qualitativelymeasured by the vertical difference between the coacervaionboundaries (II/III) of BSA and BLG in Figure 3A increaseswith I in the range 3.7 < pH < 4.3. When pH changes from 4.3to 3.7, the net charges of BSA and BLG increase from +10 to+33 and from +10 to +17, respectively. In Figure 3A, themaximum divergence of coacervation pHϕ is seen at I = 135mM (I1/2 = 0.37), and this is aligned with the maximumdivergence of pHc; but while the difference in pHc is almost onepH unit, the difference in pHϕ is only about 0.3 pH units. Thisdistinction is even more noticeable in Figure 3B at the sameionic strength, where the II/III (Zϕ) boundaries for the twoproteins actually converge, even when the I/II (Zc) boundaries
Figure 3. (A) Phase boundaries of BSA and BLG with HA from data of Figures 1 and 2. The y-axis on the right shows the degree of ionization HA,α. (B) Ionic strength dependence of protein net charge based on potentiometric titrations of BSA23 and BLG.24 pHc, pHϕ, pHp, and pHd stand forpH values of soluble complex, phase transition, precipitation, and redissolution, respectively. Domains I−IV stand for noninteracting, solublecomplex, coacervate, and precipitate, respectively.
are well separated. This means that net protein charge is moreimportant than charge patch for the II/III boundary, that is,charge anisotropy does not play a dominant role for the II/IIIboundary. The value of pHc for BSA is typically higher thanBLG (Figure 3A); and BSA binds HA more strongly than doesBLG of the same net charge at any give ionic strength (Figure3B). Nevertheless, at the relevant ionic strengths, the tendencyof BSA to coacervate is identical to the coacervation tendencyof BLG with the same net charge (congruence of the II/IIIboundaries if Figure 3B). Thus, complexation and coacervationorginate from different driving forces, the former from the localinteraction between HA and the protein domain and the latterfrom more long-range interactions between complexes. Putdifferently, pHc or Zc qualitatively describe the PE-proteinbinding affinity, that is, the binding constant that determinesthe degree of occupancy of the protein-binding sites on thepolymer.2 If the condition for coacervation is complex chargeneutralization,13 it can be described by
= = +Z Z nZ0T PE Pr (2)
where ZT is the total charge of polymer chain bound byproteins, ZPE is the charge of polyelectrolyte, ZPr is the chargeof protein, and n is the number of proteins bound per polymerchain and depends on its binding constant and free proteinconcentration. ZPE is a linear function of α (the degree ofionization of HA) and ZPr is a protein-specific function of pH.However, nϕ depends both on the binding constant and theprotein charge and these two effects are difficult to resolve atpH < pI. The higher binding affinity due to charge anisotropymay increase n for BSA, but its higher value of ZPr leads to alower value for nϕ, and two effects (affinity and net charge) maycompensate.Affinity may be considered from a more local point of view.
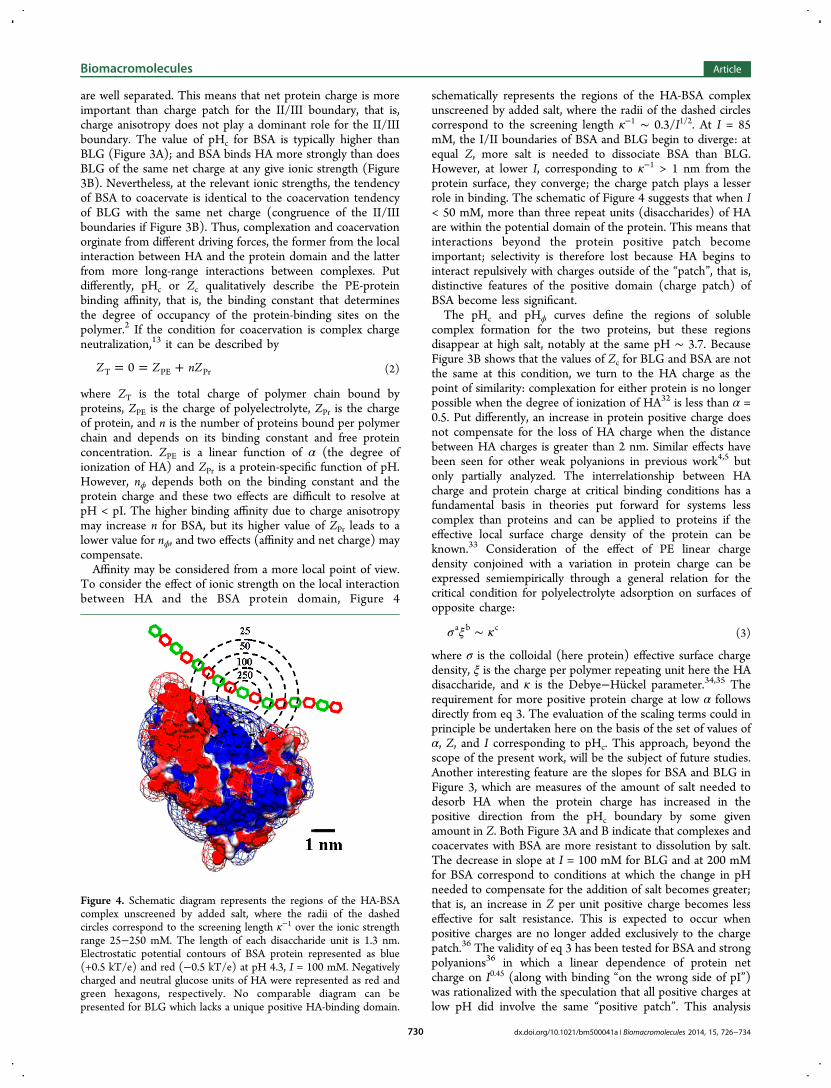
To consider the effect of ionic strength on the local interactionbetween HA and the BSA protein domain, Figure 4
schematically represents the regions of the HA-BSA complexunscreened by added salt, where the radii of the dashed circlescorrespond to the screening length κ−1 ∼ 0.3/I1/2. At I = 85mM, the I/II boundaries of BSA and BLG begin to diverge: atequal Z, more salt is needed to dissociate BSA than BLG.However, at lower I, corresponding to κ−1 > 1 nm from theprotein surface, they converge; the charge patch plays a lesserrole in binding. The schematic of Figure 4 suggests that when I< 50 mM, more than three repeat units (disaccharides) of HAare within the potential domain of the protein. This means thatinteractions beyond the protein positive patch becomeimportant; selectivity is therefore lost because HA begins tointeract repulsively with charges outside of the “patch”, that is,distinctive features of the positive domain (charge patch) ofBSA become less significant.The pHc and pHϕ curves define the regions of soluble
complex formation for the two proteins, but these regionsdisappear at high salt, notably at the same pH ∼ 3.7. BecauseFigure 3B shows that the values of Zc for BLG and BSA are notthe same at this condition, we turn to the HA charge as thepoint of similarity: complexation for either protein is no longerpossible when the degree of ionization of HA32 is less than α =0.5. Put differently, an increase in protein positive charge doesnot compensate for the loss of HA charge when the distancebetween HA charges is greater than 2 nm. Similar effects havebeen seen for other weak polyanions in previous work4,5 butonly partially analyzed. The interrelationship between HAcharge and protein charge at critical binding conditions has afundamental basis in theories put forward for systems lesscomplex than proteins and can be applied to proteins if theeffective local surface charge density of the protein can beknown.33 Consideration of the effect of PE linear chargedensity conjoined with a variation in protein charge can beexpressed semiempirically through a general relation for thecritical condition for polyelectrolyte adsorption on surfaces ofopposite charge:
σ ξ κ∼a b c (3)
where σ is the colloidal (here protein) effective surface chargedensity, ξ is the charge per polymer repeating unit here the HAdisaccharide, and κ is the Debye−Huckel parameter.34,35 Therequirement for more positive protein charge at low α followsdirectly from eq 3. The evaluation of the scaling terms could inprinciple be undertaken here on the basis of the set of values ofα, Z, and I corresponding to pHc. This approach, beyond thescope of the present work, will be the subject of future studies.Another interesting feature are the slopes for BSA and BLG inFigure 3, which are measures of the amount of salt needed todesorb HA when the protein charge has increased in thepositive direction from the pHc boundary by some givenamount in Z. Both Figure 3A and B indicate that complexes andcoacervates with BSA are more resistant to dissolution by salt.The decrease in slope at I = 100 mM for BLG and at 200 mMfor BSA correspond to conditions at which the change in pHneeded to compensate for the addition of salt becomes greater;that is, an increase in Z per unit positive charge becomes lesseffective for salt resistance. This is expected to occur whenpositive charges are no longer added exclusively to the chargepatch.36 The validity of eq 3 has been tested for BSA and strongpolyanions36 in which a linear dependence of protein netcharge on I0.45 (along with binding “on the wrong side of pI”)was rationalized with the speculation that all positive charges atlow pH did involve the same “positive patch”. This analysis
Figure 4. Schematic diagram represents the regions of the HA-BSAcomplex unscreened by added salt, where the radii of the dashedcircles correspond to the screening length κ−1 over the ionic strengthrange 25−250 mM. The length of each disaccharide unit is 1.3 nm.Electrostatic potential contours of BSA protein represented as blue(+0.5 kT/e) and red (−0.5 kT/e) at pH 4.3, I = 100 mM. Negativelycharged and neutral glucose units of HA were represented as red andgreen hexagons, respectively. No comparable diagram can bepresented for BLG which lacks a unique positive HA-binding domain.
could not be relevant to conditions of BSA unfolding at pH <3.5, but this only affects the data points above I = 400 mM inFigure 3A,B.The onset of precipitation (region IV) is expected to occur
more readily (at a higher pH), for low ionic strength, and forthe higher HA-affinity protein, BSA. In fact, in Figure 3A the II/III boundaries appear to parallel the III/IV boundaries, both forBSA and BLG; that is, the precipitation domain is moreextensive for BSA. This similarity of ionic strength dependencesimplies that the forces responsible for the formation ofprecipitate are similar to the forces involved in coacervation,that is, involving both local and global charges. In this sense,precipitation might be viewed as a continuation of coacervation,that is, further loss of solvation due to strong interactions at lowsalt. However, differences between BSA and BLG pH/I phaseboundaries could arise somewhat trivially from the largedifference in their protein net charge. For this reason, we turnto Figure 3B, in which comparisons are made at fixed Z, a morefundamental parameter than pH. While the I/II boundaries inFigure 3B indicate stronger complex formation for BSA, andthe II/III boundaries suggest equivalent tendencies tocoacervate (at fixed Z), that is, the III/IV boundaries areinverted: they appear to suggest that further progression toprecipitate is favored for BLG but more directly point out thatBLG at the onset of precipitation has a smaller global positivecharge. Despite its lower positive charge, the surface chargedensity ratio is somewhat larger for BLG (especially if there ispartial unfolding of BSA), and the volume charge density isalmost twice as large. This leads to greater ion-pairing andcounterion expulsion, thus, desolvation; that is, precipitationoccurs more readily. The markedly different III/IV boundariesfor BLG and BSA in Figure 3B are clarified through theirinverse slopes (dZ/dI1/2)−1, that is, ΔI1/2p, the amount of saltrequired to reverse precipitation arising from an increase inprotein net charge. In this way, identical increases in Z have astronger precipitating effect for BLG. It is of interest to note theremarkably uniform dependence of Zp on I1/2 for BSA; thissuggests that the addition of some particular number of chargeshas the same effect on ΔI1/2p, regardless of the positions ofthose charges. This implies a dominant role for net proteinsurface charge density.This viewpoint explains how BLG’s higher global surface
charge density can lead to a more robust precipitate. However,the absence of even complex formation for BLG at I > 135 mMprecludes the formation of any dense phase for this protein athigh salt. For BSA, the III/IV boundary in Figure 3B is seen toterminate at Z = +60, I = 250 mM. This data point representsthe limiting condition for precipitation, which extends beyondthe limiting condition for coacervation or complex formation:Both of these are impossible at α < 0.5, but precipitation canoccur at α below 0.3. Despite the low HA charge density, HAflexibility may be sufficient for the polymer to conform to theglobally positive protein in a such a way that the number ofHA-protein “ion pairs” increases more dramatically for thecoacervate−precipitate transition than for complexation. Putdifferently, while the number of COO− per HA repeat unit issmall at low pH, all of them can be within the regions ofpositive protein potential which is large at low pH. On theother hand, precipitation is totally suppressed at pH 2; here allprecipitates redissolve in the vicinity of α = 0, whereelectrostatics are less important. While PE-protein precipitationis common and selective precipitation has been suggested as a
means of protein separation,37 facile recovery from coacervaterequires less extreme conditions.Microscopic observation reveals both separation efficacy and
large-scale changes in liquid−liquid suspension formed from amixture of HA with BSA and BLG, labeled with FITC andRITC, respectively. As shown in Figure 5, the protein-rich
coacervate mainly comprises the FITC-labeled BSA. After ∼10min, a continuous coacervate film appears to form, in part as aconsequence of the fusion of large droplets and subsequentsedimentation, for example, Figure 5C. A more quantitativeanalysis of protein separation by coacervation at pH 3.5, I = 200mM, was obtained by SEC of supernatant and redissolvedcoacervate. Figure 6 shows SEC chromatograms for thesupernatant, the control, and the redissolved coacervatephase. The peaks at 24 and 27 min correspond to BSA andBLG, respectively. The efficiency or yield of BSA coacervationwith PE (the percent of the target protein in the coacervate) is
Figure 5. Fluorescence images of the ternary coacervate by confocallaser microscope as a function of time (seconds): (A) 80, (B) 140, (C)260, (D) 400, (E) 550, and (F) 700 after mixing RITC-BLG/FITC-BSA/HA at pH 3.5; I = 200 mM. Scale bar 10 μm.
Figure 6. SEC analysis of proteins in different phases separated at pH3.5, I = 200 mM. (a) 1:1 BSA/BLG total protein 10 g/L (prior tointeraction): black solid line; (b) supernatant, filtered and injected:green dashed line; and (c) coacervate: red dotted line. The elution ofHA at about 5 min is not shown.
above 70%. The selectivity of the coacervation38 can bedescribed in terms of a selectivity ratio:
= ′S P P P P( / ) /( / )A B A B (4)
where P is the SEC peak area, A and B designate the proteins(here BSA and BLG, respectively), and the prime designatesthe coacervate (vs supernatant). The value of S here for BSA/BLG is ∼72, similar to the value found for coacervation withPDADMAC (∼70), although the target protein in that case isBLG. For both forms of coacervation, that is, polyanion or
polycation, separation occurs with simultaneous precipitation ofBLG. Thus, the dense phase after centrifugation displays threelayers: the upper two are optically clear fluids, identified assupernatant and coacervate, whereas the bottom layer is thesolid precipitation of BLG (identified by the red color ofRITC). Unlike coacervation, BLG precipitation is a kinetic asopposed to an equilibrium process; like coacervation, itdepends on both pH and I. In the present case, the targetprotein BSA is concentrated in the coacervate. The “optimalpH, I condition” selected from the phase boundaries of Figure3A, might adventitiously provide better separation by making
Figure 7. Isothermal calorimetry titration thermogram for (A) BSA-HA and (B) BLG-HA. Binding isotherm for (C) BSA-HA and (D) BLG-HA.Solvent (for both protein and polymer): 10 mM phosphate and 90 mM NaCl. Incremental volume of titrant: 6 μL; injection in 14.4 s.
Figure 8. McGhee−Von Hippel fitting of (A) BSA-HA and (B) BLG-HA. Dotted lines are experimental binding isotherms; solid lines are nonlinearleast-squares fitting by eq 1.
BLG unavailable for coacervation through its precipitation, butthat process may be less easy to control.Figure 3A indicates that selective coacervation cannot be
obtained when pHc values of the two proteins are identical. pHcis qualitatively correlated in some way with binding affinity, inthat, at any given pH, the protein with the higher value of pHcwill bind a polyanion more strongly. ITC measurements wereconducted to quantitatively compare the thermodynamics ofHA binding of BSA versus BLG. In the raw data of Figure 7, thevertical peaks correspond to the heat change in the cellcontaining HA at each protein injection. While the measure-ment of the heat of binding by ITC is straightforward, thevalues of entropy or energy obtained are model-dependent.The binding isotherm was fit by the overlapping binding site(McGhee von Hippel) model27 previously applied to a numberof protein−polyelectrolyte systems, notably BLG and pectin.26
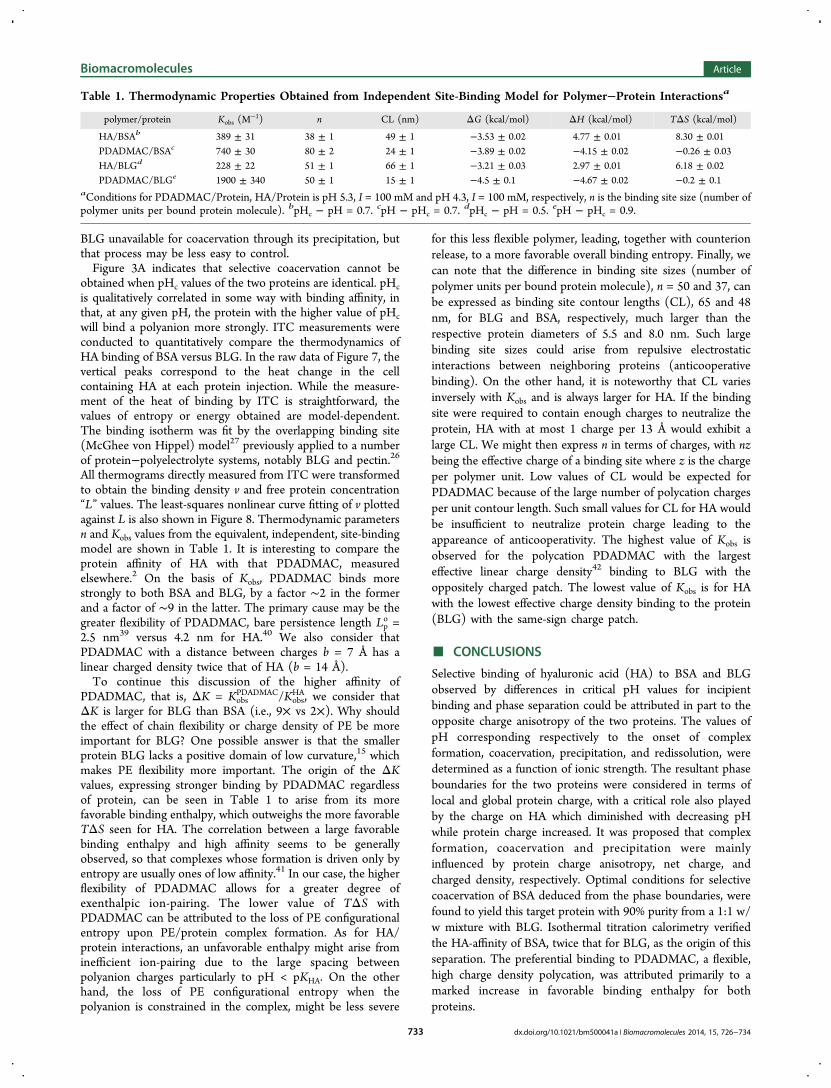
All thermograms directly measured from ITC were transformedto obtain the binding density v and free protein concentration“L” values. The least-squares nonlinear curve fitting of v plottedagainst L is also shown in Figure 8. Thermodynamic parametersn and Kobs values from the equivalent, independent, site-bindingmodel are shown in Table 1. It is interesting to compare theprotein affinity of HA with that PDADMAC, measuredelsewhere.2 On the basis of Kobs, PDADMAC binds morestrongly to both BSA and BLG, by a factor ∼2 in the formerand a factor of ∼9 in the latter. The primary cause may be thegreater flexibility of PDADMAC, bare persistence length Lp
o =2.5 nm39 versus 4.2 nm for HA.40 We also consider thatPDADMAC with a distance between charges b = 7 Å has alinear charged density twice that of HA (b = 14 Å).To continue this discussion of the higher affinity of
PDADMAC, that is, ΔK = KobsPDADMAC/Kobs
HA, we consider thatΔK is larger for BLG than BSA (i.e., 9× vs 2×). Why shouldthe effect of chain flexibility or charge density of PE be moreimportant for BLG? One possible answer is that the smallerprotein BLG lacks a positive domain of low curvature,15 whichmakes PE flexibility more important. The origin of the ΔKvalues, expressing stronger binding by PDADMAC regardlessof protein, can be seen in Table 1 to arise from its morefavorable binding enthalpy, which outweighs the more favorableTΔS seen for HA. The correlation between a large favorablebinding enthalpy and high affinity seems to be generallyobserved, so that complexes whose formation is driven only byentropy are usually ones of low affinity.41 In our case, the higherflexibility of PDADMAC allows for a greater degree ofexenthalpic ion-pairing. The lower value of TΔS withPDADMAC can be attributed to the loss of PE configurationalentropy upon PE/protein complex formation. As for HA/protein interactions, an unfavorable enthalpy might arise frominefficient ion-pairing due to the large spacing betweenpolyanion charges particularly to pH < pKHA. On the otherhand, the loss of PE configurational entropy when thepolyanion is constrained in the complex, might be less severe
for this less flexible polymer, leading, together with counterionrelease, to a more favorable overall binding entropy. Finally, wecan note that the difference in binding site sizes (number ofpolymer units per bound protein molecule), n = 50 and 37, canbe expressed as binding site contour lengths (CL), 65 and 48nm, for BLG and BSA, respectively, much larger than therespective protein diameters of 5.5 and 8.0 nm. Such largebinding site sizes could arise from repulsive electrostaticinteractions between neighboring proteins (anticooperativebinding). On the other hand, it is noteworthy that CL variesinversely with Kobs and is always larger for HA. If the bindingsite were required to contain enough charges to neutralize theprotein, HA with at most 1 charge per 13 Å would exhibit alarge CL. We might then express n in terms of charges, with nzbeing the effective charge of a binding site where z is the chargeper polymer unit. Low values of CL would be expected forPDADMAC because of the large number of polycation chargesper unit contour length. Such small values for CL for HA wouldbe insufficient to neutralize protein charge leading to theappareance of anticooperativity. The highest value of Kobs isobserved for the polycation PDADMAC with the largesteffective linear charge density42 binding to BLG with theoppositely charged patch. The lowest value of Kobs is for HAwith the lowest effective charge density binding to the protein(BLG) with the same-sign charge patch.
■ CONCLUSIONS
Selective binding of hyaluronic acid (HA) to BSA and BLGobserved by differences in critical pH values for incipientbinding and phase separation could be attributed in part to theopposite charge anisotropy of the two proteins. The values ofpH corresponding respectively to the onset of complexformation, coacervation, precipitation, and redissolution, weredetermined as a function of ionic strength. The resultant phaseboundaries for the two proteins were considered in terms oflocal and global protein charge, with a critical role also playedby the charge on HA which diminished with decreasing pHwhile protein charge increased. It was proposed that complexformation, coacervation and precipitation were mainlyinfluenced by protein charge anisotropy, net charge, andcharged density, respectively. Optimal conditions for selectivecoacervation of BSA deduced from the phase boundaries, werefound to yield this target protein with 90% purity from a 1:1 w/w mixture with BLG. Isothermal titration calorimetry verifiedthe HA-affinity of BSA, twice that for BLG, as the origin of thisseparation. The preferential binding to PDADMAC, a flexible,high charge density polycation, was attributed primarily to amarked increase in favorable binding enthalpy for bothproteins.
Table 1. Thermodynamic Properties Obtained from Independent Site-Binding Model for Polymer−Protein Interactionsa
aConditions for PDADMAC/Protein, HA/Protein is pH 5.3, I = 100 mM and pH 4.3, I = 100 mM, respectively, n is the binding site size (number ofpolymer units per bound protein molecule). bpHc − pH = 0.7. cpH − pHc = 0.7. dpHc − pH = 0.5. epH − pHc = 0.9.
*S Supporting InformationTurbidimetric titration of HA with BSA, HA with BLG, and HAwith BSA/BLG mixture in 100 mM NaCl. Turbidimetrictitration of HA and BSA with and without BLG in 200 mMNaCl. Fluorescence image of FITC-BSA/RITC-HA coacervatesuspension by confocal laser microscopy. This material isavailable free of charge via the Internet at http://pubs.acs.org.
■ AUTHOR INFORMATION
NotesThe authors declare no competing financial interest.
■ ACKNOWLEDGMENTS
The project was supported by the National Science Foundation(CBET-1133289, CBET-0966923) and MRSEC in UMASS.We thank Daniel Seeman and Dr. Julian McClements forassistance with protein modeling and isothermal titrationcalorimetry, respectively.
■ REFERENCES(1) Kayitmazer, A. B.; Seeman, D.; Minsky, B. B.; Dubin, P. L.; Xu, Y.Soft Matter 2013, 9, 2553.(2) Xu, Y.; Mazzawi, M.; Chen, K.; Sun, L.; Dubin, P. L.Biomacromolecules 2011, 12, 1512.(3) Turgeon, S. L.; Schmitt, C.; Sanchez, C. Curr. Opin. ColloidInterface Sci. 2007, 12, 166.(4) Sperber, B. L. H. M.; Schols, H. A.; Stuart, M. A. C.; Norde, W.;Voragen, A. G. J. Food Hydrocolloids 2009, 23, 765.(5) Weinbreck, F.; de Vries, R.; Schrooyen, P.; de Kruif, C. G.Biomacromolecules 2003, 4, 293.(6) Kamarck, M. E. Nat. Biotechnol. 2006, 24, 503.(7) Nfor, B. K.; Ahamed, T.; van Dedem, G. W. K.; van der Wielen,L. A. M.; van de Sandt, E. J. A. X.; Eppink, M. H. M.; Ottens, M. J.Chem. Technol. Biotechnol. 2008, 83, 124.(8) Meyer, V. R. Practical High-Performance Liquid Chromatography;Wiley: Chichester, U.K., 2010.(9) Ghosh, R. J. Chromatogr. A 2002, 952, 13.(10) Xia, J.; Mattison, K.; Romano, V.; Dubin, P. L.; Muhoberac, B.B. Biopolymers 1997, 41, 359.(11) Mattison, K. W.; Dubin, P. L.; Brittain, I. J. J. Phys. Chem. B1998, 102, 3830.(12) Cooper, C.; Kayitmazer, A. B.; Turksen, S.; Dubin, P. L. Curr.Opin. Colloid Interface Sci. 2005, 10, 52.(13) Antonov, M.; Mazzawi, M.; Dubin, P. L. Biomacromolecules2009, 11, 51.(14) Henzler, K.; Haupt, B.; Lauterbach, K.; Wittemann, A.; Borisov,O.; Ballauff, M. J. Am. Chem. Soc. 2010, 132, 3159.(15) Grymonpre, K. R.; Staggemeir, B. A.; Dubin, P. L.; Mattison, K.W. Biomacromolecules 2001, 2, 422.(16) Hattori, T.; Hallberg, R.; Dubin, P. L. Langmuir 2000, 16, 9738.(17) Gok, E.; Olgaz, S. J. Fluoresc. 2004, 14, 203.(18) Desfougeres, Y.; Croguennec, T.; Lechevalier, V.; Bouhallab, S.;Nau, F. J. Phys. Chem. B 2010, 114, 4138−4144.(19) Goding, J. W. J. Immunol. Methods 1976, 13, 215.(20) Harlow, E., Lane, D., Eds. In Antibodies: A Laboratory Manual;Cold Spring Harbor, NY, 1988; pp 353−355.(21) Nicholls, A.; Honig, B. J. Comput. Chem. 1991, 12, 435.(22) Tanford, C.; Kirkwood, J. G. J. Am. Chem. Soc. 1957, 79, 5333.(23) Tanford, C.; Swanson, S. A.; Shore, W. S. J. Am. Chem. Soc.1955, 77, 6414.(24) Nozaki, Y.; Bunville, L. G.; Tanford, C. J. Am. Chem. Soc. 1959,81, 5523.(25) Tomme, P.; Creagh, A. L.; Kilburn, D. G.; Haynes, C. A.Biochemistry 1996, 35, 13885.
(26) Girard, M.; Turgeon, S. L.; Gauthier, S. F. J. Agric. Food Chem.2003, 51, 4450.(27) McGhee, J. D.; von Hippel, P. H. J. Mol. Biol. 1974, 86, 469.(28) Raj, T.; Flygare, W. H. Biochemistry 1974, 13, 3336.(29) Bhattacharya, M.; Mukhopadhyay, S. J. Phys. Chem. B 2012, 116,520.(30) Kaibara, K.; Okazaki, T.; Bohidar, H. B.; Dubin, P. L.Biomacromolecules 2000, 1, 100.(31) Casal, H. L.; Kohler, U.; Mantch, H. H. Biochim. Biophys. Acta1988, 957, 11.(32) Staggemeier B. A. Studies of protein-polyelectrolyte binding: Acomparison of biological and synthetic polyelectrolytes Dissertation,Purdue University, IN, 1999.(33) Hayashi, K.; Tsutsumi, K.; Nakajima, F.; Norisuye, T.;Teramoto, A. Macromolecules 1995, 28, 3824.(34) Muthukumar, M. J. Chem. Phys. 1987, 86, 7230.(35) Odijk, T. Macromolecules 1980, 13, 1542.(36) Cooper, C. L.; Goulding, A.; Kayitmazer, A. B.; Ulrich, S.; Stoll,S.; Turksen, S.; Yusa, S.; Kumar, A.; Dubin, P. L. Biomacromolecules2006, 7, 1025.(37) Boeris, V.; Romanini, D.; Farruggia, B.; Pico, G. Process Biochem.2009, 44, 588.(38) Wang, Y.; Gao, J.; Dubin, P. L. Biotechnol. Prog. 1996, 12, 356.(39) Dautzenberg, H.; Goernitz, E.; Jaeger, W.Macromol. Chem. Phys.1998, 199, 1561.(40) Ball, V.; Winterhalter, M.; Schwinte, P.; Lavalle, Ph.; Voegel, J.-C.; Schaaf, P. J. Phys. Chem. B 2002, 106, 2357.(41) Sperber, B. L. H. M.; Cohen Stuart, M. A.; Schols, H. A.;Voragen, A. G. J.; Norde, W. Biomacromolecules 2010, 11, 3578.(42) Kayitmazer, A. B.; Shaw, D.; Dubin, P. L. Macromolecules 2005,38, 5198−5024.