57
Protein structure and function from sequences Lars Liljas Department of Cell and Molecular Biology University of Uppsala Uppsala, Sweden v 2.4.2 060111
Protein structure and function fromsequences
Lars Liljas
Department of Cell and Molecular BiologyUniversity of UppsalaUppsala, Sweden
v 2.4.2 060111

2

3
PROTEIN FOLDING, TAXONOMY AND EVOLUTION
Protein Folding and Stability
Proteins need a defined conformation for their function
The main goal of the efforts to accumulate vast numbers of nucleotidesequences is to increase our understanding of various biological processes, both at themolecular level and at the level of the complete organism. In most such processes,proteins are the main actors, and it is therefore important to find means to translate thesequence information into an understanding of protein function. Our methods to do thatare built on our general knowledge about the relation between protein sequence andconformation and about the evolution of protein sequences, structure and function.
The function of a protein is determined by its three-dimensional conformation.Most proteins are designed to bind other proteins or molecules, and this propertydepends on their ability to form and maintain an exact spatial organization of functionalgroups. Normally, proteins have a relatively well-defined conformation, but they are notrigid. Various types of conformational flexibility (side chain and loop movements,domain rotations) are often crucial for their function.
The folding process
The conformation or tertiary structure of a protein is defined by its amino acidsequence and therefore by the nucleotide sequence of the corresponding genes. Thedirect relation between the conformation and the amino acid sequence of a protein wasfirst proven by Anfinsen's experiments 1, where a functional staphylococcal nucleasewas reconstituted from denatured fragments of the protein. It is still valid to assume thatthe conformation of a protein is determined by its amino acid sequence, but we nowknow a lot more about the process by which the chain of amino acid residues finds itscorrect conformation, the folding process.
There are an enormous number of theoretically possible conformations of thepolypeptide chain of even a small protein. Folding of proteins is fast, which means thatthe polypeptide chain cannot "try" all these conformations to find the most stable one.One solution to this problem would be that the folding follows one or a limited numberof pathways to the final fold. It is also possible that the folding occurs while thepolypeptide chain is formed, co-translational folding. Therefore, it cannot be excluded

4
that the folding process itself and its kinetics are important for the final conformation,and that not only the native conformation, but also the folding process are coded in theamino acid sequence.
For most proteins, the native conformation seems to be the most stableconformation, although the energy difference between the folded and unfolded state ingeneral is small. It is even possible that the native fold does not represent theconformation of lowest energy since the folding process might not allow a pathwayreaching this state. The native state is in such a case the conformation of lowest energythat can be reached by the folding process. The small difference in energy between theunfolded and folded state is also a property that is important for the biological functionof proteins. The function of a protein often depends on some type of flexibility, and thecontrol of various processes requires that proteins have a limited lifetime and can bedegraded. A very stable protein conformation is not consistent with these properties.
The folding pathway seems to differ considerably between proteins 2. Someproteins seem to fold without any intermediate stages. For other proteins, the foldinginvolves intermediates, sometimes called molten globules, where some of the nativeinteractions are established, but the fully compacted conformation has not been reached.For example, secondary structure elements like helices and sheets are formed, but theyare not optimally packed in these intermediates.
In cells, there are also a number of proteins, chaperones that aid some proteinsin their folding. Chaperones are not specific for a certain fold. The function ofchaperones like the bacterial GroEL and the eukaryotic heat shock proteins seem to beto bind to proteins in a way that allow misfolded proteins to refold. Their role is thus toimprove the efficiency of the folding rather than to govern the folding process to aspecific conformation.
Some proteins can only fold properly as precursor proteins, where a segment ofthe polypeptide chain is removed after the folding is complete. A well-known exampleis the small protein-hormone insulin. The function of such a segment is probably toremove a kinetic barrier in the folding pathway.
Factors of importance for protein stability
The stability of the folded protein is due a number of factors. The energy of thewhole system, including the surrounding solution, is important for the folding.Hydrogen bonds and charge interactions between polar groups, and weak van der Waalsinteractions between closely packed atoms contribute to the stability. Most important,
5
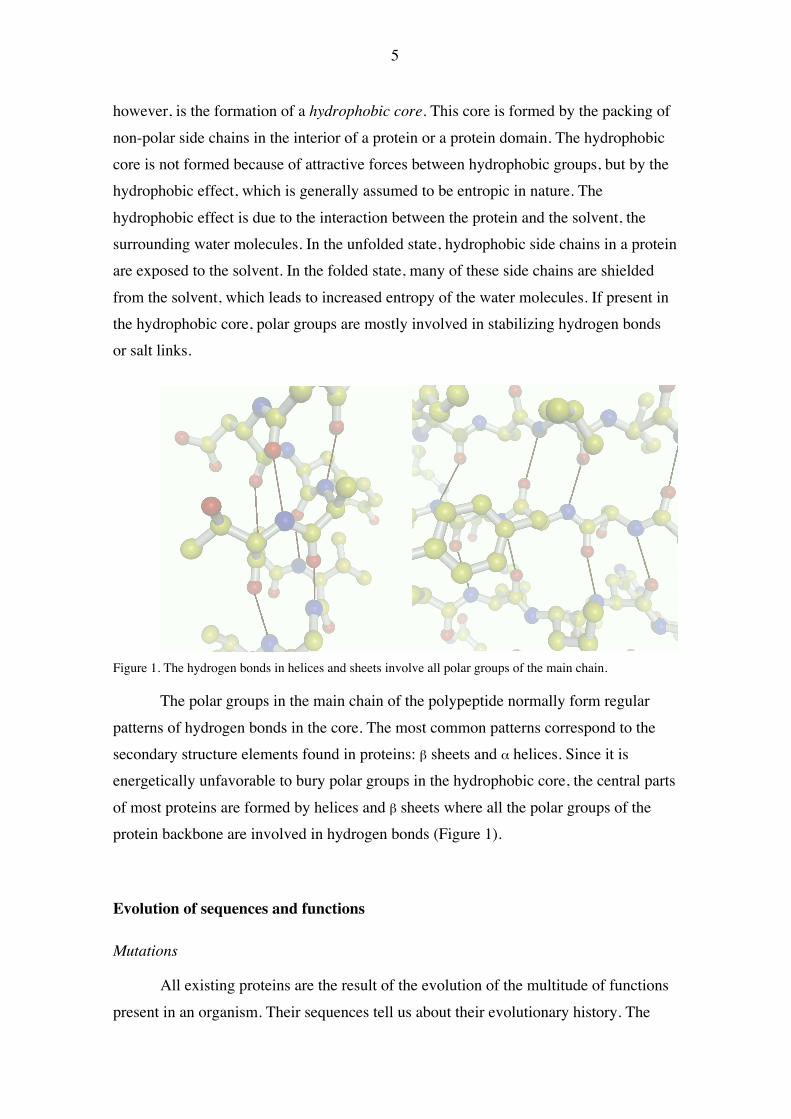
however, is the formation of a hydrophobic core. This core is formed by the packing ofnon-polar side chains in the interior of a protein or a protein domain. The hydrophobiccore is not formed because of attractive forces between hydrophobic groups, but by thehydrophobic effect, which is generally assumed to be entropic in nature. Thehydrophobic effect is due to the interaction between the protein and the solvent, thesurrounding water molecules. In the unfolded state, hydrophobic side chains in a proteinare exposed to the solvent. In the folded state, many of these side chains are shieldedfrom the solvent, which leads to increased entropy of the water molecules. If present inthe hydrophobic core, polar groups are mostly involved in stabilizing hydrogen bondsor salt links.
Figure 1. The hydrogen bonds in helices and sheets involve all polar groups of the main chain.
The polar groups in the main chain of the polypeptide normally form regularpatterns of hydrogen bonds in the core. The most common patterns correspond to thesecondary structure elements found in proteins: β sheets and α helices. Since it isenergetically unfavorable to bury polar groups in the hydrophobic core, the central partsof most proteins are formed by helices and β sheets where all the polar groups of theprotein backbone are involved in hydrogen bonds (Figure 1).
Evolution of sequences and functions
Mutations
All existing proteins are the result of the evolution of the multitude of functionspresent in an organism. Their sequences tell us about their evolutionary history. The
6
evolution has been enabled by mutations in the genome, but the process has proceededby changes in functional properties of proteins leading to changes in the organisms.Although we will never be able to reconstruct our evolutionary history, a study ofexisting sequences and proteins will tell us something about this process.
When two proteins have evolved from a common ancestor protein they arehomologous. Homologous proteins from different organisms have differences in theirsequences, and these differences are to some extent proportional to the evolutionarydistance of the organisms. For a specific protein, the sequences of the human and ratproteins are much more similar then those of the human and shark proteins. The mainreason for this is that many of the observed mutations are neutral. This term fromevolutionary theory means that a certain change in the sequence does not give theorganism any significant selective advantage (or disadvantage). In a protein, thiscorresponds to the fact that many sequence changes by themselves do not change theconformation of a protein significantly. The mutated protein will therefore be able tofulfill the same function as the original one. For example, replacement of a residue atthe surface of the protein will in most cases not influence its conformation at all. Aslong as the residue is not involved in any interactions with other molecules, themutation will not change the properties of the protein. Over long time periods, proteinsmight therefore accumulate changes. For a specific protein, these changes seem to occurat a relatively constant rate. This leads to the observed relation between sequencedifference and evolutionary distance.
When homologous proteins in distantly related organisms are compared, thesequences might have changed to the extent that there is no sequence similarity that canbe detected by a statistical analysis. In such cases, the protein conformation is stillessentially the same, showing the same topology (arrangement of secondary structureelements). Protein conformation is thus more conserved than sequence. This has theconsequence that there are cases when a relation between proteins is obvious only whenthe tertiary structure is known.
Variable sequence constraints within a protein
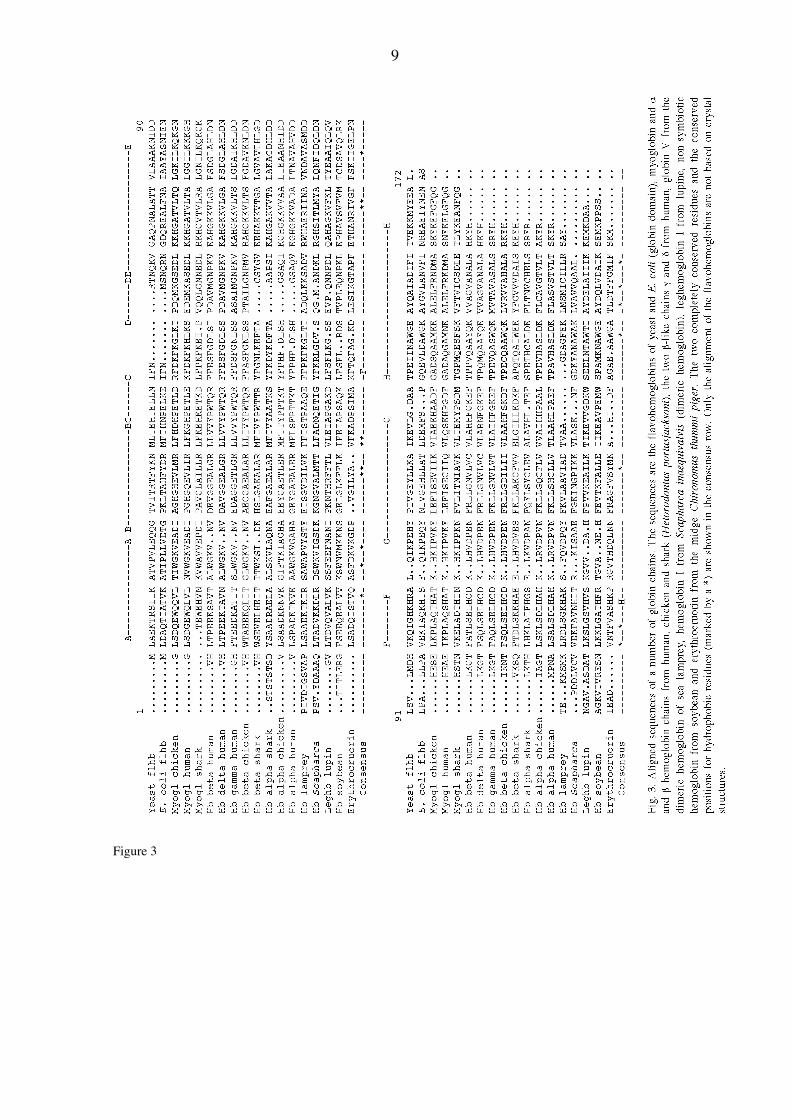
Although many sequence changes can occur without effects in the proteinfunction, other changes will affect the function in a negative way and will therefore notbe retained in the evolution. Because of that, the changes in sequences show patternsthat are related to the structural and functional properties of the proteins. A view ofthese patterns in a well-known protein with an interesting evolutionary history is shown
7
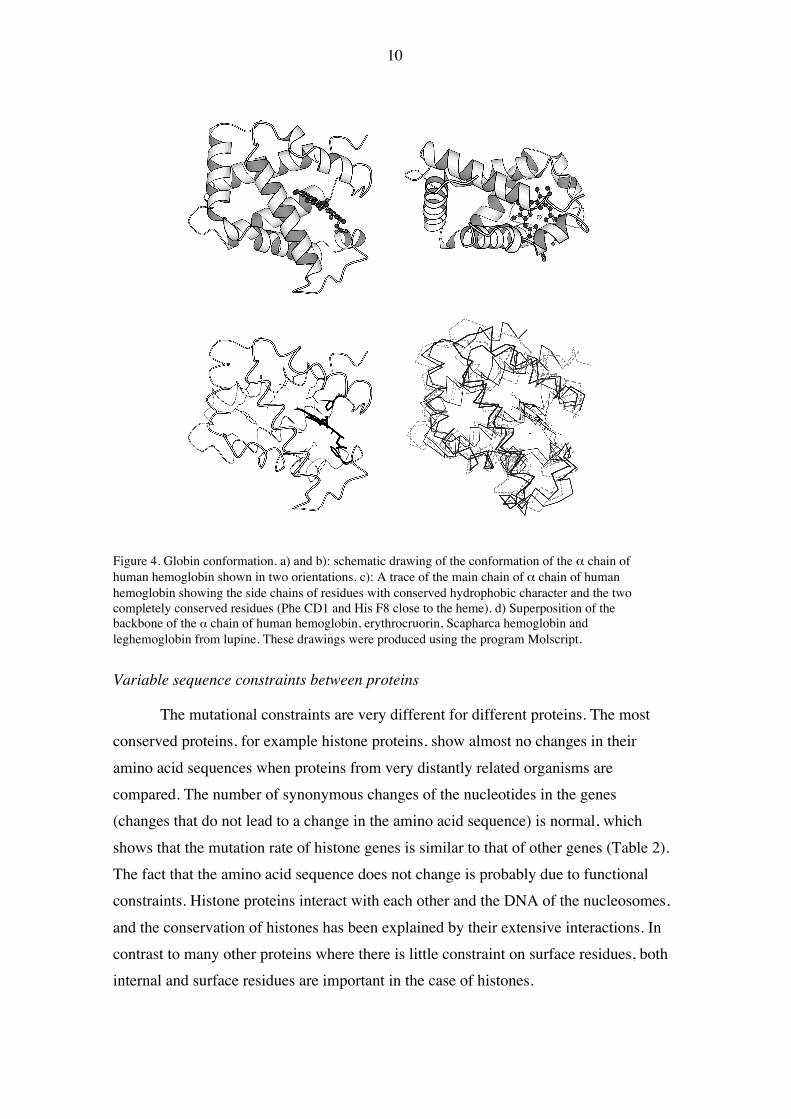
in Figure 3. The figure shows the aligned sequences of a number of globinsrepresenting widely different evolutionary distances. For some of them, the sequencesimilarity is not statistically significant. Figure 4 shows the globin structure. Theconformation is obvious from Figure 4a and b, which shows that the protein iscomposed of two layers of helices arranged around the heme group.
Closely related proteins show sequence changes in surface loops, where thechanges might have no effect on the function and only local effects on theconformation. In Figure 3, the very similar human δ and β hemoglobin chains (the δchain replaces the β chain in the fetal form of the tetrameric hemoglobin) only differ atnine positions, and these differences are all found on the surface of the protein. Moredistantly related proteins might show changes at most positions in the sequence andhave insertions and deletions at various positions. In the hydrophobic core, thehydrophobic nature of the residues is conserved, but the identity of the residue mightchange (conservative changes). In Figure 4c, the side chains are shown for all thosepositions where the hydrophobic nature is conserved. These residues are marked with a“*” in Figure 3, and form the main part of the hydrophobic core of the protein. Mostconserved are binding surfaces, active sites and of course residues involved in catalyticor other specific activities. In the case of the globins, only two residues are completelyconserved. Both these residue (labeled phenylalanine CD1 and histidine F8 in theglobin nomenclature) are interacting with the essential heme group bound to all theseglobins (Figure 4c). A nitrogen atom of the histidine side chain is one of the ligands tothe iron atom in the heme.
The insertions and deletions occur mostly in loop regions. Such changes arevery unusual in the central parts of secondary structure elements. In the globins, a shorthelix on the surface (helix D) is not present in the hemoglobin α chains, and somehelices differ somewhat in length. In Figure 4d, a comparison of four globins is shown.The conformation is similar. The conformation of the loops varies, and to some extentalso the exact orientation of the helices. Structural similarity is often measured as theroot mean square (r.m.s.) deviation of the position of superimposed α carbons in theamino acid residues. For these globins, the r.m.s. deviations are about 2 Å for 70-90 %of the residues (Table 1).

8
Table 1. Structural and sequence similarity for a few globin chains. The r.m.s. deviation is calculatedwith the program O using a cutoff of 3.5 Å.
Hemoglobin α chain vs.r.m.s. deviation of Ca carbons (Å) / %of residues compared Sequence similarity (%)
Hemoglobin β chain 1.2/97 45
Scapharca inequivalvis hemoglobin 1.8/93 19
Erythrocruorin 2.2/86 20
Lupine leghemoglobin 2.2/72 15
The structural similarity is in general roughly proportional to the degree ofsequence similarity 3; 4. This is illustrated in Figure 2, which shows the r.m.s. deviationfrom 30 000 pair-wise comparisons of proteins.
Figure 2. The relation between sequence similarity and r.m.s. deviation of superimposed Ca atomcoordinates. In this case, the r.m.s. deviation is calculated for the best 50 % of the superimposed atoms:other common procedures will give higher r.m.s. deviations but the curve will appear very similar. Theregion below 25 % sequence identity (the twilight zone) where the sequence similarity is not statisticallysignificant is indicated. The r.m.s. deviation values at 100 % identity are still not 0.0 due to slightvariation in conformation at different experiment. From Wilson et al. 4.
9
Figure 3
10
Figure 4. Globin conformation. a) and b): schematic drawing of the conformation of the α chain ofhuman hemoglobin shown in two orientations. c): A trace of the main chain of α chain of humanhemoglobin showing the side chains of residues with conserved hydrophobic character and the twocompletely conserved residues (Phe CD1 and His F8 close to the heme). d) Superposition of thebackbone of the α chain of human hemoglobin, erythrocruorin, Scapharca hemoglobin andleghemoglobin from lupine. These drawings were produced using the program Molscript.
Variable sequence constraints between proteins
The mutational constraints are very different for different proteins. The mostconserved proteins, for example histone proteins, show almost no changes in theiramino acid sequences when proteins from very distantly related organisms arecompared. The number of synonymous changes of the nucleotides in the genes(changes that do not lead to a change in the amino acid sequence) is normal, whichshows that the mutation rate of histone genes is similar to that of other genes (Table 2).The fact that the amino acid sequence does not change is probably due to functionalconstraints. Histone proteins interact with each other and the DNA of the nucleosomes,and the conservation of histones has been explained by their extensive interactions. Incontrast to many other proteins where there is little constraint on surface residues, bothinternal and surface residues are important in the case of histones.

11
Protein Change rateNon-synonymous
Synonymous
Histone 3 0.0 6.4Actin 0.0 3.7Insulin 0.1 4.0Growth hormone 1.2 5.0Myoglobin 0.6 4.4Hemoglobin α chain 0.5 5.1Hemoglobin β chain 0.8 3.1Immunoglobulin κ chain 1.9 5.9Immunoglobulin VH domain 1.1 5.7Lactate dehydrogenase 0.2 5.0
Table 2 Rate of sequence changes in a number of proteins, based on established divergence times forvarious organisms. The rate of non-synonymous and synonymous changes at the DNA level (in changesper position per 109 years) is given.
Sequence variability and the development of new functions
In the case of more variable proteins, it is of course difficult to decide to whatextent the proteins are fulfilling exactly the same function in the various organisms.While some changes are neutral, other changes might be important adaptations tochanges in the environment or the demands on the protein from the organism. In theglobins, the sequences of myoglobin molecules and the various hemoglobin chainsreflect the development by gene duplications and mutations of the tetrameric,allosterically regulated hemoglobin from a monomeric oxygen-binding ancestor likemyoglobin 5. An analysis of the sequence changes involved in this development showsthat the rate of sequence change might vary considerably at various stages of theevolution of a protein. When a new function is developed for a protein, a period ofrelatively rapid change might occur, followed by a more stable period.
Myoglobin and hemoglobin are called paralogs to indicate they have developedthrough gene duplication in an organism, allowing the development of a new functionwhile retaining the old one. The hemoglobin α chains have developed by speciation -formation of new species followed by divergence - and are called orthologs. The correctuse of the terms paralogs and orthologs would require that we are able to reconstruct theevolutionary history of the proteins, which might sometimes be difficult.

12
Protein folds and functions
Domains
Many proteins are formed around a single hydrophobic core, but the majority ofexisting proteins are built up of separate folding units, domains. A domain is normallyformed around a separate hydrophobic core, and this can be used as a definition of adomain. In many cases, there is unfortunately no well defined division between parts ofproteins and the classification of a protein part as a domain or a sub-domain issubjective. Although they are separate folding units, domains are not always separatedin the polypeptide chain. In many cases, one or a few segments of the polypeptideextend from one domain to form a separate domain. In this case, there are at least twoconnections between the domains. In other cases, the domains are separate also in thesequences.
GAGASAEEKHSRELEKKLKE DAEKDARTVKLLLLGAGESG KSTIVKQMKIIHQDGYSLEE CLEFIAIIYGNTLQSILAIVRAMTTLNIQYGDSARQDDAR KLMHMADTIEEGTMPKEMSD IIQRLWKDSGIQACFERASE YQLNDSAGYYLSDLERLVTPGYVPTEQDVLRSRVKTTGII ETQFSFKDLNFRMFDVGGQR SERKKWIHCFEGVTCIIFIA ALSAYDMVLVEDDEVNRMHESLHLFNSICNHRYFATTSIV LFLNKKDVFFEKIKKAHLSI CFPDYDGPNTYEDAGNYIKV QFLELNMRRDVKEIYSHMTCATDTQNVKFVFDAVTDIIIK ENLKDCGLF
Figure 5. A two-domain protein, transducin α, with one domain as an insertion in the other domain. Theamino acid sequence is shown in light and dark for the main and inserted domain, respectively.
Mosaic proteins
A number of eukaryotic proteins (often called “mosaic proteins”) are formed bymany modules (Figure 6). These modules are also functional units and can be identifiedfrom sequence patterns. Each module is a separate unit in the sequence and folds as aseparate domain. An example is tissue plasminogen activator, which is composed of

13
four modules, one fibronectin type III module, one epidermal growth factor module,one so-called kringle module and the main enzymatic portion, a serine protease module.Plasminogen is also a mosaic protein, with five kringle modules preceding a serineprotease domain. In some proteins, the number of similar modules is very large. Someof these modules, like the fibronectin type III module, are found in a large number ofproteins, and appear to fulfill a similar function in all of them. Most of these modulesare not catalytic, but are able to bind other molecules.
Figure 6. Domain organization of two typical multi-domain proteins, tissue plasminogen activator (top)and a receptor tyrosine kinase as presented in the Pfam database, where the cylinders are links to thecorresponding family.
Mosaic proteins are formed by recombination events. Each domain correspondsto a single exon in the DNA. All the exons are in the same reading frame. Geneduplications and recombinations of the introns containing these exons will thereforelead to formation of protein molecules with new combinations of these modules.
Protein taxonomy
Structure determination of proteins requires much more work than thedetermination of DNA sequences, but new structures appear at an increasing rate. Withthe growing database of known protein conformations there is a need to find ways ofclassifying protein, to define a taxonomy for proteins (or protein domains). Theenormous variability in natural amino acid sequences does not correspond to a similarvariability in conformations. The tertiary structure of protein show regularities, andmany proteins have the same or similar folds, even in cases when they have no obviousevolutionary relation. Classification schemes for protein folds are to some extentsubjective. One common way of classification is to divide all proteins or proteindomains into 5 major groups or classes referring to their secondary structure content: allα, all β, α/β, α + β and a fifth group of proteins which have little secondary structure anddo not fit in any of the other categories. The α/β and α + β proteins differ in the way thatthe α/β proteins mainly are built up of parallel strands connected by helices (βαβmotifs), while the α + β proteins have strands and helices connected in a more irregularfashion. Within each group there are many different folds.
14
Relation between fold and function
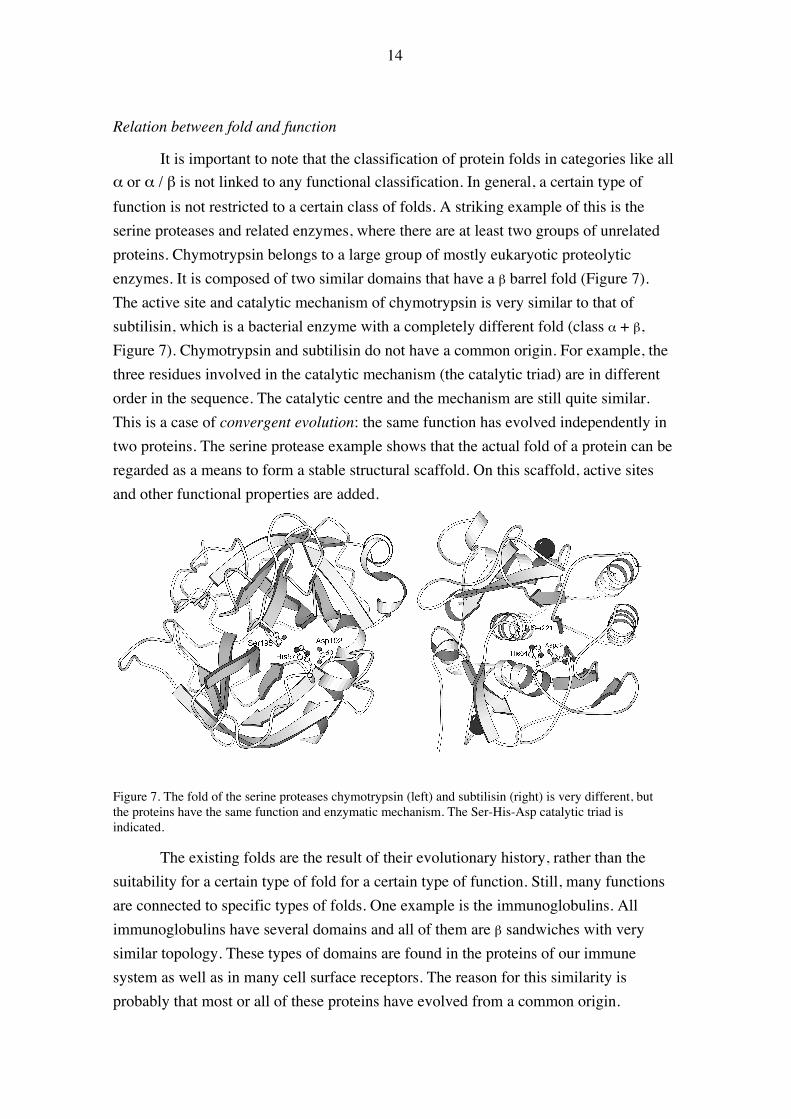
It is important to note that the classification of protein folds in categories like allα or α / β is not linked to any functional classification. In general, a certain type offunction is not restricted to a certain class of folds. A striking example of this is theserine proteases and related enzymes, where there are at least two groups of unrelatedproteins. Chymotrypsin belongs to a large group of mostly eukaryotic proteolyticenzymes. It is composed of two similar domains that have a β barrel fold (Figure 7).The active site and catalytic mechanism of chymotrypsin is very similar to that ofsubtilisin, which is a bacterial enzyme with a completely different fold (class α + β,Figure 7). Chymotrypsin and subtilisin do not have a common origin. For example, thethree residues involved in the catalytic mechanism (the catalytic triad) are in differentorder in the sequence. The catalytic centre and the mechanism are still quite similar.This is a case of convergent evolution: the same function has evolved independently intwo proteins. The serine protease example shows that the actual fold of a protein can beregarded as a means to form a stable structural scaffold. On this scaffold, active sitesand other functional properties are added.
Figure 7. The fold of the serine proteases chymotrypsin (left) and subtilisin (right) is very different, butthe proteins have the same function and enzymatic mechanism. The Ser-His-Asp catalytic triad isindicated.
The existing folds are the result of their evolutionary history, rather than thesuitability for a certain type of fold for a certain type of function. Still, many functionsare connected to specific types of folds. One example is the immunoglobulins. Allimmunoglobulins have several domains and all of them are β sandwiches with verysimilar topology. These types of domains are found in the proteins of our immunesystem as well as in many cell surface receptors. The reason for this similarity isprobably that most or all of these proteins have evolved from a common origin.

15
Common folds
In addition to the immunoglobulin fold, there are a number of other folds thatare found in seemingly unrelated proteins. A number of common folds found in severalproteins are listed in Table 3. Schematic drawings of proteins with some of these foldsare found in Figure 8.
Figure 8. Schematic drawing of a number of common protein folds. Top left: α/β domain with Rossmannfold (3a, 20b-hydroxysteroid dehydrogenase), top right: immunoglobulin constant domain, bottom left:TIM barrel (triose phosphate dehydrogenase), bottom right: jelly roll (satellite tobacco necrosis virus coatprotein)
Many enzymes have the TIM barrel fold, named after the enzyme triosephosphate isomerase. This fold consists of eight parallel β strands forming a cylinderconnected by eight helices forming an outer layer of the protein. Many functionallyunrelated enzymes with no sequence similarities have this fold. The structural similaritymight still be due to divergence from a single common ancestor. In such a case, all thesequence similarity has disappeared in the evolution. A more favored alternative is thatthis fold has developed independently in the evolution of these proteins. The active siteof these enzymes are always found in the same end of the barrel, and this fold might forunknown reasons be well suited for creating new enzymatic functions.
16
Another common type of fold is the “jelly roll”, which is found in numerousviral coat protein as well as in a number of other proteins with completely unrelatedfunctions, such as tumor necrotic factor.
Table 3. A number of common folds found in different protein families
Name Type of fold Examples of foldα/β doubly wound Mostly parallel sheet with helices on both
sidesRas, subtilisin, adenylate kinase
TIM barrel Cylinder of eight β strands connected byhelices
Triose phosphate isomerase, glycolateoxidase, aldolase
Split a/b sandwich Antiparallel sheet with helices on one side Ferredoxin, acyl phosphataseImmunoglobulin β sandwich Immunoglobulin, receptor domains,
superoxide dismutaseα up-and-down Four antiparallel helices Hemerythrin, TMV coat proteinGlobin Two layers of non-parallel helices Hemoglobin, phycocyaninJelly roll β sandwich Tumor necrosis factor, viral coat proteins,
concanavalin ATrefoil Cylinder formed by three sheets Interleukins, ricinUbiquitin αβ roll Small sheet with helices on one side Ubiquitin, ferredoxin
The reason for the existence of similar folds in many functionally unrelatedproteins is unknown. Many of them have a relatively simple topology, and such foldsmight have been favored in the evolution because of the possibilities of an efficient andaccurate folding process.
On the other hand, a large number of folds have been found only in a singlefamily of proteins with a unique function. Two examples are the enzyme carbonicanhydrase and the coat protein of small RNA bacteriophages.
Can we estimate the total number of existing folds?
As the structure is determined for more and more proteins, the number ofobserved folds is increasing steadily. The enormous amounts of data coming out of theefforts to sequence complete genomes give us a possibility to estimate the number ofexisting folds. This is done by trying to classify all sequences into groups ofhomologous proteins. Since the conformation is more conserved than the sequence,every protein in such a group will have the same fold (as long as the assignment iscorrect!). Many of these groups of proteins still correspond to the same fold; they mightcorrespond to evolutionary related proteins which have diverged so much that nosequence similarity remains, or they are truly non-homologous and have arrived atsome fold independently. From the proportion of new sequences that belong to alreadyknown groups one can by extrapolation make an estimate of the total number of groupsof homologous proteins with significant sequence similarity that exists in living cells.From the number of folds that have been connected to distinct sequence groups, we canestimate how many of these groups will have a unique fold. The present estimate is that

17
there are one or possibly a few thousand different folds. Of these folds, a few hundredare known.
The large but limited number of known folds is not necessarily the total numberof folds that can be formed by a polypeptide (sometimes called fold space). The totalnumber of possible amino acid sequences is enormous. For a small protein of 100amino acids, there are 20100 possible combinations. Probably, only an extremely smallfraction of all theoretically possible sequences would be able to fold into a stableglobular protein, since the relatively rigid backbone and the requirement to form areasonably well packed hydrophobic core severely restrict the folding. It is still possiblethat there are many stable folds that do not exist in nature, since the existing folds arethe result of an evolutionary process that has not tried all these sequence combinations.
Methods for fold comparison
There are many cases where we want to superimpose two structures andcompare them. Structural classification can use structural alignment to find similaritiesbetween complex structures that might be difficult to detect by eye. These similaritiesmay help to find unknown evolutionary relations and functional similarities. Sequencealignment from structural superposition is useful, especially when the level of sequencesimilarity is low.
Alignment of structures is not as straightforward as the alignment of sequences.Pairwise alignment can be based on an initial idea of what residues should besuperimposed in the two structures. If the proteins have obvious sequence similarities,the initial correspondence of the residues can for instance be obtained by sequencealignment. From these points a transformation can be calculated that optimallysuperimposes one of the molecules on the other as a rigid body. The initial selection ofresidues to superimpose can be modified using the alignment to include new residuesthat are within a suitable threshold distance from each other. After iterations, the resultis a superposition that includes a fraction of the residues in the two structures, and anr.m.s. deviation of these residues (often the coordinates of the Ca carbon is used). Thereis also a possibility to break up one of the molecules in a limited number of fragmentsand superimpose these on the other protein to allow for domain rotations.
18
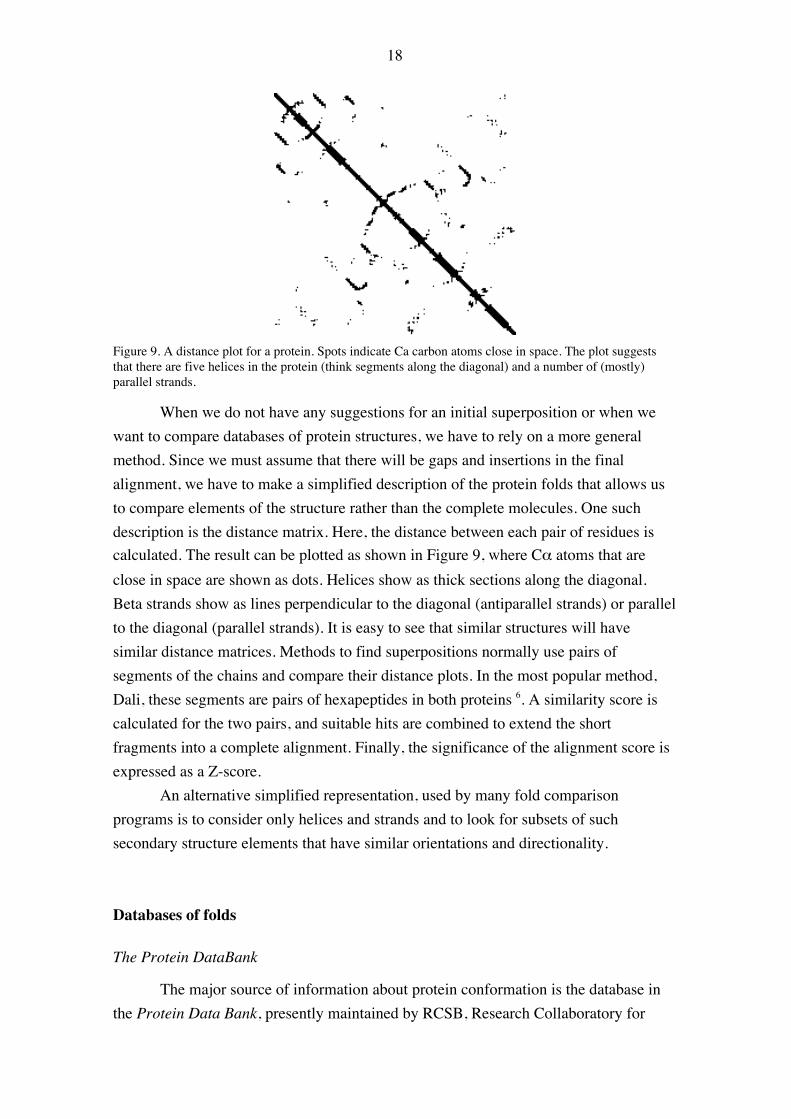
Figure 9. A distance plot for a protein. Spots indicate Ca carbon atoms close in space. The plot suggeststhat there are five helices in the protein (think segments along the diagonal) and a number of (mostly)parallel strands.
When we do not have any suggestions for an initial superposition or when wewant to compare databases of protein structures, we have to rely on a more generalmethod. Since we must assume that there will be gaps and insertions in the finalalignment, we have to make a simplified description of the protein folds that allows usto compare elements of the structure rather than the complete molecules. One suchdescription is the distance matrix. Here, the distance between each pair of residues iscalculated. The result can be plotted as shown in Figure 9, where Cα atoms that areclose in space are shown as dots. Helices show as thick sections along the diagonal.Beta strands show as lines perpendicular to the diagonal (antiparallel strands) or parallelto the diagonal (parallel strands). It is easy to see that similar structures will havesimilar distance matrices. Methods to find superpositions normally use pairs ofsegments of the chains and compare their distance plots. In the most popular method,Dali, these segments are pairs of hexapeptides in both proteins 6. A similarity score iscalculated for the two pairs, and suitable hits are combined to extend the shortfragments into a complete alignment. Finally, the significance of the alignment score isexpressed as a Z-score.
An alternative simplified representation, used by many fold comparisonprograms is to consider only helices and strands and to look for subsets of suchsecondary structure elements that have similar orientations and directionality.
Databases of folds
The Protein DataBank
The major source of information about protein conformation is the database inthe Protein Data Bank, presently maintained by RCSB, Research Collaboratory for

19
Structural Bioinformatics, USA. This database stores experimentally determined atomiccoordinates of proteins and nucleic acid molecules. This information is mainly obtainedfrom structure determination by X-ray crystallography, but in recent years also nuclearmagnetic resonance (NMR) spectroscopy has generated an increasing number of proteinand nucleic acid structures in the database. The database contains essentially all detailedstructural information that has been generated. Most journals require that thecoordinates of a structure about to be published is deposited in the data bank, but thereis an option of delaying the release of the coordinates by one year after deposition. Theactual database consists of the information deposited by the experimentalist.
HEADER COMPLEX(VIRUS COAT PROTEIN/RNA) 06-JUN-94 2BBV 2BBV 2COMPND BLACK BEETLE VIRUS CAPSID PROTEIN (BBV) COMPLEXED WITH 2BBV 3COMPND 2 DUPLEX RNA 2BBV 4SOURCE BLACK BEETLE VIRUS: GROWN IN (DROSOPHILA MELANOGASTER); 2BBV 5SOURCE 2 RNA: SYNTHETIC 2BBV 6AUTHOR M.V.HOSUR,J.-P.WERY,V.S.REDDY,J.E.JOHNSON 2BBV 7REVDAT 1 31-AUG-94 2BBV 0 2BBV 8JRNL AUTH J.-P.WERY,V.S.REDDY,M.V.HOSUR,J.E.JOHNSON 2BBV 9JRNL TITL THE REFINED THREE-DIMENSIONAL STRUCTURE OF AN 2BBV 10JRNL TITL 2 INSECT VIRUS AT 2.8 ANGSTROMS RESOLUTION 2BBV 11JRNL REF J.MOL.BIOL. V. 235 565 1994 2BBV 12JRNL REFN ASTM JMOBAK UK ISSN 0022-2836 0070 2BBV 13……ATOM 1 N LEU A 56 -7.949 48.466 105.739 1.00 20.88 2BBV 416ATOM 2 CA LEU A 56 -7.180 47.354 106.324 1.00 19.48 2BBV 417ATOM 3 C LEU A 56 -7.865 46.010 106.025 1.00 19.19 2BBV 418ATOM 4 O LEU A 56 -7.426 44.951 106.501 1.00 20.35 2BBV 419ATOM 5 CB LEU A 56 -7.062 47.567 107.833 1.00 20.81 2BBV 420ATOM 6 CG LEU A 56 -6.535 48.963 108.185 1.00 19.62 2BBV 421ATOM 7 CD1 LEU A 56 -7.367 50.091 107.567 1.00 18.29 2BBV 422ATOM 8 CD2 LEU A 56 -6.517 49.240 109.688 1.00 18.76 2BBV 423ATOM 9 N THR A 57 -8.913 46.115 105.226 1.00 18.68 2BBV 424ATOM 10 CA THR A 57 -9.767 44.978 104.827 1.00 24.01 2BBV 425ATOM 11 C THR A 57 -8.945 43.742 104.417 1.00 21.54 2BBV 426ATOM 12 O THR A 57 -9.133 43.184 103.325 1.00 19.30 2BBV 427ATOM 13 CB THR A 57 -10.670 45.380 103.663 1.00 25.13 2BBV 428ATOM 14 OG1 THR A 57 -11.999 44.940 103.910 1.00 25.79 2BBV 429ATOM 15 CG2 THR A 57 -10.228 44.782 102.329 1.00 24.03 2BBV 430…
Figure 10. The beginning of the header and of the first part of the list of atomic coordinates of a PDBentry (2bbv). The coordinates of the first two residues in the entry (Leu A56 and Thr A57) are given. Thefirst three columns of numbers are the coordinates of the atoms in Å in relation to a suitable coordinatesystem. The fourth column of numbers is the occupancy (1.0 for full occupation is normal). The nextcolumn gives the estimate of disorder (the B factors).
The PDB entries are models of the molecules. The coordinates have errors, butunfortunately there is no error estimates associated with the data. The errors are of twokinds: the random errors resulting from the limitations in the experimental data andlocal or global errors due to various kinds of mistakes of the experimentalists. Beforethe release, the deposited coordinates are subjected to a number of tests to check forerrors or unusual features. This process is called validation, and it gives important hintsabout the correctness of the coordinates in general and at specific parts of the protein.
20
The most important results of the validation procedure are either included in the headerof the entry or available through links.
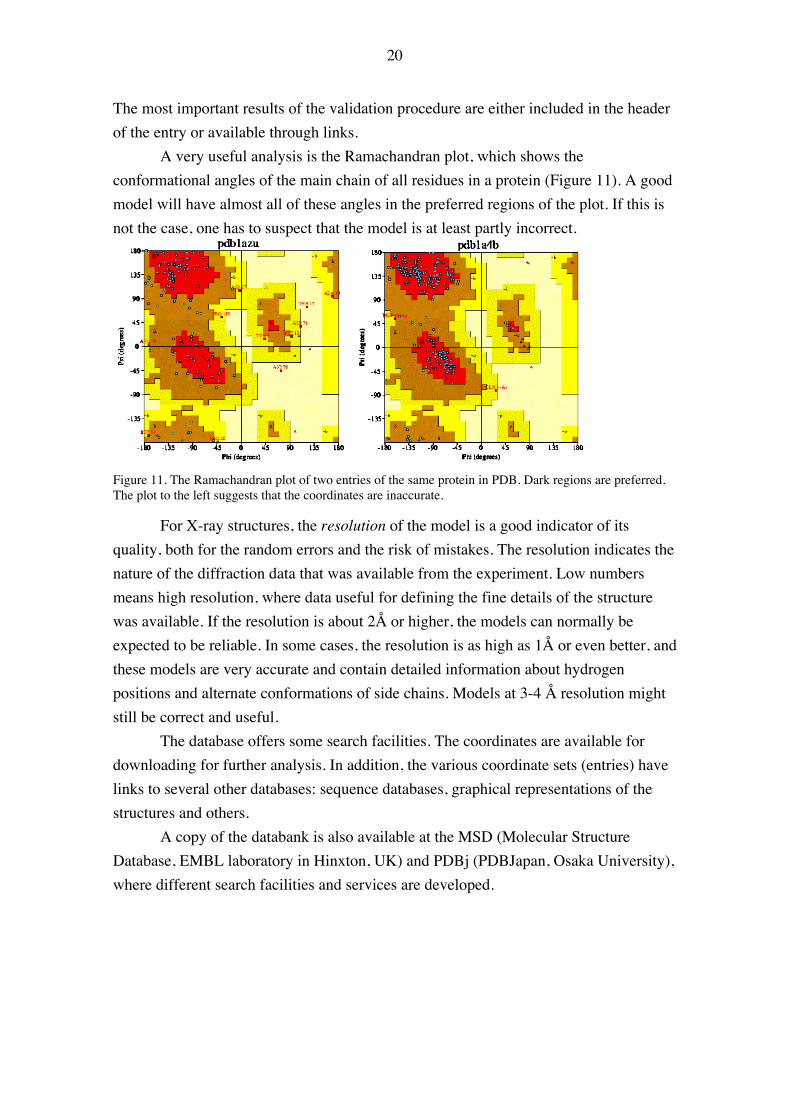
A very useful analysis is the Ramachandran plot, which shows theconformational angles of the main chain of all residues in a protein (Figure 11). A goodmodel will have almost all of these angles in the preferred regions of the plot. If this isnot the case, one has to suspect that the model is at least partly incorrect.
Figure 11. The Ramachandran plot of two entries of the same protein in PDB. Dark regions are preferred.The plot to the left suggests that the coordinates are inaccurate.
For X-ray structures, the resolution of the model is a good indicator of itsquality, both for the random errors and the risk of mistakes. The resolution indicates thenature of the diffraction data that was available from the experiment. Low numbersmeans high resolution, where data useful for defining the fine details of the structurewas available. If the resolution is about 2Å or higher, the models can normally beexpected to be reliable. In some cases, the resolution is as high as 1Å or even better, andthese models are very accurate and contain detailed information about hydrogenpositions and alternate conformations of side chains. Models at 3-4 Å resolution mightstill be correct and useful.
The database offers some search facilities. The coordinates are available fordownloading for further analysis. In addition, the various coordinate sets (entries) havelinks to several other databases: sequence databases, graphical representations of thestructures and others.
A copy of the databank is also available at the MSD (Molecular StructureDatabase, EMBL laboratory in Hinxton, UK) and PDBj (PDBJapan, Osaka University),where different search facilities and services are developed.

21
Figure 12. The increase in size of PDB
At the time of writing, there are about 34500 entries in the database, but many ofthem are mutants of the same protein or complexes of the same protein with variousligands. For example, there are as many as 377 different entries of mutants of lysozymefrom bacteriophage T4 (a favorite for the study of protein folding and stability) andabout 250 entries of various inhibitor complexes of the HIV protease.
Each one of the entries has references to relevant publications and a descriptionof the methodology used to determine the conformation, which allows the user to judgethe quality of the information.
Hierarchical databases
A number of databases are based on the information collected in the ProteinData Bank. These databases contain images of molecules, sequences and other types ofinformation. Two databases contain the available structural information in ahierarchical arrangement. These databases are useful for the analysis of evolutionaryrelationships as well as functional comparisons.
22
Class All alpha(218)
All beta(144)
Alpha/beta(136)
Alpha+beta(279)
…
Fold Immuno-globulin-like (23)
Prealbumin(6)
Viral coats(1)
OB fold (10) …
Superfamily Immuno-globulin(4)
CuZnsuperoxidedismutase(1)
PapD-like(2)
Fibronectintype III (1)
…
Family V domains(78)
C1 domains(64)
C2 domains(9)
I domains(45)
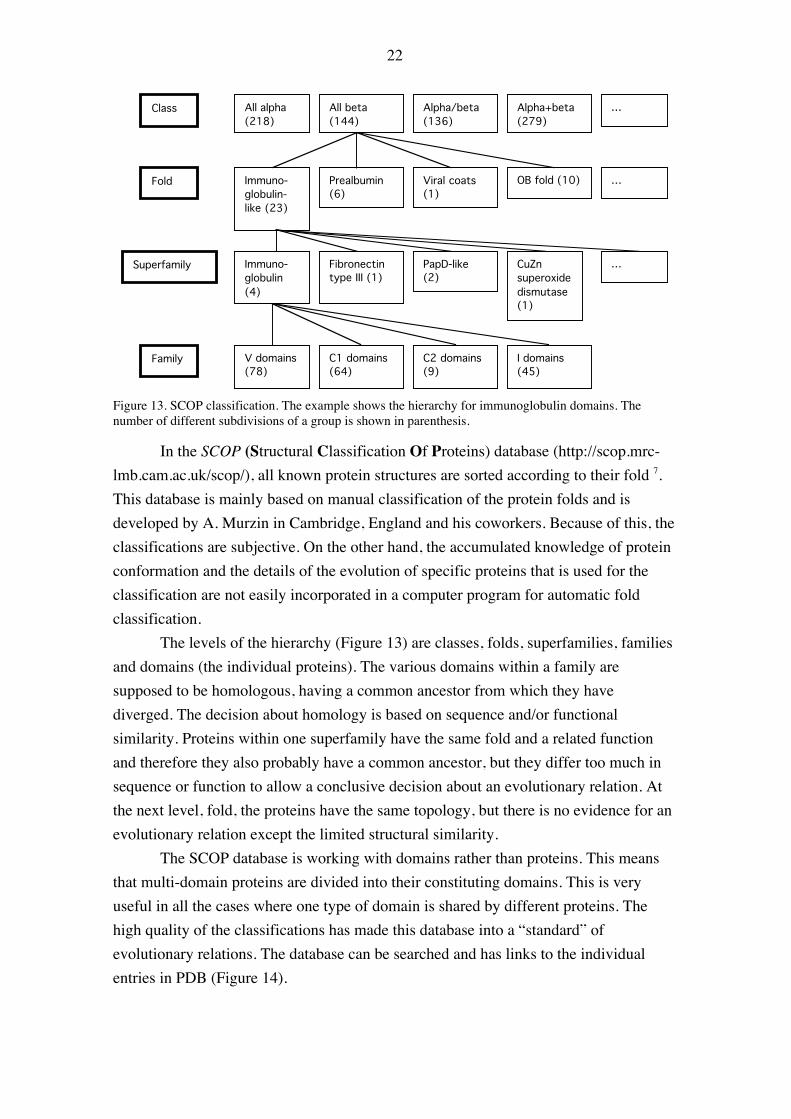
Figure 13. SCOP classification. The example shows the hierarchy for immunoglobulin domains. Thenumber of different subdivisions of a group is shown in parenthesis.
In the SCOP (Structural Classification Of Proteins) database (http://scop.mrc-lmb.cam.ac.uk/scop/), all known protein structures are sorted according to their fold 7.This database is mainly based on manual classification of the protein folds and isdeveloped by A. Murzin in Cambridge, England and his coworkers. Because of this, theclassifications are subjective. On the other hand, the accumulated knowledge of proteinconformation and the details of the evolution of specific proteins that is used for theclassification are not easily incorporated in a computer program for automatic foldclassification.
The levels of the hierarchy (Figure 13) are classes, folds, superfamilies, familiesand domains (the individual proteins). The various domains within a family aresupposed to be homologous, having a common ancestor from which they havediverged. The decision about homology is based on sequence and/or functionalsimilarity. Proteins within one superfamily have the same fold and a related functionand therefore they also probably have a common ancestor, but they differ too much insequence or function to allow a conclusive decision about an evolutionary relation. Atthe next level, fold, the proteins have the same topology, but there is no evidence for anevolutionary relation except the limited structural similarity.
The SCOP database is working with domains rather than proteins. This meansthat multi-domain proteins are divided into their constituting domains. This is veryuseful in all the cases where one type of domain is shared by different proteins. Thehigh quality of the classifications has made this database into a “standard” ofevolutionary relations. The database can be searched and has links to the individualentries in PDB (Figure 14).

23
Figure 14. Example of a SCOP image. This is the prealbumin page showing the classification into class,fold and superfamily. The lowest lever here is the domain, which refers to a PDB entry. There are asmany as 40 such entries of the human prealbumin.
Class Mainly alpha(5)
Mainly beta(19)
Alpha beta(14)
Irregular(1)
Architecture Sandwich(26)
Barrel (28) Trefoil (1) Roll (28) …
Topology Immuno-globulin-like (64)
TumorsuppressorSmad4 (2)
Jelly rolls(21)
Thaumatin(1)
…
Immuno-globulinfamily(137)
CuZnsuperoxidedismutase(3)
FibronectinType III (53)
Prealbumin(1)
…Homologoussuperfamily
Sequencefamily
Immuno-globulindomains
CD2 Interleukin-1receptor
titin …
Figure 15. CATH classification. The immunoglobulins are used as the example. Note that prealbumin(thyroxin) is classified as part of the immunoglobulin-like topology in CATH, but is a separate fold inSCOP.
A similar structure database is CATH (http://www.biochem.ucl.ac.uk/bsm/cath/),developed by C. Orengo and J. Thornton in London 8. It is ordering every knownprotein conformation in classes, architectures, topologies (fold families), superfamilies
24
and sequence families (Class, Architecture, Topology, Homologous superfamily,Figure 15).
The classification of known structures in CATH is to a large extent done byautomated procedures. The automatic procedure starts with a definition of domains inthe protein. A number of procedures for doing this automatically have been developed,but they are in general not accurate. In CATH, the domain definition is done using theconsensus of three different algorithms 9. In this way, the prediction is accurate, but forclose to half of the cases a consensus is not reached and a manual classification has tobe made.
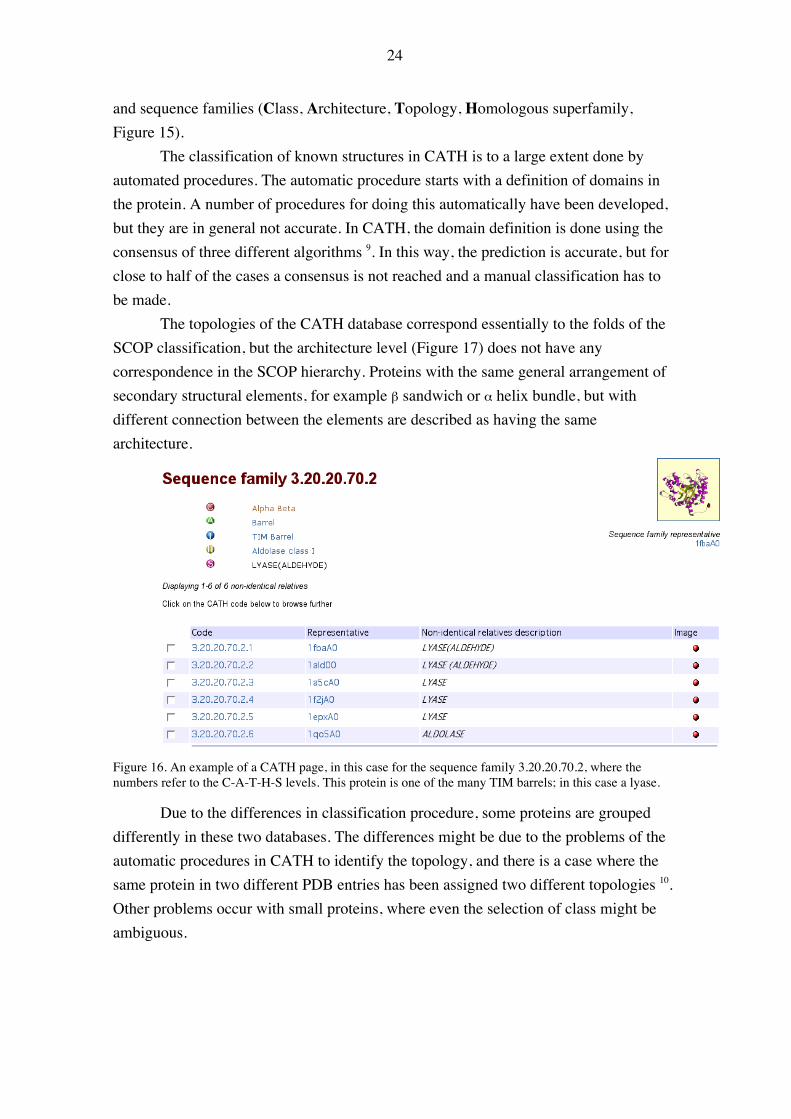
The topologies of the CATH database correspond essentially to the folds of theSCOP classification, but the architecture level (Figure 17) does not have anycorrespondence in the SCOP hierarchy. Proteins with the same general arrangement ofsecondary structural elements, for example β sandwich or α helix bundle, but withdifferent connection between the elements are described as having the samearchitecture.
Figure 16. An example of a CATH page, in this case for the sequence family 3.20.20.70.2, where thenumbers refer to the C-A-T-H-S levels. This protein is one of the many TIM barrels; in this case a lyase.
Due to the differences in classification procedure, some proteins are groupeddifferently in these two databases. The differences might be due to the problems of theautomatic procedures in CATH to identify the topology, and there is a case where thesame protein in two different PDB entries has been assigned two different topologies 10.Other problems occur with small proteins, where even the selection of class might beambiguous.

25
26
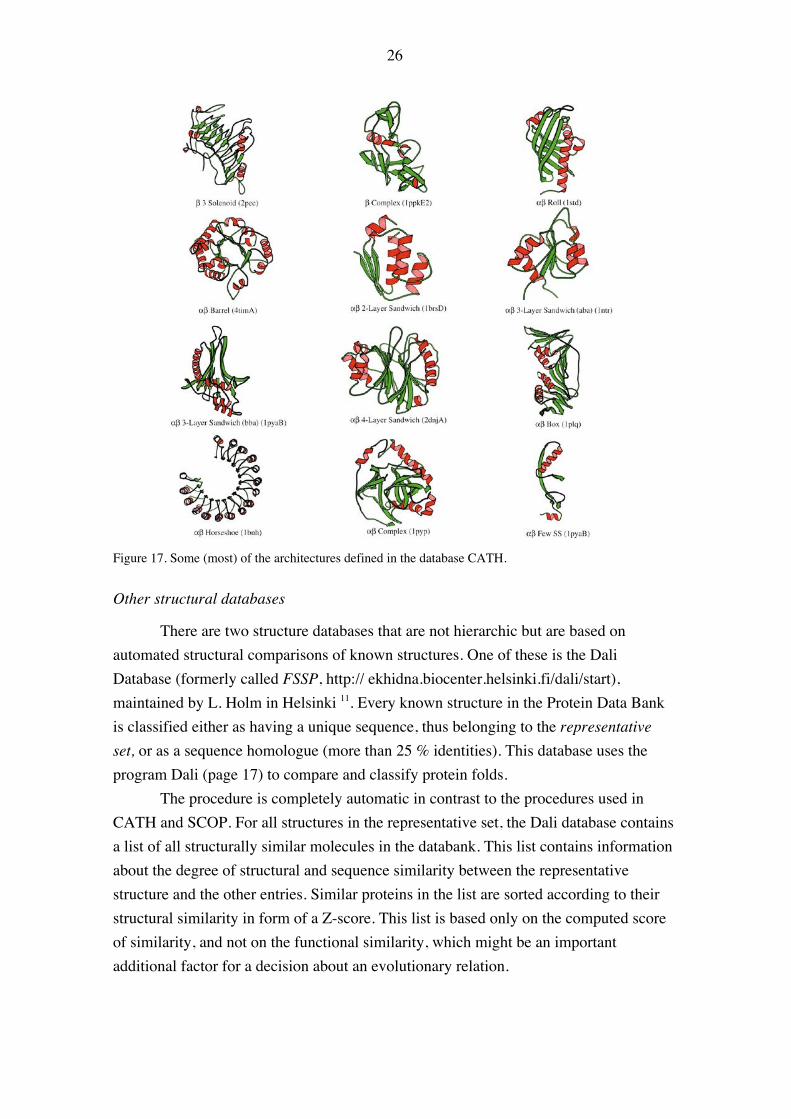
Figure 17. Some (most) of the architectures defined in the database CATH.
Other structural databases
There are two structure databases that are not hierarchic but are based onautomated structural comparisons of known structures. One of these is the DaliDatabase (formerly called FSSP, http:// ekhidna.biocenter.helsinki.fi/dali/start),maintained by L. Holm in Helsinki 11. Every known structure in the Protein Data Bankis classified either as having a unique sequence, thus belonging to the representativeset, or as a sequence homologue (more than 25 % identities). This database uses theprogram Dali (page 17) to compare and classify protein folds.
The procedure is completely automatic in contrast to the procedures used inCATH and SCOP. For all structures in the representative set, the Dali database containsa list of all structurally similar molecules in the databank. This list contains informationabout the degree of structural and sequence similarity between the representativestructure and the other entries. Similar proteins in the list are sorted according to theirstructural similarity in form of a Z-score. This list is based only on the computed scoreof similarity, and not on the functional similarity, which might be an importantadditional factor for a decision about an evolutionary relation.
27
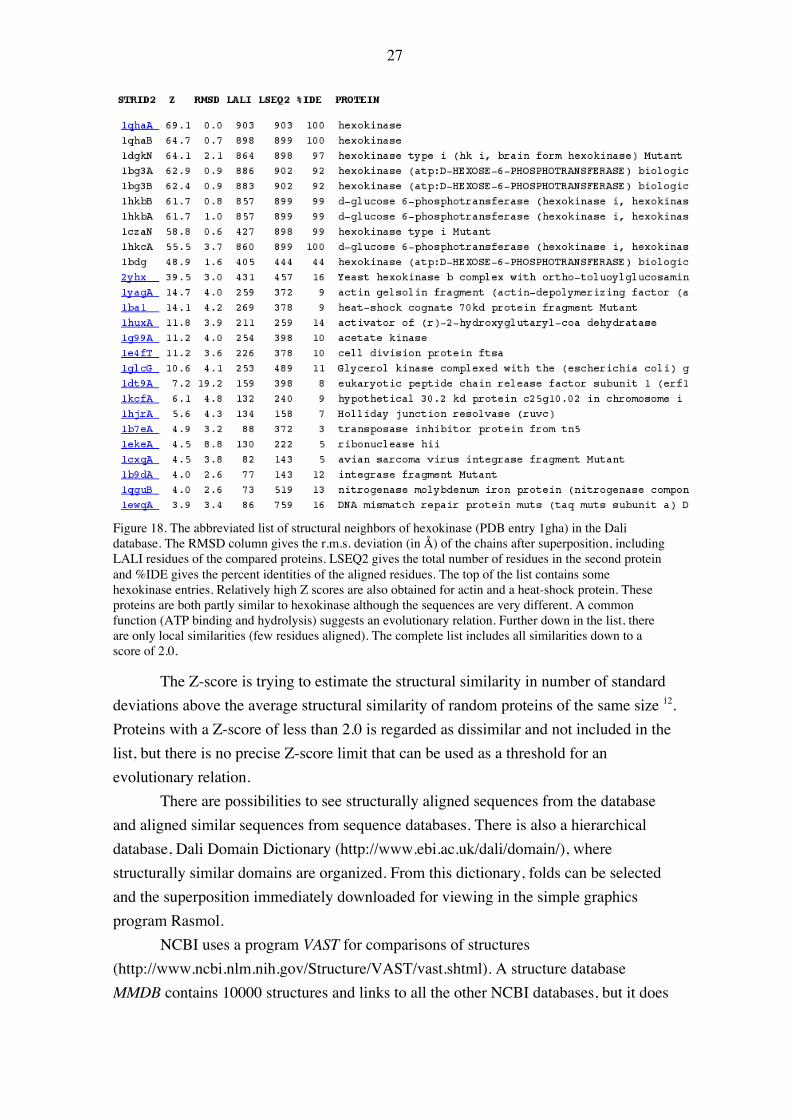
Figure 18. The abbreviated list of structural neighbors of hexokinase (PDB entry 1gha) in the Dalidatabase. The RMSD column gives the r.m.s. deviation (in Å) of the chains after superposition, includingLALI residues of the compared proteins. LSEQ2 gives the total number of residues in the second proteinand %IDE gives the percent identities of the aligned residues. The top of the list contains somehexokinase entries. Relatively high Z scores are also obtained for actin and a heat-shock protein. Theseproteins are both partly similar to hexokinase although the sequences are very different. A commonfunction (ATP binding and hydrolysis) suggests an evolutionary relation. Further down in the list, thereare only local similarities (few residues aligned). The complete list includes all similarities down to ascore of 2.0.
The Z-score is trying to estimate the structural similarity in number of standarddeviations above the average structural similarity of random proteins of the same size 12.Proteins with a Z-score of less than 2.0 is regarded as dissimilar and not included in thelist, but there is no precise Z-score limit that can be used as a threshold for anevolutionary relation.
There are possibilities to see structurally aligned sequences from the databaseand aligned similar sequences from sequence databases. There is also a hierarchicaldatabase, Dali Domain Dictionary (http://www.ebi.ac.uk/dali/domain/), wherestructurally similar domains are organized. From this dictionary, folds can be selectedand the superposition immediately downloaded for viewing in the simple graphicsprogram Rasmol.
NCBI uses a program VAST for comparisons of structures(http://www.ncbi.nlm.nih.gov/Structure/VAST/vast.shtml). A structure databaseMMDB contains 10000 structures and links to all the other NCBI databases, but it does

28
not contain the hierarchies found in CATH and SCOP(http://www.ncbi.nlm.nih.gov/Structure/MMDB/mmdb.shtml).
Both the VAST and the Dali program are set up as servers to compare anunknown structure to the structure database.
29
ASSIGNMENT OF FUNCTION TO PROTEINS
Assignment through sequence similarity
How do we know that a sequence similarity corresponds to homology?
The development of genome research has increased enormously the need formethods to find possible functions of proteins coded for by unknown genes. The mainmethod for assignment of a function to a protein is through its possible similarity toproteins of known function. The most obvious procedure is to base the functionalassignment on an established homology to a protein of known function. To do this, wecan use sequence alignment using database search methods like BLAST and/or thedynamic programming method for sequence alignment. The alignment score is anestimate of the similarity between two sequences, and with a proper statistical treatmentit will give an estimate of how likely it is that the alignment score could be obtainedfrom unrelated proteins with a random similarity. This assumes that truly unrelatedsequences have no systematic similarities. This assumption might not always be correct.Some proteins have regions with large proportions of a few amino acid residues -proteins or regions with low complexity. In normal proteins, there might be a tendencyfor certain regularity in the distribution of side chains due to the packing in thehydrophobic core of non-polar side chains from strands or helices.
As discussed above, there are proteins with the same fold but with no otherevidence of a common ancestry. This similarity can be labeled structural convergence,which means that that the similarity is the result of the independent development of themolecules from different ancestors. One might consider a possibility that also sequencesimilarity could be the result of convergence from unrelated ancestors due to functionalconstraints. Although there have been examples of convergent adaptive changes of asmall number of residues in a protein, sequence convergence for whole proteins anddomains has not been observed. A significant sequence similarity for a domain cantherefore always be used to prove homology.
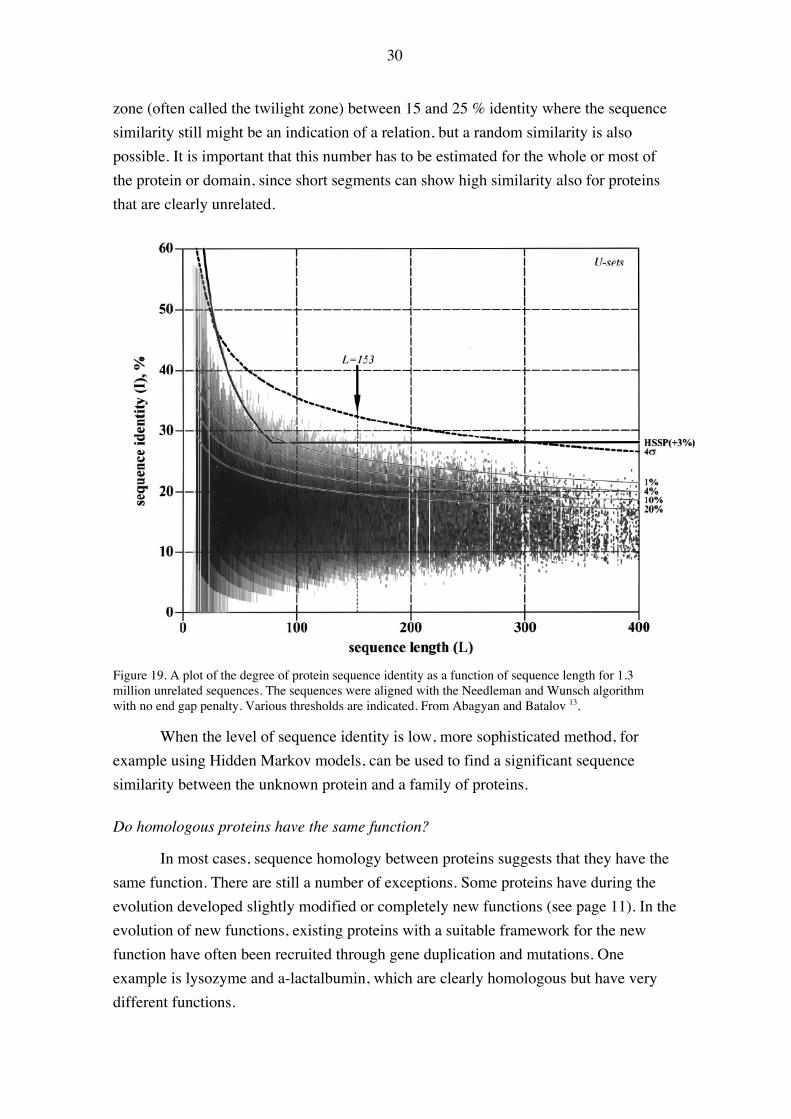
Although the best way to decide whether two proteins are homologous or not isto do a proper statistical analysis of analysis scores, it is often convenient to use thedegree of sequence identity. Comparisons of many sequences and structures has led to arule of thumb that a 25 % sequence identity (estimated as 100 x number of identities /total number of amino acids in the shorter of the two sequences) between two sequencescan be regarded as a reasonable evidence of homology, at least for sequences of morethan 200 residues (Figure 19). For shorter sequences, a still higher level of identity isneeded for a conclusive decision of homology 13. Below that number, there is a gray
30
zone (often called the twilight zone) between 15 and 25 % identity where the sequencesimilarity still might be an indication of a relation, but a random similarity is alsopossible. It is important that this number has to be estimated for the whole or most ofthe protein or domain, since short segments can show high similarity also for proteinsthat are clearly unrelated.
Figure 19. A plot of the degree of protein sequence identity as a function of sequence length for 1.3million unrelated sequences. The sequences were aligned with the Needleman and Wunsch algorithmwith no end gap penalty. Various thresholds are indicated. From Abagyan and Batalov 13.
When the level of sequence identity is low, more sophisticated method, forexample using Hidden Markov models, can be used to find a significant sequencesimilarity between the unknown protein and a family of proteins.
Do homologous proteins have the same function?
In most cases, sequence homology between proteins suggests that they have thesame function. There are still a number of exceptions. Some proteins have during theevolution developed slightly modified or completely new functions (see page 11). In theevolution of new functions, existing proteins with a suitable framework for the newfunction have often been recruited through gene duplication and mutations. Oneexample is lysozyme and a-lactalbumin, which are clearly homologous but have verydifferent functions.

31
Databases of aligned sequences
A number of databases have been developed containing aligned sequences ofhomologous proteins. The Pfam database, which is maintained by the Sanger Centre inCambridge, England (http://www.sanger.ac.uk/Software/Pfam/), contains a number ofaligned sequences of domain families 14. Note that protein domains are organized inPfam. A single multi-domain protein can therefore be found in several families. Thealignment has been made using the Hidden Markov Model methodology. The HiddenMarkov Model (HMM) for each family is in this case based on an original alignment ofa limited number of sequences using Clustal, combined with manual adjustments (seedalignment). Many other sequences have then been added to the families using the HMMto search in a non-redundant protein sequence database (Swiss-Prot + Trembl). In thePfam database, the domain organization of proteins in the database is showngraphically, and search sequences can be analyzed in the same way. There are two typesof families: type A, which are well established and documented, and type B, which arehomologous sequences that are not documented. This database contains almost 8000families.
Another database is ProDom, maintained in Toulouse, France(prodes.toulouse.inra.fr/prodom/current/html/home.php), where sequences in theSwissProt database have been used for recursive searches with the program PSI-BLAST 15. In this database, automatic procedures are used to define domains and alignsequences. As in the Pfam database, there are graphical presentations of the sequencesand links to the sequences and to other databases.
The FSSP database (www2.ebi.ac.uk/dali/fssp/fssp.html), which containsstructurally superimposed proteins, also stores aligned sequences of related proteins inSwissProt.
An attempt to include sequence information from several databases (PROSITE,PRINTS, ProDom and Pfam) is found in the new database InterPro(www.ebi.ac.uk/interpro/) maintained by EBI, the European Bioinformatics Institute 16.
Search for conserved sequence patterns
Why do we have patterns in sequences?
There are a number of features of proteins that can be easily recognized at thesequence level. In many cases, conserved residues in homologous proteins show aspecific pattern. Since functionally important residues are conserved, this pattern mightbe used to tentatively identify unknown proteins and connect them to a function in theabsence of a general sequence similarity. For example, heme-binding cytochrome cmolecules all contain the sequence pattern CXXCH, where X can be any residue. In this

32
case, the two cysteines bind the heme group of the protein covalently, and the histidineis liganding the iron atom of the heme.
ProSite patterns
There are programs to recognize these and other patterns, and in the ProSitedatabase, a great number of patterns have been defined and used to identify relatedproteins 17. The main problem with the methods is that it might be difficult to constructa unique pattern for the search. A search among all protein sequences in the SwissProtdatabase for the CXXCH pattern of cytochrome c gives 432 hits that are clearly theright type of protein, but also 476 hits of proteins that are not cytochromes. These falsepositives are unrelated proteins that do not bind heme groups and have a differentconformation. A detailed look at the entry shows that there are 7 true cytochrome cproteins that were not found (false negatives). One reason for this is that the CXXCHpattern used to identify cytochrome c:s is in fact C-{CPWHF}-{CPWR}-C-H-{CFYW}, where the amino acid residues in brackets are not allowed at the respectiveposition. This allows many false positives to be avoided but also misses some rarevariants of this pattern (for example CHVCH as in cytochrome c553i of Paracoccusdenitrificans).
Another well-known pattern is found in nucleotide-binding so-called P-loopswith the sequence (AG)XXXXGK(ST), where the letters within a parenthesis indicateobserved alternatives at a certain position. This pattern is found in a large number ofproteins that share the property of binding ATP or GTP, but also in many unrelatedproteins. Therefore, the pattern is by itself not useful for searches. Proteins with thispattern might be identified with more specific patterns. An example is the bacterialrecA proteins, which belong to this large group of nucleotide-binding proteins. Anonapeptide A-L-(KR)-(IF)-(FY)-(STA)-(STAD)-(LIVMQ)-R (letters in parenthesisindicate allowed residues) from another part of the sequence with only three completelyconserved residues can be used to find 93 recA proteins with no false positives and onlyone missed known recA protein.
When many homologous sequences are known, the search can be weightedaccording to the likelihood of finding a certain amino acid at a certain position.Obviously, patterns with several conserved residues will be more likely to generate onlytrue hits.
Sequence profiles in ProSite
For globins, the number of conserved residues is very small, and searches forshort patterns do not pick up only globins. A search profile based on the completesequence and the probability of finding a certain residue at a certain position can be
33
used in this case to identify globins with high precision. In ProSite, this type of profilesearching has identified 738 globins with only a single false positive. This procedure isthen essentially a profile-based multiple sequence alignment.
Databases
A number of databases and servers contain information about conserved patternsin proteins. The ProSite database (http://www.expasy.ch/prosite/), maintained by theSwiss Institute of Bioinformatics in Geneva, contains close to 1500 different patternsthat can be used to identify function of a protein. The database consists of a list ofsequence database entries (with links) containing the pattern. True positives and falsepositives are included with different denotations. In addition, the database contains auseful documentation for the majority of patterns. This contains a description of thepattern and the protein family,
Another database derived from ProSite is Prints(http://www.bioinf.man.ac.uk/dbbrowser/PRINTS/). It contains complete "fingerprints"of proteins, where several sites within a protein or protein domain have been combined.Only a subset of the patterns in ProSite has been possible to make into a fingerprint.The database contains the aligned patterns and functional links.
Assigning a function to a protein through its fold
Although the main method for the assignment of a function to a protein is to finda significant sequence similarity, there are many cases where no related protein ofknown function can be found. In cases where no significant similarity at the sequencelevel is found, one way to identify the function of a gene is to determine the three-dimensional structure of the protein and from the fold try to decide what function theprotein might have. Although there is in general no relation between the fold and thefunction of a protein, there are cases where a fold is connected with only one or a fewrelated activities.
In one of the first systematic efforts in this area, a number of proteins from anarchaeon were analyzed by NMR or X-ray crystallography 18. In this case, proteins ofcompletely unknown function were selected. The first 10 proteins with no clearsequence homology to known proteins all had a topology that had been observedbefore. For some of the proteins, the structural similarity gave a clear indication of thefunction of the protein. In some cases, a ligand was bound to the protein in the crystaland detected by the structure determination, which further helped in the identification ofthe function (Figure 20). There were also cases where the structural similarity gave avery crude or no indication of the protein function.

34
Figure 20. Schematic drawings of ten proteins fromMethanobacterium thermoautotrophicum (anarchaeon) with no sequence similarity to proteins of known structure. MTH150 and MTH152 boundNAD+ and FMN, respectively in the crystal, which in addition to the structural similarity to knownenzymes allowed the identification of a function (confirmed in the case of MTH150). In the case ofMTH129, the function was known from homology to oritidine monophosphate decarboxylase, but nostructure was known.
Assigning functions from sequences by genome comparisons
Gene fusion
The function of unknown genes can also be found indirectly. One way to findout whether two proteins are involved in the same metabolic pathway is to look for apossible gene fusion of the two proteins in another genome. A gene fusion in oneorganism is a strong indication that the two proteins are physically associated or at leastperforming successive steps also in another organism. In the case of bacterial genomes,hundreds of pairs of proteins are found as fusion proteins in one or another organism 19;
20.
35
Phylogenetic profiles
Another way to assign a function to a protein is to analyze the phylogeneticprofile. There are a number of such genomic-context methods. Pairs or groups ofproteins that are all either present or absent in genomes are likely to be physically orfunctionally associated 21 and a conserved gene order or shared regulatory elementsindicate that the proteins are related.
Protein-protein interactions
Many protein complexes have been found and characterized but there has been atendency to regard proteins as separate entities performing their functions. There is nowmore and more evidence that a large fraction of the proteins in the cell form complexes.When complete genomes have been characterized, it is now important to find out howthe proteins are organized in the cell. Obviously, this information would be very usefulfor explaining all the mechanisms in a cell. To map all protein-protein interactions in acell is an enormous task. A large amount of interaction data has accumulated bybiochemists for many years, but the increase in the number of proteins of unknownfunction by the genome sequence projects has increased the efforts in analyzing andstoring protein-protein interactions efficiently.
One way of obtaining such information experimentally is through two-hybridinteractions, where large number of protein-protein combinations can be tested forreasonably strong binding. In this method, a library of proteins is expressed togetherwith a “bait” protein in cells, and using a genetic trick only those cells where a proteinfrom the library interacts with the bait protein will grow. This method has been used tofind protein-protein interactions in yeast 22; 23 and some other organisms.
Another approach is to try to isolate the complexes directly from cells byattaching suitable tags to the genes of various proteins. All the proteins in thesecomplexes can then be identified by mass spectrometry.
The experimental methods are not very reliable and require a certain level ofbinding affinity. There are efforts to develop computational methods to produce usefulpredictions of interactions. This has turned out to be difficult, since interacting surfacesare often not different from other surfaces of proteins. Prediction of cavities and cleftsis more straightforward and might indicate binding surfaces for small molecules.
Information about protein interactions is found in the database BIND(www.blueprint.org/bind/bind.php). This database run by Mount Sinai Hospital inToronto, Canada at present contains 117 000 entries. It is not restricted to interactionbetween proteins but contain also interactions between proteins and other moleculeslike nucleic acid and small ligands.
36
PREDICTION OF PROTEIN CONFORMATION
Secondary structure prediction
Basis of secondary structure prediction methods
The realization that protein sequences contains essentially all the informationnecessary to govern the folding of a protein has inspired scientists to try to determineprotein conformation directly from the sequence. In spite of all efforts over decades ofyears, this goal has not at all been achieved, but the methods are still improving. Thelack of success is mainly due to two limitations. One is that even a small protein canhave an enormous number of conformations. Even with modern computers, it is farfrom possible to analyze all these conformations, even if the task is simplified byallowing only a small number of arrangements of every amino acid residue. In addition,the free energy of the system (the protein and the surrounding solvent) has to becalculated using the simplified available potential functions, which might not correctlyaccount for all forces in the system and therefore might not be able to identify thecorrect minimum.
At an early stage, it was realized that the problem could be simplified bydividing the prediction into two stages: first the secondary structure elements of theprotein were predicted, followed by attempts to assemble the strands and helices intothe correct conformation. This might to some extent follow the path of the proteinfolding in the cell.
The secondary structure of a segment of the polypeptide chain in a foldedprotein will depend on the amino acid sequence. One approach is to use the tendency ofamino acids to prefer one kind of conformation. Secondary structure prediction methodshave been based on such propensities for amino acid residues to form β strands, helicesor turns. These propensities have been derived from studies of the conformation ofsmall peptides in solution, or from statistical analysis of the occurrence of certainresidues in the various types of secondary structure in proteins of known structure.
Procedures for the prediction
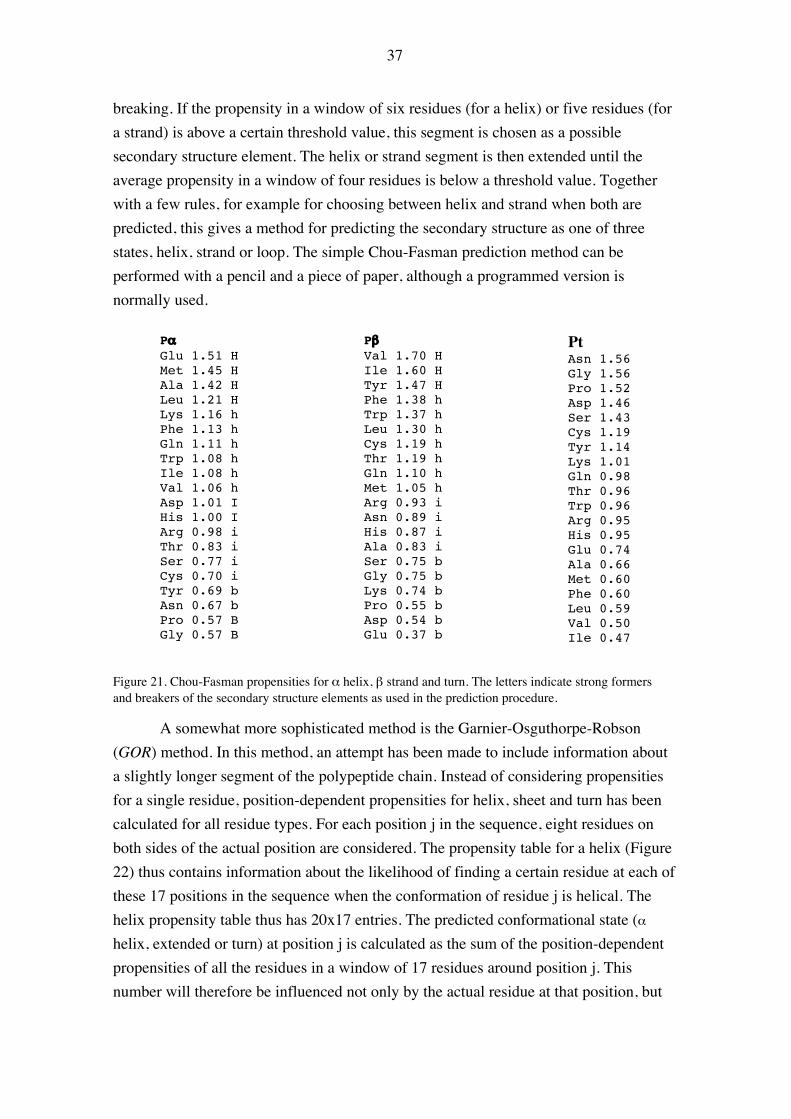
The first widely used procedure for secondary structure prediction was theChou-Fasman method. This method was based on α-helical or β-strand propensities ofall 20 amino acids, which are classified as helix-forming or -breaking and strand-forming or -breaking (Figure 21). These propensities are based on a statistical analysisof the occurrence of various residues in secondary structure elements of known proteinstructures. The method consists of a number of rules for helix and strand formation and
37
breaking. If the propensity in a window of six residues (for a helix) or five residues (fora strand) is above a certain threshold value, this segment is chosen as a possiblesecondary structure element. The helix or strand segment is then extended until theaverage propensity in a window of four residues is below a threshold value. Togetherwith a few rules, for example for choosing between helix and strand when both arepredicted, this gives a method for predicting the secondary structure as one of threestates, helix, strand or loop. The simple Chou-Fasman prediction method can beperformed with a pencil and a piece of paper, although a programmed version isnormally used.
PαGlu 1.51 HMet 1.45 HAla 1.42 HLeu 1.21 HLys 1.16 hPhe 1.13 hGln 1.11 hTrp 1.08 hIle 1.08 hVal 1.06 hAsp 1.01 IHis 1.00 IArg 0.98 iThr 0.83 iSer 0.77 iCys 0.70 iTyr 0.69 bAsn 0.67 bPro 0.57 BGly 0.57 B
PβVal 1.70 HIle 1.60 HTyr 1.47 HPhe 1.38 hTrp 1.37 hLeu 1.30 hCys 1.19 hThr 1.19 hGln 1.10 hMet 1.05 hArg 0.93 iAsn 0.89 iHis 0.87 iAla 0.83 iSer 0.75 bGly 0.75 bLys 0.74 bPro 0.55 bAsp 0.54 bGlu 0.37 b
PtAsn 1.56Gly 1.56Pro 1.52Asp 1.46Ser 1.43Cys 1.19Tyr 1.14Lys 1.01Gln 0.98Thr 0.96Trp 0.96Arg 0.95His 0.95Glu 0.74Ala 0.66Met 0.60Phe 0.60Leu 0.59Val 0.50Ile 0.47
Figure 21. Chou-Fasman propensities for α helix, β strand and turn. The letters indicate strong formersand breakers of the secondary structure elements as used in the prediction procedure.
A somewhat more sophisticated method is the Garnier-Osguthorpe-Robson(GOR) method. In this method, an attempt has been made to include information abouta slightly longer segment of the polypeptide chain. Instead of considering propensitiesfor a single residue, position-dependent propensities for helix, sheet and turn has beencalculated for all residue types. For each position j in the sequence, eight residues onboth sides of the actual position are considered. The propensity table for a helix (Figure22) thus contains information about the likelihood of finding a certain residue at each ofthese 17 positions in the sequence when the conformation of residue j is helical. Thehelix propensity table thus has 20x17 entries. The predicted conformational state (αhelix, extended or turn) at position j is calculated as the sum of the position-dependentpropensities of all the residues in a window of 17 residues around position j. Thisnumber will therefore be influenced not only by the actual residue at that position, but

38
also to some extent by other neighboring residues. The propensity tables will to someextent reflect the fact that prolines can be found in the N-terminal end of helices, but arevery unlikely in the C-terminal end (a Pro at –1 will contribute with –140 and a Pro at+1 with –60). They will also reflect that positively charged residues are more oftenfound in the C-terminal end of helices and that negatively charged residues are found inthe N-terminal end. The GOR method is well suited for programming and has been astandard method for many years.
C N -8 -7 -6 -5 -4 -3 -2 -1 0 1 2 3 4 5 6 7 8gly -5 -10 -15 -20 -30 -40 -50 -60 -86 -60 -50 -40 -30 -20 -15 -10 -5ala 5 10 15 20 30 40 50 60 65 60 50 40 30 20 15 10 5val 0 0 0 0 0 0 5 10 14 10 5 0 0 0 0 0 0leu 0 5 10 15 20 25 28 30 32 30 28 25 20 15 10 5 0ile 5 10 15 20 25 20 15 10 6 0 -10 -15 -20 -25 -20 -10 -5ser 0 -5 -10 -15 -20 -25 -30 -35 -39 -35 -30 -25 -20 -15 -10 -5 0thr 0 0 0 -5 -10 -15 -20 -25 -26 -25 -20 -15 -10 -5 0 0 0asp 0 -5 -10 -15 -20 -15 -10 0 5 10 15 20 20 20 15 10 5glu 0 0 0 0 10 20 60 70 78 78 78 78 78 70 60 40 20asn 0 0 0 0 -10 -20 -30 -40 -51 -40 -30 -20 -10 0 0 0 0gln 0 0 0 0 5 10 20 20 10 -10 -20 -20 -10 -5 0 0 0lys 20 40 50 55 60 60 50 30 23 10 5 0 0 0 0 0 0his 10 20 30 40 50 50 50 30 12 -20 -10 0 0 0 0 0 0arg 0 0 0 0 0 0 0 0 -9 -15 -20 -30 -40 -50 -50 -30 -10phe 0 0 0 0 0 5 10 15 16 15 10 5 0 0 0 0 0tyr -5 -10 -15 -20 -25 -30 -35 -40 -45 -40 -35 -30 -25 -20 -15 -10 -5trp -10 -20 -40 -50 -50 -10 0 10 12 10 0 -10 -50 -50 -40 -20 -10cys 0 0 0 0 0 0 -5 -10 -13 -10 -5 0 0 0 0 0 0met 10 20 25 30 35 40 45 50 53 50 45 40 35 30 25 20 10pro -10 -20 -40 -60 -80-100-120-140 -77 -60 -30 -20 -10 0 0 0 0
Figure 22. The helix propensity table for the GOR method. The central "0" column signifies the currentposition, and the propensity for the amino acid at that position is found there. The contributions of theresidues before and after that residue are found in the respective columns and are added to give the totalhelix propensity at the current position. Column –6 (for example) has the contributions that the variousresidues at the current position will have at the position –6.
Quality assessment
The normal method for assessing the quality of secondary structure predictionsis to predict the secondary structure for a number of proteins of known structure and tocalculate the Q number, the percentage of residues correctly assigned to a category. Fora completely random prediction in three categories (Q3, categories helix, sheet andother) this number will be 33% if the proteins have equal amounts of the threecategories of conformation. The GOR method gives on average about 60% correctpredictions, while the Chou-Fasman method gives still lower numbers.
In some examples, many of the correct secondary structure elements areidentified, but the start and end of them are not correctly predicted. In fact, there isoften an ambiguity in the definition of the beginning and end of secondary structureelements also when the conformation is known. One of the most used procedures fordefining the secondary structure of a protein is DSSP 24, which defines a number of
39
different types of secondary structure, including three different types of helices. Thisprocedure is mainly based on estimates of reasonable hydrogen bond energies.
The Chou-Fasman and GOR methods are both based on statistics of secondarystructure propensities in known structures. There are other methods that are based onproperties of residues, but these methods do not give a significantly better result.
Some improvements have been achieved by combining a number of differentprediction methods and calculating a consensus prediction. An example of a server thatruns several different programs is found at. http://pbil.ibcp.fr/.
New methods: neural networks
Recently, a number of methods that show significantly better results than theabove methods have been developed. The improvement comes from using multiplealigned sequences for the prediction. The pattern of substitutions in homologousproteins contains information about features that are of importance for the fold of aprotein. If the protein of interest can be aligned with homologous sequences, theconsensus sequence will give improved accuracy for the prediction.
One program that has become popular is PHDsec, which predicts secondarystructure based on a two-layered feed-forward neural network 25; 26. The accuracy forthis and some other programs based on aligned homologous sequences of unknownstructures is better than 70%.
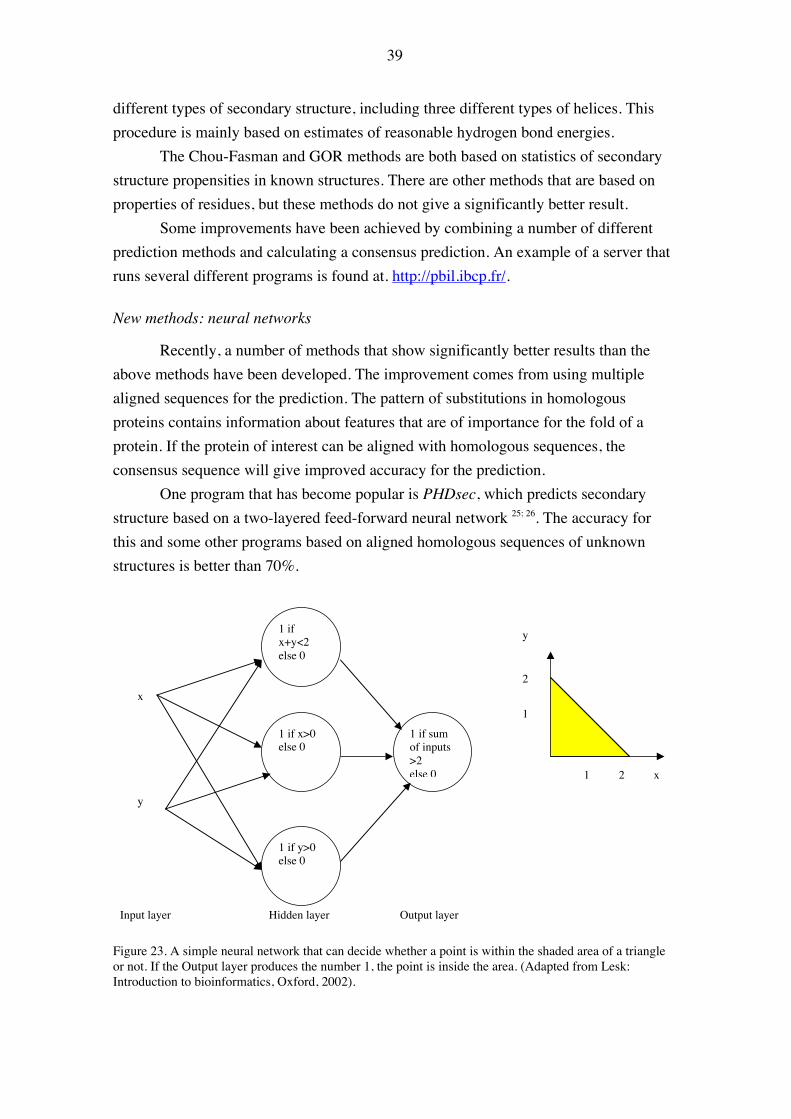
1 ifx+y<2else 0
1 if x>0else 0
1 if y>0else 0
x
y
1 if sumof inputs>2else 0 1 2
1
2
Input layer Output layerHidden layer
y
x
Figure 23. A simple neural network that can decide whether a point is within the shaded area of a triangleor not. If the Output layer produces the number 1, the point is inside the area. (Adapted from Lesk:Introduction to bioinformatics, Oxford, 2002).

40
A neural network is a computer program that can incorporate knowledge aboutrelations between various types of input and output information. The information isstored as parameters in the program. In the case of a neural network for secondarystructure prediction, the aim is to connect sequence patterns with the secondarystructure to which they have been observed to correspond to. The network contains anumber of layers (input layer, prediction layers, output layers), and the information isgoing from one layer to the next (feed-forward). Aligned homologous sequences ofknown structures are used to “train” the network. The relation between sequence andobserved secondary structure is in this procedure used to calculate parametersdescribing the probability that a certain residue will result in a certain secondarystructure. These parameters can then be used to predict the secondary structure of thealigned sequences of the unknown protein.
Figure 24. Schematic drawing of part of the neural network in PHDsec. The protein is aligned to fourmore sequences, and all of this sequence information in a window of 13 residues is put into the inputlayer of 13 x 24 = 312 units (one for each amino acid and some coding for ends and gaps). A number ofhidden layers connect the input layers to the output layer, with one node each for the probability of helix,strand and loop. A second network is used to improve the local prediction obtained in this step.
The neural network in PHD has one layer which links sequence patterns tosecondary structure (sequence-structure layer). In the training step, the occurrence ofvarious residues in a window of 13 amino acids is correlated with the secondarystructure of the central residue. This part of the method is similar to the prediction in theGOR program, and the parameters will reflect secondary structure propensities similarto the ones in Figure 22. In the second step (structure-structure layer), the output from

41
the first layer in a window of 17 residues is used to predict the secondary structure ofthe central residue. In this case, the network will be trained not to predict unreasonablyshort segments of secondary structure.
When the neural network has been trained using several proteins of knownconformation, it can be used for prediction. One of the main features is that the searchsequence is first used to find homologous sequences (using BLAST) that are aligned tothe search sequence. The aligned sequences are fed into the network and used forprediction. In spite of the more sophisticated treatment in the neural network, the mainimprovement over the methods described above is due to the aligned sequences. Forexample, positions where insertions and deletions have occurred in some of the alignedsequences most likely to correspond to loop regions. When the PHDsec procedure isused for a single sequence, the accuracy is considerably lower and only slightly betterthan the old methods.
Another procedure is the Nearest-neighbor method as found in the programNNSSP 27. Here, a number of known structure are used to make a database of sequencesegments of suitable length, for example 16 residues, and the secondary structure of acentral residue. The search sequence is then compared to this database, and for eachwindow in the search sequence, the most similar sequence in the database are found andthe secondary structure of these windows used to predict the conformation of the centralresidue in the search sequence.
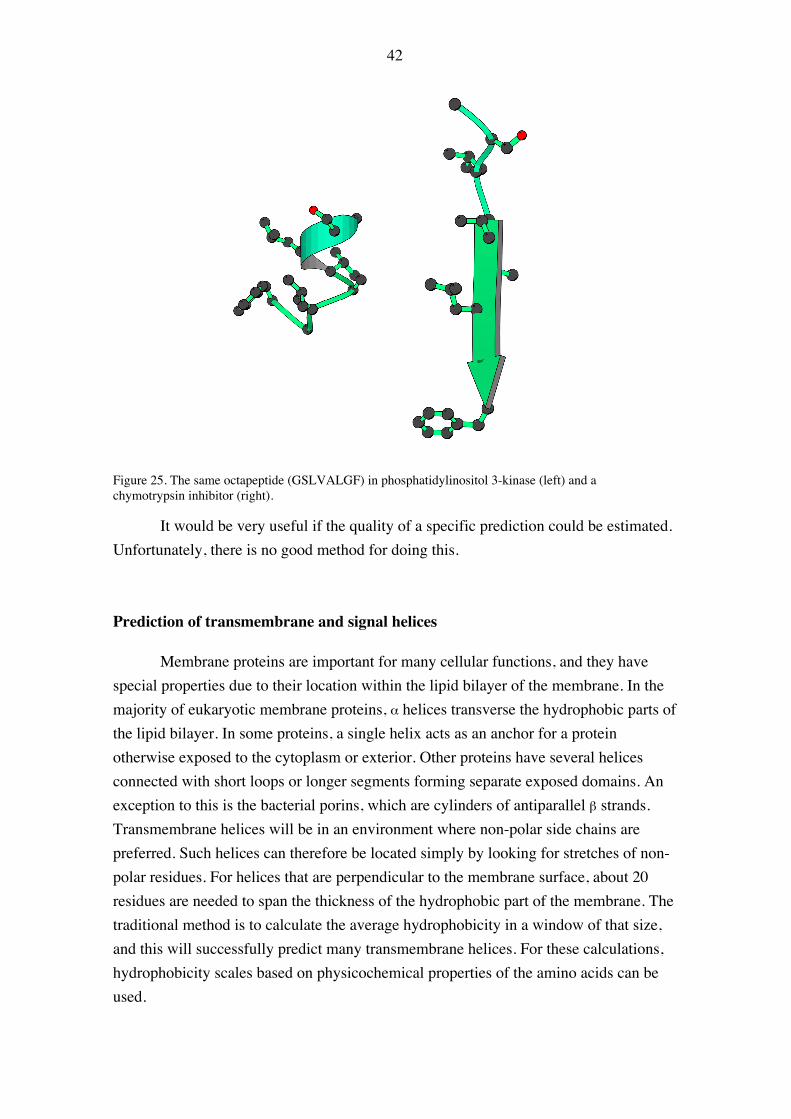
The best secondary structure prediction methods are now relatively accurate,and it is possible that it is no longer possible to improve them further. Secondarystructure prediction methods are always based on the local sequence, and the truefolding and thus the secondary structure depends on non-local interactions. The fractionof the secondary structure of a protein that is mainly dependent on the non-localinteraction might correspond to the fraction that is incorrectly predicted by theprograms. There are cases where identical sequences of up to eight residues formcompletely different structures 28, which shows that non-local effects might be crucialfor the conformation of a peptide.
42
Figure 25. The same octapeptide (GSLVALGF) in phosphatidylinositol 3-kinase (left) and achymotrypsin inhibitor (right).
It would be very useful if the quality of a specific prediction could be estimated.Unfortunately, there is no good method for doing this.
Prediction of transmembrane and signal helices
Membrane proteins are important for many cellular functions, and they havespecial properties due to their location within the lipid bilayer of the membrane. In themajority of eukaryotic membrane proteins, α helices transverse the hydrophobic parts ofthe lipid bilayer. In some proteins, a single helix acts as an anchor for a proteinotherwise exposed to the cytoplasm or exterior. Other proteins have several helicesconnected with short loops or longer segments forming separate exposed domains. Anexception to this is the bacterial porins, which are cylinders of antiparallel β strands.Transmembrane helices will be in an environment where non-polar side chains arepreferred. Such helices can therefore be located simply by looking for stretches of non-polar residues. For helices that are perpendicular to the membrane surface, about 20residues are needed to span the thickness of the hydrophobic part of the membrane. Thetraditional method is to calculate the average hydrophobicity in a window of that size,and this will successfully predict many transmembrane helices. For these calculations,hydrophobicity scales based on physicochemical properties of the amino acids can beused.

43
1 MNGTEGPNFY VPFSNKTGVV RSPFEAPQYY LAEPWQFSML AAYMFLLIML GFPINFLTLY VTVQHKKLRT EE SS E ESS TTS TTTS TT TTTHHHHHHH HHHHHHHHHH HHHHHHHHHH HHHHSTT S
71 PLNYILLNLA VADLFMVFGG FTTTLYTSLH GYFVFGPTGC NLEGFFATLG GEIALWSLVV LAIERYVVVC HHHHHTHHHH HHHHHHHHHT HHHHHHHHHH TS TTHHHHH HHHHHTTHHH HHHHHHHHHH HHHHHHHHHS
141 KPMSNFRFGE NHAIMGVAFT WVMALACAAP PLVGWSRYIP EGMQCSCGID YYTPHEETNN ESFVIYMFVV SSS H HHHHHHHHHH HHHHHHHHTH HHHTSS EEE ETTTTEEEE S TTTTH HHHTHHHHHH
211 HFIIPLIVIF FCYGQLVFTV KEAAAQQQES ATTQKAEKEV TRMVIIMVIA FLICWLPYAG VAFYIFTHQG TTHHHHHHHH HHHHHTTSS S SSSTTHHHH HHHHTHHHHH HHHHHTHHHH HHHHHHHSTT
281 SDFGPIFMTI PAFFAKTSAV YNPVIYIMMN KQFRNCMVTT LCCGKNPLGD DEASTTVSKT ETSQVAPA HHHHHH HHHHHGGGGT HHHHHHHHHT HHHHHHHHHH TTTT SSS SS
Figure 26. The amino acid sequence and the secondary structure of bovine rhodopsin.
Figure 27. The three-dimensional structure of bovine rhodopsin (PDB entry 1f88). The central part of themolecule is the membrane-spanning part. The seven helices are marked (1: 34-64, 2: 71-100, 3: 106-139,4: 150-173, 5: 199-225, 6: 249-277, 7: 285-309). All the helices are slightly distorted.
There are a number of methods that have been developed to predict membrane-spanning segments with high accuracy. Propensities for various residues can becalculated for the spanning segments as well as for those before and after thetransmembrane regions. For example, there is a clear tendency that positively chargedlysine and arginine residues are found more often in cytoplasmic loops than in the loopsat the outer surface of the membrane. This can be used to find the orientation of atransmembrane helix with respect to the outside and inside of a cell as in the programToppred 29.

44
Figure 28. The hydrophobicity plot of bovine rhodopsin from the server TMPred.
When several homologous sequences are known, multiply aligned sequencescan be used to improve the accuracy 30. In the program PHDhtm by Rost and coworkers31; 32, a neural network method is used to predict transmembrane regions of multiplyaligned sequences (http://www.predictprotein.org). These methods are able to identify90-95% of all transmembrane segments with only moderate number of incorrectlypredicted segments.
In the DAS method 33, the search sequence is compared with a database ofmembrane-penetrating proteins (http://www.sbc.su.se/~miklos/DAS/maindas.html). Inthis analysis, the similarities between the search sequence and the other sequences arecalculated in a window of about 10 amino acids using a special replacement scoringmatrix that basically contains hydrophobicity of residues. The scores are used for a dot-plot analysis with a suitable threshold. The potential membrane-spanning regions aretherefore compared to all other membrane-spanning regions. The average score for eachresidue will give peaks that are used to predict the membrane-spanning segments.
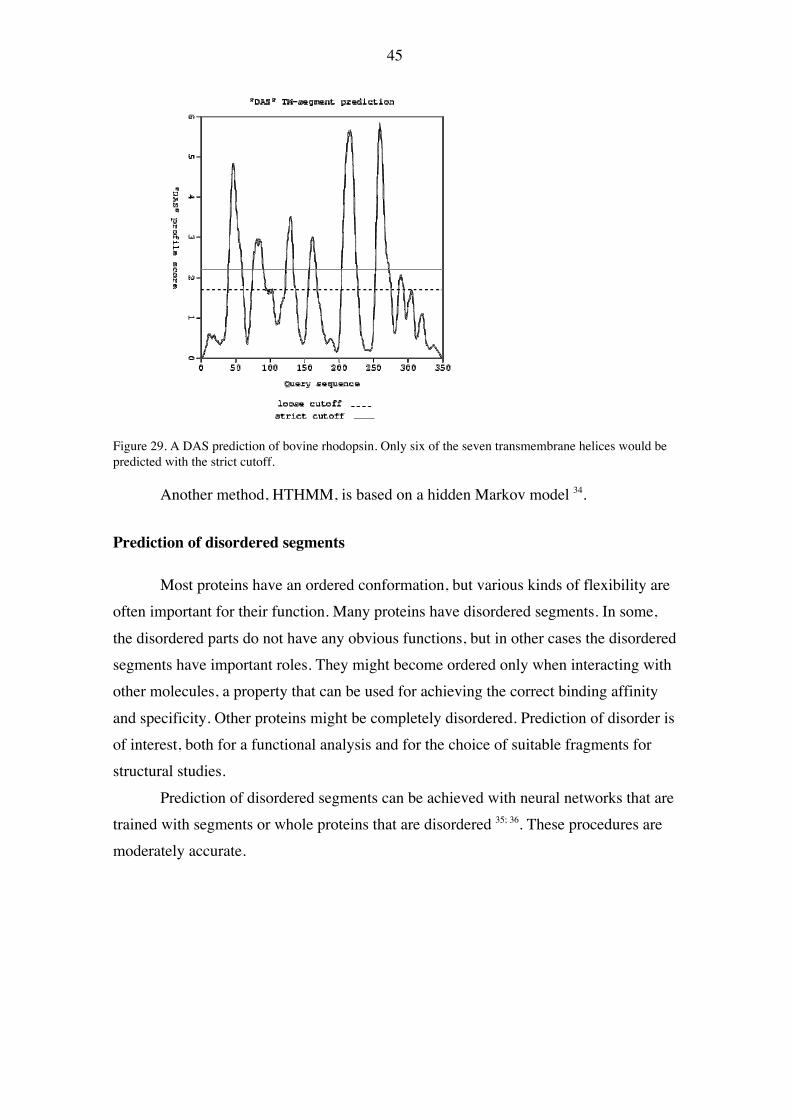
45
Figure 29. A DAS prediction of bovine rhodopsin. Only six of the seven transmembrane helices would bepredicted with the strict cutoff.
Another method, HTHMM, is based on a hidden Markov model 34.
Prediction of disordered segments
Most proteins have an ordered conformation, but various kinds of flexibility areoften important for their function. Many proteins have disordered segments. In some,the disordered parts do not have any obvious functions, but in other cases the disorderedsegments have important roles. They might become ordered only when interacting withother molecules, a property that can be used for achieving the correct binding affinityand specificity. Other proteins might be completely disordered. Prediction of disorder isof interest, both for a functional analysis and for the choice of suitable fragments forstructural studies.
Prediction of disordered segments can be achieved with neural networks that aretrained with segments or whole proteins that are disordered 35; 36. These procedures aremoderately accurate.
46
Modeling of protein tertiary structure
Modeling based on homology to a known structure
Prediction of tertiary structure from sequence has been the goal of muchresearch, but there is still no prediction method that can be applied successfully to anysequence. The increasing number of experimentally determined structures makes themethod of modeling a protein using a suitable known structure as a starting point(homology modeling or comparative modeling) more and more useful. This method isbased on the vast information about the relation between sequence similarity andstructural similarity for homologous proteins.
The first step in homology modeling is to identify a suitable starting model (thetemplate) that can be assumed to be sufficiently similar to the protein we want to model(the target). The second step involves alignment of the sequence of the unknown proteinto the sequence of the known structure(s). In the third step, the actual modeling of theprotein is done by modifications of the starting model.
Finding a suitable starting model
Homology modeling obviously depends on the correctness of the assumptionthat the proteins are homologous and that the unknown protein has the same generalfold as the unknown protein. A Blast search with the target sequence can often beperformed using the subset of all sequences that is found in PDB. If there is more thanone possible choice of a known structure, the one with the highest degree of sequencesimilarity to the unknown structure is normally the best alternative, since this structurewill be most similar to that of the target. It might still be useful to include informationfrom more than one known structure in the modeling. In cases where there is noobviously homologous protein with a known structure that can be used for homologymodeling, there are methods for finding more distant relationships, for examplethreading methods (described below).
The alignment
The alignment step is clearly critical, since any mistake made in sequencealignments is unlikely to be corrected by the modeling process. When the sequencesimilarity is high and no insertions and deletions are present in the sequences, thealignment is trivial. If the sequences are not very similar, the problem is to correctly
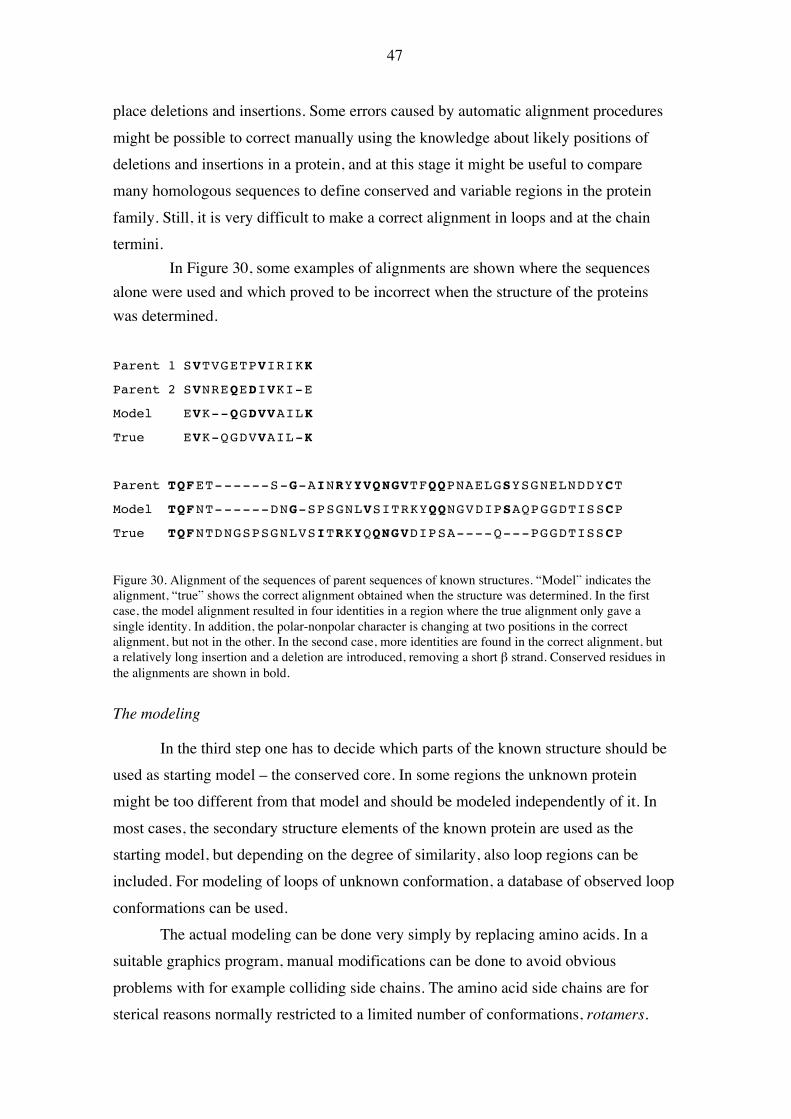
47
place deletions and insertions. Some errors caused by automatic alignment proceduresmight be possible to correct manually using the knowledge about likely positions ofdeletions and insertions in a protein, and at this stage it might be useful to comparemany homologous sequences to define conserved and variable regions in the proteinfamily. Still, it is very difficult to make a correct alignment in loops and at the chaintermini.
In Figure 30, some examples of alignments are shown where the sequencesalone were used and which proved to be incorrect when the structure of the proteinswas determined.
Parent 1 SVTVGETPVIRIKK
Parent 2 SVNREQEDIVKI-E
Model EVK--QGDVVAILK
True EVK-QGDVVAIL-K
Parent TQFET------S-G-AINRYYVQNGVTFQQPNAELGSYSGNELNDDYCT
Model TQFNT------DNG-SPSGNLVSITRKYQQNGVDIPSAQPGGDTISSCP
True TQFNTDNGSPSGNLVSITRKYQQNGVDIPSA----Q---PGGDTISSCP
Figure 30. Alignment of the sequences of parent sequences of known structures. “Model” indicates thealignment, “true” shows the correct alignment obtained when the structure was determined. In the firstcase, the model alignment resulted in four identities in a region where the true alignment only gave asingle identity. In addition, the polar-nonpolar character is changing at two positions in the correctalignment, but not in the other. In the second case, more identities are found in the correct alignment, buta relatively long insertion and a deletion are introduced, removing a short β strand. Conserved residues inthe alignments are shown in bold.
The modeling
In the third step one has to decide which parts of the known structure should beused as starting model – the conserved core. In some regions the unknown proteinmight be too different from that model and should be modeled independently of it. Inmost cases, the secondary structure elements of the known protein are used as thestarting model, but depending on the degree of similarity, also loop regions can beincluded. For modeling of loops of unknown conformation, a database of observed loopconformations can be used.
The actual modeling can be done very simply by replacing amino acids. In asuitable graphics program, manual modifications can be done to avoid obviousproblems with for example colliding side chains. The amino acid side chains are forsterical reasons normally restricted to a limited number of conformations, rotamers.
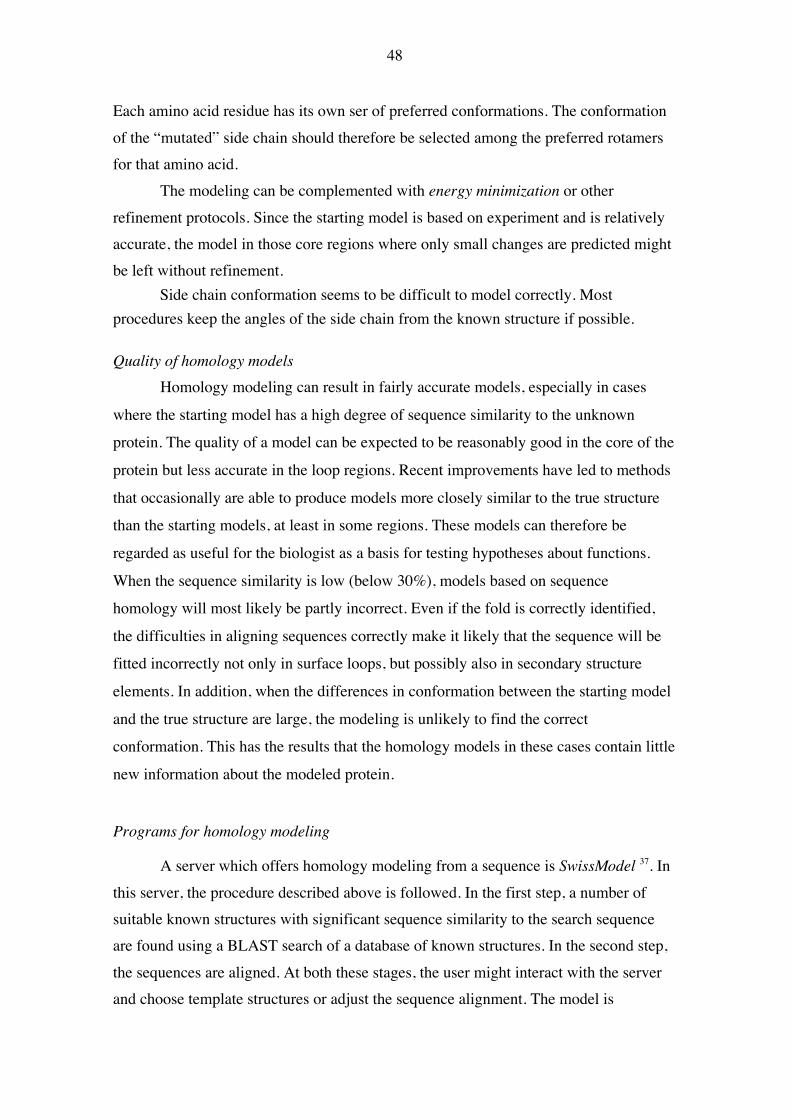
48
Each amino acid residue has its own ser of preferred conformations. The conformationof the “mutated” side chain should therefore be selected among the preferred rotamersfor that amino acid.
The modeling can be complemented with energy minimization or otherrefinement protocols. Since the starting model is based on experiment and is relativelyaccurate, the model in those core regions where only small changes are predicted mightbe left without refinement.
Side chain conformation seems to be difficult to model correctly. Mostprocedures keep the angles of the side chain from the known structure if possible.
Quality of homology modelsHomology modeling can result in fairly accurate models, especially in cases
where the starting model has a high degree of sequence similarity to the unknownprotein. The quality of a model can be expected to be reasonably good in the core of the
protein but less accurate in the loop regions. Recent improvements have led to methods
that occasionally are able to produce models more closely similar to the true structurethan the starting models, at least in some regions. These models can therefore be
regarded as useful for the biologist as a basis for testing hypotheses about functions.
When the sequence similarity is low (below 30%), models based on sequencehomology will most likely be partly incorrect. Even if the fold is correctly identified,
the difficulties in aligning sequences correctly make it likely that the sequence will befitted incorrectly not only in surface loops, but possibly also in secondary structure
elements. In addition, when the differences in conformation between the starting model
and the true structure are large, the modeling is unlikely to find the correctconformation. This has the results that the homology models in these cases contain little
new information about the modeled protein.
Programs for homology modeling
A server which offers homology modeling from a sequence is SwissModel 37. Inthis server, the procedure described above is followed. In the first step, a number ofsuitable known structures with significant sequence similarity to the search sequenceare found using a BLAST search of a database of known structures. In the second step,the sequences are aligned. At both these stages, the user might interact with the serverand choose template structures or adjust the sequence alignment. The model is
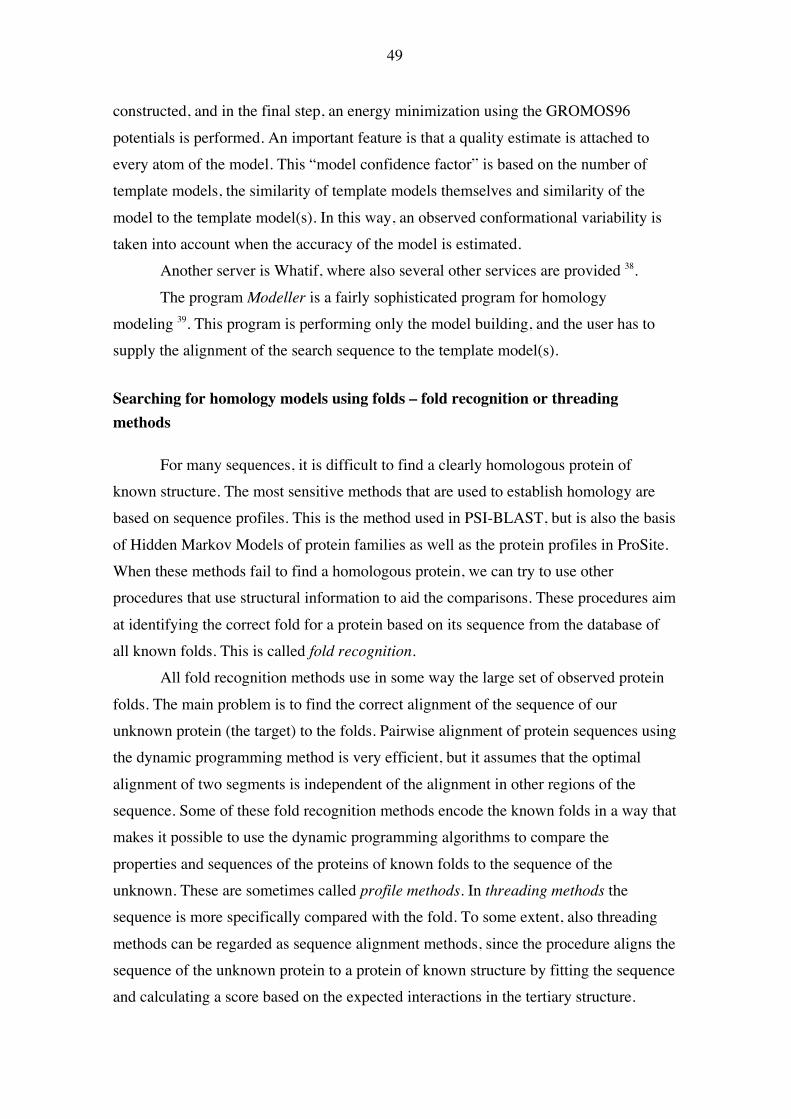
49
constructed, and in the final step, an energy minimization using the GROMOS96potentials is performed. An important feature is that a quality estimate is attached toevery atom of the model. This “model confidence factor” is based on the number oftemplate models, the similarity of template models themselves and similarity of themodel to the template model(s). In this way, an observed conformational variability istaken into account when the accuracy of the model is estimated.
Another server is Whatif, where also several other services are provided 38.The program Modeller is a fairly sophisticated program for homology
modeling 39. This program is performing only the model building, and the user has tosupply the alignment of the search sequence to the template model(s).
Searching for homology models using folds – fold recognition or threadingmethods
For many sequences, it is difficult to find a clearly homologous protein ofknown structure. The most sensitive methods that are used to establish homology arebased on sequence profiles. This is the method used in PSI-BLAST, but is also the basisof Hidden Markov Models of protein families as well as the protein profiles in ProSite.When these methods fail to find a homologous protein, we can try to use otherprocedures that use structural information to aid the comparisons. These procedures aimat identifying the correct fold for a protein based on its sequence from the database ofall known folds. This is called fold recognition.
All fold recognition methods use in some way the large set of observed proteinfolds. The main problem is to find the correct alignment of the sequence of ourunknown protein (the target) to the folds. Pairwise alignment of protein sequences usingthe dynamic programming method is very efficient, but it assumes that the optimalalignment of two segments is independent of the alignment in other regions of thesequence. Some of these fold recognition methods encode the known folds in a way thatmakes it possible to use the dynamic programming algorithms to compare theproperties and sequences of the proteins of known folds to the sequence of theunknown. These are sometimes called profile methods. In threading methods thesequence is more specifically compared with the fold. To some extent, also threadingmethods can be regarded as sequence alignment methods, since the procedure aligns thesequence of the unknown protein to a protein of known structure by fitting the sequenceand calculating a score based on the expected interactions in the tertiary structure.

50
Tertiary structure modeling using this type of methods has three parts. First, thecorrect type of fold has to be identified. The sequence of the unknown protein has thento be aligned to the sequence of the known protein using some scoring function. In thelast step, modeling of the unknown structure is done using the same procedures as inhomology modeling.
3D-profiles
One of the first methods developed for fold recognition was first used to detectincorrect experimental crystallographic models. One way is to classify each positionalong the known fold according to the observed secondary structure and side chainenvironment (a 3D profile). This linear profile is coded as a matrix where at everyposition of the known fold there is a score for each type of amino acid residue (or for agap) corresponding to the probability of finding that residue (or a gap) at that position(Figure 31). Using this matrix, a score can be calculated for a test sequence 40. Thisprocedure can be called inverse folding, since any sequence could be tested for itscompatibility with a fold. When this procedure was used to detect incorrectexperimental crystallographic models, amino acid residues incorrectly “aligned” to theexperimental electron density map, high scores would probably result due to, forexample, polar residues pointing into the hydrophobic core.
Gap GapPos Class A C D E F G ... R S T V W Y open ext.
1 E 12 -46 22 3 -190 113 -32 32 12 -91 -214 -94 2 0.022 B2 -66 -5 -128 -135 105 -166 -80 -117 -76 60 102 112 2 0.023 E α 46 -44 44 59 -220 68 -34 15 -17 -110 -135 -210 200 2004 P2 α 6 -93 28 56 -143 -50 50 -18 -5 -48 -114 -79 200 2005 E α 46 -44 44 59 -220 68 -34 15 -17 -110 -135 -210 200 2006 P2 α 6 -93 28 56 -143 -50 50 -18 -5 -48 -114 -79 200 2007 B2 α -69 -10 -162 -71 90 -149 6 -147 -150 68 50 85 200 2008 E α 46 -44 44 59 -220 68 -34 15 -17 -110 -135 -210 200 2009 P2 α 6 -93 28 56 -143 -50 50 -18 -5 -48 -114 -79 200 200
10 B1 α -66 -73 -197 -174 132 -253 -167 -273 -129 66 100 18 200 200
Figure 31. A short segment of a 3D profile of a protein. Each position in the fold is classified into one of6 classes due to environment (exposed, hydrophobicity) and 3 classes according to secondary structure.Each of these classes has a score value for each amino acid and for a gap. The score value for someamino acids is indicated. Hydrophobic residues are often buried (B), which is reflected in high numbersin the B classes of environments. Exposed hydrophobic residues and buried polar residues give negativescores.
Profile methods
The 3D profile as described above can be used as position-specific scoringmatrix for alignment using the dynamic programming algorithm. Some successful foldrecognition methods also use the power of this algorithm and convert the known folds

51
to strings and align the unknown sequence to these strings. An example of such amethod is the Topits method, developed by Rost and Sander 26. In this method, multiplesequences homologous to the unknown sequence are aligned, and this alignment is usedfor secondary structure prediction and estimates of surface accessibility using the neuralnetwork method in PHD (Figure 32). In this way, the sequence is transformed into a 1Dprofile, where each position contains the amino acid residue and its predictedconformation and accessibility. All known folds from the database of structures arestored as observed profiles of the same type with the amino acid residue and the knownsecondary structure and accessibility at each position. Alignments are then performedusing the dynamic programming algorithm. The score at each position is a suitablyweighted sum between the score from a normal sequence alignment matrix, for exampleBLOSUM62, and a simple matrix scoring for the structural profile. The constants allowa tuning of the weights for the sequence and the profile. In addition there are gapweights.
Figure 32. Principles of the 1D-3D method (TOPITS method). The first steps are the same as thesecondary structure prediction using PHD.
Another method is 3D-PSSM, which uses multiple aligned sequences of boththe target and the known folds to increase the accuracy of the procedure 41.
These methods are simple and automatic, but obviously the information aboutthe tertiary interactions of a residue in a known structure is lost when the structure ismade into a 1D profile.
Input sequenceBlast search inSwissProt
Alignedhomologoussequences
Prediction ofsecondarystructure andaccessibility
ID profile ofsearch sequence
ID profile ofknown folds
Global alignmentusing sequence,secondary structureand accessibility forscoring
List of top scoringfolds and alignedsequences

52
Threading methods
In threading methods the sequence is placed in a known fold and thecompatibility of the sequence with the fold is analyzed by calculating a score or energyfor the model. The scoring or potential function can be constructed in different ways.The score should be compared with scores obtained from fitting many different(unrelated) sequences of similar length to the profile to determine the significance ofany high score.
Distance A-A R-A R-R N-A D-R D-N D-D I-E L-I T-S0-5 0.230 0.237 -0.145 0.159 -0.527 -0.534 0.539 0.385 -0.223 -0.4305-6 0.350 0.338 0.024 -0.170 -0.618 -0.481 0.128 0.537 -0.518 0.0336-7 0.223 0.101 0.215 0.042 -0.609 -0.403 -0.006 0.464 -0.702 -0.1697-8 0.284 0.266 0.249 0.010 -0.243 -0.144 0.036 0.158 -0.347 -0.0568-9 0.020 0.068 0.195 -0.071 -0.266 -0.321 0.021 -0.019 -0.071 -0.020
9-10 0.017 0.050 -0.035 -0.150 0.130 -0.075 0.033 0.122 -0.030 -0.050
Figure 33. A few of the 21 x 21 (20 amino acids + one for the peptide group) contact potentials used forthreading a sequence through a fold. The distance is between standardized positions for the side chainscalculated from backbone coordinates. If two alanine residues are within 10 Å, the indicated potentialfrom the A-A column is added to the total score. Negative potential means a favorable contact. Thepotentials are calculated from observed contact frequencies in proteins.
Some of the procedures are based on the probability of interactions betweendifferent pair of residues in proteins. An example is the method developed by Bryantand cowrkers42. The probabilities are used to create a matrix of pairwise potentialsbetween residues (Figure 33). Each known fold is analyzed with respect to contactsbetween residues creating a table of all pairs of residues that are within a limiteddistance from each other. The sequence of an unknown protein is then threaded througheach fold and for each alignment to the fold the total potential is calculated using thematrix of pairwise interaction potentials. The information that is most important for thesuccess of this and similar method is that they store in these potentials or scoringmatrices the fact that hydrophobic side chains to a large extent are found in thehydrophobic core and that hydrophilic residues are exposed.
Since the sequence most likely has gaps and deletions relative to the possibletrue fold, the score has to be evaluated for many alignments to the fold. In this case it isnot possible to use he dynamic programming method, since the alignment of differentregions is not independent. Threading methods have to use different tricks andsimplifications to allow a score to be calculated in a reasonable time.
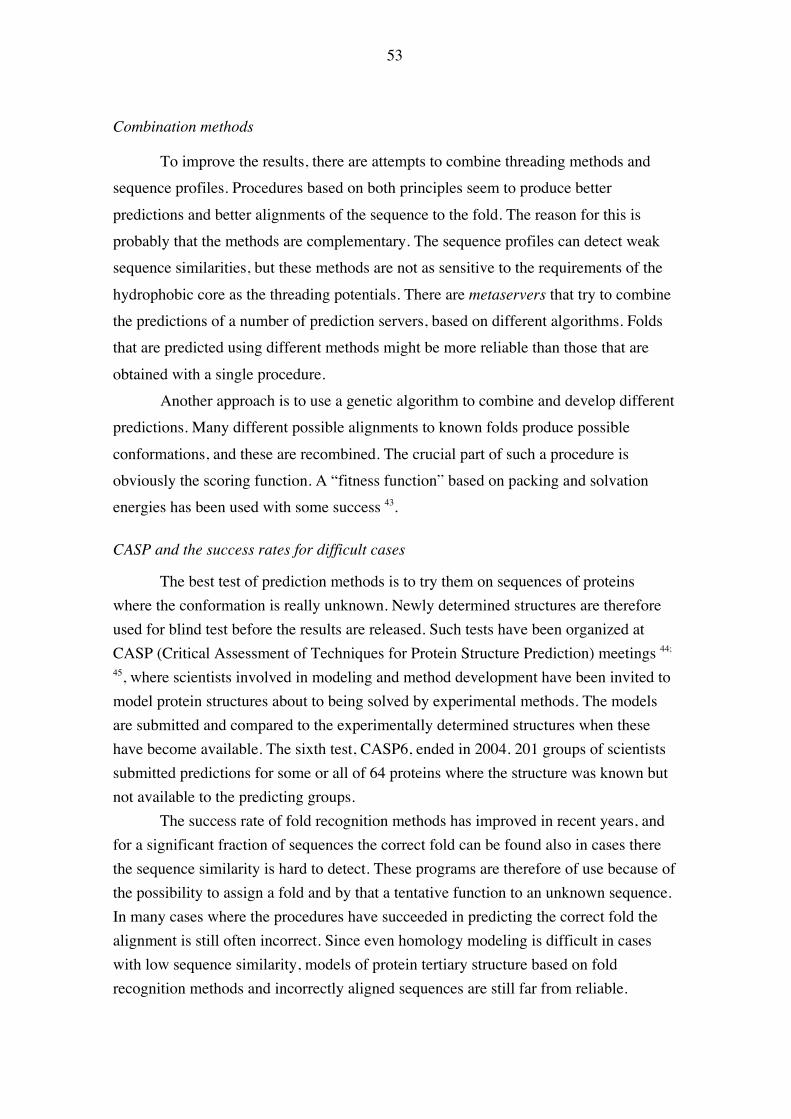
53
Combination methods
To improve the results, there are attempts to combine threading methods andsequence profiles. Procedures based on both principles seem to produce betterpredictions and better alignments of the sequence to the fold. The reason for this isprobably that the methods are complementary. The sequence profiles can detect weaksequence similarities, but these methods are not as sensitive to the requirements of thehydrophobic core as the threading potentials. There are metaservers that try to combinethe predictions of a number of prediction servers, based on different algorithms. Foldsthat are predicted using different methods might be more reliable than those that areobtained with a single procedure.
Another approach is to use a genetic algorithm to combine and develop differentpredictions. Many different possible alignments to known folds produce possibleconformations, and these are recombined. The crucial part of such a procedure isobviously the scoring function. A “fitness function” based on packing and solvationenergies has been used with some success 43.
CASP and the success rates for difficult cases
The best test of prediction methods is to try them on sequences of proteinswhere the conformation is really unknown. Newly determined structures are thereforeused for blind test before the results are released. Such tests have been organized atCASP (Critical Assessment of Techniques for Protein Structure Prediction) meetings 44;
45, where scientists involved in modeling and method development have been invited tomodel protein structures about to being solved by experimental methods. The modelsare submitted and compared to the experimentally determined structures when thesehave become available. The sixth test, CASP6, ended in 2004. 201 groups of scientistssubmitted predictions for some or all of 64 proteins where the structure was known butnot available to the predicting groups.
The success rate of fold recognition methods has improved in recent years, andfor a significant fraction of sequences the correct fold can be found also in cases therethe sequence similarity is hard to detect. These programs are therefore of use because ofthe possibility to assign a fold and by that a tentative function to an unknown sequence.In many cases where the procedures have succeeded in predicting the correct fold thealignment is still often incorrect. Since even homology modeling is difficult in caseswith low sequence similarity, models of protein tertiary structure based on foldrecognition methods and incorrectly aligned sequences are still far from reliable.

54
In fold recognition experiments the correct fold is often found as one of severalfolds with similar energies or scores. Many efforts are therefore spent on optimizingparameters in the scoring functions to recognize the correct fold among other folds. It ispossible, however, that no potential function will ever be able to discriminatecompletely between models in all cases. Even if the correct free energy correspondingto a certain fold was known, it might not be significantly lower than that of some otherfolds. The energy of the native structure is not necessarily much lower than that of otherfolds, since it is the result of a folding process, and the kinetics of the folding might beof importance for the final conformation.
Modeling without homology: Ab initio modeling
The so-called ab initio or new fold prediction methods have a long history.Early methods used simplified descriptions of the amino acid residues and tried tocalculate the minimum energy conformation using a minimization method 46. Thisprocedure to some extent tried to follow the folding pathway of a protein and wastherefore labeled ab initio folding. These methods have had limited success comparedto fold recognition methods, since the original approach suffered from limitations in thepotential functions used and from the size of the computational problem. Some newmethods, however, have been shown to be useful in identifying new folds. An exampleis the Rosetta method. This method is based on an important assumption: the fold of ashort segment of a protein will be similar to a known local fold of similar sequences inother proteins. A library of folds of three- and nine-residue segments is used for theprediction of the fold of the unknown structure. In this library, there will be examples ofdifferent folds for similar sequences. The segments can then be combined in many waysand the energy calculated in a way that favors paired β strands and buried hydrophobicresidues. Many attempts to combine segments in this way leads to a number of differentstructures, and these are clustered into groups of similar fold. The largest of theseclusters is selected as the predicted fold 47. Although better than many old methods, thisand other similar fragment-based procedures are only able to find a correct fold for aminority of sequences, and the model obtained is a very crude description of theprotein.

55
REFERENCES
1. Taniuchi, H. & Anfinsen, C. B. (1969). An experimental approach to the studyof the folding of staphylococcal nuclease. J Biol Chem 244, 3864-75.
2. Daggett, V. & Fersht, A. (2003). The present view of the mechanism of proteinfolding. Nat Rev Mol Cell Biol 4, 497-502.
3. Chothia, C. & Lesk, A. M. (1986). The relation between the divergence ofsequence and structure in proteins. EMBO J. 4, 823-826.
4. Wilson, C. A., Kreychman, J. & Gerstein, M. (2000). Assessing annotationtransfer for genomics: quantifying the relations between protein sequence,structure and function through traditional and probabilistic scores. J Mol Biol297, 233-49.
5. Dickerson, R. E. & Geis, I. (1983). Hemoglobin: Structure, function, evolutionand pathology, Benjamin/Cummings, Menlo Park, California.
6. Holm, L. & Sander, C. (1993). Protein structure comparison by alignment ofdistance matrices. J. Mol. Biol. 233, 123-138.
7. Murzin, A. G., Brenner, S. E., Hubbard, T. & Chothia, C. (1995). SCOP: astructural classification of proteins database for the investigation of sequencesand structures. J Mol Biol 247, 536-40.
8. Orengo, C. A., Michie, A. D., Jones, S., Jones, D. T., Swindells, M. B. &Thornton, J. M. (1997). CATH--a hierarchic classification of protein domainstructures. Structure 5, 1093-108.
9. Jones, S., Stewart, M., Michie, A., Swindells, M. B., Orengo, C. & Thornton, J.M. (1998). Domain assignment for protein structures using a consensusapproach: characterization and analysis. Protein Sci 7, 233-42.
10. Hadley, C. & Jones, D. T. (1999). A systematic comparison of protein structureclassifications: SCOP, CATH and FSSP. Structure Fold Des 7, 1099-112.
11. Holm, L. & Sander, C. (1998). Touring protein fold space with Dali/FSSP.Nucleic Acids Res 26, 316-9.
12. Holm, L. & Sander, C. (1998). Dictionary of recurrent domains in proteinstructures. Proteins 33, 88-96.
13. Abagyan, R. A. & Batalov, S. (1997). Do aligned sequences share the samefold? J Mol Biol 273, 355-68.
14. Bateman, A., Birney, E., Durbin, R., Eddy, S. R., Howe, K. L. & Sonnhammer,E. L. (2000). The Pfam protein families database. Nucleic Acids Res 28, 263-6.
15. Corpet, F., Servant, F., Gouzy, J. & Kahn, D. (2000). ProDom and ProDom-CG:tools for protein domain analysis and whole genome comparisons. Nucleic AcidsRes 28, 267-9.
16. Apweiler, R., Attwood, T. K., Bairoch, A., Bateman, A., Birney, E., Biswas, M.,Bucher, P., Cerutti, L., Corpet, F., Croning, M. D., Durbin, R., Falquet, L.,Fleischmann, W., Gouzy, J., Hermjakob, H., Hulo, N., Jonassen, I., Kahn, D.,Kanapin, A., Karavidopoulou, Y., Lopez, R., Marx, B., Mulder, N. J., Oinn, T.M., Pagni, M. & Servant, F. (2001). The InterPro database, an integrateddocumentation resource for protein families, domains and functional sites.Nucleic Acids Res 29, 37-40.
17. Hofmann, K., Bucher, P., Falquet, L. & Bairoch, A. (1999). The PROSITEdatabase, its status in 1999. Nucleic Acids Res 27, 215-9.
56
18. Christendat, D., Yee, A., Dharamsi, A., Kluger, Y., Savchenko, A., Cort, J. R.,Booth, V., Mackereth, C. D., Saridakis, V., Ekiel, I., Kozlov, G., Maxwell, K.L., Wu, N., McIntosh, L. P., Gehring, K., Kennedy, M. A., Davidson, A. R., Pai,E. F., Gerstein, M., Edwards, A. M. & Arrowsmith, C. H. (2000). Structuralproteomics of an archaeon. Nat Struct Biol 7, 903-9.
19. Marcotte, E. M., Pellegrini, M., Ng, H. L., Rice, D. W., Yeates, T. O. &Eisenberg, D. (1999). Detecting protein function and protein-protein interactionsfrom genome sequences. Science 285, 751-3.
20. Enright, A. J., Iliopoulos, I., Kyrpides, N. C. & Ouzounis, C. A. (1999). Proteininteraction maps for complete genomes based on gene fusion events. Nature402, 86-90.
21. Pellegrini, M., Marcotte, E. M., Thompson, M. J., Eisenberg, D. & Yeates, T. O.(1999). Assigning protein functions by comparative genome analysis: proteinphylogenetic profiles. Proc Natl Acad Sci U S A 96, 4285-8.
22. Ito, T., Tashiro, K., Muta, S., Ozawa, R., Chiba, T., Nishizawa, M., Yamamoto,K., Kuhara, S. & Sakaki, Y. (2000). Toward a protein-protein interaction map ofthe budding yeast: A comprehensive system to examine two-hybrid interactionsin all possible combinations between the yeast proteins. Proc Natl Acad Sci U SA 97, 1143-7.
23. Uetz, P., Giot, L., Cagney, G., Mansfield, T. A., Judson, R. S., Knight, J. R.,Lockshon, D., Narayan, V., Srinivasan, M., Pochart, P., Qureshi-Emili, A., Li,Y., Godwin, B., Conover, D., Kalbfleisch, T., Vijayadamodar, G., Yang, M.,Johnston, M., Fields, S. & Rothberg, J. M. (2000). A comprehensive analysis ofprotein-protein interactions in Saccharomyces cerevisiae. Nature 403, 623-7.
24. Kabsch, W. & Sander, C. (1983). Dictionary of protein secondary structure:Pattern recognition of hydrogen-bonded and geometrical features. Biopolymers22, 2577-2637.
25. Rost, B. & Sander, C. (1994). Combining evolutionary information and neuralnetworks to predict protein secondary structure. Proteins 19, 55-72.
26. Rost, B., Schneider, R. & Sander, C. (1997). Protein fold recognition byprediction-based threading. J Mol Biol 270, 471-80.
27. Salamov, A. A. & Solovyev, V. V. (1997). Protein secondary structureprediction using local alignments. J Mol Biol 268, 31-6.
28. Sudarsanam, S. (1998). Structural diversity of sequentially identicalsubsequences of proteins: identical octapeptides can have differentconformations. Proteins 30, 228-31.
29. von Heijne, G. (1992). Membrane protein structure prediction. Hydrophobicityanalysis and the positive-inside rule. J. Mol. Biol. 225, 487-494.
30. Persson, B. & Argos, P. (1994). Prediction of transmembrane segments inproteins utilising multiple sequence alignments. J Mol Biol 237, 182-92.
31. Rost, B., Casadio, R., Fariselli, P. & Sander, C. (1995). Transmembrane helicespredicted at 95% accuracy. Protein Sci 4, 521-33.
32. Rost, B., Fariselli, P. & Casadio, R. (1996). Topology prediction for helicaltransmembrane proteins at 86% accuracy. Protein Sci 5, 1704-18.
33. Cserzö, M., Wallin, E., Simon, I., von Heijne, G. & Elofsson, A. (1997).Prediction of transmembrane alpha-helices in prokaryotic membrane proteins:the dense alignment surface method. Protein Eng 10, 673-6.
34. Krogh, A., Larsson, B., von Heijne, G. & Sonnhammer, E. L. (2001). Predictingtransmembrane protein topology with a hidden Markov model: application tocomplete genomes. J Mol Biol 305, 567-80.
57
35. Linding, R., Jensen, L. J., Diella, F., Bork, P., Gibson, T. J. & Russell, R. B.(2003). Protein disorder prediction: implications for structural proteomics.Structure (Camb) 11, 1453-9.
36. Obradovic, Z., Peng, K., Vucetic, S., Radivojac, P., Brown, C. J. & Dunker, A.K. (2003). Predicting intrinsic disorder from amino acid sequence. Proteins 53Suppl 6, 566-72.
37. Peitsch, M. C. (1996). ProMod and Swiss-Model: Internet-based tools forautomated comparative protein modelling. Biochem Soc Trans 24, 274-9.
38. Rodriguez, R., Chinea, G., Lopez, N., Pons, T. & Vriend, G. (1998). Homologymodeling, model and software evaluation: three related resources.Bioinformatics 14, 523-8.
39. Sali, A. & Blundell, T. L. (1993). Comparative protein modelling by satisfactionof spatial restraints. J Mol Biol 234, 779-815.
40. Luthy, R., Bowie, J. U. & Eisenberg, D. (1992). Assessment of protein modelswith three-dimensional profiles. Nature 356, 83-5.
41. Kelley, L. A., MacCallum, R. M. & Sternberg, M. J. (2000). Enhanced genomeannotation using structural profiles in the program 3D-PSSM. J Mol Biol 299,499-520.
42. Bryant, S. H. & Lawrence, C. E. (1993). An empirical energy function forthreading protein sequence through the folding motif. Proteins 16, 92-112.
43. Contreras-Moreira, B., Fitzjohn, P. W., Offman, M., Smith, G. R. & Bates, P. A.(2003). Novel use of a genetic algorithm for protein structure prediction:searching template and sequence alignment space. Proteins 53 Suppl 6, 424-9.
44. Moult, J., Fidelis, K., Zemla, A. & Hubbard, T. (2003). Critical assessment ofmethods of protein structure prediction (CASP)-round V. Proteins 53 Suppl 6,334-9.
45. Murzin, A. G. (2001). Progress in protein structure prediction. Nat Struct Biol 8,110-2.
46. Levitt, M. & Warshel, A. (1975). Computer simulation of protein folding.Nature 253, 694-698.
47. Bonneau, R., Strauss, C., Rohl, C., Chivian, D., Bradley, P., Malmström, L.,Robertson, T. & Baker, D. (2002). De novo prediction of three-dimensionalstructures for major protein families. J Mol Biol 322, 65.


