37
Protein Structure Modeling (1)
| Date post: | 20-Dec-2015 |
| Category: |
Documents |
| View: | 226 times |
| Download: | 0 times |

Protein Structure Modeling (1)

Protein Folding Problem
A protein folds into a unique 3D structure under physiological conditions
Lysozyme sequence: KVFGRCELAA AMKRHGLDNY
RGYSLGNWVC AAKFESNFNT
QATNRNTDGS TDYGILQINS
RWWCNDGRTP GSRNLCNIPC
SALLSSDITA SVNCAKKIVS
DGNGMNAWVA WRNRCKGTDV
QAWIRGCRL
Anfinsen, 1960: denatured proteins can refold to active enzymes
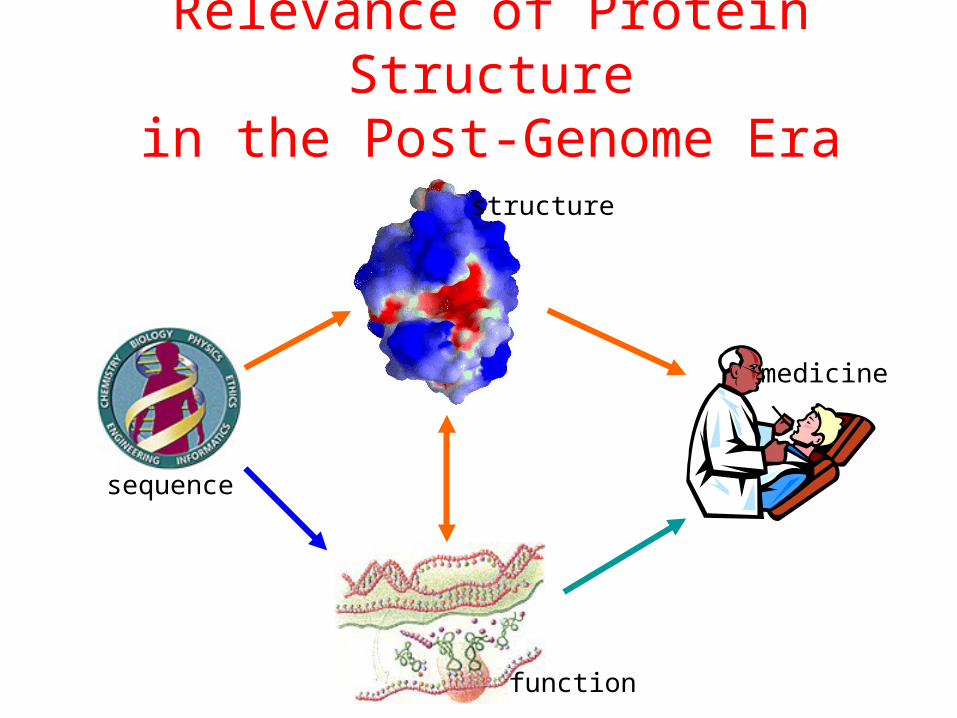
Relevance of Protein Structurein the Post-Genome Era
sequence
structure
function
medicine

Structure-Function Relationship
Certain level of function can be found without structure. But a structure is a key to understand the detailed mechanism.
A predicted structure is a powerful tool for function inference.
Trp repressor as a function switch

Structure–Function Relationship
• Do you know any folding diseases?

Structure-Based Drug Design
HIV protease inhibitor
Structure-based rational drug design is still a major method for drug discovery.

Protein Structure Prediction
Structure:Traditional experimental methods:
X-Ray or NMR to solve structures;generate a few structures per day worldwidecannot keep pace for new protein sequences
Strong demand for structure prediction:more than 30,000 human genes;10,000 genomes will be sequenced in the next 10 years.
Unsolved problem after efforts of two decades.
Protein folding
• To get from sequence to structure: What principles could one apply?

Methods
• Ab initio modeling
• Chou-Fasman / GOR
• PHD: Neural Network
• Homology modeling
• Threading

Prediction
http://www.bmm.icnet.uk/people/rob/CCP11BBS/
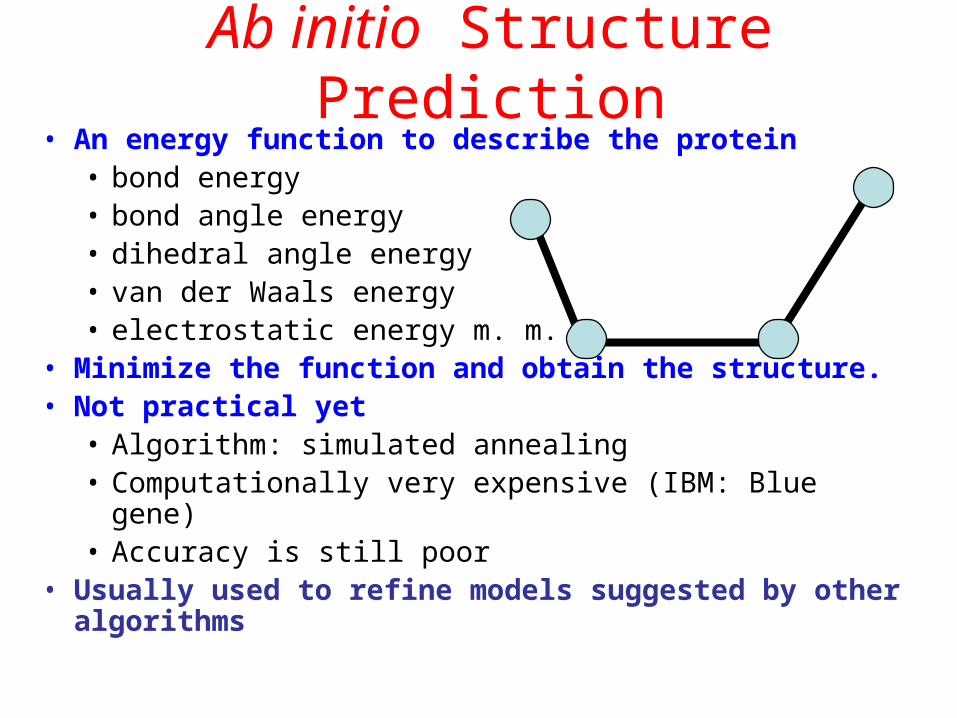
Ab initio Structure Prediction• An energy function to describe the protein
• bond energy• bond angle energy• dihedral angle energy• van der Waals energy• electrostatic energy m. m.
• Minimize the function and obtain the structure.• Not practical yet
• Algorithm: simulated annealing• Computationally very expensive (IBM: Blue gene)• Accuracy is still poor
• Usually used to refine models suggested by other algorithms
Part of the problem
• Free energy minimization: Correctly folded proteins have only marginally less free energy than misfolded proteins

Some interesting facts about protein modeling
• based on primary sequence only
• accuracy 64% -75%
• higher accuracy for -helices than strands
• accuracy is dependent on protein family
• predictions of engineered proteins are less accurate
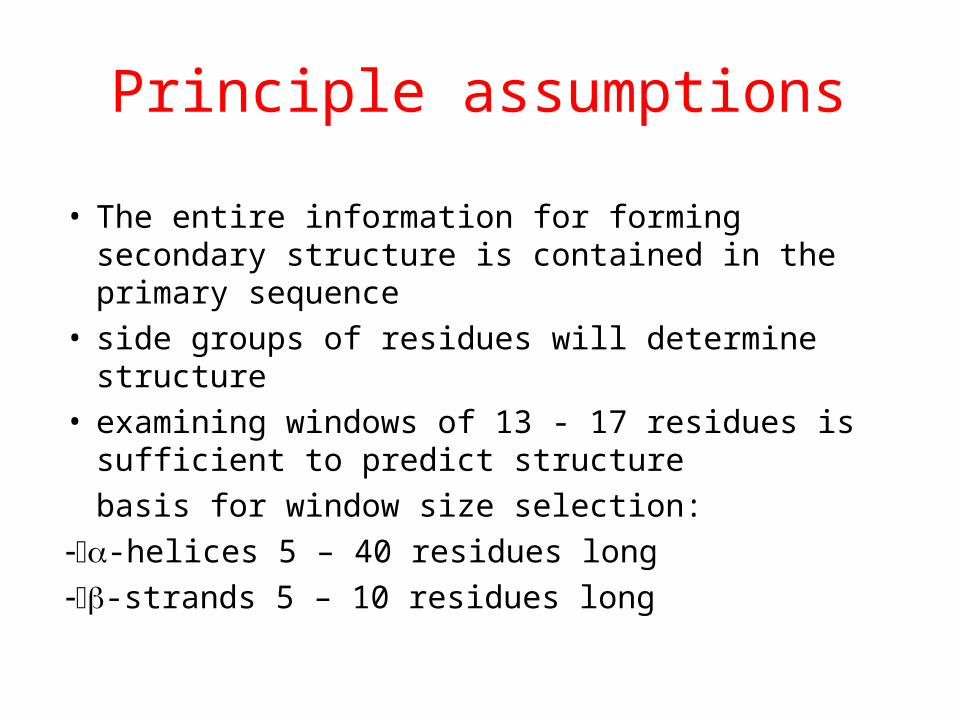
Principle assumptions
• The entire information for forming secondary structure is contained in the primary sequence
• side groups of residues will determine structure• examining windows of 13 - 17 residues is
sufficient to predict structure
basis for window size selection:
-helices 5 – 40 residues long
-strands 5 – 10 residues long
Simplifications
• Identification of secondary structures focused on
-helices
• -strands
• turns
• others (loops, coils, other helices) are collectively called “coils”
A surprising result !
• Can secondary structure prediction algorithms predict structures of engineered proteins?
• Test case “the chameleon” sequence
• Algorithm: PHDsec with alignment (PHD 30) and without alignment (PHD no)
Prediction Methods
I. Chou-Fasman / GOR method
II.Neural network models

I a. Chou-Fasman Method
• developed by Chou & Fasman in 1974 & 1978
• based on frequencies of residues in -helices (H), -sheets (E) and turns
• Accuracy ~50 - 60% Q3

Chou-Fasman Pij-valuesName P(H) P(E) P(turn) f(i) f(i+1) f(i+2) f(i+3)
Alanine 142 83 66 0.06 0.076 0.035 0.058
Arginine 98 93 95 0.07 0.106 0.099 0.085
Aspartic Acid 101 54 146 0.147 0.11 0.179 0.081
Asparagine 67 89 156 0.161 0.083 0.191 0.091
Cysteine 70 119 119 0.149 0.05 0.117 0.128
Glutamic Acid 151 37 74 0.056 0.06 0.077 0.064
Glutamine 111 110 98 0.074 0.098 0.037 0.098
Glycine 57 75 156 0.102 0.085 0.19 0.152
Histidine 100 87 95 0.14 0.047 0.093 0.054
Isoleucine 108 160 47 0.043 0.034 0.013 0.056
Leucine 121 130 59 0.061 0.025 0.036 0.07
Lysine 114 74 101 0.055 0.115 0.072 0.095
Methionine 145 105 60 0.068 0.082 0.014 0.055
Phenylalanine 113 138 60 0.059 0.041 0.065 0.065
Proline 57 55 152 0.102 0.301 0.034 0.068
Serine 77 75 143 0.12 0.139 0.125 0.106
Threonine 83 119 96 0.086 0.108 0.065 0.079
Tryptophan 108 137 96 0.077 0.013 0.064 0.167
Tyrosine 69 147 114 0.082 0.065 0.114 0.125
Valine 106 170 50 0.062 0.048 0.028 0.053
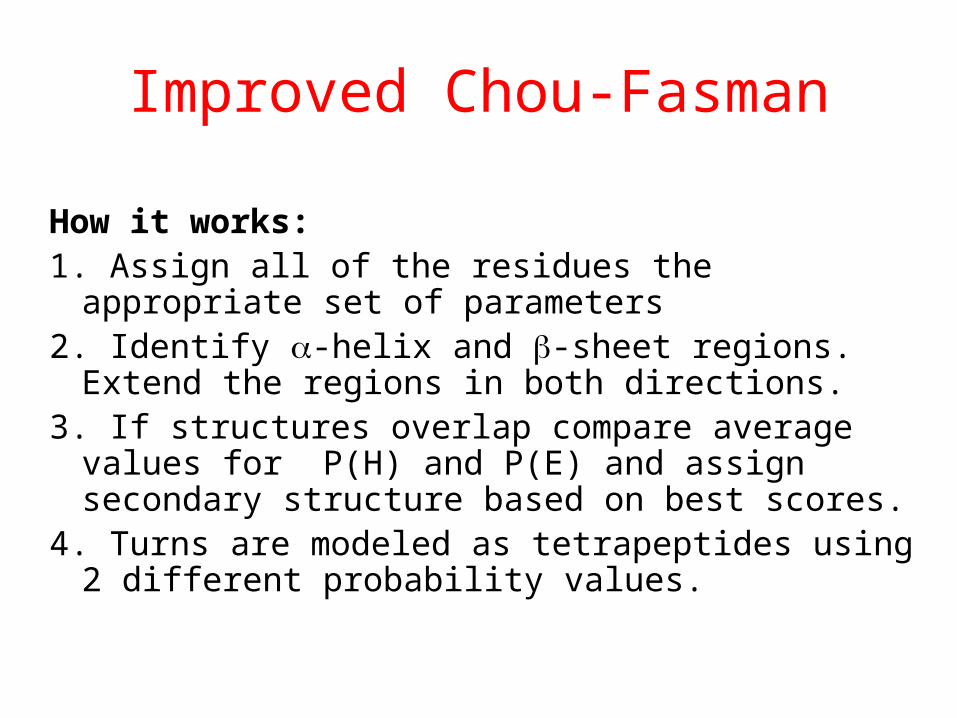
Improved Chou-Fasman
How it works:1. Assign all of the residues the appropriate set of
parameters2. Identify -helix and -sheet regions. Extend the
regions in both directions.3. If structures overlap compare average values for
P(H) and P(E) and assign secondary structure based on best scores.
4. Turns are modeled as tetrapeptides using 2 different probability values.

Assign Pij values
1. Assign all of the residues the appropriate set of parameters
T S P T A E L M R S T GP(H) 69 77 57 69 142 151 121 145 98 77 69 57P(E) 147 75 55 147 83 37 130 105 93 75 147 75
P(turn) 114 143 152 114 66 74 59 60 95 143 114 156
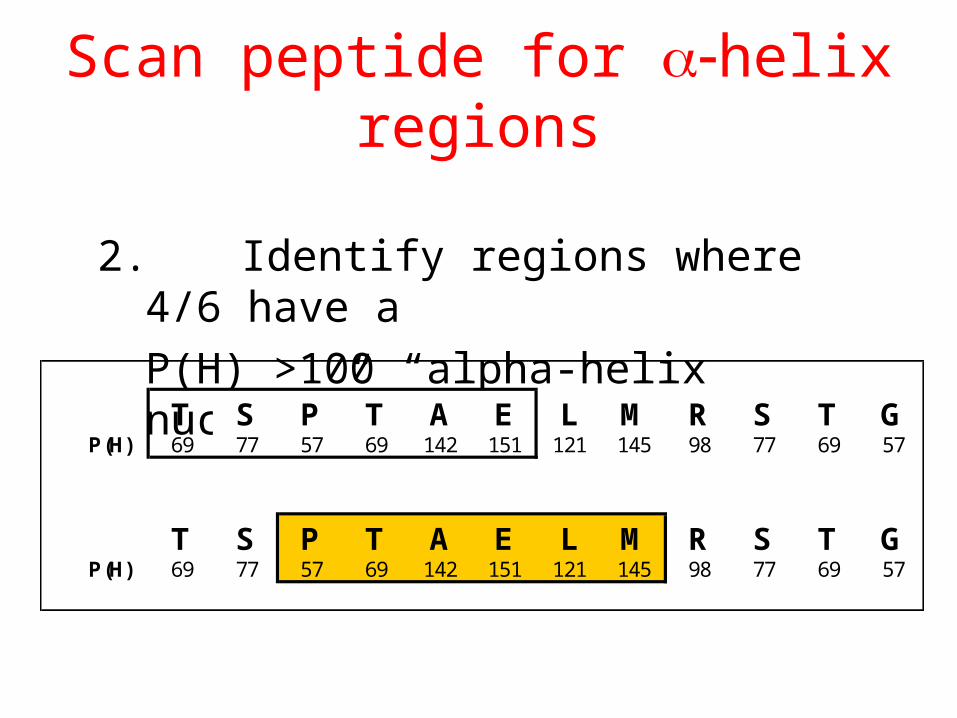
Scan peptide for helix regions
2. Identify regions where 4/6 have a
P(H) >100 “alpha-helix nucleus”
T S P T A E L M R S T GP(H) 69 77 57 69 142 151 121 145 98 77 69 57
T S P T A E L M R S T GP(H) 69 77 57 69 142 151 121 145 98 77 69 57
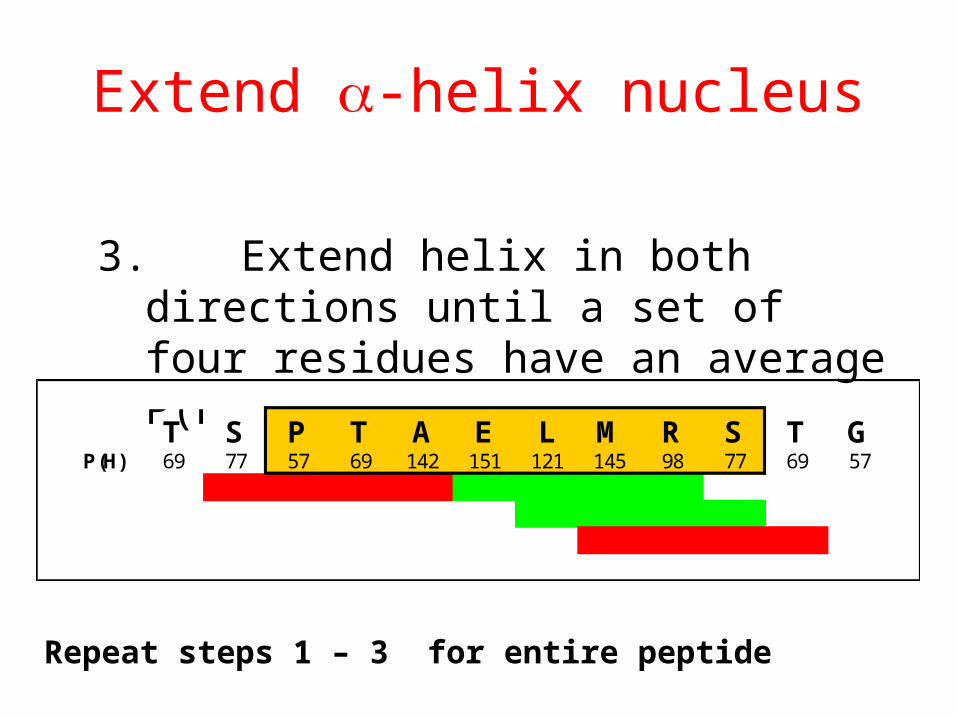
Extend -helix nucleus
3. Extend helix in both directions until a set of four residues have an average P(H) <100.
T S P T A E L M R S T GP(H) 69 77 57 69 142 151 121 145 98 77 69 57
Repeat steps 1 – 3 for entire peptide

Scan peptide for -sheet regions
4. Identify regions where 3/5 have a
P(E) >100 “-sheet nucleus”
5. Extend -sheet until 4 continuous residues an have an average P(E) < 100
6. If region average > 105 and the average P(E) > average P(H) then “-sheet”
T S P T A E L M R S T GP(H) 69 77 57 69 142 151 121 145 98 77 69 57P(E) 147 75 55 147 83 37 130 105 93 75 147 75

Actual Results
CHOFAS predicts protein secondary structure version 2.0u61 September 1998 Please cite: Chou and Fasman (1974) Biochem., 13:222-245 Chou-Fasman plot of @, 12 aa; SEQ1 sequence.
TSPTAELMRSTG helix HH sheet EEEEEEE turns T
Residue totals: H: 2 E: 7 T: 1 percent: H: 16.7 E: 58.3 T: 8.3
SOURCE: http://fasta.bioch.virginia.edu/o_fasta/cgi/garnier.cgi

I b. The GOR method
• developed by Garnier, Osguthorpe& Robson
• build on Chou-Fasman Pij values• evaluate each residue PLUS adjacent 8 N-
terminal and 8 carboxyl-terminal residues • sliding window of 17• underpredicts -strand regions• GOR III method accuracy ~64% Q3 (Chou-
Fasman: 50 – 60%)
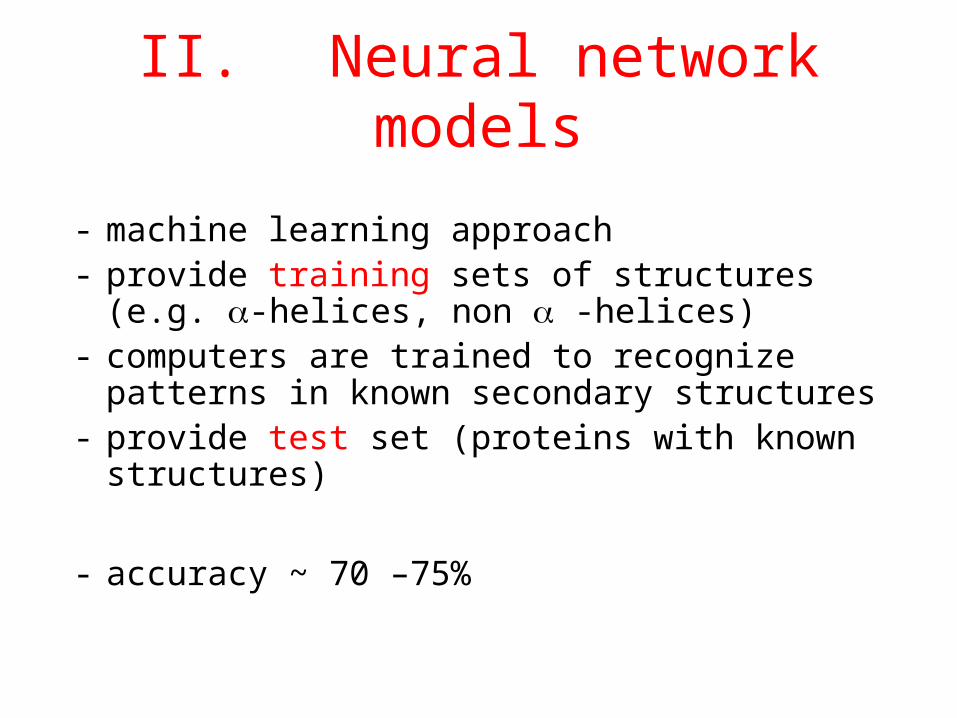
II. Neural network models
- machine learning approach - provide training sets of structures (e.g. -
helices, non -helices)- computers are trained to recognize patterns in
known secondary structures- provide test set (proteins with known structures)
- accuracy ~ 70 –75%
Reasons for improved accuracy
• Align sequence with other related proteins of the same protein family
• Find members that has a known structure
• If significant matches between structure and sequence assign secondary structures to corresponding residues
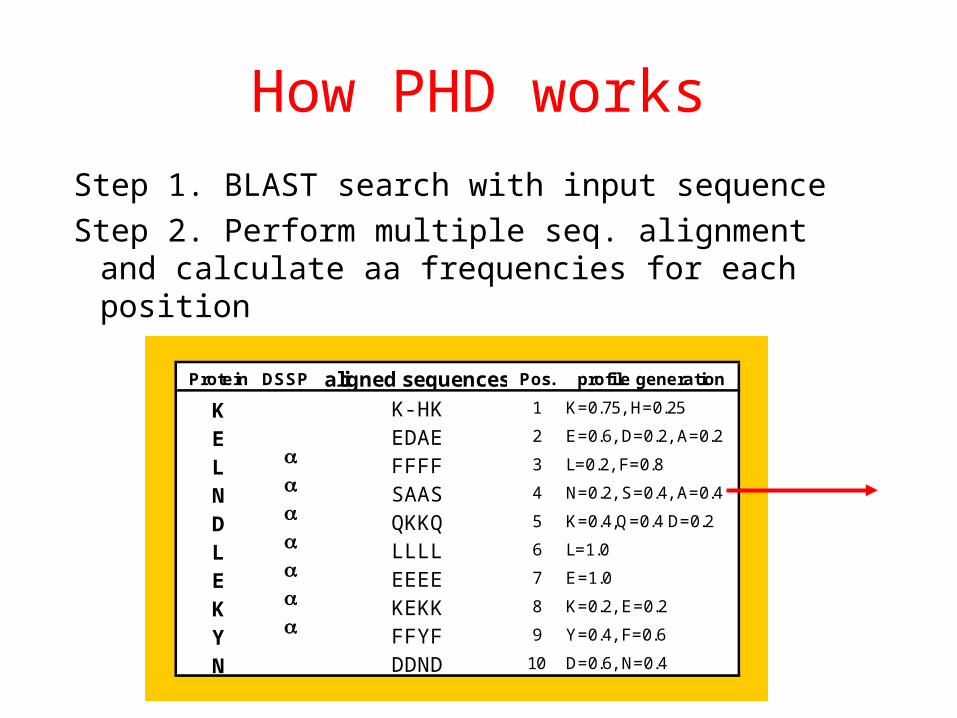
How PHD works
Step 1. BLAST search with input sequence
Step 2. Perform multiple seq. alignment and calculate aa frequencies for each position
Protein DSSP aligned sequences Pos. profile generation
K K-HK 1 K=0.75, H=0.25
E EDAE 2 E=0.6, D=0.2, A=0.2
L FFFF 3 L=0.2, F=0.8
N SAAS 4 N=0.2, S=0.4, A=0.4
D QKKQ 5 K=0.4,Q=0.4 D=0.2
L LLLL 6 L=1.0
E EEEE 7 E=1.0
K KEKK 8 K=0.2, E=0.2
Y FFYF 9 Y=0.4, F=0.6
N DDND 10 D=0.6, N=0.4

How PHD worksStep 3. First Level: “Sequence to structure net”
Input: alignment profile, Output: units for H, E, LSimilar to GOR method (window size =13). Calculate “occurrences” of any of the residues to be present in either an -helix, -strand, or loop.
1234567
H = 0.05E = 0.18L= 0.67
N=0.2, S=0.4, A=0.4
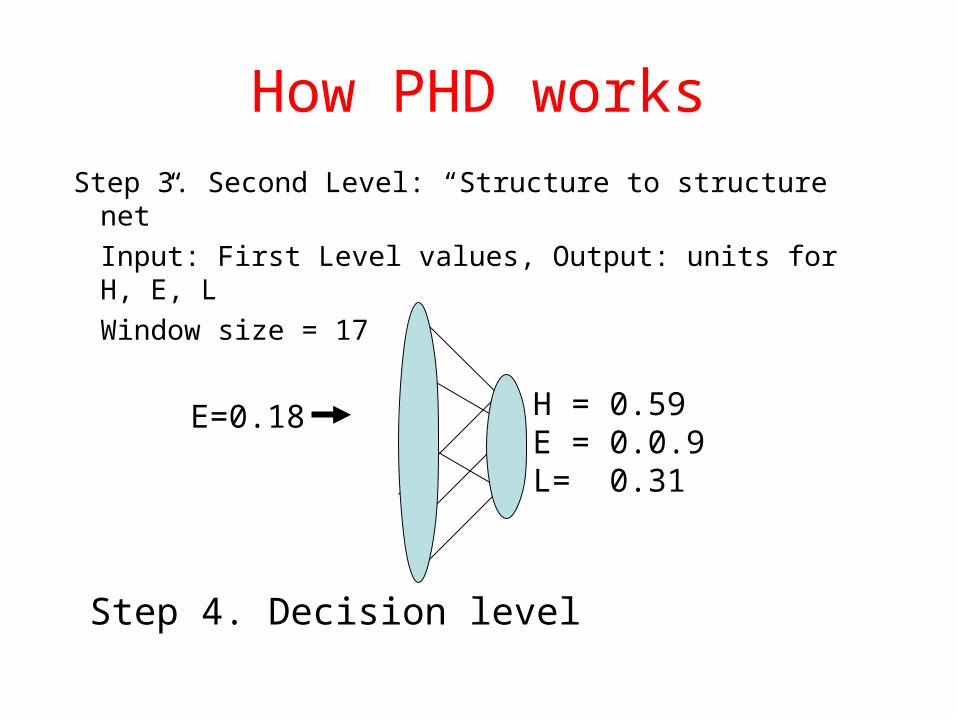
How PHD works
Step 3. Second Level: “Structure to structure net”
Input: First Level values, Output: units for H, E, L
Window size = 17
H = 0.59E = 0.0.9L= 0.31
E=0.18
Step 4. Decision level
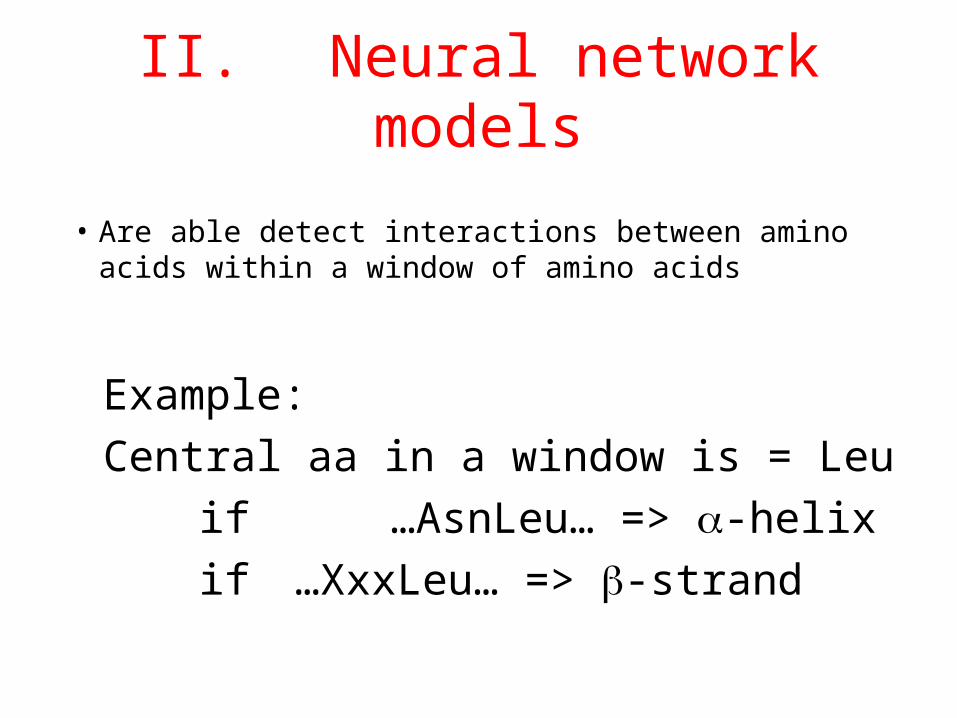
II. Neural network models
• Are able detect interactions between amino acids within a window of amino acids
Example:
Central aa in a window is = Leu
if …AsnLeu… => -helix
if …XxxLeu… => -strand

II. Prediction tools that use NNs
MACMATCH - (Presnell et al., 1993)- for MacIntosh
PHD - (Rost & Sander, 1993)www.embl-heidelberg.de/predictprotein/
predictprotein.html
NNPREDICT- (Kneller et al. 1990)http://www.cmpharm.ucsf.edu/nomi/nnpredict.html

Prediction Accuracy
Authors Year % acurracy MethodChou-Fasman 1974 50% propensities of aa's in 2nd structures Garnier 1978 62% interactions between aa'sLevin 1993 69% multiple seq. alignments (MSA)Rost & Sander 1994 72% neural networks + MSA
Guiness Book Of Records
PHDsec 79% accuracy for 31% of the data
Measuring prediction accuracy
• traditional Qindex and Q3
• Correlation coefficient– Mathews 1975

Qindex
Qindex: (Qhelix, Qstrand, Qcoil, Q3) - percentage of residues correctly predicted as -
helix, -strand, coil or for all 3 conformations.
Draw back:- even a random assignment of structure can
achieve a high score (Holley & Karpus 1991)
1003 observed
predicted
N
NQ
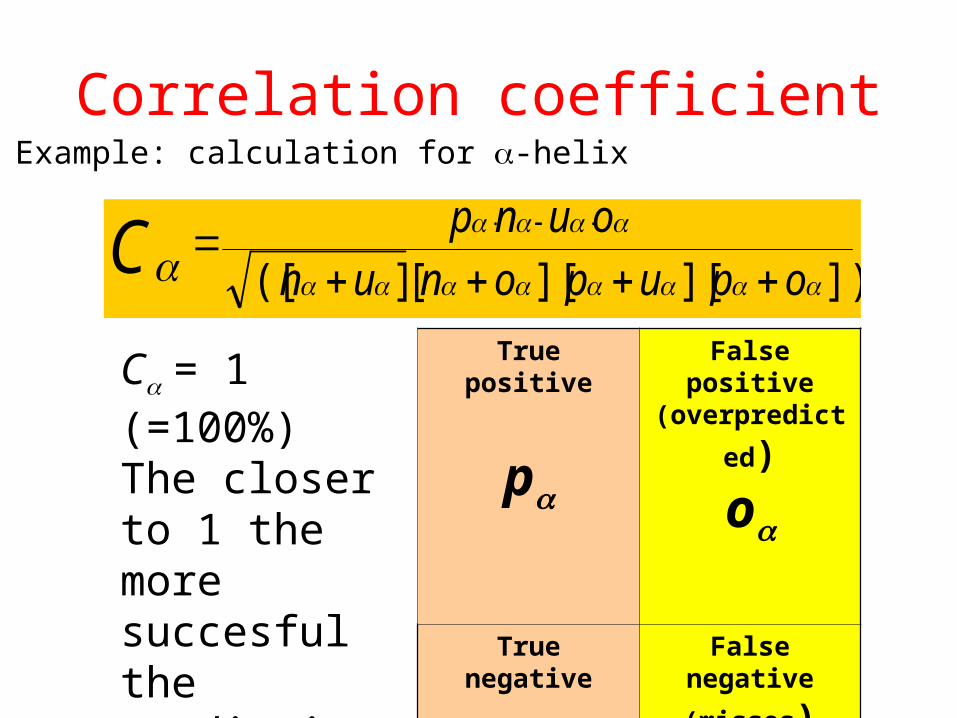
Correlation coefficient
True positive
p
False positive
(overpredicted)
o
True negative
n
False negative
(misses)
u
])][][[]([
opuponun
ounpC
C= 1 (=100%)The closer to 1 the more succesful the prediction
Example: calculation for -helix


