Proteomic analysis of rat cartilage: the identification of differentially expressed proteins in the early stages of osteoarthritis Parra-Torres et al. Parra-Torres et al. Proteome Science 2014, 12:55 http://www.proteomesci.com/content/12/1/55
Transcript
Proteomic analysis of rat cartilage: the identificationof differentially expressed proteins in the earlystages of osteoarthritisParra-Torres et al.
Parra-Torres et al. Proteome Science 2014, 12:55http://www.proteomesci.com/content/12/1/55
Parra-Torres et al. Proteome Science 2014, 12:55http://www.proteomesci.com/content/12/1/55
RESEARCH ARTICLE Open Access
Proteomic analysis of rat cartilage: the identificationof differentially expressed proteins in the earlystages of osteoarthritisNancy Marbella Parra-Torres, Febe Elena Cázares-Raga*† and Juan Bautista Kouri*†
Abstract
Background: Osteoarthritis (OA) is a chronic degenerative disease of the articular cartilage, and its diagnosis isbased on symptoms and radiological signs that are only present in the late stages of the disease. Due to the limitationsin diagnosing OA before the onset of symptoms, such as pain, little is known about the molecular mechanisms involvedin the pathogenesis of OA. Experimental OA models are often used to study the kinetics of the progression of thisdisease. In this report, we conducted a proteomic study of osteoarthritic cartilage during the early stages of OA using anexperimental rat model.
Results: Ten proteins that are differentially expressed under early OA conditions were identified by 2-DE andMALDI-TOF/MS. These proteins mediated many processes, such as glycolysis and energy production (Nme2 and Pnp),cartilage matrix (Col2a1), transcription and protein synthesis (Eef1a1 and DJ-1), signal transduction (CaM and Pebp1),transport (Alb and Hba1), and latexin (Lxn). In addition, changes in Lxn expression in early OA were observed andvalidated by western blot and immunofluorescence analysis.
Conclusions: The proteins that we identified indicate that energy metabolism, cartilage matrix remodelling, andprotective cellular mechanisms are associated with early OA. In addition, latexin expression during the early stages of OAcould be implicated in cartilage repair.
Keywords: Osteoarthritis, Cartilage, Proteomics
BackgroundOsteoarthritis (OA) is a chronic degenerative joint diseasethat is characterized by extracellular matrix (ECM) degrad-ation and cell death, resulting in the gradual loss of articularcartilage integrity [1-7]. In particular, certain ECM compo-nents, such as collagen (types II, VI, and X), proteoglycans(aggrecan, decorin, and lumican), and non-collagenous pro-teins (annexin and fibronectin) are degraded during OApathogenesis, generating fragments that negatively regulatemetabolic processes in chondrocytes [8]. The failure ofchondrocytes to maintain a proper balance between thesynthesis and degradation of the ECM has been sug-gested to result in cartilage degeneration during OApathogenesis [5,9-11].
* Correspondence: [email protected]; [email protected]†Equal contributorsDepartamento de Infectómica y Patogénesis Molecular, Centro deInvestigación y de Estudios Avanzados, Instituto Politécnico Nacional(CINVESTAV-IPN), México, DF, México
However, little is known about the molecular mecha-nisms involved in the early stages of OA due to the limi-tations in detecting the early symptoms of the diseasebefore the onset of pain, which only manifests duringthe late stages. The use of proteomic technologies thenallows the identification of novel biomarkers in tissuesand cells as indicators of normal and pathological pro-cesses, such as OA [12-16]. Furthermore, these ap-proaches are being applied to study the molecular basisof OA etiology and the mechanisms that mediate cartil-age regeneration and joint destruction in the later stagesof OA [16].Previous works used two-dimensional electrophoresis
(2-DE) to identify certain proteins, such as the precursorof collagens I and VI, annexin A1 (ANNX 1), andphosphatidylethanolamine-binding protein 1 (Pebp1),which were differentially expressed in chondrocytes fromhealthy and osteoarthritic human cartilage [16]. How-ever, these changes were observed only for proteins in
ntral Ltd. This is an Open Access article distributed under the terms of the/creativecommons.org/licenses/by/4.0), which permits unrestricted use,, provided the original work is properly credited. The Creative Commons Publicmons.org/publicdomain/zero/1.0/) applies to the data made available in this
Parra-Torres et al. Proteome Science 2014, 12:55 Page 2 of 11http://www.proteomesci.com/content/12/1/55
the advanced stages of OA, which precludes the earlydiagnosis of disease [16,17]. Thus, experimental OAmodels are often used to study the kinetics of the pro-cesses that mediate the development of OA [7].Initially, our group generated a proteomic map of nor-
mal rat articular cartilage, in which the expression oflatexin (Lxn), a carboxypeptidase A inhibitor, was identi-fied for the first time [18]. In this work, we performed aproteomic study of osteoarthritic cartilage during theearly stages of an experimental OA rat model [7]. Tenproteins were differentially expressed over time andidentified by MALDI-TOF/MS. Notably, Lxn was one ofthe proteins that was modified early as detected in theOA cartilage of rats.
Results and discussionOur previous reports examined the histological and mo-lecular changes of cartilage during OA pathogenesis inan experimental animal model of OA, and showed thatour model can be evaluated according to Mankin’s histo-logical grade parameters [2,5,7,19]. Twenty days afterinduction, our rat OA animal model reproduces thechanges that occur in human cartilage in the late stagesof OA [20]; which including fibrillation the loss of tissuecartilage mineralization and the formation of clusters[5,7,21-25]. However, using our animal model also allowsOA kinetic changes to be followed starting in the earlystages of OA; including the initial fibrillation of thecartilage surface area and superficial zone surroundingchondrocytes and the initial formation of cell clusters.
Figure 1 Macroscopic changes in the articular cartilage of rat during thinduced OA as viewed with a stereomicroscope. (A-C) Femoral condyles from
These changes were observed after 5 days of OA induc-tion [7,19,25]. Therefore and because these changes arecharacteristic of early OA, we studied the changes inthe protein profile at 3, 5, and 10 days after the induc-tion of OA.
Identification of early macroscopic changes in articularcartilage of normal, sham, and OA-induced ratsThe sham surgical procedure did not significantly changethe cartilage (Figure 1A-C): the tissues were smooth with ashiny pink surface (Figure 1D-F). In contrast, the cartilagefrom OA-induced animals underwent evident changesstarting 3 days after OA induction, showing an opaque ap-pearance, rough surface, and a white colour in the affectedarea, and these changes were more pronounced during OApathogenesis (right condyle) (Figure 1G-I). These resultsdemonstrate that a partial menisectomy and high-impactexercise cause damage the articular cartilage morphology,which causes joint deformity and induces OA.
Differential protein expression between normal and OAcartilage during early stages in a rat modelThe cartilage proteins were purified from the joints of ratsduring the early experimental OA stage (normal, and OAat 3, 5, and 10 days) and resolved by 2-DE; 280 ± 17 spotswere detected in the gels for each condition, and four spotswith equivalent expression in all samples were selected asinternal controls. The spots were consistent between dupli-cates for each condition, indicating reproducibility. In OA-induced cartilage, we observed 10 spots in the early OA
e early stages of OA. Femoral condyles from normal, sham, and earlynormal, (D-F) sham, and (G-I) OA-induced (OA 3, 5, and 10 days) rats.
Parra-Torres et al. Proteome Science 2014, 12:55 Page 3 of 11http://www.proteomesci.com/content/12/1/55
stages with differential expression versus the normal levels(Figure 2). Moreover, we observed patent differences in thespot volumes between 3, 5, and 10 days after OA induction(Figure 3).The expressions of spot 1 (S1) and S2 increased and
peaked after at 3 days of OA induction compared withthe normal samples. In addition, S3, S7, and S8 were sig-nificantly up-regulated after 5 days, whereas S4, S5, S9,and S10 peaked at 10 days (Figure 3). The differences inthe spot intensity were quantified using the relative volumepercentage (vol%) and compared with the control values.The images of the silver-stained gels were analysed usingImageMaster 2D Platinum, version 7.0 (Tukey-Kramertest, Table 1).
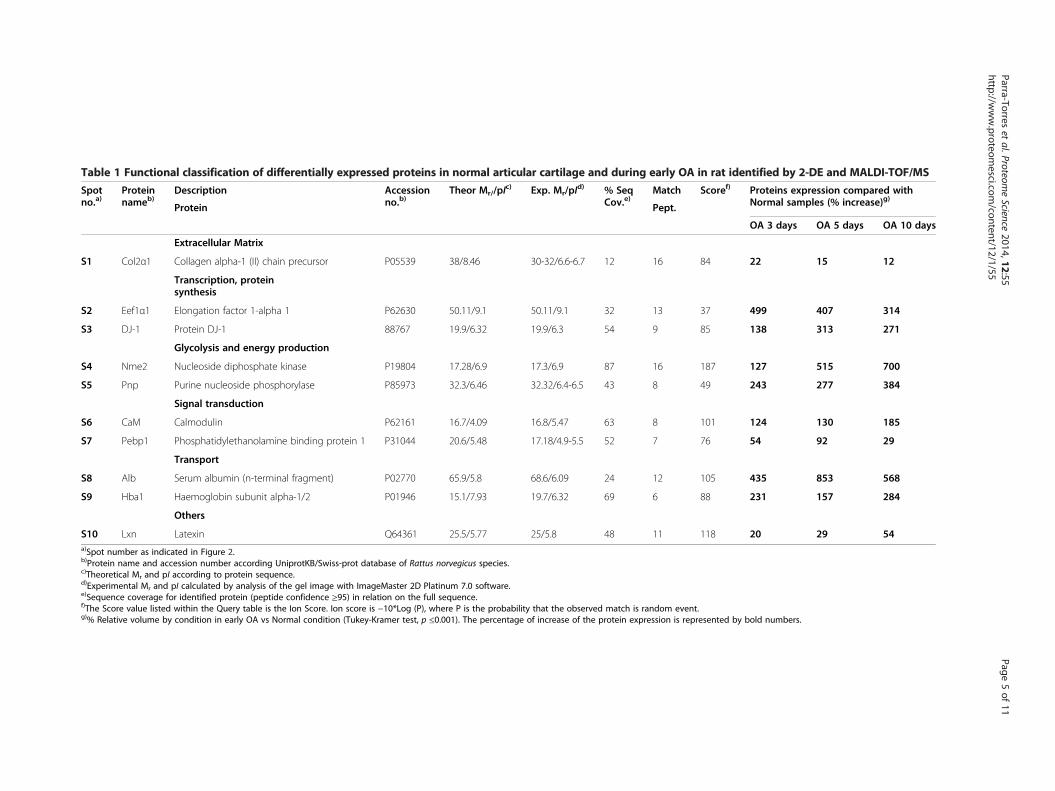
Identification and functional classification of differentiallyexpressed proteinsThe 10 differentially expressed proteins were excised,digested, and identified by MALDI-TOF/MS. Table 1shows the changes in the expression of these proteins on a2-DE reference map (Additional file 1: Figure S1). Basedon their known functions, these proteins were classifiedinto 7 groups: glycolysis and energy production (Nme2and Pnp), cartilage matrix (Col2a1), transcription and pro-tein synthesis (DJ-1 and Eef1a1), signal transduction (CaMand Pebp1), transport (Alb and Hba1), and latexin.
Figure 2 Representative 2-DE proteomic profiles of normal and OA cawere resolved on IPG strips at pH 3–10 NL using an SDS-PAGE gradient (5-(B) OA 3 days. (C) OA 5 days. (D) OA 10 days. The selected spots are numb
Two proteins mediated metabolism and energy pro-duction (Pnp and Nme2) [26,27]. Pnp has been impli-cated in purine metabolism, and its expression is linkedto the accumulation of toxic levels of deoxyguanosinetriphosphate (dGTP) which induces apoptosis in T lym-phocytes [28]. Nme2 catalyses the transfer of terminalphosphate groups of nucleoside 5′-triphosphate to nu-cleoside 5′-diphosphate, which mediates the biosynthesisof ribo- and deoxyribonucleoside triphosphates, exceptATP [27]; it also regulates a wide range of cellular func-tions, including proliferation, differentiation, and neoplas-tic transformation [29]. The increase in both proteinsduring early OA could implicate them in metabolic andpurine salvage pathways as a consequence of the increasein catabolism during OA pathogenesis.Type II collagen is the principal component of articular
cartilage and comprises its basic architecture, and it is thechief constituent of collagens [30,31]. However, in the latestages of OA, type II collagen is substituted by other colla-gens, such as types I and X, due to the catabolic activity ofchondrocytes [16,32]. Our results showed that the type IIcollagen levels increased 3 and 5 days after OA induction,which might be related to a reparative cartilage phase.This positive regulation during OA might be a self-protective response of chondrocytes to changes in thepericellular environment that wane during at later stages[11,16,28,31,32].
rtilage during the early stages (3, 5, and 10 days). The proteins20%). The gels were silver-stained. (A) Profiles from normal conditions.ered and marked with red circles.
Figure 3 Differentially expressed proteins during early OA by 2-DE and MALDI-TOF/MS. Ten proteins were differentially expressed duringthe early stages of OA (3, 5, and 10 days), compared with normal levels (see Table 1).
Parra-Torres et al. Proteome Science 2014, 12:55 Page 4 of 11http://www.proteomesci.com/content/12/1/55
Other proteins that regulate the synthesis of proteinsinvolved in ECM remodelling via MMP-1, MMP-3, andMMP-13 activation [33], such as Pebp1 and CaM, arealso up regulated during the early stages of OA. Pebp1 isa Raf kinase inhibitor that has been identified in theproteome of normal human articular cartilage, whereasit has shown decreased expression in the late stages ofOA [8,16,18]. Our results suggested that Pebp1 partici-pates in ECM remodelling during early OA, possibly viathe regulation of downstream signalling pathways.CaM regulates signal transduction, forming calcium-
calmodulin complex- dependent protein kinase II (CaMKII)
[34]. In addition, the CaMKII complex has been implicatedas a signalling receptor for acid-N-methyl-D-aspartate(NMDA) and is activated as part of the mechanotransduc-tion response of normal human articular chondrocytes tomechanical stimulation. However, this route is not activatedafter stimulation in OA chondrocytes [35]. Thus, the dys-regulation of CaMKII signaling has been suggested to besignificant for the onset and progression of OA.In addition, DJ-1 and Eef1α1 were identified as proteins
that mediate the transcription and synthesis of othersproteins. DJ-1 has several functions, such as protectionagainst oxidative stress and cell death [36]. Furthermore,
Table 1 Functional classification of differentially expressed proteins in normal articular cartilage and during early OA in rat identified by 2-DE and MALDI-TOF/MS
Spotno.a)
Proteinnameb)
Description Accessionno.b)
Theor Mr//pIc) Exp. Mr/pI
d) % SeqCov.e)
Match Scoref) Proteins expression compared withNormal samples (% increase)g)Protein Pept.
S10 Lxn Latexin Q64361 25.5/5.77 25/5.8 48 11 118 20 29 54a)Spot number as indicated in Figure 2.b)Protein name and accession number according UniprotKB/Swiss-prot database of Rattus norvegicus species.c)Theoretical Mr and pI according to protein sequence.d)Experimental Mr and pI calculated by analysis of the gel image with ImageMaster 2D Platinum 7.0 software.e)Sequence coverage for identified protein (peptide confidence ≥95) in relation on the full sequence.f)The Score value listed within the Query table is the Ion Score. Ion score is −10*Log (P), where P is the probability that the observed match is random event.g)% Relative volume by condition in early OA vs Normal condition (Tukey-Kramer test, p ≤0.001). The percentage of increase of the protein expression is represented by bold numbers.
Parra-Torreset
al.ProteomeScience
2014,12:55Page
5of
11http://w
ww.proteom
esci.com/content/12/1/55
Figure 4 (See legend on next page.)
Parra-Torres et al. Proteome Science 2014, 12:55 Page 6 of 11http://www.proteomesci.com/content/12/1/55
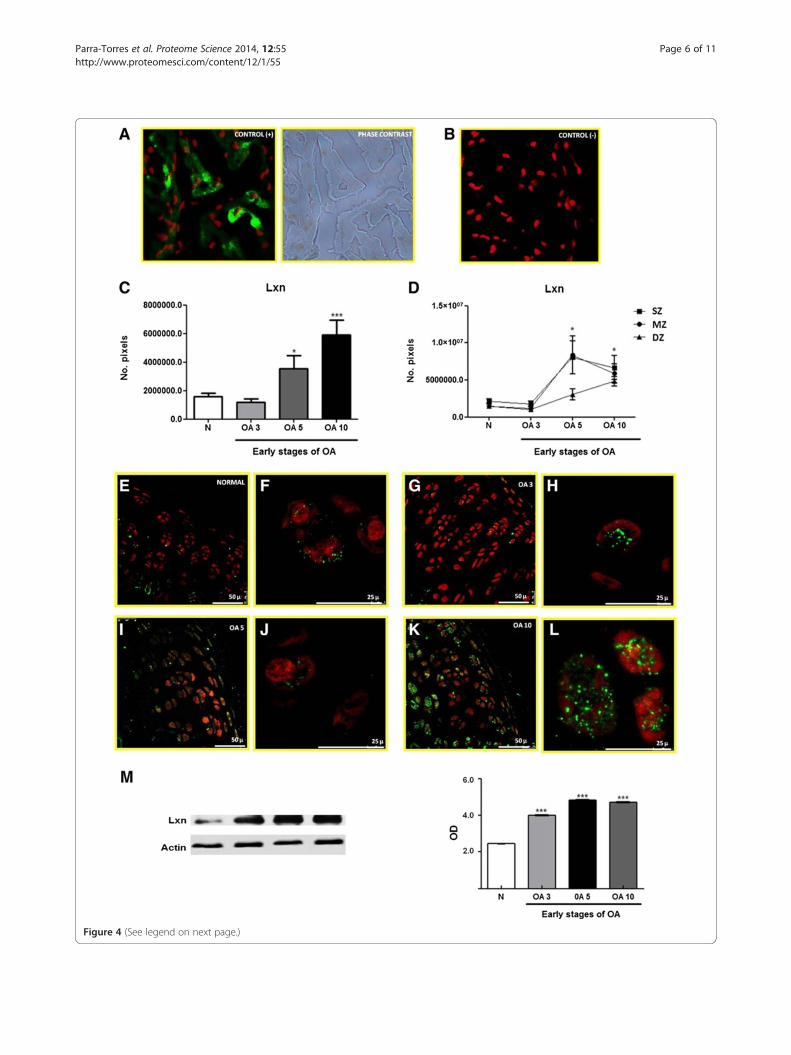
(See figure on previous page.)Figure 4 Expression and localization of Lxn in normal articular cartilage during the early stages of OA in a rat model. (A) Positivecontrol and phase contrast microscopy for Lxn expression in rat heart tissue. (B) Negative control for Lxn expression in rat heart tissue. (C) Number ofpixels, expressed as area of Lxn in the total cartilage. (D) Expression of Lxn in the 3 zones (SZ, MZ, and DZ) in normal and osteoarthritic cartilage.(E, G, I, and K) Lxn expression in normal articular cartilage and OA at 3, 5, and 10 days (F, H, J, and L), perinuclear and cytoplasmic localization of Lxnin normal articular cartilage and OA at 3, 5, and 10 days (amplification of panel E, G, I, and K). (M) Representative western blot of Lxn expression innormal and OA cartilage during early stages (3, 5, and 10 days). The densitometry graph shows the protein levels of Lxn measured by optical density(OD) normalized to β-actin. The results show the means ± S.E.M. of 3 independent experiments using a Tukey-Kramer multiple comparison test.Significant differences are represented by asterisks (*p < 0.05, **p < 0.01, ***p < 0.001).
Parra-Torres et al. Proteome Science 2014, 12:55 Page 7 of 11http://www.proteomesci.com/content/12/1/55
it regulates transcription as a co-activator [37,38]. Thechondrocyte apoptosis induced by reactive oxygen species(ROS) has been considered important in OA pathogenesis[39,40]. Our results have demonstrated that DJ-1 is up-regulated in the early stages of OA, which suggested itsinvolvement in the regeneration of cartilage due to theprevention chondrocyte death via the removal of ROS.Eef1α1 is involved in translation [41] and also increases inexpression, indicating that chondrocytes up-regulatetranslation machinery during early OA to synthesizeproteins and repair damaged cartilage [5,10].Hba1 and Alb, which mediate oxygen transport and
osmotic pressure, have been previously detected in car-tilage. Both proteins were up-regulated but their func-tions in OA cartilage remain unknown [8,18].Latexin (Lxn), a carboxypeptidase A inhibitor, was up-
regulated during early OA. The expression of this pro-tein has previously been reported in rat cartilage [18],thus, we focused on latexin analysis.
Differential expression of Lxn in early OA-induced cartilagein ratsA previous study reported Lxn expression in the articu-lar cartilage [18] of rats. Lxn mediates the developmentof skeletogenesis and the growth plate [42]. The increasein the rise Lxn levels during early OA found by theproteomic analysis suggests that it mediates OA patho-genesis. Thus, we examined Lxn with a proteomic ana-lysis to validate these results during early OA. Weutilized immunofluorescence and WB to analyse its ex-pression and localization in articular cartilage. Becausewe have previously observed that the normal and shamcontrols are similar [19,22] we only used the normalcontrol for the validation experiments. Figure 4 shows thepositive and negative controls for Lxn in rat heart tissue(A and B). In addition, Figure 4A includes phase contrastmicroscopy to show the Lxn localization in the tissue.In normal rat articular cartilage, Lxn is primarily
expressed in the chondrocytes of 3 cartilage zones—thesurface zone (SZ), middle zone (MZ), and deep zone(DZ)—at all time points (Figure 4E, G, I, and K). TheLxn levels were higher in osteoarthritic cartilage 5 and10 days after OA was induced (Figure 4C and D). Thedistribution of Lxn, was granular in the cytoplasm of
most chondrocytes and arranged in the perinuclear MZand DZ in some chondrocytes (Figure 4F, H, J, and L).The expression of Lxn was also analysed by WB under
normal conditions and during early OA. As shown inFigure 4M, the expression of Lxn was up regulated after3 days and maximized 10 days after OA induction com-pared to normal cartilage. These data corroborated our2-DE findings, which validated the use of these tools toexamine the differential expression of proteins duringearly OA.The expression of Lxn was also analysed by WB under
normal conditions and during early OA. As shown inFigure 4M, Lxn was up-regulated 149% from the normalcartilage level after 3 days, and this increase reached215% and 207% after 5 and 10 days, respectively. Thesedata corroborated our 2-DE findings, which validatedthe use of these tools to examine the differential expres-sion of proteins during early OA; when Lxn was up-regulated 20% after 3 days, 29% after 5 days, and 54%after 10 days of OA induction. The increases observedby WB were more pronounced that those observed by2-DE, likely due to antibody specificity.The expression of Latexin (Lxn), an inhibitor of car-
boxipeptidase A, was increased during the early stagesof OA, which suggested that it acted as a regulator ofcarboxypeptidase activity. This effect may have reducedthe ability of these enzymes to bind to substrates, whichinhibited degradation. This protective mechanism of thechondrocytes might prevent mechanical damage to car-tilage which is involved in the development of OA. Lxnmight also participate in other cartilage repair processes,such as the proliferation of chondrocytes and cartilageregeneration, in response to the damage that is incurredduring early OA [42,43]. Recently, Lxn was reported tobe localized in the nuclei and cytoplasm of proliferatingand prehypertrophic chondrocytes during skeletogenesisand skeletal regeneration [42]. Latexin was also identi-fied as negative regulator of stem cell replication and in-creased apoptosis [44]. Previous works have shown thatchondrocytes in the cartilage of older people remain in aresting phase of the cell cycle, which limits their poten-tial for growth. This arrest has also been associated withchanges in telomere length [45]. Thus, Lxn may governsenescence mechanisms in chondrocytes [1].
Parra-Torres et al. Proteome Science 2014, 12:55 Page 8 of 11http://www.proteomesci.com/content/12/1/55
ConclusionThe rat model of induced osteoarthritis has allowed usto demonstrate the differential expression of proteinsduring the early stages of OA with a proteomic analysis.The changes in the expression of some proteins duringthe early stages of OA suggested its participation in thereparative phase of the cartilage because most of theidentified proteins were involved in various reparativecell processes such as the remodelling of the ECM, en-ergy metabolism, and protective cellular mechanisms.In addition, this study examined the expression and im-
munolocalization of Lxn, which appeared to play a role inthe cartilage repair phase of early OA as an inhibitor ofdegradative enzymes. Although additional work is re-quired to understand the relationship between these pro-teins and early cartilage injury, our results have enabled usto identified novel proteins involved in the start of OApathogenesis, which could guide the discovery of bio-markers for this disease in humans.
Materials and methodsTissue samplingCartilage samples were obtained from the knees of 159normal male Wistar rats (130–150 g) and 1017 rats withOA that were induced by partial menisectomy of theright hind leg, followed by high-impact exercises 3, 5,and 10 days after OA induction (early OA). This proced-ure has been described elsewhere [2,5,7,19] and shownto reproduce the cartilage changes observed during thelate stages of human OA 20 days after OA induction inrats [20]. These changes include fibrillation, a loss of tis-sue, cartilage mineralization and the formation of clus-ters [5,7]. Cartilage samples were also obtained from 240sham rats (incision without menisectomy or exercises).All procedures involving animals were approved by ourinstitutional committee (CICUAL-Cinvestav-IPN) andperformed following the animal facility regulations andMexican official regulatory Guideline for the Care andUse of Laboratory Animals; NOM-069-ZOO-1999.
Protein extraction and preparationA pool of cartilage samples from the knees of 30 normalrats, 120 sham rats, and 120 rats with conditionally in-duced OA (3, 5, and 10 days after OA induction) were usedby independent experiment. The proteins were extractedbased on selective extraction as reported by Vincourt [13]with some modification [18]. Briefly, samples were frozenin liquid nitrogen, mechanically pulverized, suspended inextraction buffer [500 mM NaCl, 50 mM HEPES pH 7.2,complete protease inhibitor cocktail, (Roche AppliedScience) and homogenized. In addition, the sampleswere sonicated (POLYTRON® PT 2100) (10 strokes at15,000 × g) and then stored overnight at 4°C. The insol-uble material was then removed by centrifugation (6,000 ×
g, at 4°C for 7 min), the supernatant was recovered, andcetylpyridinium chloride (CPC) 1% (w/v) was added to re-move proteoglycans (PGs) followed by another centrifuga-tion (6,000 × g, at 4°C for 7 min) [46]. To remove thelipids and salts, the supernatant was precipitated withmethanol (400 μL methanol/100 μL sample) and centri-fuged (14,000 × g, for 30 min), and the liquid phase wasremoved. This procedure was repeated twice. The pelletwas resuspended in 2-DE sample buffer [7 M urea, 2 Mthiourea, 4% (w/v) CHAPS, 2% (v/v) immobilized pH gra-dient (IPG) buffer, pH 3–10 (GE Healthcare Life Sciences,Sweden) and 40 mM dithiothreitol (DTT)] and supple-mented with protease inhibitors [13,14]. In addition, the2D Clean-Up Kit (GE Healthcare) was used for selectiveprotein precipitation and cleaning. The precipitate was re-suspended in rehydration solution [7 M urea, 2 M thio-urea, 2% (w/v) CHAPS, 0.5% (v/v) IPG buffer, pH 3–10,and 154 mM DTT, and 0.001% bromophenol blue] sup-plemented with protease inhibitors. The protein concen-tration was measured with a Bradford assay [19]. Allexperiments were performed in independent duplicates.
Two-dimensional electrophoresis (2-DE)Protein extract (300 μg) resuspended in rehydrationsolution (250 μL) was used to rehydrate ImmobilineDryStrip gels (IPG strips) that were 13 cm in size (GE,Healthcare) at pH 3–10 NL for 12 h at room temperature.Electrofocusing was performed in an Ettan IPGphor 3(GE Healthcare, USA) per the manufacturer’s protocols.The disulphide bonds in proteins were reduced andalkylated using DTT and iodacetamide, respectively.The proteins were silver-stained immediately after tothe second-dimension run on an SDS-PAGE gradient(5–20%) [18]. These experiments were performed induplicate, and technical replicas (data not shown) wereonly implemented for controls.
Image acquisition and data analysisDigital images of 2-DE gels were obtained using anImageQuant LAS 4000 System (GE Healthcare) andanalysed using ImageMaster 2D Platinum, version 7.0(GE Healthcare Life Sciences, Switzerland) to measure theprotein expression levels. The spots were counted andcompared automatically with subsequent manual correc-tion. For the semiquantitative comparison, the optical dens-ities were automatically detected; the spots were selected,the confidence interval for the difference between twomeans was obtained (data not shown) and analysed with aTukey-Kramer multiple comparison test with at p ±0.001.
Spot excision and trypsin digestionThe spots were processed after excision. The sampleswere dehydrated by incubation in 100 μL acetonitrile for5 min at room temperature. The supernatant was then
Parra-Torres et al. Proteome Science 2014, 12:55 Page 9 of 11http://www.proteomesci.com/content/12/1/55
removed, and the gel fragments were allowed to dry.The peptides were digested as previously reported [47].Briefly, dry polyacrylamide pieces were prepared for in-gel digestion with 0.020 μg modified trypsin (sequen-cing-grade, Roche Molecular Biochemicals) overnight at37°C. The resulting peptides were extracted twice withACN/TFA solution [50% w/v acetonitrile (ACN)/% w/vtrifluoroacetic acid (TFA)], incubated for 10 min at roomtemperature and centrifuged at 14,000 × g for 30 sec. Thepeptide extracts were combined and reduced/desaltedusing C18-ZipTips (Millipore Corporation, Bedford, MA,USA).
Mass spectrometry by MALDIThe resulting peptide extracts were analysed byMALDI-TOF/MS with a Voyager DE Pro mass spec-trometer in the linear mode (Applied Biosystems) atthe Protein Core Facility, Columbia University MedicalCenter, New York, USA. To identify the proteins byPMF, the molecular mass of each tryptic fragment wassearched against the National Center for BiotechnologyRattus norvegicus database using the MASCOT program(http://www.matrixscience.com). A confidence interval≥99% was used to identify the proteins (Unused ProtScore> 2.0). The possible oxidation of methionine residues, andcarbamidomethylation at cysteine residues as variablemodifications were considered. A maximum of one missedtryptic cleavage per protein was allowed in the databasesearch. A mass accuracy of 100 ppm was used for MS. Forpositive identifications, a MASCOT score > 56 was con-sidered significant (p < 0.05).
Western blotThe cartilage samples of normal and OA-induced rats(3, 5, and 10 days) were frozen in liquid nitrogen, mech-anically pulverized, suspended in lysis buffer (25 mMTris–HCl, pH 7.6, 150 mM NaCl, 1% NP-40, 1% sodiumdeoxycholate, 0.1 % SDS) with complete protease inhibitorcocktail, and homogenized in a polytron tissue grinder(POLYTRON® PT 2100). The samples were shaken for 2 hat 4°C and clarified by centrifugation at 10,000 × g at 4°Cfor 5 min. The protein concentration was measured with aBradford assay. Subsequently, the obtained samples weredissolved in Laemmli buffer (which contained 1% SDSand β-mercaptoethanol) and boiled for 5 min. SDS-PAGEwas performed using 5–20% gradient gels of 7 cm and80 μg of protein per lane, after which the proteins weretransferred onto nitrocellulose membranes by wet transferat 350 mA for 2.5 h.The membranes were blocked with 5% non-fat dry
milk in Tris-buffered saline (TBS), pH 7.5, containing0.1% Tween 20 (TBS-T) for 2 h at 37°C with gentle shak-ing and incubated overnight at 4°C with rabbit polyclonalanti-Lxn (1:1000; sc-47089, Santa Cruz Biotechnology,
Santa Cruz, CA, USA). Peroxidase-conjugated goatanti-rabbit was used as the secondary antibody (1:40,000;Jackson Immunoresearch Laboratories Inc. West Grove,PA, USA) for 2 h at room temperature. These experimentswere performed in triplicate.
Immunonofluorescence (IF)To analyse the macroscopic characteristics of articularcartilage, femoral condyles were obtained from normaland OA-induced rats (3, 5, and 10 days) and observed undera stereomicroscope (E2 4D Leica, Heidelberg, Germany).The cartilage samples were then cryopreserved with10% PBS-sucrose for 24 h, cryosectioned (Leica CM1100; Heerbrugg, Switzerland), mounted on gelatine-coated slides, and stored at −20°C for 2 days. The sam-ples were hydrated in PBS, treated with 0.2% Tween 20in PBS for 10 min, and preincubated with 0.2% IgG-freebovine serum albumin (Sigma Chemical, Germany) for20 min at room temperature. The sections were incu-bated overnight at 4°C with anti-Lxn goat polyclonalantibody (1:70, sc-47089, Santa Cruz Biotechnology,Santa Cruz, CA, USA) followed by incubation withfluorescein isothiocyanate (FITC)-tagged anti-goat IgG(1:50 Zymed Laboratories, South San Francisco, CA) for1 h at room temperature. The nuclei were counterstainedwith propidium iodide for 1 min (1:3000; Vector Labora-tories, Burlingame, CA), and the samples were mountedwith Vectashield. As a negative control, the primary anti-body was omitted. Rat heart tissue was used as a positivecontrol. The sections were analysed with confocal micros-copy (TCP-SP2, Leica, Heidelberg, Germany). These ex-periments were performed in triplicate.
Statistical analysisA statistical analysis was performed using pools of 30 ratsby condition (normal, and 3, 5 and 10 days of OA induc-tion) for western blot in three independent assays. Theimmunoreactions were visualized by chemiluminescence(ECL Plus western blotting detection system, GE Health-care, Buckinghamshire, UK); the band intensities obtainedfrom the western blot assays were quantified by opticaldensitometry. The relative intensity was expressed in arbi-trary optical density units (OD). In all cases the statisticalanalysis was performed using a Tukey-Kramer multiplecomparison test. Three rats were used for each conditionfor IF. Three sections were obtained from each rat. Ineach rat, 3 sections and 3 fields were randomly selectedand analised; this procedure was performed in triplicate.The Leica LAS AF Lite confocal program was used toquantify the immunolabelling, wherein the fluorescenceintensities were measured in each zone based on the num-ber of pixels per area.
Parra-Torres et al. Proteome Science 2014, 12:55 Page 10 of 11http://www.proteomesci.com/content/12/1/55
Additional file
Additional file 1: Figure S1. Representative 2-DE proteomic maps ofidentified proteins in OA cartilage during early stages (3, 5, and 10 days).(A-B) Samples of OA cartilage at 3 days (duplicate experiment). Proteinswere resolved on IPG strips pH 3–10 NL (5-20% SDS-PAGE gradient gels,gels were silver-stained). The spots were marked with arrowheads accordingto the database [UniProt Knowledge base (UniProtKB)/Swiss-Prot] for Rattusnorvegicus species.
Competing interestsThe authors declare that they have no competing interests.
Authors’ contributionsNMPT and FECR participated in sample preparation for 2-D and MS, proteomicexperiments, image analysis, collection of data, and MS analysis, bioinformatics,and statistical analysis. NMPT performed microscopy confocal analysis. FECRcarried out the review of the manuscript. JBK provided direction and fundingfor this project. All authors read and approved the final manuscript.
AcknowledgementsWe wish to thank Dr. Fidel de la Cruz Hernandez, for access to theinstrumentation of his laboratory within the Departamento de Infectómica yPatogénesis Molecular, CINVESTAV-IPN and to Dra. Maylin Almonte Becerril fortheir help and many useful discussions in the Departamento de Infectómica yPatogénesis Molecular, CINVESTAV-IPN. This study was partially supported byCONACyT Project No. 168328. NMPT received a Ph. D. scholarship from CONA-CyT, México (238066).
Received: 28 March 2014 Accepted: 31 October 2014
References1. Liu Q, Yu L, Gao J, Fu Q, Zhang J, Zhang P, Chen J, Zhao S: Cloning, tissue
expression pattern and genomic organization of latexin, a humanhomologue of rat carboxypeptidase A inhibitor. Mol Biol Rep 2000,27:241–246.
2. Kouri JB, Aguilera JM, Reyes J, Lozoya KA, Gonzalez S: Apoptotic chondrocytesfrom osteoarthrotic human articular cartilage and abnormal calcification ofsubchondral bone. J Rheumatol 2000, 27:1005–1019.
3. Silver FH, Bradica G, Tria A: Relationship among biomechanical,biochemical, and cellular changes associated with osteoarthritis. Crit RevBiomed Eng 2001, 29:373–391.
4. Aigner T, McKenna L: Molecular pathology and pathobiology ofosteoarthritic cartilage. Cell Mol Life Sci 2002, 59:5–18.
5. Kouri JB, Lavalle C: Do chondrocytes undergo “activation” and“transdifferentiation” during the pathogenesis of osteoarthritis? A reviewof the ultrastructural and immunohistochemical evidence. HistolHistopathol 2006, 21:793–802.
6. Ruiz-Romero C, Lopez-Armada MJ, Blanco FJ: Mitochondrial proteomiccharacterization of human normal articular chondrocytes. OsteoarthritisCartilage 2006, 14:507–518.
7. Lozoya KA, Flores JB: A novel rat osteoarthrosis model to assess apoptosisand matrix degradation. Pathol Res Pract 2000, 196:729–745.
8. Ruiz-Romero C, Lopez-Armada MJ, Blanco FJ: Proteomic characterization ofhuman normal articular chondrocytes: a novel tool for the study ofosteoarthritis and other rheumatic diseases. Proteomics 2005, 5:3048–3059.
9. Martel-Pelletier J, McCollum R, Fujimoto N, Obata K, Cloutier JM, Pelletier JP:Excess of metalloproteases over tissue inhibitor of metalloprotease maycontribute to cartilage degradation in osteoarthritis and rheumatoidarthritis. Lab Invest 1994, 70:807–815.
10. Hardingham TE, Fosang AJ: Proteoglycans: many forms and manyfunctions. FASEB J 1992, 6:861–870.
11. Goldring MB: The role of the chondrocyte in osteoarthritis. Arthritis Rheum2000, 43:1916–1926.
12. Hermansson M, Sawaji Y, Bolton M, Alexander S, Wallace A, Begum S, Wait R,Saklatvala J: Proteomic analysis of articular cartilage shows increasedtype II collagen synthesis in osteoarthritis and expression of inhibinbetaA (activin A), a regulatory molecule for chondrocytes. J Biol Chem 2004,279:43514–43521.
13. Vincourt JB, Lionneton F, Kratassiouk G, Guillemin F, Netter P, Mainard D,Magdalou J: Establishment of a reliable method for direct proteomecharacterization of human articular cartilage. Mol Cell Proteomics 2006,5:1984–1995.
15. Wilson R, Bateman JF: A robust method for proteomic characterization ofmouse cartilage using solubility-based sequential fractionation andtwo-dimensional gel electrophoresis. Matrix Biol 2008, 27:709–712.
16. Guo D, Tan W, Wang F, Lv Z, Hu J, Lv T, Chen Q, Gu X, Wan B, Zhang Z:Proteomic analysis of human articular cartilage: identification ofdifferentially expressed proteins in knee osteoarthritis. Joint Bone Spine2008, 75:439–444.
17. Wu J, Liu W, Bemis A, Wang E, Qiu Y, Morris EA, Flannery CR, Yang Z:Comparative proteomic characterization of articular cartilage tissue fromnormal donors and patients with osteoarthritis. Arthritis Rheum 2007,56:3675–3684.
18. Perez E, Gallegos JL, Cortes L, Calderon KG, Luna JC, Cazares FE, Velasquillo MC,Kouri JB, Hernandez FC: Identification of latexin by a proteomic analysis inrat normal articular cartilage. Proteome Sci 2010, 8:27.
19. Almonte-Becerril M, Navarro-Garcia F, Gonzalez-Robles A, Vega-Lopez MA,Lavalle C, Kouri JB: Cell death of chondrocytes is a combination betweenapoptosis and autophagy during the pathogenesis of Osteoarthritiswithin an experimental model. Apoptosis 2010, 15:631–638.
21. Ostergaard K, Petersen J, Andersen CB, Bendtzen K, Salter DM: Histologic/histochemical grading system for osteoarthritic articular cartilage:reproducibility and validity. Arthritis Rheum 1997, 40:1766–1771.
22. Martinez-Calleja A, Velasquillo C, Vega-Lopez M, Arellano-Jimenez MJ,Tsutsumi-Fujiyoshi VK, Mondragon-Flores R, Kouri-Flores JB: Osteopontinexpression and localization of Ca++ deposits in early stages ofosteoarthritis in a rat model. Histol Histopathol 2014, 29:925–933.
23. Mankin HJ, Dorfman H, Lippiello L, Zarins A: Biochemical and metabolicabnormalities in articular cartilage from osteo-arthritic human hips. II.Correlation of morphology with biochemical and metabolic data. J BoneJoint Surg Am 1971, 53:523–537.
24. Mankin HJ: Biochemical and metabolic aspects of osteoarthritis. OrthopClin North Am 1971, 2:19–31.
25. Kouri-Flores JB, Abbud-Lozoya KA, Roja-Morales L: Kinetics of theultrastructural changes in apoptotic chondrocytes from an osteoarthrosisrat model: a window of comparison to the cellular mechanism ofapoptosis in human chondrocytes. Ultrastruct Pathol 2002, 26:33–40.
26. Somech R, Lev A, Simon AJ, Hanna S, Etzioni A: T- and B-cell defects in anovel purine nucleoside phosphorylase mutation. J Allergy Clin Immunol2012, 130:539–542.
28. Toro A, Grunebaum E: TAT-mediated intracellular delivery of purinenucleoside phosphorylase corrects its deficiency in mice. J Clin Invest2006, 116:2717–2726.
29. Tokarska-Schlattner M, Boissan M, Munier A, Borot C, Mailleau C, Speer O,Schlattner U, Lacombe ML: The nucleoside diphosphate kinase D (NM23-H4)
Parra-Torres et al. Proteome Science 2014, 12:55 Page 11 of 11http://www.proteomesci.com/content/12/1/55
binds the inner mitochondrial membrane with high affinity to cardiolipinand couples nucleotide transfer with respiration. J Biol Chem 2008,283:26198–26207.
31. Eyre DR, Weis MA, Wu JJ: Articular cartilage collagen: an irreplaceableframework? Eur Cell Mater 2006, 12:57–63.
32. Horikawa O, Nakajima H, Kikuchi T, Ichimura S, Yamada H, Fujikawa K,Toyama Y: Distribution of type VI collagen in chondrocytemicroenvironment: study of chondrons isolated from human normal anddegenerative articular cartilage and cultured chondrocytes. J Orthop Sci2004, 9:29–36.
33. Yeung K, Janosch P, McFerran B, Rose DW, Mischak H, Sedivy JM, Kolch W:Mechanism of suppression of the Raf/MEK/extracellular signal-regulatedkinase pathway by the raf kinase inhibitor protein. Mol Cell Biol 2000,20:3079–3085.
34. Chin D, Means AR: Calmodulin: a prototypical calcium sensor. Trends CellBiol 2000, 10:322–328.
35. Shimazaki A, Wright MO, Elliot K, Salter DM, Millward-Sadler SJ: Calcium/calmodulin-dependent protein kinase II in human articular chondrocytes.Biorheology 2006, 43:223–233.
36. Sekito A, Koide-Yoshida S, Niki T, Taira T, Iguchi-Ariga SM, Ariga H: DJ-1interacts with HIPK1 and affects H2O2-induced cell death. Free Radic Res2006, 40:155–165.
37. Takahashi K, Taira T, Niki T, Seino C, Iguchi-Ariga SM, Ariga H: DJ-1 positivelyregulates the androgen receptor by impairing the binding of PIASxalpha to the receptor. J Biol Chem 2001, 276:37556–37563.
38. Shinbo Y, Taira T, Niki T, Iguchi-Ariga SM, Ariga H: DJ-1 restores p53transcription activity inhibited by Topors/p53BP3. Int J Oncol 2005,26:641–648.
40. Dycus DL, Au AY, Grzanna MW, Wardlaw JL, Frondoza CG: Modulation ofinflammation and oxidative stress in canine chondrocytes. Am J Vet Res2013, 74:983–989.
41. Soares DC, Abbott CM: Highly homologous eEF1A1 and eEF1A2 exhibitdifferential post-translational modification with significant enrichmentaround localised sites of sequence variation. Biol Direct 2013, 8:29.
42. Kadouchi I, Sakamoto K, Tangjiao L, Murakami T, Kobayashi E, Hoshino Y,Yamaguchi A: Latexin is involved in bone morphogenetic protein-2-inducedchondrocyte differentiation. Biochem Biophys Res Commun 2009, 378:600–604.
43. Arimatsu Y, Nihonmatsu I, Hatanaka Y: Localization of latexin-immunoreactive neurons in the adult cat cerebral cortex and claustrum/endopiriform formation. Neuroscience 2009, 162:1398–1410.
44. Liang Y, Van Zant G: Aging stem cells, latexin, and longevity. Exp Cell Res2008, 314:1962–1972.
45. Pallares I, Bonet R, Garcia-Castellanos R, Ventura S, Aviles FX, Vendrell J,Gomis-Ruth FX: Structure of human carboxypeptidase A4 with itsendogenous protein inhibitor, latexin. Proc Natl Acad Sci U S A 2005,102:3978–3983.
46. Silvestro L, Viano I, Naggi A, Torri G, Da Col R, Baiocchi C: High-performanceliquid chromatographic-mass spectrometric analysis of oligosaccharidesfrom enzymatic digestion of glycosaminoglycans. Application to humansamples. J Chromatogr 1992, 591:225–232.
47. Hanna SL, Sherman NE, Kinter MT, Goldberg JB: Comparison of proteinsexpressed by Pseudomonas aeruginosa strains representing initial andchronic isolates from a cystic fibrosis patient: an analysis by 2-D gelelectrophoresis and capillary column liquid chromatography-tandemmass spectrometry. Microbiology 2000, 146(Pt 10):2495–2508.
doi:10.1186/s12953-014-0055-0Cite this article as: Parra-Torres et al.: Proteomic analysis of rat cartilage: theidentification of differentially expressed proteins in the early stages ofosteoarthritis. Proteome Science 2014 12:55.
Submit your next manuscript to BioMed Centraland take full advantage of:
• Convenient online submission
• Thorough peer review
• No space constraints or color figure charges
• Immediate publication on acceptance
• Inclusion in PubMed, CAS, Scopus and Google Scholar
• Research which is freely available for redistribution
Submit your manuscript at www.biomedcentral.com/submit