PROTOCOL FOR MONITORING EFFECTIVENESS OF DAM REMOVALS PAW PAW RIVER, MICHIGAN Great Lakes Restoration Initiative National Oceanic and Atmospheric Administration Fisheries Habitat Conservation Program October 25, 2010 Prepared by Martin Boote Project Manager Environmental Consulting & Technology, Inc. Prepared for Berrien County Brownfield Redevelopment Authority
Transcript
PROTOCOL FOR
MONITORING EFFECTIVENESS OF
DAM REMOVALS PAW PAW RIVER, MICHIGAN
Great Lakes Restoration Initiative
National Oceanic and Atmospheric Administration Fisheries Habitat Conservation Program
October 25, 2010
Prepared by Martin Boote
Project Manager Environmental Consulting & Technology, Inc.
Prepared for
Berrien County Brownfield Redevelopment Authority
NA10NMF4630411
2
This protocol is for monitoring the effectiveness of dam removal on the Paw Paw River, Michigan. The Watervliet Dams Removal project is being funded by the National Oceanic and Atmospheric Administration (NOAA), Fisheries Habitat Conservation Program Office, through the Great Lakes Restoration Initiative (GLRI).
Project Name
GLRI NOAA – Watervliet Dams Removal, Paw Paw River, Michigan
INTRODUCTION & BACKGROUND ................................................................................. 4 MONITORING GOAL ............................................................................................................ 4 QUESTIONS TO BE ANSWERED ..................................................................................... 4 NULL HYPOTHESIS ............................................................................................................. 4 MONITORING OBJECTIVES .............................................................................................. 5 FISH SAMPLING STATIONS .............................................................................................. 5 FISH COLLECTION AND MARKING METHODS ........................................................... 7 FISH COMMUNITY DATA ANALYSIS AND HYPOTHESIS TESTING ....................... 7 CHANNEL SLOPE AND HYDRAULICS ......................................................................... 11 ACCESSIBLE RIVER MILES ............................................................................................ 12 INVASIVE SPECIES CONTROL MEASURES............................................................... 13 DATA SHARING AND REPORTING ............................................................................... 14 CONTACT INFORMATION................................................................................................ 14
NA10NMF4630411
4
INTRODUCTION & BACKGROUND The National Oceanic and Atmospheric Administration (NOAA) National Marine Fisheries Service (NMFS) has awarded a Great Lakes Restoration Initiative (GLRI) grant to Berrien County’s Brownfield Redevelopment Authority for removal of two related dams on the Paw Paw River, located in the City of Watervliet (Award #NA10NMF4630411). NOAA’s stated goals for the Great Lakes Habitat Restoration Program as they specifically apply to the Watervliet Dams Removal project are 1) benefit native diadromous fish and their habitat, particularly projects that remove in-stream migration barriers; 2) restore habitats limiting productivity; and 3) restore natural systems. The Watervliet Dams Removal project has been conceived and designed to accomplish all three of those goals. Following project completion it is anticipated that the project will provide accessibility to more than 100 miles of stream, including 31 miles of the mainstem and multiple tributaries up to other existing fish passage barriers. Successful attainment of the goals stated above will be measured through ecological monitoring. Ecological monitoring will include fish community surveys and potadromous fish species mark-and-recapture. In addition, performance measurements consistent with the NOAA Open Rivers Initiative, though not required under this award, will be made. These include measures of accessible stream miles upstream of the barriers and passibility. This monitoring protocol has been prepared in consultation with the Michigan Department of Natural Resources and Environment (MDNRE), Fisheries Division; United States Fish and Wildlife Service, Green Bay Fish and Wildlife Conservation Office; and NOAA, Office of Response & Restoration. The MDNRE Fisheries Division Manual of Fisheries Survey Methods II 1 has been consulted and used as a guide for various aspects of the fish community monitoring. MONITORING GOAL The goal of ecological monitoring is to determine if removing the two Watervliet dams has effectively restored unrestricted potadromous and native riverine fish movement within the Paw Paw River while restoring habitat, thereby benefiting and conserving the native and potadromous fish communities of the Paw Paw River, St. Joseph River, and Lake Michigan. QUESTIONS TO BE ANSWERED This monitoring protocol has been developed to answer two principal questions:
1) Did dam removal restore the lotic habitat and fish community within the Paw Paw River previously impacted by the dams?
2) Did dam removal restore unrestricted fish movement? NULL HYPOTHESIS Removing the two Watervliet dams on the Paw Paw River will not significantly change fish community diversity and similarity upstream and downstream of the dams by restoring habitat and unrestricted movement of fishes. If statistical testing shows that there is a statistically significant difference in the fish community diversity after dam removal and unrestricted fish movement is documented, then the null hypothesis would be rejected,
1 Schneider, James C. (ed.) 2000. Manual of fisheries survey methods II: with periodic updates. Michigan Department of Natural Resources, Fisheries Special Report 25, AnnArbor.
NA10NMF4630411
5
indicating that the removal of the Watervliet dams has significantly changed the fish community and restored unrestricted fish movement. MONITORING OBJECTIVES Pre-Removal Objectives
Characterize the existing fish communities upstream and downstream of the dams using multiple community indices, test for statistical significance.
Map habitat types and distribution within the upstream and downstream sampling stations.
Characterize the existing fish communities within the historical channel and mill race using multiple community indices, test for statistical significance.
Map habitat types and distribution within the historical channel and mill race. Document the existing bed profile and slope through both dams and
upstream/downstream of the dams. Document the existing elevation head, bed slope, channel average width, and mean
flow velocity through both dams. Fin clip representative fish species captured downstream of the dams.
Post-Removal Objectives
Characterize the fish communities upstream and downstream of the dams after removal using multiple community indices, test for statistical significance.
Map habitat types and distribution within the upstream and downstream sampling stations.
Characterize the fish communities within the historical channel and mill race after removal using multiple community indices, test for statistical significance.
Map habitat types and distribution within the historical channel and mill race. Document the bed profile through both dams and upstream/downstream of the dams
after removal. Document the elevation head, bed slope, channel width, and mean flow velocity at
the former location of both dams. Capture fin-clipped fish upstream of the former dam locations.
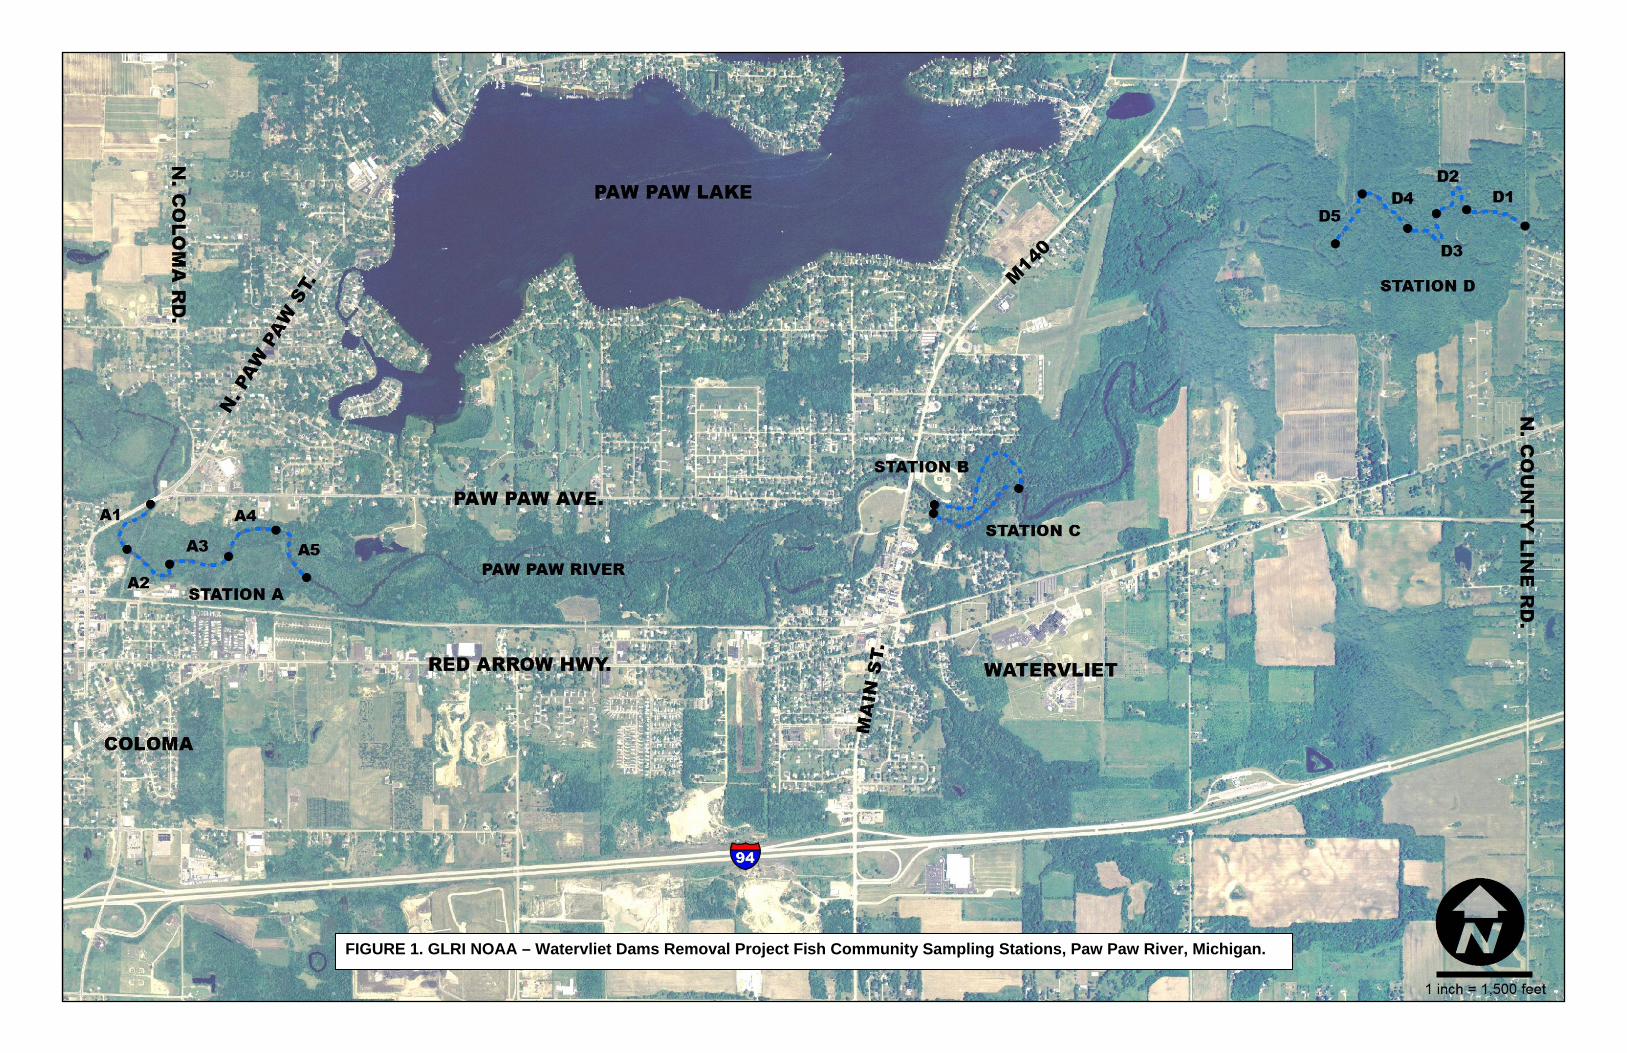
FISH SAMPLING STATIONS Lyons (1992)2 and Schneider (2000) recommend a minimum sampling length of 35 times average stream width for fish assemblage surveys. The Paw Paw River averages 70 feet in width between Coloma and the Berrien-Van Buren county line. Therefore, the 3,000-foot sampling length will exceed Lyon’s (1992) minimum recommended length (35 x 70 = 2,450 feet). The additional survey length will result in larger samples and a greater number of marked fish. Four fish community sampling stations will be used to monitor the fish communities upstream and downstream of the dams and within the historical channel and mill race. Figure 1 shows the location of the four fish community sampling stations: (A) downstream; (B) historical channel; (C) mill race; and (D) upstream.
2 Lyons, J. 1992. The length of stream to sample with a towed electrofishing unit when fish species richness is estimated. N. Am. Journal of Fish. Manag. 12:198-203.
NA10NMF4630411
6
The downstream station will be designated as Station A. Station A will be the baseline control station because the removal of the dams is not expected to affect habitat or the fish community at that location. Station A will start at North Paw Paw Street in Coloma and extend upstream 5,000 feet. The upstream end of Station A is 2.4 miles downstream of the spillway dam. The upstream station will be designated as Station D. Station D will start at 70th Street (North County Line Road, Berrien County-Van Buren county line) and extend downstream 5,000 feet. The downstream end of Station D is 2.7 miles upstream of the diversion dam and 3.0 miles upstream of the spillway dam. To decrease sampling bias and the influence of habitat variability, the upstream and downstream stations will be divided into five 1,000-foot reaches (A1 through A5 and D1 through D5, downstream to upstream). During each fish community sampling event, three of the five reaches will be randomly selected for surveying for a total combined sampling length of 3,000 feet. The historical channel is 2,200 feet long. The mill race is 1,740 feet long. Both reaches are less than 3,000 feet and less than 35 times the average stream width in length. Therefore, they cannot be sampled in a manner that will result in equal sampling effort compared to the upstream and downstream stations or one to another. A total of 3,000 feet will be sampled within the upstream and downstream stations. The diversity t-test proposed requires that the equal sampling effort assumption be met. Therefore, it will not be possible to determine if the fish communities of the mill race and historical channel are statistically different than the fish communities of the upstream and downstream stations. However, the fish communities of the historical channel and mill race can be compared pre- and post-project implementation. Therefore, the entire length of the historical channel and mill race will be sampled as sampling stations B and C respectively. Habitat will be mapped throughout the entire length of the sampling stations. Habitat mapping in stations A and D will be discretized by sub-sampling reach. Pool, run, riffle, large woody debris complexes, and rock substrate habitats will be mapped based on the observable predominant bed forms, water surface profiles, and substrate type. Map-grade GPS equipment will be used to map the upstream and downstream ends of the predominant habitat types and large woody debris locations (based on centroid). Large woody debris complexes will be defined as any accumulation of woody debris below the top-of-bank that contains woody debris exceeding six inches in diameter and approximate minimum dimensions of six feet by six feet. The estimated length and width of woody debris complexes will be recorded. The area of each habitat will be determined by multiplying to cumulative length of each habitat type by the average reach width. During March and April of 2012, fish sampling will be conducted at five remaining upstream barriers. The five barriers will be selected in 2011 based on drainage area as a surrogate for discharge – the five barriers with the largest upstream drainage areas will be selected because they will be most likely to attract the largest number of migrating potadromous fish species. Drainage area will be obtained from existing data sources or estimated using a 1:24,000 Digital Elevation Terrain Model (DEM) and GIS spatial and 3-D analysis tools. The purpose of identifying upstream barrier sampling stations is to capture and count fin-clipped fish in the spring of 2012 after both dams have been removed to assess passability. The length of channel that will be sampled will be 35 times the channel width, extending downstream from the five barriers. MONITORING SCHEDULE All four monitoring stations will be surveyed during March/April of 2011 and in June/July of 2011 to document the pre-construction fish community at the four stations. The spring
NA10NMF4630411
7
sampling event is planned for marking migrating potadromous fish species prior to construction. Post-construction surveys will be conducted at the four sampling stations in June/July of 2012. The five upstream barrier stations will be sampled in March/April of 2012. FISH COLLECTION AND MARKING METHODS Fish will be collected using a boom-shocker mounted on a 17-foot aluminum flat bottom boat powered by a 20-hp, 4-cycle outboard motor. If shallow water prevents use of the outboard motor, then the boat will be used as a tote barge. The boom shocker will be powered by a 2000-watt, 120-volt AC gas generator. A Smith-Root 1.5KVA Electrofisher will supply pulsed AC and DC to two boom mounted electrode arrays, or two electrode poles if the boat is being used as a tote barge in shallow water. The electrofisher is equipped with a timer for recording fishing effort. Based on conductivity of freshwaters in the Paw Paw River area, the electrofisher will be operated to output approximately 200 to 220 volts with 2 to 6 amperes. Output will be set at 3 amperes and then adjusted to optimize fish collection while minimizing injury and recovery time based on actual conditions at the time of sampling and capture efficiency. Fish will be stunned and netted from the river by handlers and temporarily held in aerated tanks with fresh water obtained from the Paw Paw River until processing. Sampling will proceed in an upstream direction. During sampling in Stations A and D, the three randomly selected sub-reaches will be sampled from the furthest downstream to the furthest upstream. Fish will be processed at the end of each sub-reach. After processing, fish will be immediately live released. Fish will be released at the downstream end of each sub-reach to reduce potential migration into the next upstream sub-reach selected for sampling. Captured fish will be identified to species and counted. Because the goal of fish community monitoring is to characterize the community, it is not necessary to collect weight and length measurements. Weight and length measurements are time consuming and only required for population level statistics and growth analysis. Community composition and community indices/metrics can be calculated from species identification and counts alone. Representative potadromous fish species captured during the 2011 pre-construction fish community surveys at the downstream (A) and historical channel (B) sampling stations (both downstream of the two dams) will be fin clipped prior to release. The purpose of fin clipping is to mark fish for later recapture. The mark-recapture study will be used to assess fish passage/migration. Fin clipping is a quick, inexpensive, and reliable method of marking a large number of fish; it will be important to obtain a large population sample to increase the probability of recaptures in subsequent post-construction surveys at the upstream monitoring and survey locations. Representative and important species that will be well suited for the mark-recapture study include walleye (Sander vitreus), native suckers (Catostomus spp.), and steelhead (Oncorhynchus mykiss). These species will be used as indicators of successful fish passage for all potadromous fish species in the Paw Paw River as well as resident fish species. The anal fin of walleye and representative sucker species will be clipped. The adipose fin of steelhead will be clipped. FISH COMMUNITY DATA ANALYSIS AND HYPOTHESIS TESTING Fish community diversity (Shannon-Weiner index), species richness (number of species), catch-per-effort, and species composition will be determined to compare the fish communities between stations and over time as discussed below. Similarity between
NA10NMF4630411
8
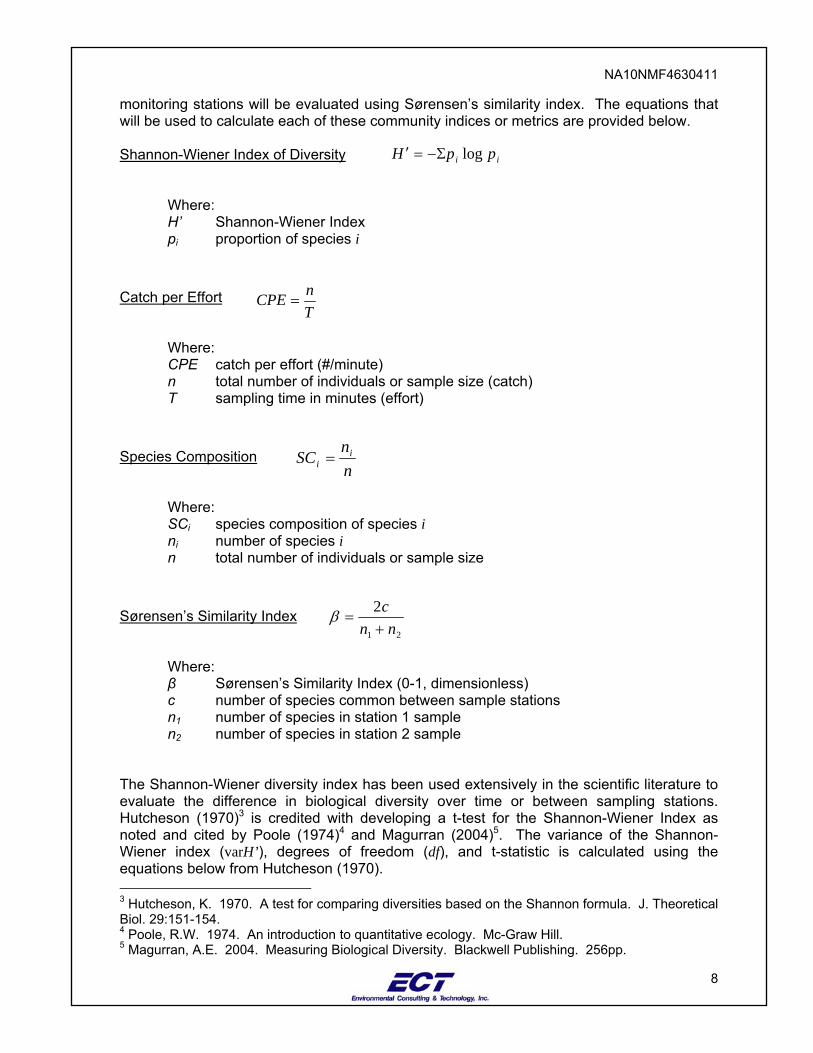
monitoring stations will be evaluated using Sørensen’s similarity index. The equations that will be used to calculate each of these community indices or metrics are provided below. Shannon-Wiener Index of Diversity
Where: H’ Shannon-Wiener Index pi proportion of species i
Catch per Effort
Where: CPE catch per effort (#/minute) n total number of individuals or sample size (catch) T sampling time in minutes (effort)
Species Composition
Where: SCi species composition of species i ni number of species i n total number of individuals or sample size
Sørensen’s Similarity Index
Where: β Sørensen’s Similarity Index (0-1, dimensionless) c number of species common between sample stations n1 number of species in station 1 sample n2 number of species in station 2 sample
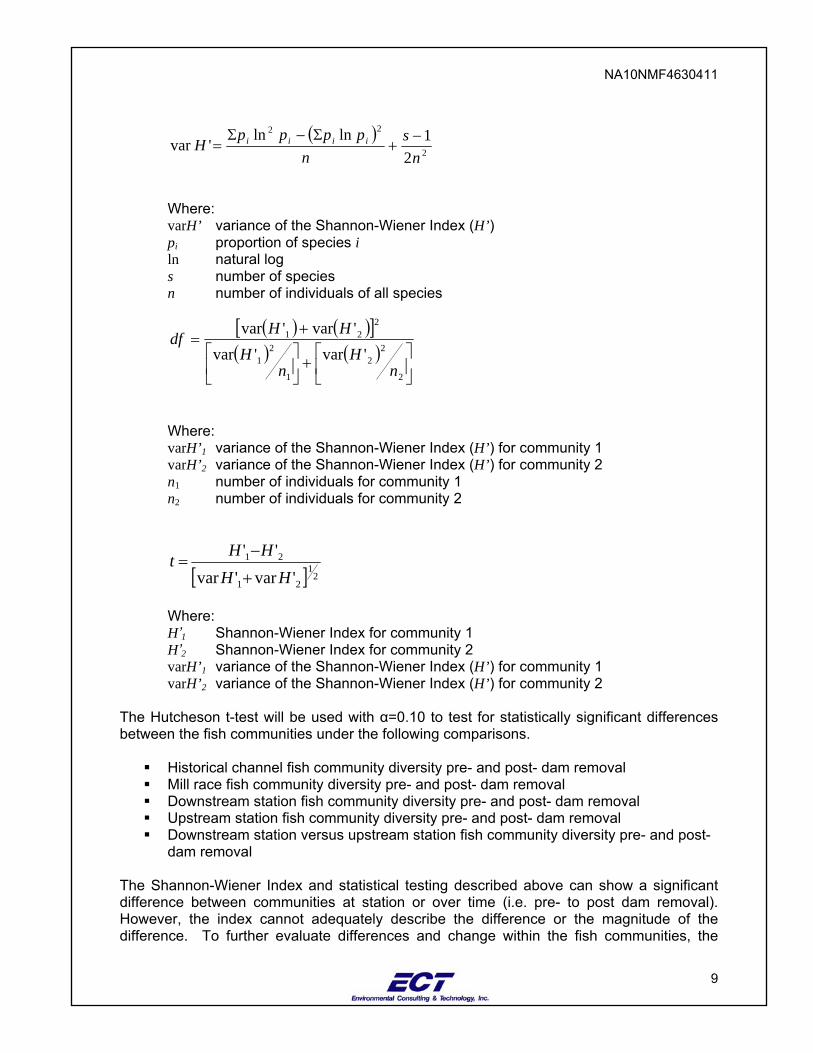
The Shannon-Wiener diversity index has been used extensively in the scientific literature to evaluate the difference in biological diversity over time or between sampling stations. Hutcheson (1970)3 is credited with developing a t-test for the Shannon-Wiener Index as noted and cited by Poole (1974)4 and Magurran (2004)5. The variance of the Shannon-Wiener index (varH’), degrees of freedom (df), and t-statistic is calculated using the equations below from Hutcheson (1970). 3 Hutcheson, K. 1970. A test for comparing diversities based on the Shannon formula. J. Theoretical Biol. 29:151-154. 4 Poole, R.W. 1974. An introduction to quantitative ecology. Mc-Graw Hill. 5 Magurran, A.E. 2004. Measuring Biological Diversity. Blackwell Publishing. 256pp.
ii ppH logΣ−=′
TnCPE =
nn
SC ii =
21
2nn
c+
=β
NA10NMF4630411
9
Where:
varH’ variance of the Shannon-Wiener Index (H’) pi proportion of species i ln natural log s number of species n number of individuals of all species
Where: varH’1 variance of the Shannon-Wiener Index (H’) for community 1
varH’2 variance of the Shannon-Wiener Index (H’) for community 2 n1 number of individuals for community 1 n2 number of individuals for community 2
Where:
H’1 Shannon-Wiener Index for community 1 H’2 Shannon-Wiener Index for community 2 varH’1 variance of the Shannon-Wiener Index (H’) for community 1
varH’2 variance of the Shannon-Wiener Index (H’) for community 2 The Hutcheson t-test will be used with α=0.10 to test for statistically significant differences between the fish communities under the following comparisons.
Historical channel fish community diversity pre- and post- dam removal Mill race fish community diversity pre- and post- dam removal Downstream station fish community diversity pre- and post- dam removal Upstream station fish community diversity pre- and post- dam removal Downstream station versus upstream station fish community diversity pre- and post-
dam removal The Shannon-Wiener Index and statistical testing described above can show a significant difference between communities at station or over time (i.e. pre- to post dam removal). However, the index cannot adequately describe the difference or the magnitude of the difference. To further evaluate differences and change within the fish communities, the
( )2
22
21lnln
'varn
sn
ppppH iiii −
+Σ−Σ
=
( ) ( )[ ]( ) ( )
⎥⎦
⎤⎢⎣
⎡+⎥
⎦
⎤⎢⎣
⎡+
=
2
22
1
21
221
'var'var'var'var
nH
nH
HHdf
[ ] 21
21
21
'var'var''HH
HHt+
−=
NA10NMF4630411
10
other community indices proposed and a conversion of the Shannon-Wiener Index will be used as described below. When the number of species in a community doubles, the community diversity intuitively doubles. This is not the case with the Shannon-Wiener Index, which is highly non-linear. A very large change in true diversity within a community can be represented by a very small change in the Shannon-Wiener Index, thereby masking the true magnitude of the change. Banos (2006)6 suggests a means of converting the Shannon-Wiener Index from a measure of entropy to a true measure of diversity expressed as the “effective number of species.” The effective number of species is the number of species with equal frequency that would result in a Shannon-Wiener index of a certain value. Banos (2006) equates it to true diversity. Mathematically, Banos (2006) defines the effective number of species as the exponential of the Shannon Index [exp(H’) or eH’; the base of the natural logarithm raised to the power of H’]. The effective number of species is proportional to the number of equally common species in a community. If the number of equally common species in a community doubles, the measure of diversity used should also intuitively double. As the Shannon-Wiener index measures it, diversity is high when there is a high number of species in the community with high equitability (i.e. evenness). Therefore, a high effective number of species equates to high diversity and vice-versa. It is useful to convert the Shannon-Wiener index to the effective number of species because it allows an assessment of the magnitude of difference/change in addition to the statistical significance of that difference/change when used to compare two communities or compare diversity over time in response to a change/disturbance within a system. Species composition will be used as a side-by-side comparison of fish assemblages. That is, the percent composition or abundance for all species between two communities will be compared side-by-side to illustrate compositional differences in the communities. Consideration of habitat preferences and species rarity/absence will be considered in the analysis to highlight differences in the communities that could be attributed to the effects of the dams and their removal. For example, the historical channel may not contain some species of fish present at the downstream and upstream stations due to the lack of flow in the historical channel or elevated water temperature in the historical channel. To graphically illustrate compositional differences between communities, k-dominance curves will be created by plotting cumulative percent dominance (i.e. % composition) on the y-axis and the natural log of the each species’ rank based on abundance on the x-axis. The shape of the k-dominance curves can be compared visually to highlight the differences in the communities. Sorenson’s Similarity Index will be used to assess similarity between communities. Sorenson’s provides an estimate of the percent similarity between species assemblages based on presence-absence data. More overlap in species between two communities will result in a higher index value, meaning the two communities are similar. Two communities with the same species assemblage will be 100% similar. The habitat mapping described above will be used to inform the data analysis and decision making process. Differences in habitat from pre- to post-dam removal or between the upstream and downstream stations may explain some of the differences in fish assemblages. For the historical channel, dam removal is expected to change the types and 6 Banos, L.J. 2006. Entropy and diversity. Oikos 113:2 (363-375).
NA10NMF4630411
11
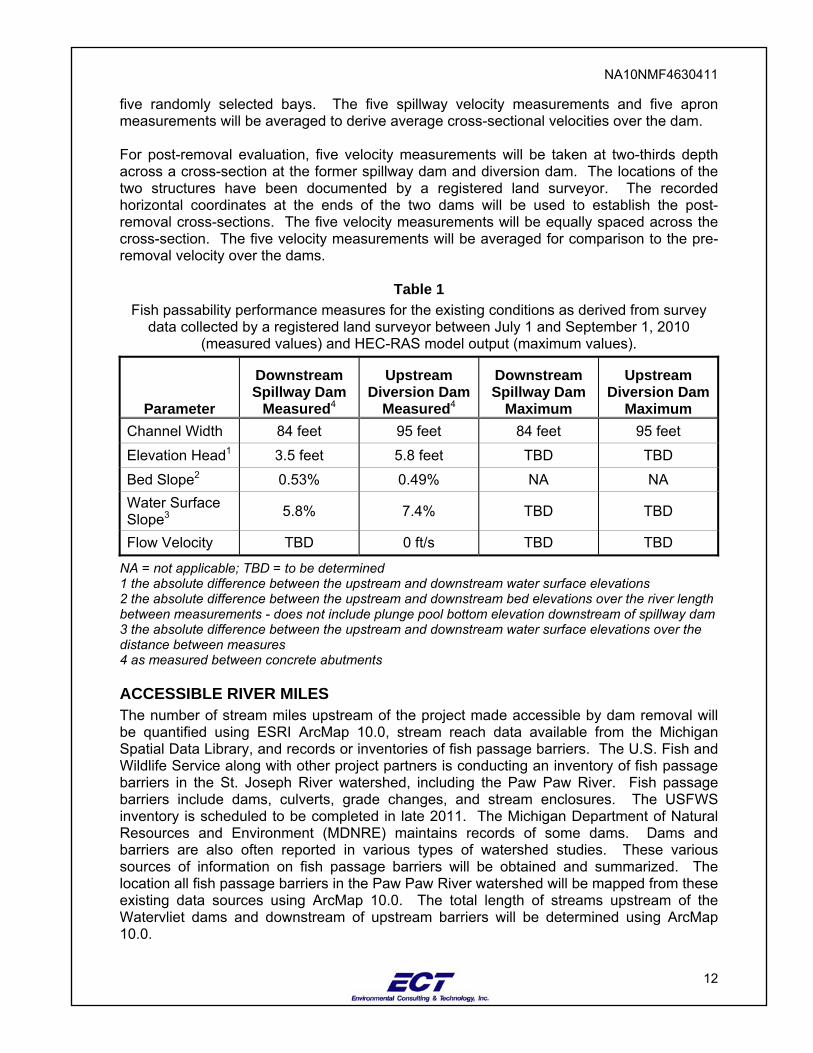
abundance of habitats due to restoration of flow. Dam removal could also alter the abundance and distribution of habitat types in the mill race due to bed erosion. A fish passage test is not included in the analysis and hypothesis testing because a simple presence/absence test will be used. The presence of fin-clipped fish that were captured at monitoring stations A and B (downstream of the dams) upstream of the dams will result in rejection of the null hypothesis. Conversely, the absence of fin-clipped fish upstream of the dams would result in acceptance of the null hypothesis or the conclusion that the study was not able to detect a change in fish passage. During the spring and summer 2012 surveys, the number of fin clipped fish captured at the upstream monitoring station and the five upstream barriers will be recorded. The number of fin clipped fish upstream of the barrier will further validate and confirm successful migration throughout the Paw Paw River as a direct result of dam removal. However, the number of recaptures will be heavily dependent on the number of fish that can be fin clipped in 2011, prior to dam removal. CHANNEL SLOPE AND HYDRAULICS The purpose of monitoring channel slope and hydraulics is to assess passability in a manner that is consistent with the NOAA Open Rivers Initiative. The goal of the Waterlviet Dams Removal project is complete above-grade removal of the two dams. Therefore, the existing elevation head will be eliminated. Elevation head is the equivalent measure of maximum jump height – the height a fish must jump from downstream to upstream in order to pass the barrier. However, it is also possible that grade control may be required to limit the amount of sediment stored above the dams that is eroded and transported down stream. If grade control is required, the resulting elevation head, bed slope, and hydraulics could impede movement of some fish species unless properly designed. Regardless, the elevation head, bed slope, and flow velocity through the two dams before and after removal will be documented in order to demonstrate that fish passage is restored. The swimming capabilities of walleye as an indicator species will be compared to elevation head, bed slope, and flow velocity before and after dam removal. This analysis will show that the two dams currently prevent fish passage for all cool and warm water fish species with swimming capabilities similar to walleye. It will also show that hydraulics after dam removal will allow fish passage. The elevation head will be measured at low flow using survey data collected by a registered land surveyor. The definition of elevation head is the difference between the upstream and downstream water surface elevations, the equivalent of jump height in fish passage terms. After dam removal, the bed and water surface profiles will be re-surveyed through the former location of both dams by a registered land surveyor. These pre- and post-removal survey data will be used to calculate elevation head and bed slope. Flow velocity will be measured as described below. The existing elevation head and bed slope through the two dams is provided below in Table 1. Some parameters have not yet been measured and the HEC-RAS modeling is in progress. Velocity will be measured at low flow using a Girly pygmy flow meter. Velocity measurements will be made at five locations along the spillway and five locations along the downstream apron of the spillway dam (during low flow, water does not flow over the diversion dam). The spillway dam is subdivided into twelve bays by concrete piers. Five of the twelve bays will be randomly selected for velocity measurements. An additional five measurements will be taken on the downstream apron face immediately downstream of the
NA10NMF4630411
12
five randomly selected bays. The five spillway velocity measurements and five apron measurements will be averaged to derive average cross-sectional velocities over the dam. For post-removal evaluation, five velocity measurements will be taken at two-thirds depth across a cross-section at the former spillway dam and diversion dam. The locations of the two structures have been documented by a registered land surveyor. The recorded horizontal coordinates at the ends of the two dams will be used to establish the post-removal cross-sections. The five velocity measurements will be equally spaced across the cross-section. The five velocity measurements will be averaged for comparison to the pre-removal velocity over the dams.
Table 1 Fish passability performance measures for the existing conditions as derived from survey
data collected by a registered land surveyor between July 1 and September 1, 2010 (measured values) and HEC-RAS model output (maximum values).
Parameter
Downstream Spillway Dam
Measured4
Upstream Diversion Dam
Measured4
Downstream Spillway Dam
Maximum
Upstream Diversion Dam
Maximum Channel Width 84 feet 95 feet 84 feet 95 feet Elevation Head1 3.5 feet 5.8 feet TBD TBD Bed Slope2 0.53% 0.49% NA NA Water Surface Slope3 5.8% 7.4% TBD TBD
Flow Velocity TBD 0 ft/s TBD TBD
NA = not applicable; TBD = to be determined 1 the absolute difference between the upstream and downstream water surface elevations 2 the absolute difference between the upstream and downstream bed elevations over the river length between measurements - does not include plunge pool bottom elevation downstream of spillway dam 3 the absolute difference between the upstream and downstream water surface elevations over the distance between measures 4 as measured between concrete abutments ACCESSIBLE RIVER MILES The number of stream miles upstream of the project made accessible by dam removal will be quantified using ESRI ArcMap 10.0, stream reach data available from the Michigan Spatial Data Library, and records or inventories of fish passage barriers. The U.S. Fish and Wildlife Service along with other project partners is conducting an inventory of fish passage barriers in the St. Joseph River watershed, including the Paw Paw River. Fish passage barriers include dams, culverts, grade changes, and stream enclosures. The USFWS inventory is scheduled to be completed in late 2011. The Michigan Department of Natural Resources and Environment (MDNRE) maintains records of some dams. Dams and barriers are also often reported in various types of watershed studies. These various sources of information on fish passage barriers will be obtained and summarized. The location all fish passage barriers in the Paw Paw River watershed will be mapped from these existing data sources using ArcMap 10.0. The total length of streams upstream of the Watervliet dams and downstream of upstream barriers will be determined using ArcMap 10.0.
NA10NMF4630411
13
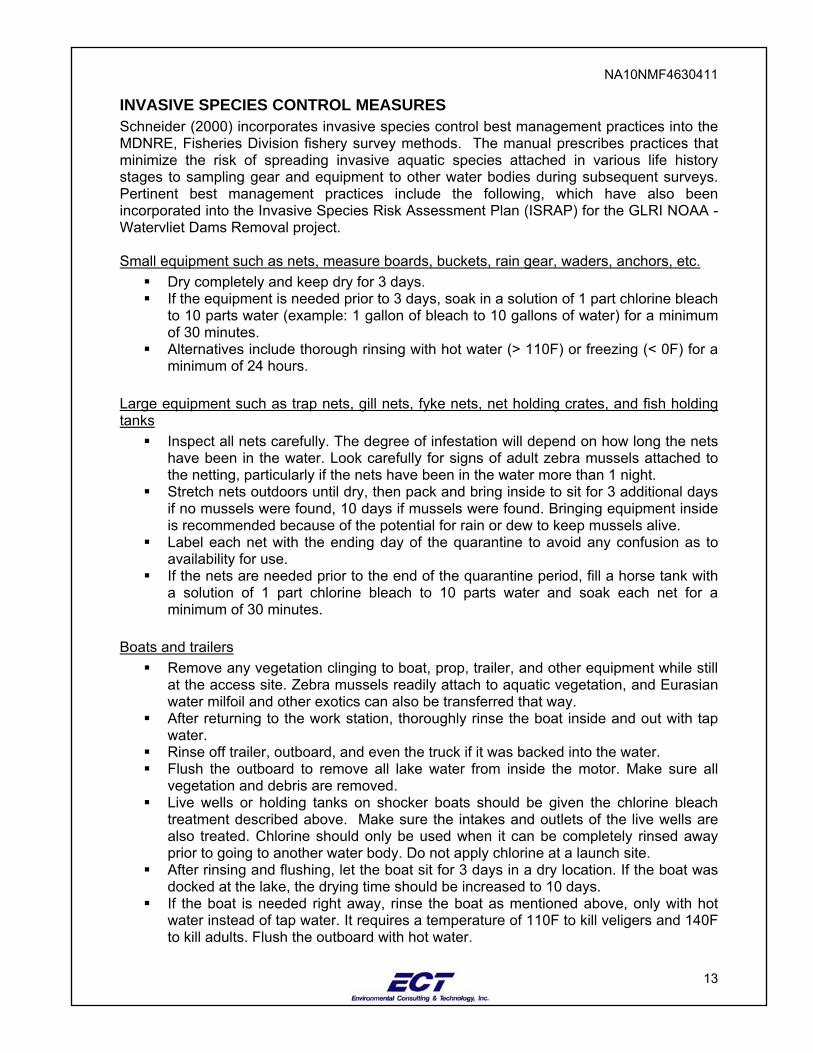
INVASIVE SPECIES CONTROL MEASURES Schneider (2000) incorporates invasive species control best management practices into the MDNRE, Fisheries Division fishery survey methods. The manual prescribes practices that minimize the risk of spreading invasive aquatic species attached in various life history stages to sampling gear and equipment to other water bodies during subsequent surveys. Pertinent best management practices include the following, which have also been incorporated into the Invasive Species Risk Assessment Plan (ISRAP) for the GLRI NOAA - Watervliet Dams Removal project. Small equipment such as nets, measure boards, buckets, rain gear, waders, anchors, etc.
Dry completely and keep dry for 3 days. If the equipment is needed prior to 3 days, soak in a solution of 1 part chlorine bleach
to 10 parts water (example: 1 gallon of bleach to 10 gallons of water) for a minimum of 30 minutes.
Alternatives include thorough rinsing with hot water (> 110F) or freezing (< 0F) for a minimum of 24 hours.
Large equipment such as trap nets, gill nets, fyke nets, net holding crates, and fish holding tanks
Inspect all nets carefully. The degree of infestation will depend on how long the nets have been in the water. Look carefully for signs of adult zebra mussels attached to the netting, particularly if the nets have been in the water more than 1 night.
Stretch nets outdoors until dry, then pack and bring inside to sit for 3 additional days if no mussels were found, 10 days if mussels were found. Bringing equipment inside is recommended because of the potential for rain or dew to keep mussels alive.
Label each net with the ending day of the quarantine to avoid any confusion as to availability for use.
If the nets are needed prior to the end of the quarantine period, fill a horse tank with a solution of 1 part chlorine bleach to 10 parts water and soak each net for a minimum of 30 minutes.
Boats and trailers
Remove any vegetation clinging to boat, prop, trailer, and other equipment while still at the access site. Zebra mussels readily attach to aquatic vegetation, and Eurasian water milfoil and other exotics can also be transferred that way.
After returning to the work station, thoroughly rinse the boat inside and out with tap water.
Rinse off trailer, outboard, and even the truck if it was backed into the water. Flush the outboard to remove all lake water from inside the motor. Make sure all
vegetation and debris are removed. Live wells or holding tanks on shocker boats should be given the chlorine bleach
treatment described above. Make sure the intakes and outlets of the live wells are also treated. Chlorine should only be used when it can be completely rinsed away prior to going to another water body. Do not apply chlorine at a launch site.
After rinsing and flushing, let the boat sit for 3 days in a dry location. If the boat was docked at the lake, the drying time should be increased to 10 days.
If the boat is needed right away, rinse the boat as mentioned above, only with hot water instead of tap water. It requires a temperature of 110F to kill veligers and 140F to kill adults. Flush the outboard with hot water.
NA10NMF4630411
14
A quick, easy method for flushing outboards is to use muffs, which can be purchased at any marine store.
DATA SHARING AND REPORTING All field data will be entered into a Microsoft Excel® spreadsheet. The spreadsheet and a summary monitoring report will be submitted to NOAA’s Technical Monitor for QA/QC after each survey. The summary report will summarize monitoring activities for the period covered and discuss any deviations from the monitoring plan. Following QA/QC review, the data and summary monitoring reports will be submitted to NOAA’s Program Officer for approval. Once approved by NOAA, the data and summary reports will be distributed to the MDNRE Fisheries Division and USFWS after each monitoring event. Data and summary reports will also be made available to the public through the project website created and maintained by ECT’s sub-contractor, the Southwest Michigan Planning Commission. The URL address for the website is provided here: http://www.swmpc.org/watervlietdam.asp. The final monitoring report will be delivered to the NOAA Technical Monitor by June 30, 2012 for QA/QC review. Approval and distribution of the data and final monitoring report will follow the same steps and procedures as outlined above for the interim data and summary of monitoring activities. CONTACT INFORMATION Grant Recipient Dan Fette Berrien County Brownfield Redevelopment Authority [email protected] Berrien County Administration Center 701 Main Street, St. Joseph, MI 49085 (269) 983-7111 ex 8617 Granting Agency Jessica Berrio Program Officer [email protected] NOAA Restoration Center (301) 713-0174 Paula Bizot Technical Monitor [email protected] NOAA Office of Response & Restoration - Contractor 4840 South State Road Ann Arbor, MI 48108 734.741.2272 734.741.2055 (FX)
NA10NMF4630411
15
Contractor Marty Boote Project Manager/Principal Investigator [email protected] Environmental Consulting & Technology, Inc. 2200 Commonwealth Blvd., Suite 300 734-769-3004 ex 23308 734-769-3164 (FX) State Funding Partner Kregg Smith Fisheries Biologist [email protected] Michigan Department of Natural Resources and Environment Fisheries Division 621 N. 10th St. Plainwell, MI 49080 (269) 685-6851 ext. 115 (269) 685-1362 (FX) Other Federal Funding Partner Rick Westerhof [email protected] Fish Biologist U.S. Fish and Wildlife Service Green Bay Fish and Wildlife Conservation Office 6644 Turner Road Elmira, MI 49730 231-584-3553 231-584-2462 (FX)
FIGURE 1. GLRI NOAA – Watervliet Dams Removal Project Fish Community Sampling Stations, Paw Paw River, Michigan.