PROTON-DEUTERON AMIDE EXCHANGE STUDIES BY MS AND NMR: NEW METHODS FOR PROTEIN NMR RESONANCE ASSIGNMENT By LIANMEI FENG (Under the Direction of Dr. James H. Prestegard and Dr. Ronald Orlando) ABSTRACT Many proteins of biological interest are large, or difficult to express with uniform magnetically active isotopic labels, making them inaccessible to structural study by conventional Nuclear Magnetic Resonance (NMR) methods. A less conventional approach relies on sparse labeling with isotopes in specific amino acid types, but this approach requires new resonance assignment strategies that don’t rely on the presence of isotopic labels in sequential backbone sites. The goal of this thesis is to develop a new protein assignment strategy applicable to a sparsely labeled sample. The approach combines NMR and Mass Spectrometry (MS) and relies on the ability of both methods to monitor the rates of exchange of an amide proton for a water deuteron. MS can identify the peptide sequence which contains the exchanged amides while NMR can provide resolved amide proton signals which reflect the amount of exchange. By correlating amide exchange rates, from data on the native protein and from data on derived peptides, we achieve assignment of NMR peaks to specific positions in the protein sequence. We selected the glycosyltransferase, ST6Gal1 as a long-term objective. This is a 38 kDa glycosylated protein that is not readily expressed in E. Coli. We have also used a more easily expressed 15 kDa lectin, Galectin-3, as an intermediate target on which to demonstrate our methodology. We have successfully demonstrated the utility of our assignment strategy on a 15 N phenylalanine labeled sample of Galectin-3, and have demonstrated an ability to acquire data on ST6Gal1 labeled in specific amino acids. We expect the new methodology to open NMR-based structural investigations for a class of proteins that has been largely inaccessible to structural biology investigation in the past. INDEX WORDS: H/D exchange, NMR, MS, Assignment, Gelectin-3, ST6Gal1, Angeotensin I, Specific isotopic labeling, Hadamard transform, Pepsin digestion, MALDI, ESI FT MS
Transcript
PROTON-DEUTERON AMIDE EXCHANGE STUDIES BY MS AND NMR:
NEW METHODS FOR PROTEIN NMR RESONANCE ASSIGNMENT
By
LIANMEI FENG
(Under the Direction of Dr. James H. Prestegard and Dr. Ronald Orlando)
ABSTRACT
Many proteins of biological interest are large, or difficult to express with uniform magnetically active isotopic labels, making them inaccessible to structural study by conventional Nuclear Magnetic Resonance (NMR) methods. A less conventional approach relies on sparse labeling with isotopes in specific amino acid types, but this approach requires new resonance assignment strategies that don’t rely on the presence of isotopic labels in sequential backbone sites. The goal of this thesis is to develop a new protein assignment strategy applicable to a sparsely labeled sample. The approach combines NMR and Mass Spectrometry (MS) and relies on the ability of both methods to monitor the rates of exchange of an amide proton for a water deuteron. MS can identify the peptide sequence which contains the exchanged amides while NMR can provide resolved amide proton signals which reflect the amount of exchange. By correlating amide exchange rates, from data on the native protein and from data on derived peptides, we achieve assignment of NMR peaks to specific positions in the protein sequence. We selected the glycosyltransferase, ST6Gal1 as a long-term objective. This is a 38 kDa glycosylated protein that is not readily expressed in E. Coli. We have also used a more easily expressed 15 kDa lectin, Galectin-3, as an intermediate target on which to demonstrate our methodology. We have successfully demonstrated the utility of our assignment strategy on a 15N phenylalanine labeled sample of Galectin-3, and have demonstrated an ability to acquire data on ST6Gal1 labeled in specific amino acids. We expect the new methodology to open NMR-based structural investigations for a class of proteins that has been largely inaccessible to structural biology investigation in the past.
INDEX WORDS: H/D exchange, NMR, MS, Assignment, Gelectin-3, ST6Gal1, Angeotensin I, Specific isotopic labeling, Hadamard transform, Pepsin digestion, MALDI, ESI FT MS
PROTON-DEUTERON AMIDE EXCHANGE STUDIES BY MS AND NMR:
NEW METHODS FOR PROTEIN NMR RESONANCE ASSIGNMENT
By
LIANMEI FENG
B.S., Zhejiang University, P. R. China, 1998
M.S., Zhejiang University, P. R. China, 2001
A Dissertation Submitted to the Graduate Faculty of the University of Georgia in Partial
PROTON-DEUTERON AMIDE EXCHANGE STUDIES BY MS AND NMR:
NEW METHODS FOR PROTEIN NMR RESONANCE ASSIGNMENT
By
LIANMEI FENG
Major Professor: James H. Prestegard Ronald Orlando Committee: Jonathan Amster Marly K. Eidsness Electronic Version Approved: Maureen Grasso Dean of the Graduate School The University of Georgia August, 2006
iv
DEDICATION
I dedicate this work to my wonderful family. My father, Dingliang Feng, taught me to
be strong, aim high, live positively and contribute to the community. My mother, Meifang
Lian, taught me kindness, patience, and appreciation. My husband, Yebin Zhao, gives me
love, and is always there for me and supporting me no matter what happens.
v
ACKNOWLEDGEMENTS
This thesis owes its existence to the help, support, and inspiration of many people.
First of all, I would like to express my sincere appreciation and gratitude to Dr. James H.
Prestegard for his support and encouragement during the past five years of this thesis work.
He provided an exciting research project for me to explore my potential and learn diverse
scientific skills. I would also like to thank Dr. Ron Orlando for his daily support and his
willingness to take time to discuss my projects. Meanwhile, I am indebted to Dr. Marly
Eidsness and Dr. John Amster, who not only agreed to serve on my examining committee,
but have been a source of enthusiasm and encouragement along my study.
Dr. John Glushka and Dr. Fang Tian helped me with NMR data analysis and
provided reference spectra of ST6Gal1. Dr. Han-Seung Lee taught me the procedure for 15N
amino acid specific labeling on Gal3. Dr. Lu Meng continuously supplied ST6Gal1 samples
expressed in mammalian cells with different types of 15N specific labeling. I will also thank
Dr. Prestegard’s assistant, Ms. Beverly Chalk, for generous assistance about lab issues and
grammar checking of my thesis. Last but not least, I extend my appreciation to all current as
well as previous post docs and graduate students for timely assistance. I am very grateful for
the cooperative spirit and the excellent working atmosphere.
CHAPTER................................................................................................................................1 1 INTRODUCTION AND LITERATURE REVIEW ..............................................1
1.1 Structural investigation of proteins by NMR and the need for a new
1. Riek, R., Pervushin, K. & Wuthrich, K. TROSY and CRINEPT: NMR with large molecular and supramolecular structures in solution. Trends in Biochemical Sciences 25, 462-468 (2000).
2. Wuthrich, K. Protein recognition by NMR. Nature Structural Biology 7, 188-189 (2000).
3. Betz, M., Saxena, K. & Schwalbe, H. Biomolecular NMR: a chaperon to drug discovery Current Opinion in Biotechnology 10, 229-225 (2006).
4. Spyracopoulos, L. Thermodynamic interpretation of protein dynamics from NMR relaxation measurements. Protein and Peptide Letters 12, 235-240 (2005).
5. Pellecchia, M. Solution nuclear magnetic resonance spectroscopy techniques for probing intermolecular interactions. Chem. Biol. 12, 961-971 (2005).
6. Carlomagno, T. Ligand-target interactions: What can we learn from NMR? Annual Review of Biophysics and Biomolecular Structure 34, 245-266 (2005).
7. Baker, H.M., Day, C.L., Norris, G.E. & Baker, E.N. Enzymatic Deglycosylation as a Tool for Crystallization of Mammalian Binding-Proteins. Acta Crystallographica Section D-Biological Crystallography 50, 380-384 (1994).
8. Riek, R., Fiaux, J., Bertelsen, E.B., Horwich, A.L. & Wuthrich, K. Solution NMR techniques for large molecular and supramolecular structures. Journal of the American Chemical Society 124, 12144-12153 (2002).
9. Hill, H.D.W. Improved sensitivity of NMR spectroscopy probes by use of high-temperature superconductive detection coils. IEEE Transactions on Applied Superconductivity 7, 3750-3755 (1997).
10. Moskau, D. & Zerbe, O. Achieving better sensitivity , less noise and fewer artifacts in NMR spectra. Methods and Principles in Medicinal Chemistry 16, 67-78 (2003).
11. Prestegard, J.H., Al-Hashimi, H.M. & Tolman, J.R. NMR structures of biomolecules using field oriented media and residual dipolar couplings. Quarterly Reviews of Biophysics 33, 371-424 (2000).
12. Prestegard, J.H., Bougault, C.M. & Kishore, A.I. Residual dipolar couplings in structure determination of biomolecules. Chemical Reviews 104, 3519-3540 (2004).
13. Tolman, J.R. & Ruan, K. NMR residual dipolar couplings as probes of biomolecular dynamics. Chemical Reviews 106, 1720-1736 (2006).
14. Horst, R. et al. Direct NMR observation of a substrate protein bound to the chaperonin GroEL. Proceedings of the National Academy of Sciences of the United States of America 102, 12748-12753 (2005).
15. Pervushin, K., Riek, R., Wider, G. & Wuthrich, K. Attenuated T-2 relaxation by mutual cancellation of dipole-dipole coupling and chemical shift anisotropy indicates an avenue to NMR structures of very large biological macromolecules in solution. Proceedings of the National Academy of Sciences of the United States of America 94, 12366-12371 (1997).
16. Apweiler, R., Hermjakob, H. & Sharon, N. On the frequency of protein glycosylation, as deduced from analysis of the SWISS-PROT database. Biochimica Et Biophysica Acta-General Subjects 1473, 4-8 (1999).
18. Dwek, R.A. Glycobiology - More Functions for Oligosaccharides. Science 269, 1234-1235 (1995).
19. Rutherford, T.J., Neville, D.C.A. & Homans, S.W. Influence of the Extent of
17
Branching on Solution Conformations of Complex Oligosaccharides - a Molecular-Dynamics and Nmr-Study of a Penta-Antennary Bisected N-Glycan. Biochemistry 34, 14131-14137 (1995).
20. Imberty, A., Delage, M.M., Bourne, Y., Cambillau, C. & Perez, S. Data-Bank of 3-Dimensional Structures of Disaccharides .2. N-Acetyllactosaminic Type N-Glycans - Comparison with the Crystal-Structure of a Biantennary Octasaccharide. Glycoconjugate Journal 8, 456-483 (1991).
21. Berman, H.M. et al. The Protein Data Bank. Nucleic Acids Research 28, 235-242 (2000).
22. Imberty, A. & Perez, S. Stereochemistry of the N-Glycosylation Sites in Glycoproteins. Protein Engineering 8, 699-709 (1995).
23. Petrescu, A.J., Petrescu, S.M., Dwek, R.A. & Wormald, M.R. A statistical analysis of N- and O-glycan linkage conformations from crystallographic data. Glycobiology 9, 343-352 (1999).
24. Coughlin, P.E. et al. Improved resolution and sensitivity of triple-resonance NMR methods for the structural analysis of proteins by use of a backbone-labeling strategy. Journal of the American Chemical Society 121, 11871-11874 (1999).
25. Iwahara, J. & Clore, G.M. Detecting transient intermediates in macromolecular binding by paramagnetic NMR. Nature 440, 1227-1230 (2006).
26. Liang, B.Y., Bushweller, J.H. & Tamm, L.K. Site-directed parallel spin-labeling and paramagnetic relaxation enhancement in structure determination of membrane proteins by solution NMR spectroscopy. Journal of the American Chemical Society 128, 4389-4397 (2006).
27. Pintacuda, G., Park, A.Y., Keniry, M.A., Dixonj, N.E. & Otting, G. Lanthanide labeling offers fast NMR approach to 3D structure determinations of protein-protein complexes. Journal of the American Chemical Society 128, 3696-3702 (2006).
28. Schwalbe, H. et al. A refined solution structure of hen lysozyme determined using residual dipolar coupling data. Protein Science 10, 677-688 (2001).
29. Meiler, J., Prompers, J.J., Peti, W., Griesinger, C. & Bruschweiler, R. Model-free approach to the dynamic interpretation of residual dipolar couplings in globular proteins. Journal of the American Chemical Society 123, 6098-6107 (2001).
30. Gossuin, Y., Roch, A., Muller, R.N., Gillis, P. & Lo Bue, F. Anomalous nuclear magnetic relaxation of aqueous solutions of ferritin: an unprecedented first-order mechanism. Magnetic Resonance in Medicine 48, 959-964 (2002).
31. Jacob, J., Baker, B., Bryant, R.G. & Cafiso, D.S. Distance estimates from paramagnetic enhancements of nuclear relaxation in linear and flexible model peptides. Biophysical Journal 77, 1086-1092 (1999).
32. Bai, Y.W., Milne, J.S., Mayne, L. & Englander, S.W. Primary Structure Effects on Peptide Group Hydrogen-Exchange. Proteins-Structure Function and Genetics 17, 75-86 (1993).
33. Hvidt, A. & Linderstromlang, K. Exchange of Hydrogen Atoms in Insulin with Deuterium Atoms in Aqueous Solutions. Biochimica Et Biophysica Acta 14, 574-575 (1954).
35. Englander, S.W. & Kallenbach, N.R. Hydrogen-Exchange and Structural Dynamics of Proteins and Nucleic-Acids. Quarterly Reviews of Biophysics 16, 521-655 (1983).
36. Zhang, Z.Q. & Smith, D.L. Determination of Amide Hydrogen-Exchange by Mass-Spectrometry - a New Tool for Protein-Structure Elucidation. Protein Science 2, 522-531 (1993).
18
37. Hoofnagle, A.N., Resing, K.A. & Ahn, N.G. Protein analysis by hydrogen exchange mass spectrometry. Annual Review of Biophysics and Biomolecular Structure 32, 1-25 (2003).
38. Bollen, Y.J.M., Kamphuis, M.B. & van Mierlo, C.P.M. The folding energy landscape of apoflavodoxin is rugged: Hydrogen exchange reveals nonproductive misfolded intermediates. Proceedings of the National Academy of Sciences of the United States of America 103, 4095-4100 (2006).
39. Wales, T.E. & Engen, J.R. Hydrogen exchange mass spectrometry for the analysis of protein dynamics. Mass Spectrometry Reviews 25, 158-170 (2006).
40. Ehring, H. Hydrogen exchange electrospray ionization mass spectrometry studies of structural features of proteins and protein/protein interactions. Analytical Biochemistry 267, 252-259 (1999).
41. Mandell, J.G., Falick, A.M. & Komives, E.A. Identification of protein-protein interfaces by decreased amide proton solvent accessibility. Proceedings of the National Academy of Sciences of the United States of America 95, 14705-14710 (1998).
42. Takahashi, H., Nakanishi, T., Kami, K., Arata, Y. & Shimada, I. A novel NMR method for determining the interfaces of large protein-protein complexes. Nature Structural Biology 7, 220-223 (2000).
43. Kamel, A.M., Zandi, K.S. & Massefski, W.W. Identification of the degradation product of ezlopitant, a non-peptidic substance p antagonist receptor, by hydrogen deuterium exchange, electrospray ionization tandem mass spectrometry (ESI/MS/MS) and nuclear magnetic resonance (NMR) spectroscopy. Journal of Pharmaceutical and Biomedical Analysis 31, 1211-1222 (2003).
44. Kim, M.Y., Maier, C.S., Reed, D.J. & Deinzer, M.L. Site-specific amide hydrogen/deuterium exchange in E-coli thioredoxins measured by electrospray ionization mass spectrometry. Journal of the American Chemical Society 123, 9860-9866 (2001).
45. Kainosho, M. Isotope labelling of macromolecules for structural determinations. Nature Structural Biology 4, 858-861 (1997).
46. Luo, S.C., Chen, C.Y., Lin, Y.S., Jeng, W.Y. & Chuang, W.J. Backbone H-1, N-15 and C-13 resonance assignments of the 28 kDa mature form of streptopain. Journal of Biomolecular Nmr 25, 165-166 (2003).
47. Gardner, K.H. & Kay, L.E. The use of H-2, C-13, N-15 multidimensional NMR to study the structure and dynamics of proteins. Annual Review of Biophysics and Biomolecular Structure 27, 357-406 (1998).
48. Muchmore, D.C., McIntosh, L.P., Russell, C.B., Anderson, D.E. & Dahlquist, F.W. Expression and N-15 Labeling of Proteins for Proton and N-15 Nuclear-Magnetic-Resonance. Methods in Enzymology 177, 44-73 (1989).
49. Archer, S.J. et al. Transforming Growth Factor-Beta-1 - Nmr Signal Assignments of the Recombinant Protein Expressed and Isotopically Enriched Using Chinese-Hamster Ovary Cells. Biochemistry 32, 1152-1163 (1993).
50. Lustbader, J.W. et al. Expression of human chorionic gonadotropin uniformly labeled with NMR isotopes in Chinese hamster ovary cells: An advance toward rapid determination of glycoprotein structures. Journal of Biomolecular Nmr 7, 295-304 (1996).
51. Strauss, A. et al. Amino-acid-type selective isotope labeling of proteins expressed in Baculovirus-infected insect cells useful for NMR studies. Journal of Biomolecular Nmr 26, 367-372 (2003).
Assignment of the Backbone H-1 and N-15 Nmr Resonances of Bacteriophage-T4 Lysozyme. Biochemistry 29, 6341-6362 (1990).
53. Chen, C.Y. et al. Preparation of Amino-Acid-Type Selective Isotope Labeling of Protein Expressed in Pichia pastoris. PROTEINS: Structure, Function, and Bioinformatics 62, 279-287 (2006).
54. Daly, R. & Hearn, M.T.W. Expression of heterologous proteins in Pichia pastoris: a useful experimental tool in protein engineering and production. J. Mol. Recognit. 18, 119-138 (2005).
55. Cereghino, G.P.L., Cereghino, J.L., Ilgen, C. & Cregg, J.M. Production of recombinant proteins in fermenter cultures of the yeast Pichia pastoris. Current Opinion in Biotechnology 13, 329-332 (2002).
57. Macauley-Patrick, S., Fazenda, M.L., McNeil, B. & Harvey, L.M. Heterologous protein production using the Pichia pastoris expression system. Yeast 22, 249-270 (2005).
58. Devries, J.K. & Zubay, G. DNA-Directed Peptide Synthesis .2. Synthesis of Alpha-Fragment of Enzyme Beta-Galactosidase. Proceedings of the National Academy of Sciences of the United States of America 57, 1010-& (1967).
59. Jenkins, N., Parekh, R.B. & James, D.C. Getting the glycosylation right: Implications for the biotechnology industry. Nature Biotechnology 14, 975-981 (1996).
60. Roitsch, T. & Lehle, L. Structural Requirements for Protein N-Glycosylation - Influence of Acceptor Peptides on Cotranslational Glycosylation of Yeast Invertase and Site-Directed Mutagenesis around a Sequon Sequence. European Journal of Biochemistry 181, 525-529 (1989).
61. Fiaux, J., Bertelsen, E.B., Horwich, A.L. & Wuthrich, K. Uniform and residue-specific N-15-labeling of proteins on a highly deuterated background. Journal of Biomolecular Nmr 29, 289-297 (2004).
62. Ozawa, K. et al. Optimization of an Escherichia coli system for cell-free synthesis of selectively N-15-labelled proteins for rapid analysis by NMR spectroscopy. European Journal of Biochemistry 271, 4084-4093 (2004).
63. Grundmann, U., Nerlich, C., Rein, T. & Zettlmeissl, G. Complete Cdna Sequence Encoding the B-Subunit of Human Factor-Xiii. Nucleic Acids Research 18, 2817-2818 (1990).
64. Weinstein, J., Desouzaesilva, U. & Paulson, J.C. Purification of a Gal-Beta-1-]4glcnac Alpha-2-]6 Sialyltransferase and a Gal-Beta-1-]3(4)Glcnac Alpha-2-]3 Sialyltransferase to Homogeneity from Rat-Liver. Journal of Biological Chemistry 257, 3835-3844 (1982).
65. Weinstein, J., Desouzaesilva, U. & Paulson, J.C. Sialylation of Glycoprotein Oligosaccharides N-Linked to Asparagine - Enzymatic Characterization of a Gal-Beta-1-]3(4)Glcnac Alpha-2-]3 Sialyltransferase and a Gal-Beta-1-]4glcnac Alpha-2-]6 Sialyltransferase from Rat-Liver. Journal of Biological Chemistry 257, 3845-3853 (1982).
66. Hidari, K. et al. Purification and characterization of a soluble recombinant human ST6Gal I functionally expressed in Escherichia coli. Glycoconjugate Journal 22, 1-11 (2005).
67. Gross, H.J. et al. Transfer of Synthetic Sialic-Acid Analogs to N-Linked and O-Linked Glycoprotein Glycans Using 4 Different Mammalian Sialytransferases. Biochemistry 28, 7386-7392 (1989).
68. Datta, A.K., Chammas, R. & Paulson, J.C. Conserved cysteines in the
20
sialyltransferase sialylmotifs form an essential disulfide bond. Journal of Biological Chemistry 276, 15200-15207 (2001).
69. Datta, A.K. & Paulson, J.C. The Sialyltransferase Sialylmotif Participates in Binding the Donor Substrate Cmp-Neuac. Journal of Biological Chemistry 270, 1497-1500 (1995).
70. Datta, A.K., Sinha, A. & Paulson, J.C. Mutation of the sialyltransferase S-sialylmotif alters the kinetics of the donor and acceptor substrates. Journal of Biological Chemistry 273, 9608-9614 (1998).
71. Vazquez-Martin, C., Gil-Martin, E. & Fernandez-Briera, A. Elevation of ST6Gal I activity in malignant and transitional tissue in human colorectal cancer. Oncology 69, 436-444 (2005).
72. Amano, M., Galvan, M., He, J.L. & Baum, L.G. The ST6Gal I sialyltransferase selectively modifies N-glycans on CD45 to negatively regulate galectin-1-induced CD45 clustering, phosphatase modulation, and T cell death. Journal of Biological Chemistry 278, 7469-7475 (2003).
73. Houzelstein, D. et al. Phylogenetic analysis of the vertebrate galectin family. Molecular Biology and Evolution 21, 1177-1187 (2004).
74. Seetharaman, J. et al. X-ray crystal structure of the human galectin-3 carbohydrate recognition domain at 2.1-angstrom resolution. Journal of Biological Chemistry 273, 13047-13052 (1998).
75. Umemoto, K. & Leffler, H. Letter to the Editor: Assignment of H-1, N-15 and C-13 resonances of the carbohydrate recognition domain of human galectin-3. J. Biomol. NMR 20, 91-92 (2001).
76. Zhuang, T., Leffler, H. & Prestegard, J.H. Enhancement of bound-state residual dipolar couplings: Conformational analysis of lactose bound to Galectin-3. Protein Science 15, 1-11 (2006).
77. Rabinovich, G.A. et al. Galectins and their ligands: amplifiers, silencers or tuners of the inflammatory response? Trends in Immunology 23, 313-320 (2002).
78. Akahani, S., Inohara, H., NangiaMakker, P. & Raz, A. Galectin-3 in tumor metastasis. Trends in Glycoscience and Glycotechnology 9, 69-75 (1997).
79. Leffler, H. Introduction to galectins. Trends in Glycoscience and Glycotechnology 9, 9-& (1997).
21
CHAPTER 2
MASS SPECTROMETRY ASSISTED ASSIGNMENT OF NMR RESONANCES IN
15N LABELED PROTEINS1
1Feng, L. M.; Orlando, R.; Prestegard, J. H. Journal of the American Chemical Society 2004, 126, 14377-14379 Reprinted here with permission of publisher, 07/07/2006
22
Abstract
Application of NMR methods for the structural characterization to larger and
more complex protein systems can be facilitated through the development of new methods
for resonance assignment. Here a novel approach that relies on integration of nuclear
magnetic resonance (NMR) and Mass Spectrometry (MS) methods is explored. The
approach relies on the fact that both NMR and MS are able to monitor rates of exchange of
amide protons for water deuterons. Correlating the rates can connect cross-peak positions
from NMR data with fragment masses from MS data to support sequential assignment. The
example provided is to a small model protein, ubiquitin, but the potential for application to
large, more difficult to express proteins, is clear.
Figure 2.1. H/D exchange rates (kex) add a dimension to 2D NMR and MS spectra, which
allow correlations to achieve protein assignment.
1H
15N
m/z
NMR MS
Log 2
(kex
)
FCGYVAHVSAGTNE
GDFCAPNT
DIILYED
Log 2
(kex
)
GA
C
Y
1H
15N
m/z
NMR MS
Log 2
(kex
)
FCGYVAHVSAGTNE
GDFCAPNT
DIILYED
Log 2
(kex
)
GA
C
Y15N
m/z
NMR MS
Log 2
(kex
)
FCGYVAHVSAGTNE
GDFCAPNT
DIILYED
Log 2
(kex
)
GA
C
Y
23
2.1 Introduction
Amide H/D exchange monitored by either NMR or MS has become a useful method
to study the conformational properties of proteins and their complexes in solution. Here a
novel application, combining these monitoring methods, to assign resonances in 2D NMR
spectra is presented. It is based on the ability of both methods to monitor rates of hydrogen
for deuterium exchange at amide sites and make assignments by correlating these rates. This
approach bypasses the limitation of conventional 3D NMR spectral collection and
interpretation to assign cross peaks of a 15N-1H HSQC spectrum to specific sites in an amino
acid sequence. The new approach should save time and avoid the need for enrichment of
proteins with multiple isotopes while pursuing conventional 3D NMR experiments. It will
ultimately be important for protein structure determination in cases where molecules fail to
form crystals suitable for X-ray structure determination. This work has now been published in
the Journal of the American Chemical Society and will be repeated here. 1 However, we first
present some background material.
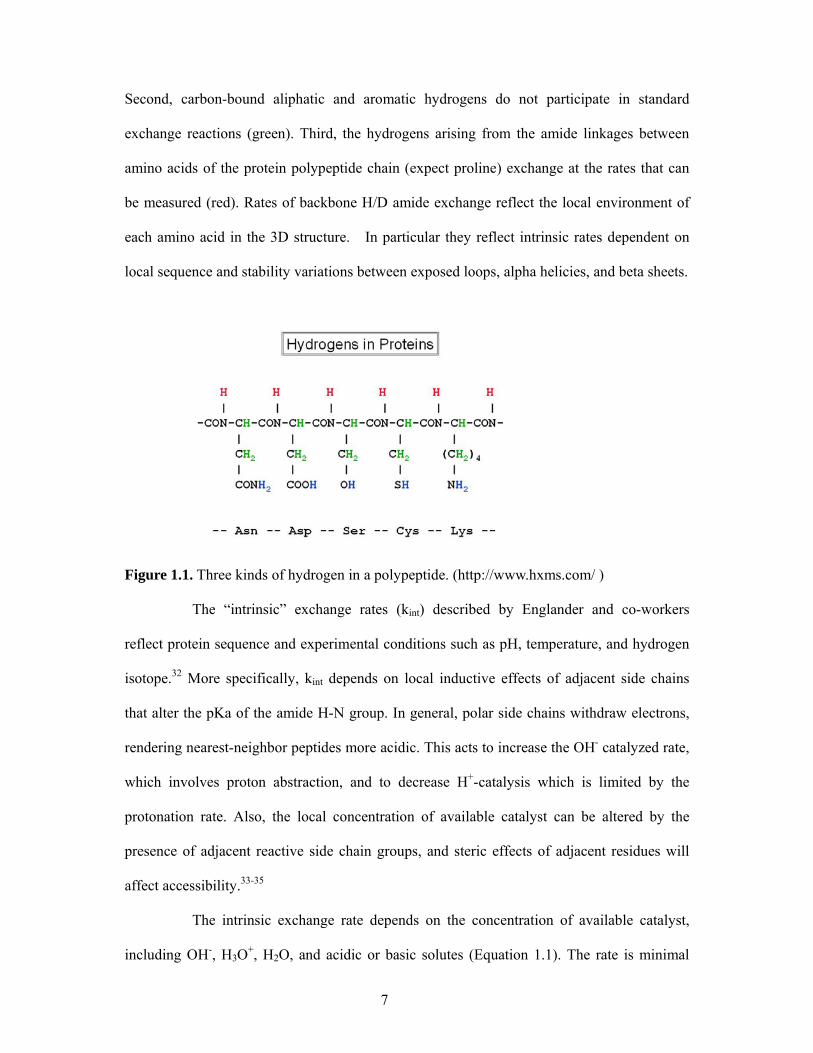
2.1.1 Protein amide H/D exchange studied by MS
Mass spectrometry (MS) based peptide amide deuterium exchange techniques
have proven to be increasingly powerful tools to study protein structure, dynamics, and
function. The advantage of MS for monitoring hydrogen exchange of protein backbone
amides is high sensitivity, wide coverage of sequence, and the ability to analyze large
proteins.
H/D exchange occurs during incubation of the lyophilized or concentrated protein
sample in deuterated buffer at physiological pH and temperature. After certain time intervals,
the deuteration is quenched by lowering the pH and temperature at pH 2.5, 0 ºC in order to
minimize undersirable back exchange and allow enough time for MS analysis. To localize the
deuterium position after the H/D exchange reaction, pepsin, an acid-stable protease, is used to
24
digest the protein into a peptide mixture. Pepsin is used to fragment the protein because it has
maximum activity at pH 2-3 where the amide hydrogen exchange rate is slowest. Given the
power of mass spectrometry for identifying peptides in complex mixtures, the non-specificity
of pepsin is advantageous because it usually leads to formation of many overlapping peptides.
Pepsin preferentially cleaves on the C-terminal side of F, L, E, W, Y, and I; other residues
may also be cleaved at various rates.2 Immobilized pepsin is used in our study in order to
provide an effective means for separating the pepsin from the isotopically labeled fragments.
In addition, the self-proteolysis can be largely minimized once pepsin is immobilized on
beads. Accurate mass measurements in combination with sequence analysis by MS/MS are
used to identify the individual peptides from the protein samples generated by pepsin
cleavage. The peptides are defined by matching their masses to those generated by a
computer program, MS-digest (http://prospector.ucsf.edu/ucsfhtml4.0/ msdigest.htm) or other
powerful MS search engines, such as MASCOT (http://www.matrixscience.com/) or
SEQUEST (Thermo Electron, Waltham, MA). Only those yielding unambiguous matches are
used for analysis.
For large proteins, pepsin might generate hundreds of peptides. Prior to mass
analysis, HPLC is frequently used to separate peptides in order to minimize mass overlap and
suppression of peptide ionization in the mass spectrometer. Normally a C18 column is used to
separate peptide mixtures based on the differences in hydrophobicity. Special attention needs
to be paid to pre-cool the HPLC system and use a moderately fast separation gradient in order
to minimize loss of deuterium through back exchange with solvent. Then the HPLC eluent is
directly introduced into a mass spectrometer.
Most studies in the field of proteomics depend on the high performance liquid
chromatography-electrospray ionization mass spectrometry (HPLC-ESI MS) method, but
matrix-assisted laser desorption / ionization – time of flight (MALDI-TOF) is also a feasible
25
approach for following amide H/D exchange.3 With recent developments in MALDI-TOF
instrumentation, two features make it better suited for the present measurements: high
resolution to easily resolve the multiple isotopic peaks resulting from amide H/D exchange
and high mass accuracy to aid in identifying the many peptides resulting from the relatively
nonspecific cleavage.4 MALDI-TOF eliminates the HPLC separation step while still being
able to determine the deuterium content of the unseparated digest mixture from a single mass
spectrum. In addition to the advantage of simple operation, it will remove the possibility of
back exchange during the HPLC run. However, when protein size becomes larger, the
number of peptic peptides will increase tremendously. In that case, moderate separation will
very likely become necessary to avoid peak overlap and suppression of peptide ionization.
During the H/D exchange experiment, each deuteron incorporated will cause one
unit shift in the mass profile of the peptide. In order to track deuterium exchange in
individual peptides during the whole time course, data on aliquots from several sequential
time intervals were collected. The raw number of deuterons incorporated at each time point
was determined by taking the difference between the centroid of the isotopic peak cluster for
the deuterated sample and the centroid of the undeuterated control. These raw numbers must
be corrected for back-exchange that occurs during the quench, digestion, and MS analysis of
the peptide fragments in the procedure.
A main concern in data analysis of H/D exchange by MS is that spatial resolution
at a level of a single amide site cannot be reached. The spectrum can only reflect the
deuterium incorporation of the whole peptide fragment. The deconvolution step for assigning
a deuteration percentage to each amino acid site is a difficult mathematical problem. In
reality, tremendous efforts are focused on how to experimentally improve spatial resolution of
deuteron localization. Dr. Forest’s group, for example, has tried two other proteases, protease
type XIII from Aspergillus saitoi and protease type XVIII from Rhizhopus.5 Combining the
26
results with pepsin fragments increased the coverage for the peptide mapping. Differences
in the deuterium contents of two overlapping peptides can then be more effectively used to
increase the spatial resolution of deuterium incorporation data. Many groups are also trying to
apply tandem MS to sequentially degrade deuterated peptides to get information on specific
amino acids by subtracting masses of two sequential ions. However, the H/D scrambling
issue associated with the high backbone dissociation energies applied is still under
exploration. Here we will explore the possibility of using current MS technology to locally
monitor amide exchange rates for the purpose of making NMR peak assignments.
2.1.2 Protein amide H/D exchange studied by NMR
As a function of time after dissolution of a fully protonated sample in D2O, peaks
in a 2D HSQC or TROSY spectra disappear as protons are exchanged with deuterium.
Because the proton signal is detectable in these experiments, but the deuteron signal is not,
the volume of cross peaks is proportional to the number of 15N-1H sites left in the sample at a
particular time. Conversion of time course data into rate data provides a more quantitative
interpretation of these results. When the deuterium concentration in the solution is large and
the pH and temperature are constant, isotopic exchange of each amide hydrogen follows
first-order kinetics.6 Thus, the exchange rates (kex) can be calculated from the time variation
of peak intensity based on the equation I = I0exp(-kex t).7 The rate at which an amino acid
incorporates deuterium is related to its position within the protein structure, which means
exterior amino acids will exchange protons with the solvent very quickly (a few seconds at
pH 7), whereas some interior amino acids can have exchange rates as long as a month or
more. This gives more than six orders of magnitude variation in the exchange rate. If we
can distinguish rate difference by a factor of two, peaks can be classified into 20 different
groups providing substantial resolution for assignment purposes.
The Hadamard method provides an alternate approach to conventional HSQC or
27
TROSY acquisitions that offers an improvement in efficiency. It can extend the short time
scale range accessible on less concentrated samples. Techniques based on Hadamard
transform (HT) have been used in various types of spectroscopy.8,9 They are based on
selective excitation and simple multiplexing principles to efficiently focus observation on
known positions of spectral lines. Hadamard matrices provide a clean separation of the
signals that are selectively excited. For one-dimensional spectra, the Hadamard scheme
allows a great deal of flexibility in choosing which regions of the spectrum are excited and
which are not, suggesting, for example, a new method for water suppression. By eliminating
the need for the evolution dimension in multi-dimensional spectroscopy, the Hadamard
technique can significantly speed up data acquisition.
In the case of an HSQC spectrum in which one intends to monitor cross-peak
intensity as a function of time after dissolution in D2O, often the cross-peaks of interest, or
those exhibiting most rapid exchange rates, fall within a range of nitrogen frequencies. In this
case, it is more efficient to excite and observe these signals directly rather than executing a
periodic excitation scheme as is done in a typical 2D HSQC. It is also well known that
simultaneous observation of all signals in various combinations of sums and differences is
more efficient than observation of one signal at a time. Modern spectrometers are capable of
generating selective excitation schemes in these sum and difference patterns and the HT
provides a means of decoding the complex signals that result. Recently, there have been
several descriptions of pulse sequences following principles of Hadamard encoding.10-12 We
simply implement an HSQC sequence and specifically optimize it for amide exchange
applications.
28
2.2 A publication presenting NMR and MS combined methodology for monitoring H/D
exchange1
Nuclear magnetic resonance (NMR) has proven a useful tool for the structural
characterization of biomolecules, particularly when those molecules fail to form crystals
suitable for diffraction studies.13 The conventional NMR method for protein characterization
is limited to the size up to 40 kDa because of the near linear increase of NMR line widths
with molecular weight. Transverse Relaxation Optimized Spectroscopy (TROSY) methods
that capitalize on interference between dipolar interactions between 1H-15N spin pairs in
amide bonds of proteins and the inherent chemical shift anisotropy of the 1H and 15N sites
have changed this. Dramatic improvements in line widths for 1H-15N cross peaks in TROSY
versions of heteronuclear single quantum coherence (HSQC) spectra have now been
demonstrated for a large number of proteins.14 It is also true that one requires only 15N
isotopic labeling in this basic experiment, something that can be advantageous in studying
proteins that are difficult to express in isotopically-labeled forms. There is, therefore, good
reason to think about structure determination strategies that rely more heavily on the basic
1H-15N HSQC experiment. One problem that must be overcome in implementing new
strategies is assignment of cross peaks without the aid of the triple resonance experiments
normally used for resonance assignment. Here we develop a novel approach for protein
resonance assignment that relies on integration of NMR and Mass Spectrometry (MS)
methods. The approach relies on the fact that both NMR7,15-17 and MS4,18,19 are able to
monitor rates of exchange of amide protons for water deuterons.20 Correlating the rates can
connect cross-peak positions from NMR data with fragment masses from MS data to support
sequential assignment. The schematic illustration is shown in Figure 2.1. The example
provided here is to a small model protein, ubiquitin, but the potential for application to large,
more difficult to express proteins, is clearly demonstrated.
29
Two-dimensional HSQC spectra show a cross-peak at the intersection of 15N and
1H chemical shifts for each amino acid backbone site (except proline). These cross-peaks
can be used to extract amide exchange rates by monitoring loss of individual cross-peak
intensities as a function of time after dissolving a protein in a deuterated buffer. Rates of
exchange in typical proteins, at normal pHs, follow an EX2 mechanism in which base
catalyzed exchange of amide protons occurs occasionally from the open, solvent exposed,
forms that exist in equilibrium with normally well-folded forms of backbone segments.21 The
fraction of open form varies widely with local stability causing rates of amide proton
exchange to vary by over six orders of magnitude. This range provides a broad frequency
range for additional resolution of HSQC peaks.
Measurement of rates of amide proton exchange at the rapid end of the range is
normally limited by the length of time required to collect an HSQC spectrum. Recently, we
introduced some methodology based on Hadamard transform (HT) encoded NMR
spectroscopy12, 22 that reduces the total acquisition time to approximately 40 s for 0.5 mM
samples of small proteins. Here we have extended our original application to human
ubiquitin (1D3Z, 8547 Da) in order to provide a nearly complete assessment of amide proton
exchange rates for this well studied protein. These rates provide a basis for comparison to
selective rates measured by MS methodology.
14N unlabeled bovine ubiquitin was purchased from Sigma (St. Louis, MO) for
the MS studies, and the 15N labeled human ubiquitin was purchased from Cambridge Isotope
Laboratories (Andover, MA) for the NMR studies. While the species for these two
ubiquitins is different, the sequence is actually identical.
For the NMR studies a 0.5 mM human ubiquitin sample with 90% 15N labeling
was prepared in phosphate buffer at pH 6.0 and observed at 25 ˚C using an 800 MHz
spectrometer. Initially the sample was prepared in H2O, an 1H-15N HSQC reference spectrum
30
was run, and the sample was lyophilized. At time zero, the sample was dissolved in D2O
and transferred to the spectrometer for acquisition. Dissolution and transfer was done
manually, limiting the first observation point to approximately 1 minute. The spectra were
acquired at geometrically increasing time points from 1min to 48 hr. As in our previous
work23, 7 15N frequencies were selectively excited. However, these frequencies were chosen
to complement the original set, providing redundant data on at least two cross peaks for the
purpose of assessing reproducibility and providing many new pieces of information.
Figure 2.2a shows the HT NMR spectrum of ubiquitin in H2O collected with 64
scans for each of the 8 increments in the Hadamard encoding matrix. Figure 2.2b shows an
equivalent spectrum taken 1.37 min after the addition of D2O to the lyophilized protonated
sample using 4 scans at each frequency. The latter spectrum required 42 sec. Data
processing, including the Hadamard transform, was achieved using nmrPipe.24 12 out of the
35 peaks seen in Figure 2.2a have disappeared even at the first time point. However,
reductions in intensities of the other peaks are easily quantified. Executing a third set and
combining all data, the exchange rates of 68 out of 76 potential amide cross-peaks are
obtained. Among the eight amino acids missing, G47 and G75 are not covered by 15N
frequency selection; M1, E24 and G53 are not present in the HSQC spectra, probably due to
broadening from intermediate chemical exchange effects; and P19, P37 and P38 are prolines,
which don’t have amide protons. A complete table of exchange rates is supplied at the end
of this chapter.
31
Figure 2.2. Reconstructed Hadamard [1H, 15N]-HSQC spectra for ubiquitin. a. Data in H2O
collected with 64 t1 increments in 10 minutes. The sample was then lyophilized overnight
and brought back to its initial volume with 99.9% D2O at pH 6.0 and immediately returned to
the spectrometer for rapid collection of a series of Hadamard spectra. The positions of excited
15N frequencies are shown in red. (Residue I36 at 6.1 ppm, 123.4 ppm is not included in the
spectra.) b. First point after 1 min 22 sec in D2O collected with 4 scans in 42 sec.
MS measurements of H/D exchange proceeded in a similar fashion in that
ubiquitin (non-labeled bovine in this instance) was dissolved in deuterated buffer at time zero
and analysis conducted at roughly geometric intervals from 1 min to 44 hr. However, in this
case small aliquots were extracted and subjected to a more complex analysis that included
quenching of exchange by lowering pH and lowering temperature, digesting the protein with
pepsin and analyzing fragment masses by Matrix-Assisted Laser Desorption/Ionization –
Time of Flight (MALDI-TOF) MS. To begin the experiment, 10 μL of 20 mg/mL ubiquitin
in 50 mM phosphate buffer at pH 6.1 was dried in an Eppendorf tube and then at time zero
100 μL of D2O solution was added; the final pH was determined to be approximately 5.9. At
each time point, 5 μL was taken out and put in the upper part of a 20 μL aerosol tip, which
held 25 μL of a pepsin resin slurry from Pierce Chemicals (Rockford, IL) in 0.1% TFA
(ubiquitin: pepsin = 1:3). The sample was immediately quenched by the addition of 45 μL of
32
0˚C 0.1% TFA, pH 2.0. After mixing for 40 seconds at the room temperature, the sample was
ejected though the filter of the tip into an Eppendorf tube. Each sample was quickly spotted
on a chilled MALDI target, mixed with the matrix prepared as 5 mg/mL �-
cyano-4-hydroxycinnamic acid in a solution containing 1:1:1 acetonitrile, ethanol, and 0.1%
TFA (pH 2.0). The plate was immediately placed in a desiccator under a moderate vacuum
such that the spots would dry in 1-2 min. Masses were then analyzed by MALDI TOF/TOF
MS (Applied Biosystems 4700 Proteomics Analyzer). The H/D exchange experiments were
repeated three times; in addition, samples at each time point were spotted and measured in
triplicate. All results are averaged and reported along with the range of measurements as an
estimate of error.
A reference mass spectrum of ubiquitin in H2O was also analyzed using the same
procedure in order to allow a more automated peptide fragment identification. Accurate mass
measurements in combination with sequence analysis were used to identify the individual
peptides from ubiquitin generated by pepsin cleavage. The online databases used for peptic
peptide identification were MS-Digest (http://prospector.ucsf.edu/ucsfhtml4.0/msdigest.htm)
and PeptideMass (http://au.expasy.org/tools/peptide-mass.html). In addition, MS/MS ions
produced by MALDI-TOF/TOF and the results of a Mascot search
(http://www.matrix-science.com/) were used to verify fragment identification. The 20
identified peptic peptides (500-2000 Da) marginally cover 100 % of the entire ubiquitin
sequence. The sequences covered represent buried and surface segments, as well as every
type of secondary structure. However, it is clear that coverage could be improved by more
complete digestion and an ability to monitor shorter peptides masked by matrix peaks. The
latter is not a problem with electrospray ionization.
We focus here on five representative isotopic peptide peak clusters which have
calculated centroid masses of 1021.2 Da, 1096.0 Da, 1175.5 Da, 1346.7 Da and 1390.4 Da in
33
H2O. The centroid masses of the peptide fragments incubated in D2O begin near these
reference values and shift with time as indicated in Figure 2.3 for the fragment of 1390.4 Da.
The raw number of deuterons incorporated at each time point was determined by taking the
difference between the centroid of the isotopic peak cluster for the deuterated sample and the
centroid of the undeuterated control. These raw numbers must however, be corrected for
back-exchange that occurs during the quench, digestion, and MALDI steps in the procedure.
Levels can be estimated from the proton content observed at late time points, but more
accurate levels can be obtained by using a single scale factor as an adjustable parameter in
fitting time-courses predicted from NMR data. The percentage of back-exchange determined
in this way ranged from 25 to 50%, after excluding that part from rapidly exchanging side
chain protons and correcting for the 10% deuterium in the final quench/matrix mixture.
These levels of back-exchange compare favorably with levels reported in the literature.4,25
Figure 2.3. Time course of mass increase on deuterium incorporation. Lyophilized
ubiquitin was dissolved in D2O buffered with Na2HPO4 at pH 6.1 and incubated for varying
lengths of time at room temperature before quenching and digesting the sample. The mass
1388.0 1391.4 1394.8 1398.2 1401.6 1405.0
Mass (m/z)
1592.1
0102030405060708090
100
% In
tens
ity
4700 Reflector Spec #1[BP = 172.1, 81712]
1398
.212
3
1397
.203
4
1399
.215
9
1396
.198
5
1400
.225
7
1395
.187
4
1401
.232
2
1394
.183
5
1402
.251
8
1388.0 1391.4 1394.8 1398.2 1401.6 1405.0
Mass (m/z)
5214.2
020406080
100
% In
tens
ity
4700 Reflector Spec #1[BP = 172.1, 66338]
1393
.098
3
1394
.104
2
1392
.093
5
1395
.109
1
1391
.088
3
1396
.115
8
1397
.125
2
1390
.080
1
1398
.134
5
1388.0 1391.4 1394.8 1398.2 1401.6 1405.0
Mass (m/z)
2.8E+4
0102030405060708090
100
% In
tens
ity
4700 Reflector Spec #1[BP = 172.1, 83628]
1389
.776
1
1390
.777
5
1391
.781
0
1392
.783
3
1394
.904
1
c
b
a
34
spectrum shows the region around the peptide of average mass 1390.4 Da (Res.#46-58:
AGKQLEDGRTLSD). The undeuterated spectrum is shown in panel (a) as a reference.
Panels (b and c) are for exchange times of 1 min and 4 hr.
The time courses of exchange predicted from NMR data were calculated by
summing the contributions expected for each amino acid given the NMR determined rate
constants corrected for differences in pH. In practice, the deuteron contribution was set to 1
if the half-life of the amide H/D exchange was shorter than 1 min and to 0 if the half-life of
the amide H/D exchange was longer than 1 week (> 104 min). Otherwise the exchange rate of
each amino acid was used to calculate the contribution as 1-e-kt, where k is the amide proton
exchange rate and t is the time interval for exchange. Exchange rates where data are
missing (4 of 72 possible measurements) are estimated from literature values or are taken to
be averages of rates for preceding and succeeding residues.
Figure 2.4 shows predicted time courses for deuterium incorporation from NMR
data (solid lines) and superimposed experimental points from the MS data. The peptides
have been paired in two panels based on similarity of fragment masses. In Figure 2.4a data
are shown for peptides of mass, 1021.2 Da (Res.#68-76: HLVLRLRGG) and mass 1096.0 Da
(Res.#59-67: YNIQKESTL); both have 9 residues. The deuteron incorporation determined by
MS in both cases agrees reasonably well with the NMR model. In both fragments, the
number of deuterons plateaus at 8, the number of amide sites expected if the terminal NH3+
and side-chain amides are excluded. However, the different rates of mass increase correlate
with the different environments these peptides see in natively folded ubiquitin. About half
of the peptide of mass 1021.2 Da, is predicted to be a � strand, while the peptide of mass
1096.6 Da is predicted to have little regular secondary structure, hence its faster exchange.
In Figure 2.4b data are shown for peptides of mass, 1346.7 Da (Res.#59-69:
YNIQKESTLHL) and mass 1175.5 Da (Res.#5-15: VKTLTGKTITL); both have 11 residues.
35
Again, the agreement between MS experimental data and the NMR calculated model is good.
Since the peptide of mass 1175.5 Da has a very slowly exchanging amino acid, L15 (T1/2 >
1.91×10⁴ min), the apparent plateau point for these two peptides is 10 and 9 respectively.
The plot also shows different exchange rates for these two peptic fragments again reflecting
their different chemical environment and secondary structure in the native protein.
Figure 2.4. Correlation of deuterium incorporation from MS data (corrected for back
exchange) with levels predicted from NMR rate constants for two pairs of peptides from
ubiquitin: a) compares data for the 1021 Da peptide (Δ) and the 1096 Da peptide (◊); b)
compares the 1347 Da peptide (◊) and the 1176 Da peptide (Δ). The NMR model is
calculated using the equation D(t)=N-Σ exp(-kit) at pH 5.85.
Using exchange information such as that presented in Figure 2.4 in an assignment
strategy would require comparing MS exchange data with exchange predictions calculated
from NMR data on all strings of connected HSQC cross-peaks of appropriate length. In
Figure 2.5 we illustrate how a comparison can be done by using prior NMR assignments to
predict exchange data for all 11 residue segments in the protein sequence and comparing
those data to MS data for the 1175.5 Da peptide (Res.# 5-15). The comparison is done using
the equation, exp(-∑(Dexp.-Dcalc.)2/(N*�2)), where N stands for the number of data points, �
is the average estimated error in measurement, and Dexp. and Dcalc. are deuterium levels
0123456789
0 20 40 60
Time (hr)
Deu
turiu
m L
evel
b
0
2
4
6
8
10
12
0 20 40 60
Time (hr)
Deu
teriu
m L
evel
a
36
from experiment and calculation. The equation yields a score for each position. Sections
that appear to lack scores either have very low scores or correspond to sequences that would
be interrupted by prolines. The scores at positions 4-6 are highest producing an assignment
in agreement with expectation.
Figure 2.5. Sequential assignment scores for peptide 1175.5 of ubiquitin (Res.# 5-15). The
highest scores are seen near the proper placement position (4-6).
While in practice short segments of peptide can be connected in HSQC based
experiments through Nuclear Overhauser Effects (NOEs), these connections are not always
unambiguous and seldom run for more than a few residues. Clearly it would be better to
have MS data on very short peptides, or at least overlapping pairs of peptides so that
differences in exchange rates could be associated with single sites or segments of two to three
residues. We do have a pair of overlapping fragments in peptides of mass 1346.7 Da and
1096.0 Da. These differ in that the peptide of mass 1346.7 Da has two more residues, H and
L, at the end. Differences in levels of deuterium as a function of time for these two peptides
give the rates of deuterium incorporation for this terminal pair. The results show the
presence of two rapidly exchanging amides with half-lives of approximately 30 min.
Examining all of the NMR data on ubiquitin we find that approximately 14 out of a possible
72 pairs of connected HSQC cross peaks can fit this pattern, including the correct pair,
H68L69.
00.10.20.30.40.50.60.70.80.9
1
1 6 11 16 21 26 31 36 41 46 51 56 61 66
Residue Number
Scor
e
37
In summary, we have been able to demonstrate that correlation of amide
exchange rate data from NMR and MS experiments can provide novel additional data to aid
in assignment of cross-peaks in HSQC style spectra. The examples given here are limited in
number and pertain only to a small protein. However, experiments can clearly be improved.
Use of additional proteases can improve fragment coverage and provide smaller fragments.18
In addition, new instrument fragmentation techniques such as electron capture dissociation
(ECD), and electron transfer dissociation (ETD) might help to isolate deuterium
incorporation sites. Also, NMR/MS data can be combined with procedures such as amino
acid specific labeling26 to reduce the number of HSQC peaks in spectra of larger proteins to
the point where exchange rates can make useful distinctions. The most important point is
that a strategy based on these ideas can be applied using high-resolution TROSY versions of
HSQC spectra and can be applied to proteins labeled only with 15N.
Acknowledgment. This work was supported in part by the Research Resource for Integrated
Glycotechnology in the Complex Carbohydrate Research Center of the University of Georgia
under award number 10-21-RR549-191 by the National Institutes of Health.
a An error of 5% at rates near 1×10⁻³ is estimated from analysis of fits to decay curves
for V70 and an error of 10% at rates near 1 ×10⁻² is estimated from analysis of fits to decay
curves for R42.
b T1/2 is the half time for amide proton exchange, T1/2 = ln(2)/k.
c k is back calculated from the protection factors in the paper, Pan, Y.Q, Briggs, M. (1992)
Biochemistry 31, 11405-11412.
40
d Exchange rate constants measured at 800 MHz; all others at 600 MHz. 800 MHz data are
adjusted to pH=6.2 from 6.0.
41
2.3 References
1. Feng, L.M., Orlando, R. & Prestegard, J.H. Mass spectrometry assisted assignment of NMR resonances in N-15 labeled proteins. J. Am. Chem. Soc. 126, 14377-14379 (2004).
2. Sachdev, G.P. & Fruton, J.S. Secondary Enzyme-Substrate Interactions and Specificity of Pepsin. Biochemistry 9, 4465-& (1970).
3. Kriwacki, R.W., Wu, J., Siuzdak, G. & Wright, P.E. Probing protein/protein interactions with mass spectrometry and isotopic labeling: Analysis of the p21/Cdk2 complex. J. Am. Chem. Soc. 118, 5320-5321 (1996).
4. Mandell, J.G., Falick, A.M. & Komives, E.A. Measurement of amide hydrogen exchange by MALDI-TOF mass spectrometry. Analytical Chemistry 70, 3987-3995 (1998).
5. Cravello, L., Lascoux, D. & Forest, E. Use of different proteases working in acidic conditions to improve sequence coverage and resolution in hydrogen/deuterium exchange of large proteins. Rapid Communications in Mass Spectrometry 17, 2387-2393 (2003).
6. Englander, S.W. & Kallenbach, N.R. Hydrogen-Exchange and Structural Dynamics of Proteins and Nucleic-Acids. Quarterly Reviews of Biophysics 16, 521-655 (1983).
7. Andrec, M., Hill, R.B. & Prestegard, J.H. Amide Exchange-Rates in Escherichia-Coli Acyl Carrier Protein - Correlation with Protein-Structure and Dynamics. Protein Science 4, 983-993 (1995).
8. Harwit, M. Hadamard transform analytical systems. Transform Techniques in Chemistr, 173-197 (1978).
9. Wilkinsm, C.L. & Jurs, P.C. Fourier and Hadamard transforms in pattern recognition. Transform Techniques in Chemistry, 307-332 (1978).
10. Kupce, E. & Freeman, R. Two-dimensional Hadamard spectroscopy. Journal of Magnetic Resonance 162, 300-310 (2003).
11. Kupce, E. & Freeman, R. Frequency-domain Hadamard spectroscopy. Journal of Magnetic Resonance 162, 158-165 (2003).
12. Kupce, E. & Freeman, R. Fast multi-dimensional NMR of proteins. Journal of Biomolecular Nmr 25, 349-354 (2003).
13. Wuthrich, K. The way to NMR structures of proteins. Nature Structural Biology 8, 923-925 (2001).
14. Galvao-Botton, L.M.P. et al. High-throughput screening of structural proteomics targets using NMR. Febs Letters 552, 207-213 (2003).
15. Bai, Y.W., Milne, J.S., Mayne, L. & Englander, S.W. Primary Structure Effects on Peptide Group Hydrogen-Exchange. Proteins-Structure Function and Genetics 17, 75-86 (1993).
17. Dempsey, C.E. Hydrogen exchange in peptides and proteins using NMR-spectroscopy. Progress in Nuclear Magnetic Resonance Spectroscopy 39, 135-170 (2001).
18. Englander, J.J. et al. Protein structure change studied by hydrogen-deuterium exchange, functional labeling, and mass spectrometry. Proceedings of the National Academy of Sciences of the United States of America 100, 7057-7062 (2003).
19. Zhang, Z.Q. & Smith, D.L. Determination of Amide Hydrogen-Exchange by Mass-Spectrometry - a New Tool for Protein-Structure Elucidation. Protein Science 2, 522-531 (1993).
42
20. Zhang, Z.Q., Li, W.Q., Logan, T.M., Li, M. & Marshall, A.G. Human recombinant [C22A] FK506-binding protein amide hydrogen exchange rates from mass spectrometry match and extend those from NMR. Protein Science 6, 2203-2217 (1997).
21. Eagen, J.R. & Smith, D.L. Investigating protein structure and dynamics by hydrogen exchange MS. Analytical Chemistry 73, 256A-265A (2001).
22. Kupce, E. & Freeman, R. Fast multi-dimensional Hadamard spectroscopy. Journal of Magnetic Resonance 163, 56-63 (2003).
23. Bougault, C., Feng, L.M., Glushka, J., Kupce, E. & Prestegard, J.H. Quantitation of rapid proton-deuteron amide exchange using hadamard spectroscopy. Journal of Biomolecular Nmr 28, 385-390 (2004).
24. Delaglio, F. et al. Nmrpipe - a Multidimensional Spectral Processing System Based on Unix Pipes. Journal of Biomolecular Nmr 6, 277-293 (1995).
25. Ghaemmaghami, S., Fitzgerald, M.C. & Oas, T.G. A quantitative, high-throughput screen for protein stability. Proceedings of the National Academy of Sciences of the United States of America 97, 8296-8301 (2000).
26. Weigelt, J., Wilkstrom, M., Schultz, J. & van Dongen, M.J.P. Site-selective labeling strategies for screening by NMR. Combinatorial Chemistry & High Throughput Screening 5, 623-630 (2002).
43
CHAPTER 3
AMIDE PROTON BACK-EXCHANGE IN DEUTERATED PEPTIDES:
APPLICATION TO MS AND NMR ANALYSIS1
1Feng, L. M.; Orlando, R.; Prestegard, J. H. Submitted to Analytical Chemistry, May, 2005
44
Abstract
Deuterium for hydrogen (H/D) exchange at amide sites in proteins is a well
established means of probing the stability of certain proteins and the effects of interactions
with ligands and other proteins. When deuterium content is analyzed by mass spectrometry
(MS) of digested peptides, corrections frequently need to be made for back-exchange that
occurs during digestion, separation, and analysis. The back-exchange process is actually
complex and deserving of analysis in a sequence specific manner. Here an analysis of
back-exchange in the decapeptide, angiotensin I, and a hexapeptide derived by digestion of a
15N labeled carbohydrate-binding protein, galectin-3, is presented. Nuclear magnetic
resonance (NMR) data are used to study back-exchange at specific sites in typical solvents
used for separation and analysis, and the derived rates are found to be predictable using
methods established for aqueous solvents. The predictability provides potentially new
means of localizing deuterium content in MS analysis of deuterium content of peptides and
new means of assigning resonances used for NMR analysis of deuterium content in peptides.
45
3.1 Introduction
Rates of amide proton for amide deuteron exchange, as measured by either NMR
or MS methods, have been used to infer site-specific properties of proteins including,
structural stability, exposure to solvent, interaction with other proteins, and interaction with
ligands.1-3 NMR methods provided the first detailed analyses of these rates, and still excel
in ability to measure rates at specific sites.4-7 More recently, however, the superior
sensitivity of MS methods has brought this approach to the forefront.8-10 Despite wide
application, there are some limitations. First, deuterium incorporation is measured on
peptide fragments resulting in sensitivity to the sum of deuterium incorporation at all sites in
a peptide, as opposed to incorporation at discrete amino acid sites which results in a decrease
in specificity; and second, incorporation levels must be corrected for back-exchange that
occurs during digestion to produce the peptide fragments, or in preparation of fragments for
analysis. Since back-exchange rates differ dramatically from site to site and peptide to
peptide, these corrections cannot be made on a global basis, further complicating
interpretation of deuterium incorporation; at sites where back-exchange is very fast,
sensitivity to deuterium incorporation can be completely lost. These limitations have kept
interpretation of deuterium incorporation from MS studies at a very qualitative level. Here,
we discuss methods that can ameliorate the back-exchange problem and even turn it to an
advantage in some cases: first, we present NMR data documenting site specific variations
in exchange rates under conditions typically used for separation of digested peptides and
suggest that rates may be predictable from sequence; second, for NMR applications, we show
how these rates may be used to facilitate assignments of peptide resonances; and third, we
suggest how predictability of rates may allow more accurate back-exchange corrections of
MS data and even more site specific analysis of deuterium incorporation.
46
The origin of the back-exchange problem in MS analysis can be seen by
examining a typical protocol for analysis for deuterium incorporation in a protein. The
protein of interest is dissolved or diluted in a deuterated aqueous buffer in which protons at
amide and other exchangeable sites begin to exchange for deuterons from water. Aliquots
are removed periodically and amide exchange is quenched by reducing the pH to 2.5 with a
fully protonated acidic solution (usually 1% TFA) and lowering the temperature to 0 ºC.
Deuterons at more labile sites are quickly replaced with protons under these conditions,
reducing the deuterium background for subsequent analyses. The protein is then digested
with pepsin under low pH, low temperature, conditions, and peptides are analyzed for mass
shifts due to deuterium incorporation. Both matrix-assisted laser desorption ionization
(MALDI) and electrospray ionization (ESI) methods have been used in these analyses.
MALDI methods offer the possibility of simultaneous analysis of many peptides.11
Electrospray of HPLC eluent simplifies analysis by focusing on a few peptides at a time.8
The problem is that considerable back-exchange of amide deuterons occurs in either case
(10-50%).12 Some occurs during digestion even in the low pH, low temperature, buffer, but a
considerable amount can also occur during matrix preparation (for MALDI) and during
separation on HPLC using solvents such as acetonitrile/water/0.1% TFA.
Because back-exchange is considered to occur after the quench step during low
pH digestion and during subsequent preparation or separation, one might assume that
peptides are disordered with all the backbone amides completely exposed to the solvent. It
would be tempting to assume all amide protons exchange at similar rates under these
conditions, and that one back-exchange scaling factor could be used to convert measured
values to true measures of deuterium incorporation. It has, of course, been known for
some time that at least in aqueous media, amide proton exchange rates for different sites in
short peptides vary considerably. 13 years ago, Englander and Bai collected sufficient data
47
on a series of peptides in aqueous buffers to allow prediction of “intrinsic rates” for
disordered peptides in this medium.13 These data have become the basis of a convenient
web tool for prediction of intrinsic rates of amide exchange for any peptide at any
temperature and pH (http://hx2.med.upenn.edu/download.html). Rates, even at pH 2.5 and
0 ºC, are predicted to vary by more than two orders of magnitude from site to site in various
peptides.
There have been attempts to systematically correct for back exchange.14 One
common adjustment suggested by Zhang and Smith rests on collecting data on a pair of
control peptides, one fully protonated and one fully deuterated.8 When analyzed using
identical conditions for digestion and HPLC fractionation, the measured mass shifts can be
used to correct measurements on digested aliquots using a simple scaling factor. However,
the equation used for the scaling factor does assume equal exchange rates for different sites in
the peptide and, in principle, the scaling factor would have to be determined for each peptide.
Statistical analysis of 3000 peptides with random sequences and 5-25 peptide linkages
indicated that the average error in deuterium content would be only 5.5%,9 however, errors
for smaller peptides would clearly have to be large and would become a severe limitation in
attempts to localize exchange by producing smaller and smaller fragments.
The limitations arising from back-exchange can clearly be minimized through a
better understanding of the back-exchange process. At a minimum, rapidly exchanging sites
might be predicted and excluded from analysis. At a maximum, monitoring back-exchange
patterns can help assign deuterium content to specific sites. An understanding of the
back-exchange that occurs in MS analysis requires additional detailed monitoring of
site-specific exchange in model peptides in solvents used in MS analysis. NMR allows site
specific monitoring of amide proton exchange through the resolution of resonances from
individual amide proton resonances and the quantitative relationship of their intensity to
48
proton content. The nonapeptide, angiotensin I, and a fragment from the protein, galectin-3
are used to illustrate data that can be obtained. The data suggest that, with study of a
sufficient variety of peptides, a set of parameters analogous to those developed by Englander
and Bai for aqueous solution might be derived for typical HPLC separation solvents, and that
these parameters can be used to predict back-exchange rates.
Additionally, we show that predictable back-exchange rates can be used to make
assignments of amide proton resonances in peptides subjected to NMR analysis. Recently,
we suggested that a correlation of amide proton exchange rates measured in an intact protein
by NMR, and in peptides by MS, can be used to assign protein NMR resonances.15 The
method, however, requires fragmentation of peptides for MS analysis to the point that data on
overlapping peptides can be used to localize single sites of exchange. This is a challenging
problem on the MS side because of back-exchange variations in short peptides and because of
the technology needed to produce extensive fragmentation. However, there is the option of
returning peptides to the NMR spectrometer for analysis. This was dismissed early on
because of sensitivity concerns, but modern high-field spectrometers equipped with cold
probes and small-volume cells currently put analysis within reach. A condition of
application is that the amide proton resonances be assigned. While standard
two-dimensional correlation spectra allow such assignments, these procedures are not
practical for the quantities of peptides available. A simple assignment method based on
predicted back-exchange rates would make analysis by NMR practical. Below we give a
preliminary illustration of such an assignment for the Galectin-3 fragment; the fragment also
provides an additional test of back-exchange predictions.
49
3.2 Experimental
3.2.1 Preparation of angiotensin I Samples
Angiotensin I (DRVYIHPFHL) (AT1) was chosen as a model peptide for the
investigation of back-exchange rates. It was purchased from Sigma (St. Louis, MO) and
used without further purification. To establish the level of back-exchange experienced in
typical MS analyses, 65 μg of AT1 was dissolved in 50 μL of deuterium oxide (99.9%)
(Cambridge Isotope Laboratories, Andover, MA) at a concentration of approximately 1 mM
and allowed to equilibrate for 48 hr at room temperature to prepare a completely deuterated
peptide. Approximately 5 μL was added to 300 μL of 75% ACN, 25% H2O, 1 M acetic
acid (tests show this to be as effective as 1% TFA) at 8 ºC to begin a back-exchange
simulation. NMR samples were prepared by dissolving approximately 0.7 mg lyophilized
AT1 in 200 μL deuterated acetonitrile (CD3CN) and 300 μL 0.1% TFA in D2O at 5 ºC or
600 μL DMSO with 20 μL 1%TFA in D2O at 25ºC to carry out back-exchange
measurements. Deuteron for proton, as opposed to proton for deuteron, exchange was
conducted in this case to provide high sensitivity for short time points. Deuterium oxide
(99.9%) and Dimethyl sulfoxide-D6 (99.9%) were purchased from Cambridge Isotope
Laboratories (Andover, MA).
3.2.2 Preparation of Galectin-3 peptides
To simplify NMR analysis, galectin-3 (Gal3) was prepared with 15N isotopic
labels only in phenylalanine sites. E. Coli cells (BL21, DE3) transformed with a PET9a
vector coding the C-terminal domain of Gal3 were grown in 1 L M9 media with a supply of
100 mg each of unlabeled amino acids (14N) until optical density (OD) reached 0.8. 100 mg
of the 15N labeled form of phenylalanine was then added to the media, just before inducing
the cells with 1 mM IPTG. Cells were allowed to grow for an additional for 3 hr. The cells
were then harvested and lysed, and 15N specific labeled Gal3 was purified on a
50
lactosyl-argarose affinity column. The protein sample was concentrated and stored in 75 mM
phosphate buffer (pH 7.4). The yield of purified Gal3 protein was approximately 80 mg/L.
2 mg 15N phenylalanine labeled Gal3 (42 mg/mL, 50 μL) was digested using 1.7
mL immobilized pepsin at a pH of 2.65 (protein to enzyme ratio is 1:1) at room temperature
for 1 hr. Pepsin on cross-linked 6% agarose, 2-3 mg of pepsin/mL of gel, was obtained
from Pierce Chemicals (Rockford, IL). The peptic peptide solution was desalted on
MacroSpin columns from the Nest Group, Inc. (Southborough, MA). The desalted peptides
were re-dissolved in 2 μL 80% ACN+20% H2O with 0.1% formic acid (FA) followed by 78
μL 0.1 % FA in H2O. The sample was loaded onto a C18 reserve phase analytical column
(Jupiter 5 μ, 300 Å, size 250×4.60 mm from Phenomenex, Inc. (Torrance, CA)), and
separated on an 1100 binary pump HPLC system from Agilent Technologies, Inc. (Palo Alto,
CA ) at a flow rate of 1 mL/min, and then loaded in 95% buffer A (0.1% TFA in H2O) for 5
min, then eluted with a gradient of increasing buffer B (0.1% TFA in ACN) content (5% to
60% over 30 min). Most peptides eluted at 10-25 min; these were collected as discrete
fractions in 2 mL glass vials. The fractions were analyzed using an applied biosystems 4700
MALDI TOF/TOF mass spectrometer and the matrix compound,
α-cyano-4-hydroxycinnamic acid (Aldrich Chemicals, Milwaukee, WI). Identification of
peptides was accomplished using the search programs MASCOT (www.matrixscience.com)
or MS DIGEST (http://prospector.ucsf.edu/ucsfhtml4.0/msdigest.htm). A single peptide
containing two 15N labeled phenylalanines was eventually targeted. This peptide was
dissolved in DMSO or ACN/H2O as described for AT1.
3.2.3 Mass spectrometry analysis
MS analysis of deuterium exchange was conducted using an LTQ FT hybrid mass
spectrometer from Thermo Electron Corporation (Waltham, MA). Sample injection was by
direct infusion of AT1 in 75% ACN, 25% H2O, 1 M acetic acid to the electrospray source.
51
The fully deuterated AT1 sample, the quench solvent and the syringe pump system are
pre-cooled in a small portable refrigerator. To start the experiment, 5 μL 1 mg/mL AT1 is
mixed with 300 μL quench solvent at about 8 ºC and quickly loaded into the syringe pump.
The mixture is steadily sprayed into the electrospary source for about 2 min and then data
collection initiates. Continuous spectral recording with subsequent pooling and analysis of
time points mimics back-exchange at various lengths of times spent on the HPLC under
similar solvent conditions. The mass range acquired was 150-2000 Da. The triply charged
molecular ion corresponding to AT1, with monoisotopic mass of 432.90 Da, was monitored
for changes in the isotopic pattern for 1 hr.
3.2.4 NMR analysis
1D proton spectra were acquired on a 600 MHz Inova spectrometer from Varian
Inc. using a triple resonance probe. TOCSY and NOESY 2D homonuclear correlation
experiments were used to assign amide proton resonances to specific amino acids in the AT1
sequence. To mimic back-exchange reactions, protonated AT1 peptide was added to 20 μL
of 1 % TFA in D2O plus 600 μL deuterated DMSO or 300 μL of 0.1% TFA in D2O plus 200
μL CD3CN. After locking, tuning and shimming the magnet (13 min for the ACN/H2O
sample, 20 min for the DMSO sample), collection of 1D data started. Typically 64 scans
were acquired with a 0.67 sec repetition rate. For the ACN/H2O sample the acquisition
intervals are 13 min, 25 min, 55 min, 1.9 hr, 4.4 hr and 10.4 hr at 5 ºC. For the DMSO
sample, data are collected at 20 min, 40 min, 1.3 hr, 2.3 hr, 4.3 hr and 12.3 hr at 25 ºC.
Then a final point was collected after 18 hr.
For work on the HFNPRF peptide from Gal3, the HPLC fraction containing the
peptide was dried down, and re-dissolved in 500 μL deuterated DMSO and 15 μL 1% TFA in
H2O to prepare a sample that was approximately 40 μM in peptide. Reference spectra were
collected on this protonated sample using a Varian Inova 800 MHz spectrometer equipped
52
with a triple resonance, pulsed field gradient, cold probe. For observation of amide proton
resonances, 1D proton and 15N filtered NMR spectra were collected at 15 ºC. The
sequence used to collect the 15N filtered spectra was derived from a pulsed field gradient fast
HSQC sequence by eliminating the indirect evolution time.16 To initiate the amide H/D
exchange experiment the protonated peptide sample was lyophilized in the NMR tube. The
deuteration solvent was prepared using 500 μL dry deuterated DMSO and 15 μL 1% TFA in
high quality D2O. After the 800MHz NMR spectrometer was locked, tuned and shimmed at
15 ºC, the sample was quickly mixed with the pre-cooled solvent and put into the magnet.
After quickly checking the lock and shimming, data collection started at sequential time
intervals, of 7 min, 16 min, 30 min, 1 hr, 2 hr, 4 hr, and 20 hr using the 15N filtered gradient
fast HSQC sequence. While we will illustrate assignment of the 15N filtered peaks using
back-exchange rates, assignments using conventional 2D NMR experiments were also made
to provide validation. 2D watergate NOESY sequences from the Varian pulse sequence
library (wgnoesy) were used on the reference sample described above to establish sequential
connectivities. 2D watergate TOCSY (wgtocsy) sequences from the same library were used
to establish the amino acid type of sequentially connected residues. For assignment 30 μg of
the peptide HFNPRF from 15N F Gal3 was dissolved in 500 μL deuterated DMSO with 15 μL
1% TFA in H2O. The TOCSY experiment took 3.5 hr, and the NOESY experiment took 15
hr.
Similar procedures were used to collect exchange data in ACN/H2O. The
peptide was recycled from DMSO by lyophilization; it was protonated and redissolved in 200
μL CD3CN and 300 μL 0.1% TFA in H2O. Then, 1D proton and 15N filtered spectra were
collected at 5 ºC for reference. To mimic back-exchange, the sample was again lyophilized
in the NMR tube and deuteration initiated by addition of pre-cooled 200 μL CD3CN and 300
μL 0.1% TFA in D2O. After quickly checking lock and shimming, data collection started at
53
sequential times of 6.5 min, 10 min, 20 min, 40 min, 1 hr, and 8 hr using the same 15N filtered
gradient fast HSQC sequence.
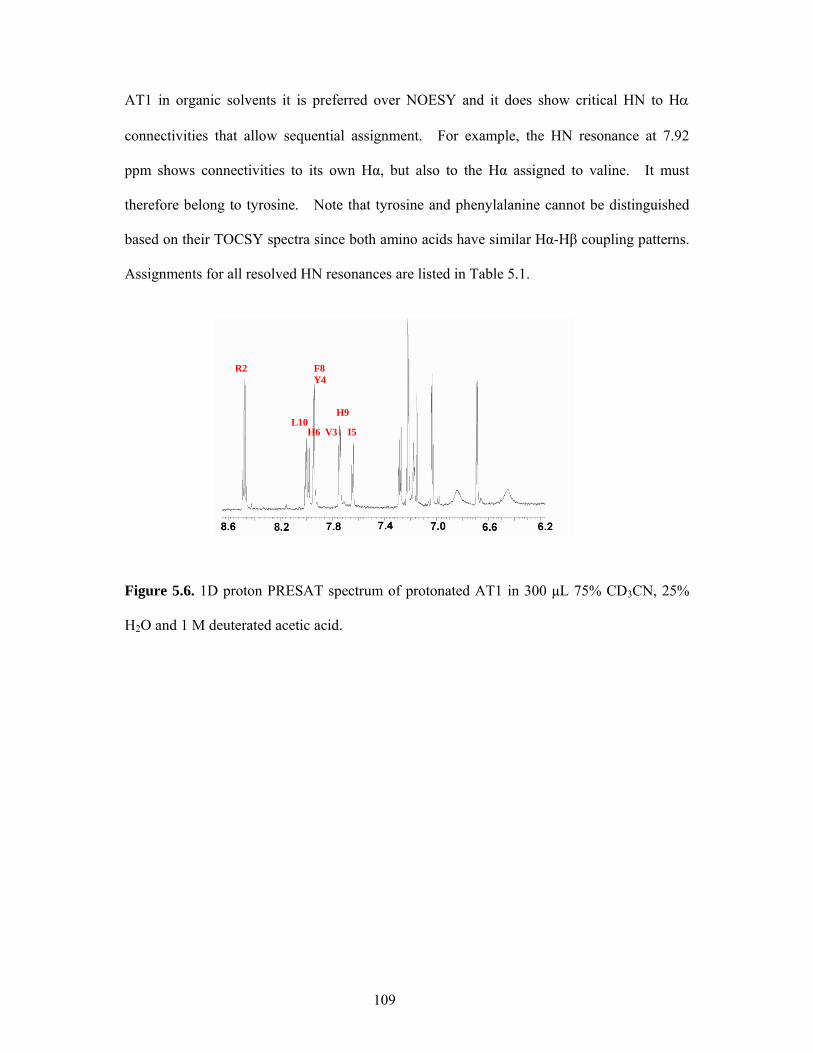
3.3 Results
3.3.1 Back-exchange in MS of deuterated AT1
Fully deuterated AT1 is used to illustrate the problems associated with back
exchange during a typical quench and MS analysis procedure. We focus on the portion of
the procedure that would be encountered during HPLC separation prior to electrospray MS
analysis. The enzyme digestion step could, in principle, be modeled using the data from
Englander and Bai if pepsin cleavage itself had little effect on exchange. AT1, sequence of
which is DRVYIHPFHL, has a monoisotopic mass (MH+) of 1296.7 Da, and has eight
exchangeable amide protons plus one on the arginine side chain; the rapidly exchanging N-
terminal NH3+ group is discounted and the proline amide does not carry a proton. AT1 also
has 9 additional rapidly exchanging sites in the side chains.17
Figure 3.1. Time course of mass decrease of fully deuterated AT1 in H2O. Fully deuterated
AT1 (5 μL) is dissolved in quench solvent, 300 μL 75% ACN and 25% H2O with 1 M acetic
acid for pH 2.65 at 8 ºC. The mass spectrum shows the region around the triple charged
54
parent ion of AT1 (monoisotopic mass 432.90 Da). The undeuterated spectrum is shown in
panel d as a reference. Panels a-c are for exchange times of 2.5 min, 10 min, and 62 min.
Figure 3.1 a-c shows typical isotopic profiles for the [M+H]+ ion of AT1 as a
function of the time AT1 has been exposed to quench buffer (75% ACN / 25% H2O / 1 M
acetic acid). The data for the first time point represents an average over the 0-1min time of
MS analysis, and data for subsequent time points represent similar averages. In panel d, the
centroid mass (433.18 Da) of the protonated AT1 spectral profile is shown as a reference.
In Figure 3.2, the data have been reduced to numbers of retained deuterons at amide sites
using the center of mass of each profile as a measure of average mass and correcting for
residual deuterium from the solvent at rapidly exchanging sites (6% based on dilution). The
time points are displaced by 2 min to allow for the 2 min preparation period. Only a total of
3 deuterons are retained at 2.5 min suggesting quite rapid exchange. If all sites exchanged
with the same rate, the time course in Figure 3.2 could be fit with a single exponential. The
best fit (dotted line) is given by D = 6.44×exp(-3.05×t) + 1.02, but it clearly does not fit
the data. The best two exponential fit is given by D = 0.38 + 5.09×exp(-27371.42×t) +
1.99 ×exp(-0.06×t), which clearly has a better fit. The weights assigned to the two rates
in the latter expression would suggest 5 rapidly exchanging sites and 3 slowly exchanging
sites. Since there are so few points on the rapid portion of the curve, the origin of the rapid
exchange could originate with a greatly enhanced exchange of all sites during the actual
injection and electrospray process, or it could be the result of several discrete sites in AT1
that have large inherent exchange rate constants. In either case, back exchange is a severe
problem that deserves more attention.
55
Figure 3.2. Deuterium content as a function of time for deuterated AT1 in H2O. The dotted
exponential curve shows the best fit single exponential and the solid curve shows the best fit
bi-exponential rate curve.
3.3.2 H/D exchange rates of AT1 from NMR
NMR offers an ability to monitor H/D exchange without many of the
uncertainties in the conditions of exchange for electrospray MS. For convenience,
replacement of protons with deuterons is monitored, rather than the reverse. This leads to a
progressive decrease in intensity of amide proton resonances as protons are replaced with
deuterons. Corrections for differences in pH vs. pD and isotope effects on rates would have
to be made, but these will be insignificant at the level of trying to understand differences in
constants in the bi-exponential fit described above.
1D proton NMR spectra as a function of time after dissolution of 0.7 mg AT1 in
200 μL CD3CN / 300 μL 0.1% TFA in D2O is shown in Figure 3.3. Peak assignment of all
eight amide protons has been accomplished by a combination of 2D TOCSY and NOESY
experiments. It is clear that the backbone amide for arginine is exchanged well before the
first time point could be acquired. Based on intensity loss in overlapping peaks either L or
H6, as well as either phenylalanine or H9, could be exchanged before the first time point.
Time (min)0 20 40 60
Deu
tero
n le
vel
0
2
4
6
8
10
56
Figure 3.3. H/D exchange of AT1 in ACN/H2O monitored by 1D proton NMR.
Observation starts by redissolving 0.7 mg lyophilized AT1 in 200 μL CD3CN and 300 μL
0.1% TFA in D2O at 5 ºC. Peaks are labeled by one letter codes for amino acids with
vertical positions of labels roughly indicating the half life of each amide resonance.
Surprisingly, the exchange rates at individual amino acid sites are very different.
The peak volumes can be integrated and fit into an exponential decay curve (I=I0×exp(-kt) +
C) where I and I0 are the signal intensity of protonated and partially deuterated amide peaks
at each time point (t), and the k values are experimental exchange rate constants. Derived
exchange rates for all amides except N-terminal aspartic acid and proline are shown in Table
3.1. The second amino acid, arginine, is exchanging very fast, whereas other amide protons
are exchanging at observable rates with half-lives less than or equal to 4 hr.
A similar exchange process can be monitored in DMSO by dissolving a
protonated peptide in DMSO containing 3.3% D2O / 1% TFA. The absence of proton
donors in DMSO and ability to work with lower percentages of water greatly slows
exchange, and the spectral dispersion is better. Figure 3.4 presents a series of 1D spectra
obtained after adding 20 μL D2O / 1% TFA to 0.7 mg of AT1 in 600 μL DMSO. Relative
rates of disappearance are similar, but improved resolution allows identification of arginine,
13min
25min
55min
1.9hr
4.4hr
10.4hr
57
leucine, and histidine-6 as the more rapidly exchanging sites. The experimental exchange
rates are listed in Table 3.1. These do vary by more than an order of magnitude from site to
site. These variations could partially account for the bi-exponential character of the
back-exchange in MS data.
Figure 3.4. H/D exchange of AT1 in DMSO monitored by 1D proton NMR. Observation
starts by redissolving 0.7 mg lyophilized AT1 in 600 μL DMSO with 20 μL 1%TFA in D2O
at 25 ºC. Peaks are labeled by one letter codes for amino acids with vertical positions of
labels roughly indicating the half life of each amide resonance.
3.3.3 H/D exchange rates of a Gal3 peptic peptide from NMR
Assignment of amide resonances in proteins, and in peptides derived from those
proteins, can be facilitated by labeling with specific amino acids enriched in 15N. For
peptides, sequences can be identified by MS analysis, and only the resonances belonging to
the labeled amino acid need be identified. In peptides containing only a single instance of
the labeled amino acid, filtering of 1D proton spectra by passing magnetization through a
scalar coupled 15N clearly identifies the corresponding amide proton resonance. The first
point of a 2D HSQC experiment corresponds to such a filtered spectrum. One persistent
problem remains arises in a case where a peptide contains multiple instances of the labeled
40 min
1.3 hr
2.3 hr
4.3 hr
12.3 hr
18.3 hr
20 min
58
amino acid. Here we explore whether differences in exchange rates for identical amino
acids could be sufficient to assign them based on predicted variations in rates. A peptic
peptide from the galactose-binding lectin, Gal3, is used to explore this possibility.
The labeling of specific amino acids can be verified by collection of 2D 15N-1H
HSQC spectra providing cross peaks are assigned. Assignments for peaks in the HSQC
spectrum of Gal3 exist,18 and spectra from the protein expressed in cells grown on 15N
phenylalanine are shown in Figure 3.5. Growth in the presence of a particular isotopically
labeled amino acid does not assure that the label remains only in the original amino acid.
However, metabolic scrambling can be reduced by adding unlabeled forms of the other amino
acids; this was done in the case of Gal3 expression. Phenylalanines in Gal3 proved to be
about 40% 15N labeled and scrambling to other amino acids proved to be minimal.
Nevertheless, a few additional labeled sites, assigned primarily to aspartic acid, were
observable.
Figure 3.5. HSQC spectrum of 15N phenylalanine labeled Gal3.
Digestion of 15N phenylalanine labeled Gal3 was accomplished using
immobilized pepsin at a 1:1 protein to enzyme ratio. Digestion was allowed to proceed for
an extended period (1 hr) at room temperature to maximize the amount of peptide recovered.
The supernatant containing peptides was then loaded onto a C18 HPLC column and peptides
59
eluted with a H2O / ACN gradient. Figure 3.6 presents the HPLC elution profile and MS
data characterizing a particularly interesting peptide. It corresponds to residues 158 to 163
of the protein and has the sequence, HFNPRF. This particular peptide has two
phenylalanines, both of which are labeled to 40% based on the MS isotopic profile. A total
of 30 μg was isolated from a digestion of 2 mg protein, by collecting the same fraction from
two successive HPLC injections.
Figure 3.6. Isolation of the HFNPRF peptide from Gal3. The upper panel is the HPLC
chromatograph showing peptic peptide separation of 15N F labeled Gal3. The identification of
fraction 17, circled, is verified by MS as shown in the lower panel.
Figure 3.7 shows a 1D proton spectrum along with a 15N filtered spectrum of the
isolated HFNPRF peptide. The two 15N labeled phenylalanines give two signals in the 1D
15N fast HSQC spectrum as expected. To provide for validation of a possible assignment
based on amide exchange rates, 2D TOCSY and NOESY experiments were collected (data
not shown). Using the inter-residue NOESY cross peaks to α protons, the resonance at 8.68
ppm (residue i) shows connection with an α proton of asparagine (residue i-1) and the
resonance at 7.90 ppm (residue i) shows connection with an α proton of arginine (residue
560 688 816 944 1072 1200Mass (m/z)
1.4E+4
0102030405060708090
100
% In
tens
ity
4700 Reflector Spec #1[BP = 818.3, 13952]
818.
3008
840.
2715
862.
2475
M+H+ M+Na+
M+K+
60
i+1). Hence the resonance at 8.68 ppm is assigned to F159 and the resonance at 7.90 ppm is
assigned to F163.
Figure 3.7. 1D proton and 15N filtered HSQC NMR spectra of the HFNPRF peptide from 15N
F Gal3.
Figure 3.8 presents the time course of amide proton to amide deuteron exchange
on dissolving 30 μg of lyophilized peptide in 200 μL deuterated CD3CN and 300 μL 0.1%
TFA in D2O at 5 °C and monitoring exchange with 15N-filtered 1D spectra. F159 exchanges
too fast to be observed at the first time point (6.5 min), and F163 exchanges slower with the
peak disappearing after 3-4 hr. The data were processed using heavy Gaussian weighting
functions to keep peak widths roughly the same, and peak heights were used to represent
intensities at different time points. Exponential curve fitting of intensity versus time plots
gave an exchange rate of 0.66 hr-1 for F163. The exchange rate for F159 was estimated to
be greater than 20 hr-1.
F163 F159
61
F159
F163
Figure 3.8. H/D exchange of peptide HFNPRF using 15N filtered NMR data in ACN/D2O.
The experiment starts by dissolving lyophilized fraction 17 in 200 μL deuterated CD3CN and
300 μL 0.1% TFA in D2O at 5 ºC. The vertical positions of labels roughly indicate the half
lives of the two phenylalanine resonances.
Similar data for H/D exchange in DMSO / H2O is presented in Figure 3.9. The
overall rates are slower, but F159 at 8.80 ppm exchanges faster than F163 at 8.10 ppm. F159
loses total signal at about 2 hr, while F163 retains some signal at 20 hr. The exchange rates
obtained from exponential fits of the data are 1.64 and 0.10 hr-1 corresponding to half-lives of
0.42 and 7.0 hr. In both solvent systems rates for the two phenylalanines differ by more
than an order of magnitude, in spite of the fact that they belong to the same amino acid type.
This raises the prospect of making assignments by correlating rates with those predicted from
sequence.
4 hr
1.5 hr
1 hr
20 min
10 min
6.5 min
62
Figure 3.9. H/D exchange of peptide HFNPRF using 15N filtered NMR data in ACN/D2O.
Exchange starts by redissolving lyophilized fraction 17 in 500 μL DMSO and 15 μL 0.1%
TFA in D2O at 15 ºC. The vertical positions of labels roughly indicate the half-lives of the
two phenylalanine resonances.
3.4 Discussion
It is not surprising that amide proton exchange rates vary substantially from site
to site even in short peptides. This was established long ago in the work by Englander and
Bai.13 Rates of exchange for each amide proton in an unstructured peptide are described
by “intrinsic” rate constants (kint) that depend on the concentrations of available catalysts
(OH-, H3O+, water, and acidic or basic solutes) as well as catalyst specific constants that
depend on the inductive, catalytic, and steric effects of both the amino acid of interest and its
adjacent residues. For aqueous solvents, specific rate constants have been collected for
various peptide sequences and dependencies on pH and temperature incorporated into a
convenient web-based tool for prediction of intrinsic rates (http://hx2.med.upenn.edu
/download.html).
Clearly, prediction of rates under solvent conditions used for the MS analysis and
the NMR analysis presented above would be of considerable value. In the MS case, it
7 min
12 hr
4 hr
1 hr
30 min
16 min F16F159
F163
63
would at least allow identification of sites back-exchanging so fast that they could not be
used to report on processes such as protein-protein interaction or ligand binding. It might
also allow assignment of deuterium content to specific sets of sites by deconvolution of
multi-exponential back exchange processes. For NMR we might be able to assign
resonances based on back-exchange rates. Currently we can easily tabulate predicted rates
for AT1 and our Gal3 peptide using the web-based tool of Englander and Bai.13 However,
the extent to which predictions designed for aqueous solution might hold for the very
different solvent systems used in MS analysis and the NMR studies presented above is less
certain. To explore possible applicability we have taken the simple step of assuming that
predicted rates will scale with percentage of water in the mixed solvent systems.
For the DMSO system the scaling factor is 31, calculated by dividing 620 μL
DMSO/H2O solution by the 20 μL aqueous proportion. The scaling factor for the ACN/H2O
system is 1.67, which is calculated by dividing the 500 μL ACN/H2O solvent by the 300 μL
aqueous proportion. The results are presented in columns three and five of Table 3.1. The
relative rates are in good agreement for most of the amino acids in both solvent systems.
The only cases where disagreement with measured values exceeds a factor of three are the
C-terminal residues in the ACN/H2O solvent (we also cannot make quantitative comparisons
for the very rapidly exchanging cases). The level of agreement suggests use of existing
prediction tools may be suitable when differences approach an order of magnitude. The
possibility of developing parameters sets more appropriate for prediction in the solvents used
in peptide studies also exists.
As an illustration of possible application in analysis of back-exchange correction
to MS data, we consider our deuterium content data on AT1. We estimated that a total of 5
amide protons back-exchange rapidly in solvents used in typical HPLC separation prior to
electrospray ionization of peptides. According to NMR data in Table 3.1, three of the sites
64
(R2, H6 and H9) exchange fast enough to contribute to the decay associated with the first
exponential. These are also predicted to exchange fast using the scaled Englander and Bai
formulas. The remaining two deuterons lost may be associated with enhanced exchange
across all sites during injection or the electrospray process. As a result, it would be safe to
say the retained deuterons should not be associated with the three rapidly back-exchanging
sites. It also appears that back exchange rates studied by NMR can be used to make
assignments of amide proton resonances in peptides. The case presented for the HFNPRF
peptide of Gal3 shows a difference of more than an order of magnitude in back-exchange rate
for the two phenylalanine residues with the resonance at 8.68 ppm in ACN/H2O exchanging
faster than the resonance at 7.90 ppm. Based on predictions, F159 should exchange more
than an order of magnitude faster than F163 in either DMSO/H2O or ACN/H2O solvent
systems. Hence we would assign the resonance at 8.68 ppm to F159 and the resonance at
7.90 ppm to F163. This is in agreement with assignments determined using conventional
2D NOESY and TOCSY experiments. Assignment based on back-exchange is important
when small amounts of material are available. The quantities used in Figures 3.8 and 3.9
were approximately 30 μg of peptide and acquisition times for a single time point were as
little as 23 min (or a little over two hours for a six point time course). The TOCSY and
NOESY experiments required 3.5 hr and 15 hr on 30 μg of material ─ almost ten times as
long. Moreover, the time course of back-exchange might be collected in any event to
allow extrapolation back to the actual time of protein digestion where the measure of
deuterium content is actually needed.
Currently there are relatively few cases where assignments for amide proton
resonances of small quantities of peptides are needed. However, we have made a case for
assignment of HSQC resonances of intact proteins by correlating amide proton exchange
rates measured for the intact protein with deuterium content of isolated peptides. The vision
65
was to analyze deuterium content by MS, but this can also be done by NMR, providing amide
resonances for small quantities of digested peptides can be assigned. Here we have used
Gal3, a modest sized protein as a test system and demonstrated that adequate amounts of
peptide can be obtained. The real targets would be larger proteins and proteins not easily
labeled in ways that allow uniform isotopic enrichment and adoption of a conventional
assignment strategy. Proteins that must be expressed in mammalian cell culture fall in this
class. These are amenable to specific amino acid labeling at reasonable cost, and the facile
assignment of labeled peptides described here could become a part of HSQC assignment
strategies for the intact protein. While specific amino acid labeling may return a limited
amount of structural data, it may be enough to facilitate computational prediction of protein
structure, or allow exploration of protein-protein and protein-ligand interaction in cases
where protein structures are known.
3.5 Conclusion
Hence, we have found that back exchange rates of amide protons in unstructured
peptides vary considerably with sequence. However, these rates appear to be predictable,
and predictions can be extremely valuable in improving the specificity of analysis by mass
spectrometry and in assigning resonances for NMR applications.
Acknowledgement. This work was supported by a grant from the National Institutes of
Health’s National Center for Research Resources, RR005351. We thank Dr. Han-Seung
Lee for his assistance in the preparation of the 15N-labeled Galectin-3 sample.
66
Table 3.1. Comparison of experimental exchange rate constants and predicted intrinsic rate
constants for AT1 and the peptic peptide of 15N F Gal3.
No. Res. kex(exp.)a (hr-1) kint(cal.)a’ (hr-1) kex(exp.)b (hr-1) kint(cal.)b’ (hr-1) 1 D -- -- -- -- 2 R >2.439 67.02 >3.000 36.73 3 V 0.225 0.38 0.087 0.14 4 Y 0.719 0.72 0.313 0.25 5 I 0.373 0.23 0.155 0.09 6 H 0.554 1.39 0.784 0.73 7 P -- -- -- -- 8 F 0.636 0.70 0.090 0.24 9 H 1.197 2.67 0.693 1.42 10 L 0.554 0.30 0.784 0.09 1 H -- -- -- -- 2 F >21.320 55.89 1.640 10.16 3 N 1.52 0.26 4 P -- -- -- -- 5 R 0.73 0.11 6 F 0.660 0.51 0.100 0.07
a) kex(exp.) is the experimental exchange rate constant calculated from peak decay of
amide proton signals in the ACN/H2O system. The upper part includes the rates for AT1, the
lower part includes the rates for the peptic peptide of 15N F Gal3.
a’) kint(cal.) is the rate constant calculated at pH 2.5 and 5°C using the spreadsheet
available at http://hx2.med.upenn.edu/download.html. Constants are scaled down by a
factor of 1.67 due to the volume fraction of H2O in the ACN/H2O solvent.
b) kex(exp.) is the experimental exchange rate constant calculated from peak decay of
amide proton signals in the DMSO system. The upper part includes the rates for AT1, the
lower part includes the rates for the peptic peptide of 15N F Gal3.
b’) kint (cal.) is the rate constant calculated at pH 2.5, 25°C for AT1 and at pH 2.5 15°C for
peptide HFNPRF using the spreadsheet available at http://hx2.med.upenn.edu/download.html.
67
Constants are scaled down by a factor of 31 due to the volume fraction of H2O in the DMSO
solvent.
68
3.6 References
1. Hvidt, A.; Linderstromlang, K. Biochimica Et Biophysica Acta 1954, 14, 574-575. 2. Englande, S. W.; Downer, N. W.; Teitelba.H Annual Review of Biochemistry 1972,
41, 903-&. 3. Englander, S. W.; Kallenbach, N. R. Quarterly Reviews of Biophysics 1983, 16,
521-655. 4. Englander, S. W.; Mayne, L. Annual Review of Biophysics and Biomolecular
Structure 1992, 21, 243-265. 5. Dempsey, C. E. Progress in Nuclear Magnetic Resonance Spectroscopy 2001, 39,
Biology 2000, 7, 220-223. 7. Paterson, Y.; Englander, S. W.; Roder, H. Science 1990, 249, 755-759. 8. Zhang, Z. Q.; Smith, D. L. Protein Science 1993, 2, 522-531. 9. Smith, D. L.; Deng, Y. Z.; Zhang, Z. Q. Journal of Mass Spectrometry 1997, 32,
135-146. 10. Miranker, A.; Robinson, C. V.; Radford, S. E.; Aplin, R. T.; Dobson, C. M. Science
1993, 262, 896-900. 11. Mandell, J. G.; Falick, A. M.; Komives, E. A. Proceedings of the National Academy
of Sciences of the United States of America 1998, 95, 14705-14710. 12. Wang, L. T.; Pan, H.; Smith, D. L. Molecular & Cellular Proteomics 2002, 1,
132-138. 13. Bai, Y. W.; Milne, J. S.; Mayne, L.; Englander, S. W. Proteins-Structure Function and
Genetics 1993, 17, 75-86. 14. Kheterpal, I.; Wetzel, R.; Cook, K. D. Protein Science 2003, 12, 635-643. 15. Feng, L. M.; Orlando, R.; Prestegard, J. H. Journal of the American Chemical Society
2004, 126, 14377-14379. 16. Mori, S.; Abeygunawardana, C.; Johnson, M. O.; Vanzijl, P. C. M. Journal of
Magnetic Resonance Series B 1995, 108, 94-98. 17. Hotchko, M.; Anand, G. S.; Komives, E. A.; Ten Eyck, L. F. Protein Science 2006,
15, 583-601. 18. Umemoto, K.; Leffler, H. Journal of Biomolecular NMR 2001, 20, 91-92.
69
CHAPTER 4
RESONANCE ASSIGNMENTS FOR PROTEINS LABELED
WITH 15N AMINO ACIDS1
1Feng, L. M.; Lee, H. S.; Prestegard, J. H. To be submitted to Nature Methods.
70
Abstract
Here we present a novel method for nuclear magnetic resonance (NMR) resonance
assignments, especially for large proteins with post-translation modification. This approach
only requires sparse 15N labeling on one or a small set of amino acids, which is applicable for
proteins not accessible uniformly labeling or multiple labeling in mammalian cells. It is based
on correlation of amide proton for deuteron exchange measured from 15N-1H cross peak
intensity in 2D NMR spectrum of an intact protein with deuterium content in digested
peptides measured by 1D NMR experiments. Galectin-3 (Gal3), a 15.6 kDa protein, is used to
test the feasibility of this strategy. F163 in one particular peptide of Gal3, HFNPRF, is
definitively assigned to the corresponding cross peak in the heteronuclear single quantum
coherence (HSQC) spectrum. The result indicates the promising application on larger
proteins with more biological significance.
71
4.1 Introduction
Labeling with single or small subsets of amino acids enriched in 15N has a
number of advantages when dealing with large proteins or proteins that are not easily
expressed in bacterial hosts. For large proteins, the number of resonances is significantly
reduced and the assignment problem is, in principle, simplified by restricting assignments to
specific amino acid types. For proteins that are difficult to express in bacterial hosts,
because of toxicity, the need for glycosylation, or the need for folding chaperones, labeling
with isotopically enriched amino acids allows use of alternative expression methods,
including cell-free expression1, 2, expression in insect cells3, and expression in mammalian
cells4,5. While there have been some examples of using a complement of amino acids
sufficient to achieve uniform labeling6-9, costs for most systems are prohibitive, and use of
selected amino acids is more common. Use of selected amino acids, however, deprives us
of the usual triple resonance approach to resonance assignment. While some assignment
strategies based on the use of sets of structural data, such as RDCs, pseudo-contact shifts, and
paramagnetic perturbations of spin relaxation, have been proposed, these are usually
dependent on the prior existence of three dimensional structures10. This leaves a real need
for new assignment strategies compatible with sparse isotopic labeling of structurally
uncharacterized proteins. Here we present a method that can accomplish this. It is based
on correlation of amide proton for deuteron exchange measured from cross peak intensity in
HSQC spectra of an intact protein, with deuterium content in digested peptides measured by
NMR, but sequentially assigned by mass spectrometry.
We had proposed a similar method earlier that relied on correlating exchange data
coming from NMR on an intact protein with exchange data and sequence data coming from
mass spectrometry on digested peptides11. Amide proton for deuteron exchange in the intact
protein was measured from the time course of disappearance of HSQC cross peaks after
72
dissolution or dilution of a fully protonated protein in a deuterated buffer. Rates of
exchange vary enormously from site to site in folded proteins (seconds to months), making it
possible to distinguish 20 or more cross peaks even if rates can be determined only to within
a factor of two. We demonstrated an ability to span the necessary exchange rate spectrum
for NMR observation using a combination of conventional HSQC methodology and fast
acquisition methodology such as Hadamard spectroscopy12. For mass spectrometry
observation of peptides, aliquots of protein were removed during the process of exchange,
exchange was quenched by lowering the pH and dropping the temperature to 0 °C, and the
protein was digested with pepsin. The deuterium content was then analyzed using mass
shifts of the various peptides. While successful correlations could be made at the whole
peptide level, assignment of individual HSQC peaks would require identification of a
sufficient number of overlapping peptides to allow assignment of differences in mass shifts to
a single site. Producing this number of peptides proved very difficult.
Here we bring the digested peptides back to NMR for analysis. This approach was
initially dismissed due to sensitivity limitations. The quantity of digested peptide that can
be conveniently produced and isolated on an HPLC column is in the 10 μg range. This is a
small quantity for NMR observation. Moreover, observation must be completed before
back-exchange of deuterons for protons in the HPLC solvent occurs to a significant extent.
However, advances in NMR instrumentation, including cold probes, micro coils, and high
fields, have caused us to reconsider the approach. Given that data acquisition proves
possible, NMR has the advantage of providing, even in simple 1D proton spectra, discrete
resonances for most amide sites. Intensities in spectra of aliquots pulled at various times are
quantitatively related to the residual proton content, and hence, to rates of exchange.
Providing resonances can be assigned to a particular amino acid, a one to one correlation with
HSQC cross peaks of the intact protein can, in principle, be achieved.
73
Assignment of resonances in 1D spectrum of peptides would be possible using
combinations of TOCSY spectra to identify amino acid types and NOESY spectra to identify
sequential connectivity. However, in the applications we envision single (or small sets of)
amino acid types will be 15N labeled in the isolated peptides. 15N filtering, as occurs in the
initial elements of an HSQC experiment, can identify amide proton resonances belonging to
the 15N labeled amino acids in far less time. Difficulties only arise in cases where more
than one amino acid of a particular type occurs in an isolated peptide. Here, we have used a
novel assignment strategy that relies on correlation of back-exchange rates with sequence
dependent intrinsic rate predictions. Back exchange rates can easily be measured by
acquiring a few 15N-filtered spectra sequentially in time while a peptide from a particular
aliquot is under observation. This would be done in any event to allow projection of
deuterium content measurements back to the time at which an exchanging aliquot of the
protein was removed for pepsin digestion and HPLC separation.
The entire procedure outlined above was applied to a test case involving the
carbohydrate-binding protein, Galectin-3 (Gal3). Gal3 is a protein that we have worked on
in the past. It has a high quality crystal structure, and a near-complete set of backbone
resonance assignments13. The existence of the assignments allows us to validate
assignments made by the new procedure. We will 15N label Gal3 by expression in an E. coli
host in the presence of 15N labeled phenylalanine. Proton for deuteron exchange rates are
measured in the intact protein using Hadamard NMR methods. The protein is then digested
and peptides isolated so that deuterium content of amide sites in these peptides can be
analyzed by 15N-filtered 1D analysis. One particular peptide that contains a pair of
phenylalanines is selected as an example in the application presented. This is the HFNPRF
peptide comprising residues 158 to 163 of the protein. The pair of phenylalanines allows
illustration of assignment based on back-exchange. We are able to get an accurate
74
correlation of exchange measured from intact protein and from peptides for one of these
assigned phenylalanines and make a definitive assignment of the corresponding peak in the
HSQC spectrum of the protein. This illustration, while restricted to a single site, sets an
important precedent for more extensive application to proteins that are large or difficult to
label by conventional means.
4.2 Experimental
4.2.1 Protein expression and preparation
Single amino acid labeling in E. coli is not routine because of the ability of the
organism to make and interconvert amino acids. However, several authors have developed
procedures to minimize these complications14,15. Here we minimize the scrambling of label
to other amino acids by adding unlabeled forms of the other amino acids before adding 15N
labeled phenylalanine during IPTG induction. The protein sample was concentrated and
stored in 75 mM phosphate buffer (pH 7.4). The yield of purified Gal3 protein was
approximately 40 mg/L. The labeling efficiency of protein expression was verified by
analyzing the 2D HSQC spectrum and isotopic pattern in MS peaks. Phenylalanines were
labeled in 15N to approximately 98% and the primary scrambling was to aspardic acid at
about 25% or less.
4.2.2 Exchange rates of 15N F labeled Gal3 by 2D Hadamard encoded HSQC
All spectra were collected on a Varian 800 MHz spectrometer equipped with a triple
resonance cold probe. Initially a ~ 0.2 mM protonated protein sample in 500 μL 300 mM
lactose and 75 mM phosphate buffer (pH 7.4) was used to collect a survey spectrum for
locating 15N excitation frequencies for Hadamard 15N-1H 2D spectroscopy. Hadamard
spectroscopy provided an efficient means of collection of 2D data when the number of
resonances to be observed was small and the peak positions are known16-18. Eight 15N
excitation frequencies (list in ppm) with a bandwidth as 50 Hz were chosen and found to
75
cover most 15N peaks of interest. A reference Hadamard spectrum on the fully protonated
sample was collect with 64 scans and 8 t1 increments using a t2 spectra width of 10000 Hz
centered at 4.76 ppm on H2O. The total acquisition time was 10 min 40 sec.
To observe H/D exchange of the protein, the same sample was lyophilized overnight
the NMR tube and at time zero 500 μL 99.9% D2O at pH 7.8 was added to redissolve the
protein. The tube was quickly returned to the spectrometer with parameters set identically
to those of the reference spectrum. After checking the lock, shimming and tuning a series of
Hadamard spectra was collected. The data, at the first time point (5 min after dissolution)
was collected with 8 scans, requiring 1 min 24 sec for acquisition of the first time point.
Subsequent spectra were acquired at geometrically increasing time points from 5 min to 24 hr.
Spectra were processed and reconstructed using nmrPipe and scripts
(http://spin.niddk.nih.gov/NMRPipe/). The peaks were integrated in each Hadamard
spectrum to determine the volume for each time point. The volume vs. time was plotted and
the data was fitted to exponential decay based on Monte-Carlo trials within nmrPipe. Then
the exchange rate constant, kex was calculated for each individual amino acid based on the
slope of the curve.
4.2.3 Exchange rates from the deuterium content of HFNPRF peptides
12 mg Gal3 labeled with 15N F was dissolved in 360 μL phosphate buffer, dried
down and redissolved in 360 μL 99.9% pure D2O. At time intervals of 2 min, 4 hr, 18 hr and
4 days, triplicate 30 μL aliquots, each containing about 1mg partially deuterated 15N F Gal3,
were withdrawn and frozen in liquid nitrogen. Aliquots were then individually thawed and
quickly combined with immobilized pepsin beads from 0.86 mL slurry after being washed by
0.1% TFA in H2O (Gal3 to pepsin mol ratio approximately is 1:1). Meanwhile 120 μL 0.1%
TFA in H2O was added to lower the pH to 2.5 at 0 ºC. The pepsin on cross-linked 6%
agarose, 2-3 mg of pepsin/mL of gel, was obtained from Pierce Chemicals (Rockford, IL).
76
The sample was shaken for 10 min gently on an orbital shaker to improve the surface
interaction between protein and pepsin beads. The peptic peptides were then quickly filtered
using a 0.2 μM membrane disk and again frozen in liquid nitrogen. The degree of digestion
and peptic peptide identification was checked by MALDI-TOF and determined to have less
than 10% fragments of mass greater than 2000 Da.
Peptides were separated on a C18 reverse phase column (DELTA PAK 3.9×300
mm) using an Agilent 1100 HPLC binuary pump system and G1314 variable wavelength UV
detector from Agilent Technologies, Inc. (Palo Alto, CA). The column, elution buffers, and
manual sample injector (model 7725i from Rheodyne LLC, Rohnert Park, CA) were
pre-cooled in an ice bath or with the use of cooling packs. After obtaining a stable baseline
running the loading buffer (90% buffer A (0.1% TFA in H2O) and 10% buffer B (0.1% TFA in
acetonitrile (ACN))) at 1 mL/min, a frozen peptide mixture was thawed and quickly injected
through the six-valve injector at the flow rate of 1 mL/min. The sample was then eluted with
a gradient of increasing buffer B content from 10% to 60% over 25 min. Peptides, most of
which eluted in the 10-25 min range, were collected as discrete fractions in 2 mL glass vials.
2 μL aliquot was removed from the first sample and saved for MS analysis to identify
peptides. The fractions were then quickly frozen in liquid nitrogen and stored in a -80 ºC
freezer.
Mass spectrometry analysis was on the initial sample was done using MALDI
method on each collected fraction. The fractions were analyzed using an Applied
Biosystems 4700 MALDI TOF/TOF mass spectrometer (Foster City, CA) and the MALDI
matrix solution, which was α-cyano-4-hydroxycinnamic acid (Aldrich Chemicals, Milwaukee,
WI) saturated in 50% H2O and 50% ACN with 1% TFA. 1 μL sample and 1 μL matrix
solvent was dried on the 100-well MALDI target and sent to the spectrometer. The laser
power setting was about 4000 and the m/z range was about 560-4000 Da. Identification of
77
peptides was accomplished using a database search (MASCOT (www.matrixscience.com) or
MS DIGEST (http://prospector.ucsf.edu/ucsfhtml4.0/msdigest.htm)). This allowed correlation
of elution times with specific peptides. The HFNPRF peptide eluting at 12 min was selected
for the in depth analysis presented in this pilot study.
The Varian Inova 800 MHz NMR spectrometer (Palo Alto, CA), equipped with a
triple resonance cold probe and pulsed field gradient unit, was used for NMR analysis of
deuterium content in peptides. It was locked, shimmed and tuned on a protonated sample of
the HFNPRF peptide in HPLC elution solvent at 0 ºC. The sequence used to collect the 15N
filtered 1H spectra was derived from a pulsed field gradient HSQC sequence (Varian Protein
Biopack library, Nhsqct2h). This sequence used a selective pulse to only observe the amide
region, largely suppressing H2O and ACN peaks. We collected only the data corresponding to
the first t1 time point (zero t1 evolution time). The fraction containing mainly the peptide,
HFNPRF, was thawed quickly and loaded into a 5 mm NMR tube along with 100 μL
deuterated acetonitrile (CD3CN) for lock and shimming. Parameters used for data acquisition
on the HFNPRF peptide obtained from the aliquot corresponding to 15N F Gal3 H/D
exchanged for 4 days were typical of those used on other samples. The first time point on this
sample started at 16 min, and took 11 min 40 sec more to finish, collecting 512 transients
with a spectra width of 8000 Hz. Additional spectra were collected at 1 hr, 2 hr, 4 hr, 8 hr,
and 12 hr to allow determination of a back-exchange rate and correction of deuterium content
to zero time. These additional back-exchange time points were collected with 2048
transients to provide better signal to noise.
Since limited by incomplete pepsin digestion and HPLC column capacity, the signal
to noise ratio of the 1D 15N filtered NMR spectra are not ideal. The solution is to repeat three
times for each time interval and add three independent free inductive decays (FID) together.
Therefore, the signal will add up and noise will be cancelled. In detail, each individual
78
spectrum was processed using only line broadening (lb=10) to keep peak width roughly the
same. H2O and ACN solvent were better suppressed to improve the baseline by set digital
filter parameters (ssfilter=50, ssntaps=71). Then the FIDs of three repeats were added up by
the VNMR program (VNMR 6.1 B, User Guide: Liquids NMR). In order to exclude the noise
interference for the quantitative analysis, deconvolution of observed spectra into individual
Lorentzian lines by VNMR software was pursued. Peaks corresponding to the amide proton
resonances for the two phenylalanines were integrated at each back-exchange time point and
back-exchange rates were obtained by fitting integrals as a function of time to exponential
rising curve using the program SigmaPlot 8.0.
4.2.4 Control for back exchange during HPLC separation
In principle, the back-exchange rates determined above can be used to not only
extrapolate deuterium to the beginning of NMR data acquisition, but to the time of HPLC
injection. The solvent conditions in the HPLC are nearly identical for much of the
separation time, and attempts were made to keep the temperature near 0 °C. However, it is
impossible to anticipate effects of the column packing and our inability to precisely control
temperature. Hence, examination of a control sample is appropriate. 20 μg of the peptide
HFNPRF used above was recycled and allowed to deuterate at exchangeable sites in 100 μL
D2O at 30 ºC for 12 hr (this produces a fully deuterated sample). The sample was re-injected
in the pre-cooled HPLC as described above, captured in a 2 mL volume at 12 min, and frozen
in liquid nitrogen. The proton signal rise due to back exchange in ACN/H2O at 0 ºC was
monitored following the NMR procedure described above at 30 min, 1 hr, 2 hr, 4 hr, 6 hr, 8 hr,
10 hr. A back-exchange rate was determined as described above and extrapolation to the
time of HPLC injection was attempted. The content did not extrapolate to the expected 0%
proton, but to a level of 30% proton. This suggested that back-exchange rates were
enhanced during HPLC separation tremendously. This factor was used in correcting other
79
data for time spent in HPLC separation.
4.3 Results
4.3.1 15N phenylalanine specific labeling on Gal3
Figure 4.1 shows the 2D HSQC NMR spectrum of the Galectin-3 carbohydrate
binding domain (CRD) produced by expression in E. coli using an excess of 15N
phenylalanine along with unlabeled supplements of 19 other amino acids. The cross-peaks in
this spectrum have been previously assigned119 and the assignments of the most intense peaks
are labeled in purple on the figure. There are eight phenylalanines in the CRD and there are
eight intense cross peaks. All of these correspond to peaks that had previously been assigned
to phenylalanines. There are, however, a number of weak peaks in green with intensities
25% or less of those for the phenylalanines based on the peak volume comparison. The
majority of these are assigned to aspartic acids.
Figure 4.1. 2D HSQC spectrum of 15N F labeled Gal3. The labels in purple are 8
phenylalanines in Gal3. The labels in green are the amino acids labeled as a result of 15N F
label scrambling.
The level of isotopic labeling for the phenylalanines can be ascertained from
isotope profiles in MS data on derived peptides. Figure 4.2 shows a profile for the HFNPRF
80
peptide. Matching the isotopic profile to those predicted by ISOTOPICA
(http://coco.protein.osaka-u.ac.jp/Isotopica/) suggests the labeling level to be approximately
40%. Higher levels of specific labeling can be achieved using a number of methods1-5.
However, the level produced here is adequate for our purposes. It illustrates the spectral
simplification afforded by specific amino acid labeling, sensitivity in 15N filtered spectra will
be adequate with 40% enrichment, and the number of major cross peaks is within limits set
for assignment based on exchange rate differences.
Figure 4.2. Isotopic pattern analysis of peptide HFNPRF of 15N F labeled Gal3 by MS. a) the
predicted isotopic distribution of the peptide at natural abundance by the program
ISOTOPICA, http://coco.protein.osaka-u.ac.jp/Isotopica/. b) The predicted isotopic
distribution of the peptide with two phenylalanines 40% 15N labeled. c) Enlarged MS
spectrum of the peptide.
4.3.2 Amide H/D exchange on 15N F Gal3 monitored by 2D Hadamard Transform (HT)
encoded HSQC spectra
Figure 4.3 shows examples of HSQC spectra collected at various times after
816 817 818 819 820 821Mass (m/z)
3583.
0102030405060708090
100
% In
tens
ity
4700 Reflector Spec #1[BP = 818.2, 3583]
818.
2401
819.
2380
817.
2407
820.
2416
a
b
c
81
dissolution of Gal3 in deuterated buffer. Figure 4.3a is on a fully protonated sample and
serves to depict the state at time zero. The seven 15N excititation frequencies chosen for this
spectrum cover 7 out of the 8 phenylalanines. F192, whose chemical shift on 1H dimension is
5.810 ppm, is not included in the enlarged version of the 2D Hadamard spectrum. Data
acquisition with a second set of frequencies on another sample with 15N uniformly labeling
provide duplicate information on several sites as well as exchange data for the one missing
phenylalanine site, F159. After 22 min (Figure 4.3b) it is clear that the cross-peak F190 has
totally disappeared making this among the most rapidly exchanging sites. After 24 hr
(Figure 4.3c) it is clear that additional sites begin to exchange, showing a wide range of
exchange rates.
Figure 4.3. Reconstructed HT 15N-1H HSQC spectra for 15N F Gal3. a) Data in H2O collected
with 64 t1 increments in 10 min 40 sec. b) Data after 22 min in D2O collected with 64 scans.
c) Data after 24 hr in D2O collected with 2048 scans. F192 is not shown in this enlarged
spectrum region.
Cross-peaks in spectra such as those in Figure 4.3 can be integrated. I(t) was
normalized to the scaled peak intensities in the first spectrum, and plotted as a function of
time. Decay rate constants were extracted from these time courses. The decay rates were
clearly exponential and fit well to Equation 4.1. The constant is approximately 0.05 in all
cases and corresponds to 5% residual H2O in the solution.
I(t) = I0(exp(−kext) + const. Eq. 4.1.
a b c
82
Table 4.1. reports measured exchange rates, kex, ranging from approximately larger
than 7.7 × 10⁻¹ min−1 to less than 3.66 × 10⁻⁵ min−1 for 15N F Gal3 at pH 7.8 (pD = pHread
+ 0.4). The corresponding half times ranged from less than 0.9 min to more than 13 days.
For cases where redundant data were collected, both measurements have been listed in Table
4.1. The rates are assigned to specific sites in the protein based on previous assignments
using triple resonance experiments on this protein19. Of course, if this were a new structural
target, these assignments would not exist. Below we illustrate an assignment procedures
based on rate correlations that could be applied in these cases.
4.3.3 Amide H/D exchange from deuterium incorporation in the HFNPRF peptide
monitored by 1D 15N filtered spectra
Rates of amide exchange for specific sites in the folded protein can be correlated
with sequence information if the deuterium content of peptides derived from the protein can
be measured. In order to capture the deuterium content of protein sites at various time
points during exchange, digestion with pepsin, and separation of peptides by HPLC for
various aliquots, were carried out quickly at low temperature (0°C) and low pH (2.5).
Digestion required approximately 10 min and HPLC separation required approximately 13
min. An example of HPLC separation using an ACN/H2O/TFA gradient is shown in Figure
4.4. A digest of approximately 0.5 mg of Gal3 peptides was injected since half of the
protein was not digested at low temperature fast enough. The peak corresponding to the
HFNPRF peptide is the most intense one eluting at 12 min. This peak contains about 16 μg
of the peptide HFNPRF. This peptide was identified using the mass spectrum shown in the
lower panel and correlation of exact masses with data from the MASCOT database. The
HFNPRF fraction is relatively pure as shown by the low abundance of other peptides.
However, contamination by other peptides is not problematic as long as they do not generate
overlapping 15N-filtered amide peaks. The collected fractions were frozen in liquid nitrogen
83
and stored for subsequent NMR analysis. The actual separation was preformed with three
different aliquots at each time point to allow triplicate data acquisitions to be combined for
final analysis of deuterium content.
Figure 4.4. Isolation of the HFNPRF peptide from 15N F Gal3. The upper panel is the
HPLC chromatograph of peptic peptides from 15N F Gal3. The fraction containing HFNPRF
is circled. Identification is established by MS as shown in the lower panel.
Ideally, peptides could be produced, separated, and data acquired with sufficient
speed to provide a true measure of deuterium content at the time of sampling. However, this
proves to be impossible. The next best thing is to monitor the time course of back-exchange
under conditions approximating those used for digestion and separation, and use these data to
extrapolate back to the time of sampling. Figure 4.5 shows a typical time course for back
exchange using the 4 day aliquot from folded Gal3 deuterium exchange. The peak at 7.98
ppm is an artifact which appears to arise as a mirror image due to strong solvent peak of H2O
and ACN. However, the peaks at 8.51 ppm and 7.73 ppm corresponding to amide proton
resonances from the two phenylalanines in the HFNPRF peptide are applied to indicate the
560 748 936 1124 1312 1500Mass (m/z)
6.7E
020406080
100
% In
tens
ity
4700 Reflector Spec #1[BP = 818.3, 67158]
818.
3621
84
deuteron incorporation tendency. Their back-exchange rates are very different. The peak at
7.73 ppm appears to have full proton intensity at the first back-exchange time point with little
variation in intensity occurring over 12 hr. Its back-exchange rate is clearly very fast. The
peak at 8.51 ppm back-exchanges more slowly, starting with reduced intensity and more than
doubling its intensity over 12 hr.
16min
1hr
2hr
4hr
8hr
12hr
16min
1hr
2hr
4hr
8hr
12hr
Figure 4.5. H/D exchange of peptide HFNPRF using 15N filtered NMR data. The experiment
starts by thawing 500 μL of the frozen aliquot in a 5 mm NMR tube with 100 μL deuterated
CD3CN at 0 ºC.
The rates of back-exchange turn out to be useful for purposes other than
extrapolation back to the point of initial sampling. They can be used to make assignments
of the two phenylalanines in the HFNPRF peptide20. The strategy is based on the fact that
F159 F163
85
rates of amide exchange are predictable given a peptide sequence, even if the solvents are
mixed aqueous-organic solvents. The rate for F159 is predicted to be nearly two orders of
magnitude faster than F163. Hence, we assign the 7.73 ppm resonance to the F159 amide
and the resonance at 8.51 ppm to the F163 amide. For this first application of this
assignment strategy, the assignment was confirmed using a combination of proton NOESY
and TOCSY data. The F163 amide resonance shows a distinct connectivity to an alpha
proton that has been assigned to an arginine residue from the TOCSY pattern. The
sequential occurrence of these residues in the peptide independently supports the assignment.
In principle, rates derived from data such as that presented in Figure 4.5 can be used
to more accurately extrapolate deuterium content to the time of aliquot removal. Figure 4.6
shows plots of back-exchange for aliquots at 2min, 4hr, 18hr and 4 days. The resonance at
7.73 ppm is at full magnitude from the very beginning for all four aliquots. This prevents
any quantitative analysis of back-exchange and any attempt to deduce deuterium content at
the time of sampling. However, the back-exchange rate for the resonance at 8.51 ppm is
slower and extrapolations can be made. The back exchange of this residue at four different
time points and levels of deuteration has been fit to the exponential function given in
Equation 4.2.
H(t) = H0 + A×(1-exp(kext)) Eq. 4.2.
H(t) gives the proton level retained at time t; H0 is the value at the time zero that we desire,
and kex is the exchange rate. When Gal3 exchanges in D2O for 4 hr, 18 hr and 4 days, the
number of deuteron incorporated into the protein increases. Due to some variation in
solvent composition, back exchange rates vary slightly and were therefore fit individually.
The rates for the 4 hr, 18 hr and 4 day aliquots are 0.0040 min-1, 0.0016 min-1, and 0.0029
min-1 respectively. The intercept of each figure gives the proton level at the time the sample
was put into the magnet. Here we use the data of the HFNPRF peptide of 4 day aliquot as an
86
example again shown in Figure 4.6 d). After normalization to the recorded full intensity in
each case, the intercepts for the 2 min, 4 hr, 18 hr, and 4 day aliquots were 1.0, 0.66, 0.50 and
0.45 respectively. The 4 day point for the slower exchanging site in this particular peptide
should be completely deuterated. About 45% proton level was the result of additional
exchange that occurred during the digestion and HPLC separation.
Figure 4.6. Peak heights of F159 (▼) and F163 (●) amide resonances as a function of
back exchange times. a) 2 min aliquot. b) 4 hr aliquot; c) 18 hr aliquot; d) 4 day aliquot.
To quantify back exchange during the HPLC step, a fully deuterated peptide
HFNPRF was prepared and subjected to HPLC separation for 12 min and the back exchange
Time (min)
0 50 100 150 200 250 300
Pea
k he
ight
(cm
)
0
20
40
60
80
100
Time (min)
0 100 200 300 400 500 600
Pea
k he
ight
(cm
)
0
20
40
60
80
100
120
140
160
Time (min)
0 100 200 300 400 500 600
Pea
k he
ight
(cm
)
0
10
20
30
40
50
60
70
Time (min)
0 200 400 600 800
Peak
hei
ght (
cm)
0
20
40
60
80
100
120
140
160
180
a b
c d
87
rate as above. The intercept for the 8.51 ppm response shows the back exchange as high as
30% during the HPLC step. This is considerably higher than expected for the 12 min run and
suggests that better cooling of the HPLC or possibly use of different column material might
improve data collection in the future. The remaining 15% loss during digestion is more
acceptable, but might also be improved. For the current analysis, the apparent deviation of
deuterium content from 100% in the long time point (4 days) can be used to correct for
inadvertent exchange in the earlier steps. The deuteron level for the 2 min, 4 hr, 18 hr, and 4
day aliquots after back exchange correction were 1.0, 0.41, 0.13 and 0.05, respectively. The
corrected data as a function of time is plotted in Figure 4.7. The data is best fit to the
exponential decay curve of Equation 4.3.
H(t) =0.8153×exp(-0.0018×t) Eq. 4.3.
H(t) stands for the proton level retained at the sequential time interval t. The exchange rate is
0.0018 min-1, and the half life is 385 min. This rate is listed in the last column of Table 1
also for comparison to data obtained on the folded protein by Hadamard HSQC spectroscopy.
Time (min)0 1000 2000 3000 4000 5000 6000 7000
prot
on le
vel
0.0
0.2
0.4
0.6
0.8
1.0
1.2
Figure 4.7. Corrected proton level vs. time for F163 of the peptide HFNPRF.
88
4.4 Discussion
4.4.1 Correlate exchange rates of 15N F Gal3 from 2D Hadamard HSQC with 3D protein
structure
The data in Table 4.1 clearly illustrate an ability to assign resonances based on
correlation of amide proton exchange rates measured from Hadamard-HSQC spectra on the
intact protein and from 1D spectra on derived peptides that can be sequentially placed based
on mass spectrometry data. There is actually quite a wide distribution of rates for different
cross-peaks in the HSQC spectrum. These rates range from greater than 7.7 × 10⁻¹ min−1
to less than 3.65 × 10⁻⁵ min−1. The exchange rate determined for the more slowly
exchanging phenylalanine of the HFNPRF peptide matches that for peak assigned to F163
within 10%. No other rate matches within a factor of 7. Had the cross-peak of F163 not
been previously assigned, we could have assigned it on the basis of amide proton exchange
rate correlations.
In reality, we are often facing larger protein systems with post-translation
modification, which are difficult to study by routine NMR methods and crystallography. The
particular example presented here is ST6Gal1, which has suitable size for NMR study but no
a. Additional data is repeatedly collected on 15N uniformly labeled Gal3 and adjusted to pH
7.8 at 25 ºC.
94
4.5 References
1. Klammt, C., Loehr, F., Schaefer, B., Doetsch, V. & Bernhard, F. Cell-free production and specific labeling of the multi-drug transporter TehA, a new approach for the structural evaluation of integral membrane proteins. Faseb J. 18, C170-C170 (2004).
2. Klammt, C. et al. High level cell-free expression and specific labeling of integral membrane proteins. Eur. J. Biochem. 271, 568-580 (2004).
3. Strauss, A. et al. Amino-acid-type selective isotope labeling of proteins expressed in Baculovirus-infected insect cells useful for NMR studies. J. Biomol. NMR 26, 367-372 (2003).
4. Klein-Seetharaman, J. et al. Solution NMR spectroscopy of [alpha-N-15]lysine-labeled rhodopsin: The single peak observed in both conventional and TROSY-type HSQC spectra is ascribed to Lys-339 in the carboxyl-terminal peptide sequence. Proc. Natl. Acad. Sci. U. S. A. 99, 3452-3457 (2002).
5. Eilers, M., Reeves, P.J., Ying, W.W., Khorana, H.G. & Smith, S.O. Magic angle spinning NMR of the protonated retinylidene Schiff base nitrogen in rhodopsin: Expression of N-15-lysine- and C-13-glycine-labeled opsin in a stable cell line. Proc. Natl. Acad. Sci. U. S. A. 96, 487-492 (1999).
6. Ozawa, K. et al. Optimization of an Escherichia coli system for cell-free synthesis of selectively N-15-labelled proteins for rapid analysis by NMR spectroscopy. Eur. J. Biochem. 271, 4084-4093 (2004).
7. Strauss, A. et al. Efficient uniform isotope labeling of Abl kinase expressed in Baculovirus-infected insect cells. J. Biomol. NMR 31, 343-349 (2005).
8. Vinarov, D.A. et al. Cell-free protein production and labeling protocol for NMR-based structural proteomics. Nature Methods 1, 149-153 (2004).
9. Kainosho, M. et al. Optimal isotope labelling for NMR protein structure determinations. Nature 440, 52-57 (2006).
10. Pintacuda, G. et al. Fast structure-based assignment of N-15 HSQC spectra of selectively N-15-labeled paramagnetic proteins. J. Am. Chem. Soc. 126, 2963-2970 (2004).
11. Feng, L.M., Orlando, R. & Prestegard, J.H. Mass spectrometry assisted assignment of NMR resonances in N-15 labeled proteins. J. Am. Chem. Soc. 126, 14377-14379 (2004).
12. Bougault, C., Feng, L.M., Glushka, J., Kupce, E. & Prestegard, J.H. Quantitation of rapid proton-deuteron amide exchange using hadamard spectroscopy. J. Biomol. NMR 28, 385-390 (2004).
13. Umemoto, K., Leffler, H., Venot, A., Valafar, H. & Prestegard, J.H. Conformational differences in liganded and unliganded states of Galectin-3. Biochemistry 42, 3688-3695 (2003).
14. Fiaux, J., Bertelsen, E.B., Horwich, A.L. & Wuthrich, K. Uniform and residue-specific N-15-labeling of proteins on a highly deuterated background. J. Biomol. NMR 29, 289-297 (2004).
15. Torizawa, T., Shimizu, M., Taoka, M., Miyano, H. & Kainosho, M. Efficient production of isotopically labeled proteins by cell-free synthesis: A practical protocol. J. Biomol. NMR 30, 311-325 (2004).
16. Kupce, E. & Freeman, R. Fast multi-dimensional Hadamard spectroscopy. J. Magn. Reson. 163, 56-63 (2003).
17. Kupce, E. & Freeman, R. Two-dimensional Hadamard spectroscopy. J. Magn. Reson. 162, 300-310 (2003).
18. Kupce, E., Nishida, T. & Freeman, R. Hadamard NMR spectroscopy. Prog. Nucl.
95
Magn. Reson. Spectrosc. 42, 95-122 (2003). 19. Umemoto, K. & Leffler, H. Letter to the Editor: Assignment of H-1, N-15 and C-13
resonances of the carbohydrate recognition domain of human galectin-3. J. Biomol. NMR 20, 91-92 (2001).
20. Feng, L.M., Orlando, R. & Prestegard, J.H. Amide proton back-exchange in deuterated peptides: Applications to MS and NMR analyses. Anal, Chem. (2006). Submitted
21. Wang, F. et al. Fourier transform ion cyclotron resonance mass spectrometric detection of small Ca2+-induced conformational changes in the regulatory domain of human cardiac troponin C. J. Am. Soc. Mass Spectrom. 10, 703-710 (1999).
22. Eroglu, S., Friedman, G. & Magin, R.L. Estimate of losses and signal-to-noise ratio in, planar inductive micro-coil detectors used for NMR. IEEE Trans. Magn. 37, 2787-2789 (2001).
23. Brey, W.W. et al. Design, construction, and validation of a 1-mm triple-resonance high-temperature-superconducting probe for NMR. J. Magn. Reson. 179, 290-293 (2006).
25. Rosay, M. et al. High-frequency dynamic nuclear polarization in MAS spectra of membrane and soluble proteins. J. Am. Chem. Soc. 125, 13626-13627 (2003).
96
CHAPTER 5
H/D EXCHANGE BY ECD– ASSESSMENT OF SCRAMBLING DURING ANALYSIS1
1Feng, L. M.; Orlando, R.; Prestegard, J. H. To be submitted to Journal of the American Society for Mass Spectrometry.
97
Abstract
As an additional approach to measurement of hydrogen-deuterium amide
exchange in proteins and derived peptides, electron capture dissociation-Fourier transform
ion cyclotron resonance mass spectrometry (ECD-FTICR-MS) is explored as a means of
improving site specificity. This technique provides ultra high mass resolution and the option
of in-spectrometer fragmentation. Most in-spectrometer methods of fragmentation result in
extensive scrambling of deuterons at amide sites. However, the free radical cleavage on
which ECD fragmentation is based is thought to minimize this. Here the proton/deuteron
scrambling issue for ECD is explored by comparing H/D exchange MS data to NMR data.
Based on a preliminary study of angiotensin I (AT1), the levels of deuteration at different
amino acids as determined by ECD FTMS qualitatively correlate with levels predicted from
NMR data. However, the deuteron content is lower at most sites by 2.5 times in the ECD
analysis while excessive deuterium is retained at the N-terminus. These observations offer
some promise for ECD as a means of following sites specific amide exchange, but also
suggest that means of further minimizing scrambling might be elucidated through a more
extensive investigation of different peptide fragments by both NMR and ECD MS.
98
5.1 Introduction
MS analysis of the deuterium content of peptides derived from proteins is now
widely used to study protein conformation, interaction and dynamics.1-5 It offers tremendous
advantage in requiring little sample and being applicable to relatively large systems. However,
structural resolution is generally limited by the size of digested peptides and an inability to
localize deuterium content to particular amino acids within a peptide. These methods could
be of importance to our MS assisted assignment strategy for NMR resonances if the
localization of deuterium to a single amino acid could be improved. Hence, I devote some
attention to this prospect in this chapter.
One approach to improving localization is focused on obtaining small and
overlapping peptic peptides from the protein. The difference in deuterium uptake between
two overlapping peptides can then narrow the spatial resolution down to a few (or even one)
amide backbone protons. This can be aided by proteolytic digestion with multiple acidic
enzymes.6 LC/MS/MS has also been suggested as a method to further fragment peptides in
the spectrometer using different dissociation methods.2, 7 However, in reality, it is difficult to
get sufficient coverage with digested peptides, and since most MS/MS approaches involve
high energy, there is significant loss of site-specific information due to scrambling of amide
deuterons during fragmentation.8-10
Fourier-transform ion cyclotron resonance mass spectrometry (FTICR MS) seems
especially well-suited for the mass spectrometry part of hydrogen exchange analysis because
of its ultrahigh mass resolution and mass accuracy.11-13 For instance, the mass accuracy of the
FT stage of LTQ FT MS (Thermo Electron Corporation, Waltham MA) can reach 2 ppm,
while that of the front end, LTQ ESI MS, is 0.1 Da at the measurement range of 150-2000 Da.
Isotopic peaks of an intact protein and protein fragments can be well resolved, and most of the
proteolytic fragments of a protein can be identified by their accurate masses, thereby reducing
99
the need for MS/MS or other partial sequencing of each fragment. One more attractive aspect
of FTMS is that it allows use of a variety of fragmentation methods, including electron capture
dissociation (ECD).14-17 ECD involves irradiation of gas-phase multiply charged cations with
low energy electrons, resulting in unique fragmentation pathways via radical ion
intermediates. This process is depicted in Figure 5.1 Capture of an electron at a positive center
localized near the carbonyl results in a fragmentation primarily at the N-Cα bonds along the
peptide backbone.
Figure 5.1.Schematic illustration of the ECD mechanism following the hot hydrogen atom
model.18 Main primary and secondary fragmentation pathways in ECD of peptide cations are
shown.
Compared to b and y ions produced by collision induced dissociation (CID), ECD
generates c and z˙ type ions without appreciably affecting even far weaker noncovalent
100
bonds. The process is nonspecific and effective cleavage results in greater peptide sequence
coverage than other ion dissociation techniques. 19-21 The presence and position of the basic
amino acid residues (Arg, Lys, His) in a peptide sequence can, however, play an important
role in the ECD efficiency, relative fragment abundances and types of ions formed.16
Therefore, ECD can be applied to proteolytic fragments or even a “top down” whole protein
characterization.16, 17, 22 Major challenges in optimizing ECD conditions, especially for larger
protein ions, have been the following: (1) ion-electron trapping conditions for high capture
efficiency; (2) denaturation of interfering tertiary noncovalent structure; and (3) minimizing
product degradation caused by secondary electron capture.18 Consequently, new techniques,
such as the introduction of a second pair of electron-trapping electrodes, the “activated ion
(AI)” method, and the plasma ECD method are actively being developed to meet the needs of
more demanding applications.14
Besides the advantages for proteomics applications, ECD is a non-ergodic
process, which means the dissociation takes place prior to randomization of vibrational
energy over all degrees of freedom in the peptide or protein ion.23 The time-scale of an ECD
reaction is estimated to be around 10-12 s, which is much shorter than the typical time in
ergodic, or slow-heating, fragmentation processes.24 In addition, the excess energy only
slightly exceeds the amount required for the desired bond rupture and deposition of energy
occur near the bond to be broken. As a result, ECD is an ion dissociation method that can
cleave a strong bond in presence of a weak bond. Therefore, ECD can improve sequencing
efficiency of peptides with multiple disulfide bridges and facilitate mapping of
post-translational modification sites.25-27 Moreover, there are some secondary fragmentation
processes (w-ion formation) in ECD which help distinguish amino acids such as leucine and
isoleucine. The structures and characteristic side-chain losses in w-ion formation for Ile and
101
Leu residues are schematically shown in Figure 5.1, assuming the corresponding amino acid
side chain is attached to an α-carbon radical.
One unknown in ECD applications is the extent to which H/D rearrangement may
occur. Specificity of exchange information can be degraded by intramolecular migration of
hydrogens or deuterium, which involves the redistribution of hydrogen isotopes over the
peptide ion as a consequence of high hydrogen mobility.28 The extent of scrambling using
CID MS/MS was found to be highly dependent on the nature of the charge carrier and the
exact amino acid sequence.9 ECD may have a possibility as a lower energy method of
eliminating amide-H/D scrambling during MS/MS and to probe the microenviroments of
individual amide sites directly from species >5 kDa.29 Since the mechanism of ECD is an
ongoing investigation and debate, the qualification and quantification of the scrambling issue
is worth studying. Some initial ECD reports indicate that some limited scrambling takes
place.23 Two main hypotheses for ECD fragmentation involve hydrogen rearrangement: in the
‘hot hydrogen atom’ mechanism27, a hydrogen atom is relocated from a protonated site (e.g.
arginine or lysine side chain) to a back bone carbonyl oxygen; and in the ‘amide superbase’
mechanism30, a proton is transferred to a backbone amide radical site. But neither of the
proposed mechanisms can rationalize the proton scrambling issue on the original backbone
amide sites. O’Conner suggested a radical cascade mechanism in which the initially formed
α-carbon radical can propagate along a peptide backbone by free radical rearrangement or by
hydrogen abstraction28. They tested the mechanism by using small cyclic peptides as shown
in Figure 5.2.
102
Figure 5.2. Nonergodic cleavage from electron capture dissociation (a→b) initiates an
α-carbon radical which can propagate along a peptide backbone by free radical
rearrangements (b→c→d), cleaving the N-Cα bond and forming another α-carbon radical28.
It would clearly be useful to provide some reliable data on the original placement
of deuterons to help distinguish such mechanisms. A method to qualify and quantify the
scrambling issue by comparing H/D deuterium exchange using ECD FT MS with rates
measured by 1D proton NMR observation is proposed here. Angiotensin I (AT1) is used as a
model peptide. The sequence of AT1 is DRVYIHPFHL, which has the molecular weight of
1296.5 Da. The basic amino acid, arginine, is the second amino acid from the N-terminus.
Proline in the middle of the sequence has no amide protons. This peptide is inexpensive to
purchase, and is used to mimic the peptic fragments of targeted protein sample after
digestion. One can mimic peptic peptides from a partially deuterated protein sample by
allowing the inherent differences in back-exchange rates of AT1 to produce partially and
specifically deuterated peptides. The experiment will be strictly controlled at 0˚C, pH 2.5 for
both experiments. Extracted rates will be localized to as specific a sequential position as
possible and correlated with NMR based rates demonstrated in Figure 5.3. The study will be
of significance in studying the inter- and intra- proton migration mechanism.
a. b.
c. d.
103
Figure 5.3. Schematic illustration of H/D exchange rates comparison by NMR and MS for
ECD scrambling exploration.
The data on AT1 are useful in establishing the potential of ECD analysis and
identifying some of the problems that must be solved. But the data are on just one peptide and
we must consider how our observations might apply to other peptides. AT1 is special in one
way that it has an arginine near the N-terminus. For peptides generated by pepsin
digestion the positions of positively charged amino acids, such as arginines and lysines, will
be randomly distributed in the sequence. They are not preferentially located at the c-terminus,
as in peptides from trypsin digestion. As a result, two concerns arise. First of all, multiple
charged parent ions have better chances for ECD ion dissociation. So short fragments with
possibly only a single charge after pepsin digestion are not good for initiating ECD
fragmentation. Secondly, if basic amino acids are randomly located in the parent ions, it is
likely that no complete c or z˙series will be observed. Therefore, the design of a different
experimental protocol may be required to achieve better ECD fragmentation. A shorter
digestion time and lower pepsin to protein ratio may help to get longer peptides, which might
MS and MS/MS
AA Pk Int
Time
Mass
Time
Mass
Time
Peptide A
C’n-C’n-1 = AAn
Exchange rate of each AA
C’n ion from Peptide A
C’n-1 ion from Peptide A
Exchange rate of each AA
NMR
Sample: deuterated peptic peptide in H2O, 2H → 1H
104
have several basic residues in the fragments to produce multiply charged parent ions for ECD.
In addition, other acidic enzymes, like protease XIII and XVIII, can be applied instead of
pepsin to initiate different sets of fragmentation and get large peptides.6
5.2 Experimental
5.2.1 D/H exchange of AT1 by NMR
A 5 mg/mL deuterated AT1 sample was prepared by dissolving 0.5 mg
lyophilized AT1 in 100 μL 99.9% D2O and storing it at room temperature for 24 hr. The
sample was lyophilized again and redissolved in the 300 μL quench solvent (75% CD3CN,
25% H2O and 1 M deuterated acetic acid) at pH 2.8. Acetic acid was used here to lower the
pH because it does not have a peak in the amide region of a 1D NMR spectrum that can
interfere with amide resonance observation and it is a good ion pairing agent that does not
suppress electron spray efficiency. The high amount of organic solvent, CD3CN, helps to
slow the H/D back exchange process for observation. It also has no exchangeable protons and
all other proton positions are deuterated. Once the AT1 protonation reaction starts, the sample
was quickly injected into the flow cell of a Varian 800 MHz NMR spectrometer equipped
with a cryoprobe maintained at 8 ºC. After locking, shimming, and tuning on 300 μL
quench solvent in advance, data were acquired at 4 min, 8 min, 30 min and 1 hr time points.
Acquisitions required 3 min for 128 scans of the first time point, longer for later time points,
using repetitions of 1.4 s. The assignment of amide proton resonances was accomplished
using 2D watergate TOCSY and ROESY experiments at the end of AT1 D/H exchange
experiment. These experiments used standard pulse sequences from the Varian Biopack
library. The NOESY mixing period was 0.2 s with a repetition time of 1.4 s. The TOCSY
mixing period was 80ms with a repetition time of 1.4 s. These experiments required 50 min
and 3 hr 40 min respectively.
105
5.2.2 D/H exchange of AT1 by FT MS
5 μL of 5 mg/mL fully deuterated AT1 and 300 μL quench solvent (75% CD3CN,
25% H2O and 1 M deuterated acetic acid) was pre-cooled in a portable refrigerator at 8 ºC.
Then the sample was quickly loaded into a pre-cooled 500 μL syringe, and electrosprayed in
positive ion mode at 1 μL/min (flow rate maintained by a Harvard Apparatus PHD 2000
syringe pump (Holliston, MA)). The electrospray emitter consisting of a 50 μm id fused silica
capillary. Standard electrospray parameters for the 7 T LTQ FTICR MS (Thermo Electron
Corporation, Waltham, MA) were used. The spray voltage was 1.8 kV, the capillary
temperature was 220 ºC, the capillary voltage was 50 V, and tube lens voltage was 90 V.
D/H exchange was monitored on-line for up to 2 hr by acquiring ECD spectra continuously.
Figure 5.4. Working principle of the Thermo LTQ FT MS detector (from Manual,
Finnigan™ LTQ FT™ Getting Started, Thermo Electron Corporation)
The acquisition method of each scan was mainly defined in the window shown in
Figure 5.5. The mass range was 115 Da to 2000 Da. The mass resolution was chosen as
106
100000 anticipating a maximum m/z of 400 Da. The Inject Time was 3000 msec and Source
Fragmentation was off. The Parent Mass for AT1 is 433.00 Da, which corresponds to the
triply charged molecular ion of AT1. The Isolation Width was set to a m/z of 5 to filter out
complicating sample background. ECD MS/MS mode was turned on by the check box beside
the ECD parameters. For our particular experiment on AT1, the Energy was 3.5%, the Delay
was 0 msec and the Duration was 100 msec.
Figure 5.5. Interface of Xcalibur for defining FT MS acquisition scans. (Data acquisition
software of LTQ FT MS, Thermo Electron Corporation)
5.2.3 Data analysis
On the NMR side, 2D ROESY and TOCSY spectra were used to accomplish
amide proton resonance assignment in the 1D proton spectra. The results show that the amide
proton region is not well resolved under the particular buffer conditions used (at 8 ºC and
107
pH 2.8). The peaks of Y4/H9 and V3/F8 happen to overlap each other, and part of R2 amide
multiplet is overlapped by aromatic protons of histidine. The amide peaks of four time points,
4 min, 8 min, 30 min, 1 hr were integrated and special attention was given to the estimation
of deconvoluted peak area contributions of overlapped peaks. In the case of Y4/H9, the
estimated portion of proton incorporation at each time point was simply divided in half, while
in the case of V3/F8, the peak of V3 was slightly resolved on the left and could be seen to be
growing slower than F8. So the estimated peak ratio based on the proton contribution of these
two amide protons of four time points are 0.26/0.74, 0.33/0.67, 0.43/0.57, 0.46/0.54. For R2,
since one half of the doublet on the left was not overlapped, this peak was used to calculate
integration. Then the calculated integrals of all eight peaks were plotted vs. the four time
points. An curve was fit to the data using the program SigmaPlot 8.0 and Equation 5.1. The
integral of the amide proton peak, H, shows an exponential relationship with the product of
exchange rate, Kex, and time, t. H0 is a constant to take care of any proton incorporation due
to back exchange taking place before NMR observation. Hence the exchange rates of all eight
amide protons as well as their exchange half-lives were obtained.
H=H0+A×(1-exp(-Kex×t)). Eq. 5.1.
On the MS side, the chromatograph of direct diffusion and H/D exchange spectra
were analyzed using Qual Browser 1.4 version from the Thermo Electron Corporation. The
most abundant molecular ion [M+3H]3+ of AT1 was selected for MS/MS fragmentation by
ECD. Monoisotopic m/z values for ECD product ions of protonated AT1 were assigned by
comparing them to the predicted valves from the program MS-Product
(http://prospector.ucsf.edu/ucsfhtml4.0/msprod.htm, Peter Baker and Karl Clauser, UCSF
Mass Spectrometry Facility).
The same FT MS parameters were used to monitor D/H exchange on fully
deuterated AT1 samples dissolved in protonated solvent. The mass spectra accumulated over
108
6-10 min of chromatograph was analyzed to get deuterium incorporation data at 8 min, while
that at 116-120 min was analyzed to get the endpoint data of the deuteration reaction. The
deuterium content of each c or z˙ ion while D/H exchanging at 8 min, is obtained by taking
the difference between the centroid mass of a particular c or z˙ ion at 8 min and that at the
end point. The centroid mass of each peak profile was calculated by dividing the product of
m/z and the intensity of each peak in the isotopic cluster and summing over the intensities.
Then amino acid residue-specific deuterium content was assessed by first subtracting the
average m/z of cn or (zm˙) ions from that of cn+1 (or zm+1˙) ions for the same charge state (z)
and multiplying by z to deduce the average mass of the deleted amino acid residue. Due to
the structure of the c and z˙ions, the mass difference between cn+1 and cn defines the amide
deuterium content of the amino acid (n+2) together with any side chain deuteriums on amino
acid (n+1), counting from the N-terminus. For z˙ions, the mass difference between zm+1˙
and zm˙ corresponds to the amide deuterium content of amino acid (m) along with any side
chain deuteriums on amino acid (m+1), counting from the C-terminus.
5.3 Results and discussion
The 1D proton spectrum of AT1 is shown in Figure 5.6 for the chemical shift
region 6.2-8.6 ppm. The peaks below 7.4 ppm belong primarily to aromatic protons. Amide
protons overlap to some degree, but most can be assigned by 2D watergate TOCSY and
ROESY as shown in Figure 5.7 and 5.8. TOCSY correlates all the protons in the same spin
system (scalar coupled network). As an example the HN resonance at 7.73 ppm shows
vertical connectivities to an Hα at 4.03 ppm, and Hβ at 1.95 ppm, and two Hγ resonance at
0.70 ppm This is very characteristic of valine. ROESY is an NOE-based experiment that
correlates the protons in space even if they are not bonded. It is a less sensitive experiment
than TOCSY and also highly depended on molecular size. However, for peptides the size of
109
AT1 in organic solvents it is preferred over NOESY and it does show critical HN to Hα
connectivities that allow sequential assignment. For example, the HN resonance at 7.92
ppm shows connectivities to its own Hα, but also to the Hα assigned to valine. It must
therefore belong to tyrosine. Note that tyrosine and phenylalanine cannot be distinguished
based on their TOCSY spectra since both amino acids have similar Hα-Hβ coupling patterns.
Assignments for all resolved HN resonances are listed in Table 5.1.
Figure 5.6. 1D proton PRESAT spectrum of protonated AT1 in 300 μL 75% CD3CN, 25%
H2O and 1 M deuterated acetic acid.
R2
H6
F8 Y4
V3
H9
I5 L10
110
Figure 5.7. 2D watergate TOCSY spectrum of protonated AT1 in 300 μL 75% CD3CN, 25%
H2O and 1 M deuterated acetic acid.
Figure 5.8. 2D watergate ROESY spectrum of protonated AT1 in 300 μL 75% CD3CN, 25%
H2O and 1 M deuterated acetic acid.
When the fully deuterated AT1 is redissolved in protonated solvent, back
exchange takes place. Since we are observing proton, not deuteron signals, the peak intensity
increases as a function of time (Figure 5.9). The integral of each amide proton peak was
calculated and plotted vs. time as described in the experimental section. Exponential curve
fitting allows extraction of exchange rate constants for each amide site. The curve for I5,
111
whose exchange rate is 0.064 min-1, is shown in Figure 5.10. Exchange rates for all the
others are listed in the Table 5.2.
Figure 5.9. H/D exchange of AT1 monitored by 1D proton NMR. The experiment starts by
mixing 300 μL quench solvent (75% CD3CN, 25% H2O and 1M deuterated acetic acid) with
0.5 mg fully deuterated AT1 at 8 ºC. Peaks are labeled by one letter codes for amino acids
with vertical positions of labels roughly indicating the half life of each amide resonance.
Figure 5.10. Peak area of I5 monitored as a function of time using 1D PRESAT proton
NMR. The data are best fit with the exponential curve, H = 89.71 + 155.74×(1-exp(0.0064
×t)).
R2
L10 H6
F8 Y4
V3
H9
I5
4 min
8 min
30 min
1 hr
Time (min)0 20 40 60
Peak
are
a
100
120
140
160
180
200
220
240
260
112
The N-terminal amino acid, D1, is positively charged and undergoes very fast
exchange with the solvent, so the exchange rate cannot be quantified. The other amide
protons except proline exchange at slower and quite different rates. The range of exchange
rates extends from 0.027 to 0.58 min-1. Half lives are between 1.20 and 25.7 min. R2 and H9
are fast exchanging residues, while V3, I5 and L10 are slow ones. Table 5.2 indicates that all
the amide protons finished exchanging half of the deuterons within 30 min.
The ECD FTMS spectrum of the protonated AT1 sample at the triply charged
state was accumulated over 10 min for reference as shown in Figure 5.11. The singly charged
c serial ions are the dominate product, while the singly charged z˙ serial ions are sparse
with very low intensity, making the calculation of site-specific D/H exchange from the latter
series difficult. This particular fragmentation pattern is due to arginine, which is a basic
amino acid, located near the N-terminus. The c ion series is complete except for c6. Here
cleavage of the proline N-Cα bond does not result in loss of the proline atoms due to the
additional N-Cα bond.
113
Figure 5.11. The ECD spectrum of protonated AT1. 5 mL of 5 mg/mL fully deuterated AT1
in 300 mL quench solvent (75% CD3CN, 25% H2O and 1 M deuterated acetic acid). Data
were collected by ESI ICR FTMS.
D/H exchange of AT1 was monitored continuously for 2 hr by ECD FTMS under
the same conditions as the NMR experiment. Since the exchange of one deuteron back to a
proton will cause a decrease in mass of one, we expect a shift of mass profiles of the c ions
with time. An example is shown in Figure 5.12 for the time evolution of the resolved isotopic
distributions of the c3+ and c4
+ ions. Due to the structure of c ions, the mass difference
between these two ions is representative of the amide deuterium content of I5, along with one
additional deuterium on the side chain of Y4. Since exchange at the side chain position is
very fast, the effect is immediate and results in a constant offset of the profile.
Since the data analysis is complicated, I will focus here on the time point of 8 min
for comparison of 1D NMR and ECD MS data. The centroid mass of c3+ is shifted down
0.8883 Da from 389.5361 Da at 8 min to 388.6478 Da at 118 min, the ending time point,
while that of c4+ is shifted down 1.1491 Da from 553.0339 Da to 551.8847 Da. Therefore,
after subtracting the deuterium level of c3+ from c4
+the approximate deuterium content at the
I5 amide is 0.2608 Da, which stands for 26% deuteration taking place at this specific site.
The whole analysis is summarized in the Table 5.3. The deuterium content on the c ion series
is listed in the second column while the deuterium content at each particular amino acid is in
the fourth column.
114
Figure 5.12. Expanded ECD product ion spectra showing the isotopic distribution of two
consecutive c-type AT1 product ions as a function of D/H exchange time.
5.4 Discussion
Since the exchange rates of each amino acid determined from NMR data under
identical experimental conditions is listed in Table 5.2, the expected deuterium content of
AT1 at 8 min can be calculated using the equation D = Σ exp(-kit). The number of deuterons
present in AT1, D, is calculated by the sum of the eight peptide amides in AT1 when ki is the
exchange rate constant for each amide HN and t is D/H exchange time, 8 min.31 The
deuterium content calculated from the NMR values is listed in the fifth column of Table 5.3
for comparison. The levels of deuterium at different amino acids as determined by ECD
FTMS follow the levels predicted from NMR data reasonably well. The results indicate that
H/D scrambling in ECD is not sufficient to prevent a qualitative analysis of the deuteron
distribution over most sites in this peptide. The deuteron level is, however, lower by a factor
of 2.5 in the ECD analysis, which could be due to enhanced exchange while in non-cooled
portions of the MS electron spray source or during the ionization process. In addition, the
C3+ ion C4
+ ion
8 min
118 min
M
M+1
M+2
M+3
M+2
M+1
M M+1
M+1
M+2
M
8
i=1
115
deuterium content of H9, yields a negative value by ECD MS. The exchange rate constant for
H9 is 0.5756 min-1, which is the fastest among all eight amide protons and agrees with the
NMR data. The negative value could be due to the experimental error. Multiple
measurements may help eliminate this anomaly. Electrospray efficiency also needs
improvement in order to gain better mass intensity for ion identification and isotopic pattern
calculation. One more interesting result from the data is excessive deuterium retained at the
N-terminus. This indicates that one or more amino acid in the N terminal tri-peptide
segment, DRV, exchanges very slowly. If this phenomenon is sequence dependent, V3
should exchange extremely slowly because D1 and R2 are fast D/H exchanging sites
according to the NMR data. Another possibility is that the slow exchange phenomenon is
normal for any N-terminal end involving some undiscovered mechanism. Is it possible that
there is some scrambling under the conditions of the experiment that results in the excessive
loss of deuterium form most sites and movement to the N-terminus? Sorting out these
possible explanations will require exploring more peptides with/without arginine and lysine
at both termini and getting more complete ionization of c and z˙ ions.
Hence, the general applicability of ECD to the determination of site-specific amide
hydrogen exchange rates remains an area of debate. I would conclude from my data that
there is some evidence for scrambling that moves deuterons to the N-terminus. There have
been some other reports of amide exchange probed by ECD in the literature. Exchange rates
for amides of melittin in methanol from c ions show some correlation with NMR data,
however, evidence for deuterium scrambling in ECD was observed for z˙ ions.7 I expect
further data correlation between ECD MS and NMR will be a powerful approach to explore
possible mechanisms for scrambling and a powerful approach to adjusting parameters to
minimize scrambling. The extent of scrambling is dependent on pressure, the collision
activation energy and the gas-phase structure of the ion. These parameters can be
116
systematically adjusted to optimize a match to NMR data. In addition, scrambling could be
a function of precursor ion size as well as local sequence effects. This will require an
extensive investigation of different peptide fragments by both NMR and ECD MS.
117
Table 5.1. 1D proton NMR assignment of protonated AT1 in ACN/H2O at 8 ºC, pH 2.8 by
TOCSY and ROESY.
No. Res. NH Hα Hβ Hγ or Hδ 1 D 2 R 8.46 4.28 3.08/3.08 1.60/1.50 3 V 7.73 4.03 1.95 0.70/0.70 4 Y 7.92 4.56 3.08/3.08 5 I 7.63 4.03 1.70 1.04/0.08 6 H 7.97 4.85 3.08/2.92 7 P 8 F 7.82 4.56 2.92/2.76 9 H 7.73 4.60 3.13/3.13 10 L 7.99 4.25 1.65/1.65 0.95
Table 5.2. Exchange rates for fully deuterated AT1 in protonated buffer at 8 ºC, pH 2.8 by
1D NMR.
No. Res. Kex (min-1) T1/2 (min)
1 D 2 R 0.5277 1.3135 3 V 0.0641 10.8135 4 Y 0.1025 6.7624 5 I 0.0640 10.8304 6 H 0.0918 7.5506 7 P 8 F 0.1025 6.7624 9 H 0.5756 1.2041 10 L 0.0270 25.6721
118
Table 5.3. ECD and 1D NMR data comparison at 8 min.
cn ion D content (cn ion, MS exp.) differential AA D content
( AA=cn-cn-1 ion, MS exp. ) D content
( AA, NMR calc. ) c2 0.7119 DRV 0.7119 0.61 c3 0.8883 Y 0.1764 0.44 c4 1.1491 I 0.2608 0.60 c5 1.2650 H 0.1158 0.48 c7 1.3857 (P)F 0.1208 0.44 c8 1.2203 H -0.1655 0.01
of Transient Protein-Folding Populations by Mass-Spectrometry. Science 262, 896-900 (1993).
2. Smith, D.L., Deng, Y.Z. & Zhang, Z.Q. Probing the non-covalent structure of proteins by amide hydrogen exchange and mass spectrometry. Journal of Mass Spectrometry 32, 135-146 (1997).
3. Kaltashov, I.A. & Eyles, S.J. Crossing the phase boundary to study, protein dynamics and function: combination of amide hydrogen exchange in solution and ion fragmentation in the gas phase. Journal of Mass Spectrometry 37, 557-565 (2002).
4. Hoofnagle, A.N., Resing, K.A. & Ahn, N.G. Protein analysis by hydrogen exchange mass spectrometry. Annual Review of Biophysics and Biomolecular Structure 32, 1-25 (2003).
5. Konermann, L. & Simmons, D.A. Protein-folding kinetics and mechanisms studied by pulse-labeling and mass spectrometry. Mass Spectrometry Reviews 22, 1-26 (2003).
6. Cravello, L., Lascoux, D. & Forest, E. Use of different proteases working in acidic conditions to improve sequence coverage and resolution in hydrogen/deuterium exchange of large proteins. Rapid Communications in Mass Spectrometry 17, 2387-2393 (2003).
7. Kweon, H.K. & Hakansson, K. Site-specific amide hydrogen exchange in melittin probed by electron capture dissociation Fourier transform ion cyclotron resonance mass spectrometry. Analyst 131, 275-280 (2006).
8. McLafferty, F.W., Guan, Z.Q., Haupts, U., Wood, T.D. & Kelleher, N.L. Gaseous conformational structures of cytochrome c. Journal of the American Chemical Society 120, 4732-4740 (1998).
9. Demmers, J.A.A., Rijkers, D.T.S., Haverkamp, J., Killian, J.A. & Heck, A.J.R. Factors affecting gas-phase deuterium scrambling in peptide ions and their implications for protein structure determination. Journal of the American Chemical Society 124, 11191-11198 (2002).
10. Hoerner, J.K., Xiao, H., Dobo, A. & Kaltashov, I.A. Is there hydrogen scrambling in the gas phase? Energetic and structural determinants of proton mobility within protein ions. Journal of the American Chemical Society 126, 7709-7717 (2004).
11. Buijs, J., Hakansson, K., Hagman, C., Hakansson, P. & Oscarsson, S. A new method for the accurate determination of the isotopic state of single amide hydrogens within peptides using Fourier transform ion cyclotron resonance mass spectrometry. Rapid Communications in Mass Spectrometry 14, 1751-1756 (2000).
12. Akashi, S. & Takio, K. Characterization of the interface structure of enzyme-inhibitor complex by using hydrogen-deuterium exchange and electrospray ionization Fourier transform ion cyclotron resonance mass spectrometry. Protein Science 9, 2497-2505 (2000).
13. Lam, T.T. et al. Mapping of protein : protein contact surfaces by hydrogen/deuterium exchange, followed by on-line high-performance liquid chromatography-electrospray ionization Fourier-transform ion-cyclotron-resonance mass analysis. Journal of Chromatography A 982, 85-95 (2002).
14. Sze, S.K., Ge, Y., Oh, H.B. & McLafferty, F.W. Plasma electron capture characterization of large dissociation for the proteins by top down mass spectrometry. Analytical Chemistry 75, 1599-1603 (2003).
15. Zubarev, R.A. Reactions of polypeptide ions with electrons in the gas phase. Mass Spectrometry Reviews 22, 57-77 (2003).
16. Zubarev, R.A. Electron-capture dissociation tandem mass spectrometry. Current
120
Opinion in Biotechnology 15, 12-16 (2004). 17. Cooper, H.J., Hakansson, K. & Marshall, A.G. The role of electron capture
dissociation in biomolecular analysis. Mass Spectrometry Reviews 24, 201-222 (2005).
18. Tsybin, Y.O., Ramstrom, M., Witt, M., Baykut, G. & Hakansson, P. Peptide and protein characterization by high-rate electron capture dissociation Fourier transform ion cyclotron resonance mass spectrometry. Journal of Mass Spectrometry 39, 719-729 (2004).
19. Konigsberg, W., Hill, R.J. & Goldstein, J. Structure of Human Hemoglobin .7. Digestion of Beta Chain of Human Hemoglobin with Pepsin. Journal of Biological Chemistry 238, 2028-& (1963).
20. Cornish-Bowden, A. & Knowles, J. Biochemistry Journal 113, 353 (1969). 21. Sachdev, G. & Fruton, J. Biochemistry 9, 4465 (1970). 22. Ge, Y. et al. Top down characterization of secreted proteins from Mycobacterium
tuberculosis by electron capture dissociation mass spectrometry. Journal of the American Society for Mass Spectrometry 14, 253-261 (2003).
23. Zubarev, R.A., Kelleher, N.L. & McLafferty, F.W. Electron capture dissociation of multiply charged protein cations. A nonergodic process. Journal of the American Chemical Society 120, 3265-3266 (1998).
24. Zubarev, R.A., Haselmann, K.F., Budnik, B., Kjeldsen, F. & Jensen, F. Towards an understanding of the mechanism of electron-capture dissociation: a historical perspective and modern ideas. European Journal of Mass Spectrometry 8, 337-349 (2002).
25. Mann, M. & Jensen, O.N. Proteomic analysis of post-translational modifications. Nature Biotechnology 21, 255-261 (2003).
26. Emmett, M.R. Determination of post-translational modifications of proteins by high-sensitivity, high-resolution Fourier transform ion cyclotron resonance mass spectrometry. Journal of Chromatography A 1013, 203-213 (2003).
27. Zubarev, R.A. et al. Electron capture dissociation of gaseous multiply-charged proteins is favored at disulfide bonds and other sites of high hydrogen atom affinity. Journal of the American Chemical Society 121, 2857-2862 (1999).
28. Leymarie, N., Costello, C.E. & O'Connor, P.B. Electron capture dissociation initiates a free radical reaction cascade. Journal of the American Chemical Society 125, 8949-8958 (2003).
29. Charlebois, J.P., Patrie, S.M. & Kelleher, N.L. Electron capture dissociation and C-13, N-15 depletion for deuterium localization in intact proteins after solution-phase exchange. Analytical Chemistry 75, 3263-3266 (2003).
30. Syrstad, E.A. & Turecek, F. Toward a general mechanism of electron capture dissociation. Journal of the American Society for Mass Spectrometry 16, 208-224 (2005).
31. Zhang, Z.Q., Post, C.B. & Smith, D.L. Amide hydrogen exchange determined by mass spectrometry: Application to rabbit muscle aldolase. Biochemistry 35, 779-791 (1996).
121
CHAPTER 6
PRELIMINARY STUDIES ON ISOTOPICALLY LABELED ST6GAL1 BY
COMBINED NMR AND MS METHODS1
1Feng, L. M.; Prestegard, J. H. To be submitted to Glycobiology.
122
Abstract
The feasibility of application of the new amide exchange based assignment strategy
for NMR resonances has been explored on a large glycosylated protein that could not be
expressed in a bacterial host. The protein is a 38 kDa sialyltransferase, ST6Gal1.
Preliminary experimental data show that, for this protein, specific 15N isotopic labels at one,
or a small set of amino acids can be incorporated. Furthermore, pepsin digestion, HPLC
separation and 15N filtered 1D NMR observation of labeled amide sites on a particular
peptide can be accomplished. This paves the way for application of amide H/D exchange
experiments on ST6Gal1 using 2D Hadamard HSQC on the folded protein and 1D 15N
filtered NMR observation on derived peptides. By correlating these data, sufficient
assignment of backbone amide resonances may be achieved to allow structure determination
of this glycoprotein by NMR.
123
6.1 Introduction
As demonstrated in Chapter 4, we are able to get an accurate correlation of H/D
exchange measured from NMR spectra of intact Gal3 and from NMR spectra of peptides
derived from the intact protein. We illustrated this by making a definitive assignment of a
peak in the HSQC spectrum to a specific phenylalanine in the sequence. This illustration,
while restricted to a single site sets an important precedent for more extensive application to
proteins that are large or difficult to label by conventional means.
Mammalian sialyltransferases play an important role in glycoprotein/glycolipid
maturation, immune function and development. However, they are often glycosylated or
require the presence of certain folding chaperones found only in eukaryotic cells. Structural
data are not available for members of relevant enzyme families, greatly impeding further
structural and functional characterization. As a first step in the structural characterization of
these biomolecules by NMR, several issues need to be resolved. Can the spectra of large
glycosylated proteins be simplified by isotopic labeling with specific amino acids? Can the
protein be digested into peptides suitable for the application of labeling strategies described
in previous chapters? And can sufficient quantities of peptide be obtained to allow NMR, as
opposed to MS, observation of deuterium incorporation in peptides? Here, preliminary data
on ST6Gal1, a 38 kDa glycosylated protein, is presented in an effort to resolve some of these
issues. A complete H/D exchange study of this biological meaningful protein is progressing
based on the results of studies presented here.
6.2 Experimental
6.2.1 Expression and preparation of 15N phenylalanine (F) and glycine (G) labeled
ST6Gal1
15N specific labeled ST6Gal1 with His-tag was expressed in HEK 293 mammalian
cells in the Moremen lab by Dr. Meng Lu. Expression used a Custom-Formulation
124
DMEM-4.5 medium (Atlanta Biologicals, Lawrenceville, GA). Amino acid stock solutions
without 15N or 13C labeled amino acids were added to the medium following the DMED
(Sigma D 1152) recipe, in which 15 amino acids are supplied in the media except glutamic
acid, aspartic acid, alanine, histidine, and proline. Glycine or phenylalanine was added in
their 15N labeled forms again following the DMED recipe. This called for 60 and 132 mg/L
respectively. The cells were grown for one week in T-175 flasks at 37 ºC in the incubator.
There were three rounds of scaling up and changing to the fresh medium containing
puromycin. Then the cells are harvested, lysed and purified on a phenyl sepharose column, a
Ni2+-NTA IMAC column and a gel filtration column. The final protein was stored in 200 mM
NaCl, 10 mM phosphate buffer, pH 7.4.
For the multiple labeled samples of ST6Gal1, the protein expression procedure
exactly followed the steps above. The only difference was that 15N glycine, phenylalanine,
and leucine and 13C valine were supplied simultaneously in the growth media.
6.2.2 Isotopic labeling efficiency as determined by NMR and MS Analysis
After decreasing the salt concentration of ST6Gal1, 200 μL of 0.3 mM protein
was put into a 5 mm shigemi tube. After the Varian 800 MHz NMR spectrometer is locked,
shimmed and tuned, 2D 15N gradient HSQC spectra were collected. Each HSQC spectrum
showed peaks corresponding to the expected numbers of the targeted 15N labeled amino acids
plus peaks corresponding to amino acids labeled by metabolic scrambling. Peaks were
integrated to assess relative labeling efficiencies.
MS provides a sensitive method for assessing the isotopic distribution in specific
amino acid types based on accurate mass determination of particular peptides and isotope
profiles about those masses. This was used to determine the percentage of labeling of amino
acids in our case. MALDI-TOF was used because of its high mass accuracy and mass
resolution. By comparing the experimental and predicted isotope pattern, 15N specific
125
labeling of ST6Gal1 sample is quantified and the scrambling of 15N to other position(s) is
located. The results of isotope pattern analysis were rationalized by biosynthesis and
metabolism paths for the various amino acids.
15N specific labeled ST6Gal1 was digested using immobilized pepsin (1:1) (Pierce
Biotechnology, Inc., Rockford, IL) at room temperature for 1 hr. 1 μL peptide mixture was
then loaded onto the MALDI (MALDI-TOF/TOF from Applied Biosystems, Foster City, CA)
or FT MS (LTQ FT MS from Thermo Electron Corporation, Waltham, MA) for MS analysis.
The peptic peptides were identified by comparison to a) the MS-Digest database
(http://prospector.ucsf.edu/ucsfhtml4.0/msdigest.htm); b) the MALDI TOF/TOF —
MASCOT identification database (www.matrixscience.com); c) the ESI MS/MS —
SEQUEST identification database. Once peptide identification was determined, the isotopic
composition was calculated. Different percentages of labeling on 15N were defined using the
prediction program ISOTOPICA (http://coco.protein.osaka-u.ac.jp/Isotopica/). The closest
agreement between experimental and calculated patterns were used to decide how much 15N
labeling was in each peptide.
6.2.3 Pepsin digestion, HPLC separation and 1D NMR observation of 15N G ST6Gal1
2.34 mg 15N G ST6Gal1 (93.6 mg/mL, 25 μL) in buffer was digested using beads
washed out of 0.86 mL of an immobilized pepsin slurry (protein to enzyme mole ratio is 1:1)
by 0.1% TFA in H2O. 175 μL 0.1% TFA in H2O was added and the mixture was incubated
for 1 hr at pH 2.5 and room temperature. Then the immobilized pepsin beads are removed
from the digested protein mixture by 1 min centrifuge at RMP 10000 min-1 The peptic
peptide solution was divided into four equal portions and desalted on MacroSpin columns
from the Nest Group, Inc. (Southborough, MA) The desalted peptides were re-dissolved in 2
μL 80% ACN+20% H2O with 0.1% formic acid (FA) for hydrophobic peptides, and 78 μL 0.1
% FA in H2O for hydrophilic peptides. The four samples were loaded onto a C18 reverse−
126
phase analytical column (Jupiter 5 μ, 300 Å, size 250 × 4.60 mm from Phenomenex, Inc.
(Torrance, CA)), and separated on an 1100 binary pump HPLC system (Agilent Technologies,
Inc., Palo Alto, CA ) in four repeated runs. Initially the samples were in 95% buffer A (0.1%
TFA in H2O) for 5 min, then eluted with a gradient of increased buffer B (0.1% TFA in ACN)
from 5% to 60% over 30 min. Most peptides, eluted at 10-25 min; these were collected as
discrete fractions in 2 mL glass vials. 1 μL of each fraction and 1 μL matrix was mixed on the
sample target and inserted into an MALDI TOF/TOF MS. The matrix solvent was saturated
α-cyano-4-hydroxycinnamic acid powder (Aldrich Chemicals, Milwaukee, WI) in ACN/H2O
(1:1) with 0.1% TFA. Once the peptides were identified in all fractions, a peptide
containing three 15N labeled glycines was targeted for NMR observation. The sequence is
KGPGPGVKF with m/z 886.4 Da.
Four HPLC runs of the KGPGPGVKF peptide were combined. Totally, 20 μg of
sample was dried down and redissolved in 300 μL deuterated DMSO with 20 μL 10% TFA in
H2O. 1D proton spectra were collected on this protonated sample in a 5mm shigemi tube
using a Varian Inova 800 MHz spectrometer equipped with a triple resonance cold probe
equipped with pulsed field gradients. For observation, of amide proton resonances 1D proton
and 15N filtered NMR spectra were collected at 25ºC. The sequence used to collect the 15N
filtered spectra was derived from a pulsed field gradient fast HSQC sequence by eliminating
the indirect evolution time.1 The same pepsin digestion and HPLC separation steps were also
applied to multiple isotopic labeled ST6Gal1 for further NMR observation.
6.3 Results and discussion
6.3.1 2D HSQC spectrum of single 15N amino acid labeled ST6Gal1
2D HSQC NMR spectra were collected on 15N F ST6Gal1 and 15N G ST6Gal1 in
order to evaluate 15N labeling efficiency. The results are shown in Figure 6.1 a) and b). In
the case of 15N G ST6Gal1, we expect 16 glycines to be labeled; these should have
127
characteristic 15N chemical shifts around 100 - 110 ppm. Since glycine and serine are closely
coupled by a biosynthesis pathway, 15N label could scramble to 22 possible serines. On
examining Figure 6a, 12 peaks in the 100-110 ppm region are seen. This is a few more than
expected for 16 glycines. The additional peaks in the 110-122 ppm region are on average
weaker (about 45% the intensity of those in the 100-110 ppm region). They are expected to
be some of the 22 serines. In the 2D HSQC spectrum of 15N F ST6Gal1 (Figure 6b), all 16
expected phenylalanine cross peaks are seen with no scrambling taking place to other amino
acids. In both cases the HSQC spectra are much simplified compared to the spectrum
expected for a 15N uniformly labeled sample where 300 or more cross peaks would be
expected. The simplified spectrum will certainly facilitate the assignment procedure. In
addition, for the glycine labeled sample, the cross peaks of serines give bonus information
with a reasonable probability of distinguishing serine from glycine peaks based on chemical
shift and intensity.
Figure 6.2. 2D HSQC spectra of a) 15N G ST6Gal1 and b) 15N F ST6Gal1.
For the ST6Gal1 sample labeled simultaneously with 15N F, G, and L, the 2D
HSQC is much more complicated. Besides peaks from 16 phenlyalanines, 16 glycines, and 22
serines, there are numerous peaks of widely varying intensity. The number of additional
peaks, especially when plotted with a lower threshold, is far more than that expected from the
a b
128
25 15N labeled leucines. Valines were labeled with 13C as well, but these will not affect the
quality of the spectrum and will benefit some 3D data collection later on. I conclude that
scrambling from labeled leucine must be much more extensive that from phenylalanine or
glycine.
Figure 6.3. 2D HSQC spectra of multiple labeled ST6Gal (15N labeling on G, F, L and 13C
labeling on V)
6.3.2 Isotopic pattern analysis by MS of 15N specific labeled ST6Gal1
The resulting distribution of 15N labels on expression of ST6Gal1 can also be
analyzed using MS data on derived peptides. The simplest case is that of phenylalanine,
where based on NMR data we do not expect scrambling. From a sample labeled in media
supplemented with 15N labeled phenylalanine we were able to isolate several peptides not
containing phenylananine. Among them are the peptides, NYLNM (655.95 Da),
KPQMPWEL (1028.37 Da), IQPNPPSSGML(1140.37 Da). An isotope profile for the peptide
KPQMPWEL is shown in Figure 6.4a along with a calculated profile using natural isotope
abundances. The fit is very good indicating that the amino acids present contain no more
than an average of 5 % 15N. In Figure 6.4b we show the isotope profile of the
phenylalanine containing peptide, YQKPDYNF (1075.34 Da), along with the best fit
calculated profile obtained by adjusting the 98% labeling of the phenylalanine. We
129
conclude that in this particular sample, phenylalanines are 98% labeled and no other amino
acids have significant labeling levels.
Figure 6.4. Comparison of mass isotopic pattern between predicted profile by ISOTOPICA
and experimental data of two peptic peptides of 15N F ST6Gal1. The upper two rows are the
predicted isotopic distribution of peptide with/without 15N specific labeling a) peptide
KPQMPWEL has no labeling on all amino acids. b) peptide YQKPDYNF shows
phenylalanine to be about 98% labeled.
A similar analysis can be carried out with a sample prepared by expression in
15N–glycine supplemented media. At first, peptides which do not have glycines or serines
were explored (808.4Da: FRNIC; 1350.7Da: LKIWRNYLNM; 1028.5Da: KPQMPWEL;
1074.5Da: YQKPDYNF). This was done in order to check for the possibility of scrambling
to other amino acids. If we observe no isotope enrichment in these peptides, we can conclude
that no significant amount of15N transferred into F, R, N, I, C, L, K, W, Y, M, P, Q, or E.
Figure 6.5a shows the isotope profile observed for the peptide FRNIRC along with that
calculated based expected natural abundance. Within 5% we can say that no scrambling to
A further study of ST6Gal1 with sparse labeling is in progress. So far, the ability to
observe well−resolved peaks in the HSQC spectra of protein selectively labeled with
phenylalanine or glycine is established and the experimental protocol for pepsin digestion and
HPLC separation is set up. Also 15N isotopic filtering in 1D HSQC spectra is established. The
major obstacle is getting enough peptide for NMR observation. Besides efforts toward
136
optimizing pepsin digestion efficiency and minimizing sample loss during HPLC runs and
NMR sample preparation, the expression and specific labeling efficiency of ST6Gal1 needs
to be further improved. It may be possible to improve inherent NMR sensitivity in these
experiments by employing micro-coil technology in combination with cold probe technology
4, 5, or employ emerging methods such as dynamic nuclear polarization (DNP) to enhance
sensitivity6, 7.
With appropriate improvement in sensitivity, the application of the backbone
assignment strategy described in previous chapters should become possible. The significance
for ST6Gal1 structure determination and further studies of protein-protein and protein-ligand
interaction is substantial. Ongoing research in the Prestegard lab is currently exploring the
interaction of ST6Gal1 with CMP-carboxy-tempo to obtain long range distance constraints
on 15N labeled sites. Also, the use of residual dipolar coupling (RDC) measurements for the
determination of angular constraints on 15N-1H vectors is well established. When combined
with modern structure prediction methods, data from sparse labels using two or more amino
acid specific labels should be adequate for determination of a backbone structure. Neither
type of measurement requires complete backbone assignment or total side-chain assignment.
However, they do need assignment of observed HSQC peaks. Hence the methods for
assignment become very important. Hadamard transform encoded data collection on intact
proteins and simple 1D filtered NMR observation on digested peptides with 15N specific
labeling provide the basis for the H/D exchange correlated assignment strategy described in
previous chapters. We expect the methods to open structural studies to proteins that have
been traditionally difficult because of their need for expression in non-bacterial hosts, such as
the glycosyltransferase illustrated in this chapter.
137
Table 6.1. Comparison of half-lives of the peptide KGPGPGVKF between calculated and
experimental data.
No. Res. Kint(min-1)a T1/2 (min) T1/2 (min)b
1 K ― ― ― 2 G 1.130 0.613 12.264 3 P ― ― ― 4 G 0.034 20.682 413.644 5 P ― ― ― 6 G 0.034 20.682 413.644 7 V 0.020 34.228 684.558 8 K 0.015 45.847 916.935 9 F 0.078 8.849 176.975
a) Kint is calculated by the spreadsheet from Dr. Englander ’ s lab,
http://hx2.med.upenn.edu/download.html.
b) The half lives of amino acids in the peptide based on the experimental data. The data are
scaled by a factor of 16 to correct to correct for the reduced amount of H2O in the
of Hsqc Spectra of Exchanging Protons at Short Interscan Delays Using a New Fast Hsqc (Fhsqc) Detection Scheme That Avoids Water Saturation. Journal of Magnetic Resonance Series B 108, 94-98 (1995).
2. Oconnor, M.L. & Hanson, R.S. Serine Transhydroxymethylase Isoenzymes from a Facultative Methylotroph. Journal of Bacteriology 124, 985-996 (1975).
3. Snell, K. Enzymes of Serine Metabolism in Normal, Developing and Neoplastic Rat-Tissues. Advances in Enzyme Regulation 22, 325-400 (1984).
4. Eroglu, S., Friedman, G. & Magin, R.L. Estimate of losses and signal-to-noise ratio in, planar inductive micro-coil detectors used for NMR. IEEE Trans. Magn. 37, 2787-2789 (2001).
5. Brey, W.W. et al. Design, construction, and validation of a 1-mm triple-resonance high-temperature-superconducting probe for NMR. J. Magn. Reson. 179, 290-293 (2006).
7. Rosay, M. et al. High-frequency dynamic nuclear polarization in MAS spectra of membrane and soluble proteins. J. Am. Chem. Soc. 125, 13626-13627 (2003).
139
CHAPTER 7
CONCLUSIONS
140
The objective of this thesis was to accomplish resonance assignment of 2D HSQC
or TROSY NMR spectra for proteins that have traditionally been difficult to characterize
using structural biology methods. These include 1) proteins which cannot easily be
crystallized and studied by X-ray diffraction; 2) proteins which are large and beyond the
capability of conventional NMR methods; 3) proteins which are difficult to uniformly
isotopic label; and 4) proteins which must be expressed in mammalian cells to achieve proper
post translational modification, especially glycosylation. NMR resonance assignment is an
important prerequisite to structural investigation and one we believe to have made possible
with the methods developed and described in this thesis.
The method we described is a novel method that uses amide H/D exchange rates,
which have the same units as other NMR frequencies, to add a third dimension to 2D NMR
spectra and allow distinction of each amide site based on its particular chemical/structural
environment. By correlating exchange rates of individual amide sites collected in intact
proteins by 2D Hadamard encoded experiments with those collected in peptic digested
peptides by either MS or 1D proton NMR experiments, assignment is reduced to identifying
the sequence of peptides. MS then efficiently supplies the sequential information needed for
assignment.
There were several steps used in achieving our goal. We were able to
demonstrate in chapter 2 an ability to correlate amide exchange rates measured by MS and
NMR methods at a whole peptide level, but it proved difficult to get sufficient fragmentation
to allow correlation at a single amino acid level. We were able to demonstrate in chapter 3
an ability to monitor exchange at the single amino acid level using 1D proton NMR of
derived peptides, and were able to turn back-exchange to advantage in making resonance
assignments in derived peptides. We were able to demonstrate in chapter 4 that correlation
of amide exchange rates measured by NMR methods in intact Galectin-3, and peptides
141
derived from Galectin-3, could lead to assignment of specific cross-peaks in HSQC spectra.
However, these methods require substantial amounts of sample. We were able to demonstrate
in chapter 5 that new ionization methods in MS, ECD in particular, may in the future allow,
with far smaller samples, sufficient fragmentation to localize exchange to single amino acids.
However, deuterium scrambling issues will have to be resolved. And, in this chapter we
were able to demonstrate an ability to produce sufficient peptide fragments of the
glycosylated peptide, ST6Gal1, to allow application of either the NMR-NMR correlation
method or the MS-NMR correlation method. The future application to ST6Gal1 will
demonstrate the ability to study a class of protein that has been largely inaccessible to
structural biology techniques in the past, and will substantially improve prospects for an
impact of structural biology on biomedical research.