Page 1
i
PROTOTYPE DESIGN AND DEMONSTRATION OF
PRODUCED WATER PURIFICATION AT WELLHEAD USING
COPRODUCED ENERGY SOURCES
By
Shanker Muraleedharan
THESIS
Submitted in Partial Fulfillment
Of the Requirements for the Degree of
Masters of Science in Petroleum Engineering
New Mexico Institute of Mining and Technology
Department of Petroleum & Natural Gas Engineering
Socorro, New Mexico
August 2010
Page 2
ii
ABSTRACT
Treatment of produced water for various beneficial uses has always been a vital
requirement for the oil and gas industry. In mature fields in particular, an increase in water to oil
ratio calls for an increasing need for cost effective produced water treatment. Desalting produced
water by using humidification dehumidification process has advantages and is less sensitive to
feed water chemistry with a possibility to deploy low-temperature energy such as co-produced
geothermal energy and solar energy. In this work, bench scale water desalination by using the
humidification dehumidification was investigated. According to the bench scale data, a 10-15
bbls/day produced water treatment prototype was designed, built, and tested for field
deployment. This work presents a pilot scale lab study of the process followed by a scale up to a
field prototype. The unit was operated under various modes with and without vacuum. The
process parameters established for the field prototype was a direct scale up from the laboratory
experiments as well as from parametric studies conducted both on the lab scale and field
prototype. A “recoverable yield” from the process was found to be 8%, while the “total
producible yield” was as high as 40% with a feed water(L/min) to input air(ft3/min) ratio of 1:40.
The total producible yield is the sum of condensed and lost vapor, while the total actual yield is
the total condensed clean water that was collected during the operation. In sum, the process
shows great potential for economic desalination of produced water for smaller producers and the
yield could be greatly increased by enhancing the latent heat recovery and deploying new
condensation technology.
Page 3
iii
ACKNOWLEDGMENT
I would like to take this opportunity to thank my committee members for their invaluable
assistance during the entire course of this thesis project. My advisor Dr Liangxiong Li and Dr
Robert Lee have been instrumental with the basic idea of generating produced water for
independent producers and have offered great support throughout the project work from lab scale
testing to fabrication of the field prototype. My committee members Dr. Mike Kelly and Dr. Her
Yuan Chen have been a great support during the course of this project as well. I would also like
to thank Dr Michaelann Tartis, Dr Robert Bretz and Dr Michael Riley for the informative and
thought provoking conversations with regard to the chemical engineering concepts behind this
work. I would also like to thank the staff at Industrial Electric who fabricated the water
purification unit and have offered good support for converting the basic lab scale idea into a field
prototype, and also for allowing us to test the field prototype at their facility in Albuquerque
before it was taken to New Mexico Tech for further testing.
My acknowledgement would go incomplete without thanking Mr. Jim McLemore for his
assistance in setting up the lab prototype and several other retrofits carried out on the field
prototype during the course of these two years. Yu Jianjia and Ahmed have been a great help as
well in running experiments and recording data while I was away. I’d also like to thank Heidi
Guerra for arranging transportation and travel forms at quick notice before my field trips. Ms.
Liz Bustamante has been a great help with material for my literature review through my project.
Last but not least, I’d like to thank my good friend and office mate Weiwei Li for his constant
support over the past two years with lab analysis of produced water and the like.
Page 4
iv
TABLE OF CONTENTS ACKNOWLEDGMENT ..................................................................................................... iii
LIST OF TABLES .............................................................................................................. ix
CHAPTER 1 INTRODUCTION ......................................................................................... 13
1.1 Water quality and various end uses ........................................................................................ 18
1.2 Thermal technologies for water Desalination ......................................................................... 21
1.2.1 Multistage Flash Distillation ......................................................................................................... 21
1.2.2 Multi Effect Distillation ................................................................................................................ 23
1.2.3 Vapor Compression Distillation .................................................................................................... 24
1.3 Economics of desalination technologies ................................................................................. 25
CHAPTER 2 LOW-TEMPERATURE DISTILLATION PHILOSOPHY AND
THEORETICAL ANALYSIS ............................................................................................. 29
CHAPTER 3 BENCH SCALE TESTS ................................................................................ 35
3.1 Lab scale experimental set up ................................................................................................ 35
3.2 Parametric studies .................................................................................................................. 38
3.3 Troubleshooting lab scale prototype process .......................................................................... 41
3.4. Bench scale test results ......................................................................................................... 42
CHAPTER 4 DESIGN AND CONSTRUCTION OF WATER TREATMENT PROTOTYPE
................................................................................................................................................. 48
4.1 Field prototype fabrication/set up ........................................................................................... 48
4.1.1 Construction of prototype ............................................................................................................. 58
4.1.2 Electrical controls ......................................................................................................................... 60
Page 5
v
4.2 Design Modifications............................................................................................................. 63
4.2.2 Air-induced water cooling system ................................................................................................. 65
4.2.3 Automatic drainage system for concentrate recirculation ............................................................... 65
4.2.4 Field prototype testing site ............................................................................................................ 67
4.3 Heat exchanger sizing ............................................................................................................ 68
4.5 Deployment of coproduced energy or renewable energy sources ............................................ 70
CHAPTER 5 RESULTS AND DISCUSSION ..................................................................... 75
5.1 Test configurations ................................................................................................................ 76
5.2. Operation of prototype using the humidification dehumidification configuration ................... 80
5.2.1 Operation of prototype using modified water condenser ................................................................ 83
5.2.2 Operation of prototype under vacuum distillation configuration ..................................................... 85
5.3 Ion rejection potential of the field prototype ........................................................................... 88
5.4 Parametric analysis of the system ........................................................................................... 94
5.5 Comparison of results the various configurations ................................................................... 97
CHAPTER 6 CONCLUSIONS AND FUTURE WORK ................................................... 100
6.1 FUTURE WORK ................................................................................................................ 103
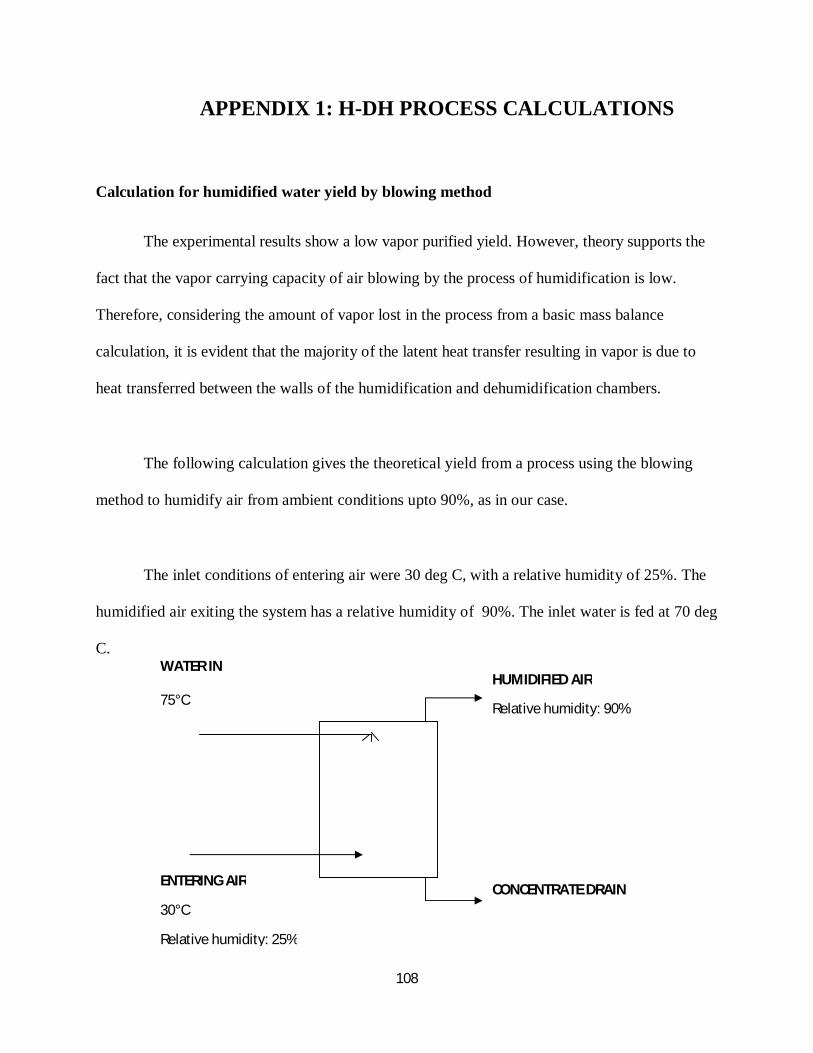
APPENDIX 1: H-DH PROCESS CALCULATIONS ........................................................ 108
APPENDIX 2: MOISTURE CONTENT CALCULATIONS ............................................. 111
APPENDIX 3: ELECTRICAL AND MECHANICAL CHECKLISTS .............................. 113
REFERENCES.................................................................................................................. 104
Page 6
vi
LIST OF FIGURES
FIGURE 1.1 BASIC ILLUSTRATION OF MSF PROCESS [7]............................................................................ 22
FIGURE 1.2 BASIC ILLUSTRATION OF MED PROCESS [7]. .......................................................................... 23
FIGURE 1.3 ILLUSTRATION OF SINGLE STAGE VAPOR COMPRESSION DISTILLATION [7]. ................. 25
FIGURE 1.4 WATER TREATMENT COSTS FOR RO PROCESS WITH AND WITHOUT TRANSPORTATION.
.................................................................................................................................................................... 27
FIGURE 2.1 SCHEMATIC REPRESENTATION OF HUMIDIFICATION- DEHUMIDIFICATION DESIGN. ... 30
FIGURE 2.2 SCHEMATIC REPRESENTATION OF AIR ENHANCED H-HD PROCESS. ................................ 31
FIGURE 3.1 SCHEMATIC REPRESENTATION OF BENCH SCALE EXPERIMENTAL SETUP. .................... 36
FIGURE 3.2 PILOT SCALE H-DH UNIT. ........................................................................................................... 38
FIGURE 3.3 BASIC PARAMETERS ESTABLISHED IN LAB SCALE TESTS. ................................................. 39
FIGURE 3.4 FISHBONE DIAGRAM FOR TROUBLESHOOTING THE PROCESS. .......................................... 41
FIGURE 3.5 EXPERIMENTAL SET UP FOR CONTINUOUS PROCESS. ......................................................... 42
FIGURE 3.6 EXPERIMENTAL SET UP FOR BATCH PROCESS. ..................................................................... 43
FIGURE 4.1 SCHEMATIC REPRESENTATION OF THE FIELD PROTOTYPE................................................ 49
FIGURE 4.2 MIND MAPPING FOR DESIGN OF FIELD PROTOTYPE. ........................................................... 51
FIGURE 4.3 PROCESS AND INSTRUMENTATION DIAGRAM OF THE WATER PURIFICATION UNIT ON
SITE. ........................................................................................................................................................... 52
FIGURE 4.4 PLAN VIEW OF THE EQUIPMENT PROTOTYPE........................................................................ 53
FIGURE 4.5 FIELD PROTOTYPE IN THE FABRICATION SHOP. ................................................................... 56
FIGURE 4.6 FABRICATED PROTOTYPE USING H-DH CYCLE. .................................................................... 57
FIGURE 4.7 MANIFOLD CONTAINING V NOTCHED WEIRS FOR THE WATER INLET. ............................ 58
FIGURE 4.8 TOP COVER SEPARATING THE H-DH CHAMBERS. ................................................................. 59
FIGURE 4.9 PACKING MATERIAL USED INSIDE THE HUMIDIFICATION CHAMBERS. ........................... 60
Page 7
vii
FIGURE 4.10 GAUGES FOR PROCESS PARAMETER MONITORING. ........................................................... 61
FIGURE 4.11 ELECTRICAL CONTROLS FOR THE UNIT. .............................................................................. 62
FIGURE 4.12 FIGURE SHOWING THE DISCHARGE AND RECIRCULATION SYSTEM. ............................. 63
FIGURE 4.13 SHOWING MODIFICATIONS WITH BALL VALVES FOR VACUUM OPERATION. .............. 64
FIGURE 4.14 BEFORE AND AFTER INSTALLING THE CONDENSER. ......................................................... 65
FIGURE 4.15 RECIRCULATION PUMP INSTALLED FOR CONCENTRATE DRAINAGE. ............................ 66
FIGURE 4.16 SITE PICTURE OF PROTOTYPE UNIT CONTAINED IN THE MOVING TRAILER. ................ 67
FIGURE 4.17 SCHEMATIC OF SHELL AND TUBE HEAT EXCHANGER(3.5 M2). ......................................... 69
FIGURE 4.18 SCHEMATIC OF COLD TRAP DESIGNED FOR THE FIELD PROTOTYPE(1.5M2). ................. 70
FIGURE 4.19 SCHEMATIC DIAGRAM OF THE GLYCOL BASED SOLAR LOOP FOR THE PROCESS. ...... 73
FIGURE 4.20 HOT AND COLD WATER LOOPS SHOWING THE SOLAR PROCESS FLOW DIAGRAM. ..... 74
FIGURE 4.21 BASIC SCHEMATIC AND TILT ANGLE OF THE SOLAR COLLECTORS. .............................. 74
FIGURE 5.1 CONFIGURATION WITH BLOWER AND WATER CONDENSER. ............................................. 76
FIGURE 5.2 SCHEMATIC REPRESENTATION SHOWING THE PROCESS STREAMS. ................................ 77
FIGURE 5.3 SCHEMATIC DIAGRAM OF THE FIELD PROTOTYPE WITH ALL POSSIBLE
CONFIGURATIONS. .................................................................................................................................. 79
FIGURE 5.4 TEMPERATURE CHANGE AT SAME HEIGHT OF ADJACENT CHAMBERS. .......................... 82
FIGURE 5.5 TEMPERATURE CHANGE FROM TOP TO BOTTOM OF HUMIDIFICATION CHAMBERS. .... 82
FIGURE 5.6 SCHEMATIC DIAGRAM OF PROTOTYPE WITH BLOWER AND WATER CONDENSER. ...... 83
FIGURE 5.7 TEMPERATURE PROFILE WITHIN THE UNIT. .......................................................................... 84
FIGURE 5.8 SCHEMATIC REPRESENTATION OF PROTOTYPE WITH VACUUM AND COLD TRAP ........ 85
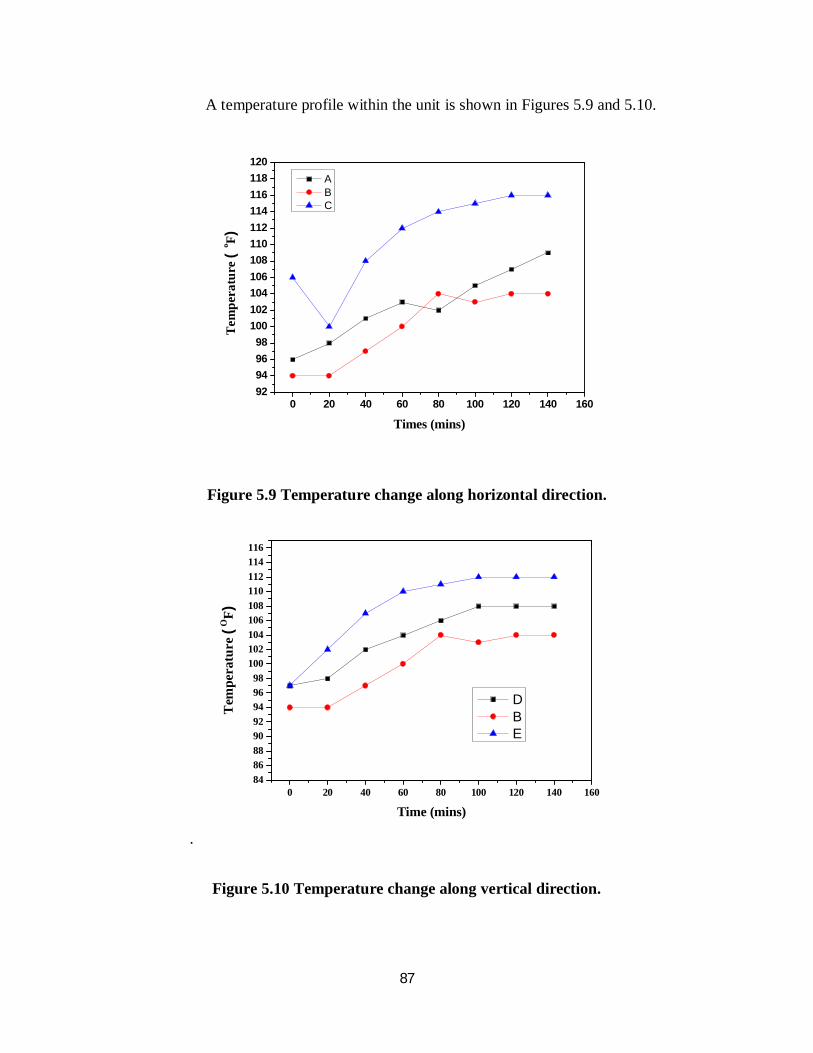
FIGURE 5.9 TEMPERATURE CHANGE ALONG HORIZONTAL DIRECTION. .............................................. 87
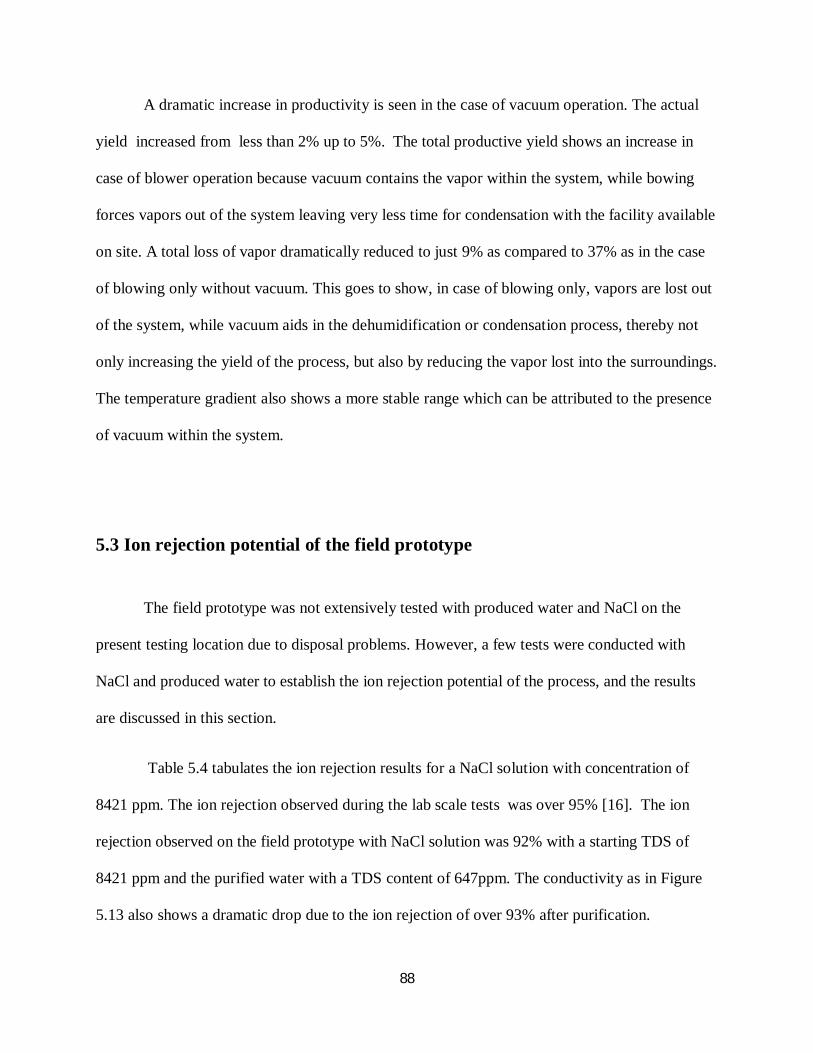
FIGURE 5.10 TEMPERATURE CHANGE ALONG VERTICAL DIRECTION................................................... 87
FIGURE 5.11 ION REJECTION FOR NACL FEED. ........................................................................................... 90
FIGURE 5.12 ION REJECTION FOR NACL FEED. ........................................................................................... 90
FIGURE 5.13 ION REJECTION SUMMARY DISPLAYING TDS AND CONDUCTIVITY FOR NACL FEED. 91
FIGURE 5.14 ION REJECTION FOR PRODUCED WATER FEED. ................................................................... 93
Page 8
viii
FIGURE 5.15 ION REJECTION FOR PRODUCED WATER FEED. ................................................................... 93
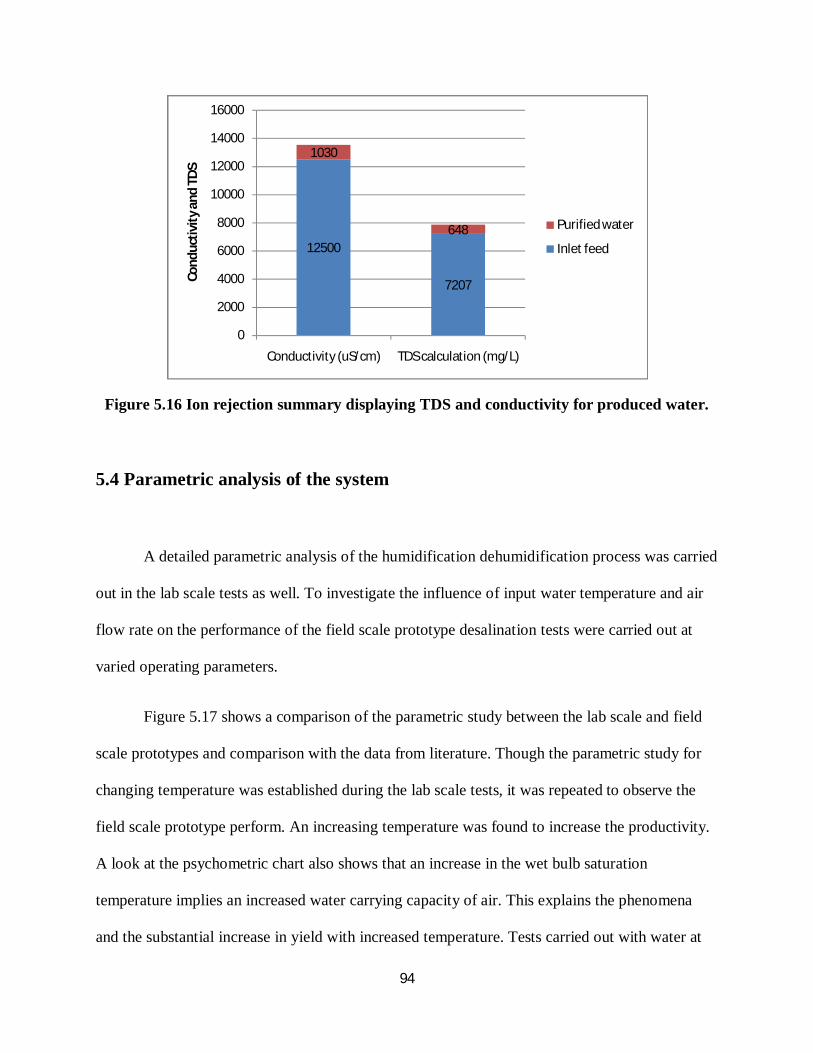
FIGURE 5.16 ION REJECTION SUMMARY DISPLAYING TDS AND CONDUCTIVITY FOR PRODUCED
WATER. ..................................................................................................................................................... 94
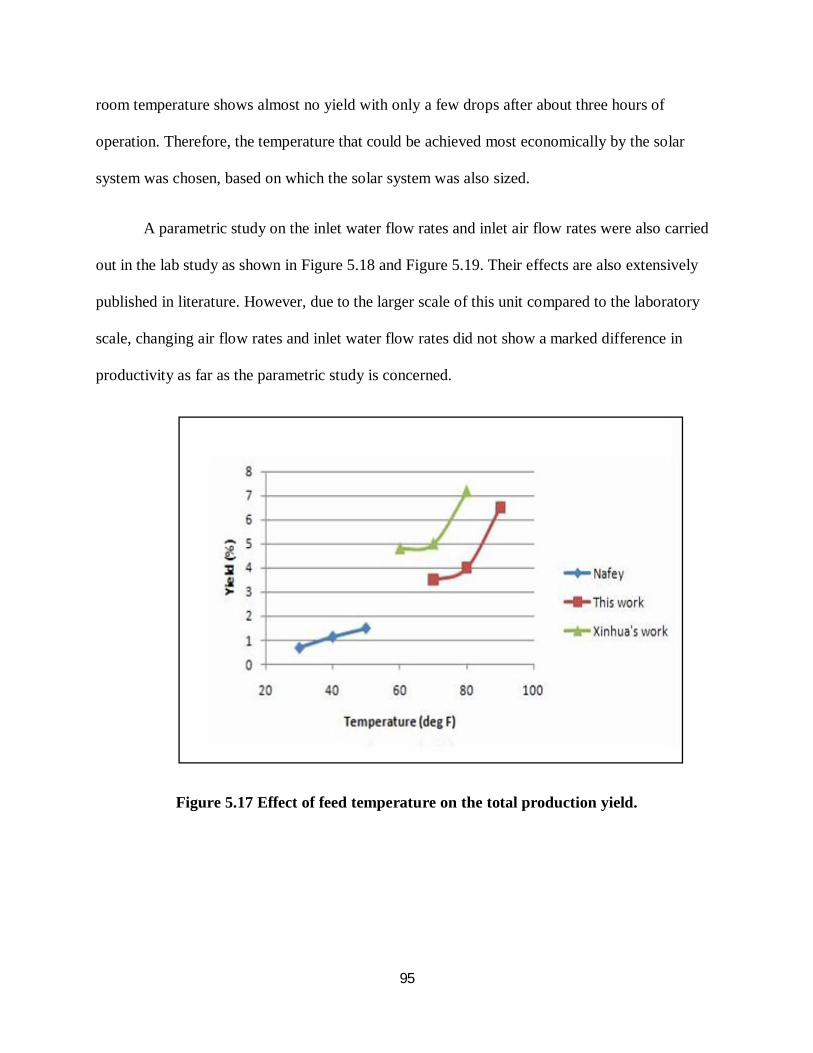
FIGURE 5.17 EFFECT OF FEED TEMPERATURE ON THE TOTAL PRODUCTION YIELD. ......................... 95
FIGURE 5.18 EFFECT OF AIR FLOW RATE ON THE TOTAL PRODUCTION YIELD [16]. ........................... 96
FIGURE 5.19 EFFECT OF FEED WATER FLOW RATE ON THE TOTAL PRODUCTION YIELD [16]. ......... 96
FIGURE 5.20 ACTUAL YIELD COMPARISON OF ALL COMBINATIONS..................................................... 98
FIGURE 5.21 TOTAL PRODUCTIVE YIELD COMPARISON OF ALL COMBINATIONS. .............................. 98
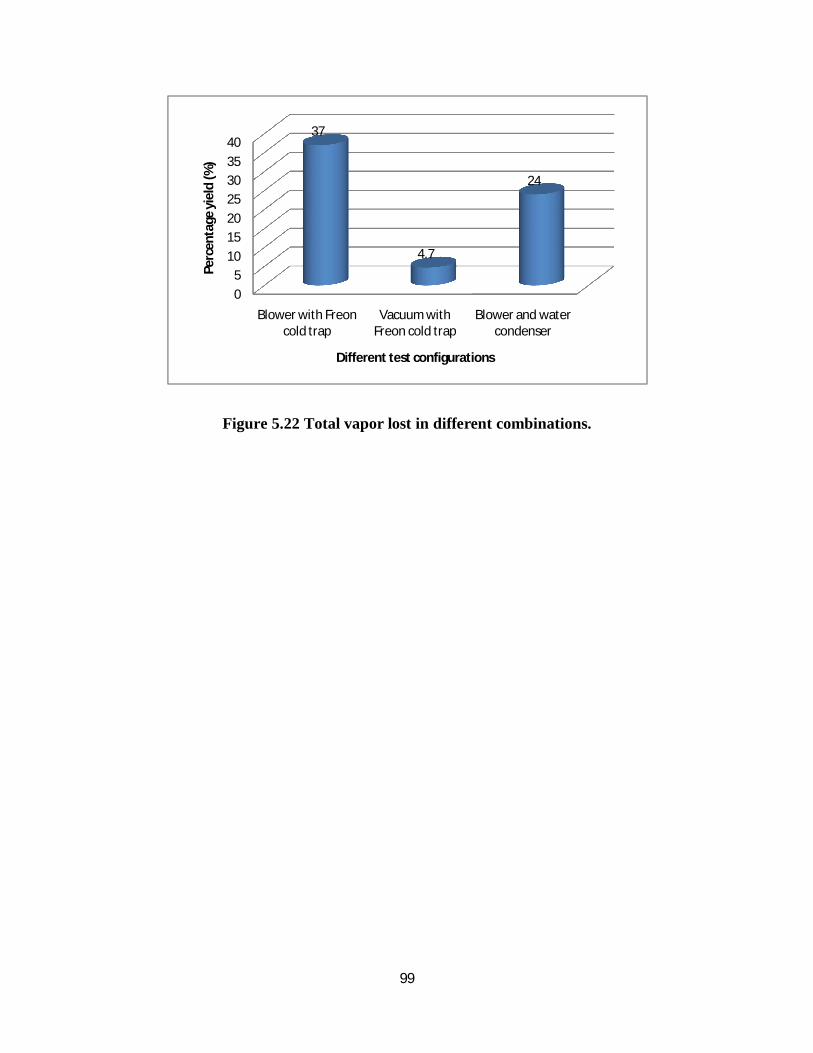
FIGURE 5.22 TOTAL VAPOR LOST IN DIFFERENT COMBINATIONS. ........................................................ 99
Page 9
ix
LIST OF TABLES
TABLE 1.1 WATER QUALITY REQUIREMENTS AND VARIOUS END USES .............................................. 19
TABLE 1.2 TYPICAL CHARACTERISTICS OF PRODUCED WATER COMPARED WITH SEAWATER ...... 20
TABLE 1.3 COMPARISON OF THERMAL AND MEMBRANE PROCESSES[11] ........................................... 26
TABLE 1.4 ECONOMICS OF DESALINATION[11] .......................................................................................... 26
TABLE 3.1 BASIC PARAMETERS ESTABLISHED IN THE LAB SCALE ....................................................... 40
TABLE 3.2 RANGE OF INPUT STREAMS FOR THE TESTS ........................................................................... 45
TABLE 3.3 A TYPICAL LAB SCALE RESULT OF YIELD ............................................................................... 46
TABLE 4.1 SOLAR PANEL DESIGN AND SIZING........................................................................................... 71
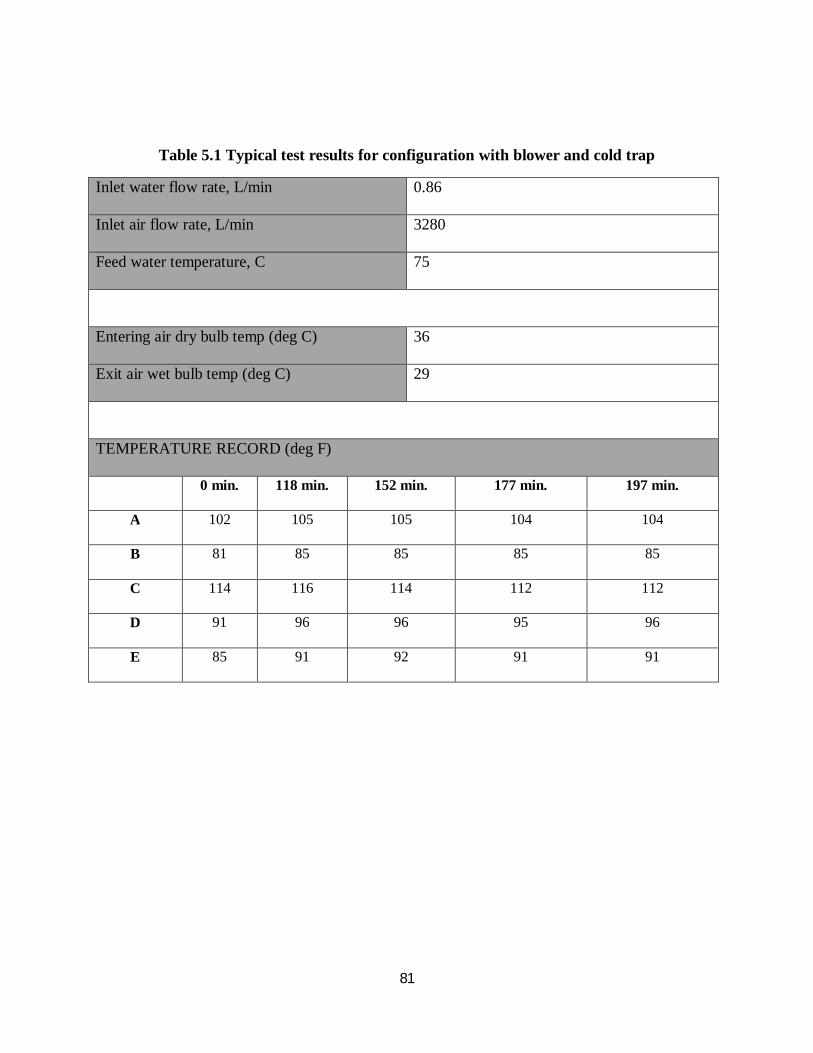
TABLE 5.1 TYPICAL TEST RESULTS FOR CONFIGURATION WITH BLOWER AND COLD TRAP ........... 81
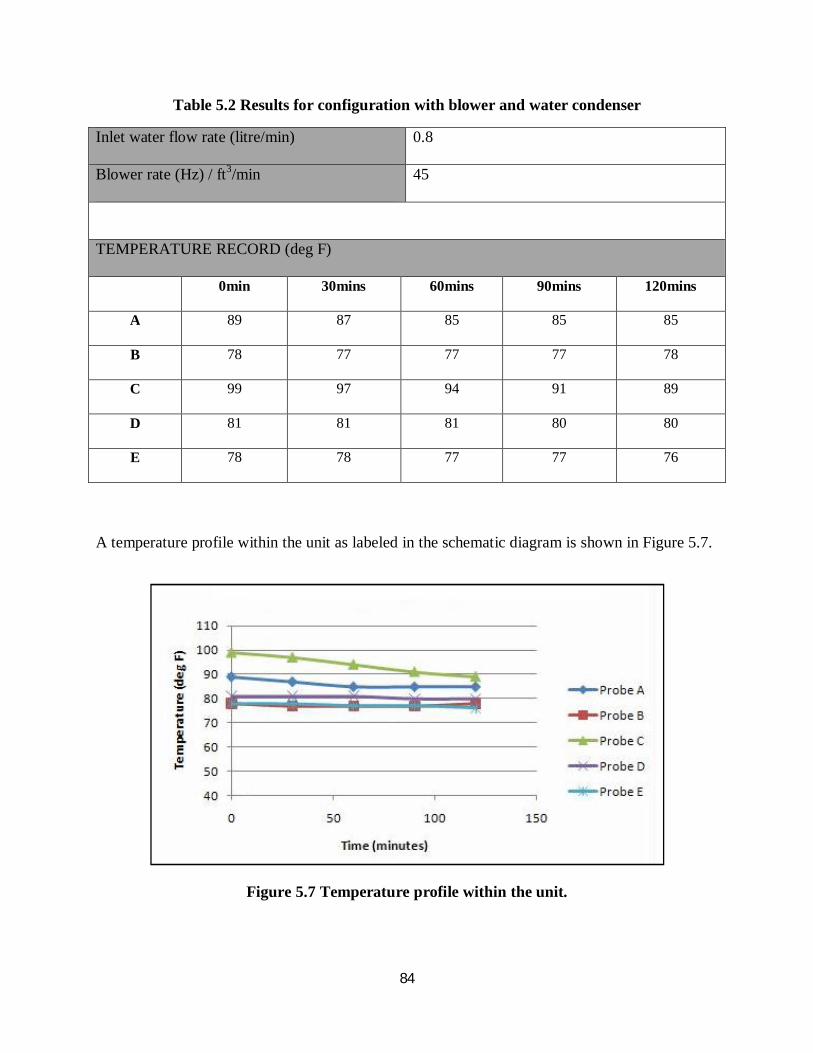
TABLE 5.2 RESULTS FOR CONFIGURATION WITH BLOWER AND WATER CONDENSER ...................... 84
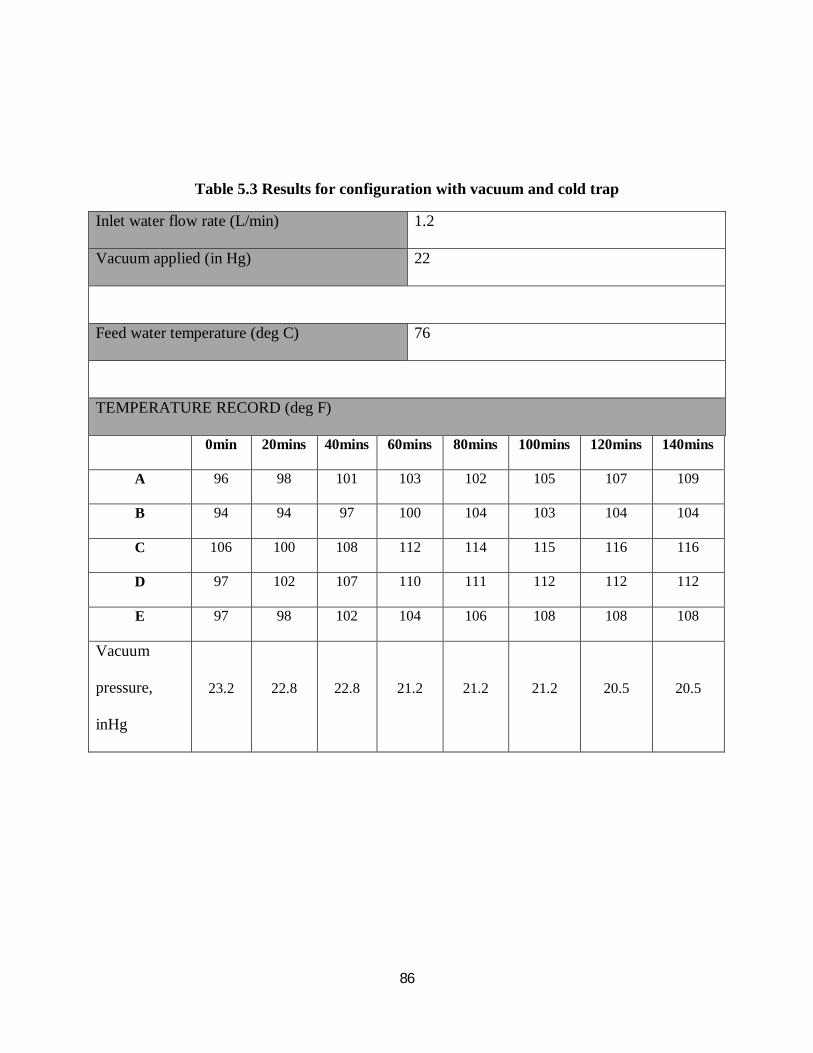
TABLE 5.3 RESULTS FOR CONFIGURATION WITH VACUUM AND COLD TRAP ..................................... 86
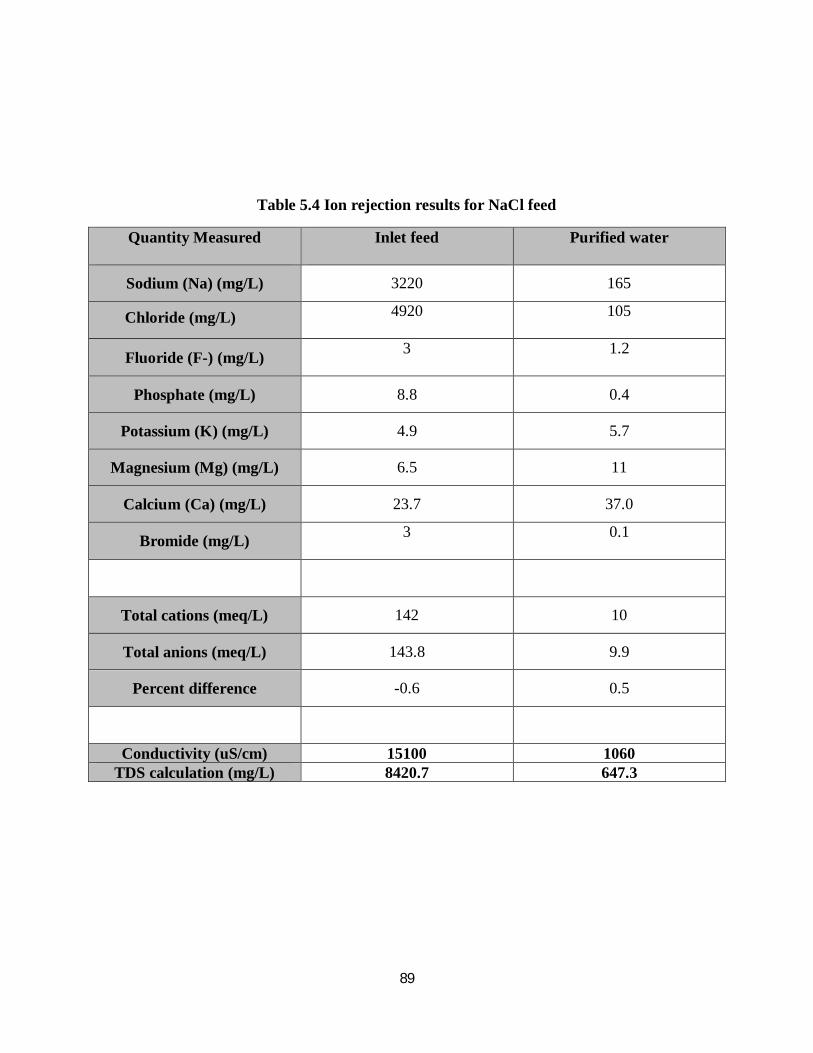
TABLE 5.4 ION REJECTION RESULTS FOR NACL FEED .............................................................................. 89
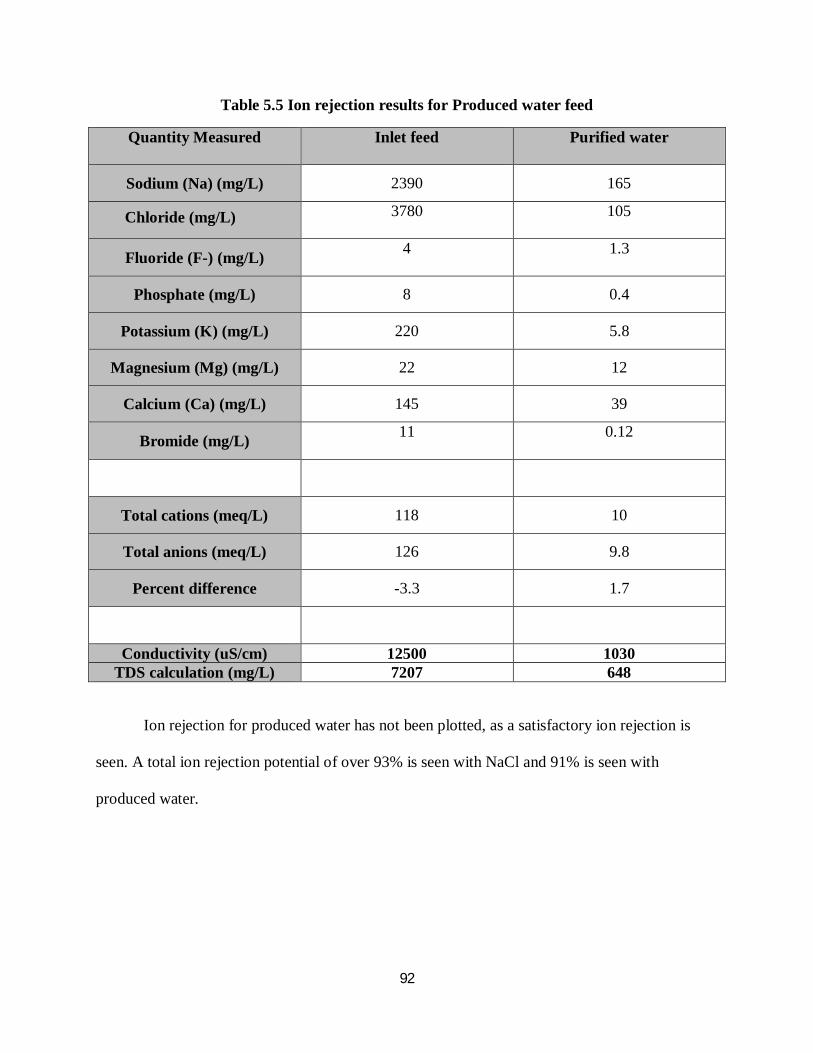
TABLE 5.5 ION REJECTION RESULTS FOR PRODUCED WATER FEED ...................................................... 92
TABLE 5.6 YIELD COMPARISON OF VARIOUS OPERATING CONFIGURATIONS .................................... 97
Page 11
xi
Glossary
A Area of heating surface, m2
Cp Specific heat, J/gC
Cpm Specific heat of moisture, J/gC
Cpa Specific heat of dry air, J/gC
Cpw Specific heat of water, J/gC
Specific heat of saturated steam, J/gC
D Diameter, m
f Function of
G Mass velocity, kg/sm2
H Enthalpy, J/kg
Ha At entrance
Hb At exit
h Heat transfer coefficient, W/m2C
Thermal conductivity, W/mC
m Mass, kg
P Total pressure
Pa Moist air pressure, Pa
Saturation pressure of moist air, Pa
Q Quantity of heat, J
q Rate of heat transfer, J/hr
R Gas law constant, 8.31447103 J/kKg mol
r Distance between two mass points, m
T Temperature, K
satspC ,
satswP ,
Page 12
xii
V Volume
H Humidity, mass of vapor per unit mass of vapor-free air; Ha, at the entrance of contactor, Hb, at exit of contactor.
Latent heat of vaporization, J/g; o, at To.
Qs Sensible heat flow rate, W
QL Latent heat flow rate, W
QLoss Loss of heat, W
QR Recovered latent heat transferring from the condensation side to the evaporation side, W
Twin Inlet temperature (K)
Mwin Inlet mass flow rate (kg/s)
W Moisture content of air (kg water / kg air)
H Enthalpy of air (kJ/s)
Cw Specific heat (J/kg.K)
Page 13
13
CHAPTER 1 INTRODUCTION
Produced water cogenerated with oil and gas production usually contain floating oil,
particulates and dissolved components such as salt, metal ions and water soluble organics (i.e.,
fatty acid and phenol). It is very saline, sometimes nearly six times as salty as seawater, and
contains dissolved hydrocarbons and organic matter as well. The components in produced water
that contribute to environmental impact include both dissolved salt and hydrocarbons, such as
aliphatic hydrocarbons, heavy aromatic compounds and alkylated phenols. In some cases
corrosion inhibitors and H2S also make a significant contribution [1, 2, 3]. For many small
oil/gas producers, purification of the produced water at wellhead, and on-site disposal or use of
the purified water for beneficial uses such as well drilling and stimulation, will be the primary
options for cost-effective produced water management, due to the shortage of storage capacity
and limitations of distribution technologies. For every barrel of oil produced, approximately 10-
15 barrels of brackish or saline water is generated. Presently the USA generates over 5 billion
gallons a day of produced water [4]. In the past, this water was handled as a waste and re-
injected, often at significant cost to the producer. As the US demand for fresh water outstrips
available supplies, the country is increasingly turning to desalination to create fresh water.
Because of the large volumes of brackish produced water being generated, the treatment of this
water is increasingly being looked at as a way to supplement the limited fresh water resources in
many parts of the country. Several issues still must be addressed to use this water such as, a)
Costs of treatment and removal of organic contamination b) Disposal of the associated
Page 14
14
concentrate from treatment, c) The treatment level required for beneficial reuse, and d) The
regulatory and policy issues associated with produced water used for beneficial reuse [5] .
Development of a method that can be deployed for cleaning produced water at the
wellhead is highly desirable. The disposal of produced water needs to satisfy the National
Pollutant Discharge Elimination System, requiring removal of both floating waste and dissolving
contaminants. Current produced water management includes produced water lifting,
transportation, separation, and deep-well injection. Unfortunately, the large cost of produced
water disposal (Up to $2.5/bbls) and increasing restrictions usually forces the shutdown of high
water-cut producing wells, particularly marginal wells. On the other hand, most of landscapes
with enriched oil and gas production activities are vulnerable to degradation. Supplying of
irritable clean water is critical to maintain native vegetation and restore the natural ecosystems in
these areas. The increased economic burden and environmental liability posted by produced
water disposal motivate the research of produced water purification.
Unfortunately, the conventional oil/water separations and filtration processes, which are
widely deployed in oil/gas industry, can only remove the floating particulates and large oil
droplets. Advanced demineralization technologies are in need for removing the salt and
dissolved organics and meeting surface water discharge standard. Among the desalination
technologies, membrane separation and thermal separation are the most promising and widely
deployed technologies for ion removal from seawater. The membrane-based desalination
process, such as reverse osmosis (RO) and electro dialysis (ED) are not efficient, especially for
small or medium scale water desalination (i.e., <1000 m3/day) [2, 3]. Also, the dissolved
organics and high concentration of suspended particulates in produced water will trim the
lifetime of membranes due to fouling. Therefore, deployment of sophisticated pretreatment is
Page 15
15
usually required to remove the floating particulates, dissolved metal ions and organics and
prolong the operation lifetime. Heat-based desalination methods including multistage flash
desalination (MSF), multiple-effect evaporation with thermal vapor compression (MEE-TVC)
and mechanical vapor compression (MVC) are generally energy intensive due to large heat
consumption in phase conversion. Other desalination methods such as freeze-thaw deionization
can only be used in cold season. Moreover, sophisticated pretreatment is generally required for
prolonged operating lifetime. Dissolved organics, metal oxide (i.e. Fe2O3), and large variation in
salt concentration (TDS=1000100104 mg/L) are the main factors limiting the deployment of
the conventional desalination technologies for produced water purification.
Humidification-dehumidification (H-DH) is a heating-based desalination process at the
mechanism of air humidification at elevated temperature and water condensation at low
temperature. The typical characteristics of the humidification-dehumidification include
flexibility in capacity, atmospheric pressure operation, and use of low-temperature energy such
as solar energy, geothermal, and other industry waste heat. Such a water desalination process is
based on the fact that air can carry large amount of water vapor at elevated temperatures.
Another interesting feature of the humidification – dehumidification process is that the process
could be carried out below the boiling point of the liquid unlike other typical thermal processes
where extensive energy is used to heat the water to a certain temperature, induce vacuum in the
unit and flash the water to obtain purified vapor. Therefore, the H-DH system clearly is devoid of
all those energy requirements, and is a very promising technology for smaller producers and
lesser water treatment water capacity. For example, by increasing temperature from 30 to 80 C,
1 kg air can carry about 0.5 kg water vapor; about 500 g clean water could be collected upon
subsequent cooling. By viewing the general humidification and dehumidification process for
Page 16
16
producing 1.0 kg clean water, the energy consumption of water heating, evaporation, and air
blowing are 209 KJ, 2260 KJ and 8 KJ respectively, where over 90% of energy consumption is
for the phase conversion.
One attempt for overcome the high energy consumption of phase conversion is to recover the
latent heat released from condensation. Traditionally, the evaporation and condensation occur at
two different towers where the latent heat recovered from condensation can be deployed for feed
water preheating. A limitation of the referenced desalination process is the low water recovery
and high sensitive in heat loss. Recently, Beckman and coworkers reported the modified
humidification-dehumidification process named dewvaporation for enhancement in latent heat
recovery and improvement in energy efficiency [6]. In the dewvaporation process,
humidification and dehumidification occur continuously in two chambers with internal liquid
heat exchanger on the evaporation side. This technique uses air as a carrier gas to evaporate
liquid from a saline solution, using cross flow configuration, at atmospheric pressure [6]. The
experimental set up works on the concept of humidification and de-humidification. The basic
concept is to scrub feed solution with air. Feed water is sprinkled from the top and air is pumped
from the bottom using an air blower. The chamber is filled with packing material for enhanced
water/air contact. The air is humidified as it travels to the top and is de-humidified in another
chamber [1, 4].
Two factors are essential to enhance the mass and heat transfer for the humidification and
dehumidification process: large air-liquid contact surface area and high latent-heat recovery.
Large air-liquid contact area can enhance water evaporation by forming large area of thin water
film and contacting with enforced air flow. The recovered latent heat compensate the heat lose
Page 17
17
during phase conversion (i.e., water evaporation), improving heat efficiency of the desalination
process.
Our recent research indicated that the modified humidification dehumidification process
show great advantages in produced water desalination:
(1) Deployment of co-produced energy sources or solar energy for driving the
desalination process. A specific advantage of the proposed water purification process is that
various low-temperature energies can be used, such as solar energy and co-produced geothermal
energy.
(2) Deployment of heat pump technology for enhancing latent heat recovery. Evaporation
provokes cooling on the evaporation side while water vapor condensation provokes heat release
in the adjacent chamber. Heat released by condensation will transport to the evaporation side for
enhancing water evaporation. Heat pump technology can be deployed for recovering the latent
heat for feed water preheating [9].
In sum, conventional membrane and thermal processes are not only energy intensive and
economically unfavorable for small producers, but also requires a high input volume of water to
be treated. Small quantities of produced water to be treated as seen in the case of small producers
become uneconomical to have a treatment facility on site. Even if water is to be transported to
different locations, transportation costs or laying pipelines makes operating marginally
producing wells un-economical.
In this thesis work, a prototype of produced water purification using the fundamental
theory of humidification-dehumidification has been designed and constructed. Process
Page 18
18
parameters have been established by both parametric studies on the lab unit as well as on the
field prototype.
1.1 Water quality and various end uses
Water that is termed saline contains significant concentration of dissolved salts. The
concentration is the amount by weight of salt in water, as expressed in parts per million (ppm).
For example, if water has a concentration of 10,000 ppm of dissolved salts, then one percent
(10,000 divided by 1,000,000) of the weight of the water comes from dissolved salts [6].
Table 1.1 summarizes the water quality requirements for various uses, and also the main
concerns for having restriction criteria for suspensions and dissolved components for various end
uses.
Page 19
19
Table 1.1 Water quality requirements and various end uses
Beneficial uses
Water quality requirement
Main Concerns Suspensions Dissolved
components
Offshore disposal Solid <10 mg/l
Oil<5 mg/l No limitation Environmental
impact
Reinjection
Solid<1 mg/L
Oil<5 mg/l
MPS<1 m
No limitation Formation damage
Irrigation [22] Oil & grease < 35 mg/l TDS: < 2000 mg/l
Salinity, trace elements, chlorine
residues, and nutrient
Cooling water [19] N/A TDS<2700 Corrosion, biological growth, and scaling.
Chemical process [19] N/A TDS<1000 Low
turbidity, suspended solids and silica
Page 20
20
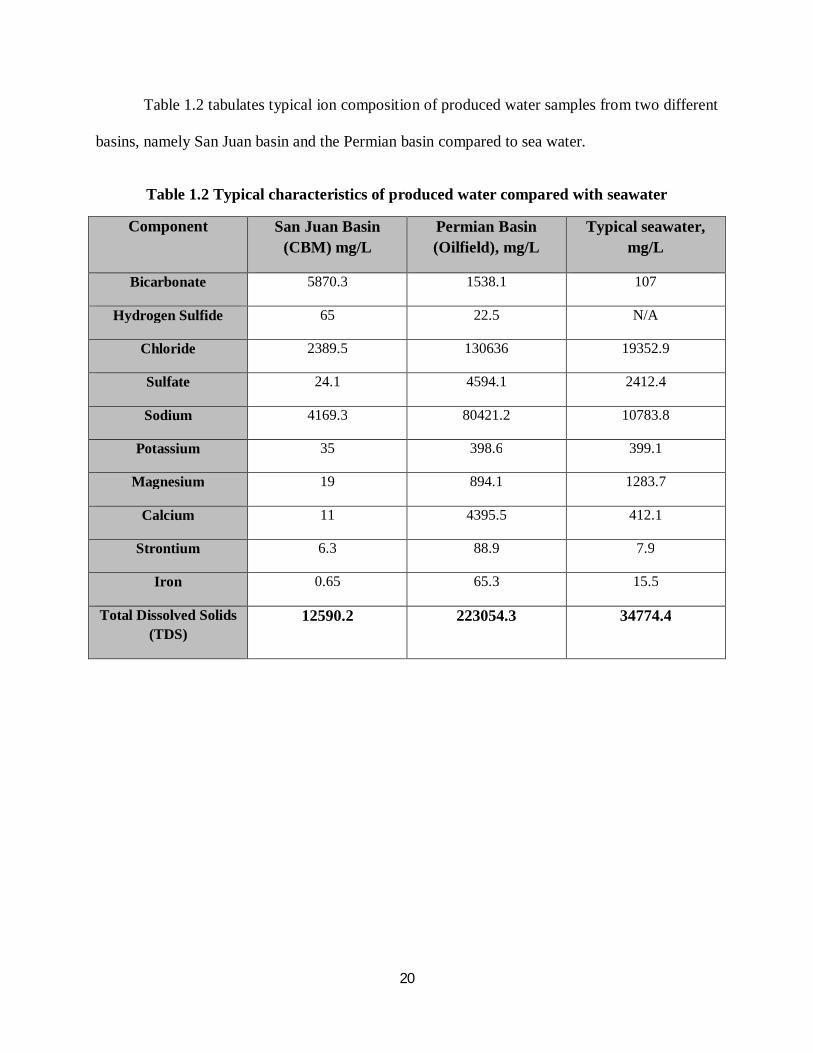
Table 1.2 tabulates typical ion composition of produced water samples from two different
basins, namely San Juan basin and the Permian basin compared to sea water.
Table 1.2 Typical characteristics of produced water compared with seawater
Component San Juan Basin (CBM) mg/L
Permian Basin (Oilfield), mg/L
Typical seawater, mg/L
Bicarbonate 5870.3 1538.1 107
Hydrogen Sulfide 65 22.5 N/A
Chloride 2389.5 130636 19352.9
Sulfate 24.1 4594.1 2412.4
Sodium 4169.3 80421.2 10783.8
Potassium 35 398.6 399.1
Magnesium 19 894.1 1283.7
Calcium 11 4395.5 412.1
Strontium 6.3 88.9 7.9
Iron 0.65 65.3 15.5
Total Dissolved Solids (TDS)
12590.2 223054.3 34774.4
Page 21
21
1.2 Thermal technologies for water Desalination
As discussed earlier, desalination is a process that removes dissolved minerals (including
but not limited to salt) from feed water sources such as seawater, brackish water or treated
wastewater. The techniques for desalination may be classified into two categories according to
the process principle used:
Process based on a physical change in state of the water – i.e. distillation or freezing.
Process using membranes – i.e. reverse osmosis or electro dialysis
These two processes, based on physical change of the water and filtering via membranes,
are regularly used to treat seawater and brackish water and have been developed over many years
in large scale commercial applications. In circumstances of more intense TDS produced water
with high concentration of suspended solid and floating oil, mechanical and thermal technologies
are economically competitive to membrane process. Conventionally, mechanical and thermal
desalination technologies include Multi-stage flash distillation, multiple effect distillation, and
vapor compression distillation [7,8].
1.2.1 Multistage Flash Distillation
Multistage Flash distillation (MSF) accounts for the major portion of desalinated fresh
water currently produced and are used primarily for desalting seawater. This process has been in
large scale commercial use for over thirty years and is illustrated in Figure 1.1.
Page 22
22
Figure 1.1 Basic illustration of MSF process [7].
The principles of MSF involve seawater feed being pressurized and heated to the plant’s
maximum allowable temperature. When the heated liquid is discharged into a chamber
maintained slightly below the saturation vapor pressure of the water, a fraction of its water
content ‘flashes’ into steam. The flashed steam is stripped of suspended brine droplets as it
passes through a mist eliminator and condenses on the exterior surface of the heat transfer
tubing. The condensed liquid drips into trays as hot product (fresh) water. The recirculating
stream, flowing through the interior of the tubes that condense the vapor in each stage, serves to
remove the latent heat of condensation. In doing so, the circulating brine is preheated to almost
the maximum operating temperature of the process, simultaneously recovering the energy of the
condensing vapor. This portion of the MSF plant is called the ‘heat recovery’ section [7,8].
Page 23
23
1.2.2 Multi Effect Distillation
Multi Effect Distillation (MED) is stated as being the most important large-scale
evaporative process, and offers significant potential for water cost reduction over other large-
scale desalination processes. It is predicted that the use of this distillation technology will expand
in the future, over and above the usage of the Multistage-Flash distillation process.
Multiple effect distillation units operate on the principle of reducing the ambient pressure
at each successive stage, allowing the feed water to undergo multiple boiling without having to
supply additional heat after the first stage. Figure 1.2 illustrates the basic MED process.
Figure 1.2 Basic illustration of MED process [7].
In MED units, steam and/or vapor from a boiler or some other available heat source is fed
in to a series of tubes where it condenses and heats the surface of the tube and acts as a heat
Page 24
24
transfer surface to evaporate saline water on the other side. The energy used for evaporation of
the saline water is the heat of condensation of the steam in the tube.
The evaporated saline water, now free of a percentage its salinity and slightly cooler, is
fed in to the next, lower-pressure stage where it condenses to fresh water product, while giving
up its heat to evaporate a portion of the remaining seawater feed [7].
1.2.3 Vapor Compression Distillation
The low temperature Vapor Compression Distillation (VCD) method is a simple, reliable
and highly efficient process. Its efficiency comes largely from a low energy requirement and its
design that is based on the ‘heat pump’ principle of continuously recycling the latent heat
exchanged in the evaporation-condensation process.
VCD is similar in process operation to multi-effect distillation. The main difference is
that the vapor produced by the evaporation of the brine is not condensed in a separate condenser.
Instead, a compressor returns it to the steam side of the same evaporator, in which it originated,
where it condenses on the heat transfer surfaces, giving up its latent heat to evaporate an
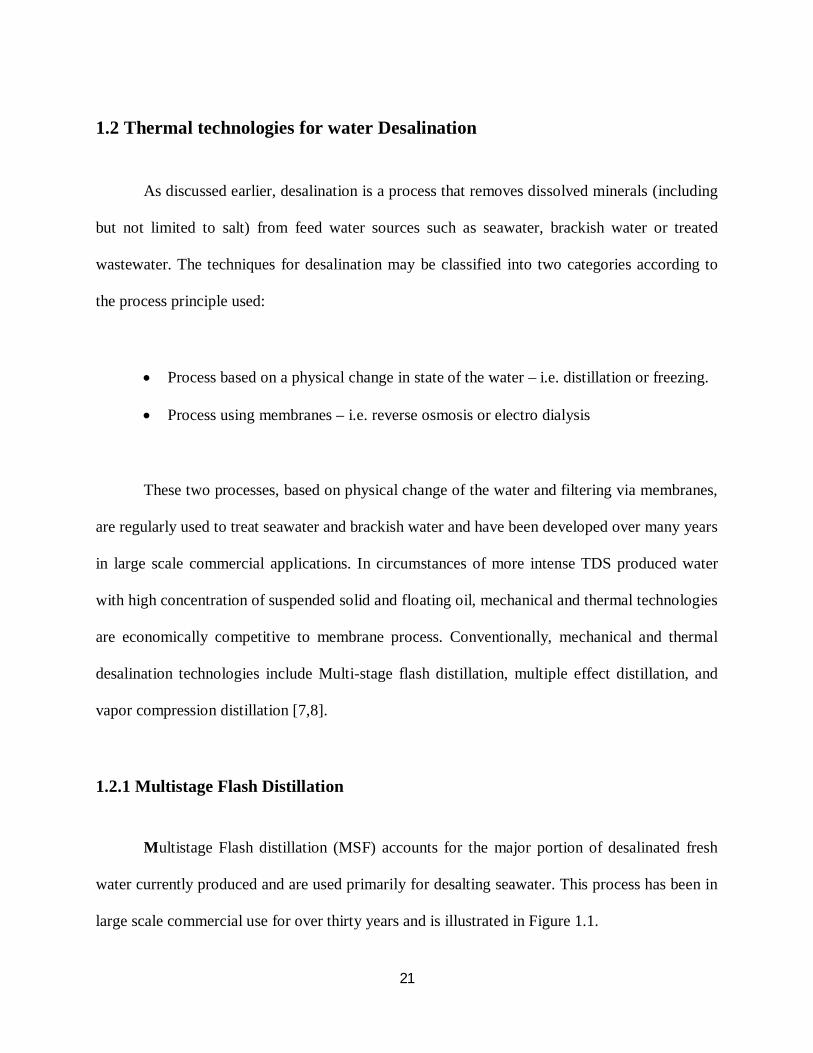
additional portion of the brine as shown in Figure 1.3 [9].
The energy for the evaporation is not derived from a prime steam source as in the
preceding two distillation processes, but from the vapor compressor. In addition, the latter raises
the temperature of the vapor by its compressive action, thereby furthering the driving force for
the transfer of heat from vapor to brine[7, 10].
Page 25
25
Figure 1.3 Illustration of single stage vapor compression distillation [7].
1.3 Economics of desalination technologies
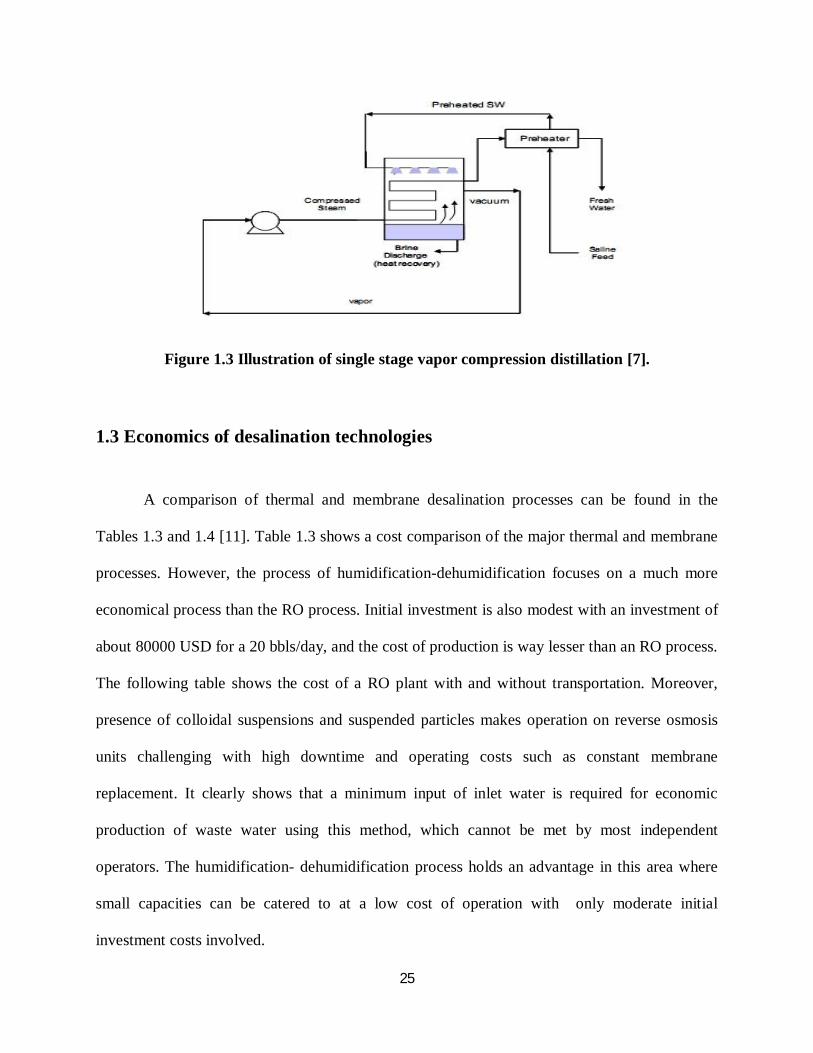
A comparison of thermal and membrane desalination processes can be found in the
Tables 1.3 and 1.4 [11]. Table 1.3 shows a cost comparison of the major thermal and membrane
processes. However, the process of humidification-dehumidification focuses on a much more
economical process than the RO process. Initial investment is also modest with an investment of
about 80000 USD for a 20 bbls/day, and the cost of production is way lesser than an RO process.
The following table shows the cost of a RO plant with and without transportation. Moreover,
presence of colloidal suspensions and suspended particles makes operation on reverse osmosis
units challenging with high downtime and operating costs such as constant membrane
replacement. It clearly shows that a minimum input of inlet water is required for economic
production of waste water using this method, which cannot be met by most independent
operators. The humidification- dehumidification process holds an advantage in this area where
small capacities can be catered to at a low cost of operation with only moderate initial
investment costs involved.
Page 26
26
Table 1.3 Comparison of thermal and membrane processes[11]
MSF RO
Energy consumption ~13 kWh/m3
(70 kWh + 3 to 4 kWh)
4-5 kWh/m3
Recovery 10% - 20% 30 – 50%
Investment [$/m3/day)] ~ 1000 – 1500 ~700 – 1500
(10% for membranes)
Chemicals [$/m3] ~ 0.03 to 0.05 ~ 0.06 to 0.1
Brine Quantity Distillate x 4 to 9 Permeate x 1 to 4
Brine Quality Chemicals, Heat Chemcials
Robustness High Fouling Sensitivity,
Feed water monitoring
Improvement Potential Low High
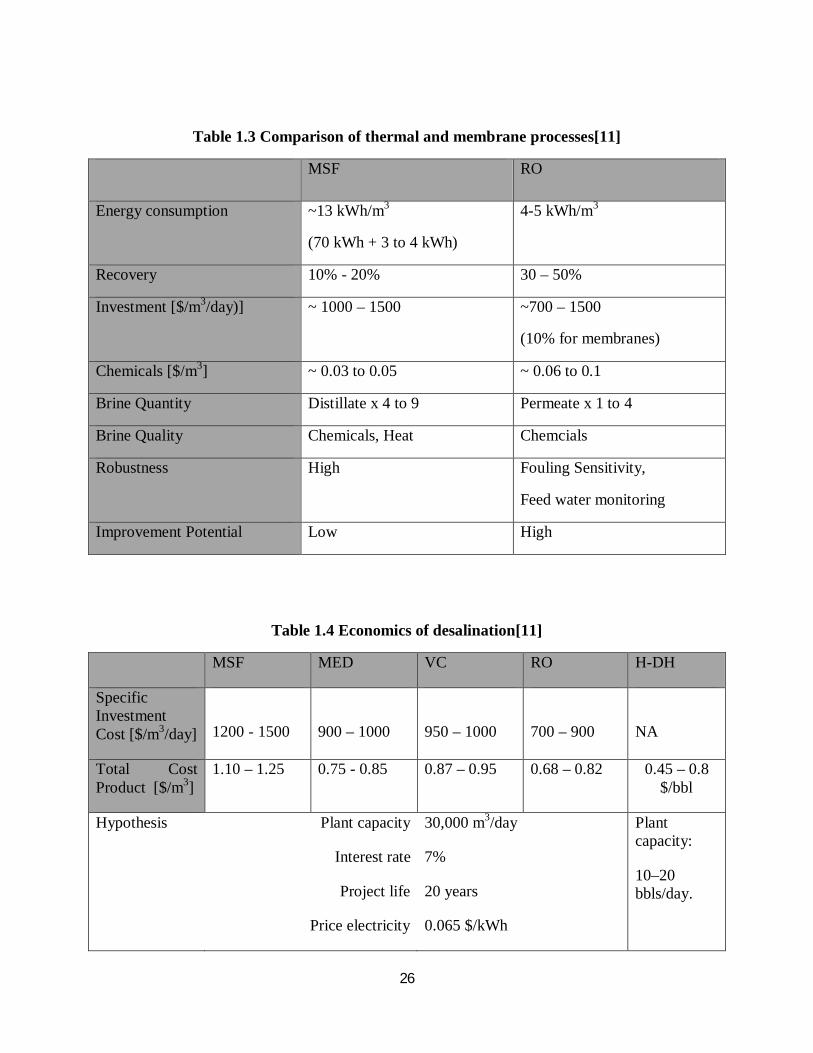
Table 1.4 Economics of desalination[11]
MSF MED VC RO H-DH
Specific Investment Cost [$/m3/day]
1200 - 1500
900 – 1000
950 – 1000
700 – 900
NA
Total Cost Product [$/m3]
1.10 – 1.25 0.75 - 0.85 0.87 – 0.95 0.68 – 0.82 0.45 – 0.8 $/bbl
Hypothesis Plant capacity
Interest rate
Project life
Price electricity
30,000 m3/day
7%
20 years
0.065 $/kWh
Plant capacity:
10–20 bbls/day.
Page 27
27
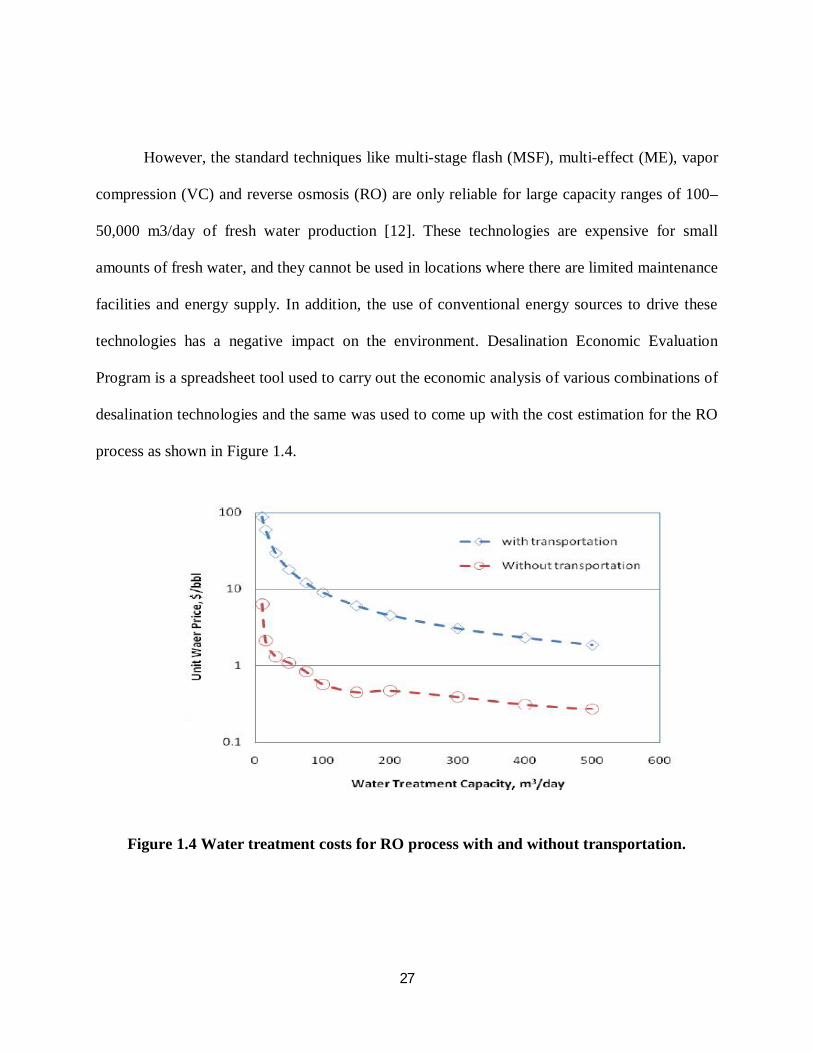
However, the standard techniques like multi-stage flash (MSF), multi-effect (ME), vapor
compression (VC) and reverse osmosis (RO) are only reliable for large capacity ranges of 100–
50,000 m3/day of fresh water production [12]. These technologies are expensive for small
amounts of fresh water, and they cannot be used in locations where there are limited maintenance
facilities and energy supply. In addition, the use of conventional energy sources to drive these
technologies has a negative impact on the environment. Desalination Economic Evaluation
Program is a spreadsheet tool used to carry out the economic analysis of various combinations of
desalination technologies and the same was used to come up with the cost estimation for the RO
process as shown in Figure 1.4.
Figure 1.4 Water treatment costs for RO process with and without transportation.
Page 28
28
The above plot shows as discussed the cost of producing each barrel of water with and
without transportation. The humidification dehumidification process comes into picture here,
where transportation costs are totally eradicated and cost of producing a unit barrel is also very
low as the process is deployed in the well site and obviously membrane costs, maintenance, high
pressure pumping costs etc. all ruled out. The economic estimation for the treatment of produced
water using the thermal and membrane processes as shown in Table 1.4 are for very high plant
capacities. However, the price in dollars per barrel of treated produced water is also tabulated in
Table 1.4 for a very small capacity of up to 20 bbls/day. The only treatment cost incurred for the
system in this study is the operating cost, that includes the pumps utilized for introducing the
process streams into the unit. Heating of inlet feed is carried out using solar panels which also
involves a circulating pump. A good estimate of the operating cost in kWh consumed per barrel
of produced water can be calculated easily using the cumulative Kilowatt consumption of all the
pumps used in the system multiplied with the number of operating hours. The price of electricity
is considered as 0.06 $/kWh, which is the pricing for industrial applications in the state of New
Mexico.
Page 29
29
CHAPTER 2 LOW-TEMPERATURE DISTILLATION
PHILOSOPHY AND THEORETICAL ANALYSIS
The objective of this work is to test a thermal process for produced water desalination at
wellhead by using coproduced energy sources. “Low temperature distillation” defined in this
research is distillation at temperature below 80 C or a thermal evaporation process that operate
below the boiling point of water.
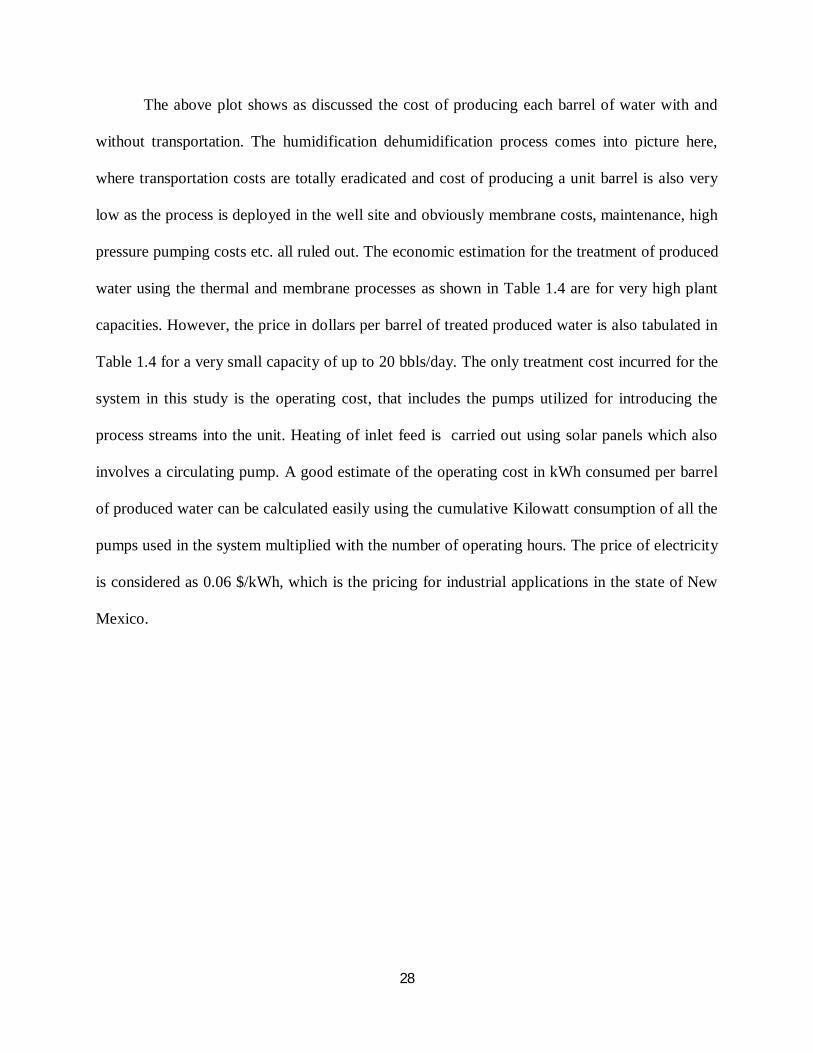
Humidification/dehumidification is a thermal process that operates below the boiling
temperature of water. Conventionally, the humidification and dehumidification was carried out
in two separate towers in which the part of the latent heat was reused. Recently, Beckman and
coworkers have integrated the humidification dehumification process in one single tower named
dewvaporation in which the internal heat transfer is more efficient [2]. Multiple evaporation
chamber and condensation chamber are separated by thin stainless steel thin plate for enhanced
latent heat recovery as shown in Figure 2.1. In the evaporation side, the feed air first contact with
concentrate wate for air preheating and then moves upward to contact with water film for water
extraction. The resultant humidified air in the water distribution chamber will be directed to the
dehumidification chamber for water condensation.
The evaporation of produced water provokes cooling effect on feed side, resulting
temperature decline along the upright shell of the steel plate. Water condensation at the
condensation chamber releases large amount of latent heat, which will transport from the
dehumidification side to the evaporation side. Figure 2.2 is a schematic showing the heat and
Page 30
30
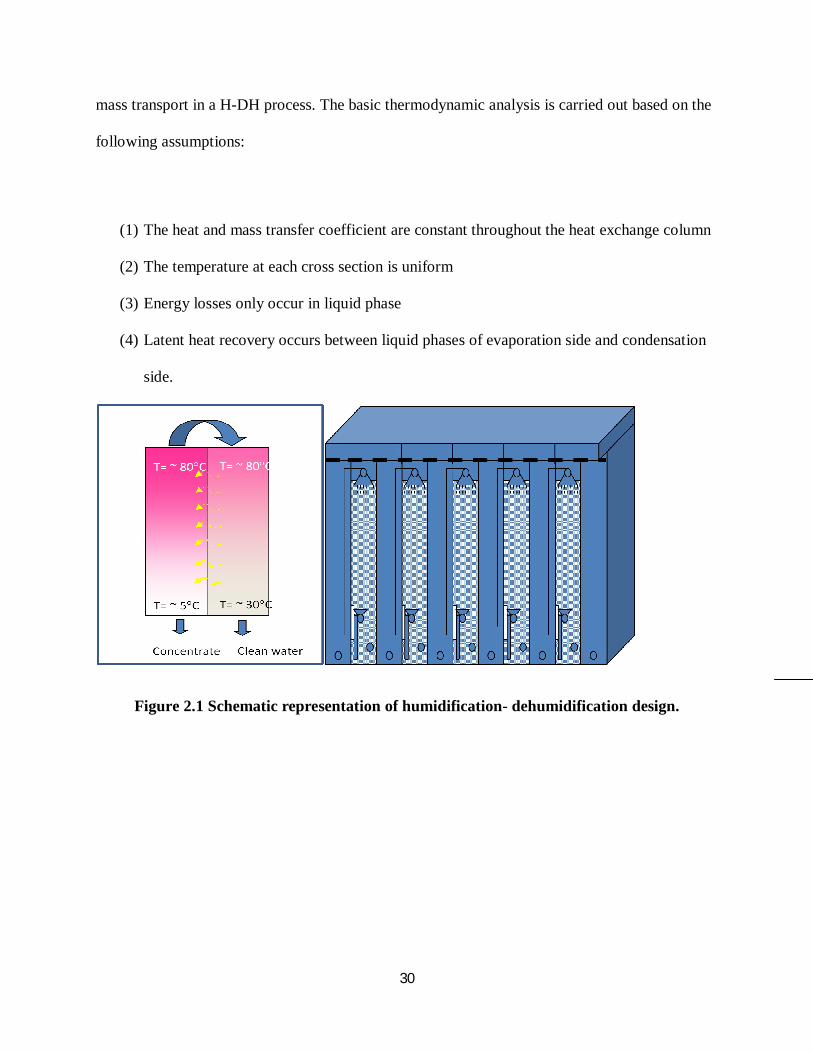
mass transport in a H-DH process. The basic thermodynamic analysis is carried out based on the
following assumptions:
(1) The heat and mass transfer coefficient are constant throughout the heat exchange column
(2) The temperature at each cross section is uniform
(3) Energy losses only occur in liquid phase
(4) Latent heat recovery occurs between liquid phases of evaporation side and condensation
side.
Figure 2.1 Schematic representation of humidification- dehumidification design.
Page 31
31
Figure 2.2 Schematic representation of air enhanced H-HD process.
Energy balance
The application of energy balance between falling water film and flowing air stream in the
evaporation chamber provides:
Energy balance for gas phase:
(1)
Energy balance for liquid phase:
(2)
The term ha stands for the specific enthalpy of moist air with an expression as follows [21]
(3)
aaaLsaa mdhhdQdQhm )(
LossSLwwwwRww dQdQdQdhhdmmdQhm ))((
)( , asat
spaapaa TCHTch
Page 32
32
where ha represent the specific enthalpy of moist air, Cpa represent the specific heat capacity of
dry air. The term dQs represents the sensible heat transfer from liquid phase to air stream due to
the temperature difference with an expression of
(4)
where a is the effective heat transfer area for liquid/air contact, m2/m3. In the term,
represents the mass transfer coefficient between water film and air stream and can be express by
the following relation [13]
(5)
(6)
where K is the mass transfer coefficient and Le is the Lewis number.
The term dQL is the latent heat transferred to the air stream accompanying water evaporation.
(7)
Substituting eqs (3), (4), and (7) to eq (1), the variation of humidified air temperature along the
longitude of evaporation chamber is obtained:
(8)
The variation of humidity along the longitudinal axis can be expressed by the following relation
[14]
dZTTadQ awLAs )(
LA
pmLA cKLe
6.04.0 )()(2A
mA
mK aw
)( , wsat
spwL TCdmdQ
)()(
)( ,
, dZdHC
mL
HCCTT
dZdT sat
sp
a
LAsat
sppa
awa
Page 33
33
(9)
where Hsat is the saturation humidity ratio of air with a definition of
(10)
The change in gas enthalpy is the change in sensitive heat and latent heat of evaporation.
(11)
The heat loss through wall to the ambient environment is expressed as,
(12)
where b is the exposure surface area to the environment, m2/m3, is the environmental
temperature, C.
The rate of heat transfer from the liquid phase of condensation side to the liquid phase of
evaporation side is proportional to the driving force ( ) and heat transfer area, with an
expression of
(13)
Where k is heat transfer coefficient from condensation side to the evaporation side, W/m2.C. c is
the effective heat transfer area between evaporation chamber and condensation chamber, m2/m3.
Substituting eqs. (4), (7), (12) and (13) into eq. (2), water temperature gradient along the
longitude of evaporation chamber is obtained:
])([ )(awsat
a
HTHmLK
dZdH
)()(
622.0)(w
satwsa
wsat
wsw
sat
TPPTP
TH
satsppapm HCcc ,
dZTTbKdQ EnvwLossLoss )(
EnvT
ww TT '
dzTTkcdQ wwR )( '
Page 34
34
(14)
Similarly, the application of energy balance in the condensation chamber provides:
Energy balance for gas phase:
(15)
Energy balance for liquid phase:
(16)
Mass balance:
is saturated humidity at temperature T.
pww
wwEnvwLosswpww
satsp
pww
aw
cMTTckTTbk
dzdHTCTc
cMm
dzdT )()()(
'
,
''''''' )( Lsaaaaa dQdQdhhmhm
''''''''' ))(( LossRwwwwsLww dQdQdhhdmmdQdQhm
'aa mm
)('aa TH
Page 35
35
CHAPTER 3 BENCH SCALE TESTS
In this chapter of work, bench scale test was carried out and the influence of water flow
rate, air flow rate, cooling water flow rate in the dehumidifier on water productivity, and latent
heat recovery has been investigated. The result shows an ion rejection of over 75% for the
sample collected in one hour, which is also the range required for various end uses. However, the
samples collected during the second and third hour shows a remarkable increase in ion
concentration. This is due to intermixing of the pure water and the NaCl solution at the base of
the unit which is separated by plastic foils. Leakage between each chamber inside the chamber is
the reason why a sharp increase in ion concentration is observed. A similar test carried out using
tap water alone resulted in an ion concentration decrease from 85 ppm to 42 ppm for Na+ , and
140 ppm to 68 ppm for Cl-.
3.1 Lab scale experimental set up
The experimental set up consisted of an acrylic body, with humidification-
dehumidification chambers inside it. Produced water was introduced into the humidification
chamber by using a pump at a rate of about 1.5 L/min. A steam generator of capacity 25 lb/hr is
connected to the inlet, which heats the input stream. Air is pumped from the bottom which scrubs
through the inlet water. The air is humidified and condensed in the adjacent chamber as water
trickles down counter current to the inlet air stream. The air flow rate was adjusted to a value
where the water to air ratio was 40 as conducted in the lab scale experiments.
Figure 3.1 is a schematic representation of the pilot scale water purification set up.
Page 36
36
Figure 3.1 Schematic representation of bench scale experimental setup.
Page 37
37
Label 1 is the steam generator used to heat inlet feed to desired process temperature. The
steam generator requires a water inlet pressure at least 20 psi greater than the operating pressure
of the steam generator which is about 15 psi. Label 2 is the inlet water pump which feeds the
water at the desired flow rate. Label 3 represents the air pump that pumps air counter current to
inlet water flow. Label 4 is the water purification unit itself. Label 5 shows the condensed
purified water. Label 6 and 7 are the water and air flow meters respectively. Similar to the
conventional humidification-dehumidification process [2], the produced water purification by the
humidification-dehumidification was carried out through three steps: (1) heating produced water
to elevated temperatures; (2) water evaporation in a water-air contactor; and (3) condensing
purified water vapor by condensation.
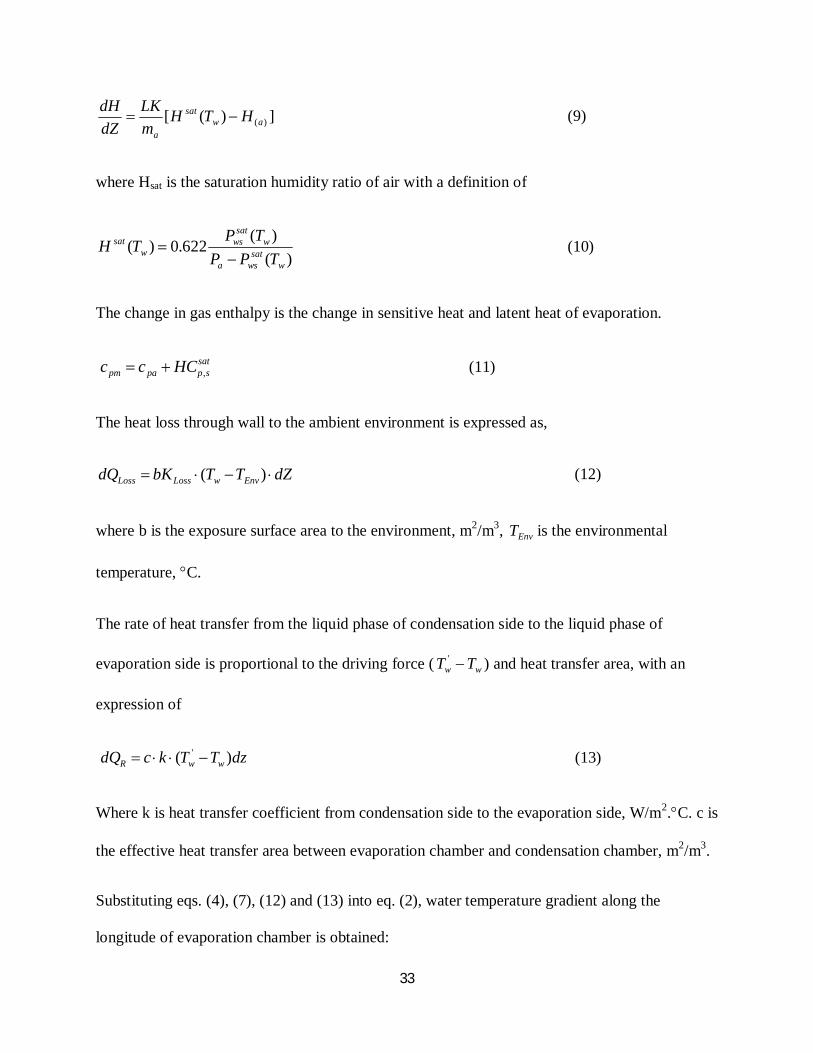
Figures 3.2 displays the bench scale setup of humidification dehumidification unit for
produced water desalination test.
Page 38
38
Figure 3.2 Pilot scale H-DH unit.
3.2 Parametric studies
Lab tests have been carried out for parametric studies. The process parameters, yield and
ion rejection potential of the process were obtained through the lab scale tests. The results of the
lab tests are in accordance with data published in literature as well. An increase in water
productivity is seen with an increase in inlet water temperature. However, a scale up of this
extent needs to take into consideration for scaling up from the bench test to field scale prototype.
Connections for water inlet
Connections for air inlet and concentrate discharge.
Page 39
39
The basic parameters established in the lab scale set up are shown in Figure 3.3.
Figure 3.3 Basic parameters established in lab scale tests.
The inlet water flow rate was varied from 20 to 30 ml/min with an inlet air flow rate of
1250 L/hr, giving an air to water ratio varying from 40 to 65. A direct scale up of this system was
also used in the field scale prototype with an inlet water flow rate ranging between 1 – 5 L/min
and an inlet air flow rate of 19.2 x 10⁴ L/hr. A parametric study of varying water and air flow
rates in the field scale prototype has also been studied and presented in the results section.
Humidification Dehumidification unit
INLET WATER RATE Flow rate: 0.02 l/min
0.1 mol/L Nacl
INLET AIR RATE Flow rate: 0.02 ml.min
0.1 mol/L Nacl
PURE WATE PRRODUCTIVITY
Flow rate: 0.025kg/h.m2 Yield: 7.5%
Page 40
40
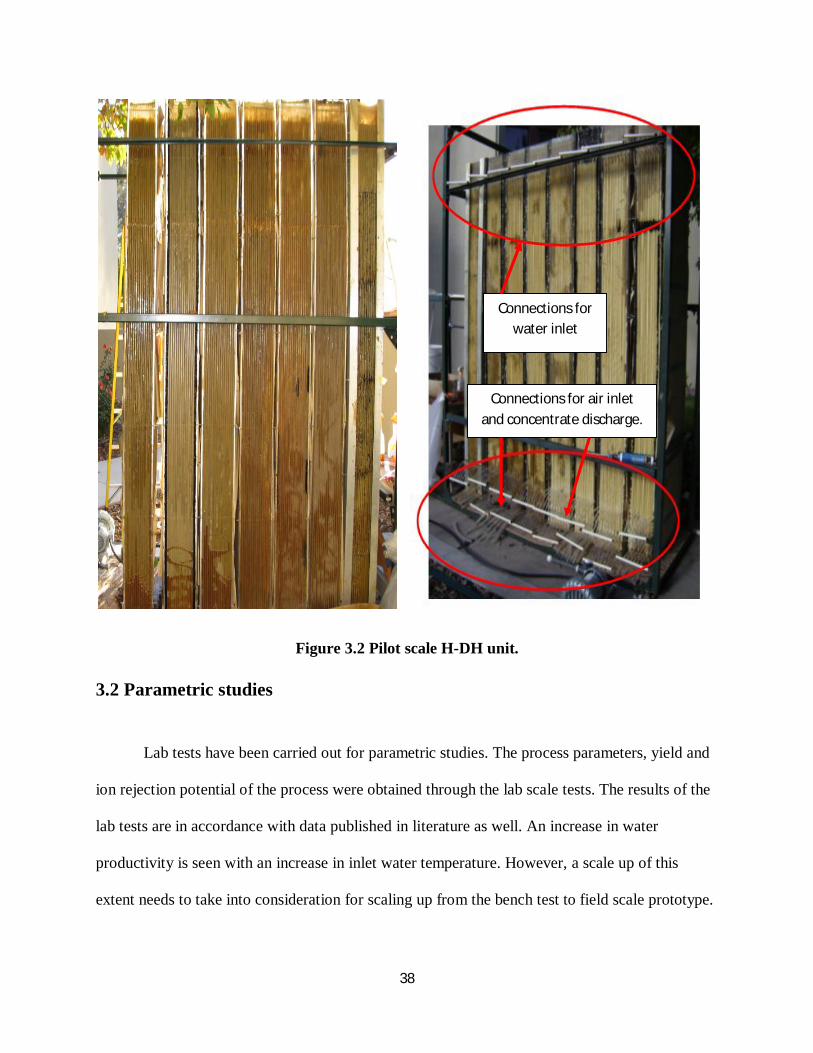
Table 3.1 Basic parameters established in the lab scale
Lab scale Field scale prototype
Inlet water flow rate range (mL/min)
20-35 800 - 2000
Inlet air flow rate range (L/ hr)
1250 – 2500 3.2 x 10⁴ – 22.8 x 10⁴
Air to Water ratio range 62.5 - 70 41 - 114
The pump sizing for the field prototype was selected to cover the ranges tested in the lab
scale tests. Therefore a parametric study could be carried out both within and outside the
parameters tested before. The field prototype has the provision to change the air to water ratio
from 41 to 114. Results of parametric studies in detail are further discussed in Chapter 5. Table
3.1 shows the inlet water flow rate, air flow rate and the air to water ratio’s tested in the lab scale
and the capacity or the possible operating ranges for the field scale prototype.
Page 41
41
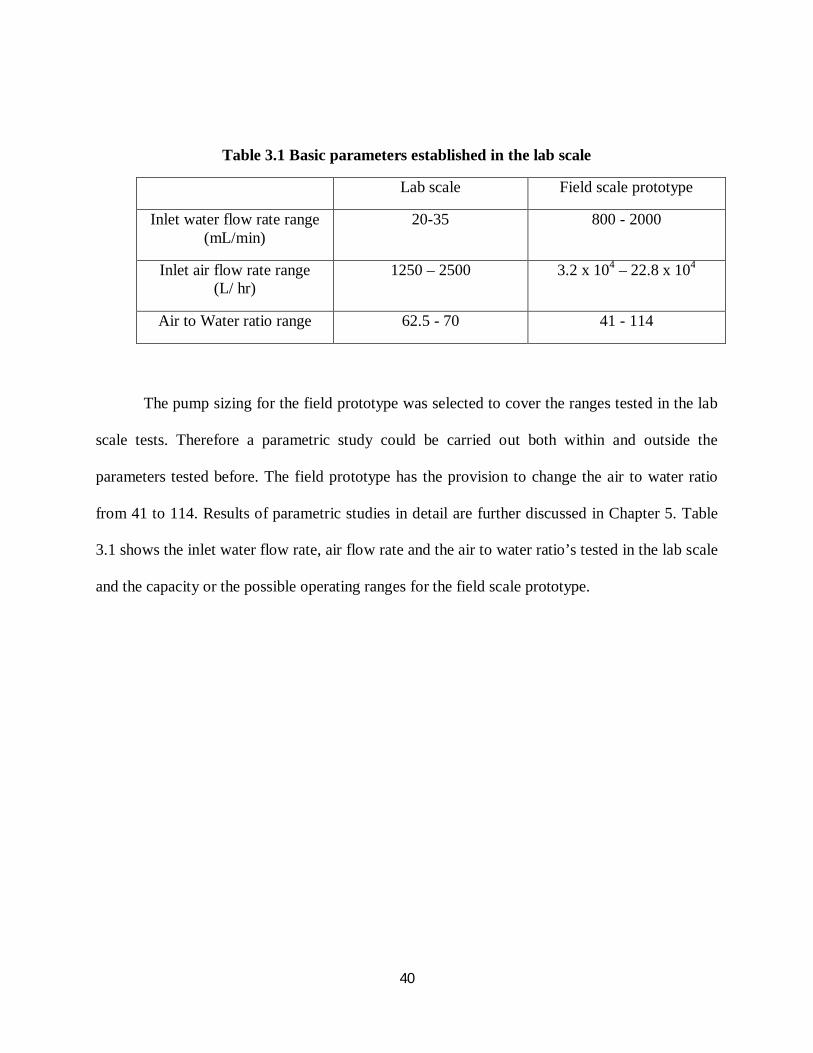
3.3 Troubleshooting lab scale prototype process
A fishbone analysis or mind mapping was carried out to circle down upon possible
reasons for poor yield after the bench scale laboratory tests. The figure 3.4 shows the
fishbone diagram after the analysis.
Figure 3.4 Fishbone diagram for troubleshooting the process.
Page 42
42
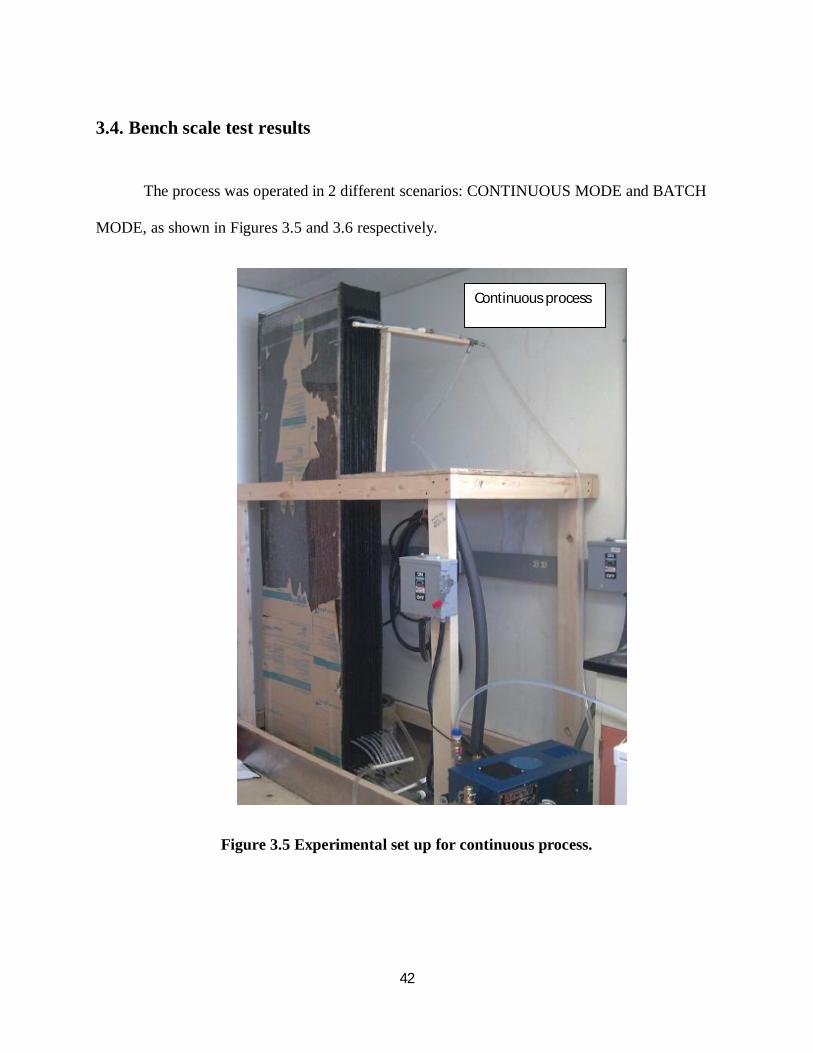
3.4. Bench scale test results
The process was operated in 2 different scenarios: CONTINUOUS MODE and BATCH
MODE, as shown in Figures 3.5 and 3.6 respectively.
Figure 3.5 Experimental set up for continuous process.
Continuous process
Page 43
43
Figure 3.6 Experimental set up for batch process.
The heat transfer rate is calculated for the desired temperature gradient, which is used to
determine the mass flow rate of steam. This is used to size the steam generator as well as
determine the time required for batch heating with steam for tests.
Batch process
Page 44
44
A steam generator had to be sized for heating the process batch and the basic requirement
was:
To heat a batch of liquid from ambient conditions to 80°C.
Continuous heating on inlet water by direct steam injection.
The amount of steam required for heating up the inlet stream is calculated as follows.
Details are tabulated in Table 3.2 and 3.3 [2].
Steam generator rating: 25 lb/hr
Temperature gradient: (158 – 68) deg F
(Assuming 20°C inlet water and 70°C water entering the purification chamber)
Heating capacity of steam: 1 lb of steam condensed releases about 1000 Btu.
Page 45
45
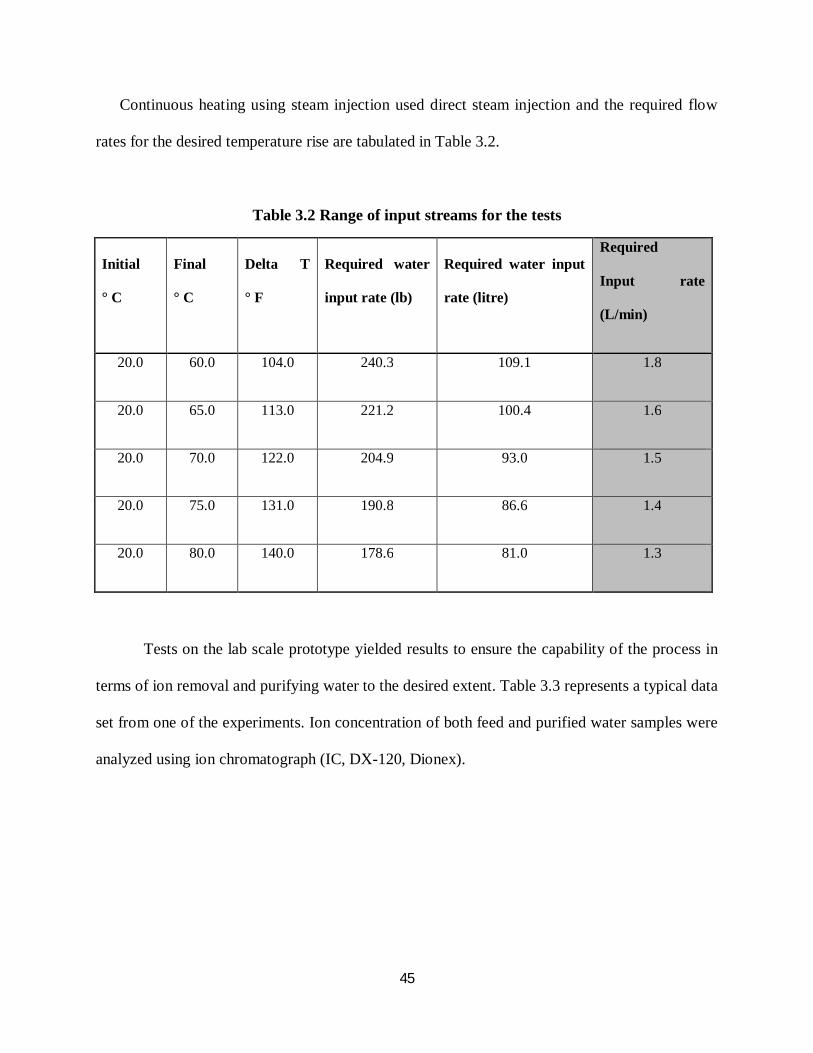
Continuous heating using steam injection used direct steam injection and the required flow
rates for the desired temperature rise are tabulated in Table 3.2.
Table 3.2 Range of input streams for the tests
Initial
° C
Final
° C
Delta T
° F
Required water
input rate (lb)
Required water input
rate (litre)
Required
Input rate
(L/min)
20.0 60.0 104.0 240.3 109.1 1.8
20.0 65.0 113.0 221.2 100.4 1.6
20.0 70.0 122.0 204.9 93.0 1.5
20.0 75.0 131.0 190.8 86.6 1.4
20.0 80.0 140.0 178.6 81.0 1.3
Tests on the lab scale prototype yielded results to ensure the capability of the process in
terms of ion removal and purifying water to the desired extent. Table 3.3 represents a typical data
set from one of the experiments. Ion concentration of both feed and purified water samples were
analyzed using ion chromatograph (IC, DX-120, Dionex).
Page 46
46
Table 3.3 A typical lab scale result of yield
Input water rate (L/min)
Input Temp. (°C)
Time (min)
Recycled water temp (°
C)
Output water temp (° C)
Output water quantity
(ml)
1.3 L/min
72
15.0 28.0 19.0
1200
30.0 29.0 19.0
45.0 29.0 19.0
60.0 28.0 19.0
75.0 29.0 19.0
90.0 29.0 19.0
105.0 27.0 19.0
120.0 27.0 19.0
An analysis of the water quality was done in experiments carried out in the lab prior to
building the pilot scale lab unit. An ion rejection of 99% ion rejection was observed [16].
However, in the above case the Na+ and Cl- concentrations before and after the experiment are
measured and the result shows an ion rejection of over 75% for the sample collected in one
hour, which is also the range required for various end uses. With extended experimental time, the
ion concentration increases dramatically. This is due to intermixing of the pure water and the
NaCl solution at the base of the unit, which is separated by plastic foils. Leakage between each
chamber inside the it is the reason why a marked increase in ion concentration is seen.
This data set is a typical one obtained from the pilot scale lab prototype, and shows the
capacity of the process, which also buttresses the results and process capability of the previously
carried out lab prototype.
Page 47
47
A similar test carried out using tap water alone resulted in an ion concentration decrease
from 85 ppm to 42ppm for Na+, and 140 ppm to 68ppm for Cl-.
Page 48
48
CHAPTER 4 DESIGN AND CONSTRUCTION OF WATER
TREATMENT PROTOTYPE
4.1 Field prototype fabrication/set up
The water purification unit to be installed at the wellhead was an extension of the laboratory
unit. The unit consists of alternate hot and cold chambers, the hot chamber containing the
packing material into which the produced water would be introduced. Air would be blown from
the bottom of the same chamber, which would be tapped in through the adjacent chamber for
water condensation. Alternative low duty Freon condenser was also designed with possibility to
induce vacuum in the unit for operations with different system configurations.
The bench scale tests indicated that ions can be effectively removed using the H-DH process.
However, the yield was low, and several other challenges were faced such as, insufficient heat
transfer within the process chamber, leakage, material of construction etc., which could be
attributed to the material of construction.
The factors taken under consideration while designing the field scale prototype were
1) Process
2) Material of construction
3) Manual/ Automatic controls.
4) Environmental factors.
5) External equipment to be hooked to the water purification unit.
Page 49
49
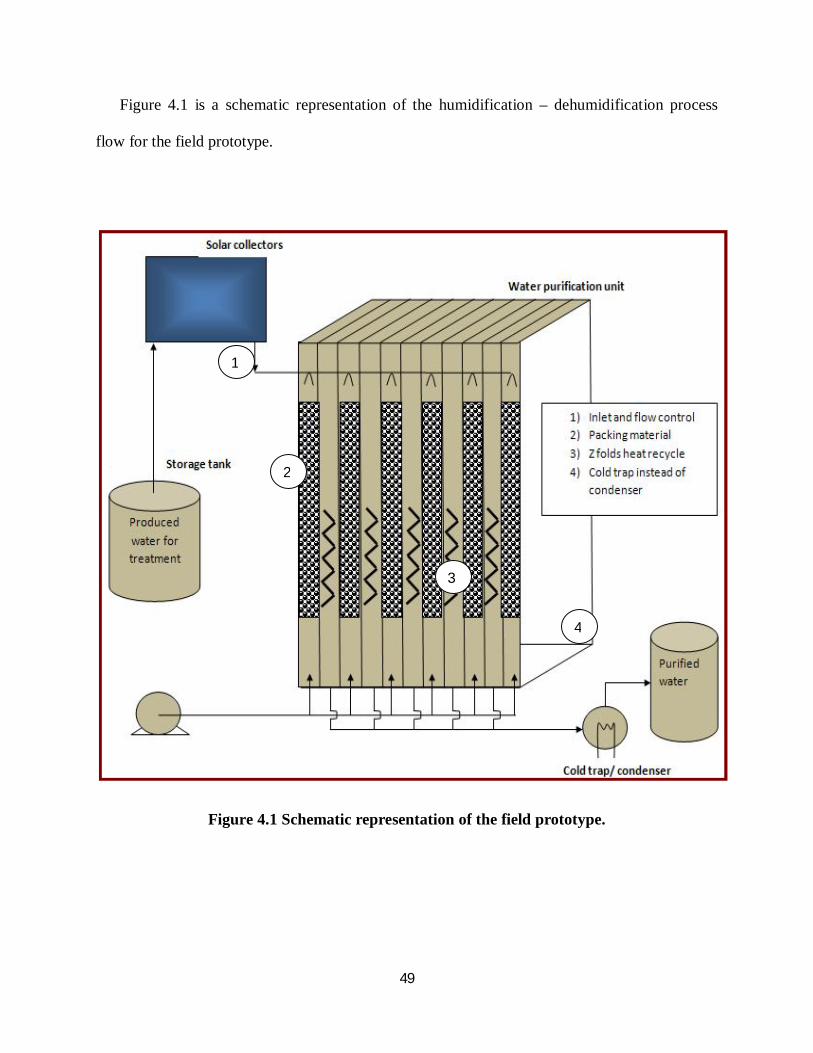
Figure 4.1 is a schematic representation of the humidification – dehumidification process
flow for the field prototype.
Figure 4.1 Schematic representation of the field prototype.
1
2
3
4
Page 50
50
Main components of the produced water desalination unit include: (1) water heating
system by using solar energy sources, (2) water evaporation unit, and (3) water recovery system
with high latent recovery. Produced water from wellhead has a temperature around 45-60C. The
produced water will be further heated to the designed temperature (i.e., 60-80C) by using solar
energy. Produced water at elevated temperature is next introduced into the desalination unit as
shown in the Figure 4.1 for water vaporization. As water falls to the bottom of the vessel by
contacting with air flowing in a counter direction, water vapor will be extracted by flow air and
form humidified air stream. The humidified air enters into the adjacent condensation chamber
and water condenses on the surface with latent heat recovery: creating clean water for beneficial
uses. Temperature and pressure sensors have been installed along the longitudinal of the
separation unit to monitor the temperature and pressure changes at different temperature and
operating condition. A water meter is installed to record total amount of clean water generated
from the process. Both feed water and purified water will be studied for chemistry.
Page 51
51
Figure 4.2 is a pre-design mind mapping carried out before the start of fabrication showing
all the factors considered to be incorporated in the design. This helped narrow down in the finer
aspects of the prototype needed to test the unit both on and off site.
Figure 4.2 Mind mapping for design of field prototype.
Page 52
52
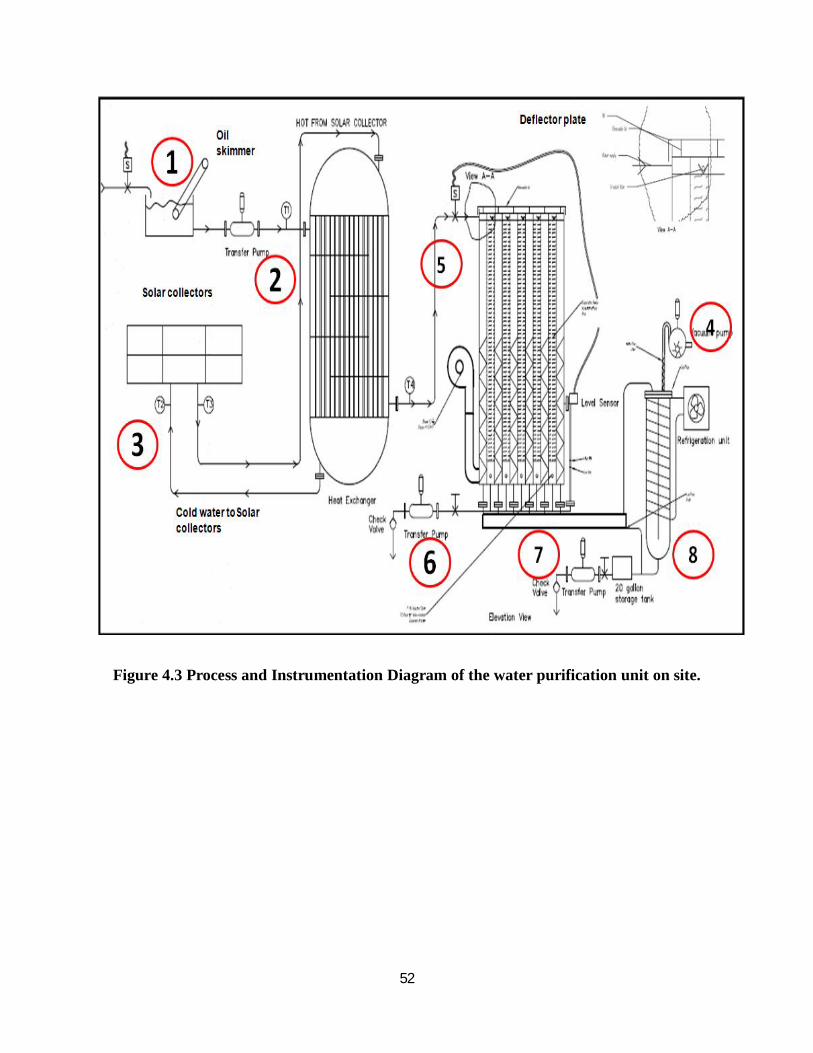
Figure 4.3 Process and Instrumentation Diagram of the water purification unit on site.
Page 53
53
Figure 4.4 Plan view of the equipment prototype.
Page 54
54
A detailed description of the labeled parts in Figure 4.3 and 4.4 follow.
1) Oil skimmer: The primary function of the oil skimmer would be to separate out the initial
oil from the produced water. A simple skimming mechanism will be used for the purpose.
2) Heat Exchanger: A heat exchanger (shell and tube) which performs the function of heat
exchange was also considered to be used as a storage tank for the heated water. However,
the heat exchanger has been progressed further in the process flow diagram and is being
used to condense vapors from the system. A typical shell and tube heat exchanger sized at
2.5 m2 costs over 40000 USD for fabrication. Moreover, there is no utility supply such a
chilled water or cooling water in the field, which gave rise to the Freon chilling system.
Tests have been carried out using both the Freon chiller as well as a conventional
condenser that was previously used for lab scale test purposes. The heat transfer area for
the Freon chiller was 1.5 m2, and that of the condenser used was about 2.4 m2.
3) Solar collectors: Flat plate solar collectors and evacuated tubes were considered to
perform the required heating on inlet water. However, flat plate solar collectors have
been sized to perform the required function. The amount of energy required to heat 20
bbls of water per day from ambient conditions to 70°C was the basis. A detailed
description of the sizing the solar system and a flow diagram will be presented at a later
stage. For experiments carried out on the field prototype before installing the solar
system, a steam generator was used to heat up the inlet water up to 80°C. A n electric
water heater was also used, but could only heat the inlet water up to 70°C.
Page 55
55
4) A condenser/cold trap will be used to condense out and collect the purified water. The
condenser works on a Freon refrigerant for the lack of chilled or cold water utility supply
on site. However, test were also carried out using a conventional shell and tube condenser
that was fabricated for lab scale tests.
5) Water purification unit: The process of humidification and dehumidification is carried out
in this unit. Eleven chambers alternately carry water and air counter currently. The
remaining chambers carry the vapor which is carried out into the condenser. The water
purification unit is made up of SS304 and the inside chambers are fabricated with SS316
which is more corrosion resistant in produced water. A solar heating system for heating
the input produced water to the process has also been procured. A detailed explanation of
the water purification unit, the individual chambers and the mechanism of operation has
been discussed separately.
6) Transfer pump: The transfer pump serves the purpose of re-circulating the hold up water
at the bottom of the unit. The water is pumped back to the top which trickles down the
packed column. Alternatively, the transfer pump can also be used to drain any hold up
liquid over left at the bottom of the unit before the start of a new trial. Figures 4.5 to 4.8
display the fabricated prototype.
Page 56
56
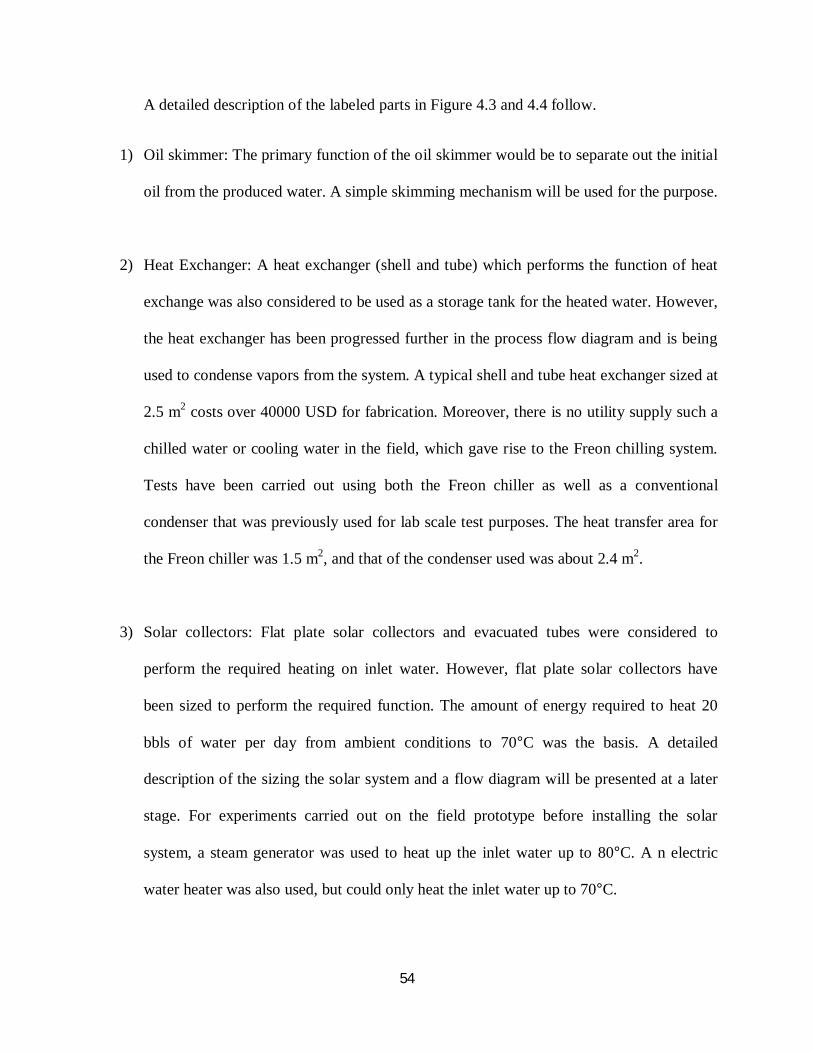
Figure 4.5 Field prototype in the fabrication shop.
Page 57
57
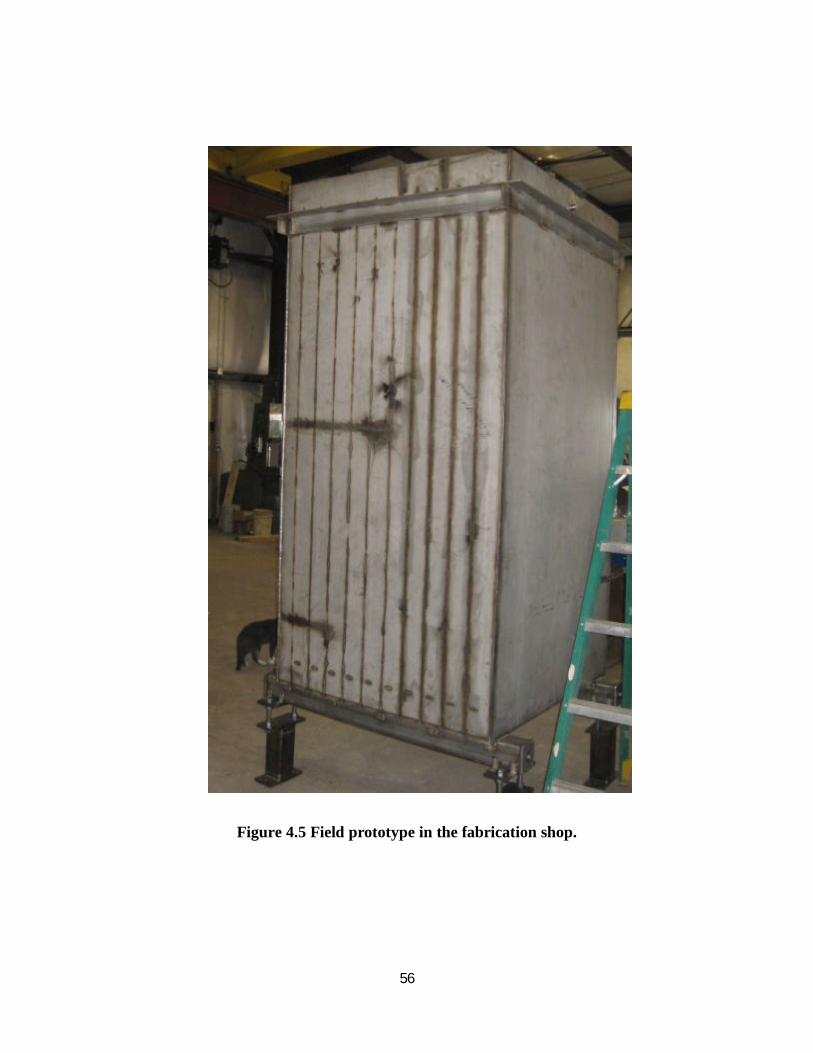
Figure 4.6 Fabricated prototype using H-DH cycle.
The process of purifying produced water is achieved through the process of
humidification- dehumidification using the field scale prototype in the Figure 4.5. The Figure 4.6
is labeled which also explains the working principle of the system. Label 1 on the figure shows
the vacuum pump inducing vacuum within the system. The condenser / cold trap is connected to
the water purification unit, which is also induced under vacuum. A maximum vacuum of 20
inHg can be reached within the system. Label 2 shows the inlet of air carrying water vapor from
1
2
3 4
Page 58
58
the process, which is also the purified water exit stream from the process after the condensation
process. Label 3 is the cold trap or in other words the condenser which works on a refrigeration
system. Label 4 is the water purification unit made of stainless steel, SS304 on the outside. The
inside plates separating the humidification and de-humidification chambers are made of SS316
sheets. The water purification unit consists of 11 chambers inside with 5 chambers being the
humidification chambers and the other 6 being the de-humidification chambers.
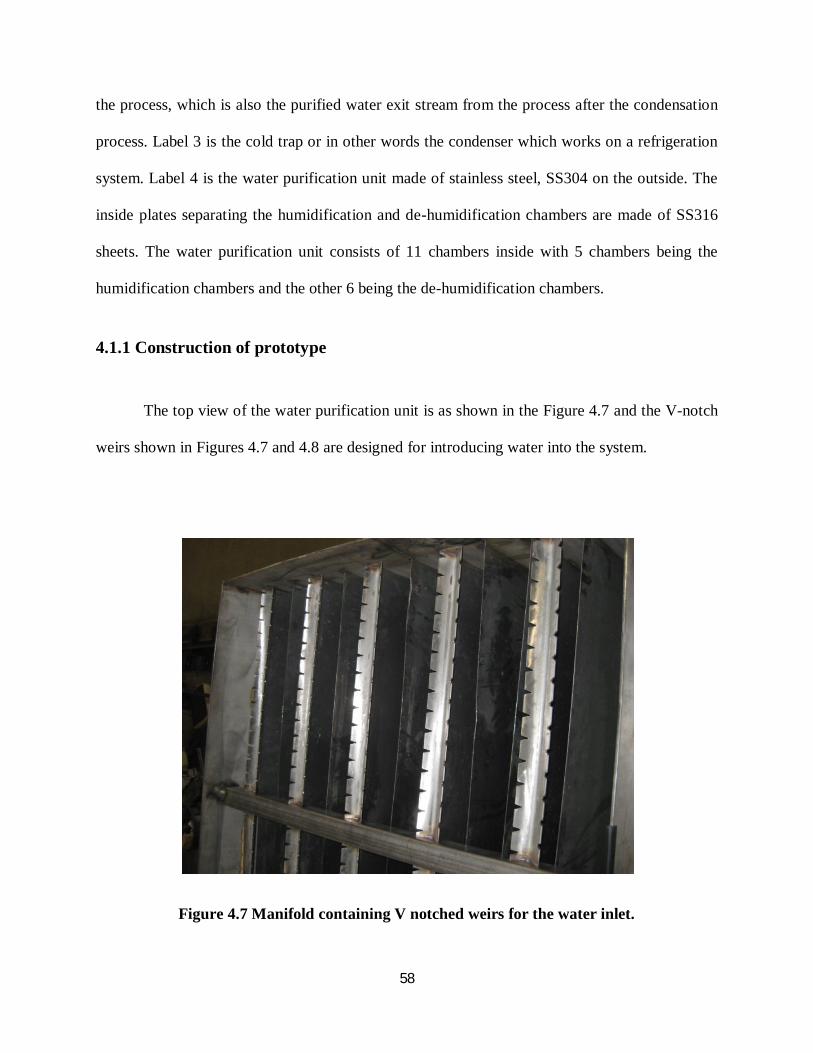
4.1.1 Construction of prototype
The top view of the water purification unit is as shown in the Figure 4.7 and the V-notch
weirs shown in Figures 4.7 and 4.8 are designed for introducing water into the system.
Figure 4.7 Manifold containing V notched weirs for the water inlet.
Page 59
59
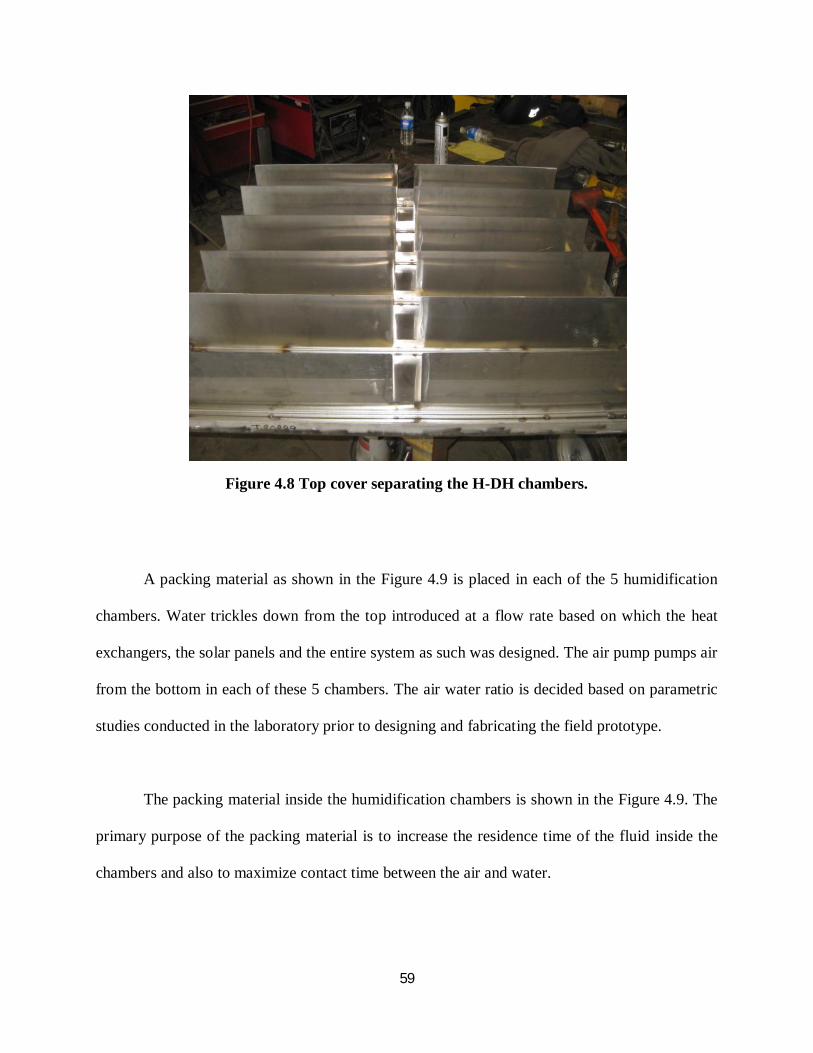
Figure 4.8 Top cover separating the H-DH chambers.
A packing material as shown in the Figure 4.9 is placed in each of the 5 humidification
chambers. Water trickles down from the top introduced at a flow rate based on which the heat
exchangers, the solar panels and the entire system as such was designed. The air pump pumps air
from the bottom in each of these 5 chambers. The air water ratio is decided based on parametric
studies conducted in the laboratory prior to designing and fabricating the field prototype.
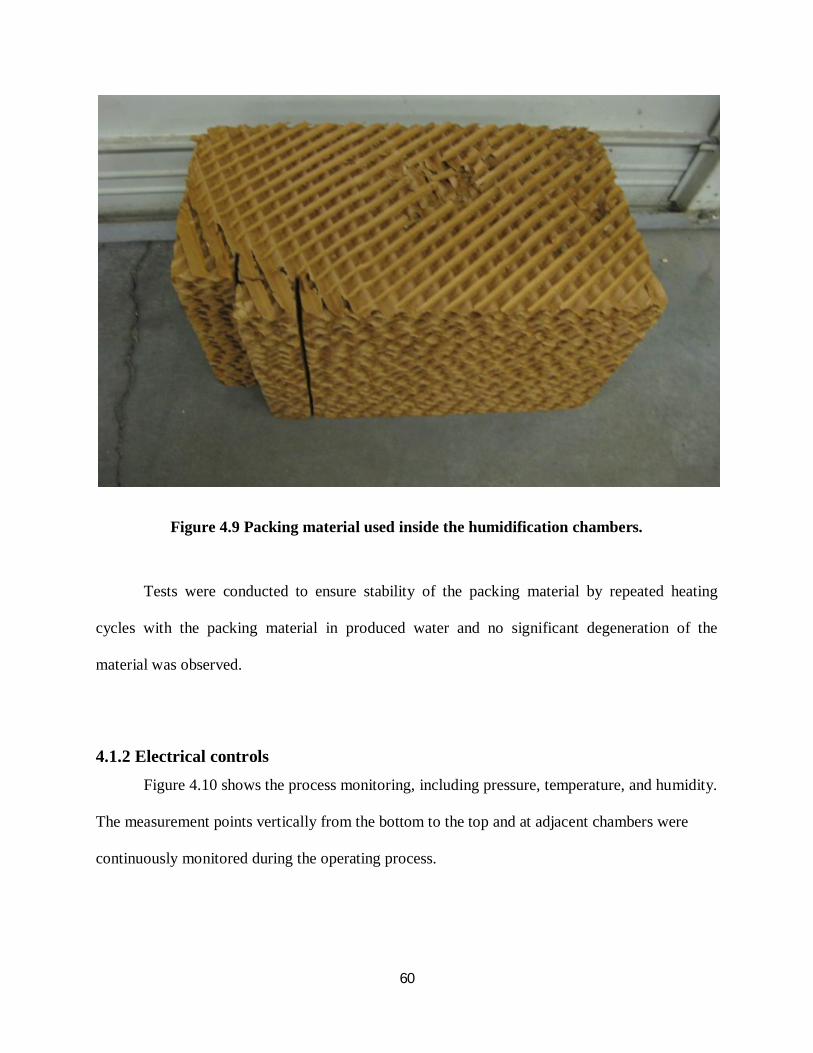
The packing material inside the humidification chambers is shown in the Figure 4.9. The
primary purpose of the packing material is to increase the residence time of the fluid inside the
chambers and also to maximize contact time between the air and water.
Page 60
60
Figure 4.9 Packing material used inside the humidification chambers.
Tests were conducted to ensure stability of the packing material by repeated heating
cycles with the packing material in produced water and no significant degeneration of the
material was observed.
4.1.2 Electrical controls Figure 4.10 shows the process monitoring, including pressure, temperature, and humidity.
The measurement points vertically from the bottom to the top and at adjacent chambers were
continuously monitored during the operating process.
Page 61
61
Figure 4.10 Gauges for process parameter monitoring.
The electrical controls for the unit are shown in Figure 4.11. The unit can be operated
both using a 240 volts or a 480 volts input supply. The unit can be operated using the automatic
mode in which the corresponding water/air pump will be triggered to start at preset conditions.
For example, the concentrate drainage pump will be triggered to pump out the concentrate as the
concentrated water in the humidification chamber reaches the preset level as shown in Figure
4.12. The manual mode was however used during field tests for ease of operation where input
air flow rates, input water flow rates and concentrate discharge / recirculation were manually
controlled.
Page 62
62
Figure 4.11 Electrical controls for the unit.
Page 63
63
Figure 4.12 Figure showing the discharge and recirculation system.
4.2 Design Modifications
During the testing phase, several modifications were conducted, including provision for
vacuum operation, installing a new condenser, replacement of the existing air blower and
installation of recirculation pump. These modifications were primarily carried out for testing
under various combinations and also for parametric studies where parameters would be varied as
required.
Page 64
64
4.2.1 Ball valves for operation under vacuum
The unit was initially tests without vacuum conditions. However modification by
installing ball valves at the inlet air manifold allowed for vacuum operation as well. A
maximum vacuum of 22 in Hg was reached in the process. Figure 4.13 shows the modifications
carried out.
BEFORE AFTER
Figure 4.13 Showing modifications with ball valves for vacuum operation.
Page 65
65
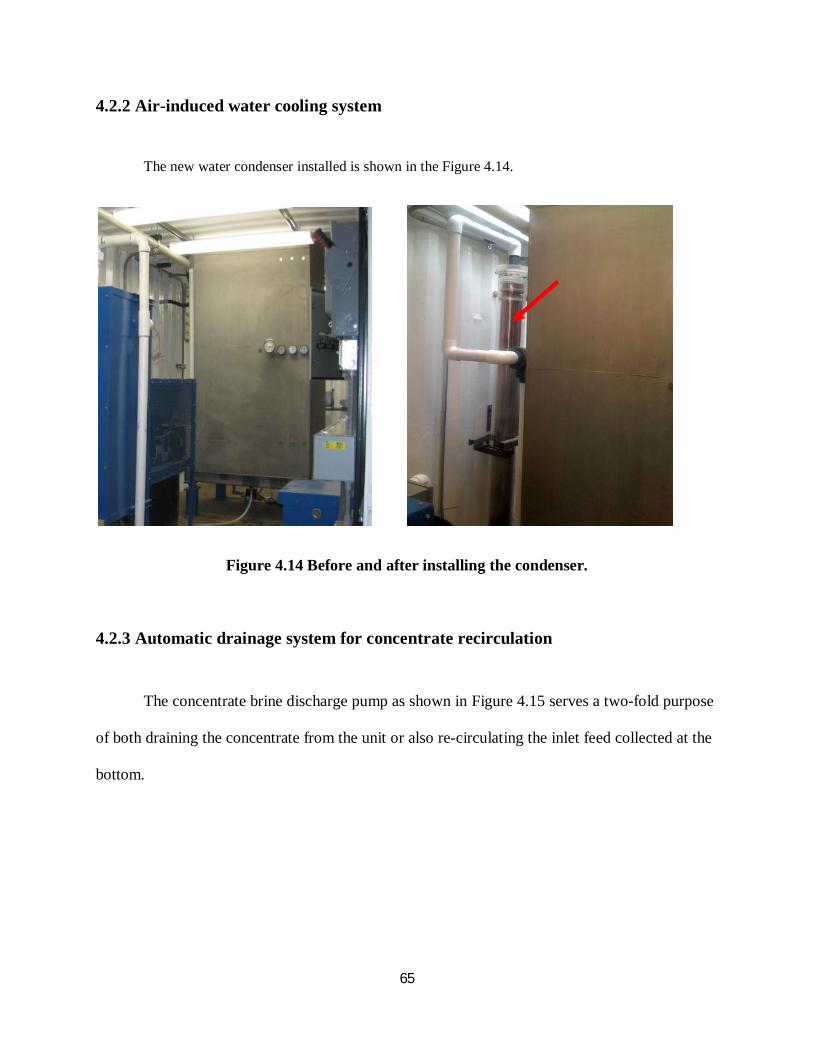
4.2.2 Air-induced water cooling system
The new water condenser installed is shown in the Figure 4.14.
Figure 4.14 Before and after installing the condenser.
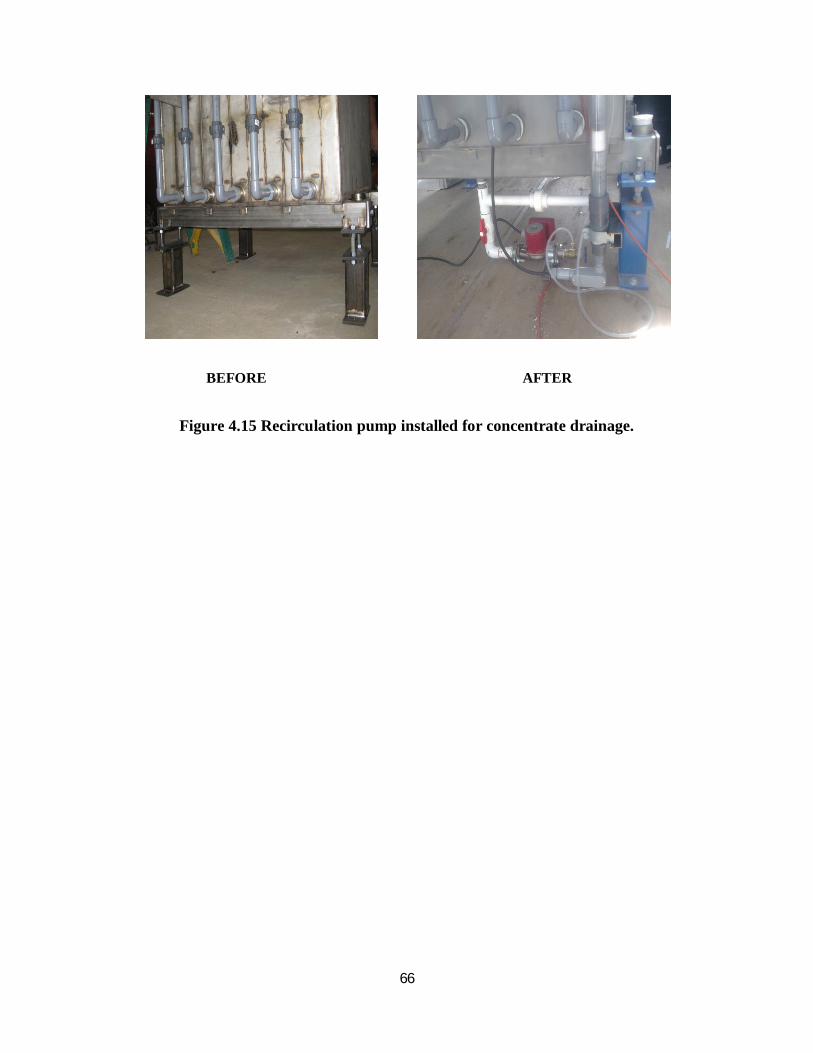
4.2.3 Automatic drainage system for concentrate recirculation
The concentrate brine discharge pump as shown in Figure 4.15 serves a two-fold purpose
of both draining the concentrate from the unit or also re-circulating the inlet feed collected at the
bottom.
Page 66
66
BEFORE AFTER
Figure 4.15 Recirculation pump installed for concentrate drainage.
Page 67
67
4.2.4 Field prototype testing site
The water purification prototype in the moving container was set up in the campus of
New Mexico Tech, as shown in Figure 4.16. All the testing experiments were carried out by
using simulated produced water.
Figure 4.16 Site picture of prototype unit contained in the moving trailer.
POWER SOURCE
Page 68
68
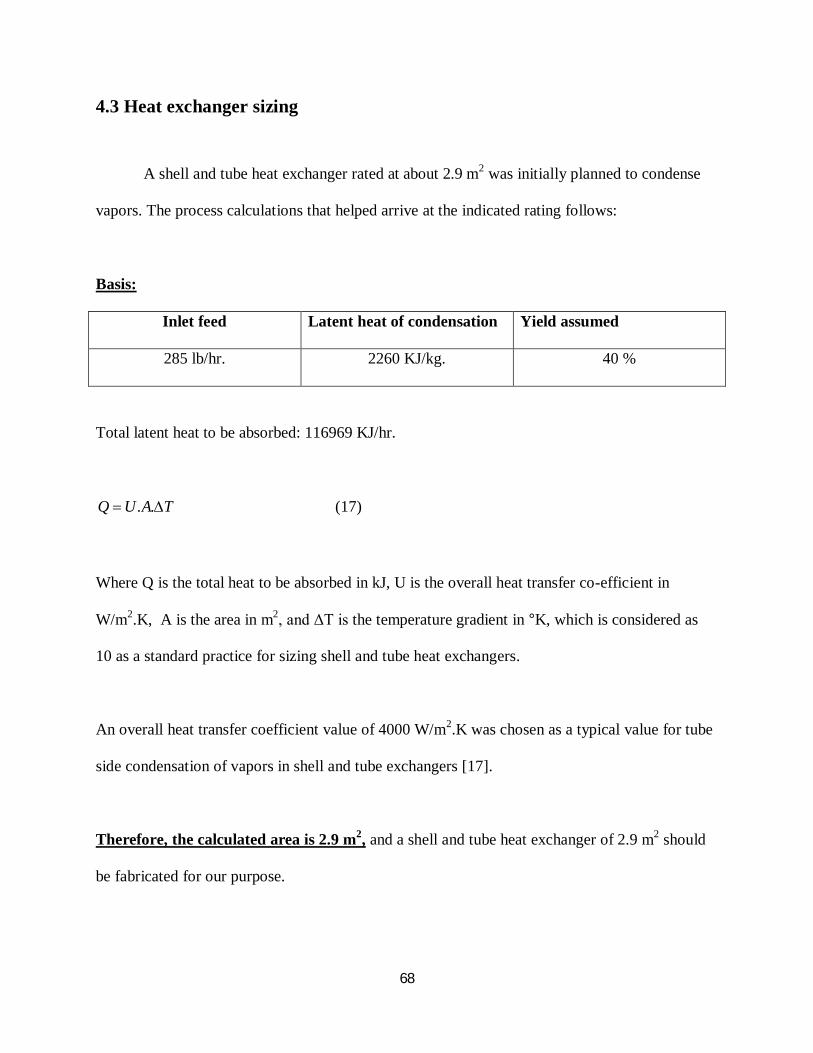
4.3 Heat exchanger sizing
A shell and tube heat exchanger rated at about 2.9 m2 was initially planned to condense
vapors. The process calculations that helped arrive at the indicated rating follows:
Basis:
Inlet feed Latent heat of condensation Yield assumed
285 lb/hr. 2260 KJ/kg. 40 %
Total latent heat to be absorbed: 116969 KJ/hr.
TAUQ .. (17)
Where Q is the total heat to be absorbed in kJ, U is the overall heat transfer co-efficient in
W/m2.K, A is the area in m2, and ΔT is the temperature gradient in °K, which is considered as
10 as a standard practice for sizing shell and tube heat exchangers.
An overall heat transfer coefficient value of 4000 W/m2.K was chosen as a typical value for tube
side condensation of vapors in shell and tube exchangers [17].
Therefore, the calculated area is 2.9 m2, and a shell and tube heat exchanger of 2.9 m2 should
be fabricated for our purpose.
Page 69
69
However, two problems arose:
a) High cost of shell & tube heat exchanger fabrication.
b) Lack of chilled or cooling (utility) supply on site.
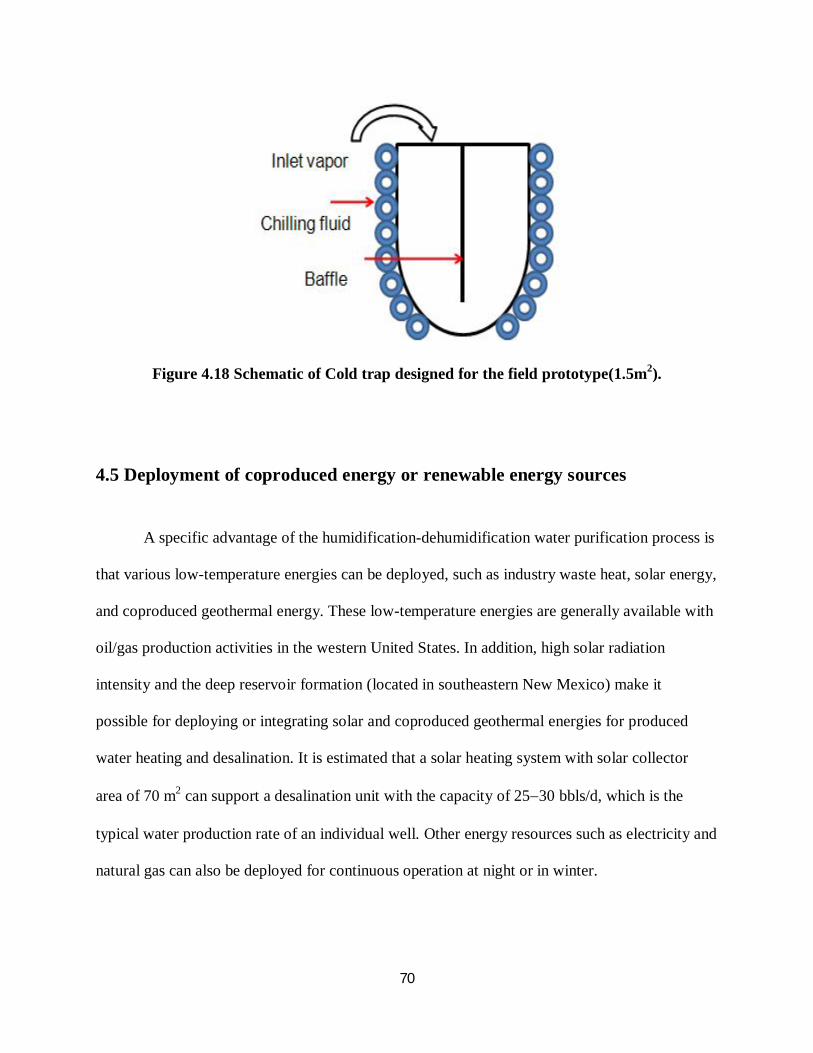
Therefore, a cold trap that works with a Freon compressor as shown in Figure 4.17 was
fabricated, which does not require any utility supply. A shell and tube heat exchanger as shown
in Figure 4.16 however works on either cold water or chilled water, which is not easily available
on site. However, produced water itself could be used to cool the water. The overall heat transfer
area for the shell and tube heat exchanger was about 3.5 m2. However, due to monetary
constraints a refrigeration system with a 1.5 m2 area was used. A typical shell and tube heat
exchanger and the cold trap is shown in the Figures 4.17 and 4.18.
Figure 4.17 Schematic of shell and tube heat exchanger(3.5 m2).
Page 70
70
Figure 4.18 Schematic of Cold trap designed for the field prototype(1.5m2).
4.5 Deployment of coproduced energy or renewable energy sources
A specific advantage of the humidification-dehumidification water purification process is
that various low-temperature energies can be deployed, such as industry waste heat, solar energy,
and coproduced geothermal energy. These low-temperature energies are generally available with
oil/gas production activities in the western United States. In addition, high solar radiation
intensity and the deep reservoir formation (located in southeastern New Mexico) make it
possible for deploying or integrating solar and coproduced geothermal energies for produced
water heating and desalination. It is estimated that a solar heating system with solar collector
area of 70 m2 can support a desalination unit with the capacity of 2530 bbls/d, which is the
typical water production rate of an individual well. Other energy resources such as electricity and
natural gas can also be deployed for continuous operation at night or in winter.
Page 71
71
A variety of solar systems are available for the purpose of heating produced water from
ambient conditions to the desired temperature. However, the brackish nature of the water calls
for corrosion resistant material. Flat plate collectors were chosen, as there was ample space
available, and was more economical than evacuated tube systems. Evacuated tubes and flat plate
solar collectors were considered, however glycol based flat plate collectors were chosen due to
budget constraints. A tilt angle of 50° was found appropriate for ROSWELL, NM as shown in
Figure 4.21.
The basis on sizing the solar collectors was 20 barrels of produced water per day. The heat input
required for solar heating was calculated in equation 17 [15].
Q f m Cwp t T (17)
Where Q is the heat transfer rate (KW or KJ/s), m is the quantity of fluid to be heated, Kg, Cp is
the specific heat of water, KJ/Kg.C, t is the time, sec, and ΔT is the temperature gradient, °C, and
f is the solar efficiency, 78%.
Total energy required for heating 20 barrels produced water from ambient temperature
(15°C) to optimized temperature (80°C) is listed in Table 4.1.
Table 4.1 Solar panel design and sizing
Initial Temperature 15 C
Target Temperature 80 C
Size of solar collector 8ft 4 ft
No. of solar collectors required 16
Page 72
72
From the Equation 17, 656KBtu of heat is required to heat the daily capacity of produced
water per day, which is the theoretical value required. Solar collectors that can cater to this need
have to be sized and purchased and 16 solar collectors will be procured to perform the job. The
rule of thumb used by solar panel suppliers considers a capacity of 15 barrels per day of water to
be treated, which is about 630 gallons of water per day. Water density of 8.34 pounds per
gallon(ppg) is used with a 75 degree increase in desired temperature. The solar panel efficiency
is considered as 75% and the calculation yields 500 KBtu. A 32 ft2 solar collector supplies about
32000 Btu/day. Therefore, 500 KBtu of heat can be catered with 16 solar collectors with each
supplying 32000 Btu as mentioned. This method is used by solar collector manufacturers for
sizing. The tilt angle of the solar collectors would be 50° which is shown in Figure 4.21.
Page 73
73
A basic schematic of the glycol based solar collector design is shown in Figure 4.19.
Figure 4.20 describes the hot and cold process loops for the solar system and Figure 4.21 is the
placement layout for the solar panels on site with a tilt angle that applies to the location
(Roswell, NM).
Figure 4.19 Schematic diagram of the glycol based solar loop for the process.
Page 74
74
Figure 4.20 Hot and cold water loops showing the solar process flow diagram.
Figure 4.21 Basic schematic and tilt angle of the solar collectors.
Page 75
75
CHAPTER 5 RESULTS AND DISCUSSION
This chapter discusses the results from both the pilot scale lab tests as well as tests carried
out on the fabricated field prototype. The field prototype was tested by varying the inlet water
flow rate and feed water temperature for monitoring the impact of feed water parameters on the
performance.
The primary variables involved in the humidification – dehumidification system are following:
- Inlet water flow rate.
- Inlet water temperature
- Inlet air temperature
- Inlet air flow rate
- Total solar energy incident and solar water heater collector area.
Page 76
76
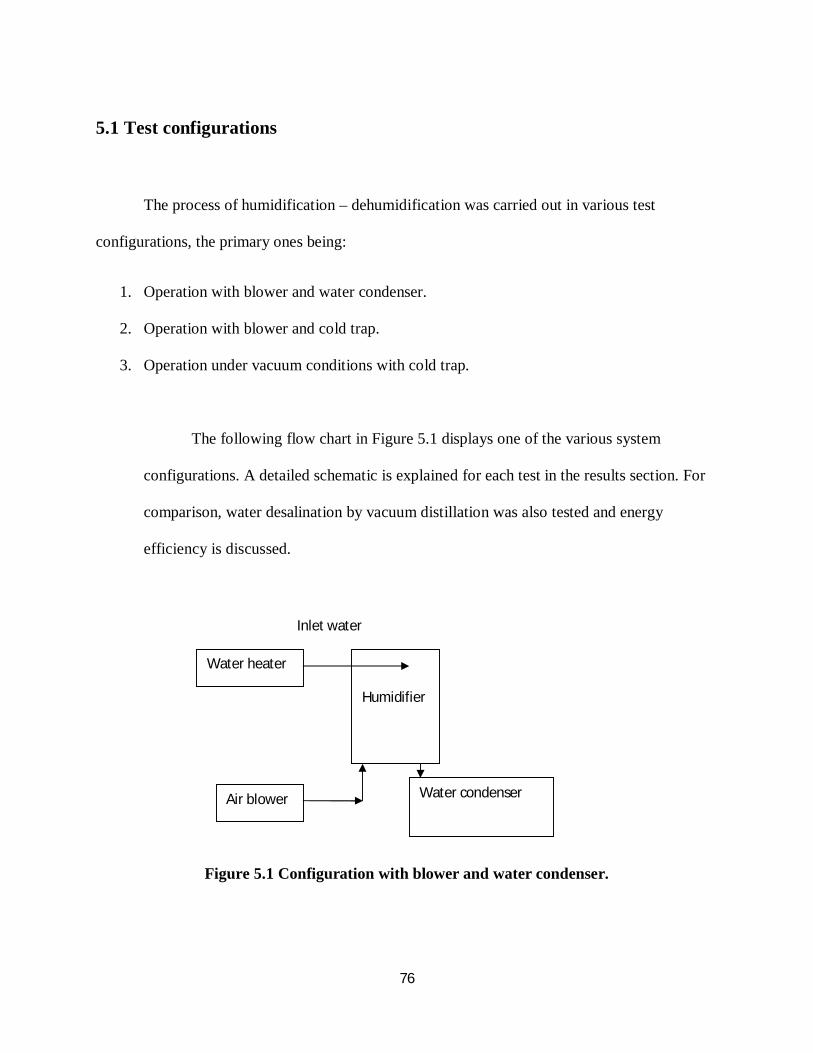
5.1 Test configurations
The process of humidification – dehumidification was carried out in various test
configurations, the primary ones being:
1. Operation with blower and water condenser.
2. Operation with blower and cold trap.
3. Operation under vacuum conditions with cold trap.
The following flow chart in Figure 5.1 displays one of the various system
configurations. A detailed schematic is explained for each test in the results section. For
comparison, water desalination by vacuum distillation was also tested and energy
efficiency is discussed.
Figure 5.1 Configuration with blower and water condenser.
Humidifier
Water heater
Inlet water
Air blower Water condenser
Page 77
77
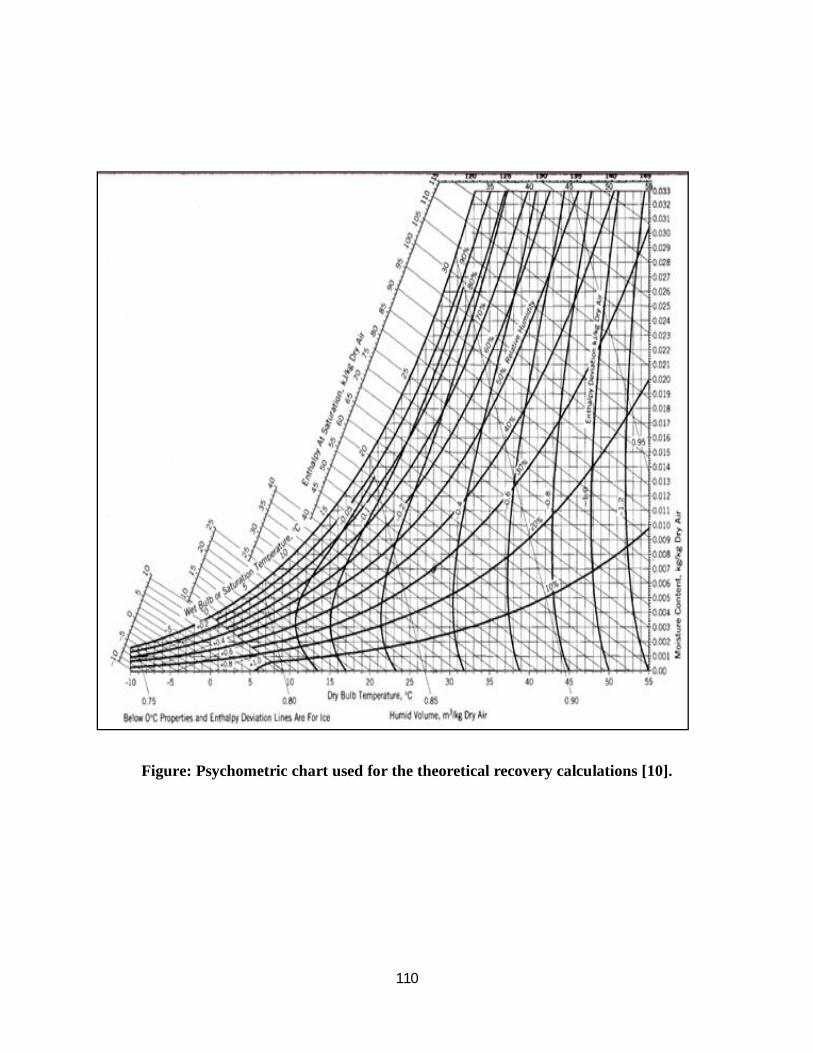
The productivity of the system can be measured by the moisture content of the
humidified air. This can be calculated using humidity charts with the dry bulb and wet bulb
temperature of the process streams. An illustration of calculating the moisture content of the exit
stream in the present case is presented in APPENDIX 2. The required data for the calculation is
the dry bulb temperature of the entering and leaving air and the wet bulb temperature of the
entering air.
A schematic representation of the unit itself and the condenser is shown in Figure 5.2.
Figure 5.2 Schematic representation showing the process streams.
Page 78
78
The balance around the humidification unit can be written as
Mair.Ha2 + Mwout.Cw.Twout = Mwin.Cw.Twin + Mair.Ha1 (17)
Expressing in terms of enthalpies:
(Ha2-Ha1) = (Mwin/Mair).Cw.Twin – [(Mwin/Mair )-(W2 – W1)].Cw.Twout = Mwin.Cw.Twin + Mair.Ha1
(18)
The balance around the de- humidification unit can be written as
Mair.Hair2 – Mair.Hair3 = Mw3.Cw.Tw4 – Mw3.Cw.Tw3 + Mw5.Cw.Tw5 (19)
Energy balances around the condenser, the solar unit and the storage tank can also be
written. However, the solar system will only be hooked up on site and is beyond the scope of the
present configuration.
The measured entities throughout the experiments include liquid flow rate, air flow rate,
total dissolved solid in both the feed water and concentrate water, and operating parameters at
different locations (A, B, C, D, and E) of the unit as shown in Figure 5.3. Figure 5.3 also shows
various combinations that could be used in testing system performance such as operation under
Page 79
79
vacuum conditions, only blower, and also using the Freon cold trap.
Figure 5.3 Schematic diagram of the field prototype with all possible configurations.
The feed water was heated to preset temperature by an in-line heater or a steam generator.
An in-line water flow meter monitors the feed water flow rate. Feed water evaporates under
vacuum or flowing air stream and was split to clean water and concentrate with high TDS. Both
the concentrate and condensed clean water will be collected for ion concentration analysis by
conductivity meter and ion chromatograph. Temperature, pressure, and humidity at locations of
A, B, C, D, and E were monitored throughout all the experiments.
Page 80
80
5.2. Operation of prototype using the humidification dehumidification
configuration
Following the completion and seal testing, operating tests of the prototype under different
modes were initiated by using brine and simulated produced water. The first operation was
carried out under the humidification dehumidification configuration. Table 5.1 is a typical test
data record showing process parameters with the temperature distribution across the unit. The
temperature distributions are plotted in Figures 5.4 and 5.5. The temperature distributions not
only give an idea of the saturation wet bulb temperatures, but also show uneven distribution of
water within the chamber.
Page 81
81
Table 5.1 Typical test results for configuration with blower and cold trap
Inlet water flow rate, L/min 0.86
Inlet air flow rate, L/min 3280
Feed water temperature, C 75
Entering air dry bulb temp (deg C) 36
Exit air wet bulb temp (deg C) 29
TEMPERATURE RECORD (deg F)
0 min. 118 min. 152 min. 177 min. 197 min.
A 102 105 105 104 104
B 81 85 85 85 85
C 114 116 114 112 112
D 91 96 96 95 96
E 85 91 92 91 91
Page 82
82
0 20 40 60 80 100 120 140 160 180 20060
70
80
90
100
110
120
130
Tem
pera
ture
( o F)
Times (mins)
A B C
Figure 5.4 Temperature change at same height of adjacent chambers.
0 20 40 60 80 100 120 140 160 180 20070
75
80
85
90
95
100
105
110
Tem
pera
ture
(O
F)
Time (mins)
D B E
Figure 5.5 Temperature change from top to bottom of humidification chambers.
Page 83
83
5.2.1 Operation of prototype using modified water condenser
A schematic of the field prototype for testing with the water condenser configurations as
shown in the Figure 5.6. Table 5.1 is the test data from this trial and Figure 5.7 shows the
temperature distribution within the unit.
Figure 5.6 Schematic diagram of prototype with blower and water condenser.
Page 84
84
Table 5.2 Results for configuration with blower and water condenser
Inlet water flow rate (litre/min) 0.8
Blower rate (Hz) / ft3/min 45
TEMPERATURE RECORD (deg F)
0min 30mins 60mins 90mins 120mins
A 89 87 85 85 85
B 78 77 77 77 78
C 99 97 94 91 89
D 81 81 81 80 80
E 78 78 77 77 76
A temperature profile within the unit as labeled in the schematic diagram is shown in Figure 5.7.
Figure 5.7 Temperature profile within the unit.
Page 85
85
A second trial using vacuum was conducted to confirm the results of trials that provided a
higher yield. The trial resulted in an actual yield of about 8%, and a total productive yield of
12.5%, in comparison to 15% and 5% in the previous trials using the vacuum method.
5.2.2 Operation of prototype under vacuum distillation configuration
The purpose of inducing vacuum in the system is to compare the energy efficiency of
produced water desalination under different configurations. Under vacuum, water starts to
evaporate at much lower temperature compared to that at atmospheric pressure due to the
reduced vapor pressure of water inside the system.
A schematic of the field prototype is as shown in the Figure 5.8, and the labeled parts in
this schematic representation will be used in the mass balance analysis:
Figure 5.8 Schematic representation of prototype with vacuum and cold trap
Page 86
86
Table 5.3 Results for configuration with vacuum and cold trap
Inlet water flow rate (L/min) 1.2
Vacuum applied (in Hg) 22
Feed water temperature (deg C) 76
TEMPERATURE RECORD (deg F)
0min 20mins 40mins 60mins 80mins 100mins 120mins 140mins
A 96 98 101 103 102 105 107 109
B 94 94 97 100 104 103 104 104
C 106 100 108 112 114 115 116 116
D 97 102 107 110 111 112 112 112
E 97 98 102 104 106 108 108 108
Vacuum
pressure,
inHg
23.2 22.8 22.8 21.2 21.2 21.2 20.5 20.5
Page 87
87
A temperature profile within the unit is shown in Figures 5.9 and 5.10.
0 20 40 60 80 100 120 140 16092949698
100102104106108110112114116118120
Tem
pera
ture
( o F)
Times (mins)
A B C
Figure 5.9 Temperature change along horizontal direction.
.
0 20 40 60 80 100 120 140 1608486889092949698
100102104106108110112114116
Tem
pera
ture
(O
F)
Time (mins)
D B E
Figure 5.10 Temperature change along vertical direction.
Page 88
88
A dramatic increase in productivity is seen in the case of vacuum operation. The actual
yield increased from less than 2% up to 5%. The total productive yield shows an increase in
case of blower operation because vacuum contains the vapor within the system, while bowing
forces vapors out of the system leaving very less time for condensation with the facility available
on site. A total loss of vapor dramatically reduced to just 9% as compared to 37% as in the case
of blowing only without vacuum. This goes to show, in case of blowing only, vapors are lost out
of the system, while vacuum aids in the dehumidification or condensation process, thereby not
only increasing the yield of the process, but also by reducing the vapor lost into the surroundings.
The temperature gradient also shows a more stable range which can be attributed to the presence
of vacuum within the system.
5.3 Ion rejection potential of the field prototype
The field prototype was not extensively tested with produced water and NaCl on the
present testing location due to disposal problems. However, a few tests were conducted with
NaCl and produced water to establish the ion rejection potential of the process, and the results
are discussed in this section.
Table 5.4 tabulates the ion rejection results for a NaCl solution with concentration of
8421 ppm. The ion rejection observed during the lab scale tests was over 95% [16]. The ion
rejection observed on the field prototype with NaCl solution was 92% with a starting TDS of
8421 ppm and the purified water with a TDS content of 647ppm. The conductivity as in Figure
5.13 also shows a dramatic drop due to the ion rejection of over 93% after purification.
Page 89
89
Table 5.4 Ion rejection results for NaCl feed
Quantity Measured Inlet feed Purified water
Sodium (Na) (mg/L) 3220 165
Chloride (mg/L)
4920 105
Fluoride (F-) (mg/L) 3 1.2
Phosphate (mg/L) 8.8 0.4
Potassium (K) (mg/L) 4.9 5.7
Magnesium (Mg) (mg/L) 6.5 11
Calcium (Ca) (mg/L) 23.7 37.0
Bromide (mg/L) 3 0.1
Total cations (meq/L) 142 10
Total anions (meq/L) 143.8 9.9
Percent difference -0.6 0.5
Conductivity (uS/cm) 15100 1060 TDS calculation (mg/L) 8420.7 647.3
Page 90
90
Figure 5.11 Ion rejection for NaCL feed.
Figure 5.12 Ion rejection for NaCL feed.
3220
4920
165
105
0
1000
2000
3000
4000
5000
6000
Sodium (Na) (mg/L) Chloride (mg/L)
Ion
conc
etra
tion
(ppm
)
Analysed ions(ppm)
Purified water
Inlet feed
3 8.8 4.9 6.5
23.7
31.20.4
5.711
37
0.1
0
10
20
30
40
50
60
70
Ion
conc
etra
tion
(ppm
)
Analysed ions(ppm)
Purified water
Inlet feed
Page 91
91
Figure 5.13 Ion rejection summary displaying TDS and conductivity for NaCl feed.
Figure 5.11 and Figure 5.12 shows the ion concentration of the inlet feed and purified
water. The plot of trace elements is plotted separately in Figure 5.12 as it lies within a smaller
range (<100 ppm).
15100
8421
1060
647
0
2000
4000
6000
8000
10000
12000
14000
16000
18000
Conductivity (uS/cm) TDS calculation (mg/L)
Cond
uctiv
ity
and
TDS
Purified water
Inlet feed
Page 92
92
Table 5.5 Ion rejection results for Produced water feed
Quantity Measured Inlet feed Purified water
Sodium (Na) (mg/L) 2390 165
Chloride (mg/L)
3780 105
Fluoride (F-) (mg/L) 4 1.3
Phosphate (mg/L) 8 0.4
Potassium (K) (mg/L) 220 5.8
Magnesium (Mg) (mg/L) 22 12
Calcium (Ca) (mg/L) 145 39
Bromide (mg/L) 11 0.12
Total cations (meq/L) 118 10
Total anions (meq/L) 126 9.8
Percent difference -3.3 1.7
Conductivity (uS/cm) 12500 1030 TDS calculation (mg/L) 7207 648
Ion rejection for produced water has not been plotted, as a satisfactory ion rejection is
seen. A total ion rejection potential of over 93% is seen with NaCl and 91% is seen with
produced water.
Page 93
93
Figure 5.14 Ion rejection for produced water feed.
Figure 5.15 Ion rejection for produced water feed.
2390
3780
165
105
0
500
1000
1500
2000
2500
3000
3500
4000
4500
Sodium (Na) (mg/L) Chloride (mg/L)
Ion
conc
etra
tion
(ppm
)
Analysed ions(ppm)
Purified water
Inlet feed
4 8
220
22
145
111.3 0.4
5.8
12
39
0.12
0
50
100
150
200
250
Ion
conc
etra
tion
(ppm
)
Analysed ions(ppm)
Purified water
Inlet feed
Page 94
94
Figure 5.16 Ion rejection summary displaying TDS and conductivity for produced water.
5.4 Parametric analysis of the system
A detailed parametric analysis of the humidification dehumidification process was carried
out in the lab scale tests as well. To investigate the influence of input water temperature and air
flow rate on the performance of the field scale prototype desalination tests were carried out at
varied operating parameters.
Figure 5.17 shows a comparison of the parametric study between the lab scale and field
scale prototypes and comparison with the data from literature. Though the parametric study for
changing temperature was established during the lab scale tests, it was repeated to observe the
field scale prototype perform. An increasing temperature was found to increase the productivity.
A look at the psychometric chart also shows that an increase in the wet bulb saturation
temperature implies an increased water carrying capacity of air. This explains the phenomena
and the substantial increase in yield with increased temperature. Tests carried out with water at
12500
7207
1030
648
0
2000
4000
6000
8000
10000
12000
14000
16000
Conductivity (uS/cm) TDS calculation (mg/L)
Cond
uctiv
ity
and
TDS
Purified water
Inlet feed
Page 95
95
room temperature shows almost no yield with only a few drops after about three hours of
operation. Therefore, the temperature that could be achieved most economically by the solar
system was chosen, based on which the solar system was also sized.
A parametric study on the inlet water flow rates and inlet air flow rates were also carried
out in the lab study as shown in Figure 5.18 and Figure 5.19. Their effects are also extensively
published in literature. However, due to the larger scale of this unit compared to the laboratory
scale, changing air flow rates and inlet water flow rates did not show a marked difference in
productivity as far as the parametric study is concerned.
Figure 5.17 Effect of feed temperature on the total production yield.
Page 96
96
Figure 5.18 Effect of air flow rate on the total production yield [16].
Figure 5.19 Effect of feed water flow rate on the total production yield [16].
Page 97
97
5.5 Comparison of results the various configurations
Table 5.6 compares the yield from various combinations. The Total Actual Yield is the
volume of condensed vapors, while the Total Productive Yield is the sum of condensed vapors
and the vapor volume unaccounted for during the mass balance calculation.
Table 5.6 Yield comparison of various operating configurations
Capacity (bbls/day)
Water to air ratio. (LPM/CFS)*
Total actual
yield (%)
Total productive yield (%)
Vapor lost (%)
Blower with Freon cold
trap 10 1:45 1.3 40 37
Vacuum with Freon cold
trap 10 1:40 8 12.5 4.7
Blower and water
condenser 10 1:40 4 28 24
After a comparison of various combinations, the actual yield, total productive yield and
the vapor lost in different test configurations are presented in Figures 5.20 - 5.23.
Page 98
98
Figure 5.20 Actual yield comparison of all combinations.
Figure 5.21 Total productive yield comparison of all combinations.
012345678
Blower with Freon cold trap
Vacuum with Freon cold trap
Blower and water condenser
1.3
8
4Pe
rcen
tage
yie
ld (%
)
Different test configurations
05
10152025303540
Blower with Freon cold trap
Vacuum with Freon cold trap
Blower and water condenser
40
12.5
28
Perc
enta
ge y
ield
(%)
Different test configurations
Page 99
99
Figure 5.22 Total vapor lost in different combinations.
05
10152025303540
Blower with Freon cold trap
Vacuum with Freon cold trap
Blower and water condenser
37
4.7
24
Perc
enta
ge y
ield
(%)
Different test configurations
Page 100
100
CHAPTER 6 CONCLUSIONS AND FUTURE WORK
A low temperature distillation in which water evaporates at a temperature below boiling
point in the flowing air stream(or in other words humidifies the inlet air stream) was designed
and tested for produced water desalination. Bench scale tests indicated that both organics and salt
can be removed by the air enhanced distillation process. Based on bench scale test results, a
pilot scale prototype water desalination unit was designed and constructed in this work for
produced water desalination. The fabricated water purification prototype was investigated for
maximum productivity under different configurations. The ultimate goal of this work was to
establish a process with maximum possible yield with the least operating cost.
The water treatment prototype with a designed capacity of 20bbls/day was tested using
different configurations. According to the experimental results, modification of the prototype
including deployment of the air-enhanced condenser and recirculation pump was carried out. The
experiment results indicated that about 52.7% water will evaporate with an air flow rate of 3516
L/min with a feed water temperature of 90 C. Due to the limitation of feed water flow rate
during experimental conditions, about 4.7% of water could be recovered as clean water. The
experimental results are compared with vacuum distillation and the observations are summarized
as:
1. Produced water can be effectively desalinated by the humidification dehumidification
process. Specifically, the process can be operated at atmospheric pressure and relatively
low temperature (60-80 C) and thus low-temperature heat sources like coproduced
geothermal energy could be deployed for the desalination process.
Page 101
101
2. Conventional thermal processes, i.e., vacuum distillation, is energy intensive to attain
vacuum , and also requires a large quantity of cooling water for vapor condensation, and
the same is not applicable at the wellhead where cooling water supply is limited.
3. The total productive yield defined as the total vapor generated including water condensed
and water vapor lost which varies from 12.5% to 40% depending on the system
configuration. Specifically, the total productive yield at an air flow rate of 3516 L/min
varies from 29.5% to 38.8% when the feed water temperature increases from 70 C to 90
C. A total productive yield of 9.4% of feed water is observed in the vacuum distillation
configuration.
4. In terms of economics and an overall appraisal of the various configurations, the
configuration with the air blower and water condenser was found to be more efficient
than vacuum distillation both in terms of yield and energy requirement.
5. A parametric study was already carried out during lab tests, and the optimum temperature
for the humidification dehumidification was set at 70 – 80 C.
6. An ion rejection capacity of 93% was observed with NaCl feed solution and an ion
rejection of 91% with produced water feed solution. The total TDS was reduced from
8421 ppm to 647 ppm in both cases, which also falls within the environmental
regulations for use in various end uses such as cooling towers, irrigation and in chemical
processes as shown in Table 1.2.
7. A parametric study on the field prototype for inlet feed water rate indicated that the
current water flow rate is too low and thus experimental testing with extended range of
feed water flow rate is needed for onsite testing.
Page 102
102
8. A solar system was sized based on the feed requirement or the desired capacity. The basis
was to process up to 20 barrels a day. Both evacuated solar heating systems as well as flat
plate collectors were considered. Flat plate collectors were chosen as it was cheaper and
space was not a constraint on site. About sixteen flat plate collectors of 32 ft2 each were
chosen to cater to a load of 500 KBTU/day. The solar system has been sized to heat the
inlet water from ambient conditions(5C- the worst case scenario during winter was
considered) up to 80C, which serves the required purpose for this study.
Page 103
103
6.1 FUTURE WORK
The field prototype was tested extensively and the following steps will be the future plan
of action:
1. The field prototype will be tested on site with the solar system that has been procured.
2. The unit can still be operated under different modes or configurations such as vacuum, air
blower, Freon cold trap or the water condenser with the parameters established with each
combination.
3. Produced water has been tested only once on the field prototype due to disposal concerns
in the area where the unit is located presently. The present unit also uses a water heater
for continuous operation and a steam generator for batch operation to perform the
function of heating and repeated use of produced water at the present site with the
available infrastructure would lead to severe corrosion issues and disposal concerns.
However, the well site would not face any of these concerns and extensive testing will
also be carried out at the site.
Page 104
104
REFERENCES
[1] Knudsen, B.L.: “Meeting the Zero Discharge Challenge for Produced Water”, SPE 7th
International conference on Health,Safety and Environment in Oil and Gas Exploration
and Production, Calgary, Alberta, Canada, 29–31 March 2004.
[2] B.M. Hamieh, J.R Beckman,“Seawater Desalination Using Dewvaporation Technique:
Experimental and Enhanced Work with Economic Analysis,” Desalination, 195 (2006)
14-25.
[3] Santos, S.M., and Wiesner, M.R., “Ultrafiltration of Water Generated in Oil and Gas
production,” Water Environment Research, 69 (1997)1120-1127.
[4] C.E. Clark and J.A. Veil, “Produced water volumes and Management Practices in the
United States”, Environmental Science Division, Argonne National Laboratory,
September 2009.
[5] Mike Hightower, “Produced Water Reuse challenges”, A report- Water safety, Security
and Sustainability, Sandia National Laboratories.
[6] Marine Buzz, “Advantages of Seawater desalination Vessel versus Land Based Reverse
Osmosis Facility”, 11 December 2007.
Page 105
105
[7] National Dryland Salinity Program,“Economic and Technical Assessment of
Desalination Technologies”, 2 September 2002.
[8] http://www.coastal.ca.gov/desalrpt/dchap1.html
[9] Fath HES, “Desalination technology, the role of Egypt in region” IWT C, Alexandria,
[10] Richard. M. Felder., “Elementary Principles of Chemical Processes, Third Edition”
1999.
[11] Fawzi Banat, “Economic and technical assessment of desalination technologies”, IWA
Conference -New Technologies for Water and Wastewater Treatment in the 21st Century,
Geneva 6-8 June, 2007
[12] A.S. Nafey, H.E.S. Fath, S.O. El-Helaby, A. Soliman, “Solar desalination using
humidification-dehumidification processes. Part II. An experimental investigation”,
Energy Conversion and Management 45 (2004) 1263–1277.
[13] Simpson, W.M., T.K. Sherwood, “Performance of Small Mechanical Draft Cooling
Tower,” Refrigeration Engineering, 52 (1946), 574-576.
[14] Perez-Blanco, H., W.A. Bird, “Study of heat and mass transfer in a vertical-tube
evaporative cooler, ASME Transactions, J. Heat Trasfer, 106 (1984), 210-215.
Page 106
106
[15] M. David Himmelblau, Basic Principles and Calculations in Chemical
Engineering(7th Edition), Prentice Hall, December 2003.
[16] Xinhua Li, Experimental analysis of produced water desalination by a humidification-
dehumidification process, Thesis, New Mexico Tech, Dec 2009.
[17] Perry, R.H. and Green, D.W, Perry's Chemical Engineers' Handbook (7th Edition),
McGraw-Hill, ISBN 0-07-049841-5
[18] Hansen, B.R., and Davies, S.R.H., “Review of Potential Technologies for the Removal of
Dissolved Components from Produced Water,” Trans IChemE, 72, (1994) 176-188.
[19] Guidelines for Water Reuse, EPA/625/R-04/108. U.S. Environmental Protection Agency
(2004)
[20] SRCC, Operating guidelines for certifying solar collectors, SRCC document OG-100-
06.
[21] Ibrahim GA, Nabhan MBW, Anabtawi MZ, “An Investigation into a falling film type
cooling tower”, International Journal of Refregeration-Revue International Du Froid, 18
8, (1995), 557-564.
Page 107
107
[22] Rowe, D. and Abdel Magid, M., Handbook of Wastewater Reclamation and Reuse,
Lewis
Page 108
108
APPENDIX 1: H-DH PROCESS CALCULATIONS
Calculation for humidified water yield by blowing method
The experimental results show a low vapor purified yield. However, theory supports the
fact that the vapor carrying capacity of air blowing by the process of humidification is low.
Therefore, considering the amount of vapor lost in the process from a basic mass balance
calculation, it is evident that the majority of the latent heat transfer resulting in vapor is due to
heat transferred between the walls of the humidification and dehumidification chambers.
The following calculation gives the theoretical yield from a process using the blowing
method to humidify air from ambient conditions upto 90%, as in our case.
The inlet conditions of entering air were 30 deg C, with a relative humidity of 25%. The
humidified air exiting the system has a relative humidity of 90%. The inlet water is fed at 70 deg
C.
WATER IN
75°C
ENTERING AIR
30°C
Relative humidity: 25%
CONCENTRATE DRAIN
HUMIDIFIED AIR
Relative humidity: 90%
Page 109
109
The following calculations calculate the ultimate amount of water per hour exiting the
system.
a. Absolute humidity of entering air:
At 30 deg C and a relative humidity of 25%, the psychometric chart gives an
absolute humidity reading of 0.0052 kg water/ kg dry air.
0.052 kg water/ kg dry air
b. Adiabatic saturation temperature of entering air:
The psychometric chart reads an adiabatic saturation temperature of 15.5°C.
15.5°C
c. Amount of humidified air leaving the unit:
The amount of vapor in air at a relative humidity of 90% and 15.5°C can be read
out of the psychometric chart as:
0.0105kg water/ kg dry air.
Inlet flow rate of dry air :
326 kg/hr. (1 kg dry air/1.0052) = 326 kg dry air/hr in input into the system.
Therefore, the amount of water being carried out in the exit stream by the process
of humidification alone is
(326kg dry air/hr) . (0.0105 – 0.0052)= 1.72 kg water/hr.
Page 110
110
Figure: Psychometric chart used for the theoretical recovery calculations [10].
Page 111
111
APPENDIX 2: MOISTURE CONTENT CALCULATIONS
Illustration of calculating the moisture content of exit stream:
The dry bulb temperature of the entering and exit stream of air is 39 °C and 28 °C
respectively. The wet bulb temperature of the entering stream of air is 31 °C.
Table: Temperature of process streams
Dry bulb temperature Wet bulb temperature
Entering air 39 °C 31°C
Leaving air 28 °C
Solution:
Assuming the process to be adiabatic, and that the web bulb temperature remains constant
at 31 °C due to constant inlet flow rate at constant temperature, the following values can be
obtained from the humidity chart:
At BDT 39 °C and WBT 31 °C, the moisture content is 0.03 kg water/kg dry air.
At BDT 28 °C and WBT 31 °C, the moisture content is 0.025 kg water/kg dry air.
Therefore the exit stream carries 0.005 kg H2O/Kg dry air.
Page 112
112
The following is the psychometric chart used for the calculation:
Figure: Psychometric chart used to calculate moisture content of exit stream [10].
Wet Bulb Temperature
Dry Bulb Temperature
Moisture content
Page 113
113
APPENDIX 3: ELECTRICAL AND MECHANICAL
CHECKLISTS
Before the start of any tests, a series of electrical and mechanical tests were
carried out and the results are tabulated in the table
Table: Equipment electrical and mechanical tests checklist
Test item Specification/
Requirement
Measurement
System Observations Remedy Status
Leakage test of
the module. No leakage
Pressure test using air
blower.
Slight leakage on
ceiling
Hinged
ceiling to be
modified
DONE.
Ceiling
modified at
NMT.
Mechanical
damages test
No Mechanical
damages Visual Inspection. Found OK NA NA
Feed weirs and
all flow lines
check
Work as
required.
Visual Inspection and
tests.
Top weir for inlet
water flow not in
level.
Top cover to
be dismantled
and V-notch
weirs to be
adjusted.
DONE at
Industrial
Electric.
Spray nozzles,
pumps and
filters test
Work as required Visual Inspection. Recirculation
pump missing
Provide a
recirculation
pump at
lower sump.
DONE at
Industrial
electric.
Heating and Control in the Temperature gauges. Freon system to Optimum DONE at
Page 114
114
cooling system
test
right temp.area be modified due
to excess
refrigerant.
Freon level to
be
maintained.
Industrial
electric.
Temperature and
pressure gauges.
Ensure adequate
quantity for
process readings.
Visual Inspection.
Temperature
gauges missing at
top and bottom
section.
Procure and
fit the same.
DONE at
Industrial
electric.
Valves.
Work as required
and ensure
adequate
number.
Purge valve for
vacuum pump
missing.
Flow meter and Visual
Inspection.
2”Ball valve installed.
5 valves missing
to operate unit
under vacuum.
Required ball
valves to be
procured and
installed.
DONE at
Industrial
electric and
NMT.
Controls and
hardware test
All work as
required. Control box.
All automatic and
manual controls
work as required.
NA NA