16
PROVINCIAL UPDATE ON AUDITOR GENERAL RECOMMENDATIONS As at June 15, 2013

PROVINCIAL UPDATE ON AUDITOR GENERAL RECOMMENDATIONS
As at June 15, 2013
2
CONTENTS
Overview 3
Overall Statistics 5
Summary 11
Appendix 1: Links to Departmental Reports 12
Appendix 2: 2007 to 2008 Recommendations 13
Appendix 3: Management and Oversight of Auditor General Recommendations 15
3
Overview In May 2011, the Province committed to update Nova Scotians every six months on its progress in
implementing Auditor General’s (AG) recommendations.
This report provides a brief summary of the recommendations, responses and status of the
recommendations from April 2009 to February 2013. A summary response from each department is
found in Appendix 1 at the end of this report, with a breakdown of the recommendations by chapter
and status. Appendix 2 provides a summary of the status of all 2007 to 2008 AG’s recommendations.
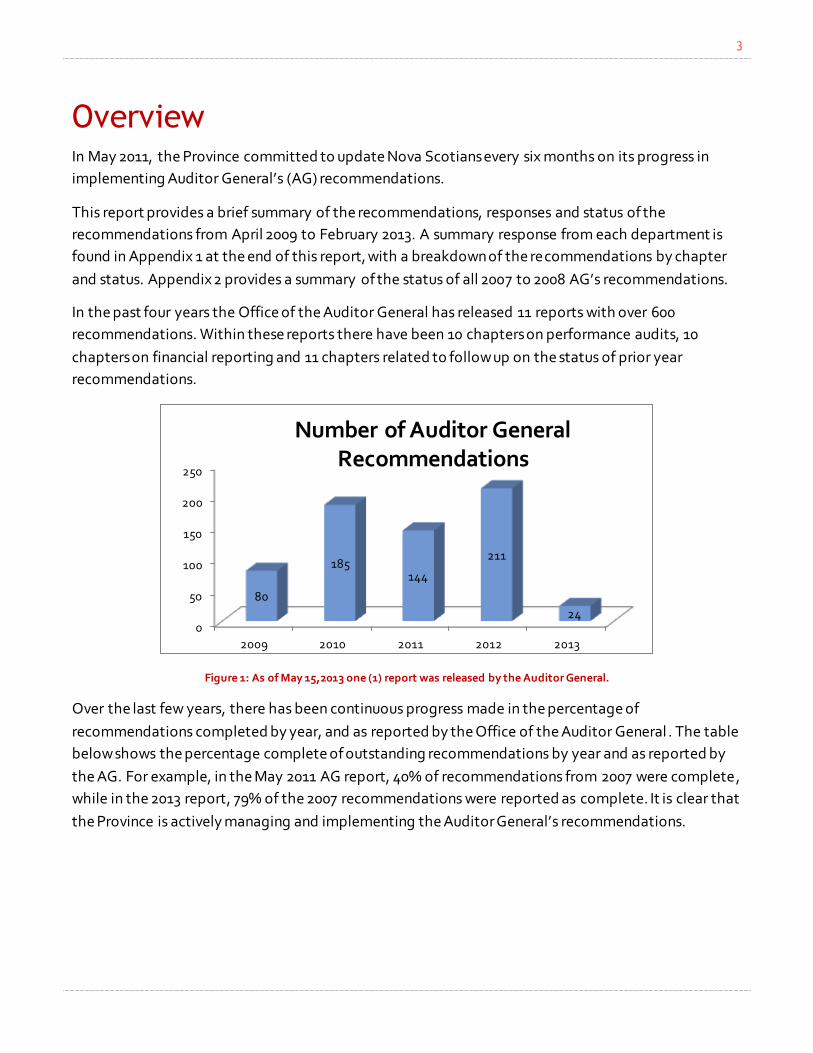
In the past four years the Office of the Auditor General has released 11 reports with over 600
recommendations. Within these reports there have been 10 chapters on performance audits, 10
chapters on financial reporting and 11 chapters related to follow up on the status of prior year
recommendations.
Figure 1: As of May 15,2013 one (1) report was released by the Auditor General.
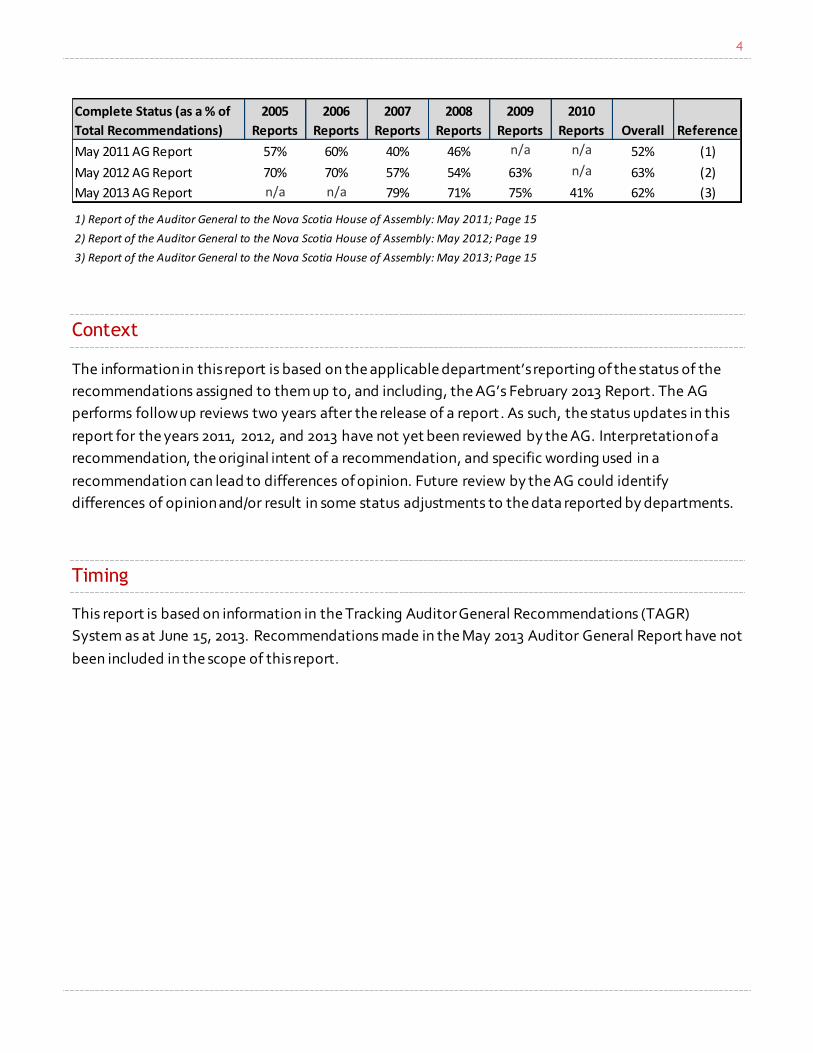
Over the last few years, there has been continuous progress made in the percentage of
recommendations completed by year, and as reported by the Office of the Auditor General . The table
below shows the percentage complete of outstanding recommendations by year and as reported by
the AG. For example, in the May 2011 AG report, 40% of recommendations from 2007 were complete,
while in the 2013 report, 79% of the 2007 recommendations were reported as complete. It is clear that
the Province is actively managing and implementing the Auditor General’s recommendations.
0
50
100
150
200
250
2009 2010 2011 2012 2013
80
185 144
211
24
Number of Auditor General Recommendations
4
Context
The information in this report is based on the applicable department’s reporting of the status of the
recommendations assigned to them up to, and including, the AG’s February 2013 Report. The AG
performs follow up reviews two years after the release of a report. As such, the status updates in this
report for the years 2011, 2012, and 2013 have not yet been reviewed by the AG. Interpretation of a
recommendation, the original intent of a recommendation, and specific wording used in a
recommendation can lead to differences of opinion. Future review by the AG could identify
differences of opinion and/or result in some status adjustments to the data reported by departments.
Timing
This report is based on information in the Tracking Auditor General Recommendations (TAGR)
System as at June 15, 2013. Recommendations made in the May 2013 Auditor General Report have not
been included in the scope of this report.
Complete Status (as a % of
Total Recommendations)
2005
Reports
2006
Reports
2007
Reports
2008
Reports
2009
Reports
2010
Reports Overall Reference
May 2011 AG Report 57% 60% 40% 46% n/a n/a 52% (1)
May 2012 AG Report 70% 70% 57% 54% 63% n/a 63% (2)
May 2013 AG Report n/a n/a 79% 71% 75% 41% 62% (3)
1) Report of the Auditor General to the Nova Scotia House of Assembly: May 2011; Page 15
2) Report of the Auditor General to the Nova Scotia House of Assembly: May 2012; Page 19
3) Report of the Auditor General to the Nova Scotia House of Assembly: May 2013; Page 15
5
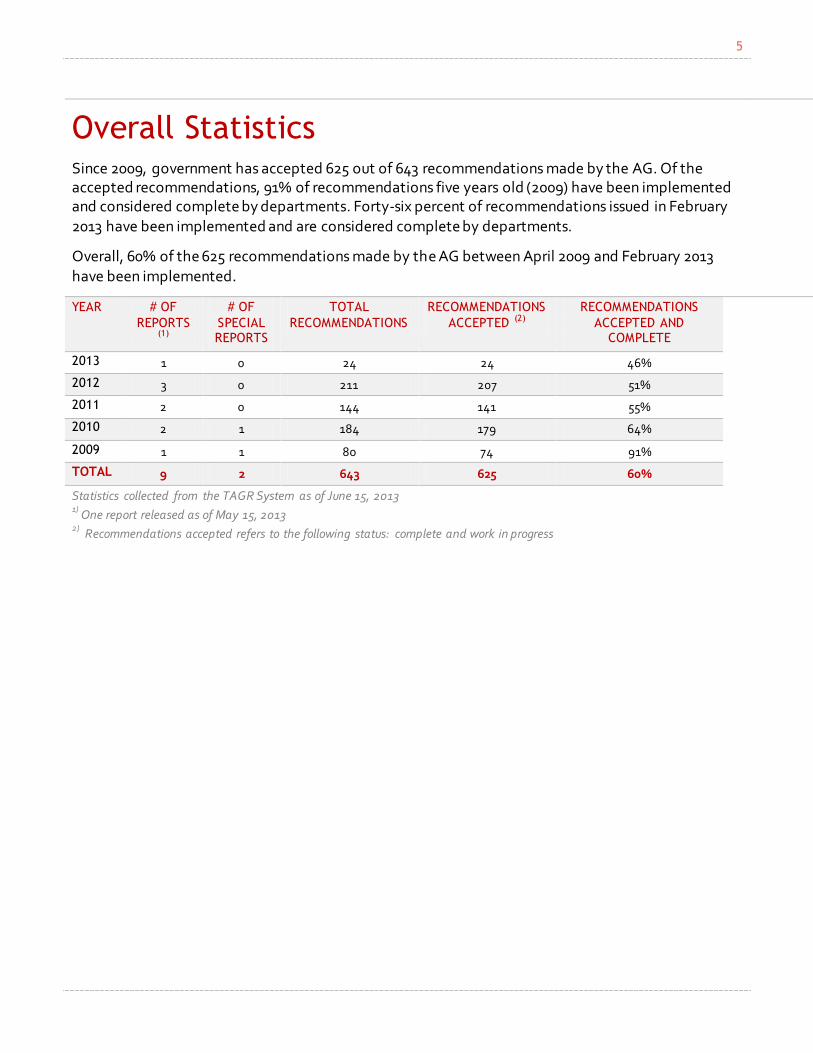
Overall Statistics Since 2009, government has accepted 625 out of 643 recommendations made by the AG. Of the accepted recommendations, 91% of recommendations five years old (2009) have been implemented and considered complete by departments. Forty-six percent of recommendations issued in February
2013 have been implemented and are considered complete by departments.
Overall, 60% of the 625 recommendations made by the AG between April 2009 and February 2013
have been implemented.
YEAR # OF
REPORTS (1)
# OF
SPECIAL REPORTS
TOTAL
RECOMMENDATIONS RECOMMENDATIONS
ACCEPTED (2) RECOMMENDATIONS
ACCEPTED AND COMPLETE
2013 1 0 24 24 46%
2012 3 0 211 207 51%
2011 2 0 144 141 55%
2010 2 1 184 179 64%
2009 1 1 80 74 91%
TOTAL 9 2 643 625 60%
Statistics collected from the TAGR System as of June 15, 2013 1)
One report released as of May 15, 2013 2)
Recommendations accepted refers to the following status: complete and work in progress

6
Comparison of Years
For a comparison to prior years, the table below outlines the number of recommendations and the
percentage of those recommendations that are complete.
Since the release of the November 2012 Provincial Update, departments have implemented another
13% of 2009 recommendations (Nov. 2012 Update reported 78% complete for 2009
recommendations) and 8% of 2011 recommendations (Nov. 2012 Update reported 47% complete for
2011 recommendations).
Percentage of 2010 recommendations completed has remained the same (64%) as reported in
November 2012. While progress has been made with implementing some of the recommendations,
there were also some recommendations that went from complete to work in progress primarily due to
status discrepancies between three provincial departments and the AG (see Context on page 1). The
departments are actively working to complete these recommendations.
0%
20%
40%
60%
80%
100%
2009 2010 2011 2012 2013
91%
64% 55% 51% 46%
9%
36% 45% 49% 54%
Status of Auditor General Recommendations by Year As at June 15, 2013
Complete Work In Progress
Number of Accepted Recommendations 179 74 141 207 24 (1)
1) At the time the February 2013 Auditor General report was released, the Department of Finance had already been working on the majority of the 15 recommendations assigned to them.
7
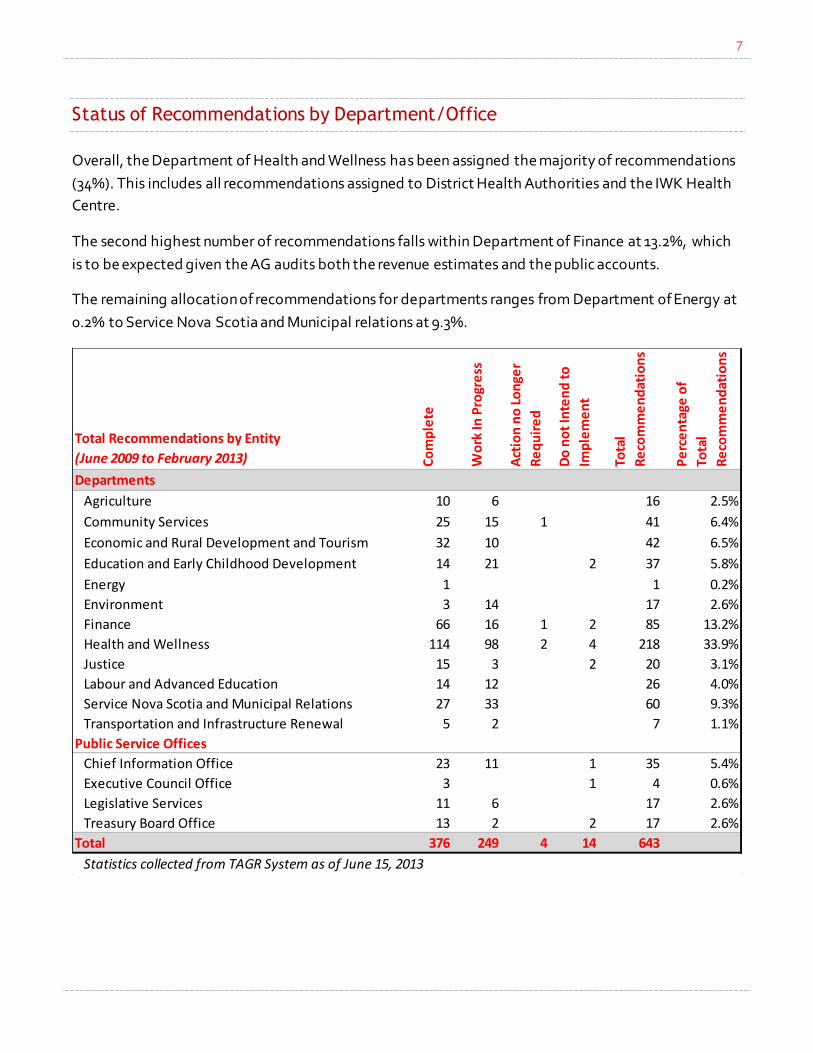
Status of Recommendations by Department/Office
Overall, the Department of Health and Wellness has been assigned the majority of recommendations
(34%). This includes all recommendations assigned to District Health Authorities and the IWK Health
Centre.
The second highest number of recommendations falls within Department of Finance at 13.2%, which
is to be expected given the AG audits both the revenue estimates and the public accounts.
The remaining allocation of recommendations for departments ranges from Department of Energy at
0.2% to Service Nova Scotia and Municipal relations at 9.3%.
Total Recommendations by Entity
(June 2009 to February 2013) Co
mp
lete
Wo
rk In
Pro
gre
ss
Act
ion
no
Lo
nge
r
Re
qu
ire
d
Do
no
t In
ten
d t
o
Imp
lem
en
t
Tota
l
Re
com
me
nd
atio
ns
Pe
rce
nta
ge o
f
Tota
l
Re
com
me
nd
atio
ns
Departments
Agriculture 10 6 16 2.5%
Community Services 25 15 1 41 6.4%
Economic and Rural Development and Tourism 32 10 42 6.5%
Education and Early Childhood Development 14 21 2 37 5.8%
Energy 1 1 0.2%
Environment 3 14 17 2.6%
Finance 66 16 1 2 85 13.2%
Health and Wellness 114 98 2 4 218 33.9%
Justice 15 3 2 20 3.1%
Labour and Advanced Education 14 12 26 4.0%
Service Nova Scotia and Municipal Relations 27 33 60 9.3%
Transportation and Infrastructure Renewal 5 2 7 1.1%
Public Service Offices
Chief Information Office 23 11 1 35 5.4%
Executive Council Office 3 1 4 0.6%
Legislative Services 11 6 17 2.6%
Treasury Board Office 13 2 2 17 2.6%
Total 376 249 4 14 643
Statistics collected from TAGR System as of June 15, 2013
8
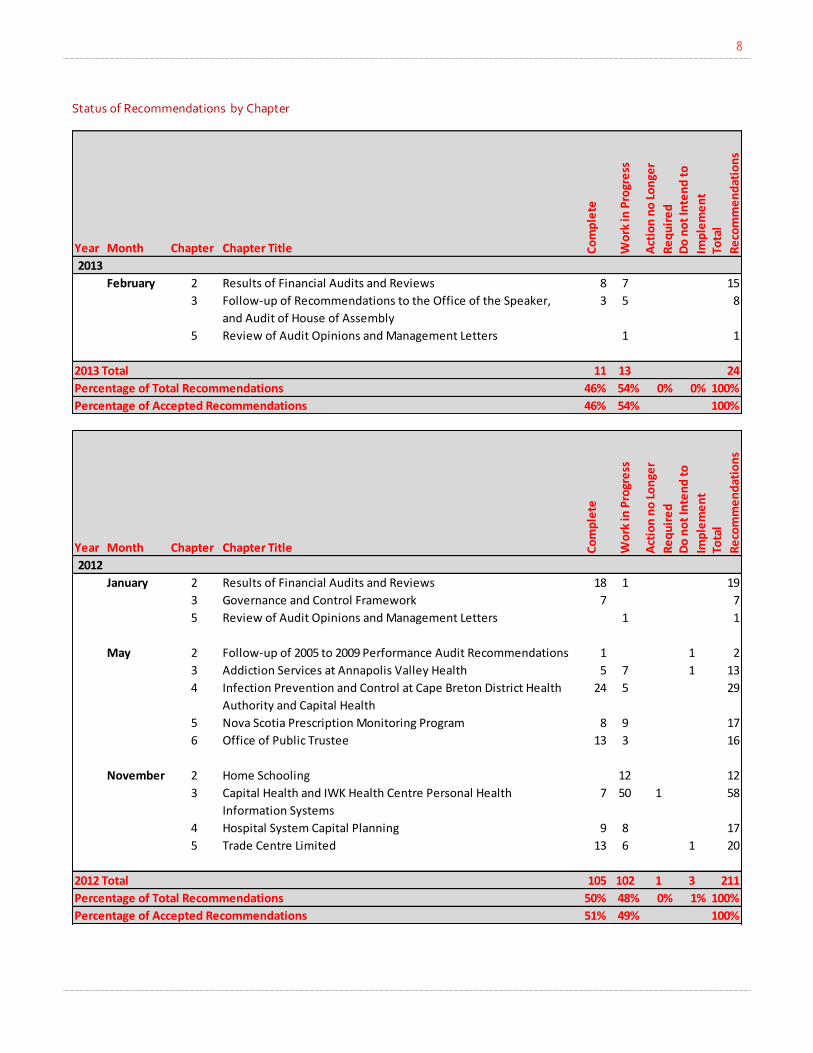
Status of Recommendations by Chapter
Year Month Chapter Chapter Title Co
mp
lete
Wo
rk in
Pro
gre
ss
Act
ion
no
Lo
nge
r
Re
qu
ire
dD
o n
ot
Inte
nd
to
Imp
lem
en
tTo
tal
Re
com
me
nd
atio
ns
2013
February 2 Results of Financial Audits and Reviews 8 7 15
3 Follow-up of Recommendations to the Office of the Speaker,
and Audit of House of Assembly
3 5 8
5 Review of Audit Opinions and Management Letters 1 1
2013 Total 11 13 24
Percentage of Total Recommendations 46% 54% 0% 0% 100%
Percentage of Accepted Recommendations 46% 54% 100%
Year Month Chapter Chapter Title Co
mp
lete
Wo
rk in
Pro
gre
ss
Act
ion
no
Lo
nge
r
Re
qu
ire
dD
o n
ot
Inte
nd
to
Imp
lem
en
tTo
tal
Re
com
me
nd
atio
ns
2012
January 2 Results of Financial Audits and Reviews 18 1 19
3 Governance and Control Framework 7 7
5 Review of Audit Opinions and Management Letters 1 1
May 2 Follow-up of 2005 to 2009 Performance Audit Recommendations 1 1 2
3 Addiction Services at Annapolis Valley Health 5 7 1 13
4 Infection Prevention and Control at Cape Breton District Health
Authority and Capital Health
24 5 29
5 Nova Scotia Prescription Monitoring Program 8 9 17
6 Office of Public Trustee 13 3 16
November 2 Home Schooling 12 12
3 Capital Health and IWK Health Centre Personal Health
Information Systems
7 50 1 58
4 Hospital System Capital Planning 9 8 17
5 Trade Centre Limited 13 6 1 20
2012 Total 105 102 1 3 211
Percentage of Total Recommendations 50% 48% 0% 1% 100%
Percentage of Accepted Recommendations 51% 49% 100%
9
Year Month Chapter Chapter Title Co
mp
lete
Wo
rk in
Pro
gre
ss
Act
ion
no
Lo
nge
r
Re
qu
ire
dD
o n
ot
Inte
nd
to
Imp
lem
en
tTo
tal
Re
com
me
nd
atio
ns
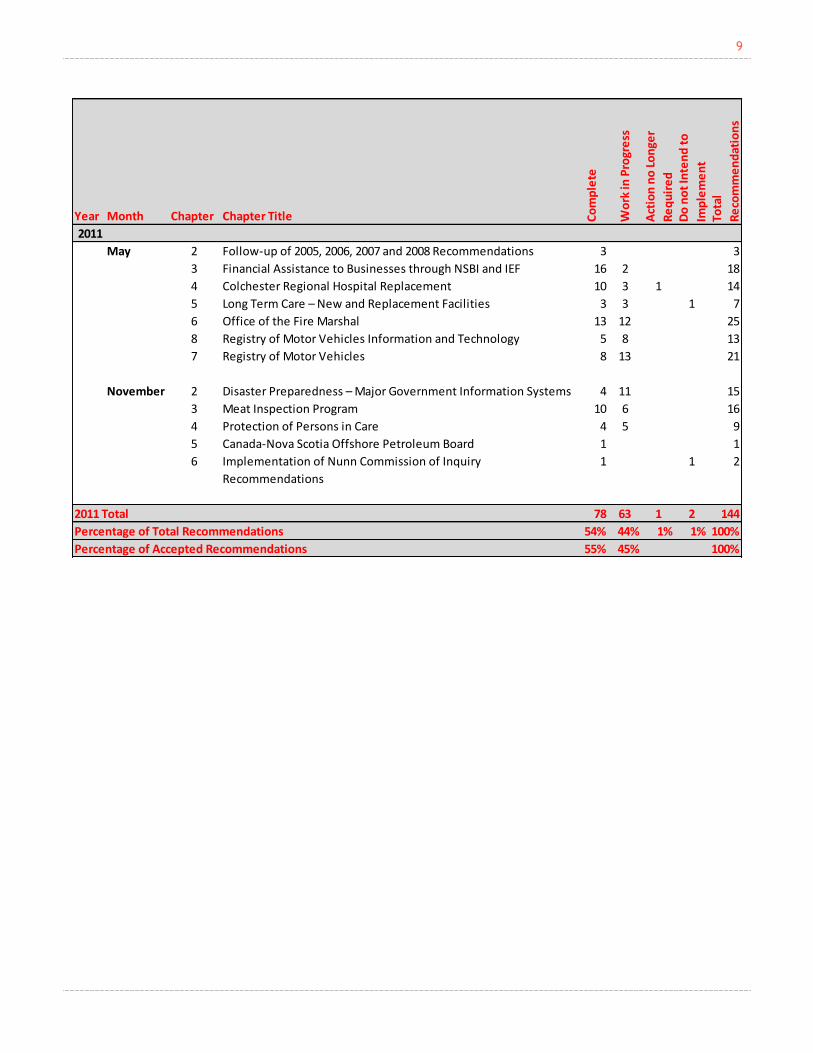
2011
May 2 Follow-up of 2005, 2006, 2007 and 2008 Recommendations 3 3
3 Financial Assistance to Businesses through NSBI and IEF 16 2 18
4 Colchester Regional Hospital Replacement 10 3 1 14
5 Long Term Care – New and Replacement Facilities 3 3 1 7
6 Office of the Fire Marshal 13 12 25
8 Registry of Motor Vehicles Information and Technology 5 8 13
7 Registry of Motor Vehicles 8 13 21
November 2 Disaster Preparedness – Major Government Information Systems 4 11 15
3 Meat Inspection Program 10 6 16
4 Protection of Persons in Care 4 5 9
5 Canada-Nova Scotia Offshore Petroleum Board 1 1
6 Implementation of Nunn Commission of Inquiry
Recommendations
1 1 2
2011 Total 78 63 1 2 144
Percentage of Total Recommendations 54% 44% 1% 1% 100%
Percentage of Accepted Recommendations 55% 45% 100%
10
Year Month Chapter Chapter Title Co
mp
lete
Wo
rk in
Pro
gre
ss
Act
ion
no
Lo
nge
r
Re
qu
ire
dD
o n
ot
Inte
nd
to
Imp
lem
en
tTo
tal
Re
com
me
nd
atio
ns
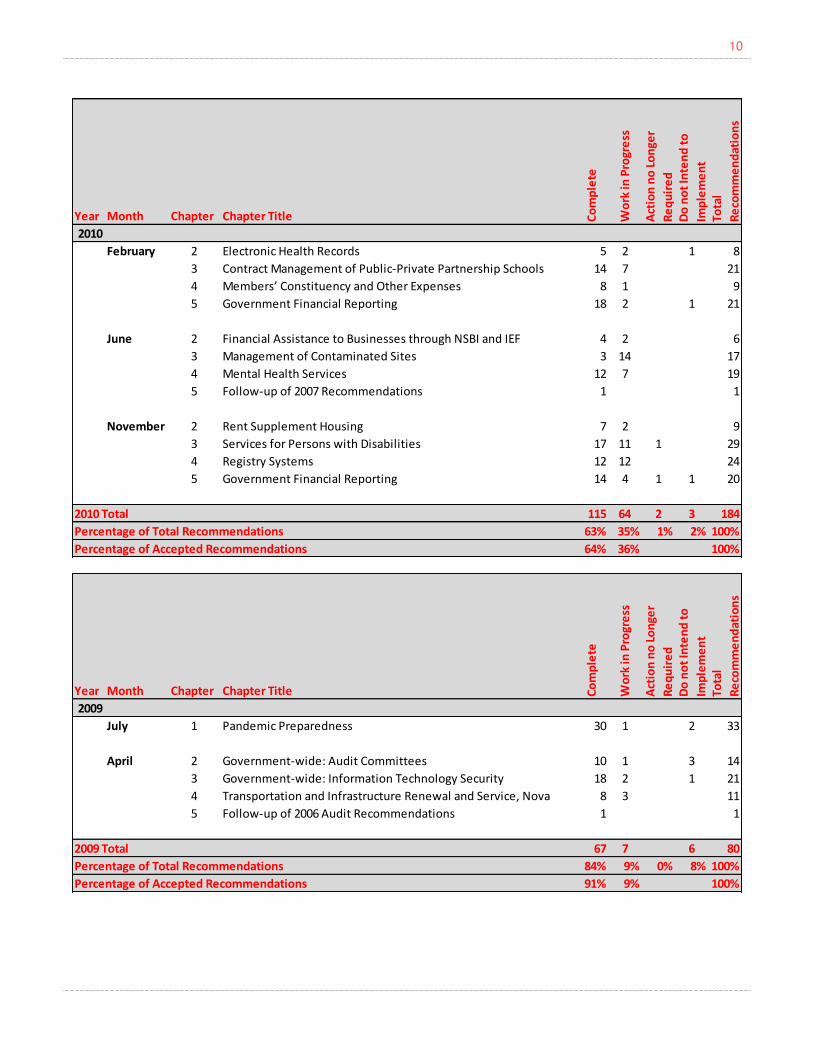
2010
February 2 Electronic Health Records 5 2 1 8
3 Contract Management of Public-Private Partnership Schools 14 7 21
4 Members’ Constituency and Other Expenses 8 1 9
5 Government Financial Reporting 18 2 1 21
June 2 Financial Assistance to Businesses through NSBI and IEF 4 2 6
3 Management of Contaminated Sites 3 14 17
4 Mental Health Services 12 7 19
5 Follow-up of 2007 Recommendations 1 1
November 2 Rent Supplement Housing 7 2 9
3 Services for Persons with Disabilities 17 11 1 29
4 Registry Systems 12 12 24
5 Government Financial Reporting 14 4 1 1 20
2010 Total 115 64 2 3 184
Percentage of Total Recommendations 63% 35% 1% 2% 100%
Percentage of Accepted Recommendations 64% 36% 100%
Year Month Chapter Chapter Title Co
mp
lete
Wo
rk in
Pro
gre
ss
Act
ion
no
Lo
nge
r
Re
qu
ire
dD
o n
ot
Inte
nd
to
Imp
lem
en
tTo
tal
Re
com
me
nd
atio
ns
2009
July 1 Pandemic Preparedness 30 1 2 33
April 2 Government-wide: Audit Committees 10 1 3 14
3 Government-wide: Information Technology Security 18 2 1 21
4 Transportation and Infrastructure Renewal and Service, Nova 8 3 11
5 Follow-up of 2006 Audit Recommendations 1 1
2009 Total 67 7 6 80
Percentage of Total Recommendations 84% 9% 0% 8% 100%
Percentage of Accepted Recommendations 91% 9% 100%
11
Summary Information in the Provincial Update is collected from the TAGR System and in consultation with the
departments who are assigned recommendations. The statuses of recommendations within this
report are the department’s self-assessment of their progress on a specific recommendation as of
June 15, 2013.
The Province recognizes the value in the work performed by the Office of the Auditor General and
contribution it makes to increased accountability and transparency of Government for Nova Scotians.
The Province will continue to actively work on addressing recommendations, while improving the
systems and processes that enable the tracking and monitoring of those recommendations.
12
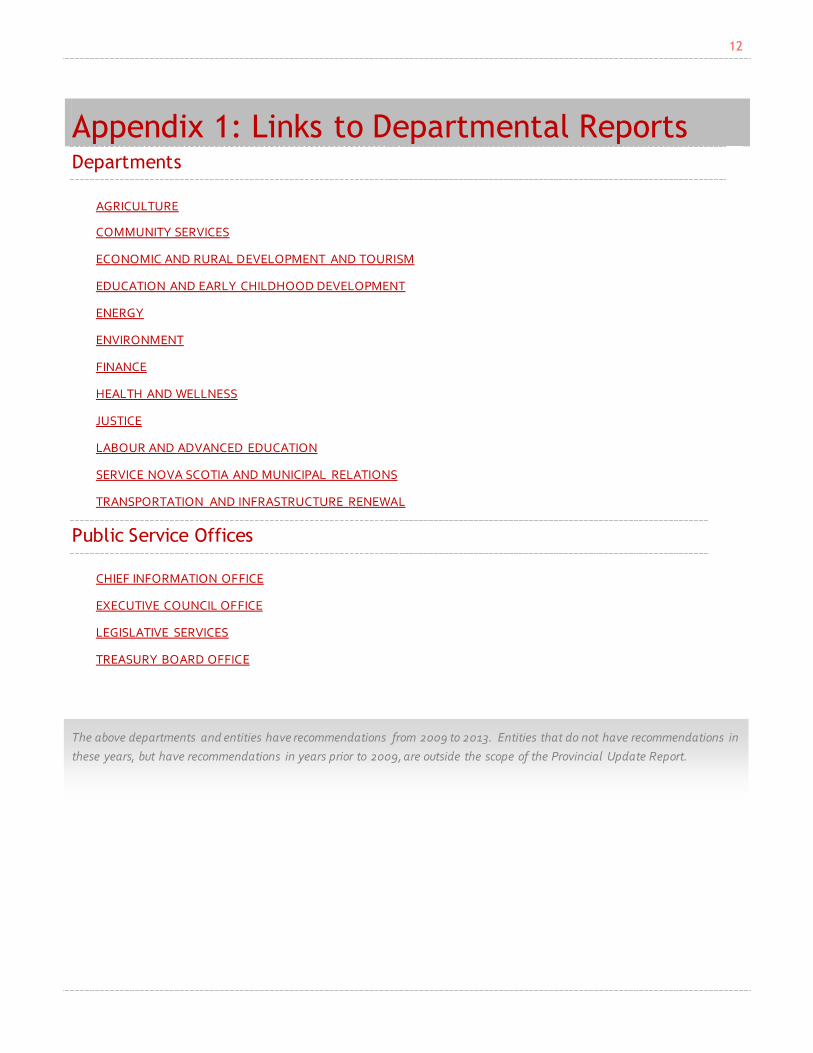
Appendix 1: Links to Departmental Reports Departments
AGRICULTURE
COMMUNITY SERVICES
ECONOMIC AND RURAL DEVELOPMENT AND TOURISM
EDUCATION AND EARLY CHILDHOOD DEVELOPMENT
ENERGY
ENVIRONMENT
FINANCE
HEALTH AND WELLNESS
JUSTICE
LABOUR AND ADVANCED EDUCATION
SERVICE NOVA SCOTIA AND MUNICIPAL RELATIONS
TRANSPORTATION AND INFRASTRUCTURE RENEWAL
Public Service Offices
CHIEF INFORMATION OFFICE
EXECUTIVE COUNCIL OFFICE
LEGISLATIVE SERVICES
TREASURY BOARD OFFICE
The above departments and entities have recommendations from 2009 to 2013. Entities that do not have recommendations in
these years, but have recommendations in years prior to 2009, are outside the scope of the Provincial Update Report.
13
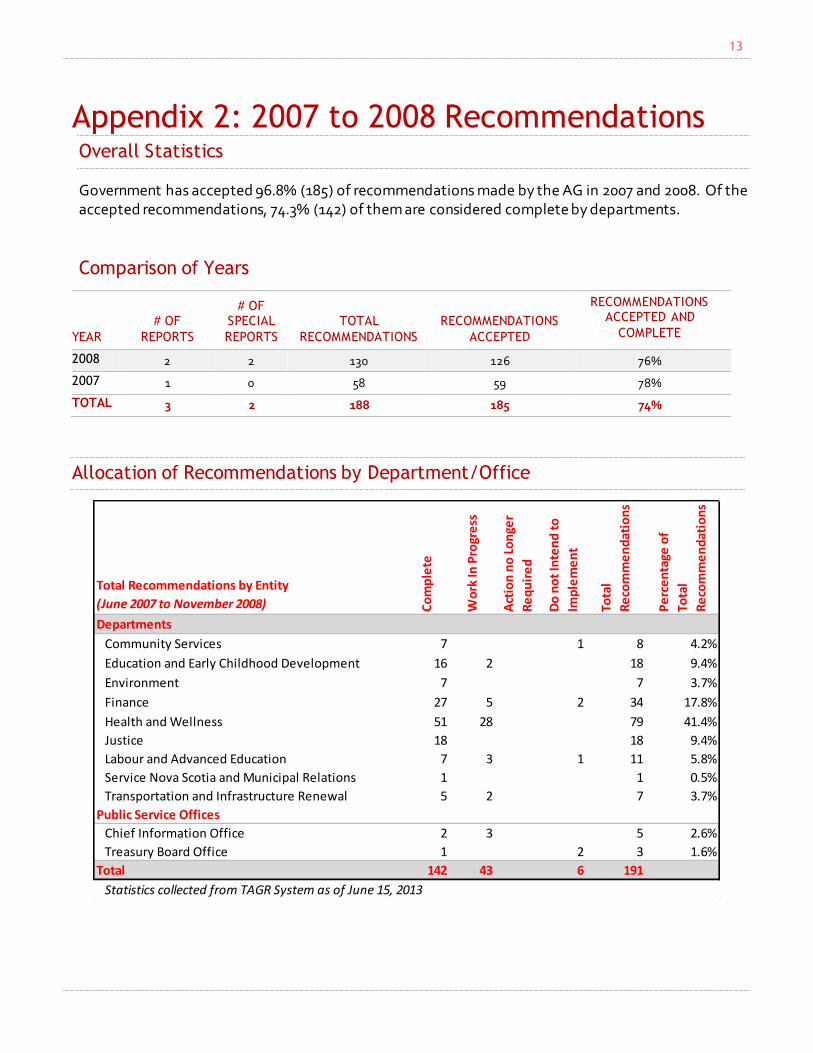
Appendix 2: 2007 to 2008 Recommendations Overall Statistics
Government has accepted 96.8% (185) of recommendations made by the AG in 2007 and 2008. Of the accepted recommendations, 74.3% (142) of them are considered complete by departments.
Comparison of Years
YEAR
# OF
REPORTS
# OF SPECIAL
REPORTS TOTAL
RECOMMENDATIONS RECOMMENDATIONS
ACCEPTED
RECOMMENDATIONS ACCEPTED AND
COMPLETE
2008 2 2 130 126 76%
2007 1 0 58 59 78%
TOTAL 3 2 188 185 74%
Allocation of Recommendations by Department/Office
Total Recommendations by Entity
(June 2007 to November 2008) Co
mp
lete
Wo
rk In
Pro
gre
ss
Act
ion
no
Lo
nge
r
Re
qu
ire
d
Do
no
t In
ten
d t
o
Imp
lem
en
t
Tota
l
Re
com
me
nd
atio
ns
Pe
rce
nta
ge o
f
Tota
l
Re
com
me
nd
atio
ns
Departments
Community Services 7 1 8 4.2%
Education and Early Childhood Development 16 2 18 9.4%
Environment 7 7 3.7%
Finance 27 5 2 34 17.8%
Health and Wellness 51 28 79 41.4%
Justice 18 18 9.4%
Labour and Advanced Education 7 3 1 11 5.8%
Service Nova Scotia and Municipal Relations 1 1 0.5%
Transportation and Infrastructure Renewal 5 2 7 3.7%
Public Service Offices
Chief Information Office 2 3 5 2.6%
Treasury Board Office 1 2 3 1.6%
Total 142 43 6 191
Statistics collected from TAGR System as of June 15, 2013
14
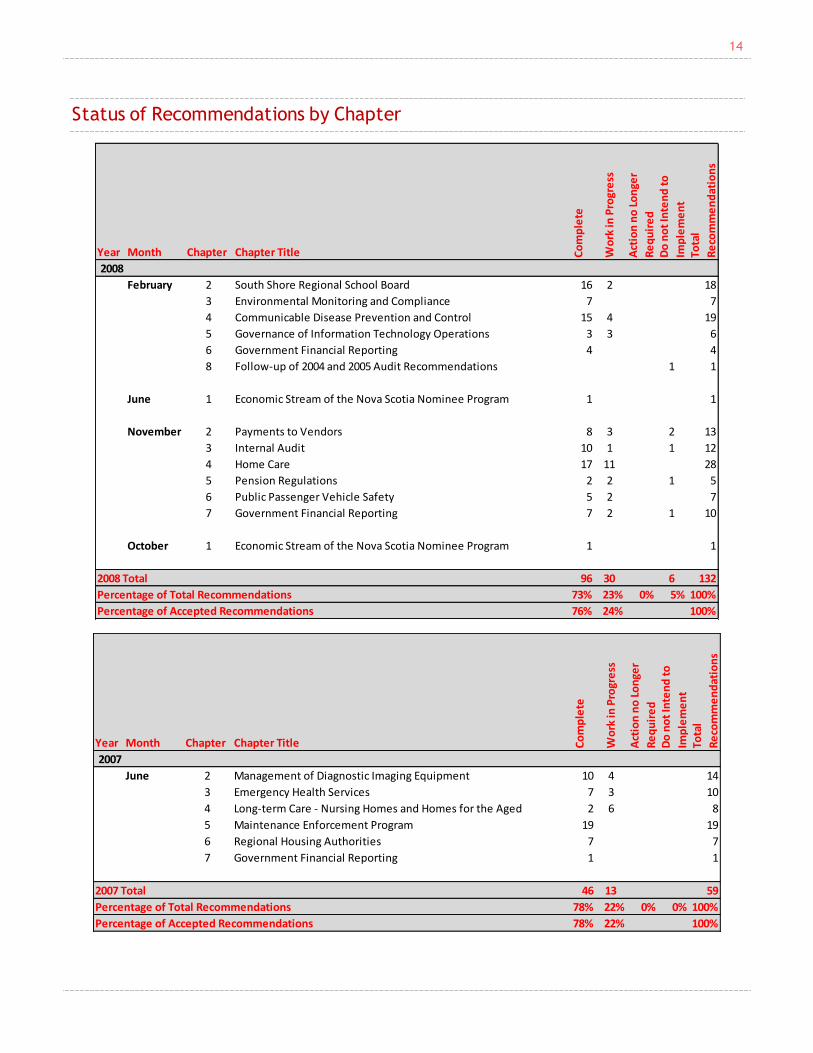
Status of Recommendations by Chapter
Year Month Chapter Chapter Title Co
mp
lete
Wo
rk in
Pro
gre
ss
Act
ion
no
Lo
nge
r
Re
qu
ire
dD
o n
ot
Inte
nd
to
Imp
lem
en
tTo
tal
Re
com
me
nd
atio
ns
2008
February 2 South Shore Regional School Board 16 2 18
3 Environmental Monitoring and Compliance 7 7
4 Communicable Disease Prevention and Control 15 4 19
5 Governance of Information Technology Operations 3 3 6
6 Government Financial Reporting 4 4
8 Follow-up of 2004 and 2005 Audit Recommendations 1 1
June 1 Economic Stream of the Nova Scotia Nominee Program 1 1
November 2 Payments to Vendors 8 3 2 13
3 Internal Audit 10 1 1 12
4 Home Care 17 11 28
5 Pension Regulations 2 2 1 5
6 Public Passenger Vehicle Safety 5 2 7
7 Government Financial Reporting 7 2 1 10
October 1 Economic Stream of the Nova Scotia Nominee Program 1 1
2008 Total 96 30 6 132
Percentage of Total Recommendations 73% 23% 0% 5% 100%
Percentage of Accepted Recommendations 76% 24% 100%
Year Month Chapter Chapter Title Co
mp
lete
Wo
rk in
Pro
gre
ss
Act
ion
no
Lo
nge
r
Re
qu
ire
dD
o n
ot
Inte
nd
to
Imp
lem
en
tTo
tal
Re
com
me
nd
atio
ns
2007
June 2 Management of Diagnostic Imaging Equipment 10 4 14
3 Emergency Health Services 7 3 10
4 Long-term Care - Nursing Homes and Homes for the Aged 2 6 8
5 Maintenance Enforcement Program 19 19
6 Regional Housing Authorities 7 7
7 Government Financial Reporting 1 1
2007 Total 46 13 59
Percentage of Total Recommendations 78% 22% 0% 0% 100%
Percentage of Accepted Recommendations 78% 22% 100%
15
Appendix 3: Management and Oversight of Auditor General Recommendations Internal Processes and Governance
When the AG releases a report with recommendations, each recommendation is assigned a lead
department to track and report. The lead department, though their TAGR liaison and coordinator,
consults subject matter experts to determine a course of action. Departments with a significant
number of recommendations (e.g., Service Nova Scotia and Municipal Relations) have implemented
an internal structure to monitor, review and report on the status of the recommendations.
The liaisons and coordinators report to the Senior Management Team on the status of the
recommendations, and work with the TAGR Steering Committee to ensure the responses are updated
in the TAGR system and they have been approved by the appropriate individuals.
TAGR Steering Committee governs the TAGR process and acts as the conduit between the Audit
Committee, Treasury Board and TAGR representatives within departments. The Steering Committee
is made up of senior management from Department of Finance, Treasury Board Office and Office of
Policy and Priorities. The Steering Committee reviews initial follow-up responses to the AG (two-year-
old recommendations) but does not go back to older responses and review them every year unless
specifically requested.
Training sessions were held in July 2012 for departments with recommendations, and other
departments interested in the administration and monitoring of AG recommendations. Of the 16
departments issued recommendations between April 2009 and February 2013, 88% of them attended
the training sessions and the remaining 12% received one-on-one training. Overall feedback from
these sessions was positive and government intends to make these training sessions available
annually.
TAGR System
The TAGR system is a database of AG recommendations and department responses to those
recommendations. It was developed in cooperation with the Office of the Auditor General in 2008.
When the AG releases a report, all recommendations are entered into the TAGR database and
assigned to the appropriate department for action.
The TAGR system is continuously being updated by departments on the progress they are making to
meet the AGs recommendations. A recommendation may have a status of “Work in Progress” one day
and then be updated to “Complete” on another.
As with any system, when information is extracted (a snapshot in time) there can be some differences
between the extract and the live system. There can also be a delay in reporting in the system from
16
when a recommendation is implemented to when it is updated in the system. This is in part due to
controls put in place to ensure information is received, recorded, reported and approved by the
appropriate parties.
As pointed out by the AG, the importance of any monitoring system is to ensure the data being
provided is timely and accurately reflects the most up-to-date information. Those using the system
must also be aware of its limitations and use the information appropriately. The Province
acknowledges that further training and more frequent updates should be done to ensure those using
the system are reporting appropriately.
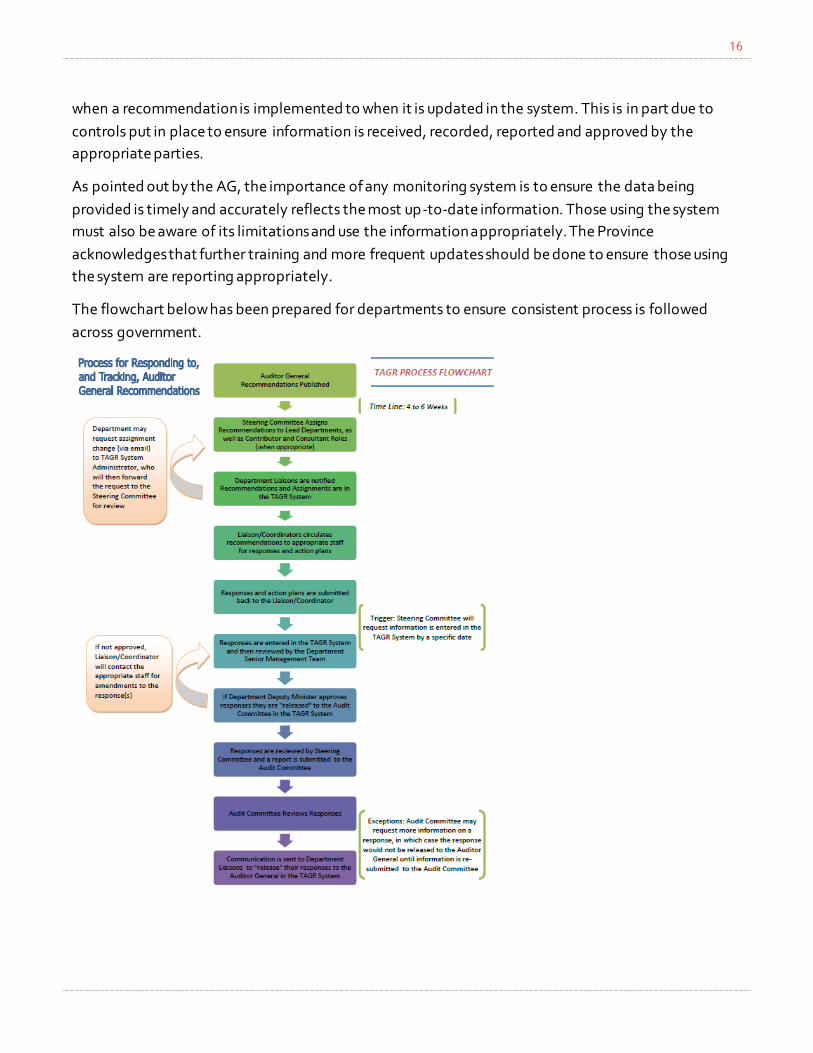
The flowchart below has been prepared for departments to ensure consistent process is followed
across government.


