Page 1
UNITED NATIONS DEVELOPMENT
PROGRAM (UNDP)
PROVISION OF PROFESSIONAL
SERVICES OF ENERGY AUDIT FIRM
FOR THE CEDRO IV
PHOTOVOLTAIC (PV) SITES
LEB/CO RFP/24/14
ENERGY AUDIT REPORT FOR
USEK
February , 2015
Page 2
USEK, Beirut- Energy Audit
ii Energy Audit prepared by EEG – Energy Efficiency Group | www.eegroup.info
EEG- ENERGY EFFICIENCY GROUP SAL
UNITED NATIONS DEVELOPMENT PROGRAMME (UNDP) Document Type: Draft Report
Contract Ref: 14/125
PROVISION OF PROFESSIONAL SERVICES OF ENERGY
AUDIT FIRM FOR THE CEDRO IV PHOTOVOLTAIC (PV)
SITES
No. of Pages: 45
Energy Audit Report Version no.: 0
Document Control
Revision / Date Issued by: Reviewed by: Approved by:
A-for Client Review
13/02/2015
Ronald Diab
Martine Tohme
Martine Tohme
Ronald Diab
B-for Client Approval
Disclaimer
This report has been prepared by EEG, with all reasonable skill, care and diligence within the terms of the contract
with the client, incorporating our General Terms and Conditions of Business and taking account of the resources
devoted to it by agreement with the client. The information contained in this report is, to the best of our knowledge,
correct at the time of printing. The interpretations and recommendations are based on our experience, using
reasonable professional skill and judgment, and based upon the information that was available to us. This report is
confidential to the client and we accept no responsibility whatsoever to third parties to whom this report, or any part
thereof, is made known. Any such party relies on the report at their own risk.
HQ: Banking Centre, Dora Highway.
PO BOX: 90-1080 Beirut, Lebanon
T: + 9611250840; F: + 9611250874
E: [email protected] , www.eegroup.info
Page 3
USEK, Beirut- Energy Audit
iii Energy Audit prepared by EEG – Energy Efficiency Group | www.eegroup.info
Table of Contents Page 1. Introduction .......................................................................................................................... 1
1.1. Energy Audit procedure .............................................................................................. 1
2. USEK General description and information ....................................................................... 2
2.1. Facility General description ............................................................................................ 2
2.2. Facility Building Envelope ............................................................................................... 3
2.3. Electrical Energy: Sources and Distribution system ....................................................... 5
2.4. Automation and Metering.............................................................................................. 6
2.5. Thermal Energy: Sources and Distribution system ......................................................... 7
2.6. Annual Utilities Consumption .......................................................................................... 7
3. USEK Utilities .......................................................................................................................... 8
3.1. Electrical Energy ........................................................................................................... 8
3.1.2 Introduction................................................................................................................... 8
3.1.2 EDL Electrical Energy Analysis and Cost ..................................................................... 8
3.1.3 Generators' Electrical Analysis ..................................................................................... 9
3.1.4 Electrical Energy Baseline ...........................................................................................10
3.1.5 Correlation between Electrical Energy and Weather .............................................11
3.2. Thermal Energy ............................................................................................................12
4. USEK Electrical Load Analysis ........................................................................................... 13
4.1. Introduction ....................................................................................................................13
4.2. Load Inventory ................................................................................................................13
4.3. Lighting System Description ...........................................................................................14
4.4. Cooling System Description ...........................................................................................16
4.4.1. DX/Split Units ................................................................................................................16
4.4.2. Air Cooled Chillers .......................................................................................................17
4.4.3. VRF System ...................................................................................................................18
4.4.4. Cooling Energy Breakdown ........................................................................................19
4.5. HVAC Fans ......................................................................................................................20
4.6. Pumps and Motors .........................................................................................................22
4.7. IT Equipment ...................................................................................................................22
4.8. Miscellaneous Loads ......................................................................................................23
4.9. Electrical Energy Balance (Load and Cost/Consumption Breakdown) ....................24
4.10. Indoor Air Quality-USEK Present Situation ...................................................................26
5. Energy Efficiency Measures .............................................................................................. 28
Page 4
USEK, Beirut- Energy Audit
iv Energy Audit prepared by EEG – Energy Efficiency Group | www.eegroup.info
5.1. EEM 1: Low Cost/ No Cost Energy Efficiency Measures ..................................................29
5.1.3 Chilled water temperature reset .........................................................................30
5.1.4 Retro-commissioning of all HVAC system in USEK ..............................................31
5.1.5 Employee and Student Engagement .................................................................33
5.2.EEM 2: Lighting Retrofit-LED Retrofit ....................................................................................34
5.3.EEM 3: Occupancy sensors for lighting and cooling system control ...............................36
5.3.1 Introduction ...........................................................................................................36
5.3.2 USEK Case .............................................................................................................37
5.4.EEM 4: Retrofit Split Units with DC Inverter technology .....................................................38
5.4.1 What is a DC inverter technology? .....................................................................38
5.4.2 DC inverter electrical savings calculation ..........................................................39
5.5.VRF Retrofit for the DX units in USEK (What If Scenario) .....................................................42
5.5.1 What is a VRF system? .............................................................................................42
5.5.2 VRF System Electrical Savings Calculation .............................................................42
5.6.EEM 6: Waste Heat Recovery ..............................................................................................45
5.6.1 Waste Heat Recovery Definition .........................................................................45
5.6.2 Heat Rejected from generators ..........................................................................45
5.6.3 USEK Case: Hot water from jacket water coolant .............................................45
5.7.EEM 7: Roof Insulation-Green Roof .....................................................................................47
5.7.1 Introduction ..............................................................................................................47
5.7.2 Green Roof Concept and Benefits .....................................................................47
5.7.3. Energy Saving Mechanism ..................................................................................48
5.8.EEM 8: BMS System Upgrade and Extension ......................................................................51
Page 5
USEK, Beirut- Energy Audit
v Energy Audit prepared by EEG – Energy Efficiency Group | www.eegroup.info
List of Tables Page
Table 1: Installed generators and transformers ........................................................................ 5
Table 2: USEK Annual Electrcity Consumption .......................................................................... 7
Table 3: Monthly EDL consumption and cost for USEK ............................................................. 8
Table 4: Generators' Electrical energy consumption and cost over one year ..................... 9
Table 5: Monthly Electrical Energy consumption and cost over one year for USEK .............10
Table 6: Lighting Inventory-Sample ..........................................................................................13
Table 7: Equipment Inventory-Sample .....................................................................................14
Table 8: USEK-Lighting BOQ .......................................................................................................15
Table 9: Split units Inventory-Sample ........................................................................................16
Table 10: Chilled water networks description ..........................................................................17
Table 11: List of Chillers along their chilled water pumps .......................................................18
Table 12: VRF units Inventory-Sample .......................................................................................19
Table 13: HVAC fans Inventory-Sample ...................................................................................20
Table 14: Motors sample inventory-USEK .................................................................................22
Table 15: IT equipment inventory-USEK ....................................................................................22
Table 16: Miscellaneous loads inventoy-USEK .........................................................................23
Table 17: Electrical load breakdown (Left); Energy Cost Breakdown (Right) .......................24
Table 18: Thermal losses improvement savings .......................................................................30
Table 19: Chilled water temperature reset savings ................................................................31
Table 20: Retro-commissioning of HVAC system in USEK ........................................................33
Table 21: Retro-commissioning of HVAC system in USEK ........................................................33
Table 22: Lighting Retrofit project-LED Retrofit project ...........................................................35
Table 23: Lighting and cooling Energy Savings-USEK ..............................................................38
Table 24: Occupancy sensor project key financial indicator ................................................38
Table 25: Split units installed and related energy consumption ............................................40
Table 26: Comparison of electrical energy consumed to produce the cooling capacity
needed .......................................................................................................................................41
Table 27: DC inverter technology Project Key Financial Indicators ......................................41
Table 28: Cooling capacity needed .......................................................................................43
Table 29: Comparison of the electrical rated power to produce the cooling capacity
needed .......................................................................................................................................43
Table 30: Estimated energy savings if installed VRF ................................................................44
Table 31: Generator heat rejected Description @ full load ...................................................46
Table 32: Thermal energy recovered from the jacket water coolant ...................................46
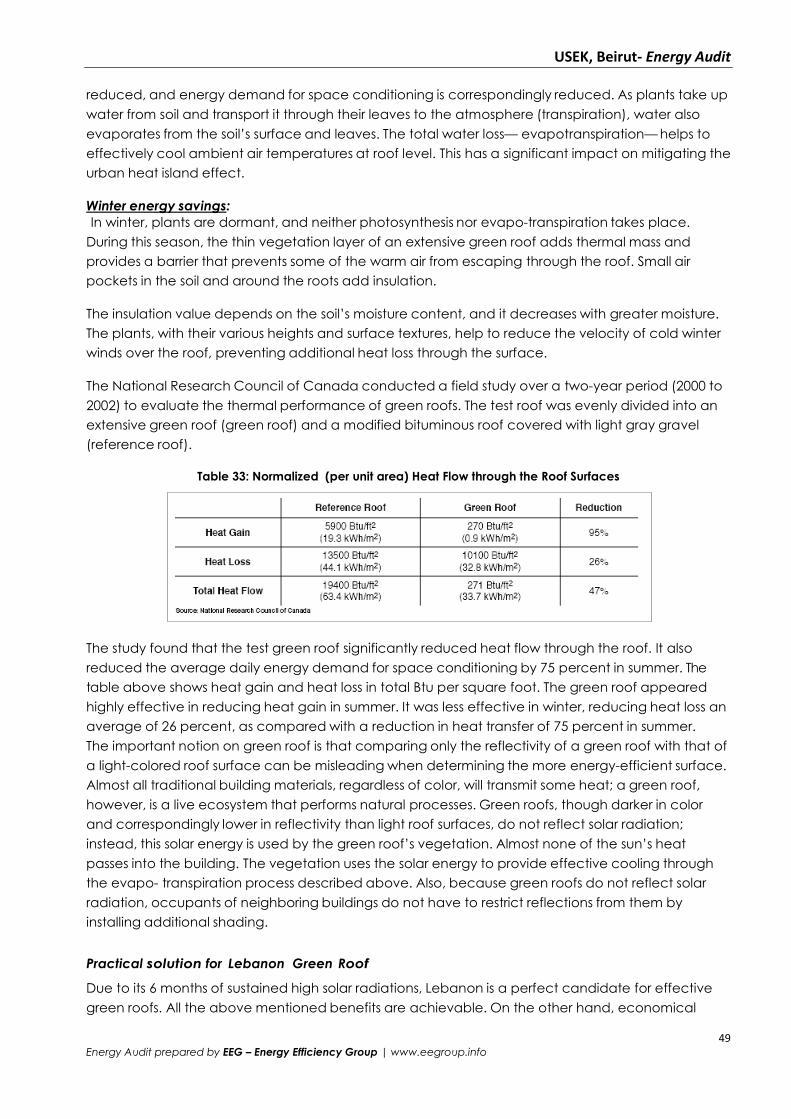
Table 33: Normalized (per unit area) Heat Flow through the Roof Surfaces .......................49
Page 6
USEK, Beirut- Energy Audit
vi Energy Audit prepared by EEG – Energy Efficiency Group | www.eegroup.info
List of Figures Page
Figure 1: USEK Campus map ...................................................................................................... 2
Figure 2: Building envelope block A (Left); Skylights in block H (Middle); Single wall and
single glazing in block C (Right) ................................................................................................ 3
Figure 3: ATS Panels (Left); Transformers (Middle); Main EDL feeder (Right) .......................... 5
Figure 4: Electrical network single line diagram ....................................................................... 5
Figure 5: Ventilation fans time schedule in Block F .................................................................. 6
Figure 6: VRF BMS snapshot in Block F ....................................................................................... 6
Figure 7: CS-NET snapshot in Block H providing the status of each (indoor/outdoor)
cooling unit ................................................................................................................................. 7
Figure 8: EDL energy consumption and cost-USEK .................................................................. 9
Figure 9: Generators' monthly electrical energy consumption and diesel consumption ...10
Figure 10: Monthly Total Electrical Energy Profil for USEK ........................................................11
Figure 11: Monthly Electricity Consumption and Degree Days .............................................11
Figure 12: De Dietrich diesel boilers (Left); Solar Panels for the restaurant (Right) ...............12
Figure 13: 2D 36W in block E (Left); PL 58W in offices (Middle); Linear fluorescent T8 in the
Library (Right) .............................................................................................................................14
Figure 14: LED lighting fixtures in basement 3-Block H ............................................................14
Figure 15: External Lighting fixtures ...........................................................................................14
Figure 16: Outdoor units (Left); Indoor units (Right) .................................................................16
Figure 17: Technical data sheet for the chillers of USEK .........................................................17
Figure 18: Chillers on the roof of Block H (Left); Primary chilled water pumps (Right) ..........17
Figure 19: Operation panel (Left); Chilled water temperature settings (Middle); Operation
Mode (Right) ..............................................................................................................................18
Figure 20: VRF Outdoor units for the Library with dehumidifier inside (Left); VRF O.U. for the
Students Library (Middle); Thermostats for the church (Right) ...............................................18
Figure 21: THermostats for VRF control in students library (Left); CS-NET readings linked to
the archive VRF units (Middle); Ambiant conditions for the books storage room (Left) ......19
Figure 22: Cooling Energy Breakdown (KWh)-USEK.................................................................19
Figure 23: Exhaust Fans in Block E (Left); Exhaust Fans in Block F (Right) ...............................20
Figure 24: Lifting pumps (Left); Hot water circulating pumps (Middle); Potable water
pumps (Right) .............................................................................................................................22
Figure 25: UPS for servers (Left); Server room (Right) ...............................................................23
Figure 26: Washers and dryers (Left); Buggies (Right) .............................................................23
Figure 27: Facility Load Breakdown (Left); Facility Energy Breakdown (Right) .....................24
Figure 28: Load breakdown per Block (Left) ; Energy Consumed per Block (Right) ............25
Figure 29: CO2 level and temperature measured in library block AB-Main Library .............27
Figure 30: Thermal image on hot water pipes .........................................................................29
Figure 31: Open windows and doors in cooled areas ............................................................30
Figure 32: Beirut-Lebanon Historical Temp/RH averages ........................................................31
Page 7
USEK, Beirut- Energy Audit
vii Energy Audit prepared by EEG – Energy Efficiency Group | www.eegroup.info
Figure 33: Motion detector coverage area (Left); Laboratory in building H ........................36
Figure 34: Occupancy sensor installation for lighting and cooling control ..........................36
Figure 35: Operational cooling and lighting in unoccupied areas .......................................37
Figure 36: Laboratories in the second basement of block H (Left); Administration offices
(Right) .........................................................................................................................................37
Figure 37: DC inverter and conventional split units' comparison ...........................................39
Figure 38: DC inverter and conventional split units' temperature variation..........................39
Figure 39: Engine Heat Recovery connection (Left) , Engine Energy Balance v/s Load
(Right) .........................................................................................................................................45
Figure 40: Roof of buildings A and B .........................................................................................47
Figure 41: Gravel Roof v/s Green Roof components ..............................................................47
Figure 42: Two examples of Green Roof: In New York (Left); On the Lebanese Central Bank
Roof – CEDRO project (Right) ...................................................................................................48
Figure 43: Two examples of Sedum Plants in a Green Roof application ..............................50
Figure 44 - Snapshot from the BMS in the block H (Left); BMS Snapshot in block F (right) ...51
Figure 45: BMS in block H lacks control on the chilled water system ....... Error! Bookmark not
defined.
Figure 46 - Energy dashboard example ..................................... Error! Bookmark not defined.
Page 8
USEK, Beirut- Energy Audit
viii Energy Audit prepared by EEG – Energy Efficiency Group | www.eegroup.info
Abbreviations Table
A Amperage
AC Air Conditioning
AHU Air Handling Unit
Amps Amperage
BMS Building Management System
CAV Constant Air Volume
CF Compact Fluorescent
CO2 Carbon Dioxide
COP Coefficient of Performance (KWcooling/KWelectrical)
ECG Electricity Company of Ghana
EEM Energy Efficiency Measures
ESCO Energy Services Company
FAF Fresh Air Fan
Fluo Fluorescent
GHG Green House Gases
Hal Halogen
HVAC Heating Ventilation Air Conditioning
IRR Internal Rate of Return
KV kilo Volt
KVA kilo Volt Ampere
KW Kilowatt
KWh Kilowatt-hour
LED Light Emitting Diode
M Meter
m2 Square meter
MDB Main Distribution Board
MH Metal Halide
ºC Degree Celsius
ºK Degree Kelvin
ºF Degree Fahrenheit
PF Power Factor
TR Transformer
UPS Uninterruptible Power Supply
V Volt
VAV Variable Air Volume
Page 9
USEK, Beirut- Energy Audit
ix Energy Audit prepared by EEG – Energy Efficiency Group | www.eegroup.info
VFD
Variable Frequency
Drive
W Watt
W m2/ ºK Watt Square meter per degree Kelvin
Conversion Factors
Multiply By To Obtain
Meter 3.2808399 Feet
Meter 39.370079 Inches
Kg 2.2046226 Pounds
Tons 1000 Kg
Liter 0.264179 Gallons (US beer)
Liter 0.035315 Cubic feet
kWh 3.6 MJ
kWh 3412 BTU
W/m2 0.317 BTU/ft2
kJ/kg K 0.2388 BTU/lb °F
W (heat flow rate) 3.412 BTU/h
W/m2k 0.1761 BTU/ft2 h °F
kJ/kg 0.4299 BTU/lb
MJ/m3 26.84 BTU/ft3
Mm Hg (mercury) 133.332 Pa
Ft of water 2.98898 kPa
m3/kg 16.02 ft3/lb
m/s 3.281 ft/s
Page 10
USEK, Beirut- Energy Audit
x Energy Audit prepared by EEG – Energy Efficiency Group | www.eegroup.info
Page 11
USEK, Beirut- Energy Audit
1 Energy Audit prepared by EEG – Energy Efficiency Group | www.eegroup.info
1. Introduction
Following an agreement with the UNDP/CEDRO contract # 14/125, Energy Efficiency Group (EEG)
has undertaken an energy audit for USEK, Kaslik.
The property includes 12 faculties, 4 institutes, administration offices and dorms spread over nine
buildings. USEK has an annual energy budget in excess of $535,806 including electricity and diesel for
generators.
The energy audit was carried out in October-December 2014 by a combination of a field in depth
survey and additional offices analysis; a close coordination and cooperation was made with the
administrative team in the building.
The report is divided in two sections: the first one provides the detailed analysis of the present energy
infrastructure including the energy accounting, load description and breakdown, and while the
second provides the development of the proposed EEMs (Energy Efficiency Measures) including their
technical analysis and financial feasibility.
1.1. Energy Audit procedure
The energy audit evaluates the efficiency of all buildings that use energy. The energy auditor starts at
the utility meters, locating all energy sources coming into a facility. The auditor then identifies energy
streams for each gas, quantifies those energy streams into discrete functions, evaluates the
efficiency of each of those functions, and identifies energy and cost savings opportunities.
An energy audit serves the purpose of identifying where a facility uses energy and identifies Energy
Efficiency Measures (EEM).
The goals of the energy audit are:
• To clearly identify the types and costs of energy use.
• To understand how the energy is being used – and possibly wasted.
• To identify and analyze various EEM alternatives such as improved operational techniques and/or
new equipment that could substantially reduce energy costs.
• To perform an economic analysis on those alternatives and determine which ones are cost
effective for the business or industry involved
The energy audit is done following the below set of tasks:
1. Gathering all historical databases from Energy Bills.
2. Gathering all facility layout, description, load data, operational hours.
3. Perform a full load inventory on all electrical loads from lighting to HVAC, motors, resistive
equipment…
4. Perform real time and historical measurement (Data logging) on all important electrical loads and
distribution panels.
5. Build an Energy Simulation of the facility using Energy Analysis software. This modeling will allow
us to have a detailed load and cost breakdown (Energy balance) along with an in depth study on
the
consumption of the facility.
6. Investigate potential Energy Efficiency Measures (EEMs) from the low cost/no cost ones to those
with low CAPEX and quick returns and then those with higher CAPEX and longer returns.
7. Develop the chosen EEMs with their impact on the energy consumption and related financials
8. Prepare a comprehensive report that would be divided into 3 main parts:
a) Detailed analysis of the present facility’s energy status including energy analysis, energy balance,
detailed systems description…
b) EEMs : Technical analysis, savings development, financial analysis
c) Appendices: Full load inventory list and any supporting technical documentation.
Page 12
USEK, Beirut- Energy Audit
2 Energy Audit prepared by EEG – Energy Efficiency Group | www.eegroup.info
2. USEK General description and information
2.1. Facility General description
The Holy Spirit University of Kaslik located near the bay of Jounieh, includes12 faculties and 4
institutes along nine blocks as listed hereafter:
• Building A: Office of the President; the Main Library; Pontifical Faculty of Theology; Institute of
History; Institute of Liturgy; Faculty of Music.
• Building B: Faculty of Law; Faculty of Letters; Faculty of Philosophy and Humanities.
• Building C: Faculty of Fine and Applied Arts.
• Building D: Faculty of Business.
• Building E: Faculty of Agriculture and Food sciences; Higher Institute of Political and
Administrative Sciences.
• Building F: Students Dorms.
• Building G: Administrative and Technical Units.
• Building H: Faculty of Engineering; Faculty of Medicine and Medical Sciences; Faculty of
Sciences; Higher Institute of Nursing Sciences.
• Building I: Sports center. This center is located in an underground floor next to the basket ball
court.
You will find here below the USEK campus layout map.
Figure 1: USEK Campus map
The facility has two entrances, the first gate passing through the oldest church of USEK and the
second gate leading to an open air parking along four basements where students, professors and
employees park their vehicles. Furthermore, there is an additional parking for students on the other
side of the road.
Building G is a standalone one located outside the campus with some rented floors. Finally, USEK
has one cafeteria located in between buildings E and C.
Page 13
USEK, Beirut- Energy Audit
3 Energy Audit prepared by EEG – Energy Efficiency Group | www.eegroup.info
2.2. Facility Building Envelope
Because of its history, USEK campus is characterized by building with very different architecture and
building envelopes. The main buildings of USEK which are blocks A and B feature a vernacular
architecture of the 1950s with an external stone cladding of 80cm thickness providing a good
insulation from outside temperature variations.
Buildings C, D, E and G have standard building envelope based on single wall with a related U-
value of 2.53W/m2.◦C, single glazing having a U-value of 6 W/m2.◦C, lacking all kinds of insulation
which increases potential heat gains.
As for the new constructed buildings H and F, a modern architecture is adopted with extensive use
of glass areas and skylights allowing substantial daylight which reduces the usage of artificial
lighting but raises also the cooling load.
Figure 2: Building envelope block A (Left); Skylights in block H (Middle); Single wall and single
glazing in block C (Right)
Page 14
USEK, Beirut- Energy Audit
4 Energy Audit prepared by EEG – Energy Efficiency Group | www.eegroup.info
Lebanon Key Climatic conditions
Climate conditions have the largest impact on energy consumption due to the related large
HVAC loads affected for cooling or heating.
Lebanon has a Mediterranean climate - hot and dry in summer (June to August), cool and rainy
in winter (December to February).
In summer humidity is very high along the coast and daytime temperatures average 30°C, with
night temperatures not much lower. Winter is mild, with daytime temperatures averaging 15°C.
In the mountains, summer days are moderately hot (26°C on average) and the nights cool.
Winters are cold, with snowfall above 1,300m.
In spring (March to May) and autumn (September to November) the climate is warm but not
uncomfortable.
You will find here below a graph depicting all the climate average trends in Lebanon.
• The average temperature in Beirut is 20.2°C
• The range of average monthly temperatures is 13°C.
• The warmest average max/ high temperature is 30°C in August.
• The coolest average min/ low temperature is 10 °C in January & February.
• Lebanon receives on average 601 mm of precipitation annually or 50 mm each month.
• The month with the driest weather is June, July & August when on balance 0 mm of rainfall
falls occurs.
• The month with the wettest weather is January when on balance 140 mm of rain, sleet, hail
or snow falls across 16 days.
• Mean relative humidity for an average year is recorded as 69.3% and on a monthly basis
it ranges from 66% in November to 73% in July & August.
• Hours of sunshine range between 4.2 hours per day in January and 11.6 hours per day in
July.
• On balance there are 2,940 sunshine hours annually and approximately 8.1 sunlight hours
for each day.
62%
64%
66%
68%
70%
72%
74%
0
5
10
15
20
25
30
35
40
Jan Feb Mar Apr May Jun Jul Aug Sep Oct Nov Dec
Rel
ativ
e H
umid
ity
Tem
per
atur
es/
Pre
cepet
atio
n/su
nlig
ht/
Beirut, Lebanon
Min Temp (deg C) Average Temp (deg C) Max Temp (deg C)
Average Sunlight Hours/Day Precepetation (cm) Relative Humidity (%)
Page 15
USEK, Beirut- Energy Audit
5 Energy Audit prepared by EEG – Energy Efficiency Group | www.eegroup.info
2.3. Electrical Energy: Sources and Distribution system
The local utility EDL is the only electricity supplier. In addition, there are six 1,000 KVA generators and
two 700KVA generators used as backup in case of power failure.
below is a table with the list of the key electrical distribution transformers and generators
along a single line diagram of the connections.
Table 1: Installed generators and transformers
Name Qty KVA
Standby Generator 400V/3Ø/50 HZ 6 1,000
Standby Generator 400V/3Ø/50 HZ 2 700
Step Down Transformer MDB 1,2&3 3 1,600
Step Down Transformer Block G 1 1,250
In addition to the above list, USEK has three capacitors out of service since two years. Furthermore,
a redundant UPS system is installed for the emergency lights and different emergency loads such as
data center and IT equipment.
Figure 3: ATS Panels (Left); Transformers (Middle); Main EDL feeder (Right)
The below single line diagram provides the electrical system distribution from the feeders and
generators to the MDBs.
Figure 4: Electrical network single line diagram
Page 16
USEK, Beirut- Energy Audit
6 Energy Audit prepared by EEG – Energy Efficiency Group | www.eegroup.info
2.4. Automation and Metering
USEK has two BMS (Building Management System) installed in Blocks H and F (the dorms). Both
systems are connected to the key MEP loads including lighting, ventilation, water pumping system,
domestic hot water, space cooling and space heating.
They provide an extensive monitoring tool along with control capabilities through time scheduling.
Another monitoring system - “CS-NET” - is installed in Block H and the library located in Block A
providing a basic status of the cooling units with no metering or automation.
Figure 5: Ventilation fans time schedule in Block F
Figure 6: VRF BMS snapshot in Block F
Page 17
USEK, Beirut- Energy Audit
7 Energy Audit prepared by EEG – Energy Efficiency Group | www.eegroup.info
Figure 7: CS-NET snapshot in Block H providing the status of each (indoor/outdoor) cooling unit
2.5. Thermal Energy: Sources and Distribution system
Thermal energy is divided in two categories: cooling and heating.
1. Cooling Energy: USEK uses for its cooling purposes a mix of chilled water system, VRF system and
split units. There are three McQuay air cooled chillers servicing partially Block H while VRF system
covers the remaining parts of this building and the dorms. The rest of the facility is serviced by
split/DX units.
2. Heating Energy: The demand for heating energy in USEK is characterized by space heating
during the winter season covered by the various VRF/Split and DX units . As for the domestic hot
water demand, it is provided in the dorms and the restaurant via a solar thermal system .
Moreover, two diesel driven hot water boilers are installed in the hot water loop of the dorms to
assist the solar thermal system when water temperature drops to below 60°C .
2.6. Annual Energy Consumption
USEK has only one main energy source which is electricity (EDL + Generators). The total energy
budget over one year extended from September 2013 till August 2014 is found in the below table.
Table 2: USEK Annual Electrcity Consumption
Unit Consumption Cost
EDL KWh 3,054,657 $309,332
Generators KWh 1,258,197 $226,475
Total 4,312,854 $535,807
*No data was provided for the boilers’ diesel consumption.
Page 18
USEK, Beirut- Energy Audit
8 Energy Audit prepared by EEG – Energy Efficiency Group | www.eegroup.info
3. USEK Energy Sources
3.1. Electrical Energy
3.1.2 Introduction
The first step of the electrical energy analysis is to gather all real consumption data and aggregate
them in order to find the total electrical energy consumption. As previously mentioned, USEK has two
sources for electricity, the EDL electric source and the generators in case of a power failure.
The meter’s monthly EDL bills were gathered from January 2013 till December 2013, thus providing a
detailed consumption of the facility.
3.1.2 EDL Electrical Energy Analysis and Cost
EDL energy consumption is found in the below table covering the 12 months running from January
2013 till December 2013. It has to be noted that the EDL feeds the USEK through two main
transformers: EDL1 based on the industrial tariff and the EDL2 based on the residential tariff having a
set of residential meters along the facility. The total energy consumption is found to be 3,054,657
KWh with a related cost of $309,332 annually. These twelve months were chosen to be used as an
energy baseline for USEK.
Table 3: Monthly EDL consumption and cost for USEK
EDL1: Industrial Tariff EDL2: Residential Tariff Total EDL
Month KWh Cost KWh Cost KWh Cost
Jan-13 147,528 $14,753 5,355 $696 152,883 $15,449
Feb-13 207,701 $20,770 4,381 $570 212,082 $21,340
Mar-13 243,070 $24,307 9,632 $1,252 252,702 $25,559
Apr-13 212,877 $21,288 9,632 $1,252 222,509 $22,540
May-13 292,618 $29,262 9,191 $1,195 301,809 $30,457
Jun-13 224,040 $22,404 9,545 $1,241 233,585 $23,645
Jul-13 279,814 $27,981 14,205 $1,847 294,019 $29,828
Aug-13 318,744 $31,874 14,782 $1,922 333,526 $33,796
Sep-13 335,236 $33,524 12,641 $1,643 347,877 $35,167
Oct-13 297,801 $29,780 13,150 $1,710 310,951 $31,490
Nov-13 192,377 $19,238 13,845 $1,800 206,222 $21,038
Dec-13 173,978 $17,398 12,514 $1,627 186,492 $19,025
Annual 2,925,784 $292,578 128,873 $16,753 3,054,657 $309,332
Page 19
USEK, Beirut- Energy Audit
9 Energy Audit prepared by EEG – Energy Efficiency Group | www.eegroup.info
Figure 8: EDL energy consumption and cost-USEK
3.1.3 Generators' Electrical Analysis
USEK has six generators having each 1,000KVA capacity and two generators with a 700 KVA rating
each. They work during the EDL cut-off period only.
Considering the monthly diesel bills given for USEK, the energy consumption was calculated based
on a rate of 0.163Liters/KWh. Results are found in the below table.
Table 4: Generators' Electrical energy consumption and cost over one year
Month Liters KWh Cost Total
$/KWh
Jan-12 8,907 54,642 $9,836 $0.18
Feb-12 8,713 53,455 $9,622 $0.18
Mar-12 9,584 58,797 $10,583 $0.18
Apr-12 12,433 76,274 $13,729 $0.18
May-12 18,880 115,830 $20,849 $0.18
Jun-12 17,677 108,451 $19,521 $0.18
Jul-12 41,928 257,224 $46,300 $0.18
Aug-12 41,923 257,198 $46,296 $0.18
Sep-12 18,874 115,794 $20,843 $0.18
Oct-12 9,583 58,789 $10,582 $0.18
Nov-12 9,573 58,732 $10,572 $0.18
Dec-12 7,011 43,011 $7,742 $0.18
Annual 205,086 1,258,197 $226,475 $0.18
$0
$5,000
$10,000
$15,000
$20,000
$25,000
$30,000
$35,000
$40,000
0
50,000
100,000
150,000
200,000
250,000
300,000
350,000
400,000
KW
h
EDL1 Consumption EDL2 Consumption Total EDL Cost
Page 20
USEK, Beirut- Energy Audit
10 Energy Audit prepared by EEG – Energy Efficiency Group | www.eegroup.info
Figure 9: Generators' monthly electrical energy consumption and diesel consumption
3.1.4 Electrical Energy Baseline
Combining the total energy consumption (KWh) drawn from both the EDL feeders and the
generators would lead to the electrical energy baseline of USEK which is found in the below table.
The total annual electricity cost is seen to be the $535,807.
Table 5: Monthly Electrical Energy consumption and cost over one year for USEK
Total EDL Generators Total
Month KWh Cost KWh Cost KWh Cost Total $/KWh
Jan-13 152,883 $15,449 54,642 $9,836 207,525 $25,285 0.122
Feb-13 212,082 $21,340 53,455 $9,622 265,537 $30,961 0.117
Mar-13 252,702 $25,559 58,797 $10,583 311,499 $36,143 0.116
Apr-13 222,509 $22,540 76,274 $13,729 298,783 $36,269 0.121
May-13 301,809 $30,457 115,830 $20,849 417,639 $51,306 0.123
Jun-13 233,585 $23,645 108,451 $19,521 342,036 $43,166 0.126
Jul-13 294,019 $29,828 257,224 $46,300 551,243 $76,128 0.138
Aug-13 333,526 $33,796 257,198 $46,296 590,724 $80,092 0.136
Sep-13 347,877 $35,167 115,794 $20,843 463,671 $56,010 0.121
Oct-13 310,951 $31,490 58,789 $10,582 369,740 $42,072 0.114
Nov-13 206,222 $21,038 58,732 $10,572 264,954 $31,609 0.119
Dec-13 186,492 $19,025 43,011 $7,742 229,503 $26,767 0.117
Annual 3,054,657 $309,332 1,258,197 $226,475 4,312,854 $535,807 0.122
05,00010,00015,00020,00025,00030,00035,00040,00045,000
0
50,000
100,000
150,000
200,000
250,000
300,000
Lite
rs
KW
h
Energy Consumption Generators diesel consumption
Page 21
USEK, Beirut- Energy Audit
11 Energy Audit prepared by EEG – Energy Efficiency Group | www.eegroup.info
Figure 10: Monthly Total Electrical Energy Profil for USEK
3.1.5 Correlation between Electrical Energy and Weather
An important step in the energy analysis is to understand the relationships between the various
parameters affecting the energy consumption and the total energy used. Accordingly, the main
parameter weighing on a facility’s energy consumption is the climatic conditions (in this case
cooling and heating Degree Day). You will find here below two charts showing the relation of the
electricity consumption to the cooling and heating demands.
They clearly show that the Cooling Degree Days have a direct – and large impact on the energy
consumption due to the high cooling load.
Figure 11: Monthly Electricity Consumption and Degree Days
0
200,000
400,000
600,000K
Wh
Generators Consumption EDL Consumption Total Consumption
0
20
40
60
80
100
120
140
160
0
50,000
100,000
150,000
200,000
250,000
300,000
350,000
400,000
450,000
Jan
-12
Feb
-12
Mar
-12
Ap
r-1
2
May
-12
Jun
-12
Jul-
12
Au
g-1
2
Sep
-12
Oct
-12
No
v-1
2
Dec
-12
HD
D
KW
h
Total Electricity Consumption Heating Degree Day
0
100
200
300
400
500
600
0
50,000
100,000
150,000
200,000
250,000
300,000
350,000
400,000
450,000
Jan
-12
Feb
-12
Mar
-12
Ap
r-1
2
May
-12
Jun
-12
Jul-
12
Au
g-1
2
Sep
-12
Oct
-12
No
v-1
2
Dec
-12
CD
D
KW
h
Total Electricity Consumption Cooling Degree Day
Page 22
USEK, Beirut- Energy Audit
12 Energy Audit prepared by EEG – Energy Efficiency Group | www.eegroup.info
3.2. Thermal Energy
Thermal energy in USEK includes the hot water and space heating demands.
For space heating, the facility relies on the installed DX/split units and the VRF units without the use
of any diesel/gas driven boilers.
As for the hot water demand, it is only found in the dorms building and the restaurant. In both cases
solar thermal systems are installed on the roof of each building to supply hot water throughout the
year.
In the dorms there are two diesel driven boilers installed in the basement each with 250,000Kcal/hr
capacity and supposed to be used for space heating as per the mechanical design. At the present
time, space heating is afforded by the VRF system and hot water demand is provided by the solar
thermal system installed. The boilers are linked to the solar system and they are used to raise the
water temperature to 60◦C if needed.
Figure 12: De Dietrich diesel boilers (Left); Solar Panels for the restaurant (Right)
Page 23
USEK, Beirut- Energy Audit
13 Energy Audit prepared by EEG – Energy Efficiency Group | www.eegroup.info
4. USEK Electrical Load Analysis
4.1. Introduction
One key milestone in an energy audit is to perform the comprehensive load inventory for all
electrical end uses, then carefully workout the entire operational schedule and load factors of
each load in order to have a micro and macro energy consumption analysis and to find the
energy balance.
Information and Database process
All the load inventory data (lighting, cooling, motors…) of the facility was entered in an Energy
Analysis Software; every item is entered with full details of actual electrical specification (KW) and
detailed operational schedule (hours per day, week, month…) in order to perform a total
simulation and energy modeling of the facility. This includes a full one year simulation on the energy
usage per category.
In the present report the entire electrical and mechanical loads were divided in the following
categories:
• Lighting: All internal and external lighting systems.
• Cooling: A/C split units, VRF and chilled water plant including chillers and related pumps.
• HVAC Fans: All heating, cooling and ventilation fans.
• Motors/Pumps: Lifts, service pumps…
• IT Equipment: IT equipment: servers, computers, routers…
• Miscellaneous: All other equipment like kitchen equipment and resistive loads.
4.2. Load Inventory
The entire electrical inventory was divided in two categories; Lighting and equipment.
All the existing equipment in the facility as well as all lighting fixtures are listed in tables found in
Appendix A, a sample of the two tables is shown below.
Annual KWh of every equipment or load has been listed according to the detailed operational
schedules used and the full reconciliation of the USEK’s total electrical energy consumption as
found in the energy baseline.
Table 6: Lighting Inventory-Sample
Type Location No. of
Fixtures
Lamp
Wattage
(W)
Ballast
Wattage
(W)
Installed
Wattage
(W)
Total
Installed
Wattage
(KW)
Annual
Energy
Use
(KWh)
Block A
Panel 36W GF-orientation office 24 36 0 36 0.864 1,820
Hal 70W GF-orientation office 33 70 0 70 2.31 4,865
Fluo T8 4x18W GF-B.A.E.S 23 72 12 84 1.932 4,069
Fluo T8 2x36W GF-B.A.E.S 6 72 12 84 0.504 1,062
Hal 70W GF-registration 52 70 0 70 3.64 7,667
Fluo T8 2x58W GF-registration 17 116 16 132 2.244 4,726
PL 2x26W GF-registration 3 52 0 52 0.156 329
Economy 2x23W GF-offices& common areas 50 46 0 46 2.3 4,844
Page 24
USEK, Beirut- Energy Audit
14 Energy Audit prepared by EEG – Energy Efficiency Group | www.eegroup.info
Table 7: Equipment Inventory-Sample
Name Location No. of
Units
Input
Capacity
(KW)
Total
Capacity
(KW)
Annual
Energy
Use
(KWh)
Elevator Block A-Music 1 11 11 28,398
Elevator Block A-Library 1 11 11 28,398
Elevator Block A-Library 1 7.5 7.5 17,443
Hot water pump Block A-Boiler 1 0.5 0.5 1,084
Pressure pumps Block A 2 1.3 2.6 2,368
4.3. Lighting System Description
Lighting system in USEK consists of a large number of fixture and bulb types. This is mainly due to the
various phases of constructions of the campus. Accordingly, a heteroclite usage of Halogen type
fixtures, CFL ones, Linear T8 fluorescent and HID for external lights is noticed. Lately, the facility
management initiated the usage of LED in block H. The campus has been also looking for a campus
wide Led retrofit which has been developed in one of the Energy Efficiency Measures in the present
report. here after is a set of picture depicting the variety of lighting systems in the campus.
Figure 13: 2D 36W in block E (Left); PL 58W in offices (Middle); Linear fluorescent T8 in the Library (Right)
Figure 14: LED lighting fixtures in basement 3-Block H
Figure 15: External Lighting fixtures
Page 25
USEK, Beirut- Energy Audit
15 Energy Audit prepared by EEG – Energy Efficiency Group | www.eegroup.info
The below table provides the lighting BOQ of USEK. The total lighting load installed is found to be
532KW. Taking into consideration the schedule of work in the various areas, the lighting system was
found to have an annual energy consumption of 1,246,756KWh.
Table 8: USEK-Lighting BOQ
USEK Lighting BOQ
Type Number Total
KW
Annual
Energy
Use
(KWh)
Linear Fluorescent Type
Fluo T8 18W 141 3.384 4,841
Fluo T8 36W 338 14.196 24,743
Fluo T8 2x18W 9 0.378 1,228
Fluo T8 3x18W 12 0.768 83
Fluo T8 4x18W 683 57.372 140,855
Fluo T8 2x36W 378 31.752 96,452
Fluo T8 4x36W 108 17.28 49,098
Fluo T8 2x58W 296 39.072 79,100
Fluo T5 28W 1,981 55.468 156,326
Halogen
Hal 50W 216 10.8 5,116
Hal 70W 1,135 79.45 107,280
Hal 150W 2 0.3 66
Hal 2x300W 78 46.8 174,396
Compact Fluorescent
PL 26W 416 10.816 16,492
PL 2x26W 1,192 61.984 136,875
Panel 36W 120 4.32 10,264
PL 58W 654 36.943 48,557
E27 23W 119 2.737 2,578
2D 36W 78 2.808 8,074
Economy 2x23W 200 9.2 21,217
Economy 30W 3 0.09 283
Economy 36W 29 1.044 2,689
Economy 2x36W 108 7.776 39,427
Metal Halide
MH 400W 42 16.8 63,809
Pressure Sodium
PS 250W 40 10 39,000
Incandescent
Inc 100W 34 3.4 6,766
LED
Projector LED 100W 10 1 628
LED T8 16W 299 4.784 6,061
LED 20W 12 0.24 68
LED 100W 8 0.8 1,571
Other
F4-T8 2x36W +2xspot 50W 4 0.736 1,737
Spot 12W 38 0.456 1,076
Total 531.76 1,246,756
Page 26
USEK, Beirut- Energy Audit
16 Energy Audit prepared by EEG – Energy Efficiency Group | www.eegroup.info
4.4. Cooling System Description
Cooling system presents the most critical energy end use in USEK since it combines the classical
cooling system by using the DX/split units and the new technologies with the VRF and the air cooled
chillers. Their distribution and location can be found as listed below:
➢ VRF (Variable Refrigerant Volume): Servicing the dorms (building F), the new constructed
zone of building H, the church and the library in building A.
➢ Air Cooled Chillers: Servicing class rooms and offices of building H that are not cooled with
the VRF, in addition to the new constructed conference rooms in basement 3 of the same
building.
➢ DX/Split units: Provides cooling through all the facility excluding the zones listed above.
4.4.1. DX/Split Units
Split units or direct expansion units (DX) are the traditional air conditioning concept. This system
dominates in USEK and various sizes were inventoried through the facility aging between 3 years to
more than 10 years in some areas.
Figure 16: Outdoor units (Left); Indoor units (Right)
Table 9: Split units Inventory-Sample
Name Location
No.
of
Units
Input
Capacity
(KW)
Total
Capacity
(KW)
Annual
Energy
Use
(KWh)
AC 3Tons Music 8 3.9 31.2 47,673
AC 18000Btu Music 8 1.9 15.2 23,972
AC 24000Btu Music 38 2.6 98.8 151,742
AC 12000Btu Music 62 1.3 80.6 123,790
AC 28000Btu Music 14 3 42 62,681
If we go deep in the cooling capacities installed with their related energy consumption, the DX/split
units are seen to have 68% of the total cooling energy consumption with around 1,740,778KWh per
year.
Page 27
USEK, Beirut- Energy Audit
17 Energy Audit prepared by EEG – Energy Efficiency Group | www.eegroup.info
4.4.2. Air Cooled Chillers
USEK has three similar McQuay air cooled chillers model “McSmart 500CR” located on the roof of
block H. Chilled water circulation is provided through 4 primary pumps. The system operation is
based on two main networks that are described in the below table.
Table 10: Chilled water networks description
Serviced Area
Number
of
Chillers
Number of
primary
pumps
Periods of
Operation
Network 1 New constructed classes and
offices in block H 1 2 May till September
Network 2
six conference rooms with
their lobby in basement 3-
block H
2 2 Occasionally
Concerning the chillers, a technical data sheet is displayed here after.
Figure 17: Technical data sheet for the chillers of USEK
Figure 18: Chillers on the roof of Block H (Left); Primary chilled water pumps (Right)
It is to be noted that the chilled water system has an “operation panel” providing many features
and settings according to various parameters such as time schedule, cooling/heating temperature
settings, the status of each compressor…. Besides, many alarms can be set by the operator to meet
Page 28
USEK, Beirut- Energy Audit
18 Energy Audit prepared by EEG – Energy Efficiency Group | www.eegroup.info
the desired sequencing and control. However, this automation system is in a passive status for the
time and is solely used for manual control and for checking any alarm 3 times per day.
Figure 19: Operation panel (Left); Chilled water temperature settings (Middle); Operation Mode (Right)
You will find below the list of the chilled water plant components installed with the rated annual
energy use. The chilled water pumps are of the primary only type and do not have any VFD.
Table 11: List of Chillers along their chilled water pumps
Name Description No. of
Units
Input
Capacity
(KW)
Total
Capacity
(KW)
Annual
Energy
Use
(KWh)
Chiller1 Classes 1 50.7 50.7 44,434
Chillers2-3 Conference rooms in
B3 2 50.7 101.4 79,091
Chilled water
pumps Network 1 2 5.5 11 2,450
Chilled water
pumps Network 2 2 2.2 4.4 2,130
Total 167.5 128,104
4.4.3. VRF System
On the top of the chilled water system and split/DX cooling units, USEK has been investing in VRF in
its two buildings H and F. They provide both space cooling during summer and space heating
during winter.
Figure 20: VRF Outdoor units for the Library with dehumidifier inside (Left); VRF O.U. for the Students
Library (Middle); Thermostats for the church (Right)
Hereafter is a sample of the inventoried VRF indoor/outdoor units. The total installed capacity is
483KW with a related annual energy consumption of 695,592KWh.
Page 29
USEK, Beirut- Energy Audit
19 Energy Audit prepared by EEG – Energy Efficiency Group | www.eegroup.info
Table 12: VRF units Inventory-Sample
Name Description No. of
Units
Input
Capacity
(KW)
Total
Capacity
(KW)
Annual
Energy
Use
(KWh)
O.U.1 VRF-Faculty of Sciences 3 1.4 4.2 3,075
O.U.2 VRF-Faculty of Sciences 2 3.2 6.4 4,587
O.U.3 VRF-Faculty of Sciences 4 3.2 12.8 9,059
O.U.4 VRF-Faculty of Sciences 9 7 63 45,152
O.U.5 VRF-Faculty of Sciences 3 15.3 45.9 32,789
The installed BMS in block F (Faculty of Sciences) enables a specified schedule to be fixed for the
VRF in terms of operational hours and mode of operation (cooling/heating). This situation is almost
the same for the dorms-block F- with an individual control for the indoor units in each room.
In addition, there are seven VRF outdoor units that cover the church’s cooling where a fixed
schedule is maintained all over the year.
Other areas in USEK depend also on VRF system such as the main library, Phoenix center, E zone and
the related archive where specific conditions must be maintained. For that reason, three outdoor
units each with 10tons cooling capacity and two other units each with 5tons cooling capacity are
installed, providing good conditions for books storage.
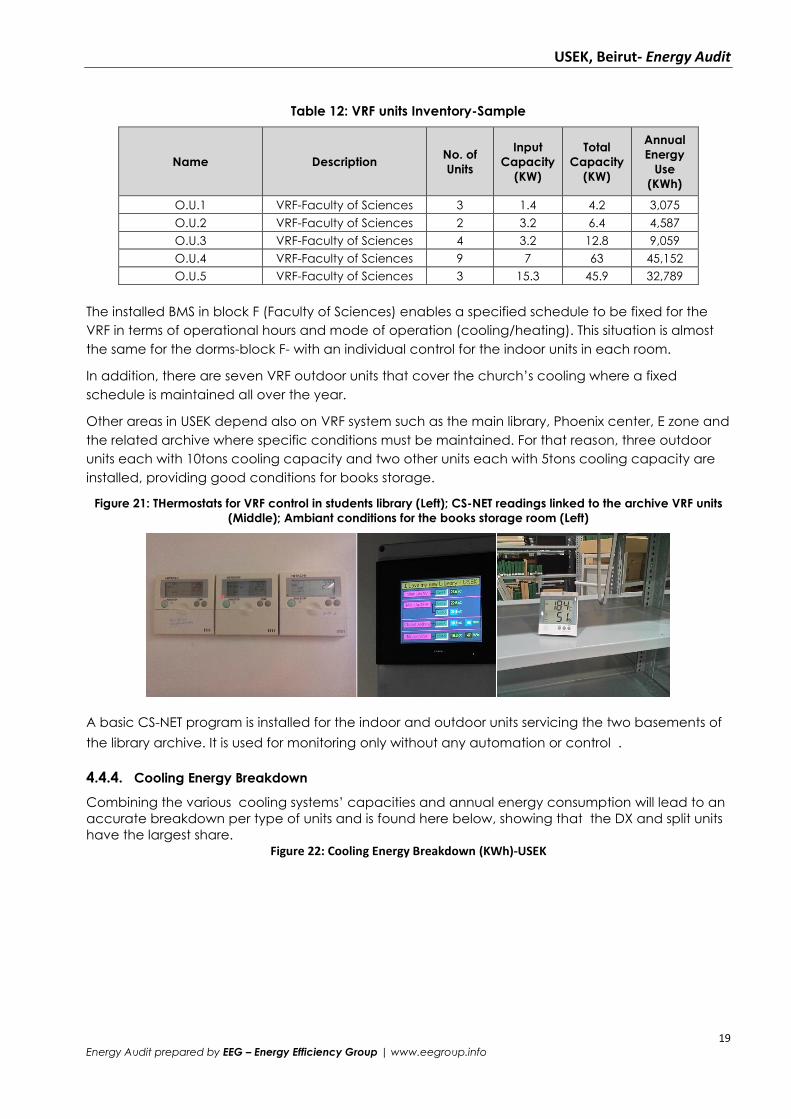
Figure 21: THermostats for VRF control in students library (Left); CS-NET readings linked to the archive VRF units
(Middle); Ambiant conditions for the books storage room (Left)
A basic CS-NET program is installed for the indoor and outdoor units servicing the two basements of
the library archive. It is used for monitoring only without any automation or control .
4.4.4. Cooling Energy Breakdown
Combining the various cooling systems’ capacities and annual energy consumption will lead to an
accurate breakdown per type of units and is found here below, showing that the DX and split units
have the largest share. Figure 22: Cooling Energy Breakdown (KWh)-USEK
Page 30
USEK, Beirut- Energy Audit
20 Energy Audit prepared by EEG – Energy Efficiency Group | www.eegroup.info
4.5. HVAC Fans
HVAC fans are the center systems for a good Indoor Air Quality as they ensure the proper
temperature; humidity and fresh air are attained while extracting smokes and odors. The facility has
a large number of HVAC fans that fall under the below categories:
- Fan Coil Units (FCU): serving areas supplied by the chillers.
- VRF indoor units: serving areas supplied by the VRF and found in the server room.
- Exhaust Fans: they are mostly used to extract air from kitchens, parking and
laboratories. Extractor fans in basements operate on CO sensors.
- Fresh Fans: they are mostly used to produce fresh air inside the parking.
Figure 23: Exhaust Fans in Block E (Left); Exhaust Fans in Block F (Right)
The below table provides a sample of the HVAC fans inventory installed in the facility along the
related annual energy consumption as compiled in the energy analysis software and re-conciliated
with the energy baseline. The total annual energy consumption was found to be 34,917KWh with an
installed power of 55KW.
Table 13: HVAC fans Inventory-Sample
Name Location
No.
of
Units
Input
Capacity
(KW)
Total
Capacity
(KW)
Annual
Energy
Use
(KWh)
EF-B5 Block H-SS1 -4000cfm- 1 1.6 1.6 1,291
EF-B5 Block H-SS1-3000cfm- 2 1.2 2.4 1,940
FAF-B5- Block H-SS2-4000cfm- 2 1.6 3.1 2,581
EF-B4 Block H-SS1 -4000cfm- 1 1.6 1.6 1,291
EF-B4- Block H-SS1-3000cfm- 2 1.2 2.4 1,940
1,740,778
68%
695,592
27%
128,104
5% DX/Split
VRV
Chillers
Page 31
USEK, Beirut- Energy Audit
21 Energy Audit prepared by EEG – Energy Efficiency Group | www.eegroup.info
FAF-B4- Block H-SS2-4000cfm- 2 1.6 3.1 2,581
Page 32
USEK, Beirut- Energy Audit
22 Energy Audit prepared by EEG – Energy Efficiency Group | www.eegroup.info
4.6. Pumps and Motors
In addition to the chilled water pumps, USEK has a series of pumps for various end uses such as
domestic water pumps, hot water circulators, fire fighting pumps...They are all operational on a time
or demand based ways. In addition, USEK has a number of motors for various end uses such as
elevators.
The below table provides a sample on the motors inventory. The total annual energy consumption is
found to be 260,392KWh with an installed power of about 173KW.
Table 14: Motors sample inventory-USEK
Name Location No. of
Units
Input
Capacity
(KW)
Total
Capacity
(KW)
Annual
Energy
Use
(KWh)
Elevator Block A-Music 1 11 11 22,802
Elevator Block A-Library 1 11 11 22,802
Elevator Block A-Library 1 7.5 7.5 14,006
Hot water pump Block A-boiler 1 0.5 0.5 870
Pressure pump Block A-water treatment 2 1.3 2.6 1,901
Circulating pump Block A-water treatment 2 0.3 0.6 156
Figure 24: Lifting pumps (Left); Hot water circulating pumps (Middle); Potable water pumps (Right)
4.7. IT Equipment
The total IT assets that include the data centre, laptops, desktops, routers and all other IT auxiliary
equipment have been estimated. Two main UPS are implemented for the servers with 34KVA capacity
each. For the remaining IT loads, several UPS are spread throughout the facility, with different
capacities ranging from 30KVA to 60KVA. The installed power and annual energy consumption are
found in the below table.
Table 15: IT equipment inventory-USEK
Name Location
No.
of
Units
Input
Capacity
(KW)
Total
Capacity
(KW)
Annual
Energy
Use
(KWh)
PCs Administration 300 0.06 18 28,665
PCs Laboratories 440 0.06 26.4 5,787
Server USEK 1 10 10 30,301
Total 54.4 64,753
Page 33
USEK, Beirut- Energy Audit
23 Energy Audit prepared by EEG – Energy Efficiency Group | www.eegroup.info
Figure 25: UPS for servers (Left); Server room (Right)
4.8. Miscellaneous Loads
Equipment that do not fall in the above categories, are classified as miscellaneous loads. The
Miscellaneous loads inventory along with their individual annual energy consumption is shown below.
Table 16: Miscellaneous loads inventoy-USEK
Name Location No. of
Units
Input
Capacity
(KW)
Total
Capacity
(KW)
Annual
Energy
Use (KWh)
Freezer Block C 1 7 7 15,942
Washer Block F-SS1 4 4 16 20,166
Dryer Block F-SS1 2 4.5 9 11,344
Iron Block F-SS1 3 1.5 4.5 2,158
Freezer Block H-Lab 1 7 7 15,942
Buggies USEK 7 5 35 47,950
Lab equipment Block H 1 10 10 7,056
kitchen equip Cafeteria 1 10 10 19,180
TV Dorms 50 0.2 10 1,825
Total 108.5 141,562
Figure 26: Washers and dryers (Left); Buggies (Right)
Page 34
USEK, Beirut- Energy Audit
24 Energy Audit prepared by EEG – Energy Efficiency Group | www.eegroup.info
4.9. Electrical Energy Balance (Load and Cost/Consumption Breakdown)
Compiling all the data from the load inventory and the energy analysis would yield to USEK’s
energy balance which provides the breakdown of the power installed, energy consumed and
energy costs.
• Electrical Load Breakdown: Giving the total installed electrical power (KW) along with the
percentage share of each category. The total installed load in USEK exceeds the 2,903KW.
• Energy Consumption and Cost Breakdown: Giving the total energy consumption (KWh) and
cost along the percentages for each category. Electric bills are not itemized and give no
indication how much one spends each month to light his facility, operate motors etc. The
macro and micro analysis as done in the energy analysis software enables a comprehensive
breakdown per individual end use or per category.
The below table provides the load and cost breakdown in USEK while the following figure
depicts the pie chart for both parameters.
Table 17: Electrical load breakdown (Left); Energy Cost Breakdown (Right)
Category KW Percentage
KWh Cost Percentage
Lighting 532 18% 1,246,756 $122,444 29%
Cooling 1,979 68% 2,564,474 $335,348 59%
HVAC 55 2% 34,917 $6,365 1%
IT 54 2% 64,753 $10,161 2%
Motors 173 6% 260,392 $40,670 6%
Miscellaneous 109 4% 141,562 $20,820 3%
Total 2,903 100% 4,312,854 $535,807 100%
Figure 27: Facility Load Breakdown (Left); Facility Energy Breakdown (Right)
It is seen that the cooling loads are the largest energy consumers with about 59% of the total while
they represent 68% of the installed power. Lighting loads come second with a total of 29% of the total
energy consumption followed by motors loads.
Lighting18%
Cooling68%
HVAC 2%
IT 2%
Motors6%
Auxiliary4% Lighting
29%
Cooling59%
HVAC1%
IT2% Motors
6%
Auxiliary3%
Page 35
USEK, Beirut- Energy Audit
25 Energy Audit prepared by EEG – Energy Efficiency Group | www.eegroup.info
Energy Breakdown per Building
One important energy breakdown is the one related to the various buildings /Blocks in USEK. below
are the two pie charts whereby clearly Block A has the largest energy consumption and loads
followed by Blocks B and F (dorms) .
Figure 28: Load breakdown per Block (Left) ; Energy Consumed per Block (Right)
Bloc A20%
Bloc B14%
Bloc C7%
Bloc D8%
Bloc E10%
Bloc F9%
Bloc G3%
Bloc H26%
Bloc I1%
External2%
Bloc A24%
Bloc B16%
Bloc C8%
Bloc D6%
Bloc E6%
Bloc F18%
Bloc G4%
Bloc H15%
Bloc I1%
External3%
Page 36
USEK, Beirut- Energy Audit
26 Energy Audit prepared by EEG – Energy Efficiency Group | www.eegroup.info
4.10. Indoor Air Quality-USEK Present Situation
Indoor air quality (IAQ) focuses on airborne contaminants including thermal comfort quality and air
quality, covering therefore temperature, humidity, CO2, CO and VOC (Volatile Organic Compounds)
levels.
When it comes to standards, the main guidelines refer to standards promulgated by the American
Society of Heating, Refrigerating and Air-conditioning Engineers Inc. (ASHRAE). These are found in the
ASHRAE documents Ventilation for Acceptable Indoor Air Quality (ASHRAE 62-2001) and Thermal
Environmental Conditions for Human Occupancy (ASHRAE 55-2004).
Humidity and Temperature
There is no “ideal” humidity level and temperature suitable for all building occupants. Many factors,
such as personal activity and clothing may affect personal comfort. Acceptable relative humidity
levels should range from 20 percent – 65 percent year-round. Levels less than 20 percent in the winter
and greater than 65 percent in the summer should be considered off the standards. Elevated relative
humidity can promote the growth of mold, bacteria, and dust mites, which can aggravate allergies
and asthma. To achieve maximum occupant comfort, relative humidity should be maintained
between 30 % – 65 % .
In order to showcase the situation, we have installed data loggers in various areas of the facility and
the results are shown here after.
two sets of graphs are shown, each with clear indication on the targeted location. The graphs include
the plotting of both the temperature and relative humidity on the basis of a logging done every 5
minutes.
a)
The graph above shows the conditions measured in building H basement 2 where laboratories and
some offices are located. We can note that temperature revolves around 24 degrees while
humidity varies from 45% to 65%. During holidays temperature drops to 20degrees and humidity
reaches 55%.
Page 37
USEK, Beirut- Energy Audit
27 Energy Audit prepared by EEG – Energy Efficiency Group | www.eegroup.info
b)
The second graph depicts the temperature and relative humidity in the student library where high
temperatures and humidity are recorded. A peak of 26 degrees in September is measured in the
library with a relative humidity exceeding 60%. An improvement for the ventilation system operation
must be done in order to ensure better comfort conditions for students.
It has to be noted that a CO2 measurement was undertaken in some of the enclosed areas of USEK
and results were at the limit in the cafeteria with an average of 1,000ppm and in the basements of
block H while in the main library in block AB, this level exceeds 1,320ppm which requires an
improvement in the ventilation system and air circulation in order to upgrade the comfort conditions
for the students.
Figure 29: CO2 level and temperature measured in library block AB-Main Library
Page 38
USEK, Beirut- Energy Audit
28 Energy Audit prepared by EEG – Energy Efficiency Group | www.eegroup.info
5. Energy Efficiency Measures
Energy budgets represent one of the highest cost centers in a facility operation. On the other hand,
in their aim for greening their operations, buildings today are also investing in energy efficiency as
energy is by far the largest contributor to their CO2 emissions.
Energy efficiency is a continuous development program that includes a comprehensive look and
optimization at every aspect of the facility and at all levels of operations, loads and systems.
Taking the present situation of USEK as a baseline, we have investigated a large number of energy
efficiency solutions which could yield to substantial cost optimization. Every opportunity is called an
Energy Efficiency Measure (EEM). Our basis for this analysis is to develop a robust, fiscally disciplined
program targeting energy efficiency and conservation investments across the campus with the
emphasis on measures that will have a substantial impact on energy consumption and greenhouse
gas emissions while at the same time offering positive economic return.
The various EEMs modules are divided as follows:
1. EEM1: Low Cost/No Cost Energy Efficiency Measures
1.1. Hot water pipes insulation
1.2. Thermal losses reduction
1.3. Chilled water temperature reset
1.4. Re-Commissioning of all electrical systems in USEK
1.5. Employee Engagement
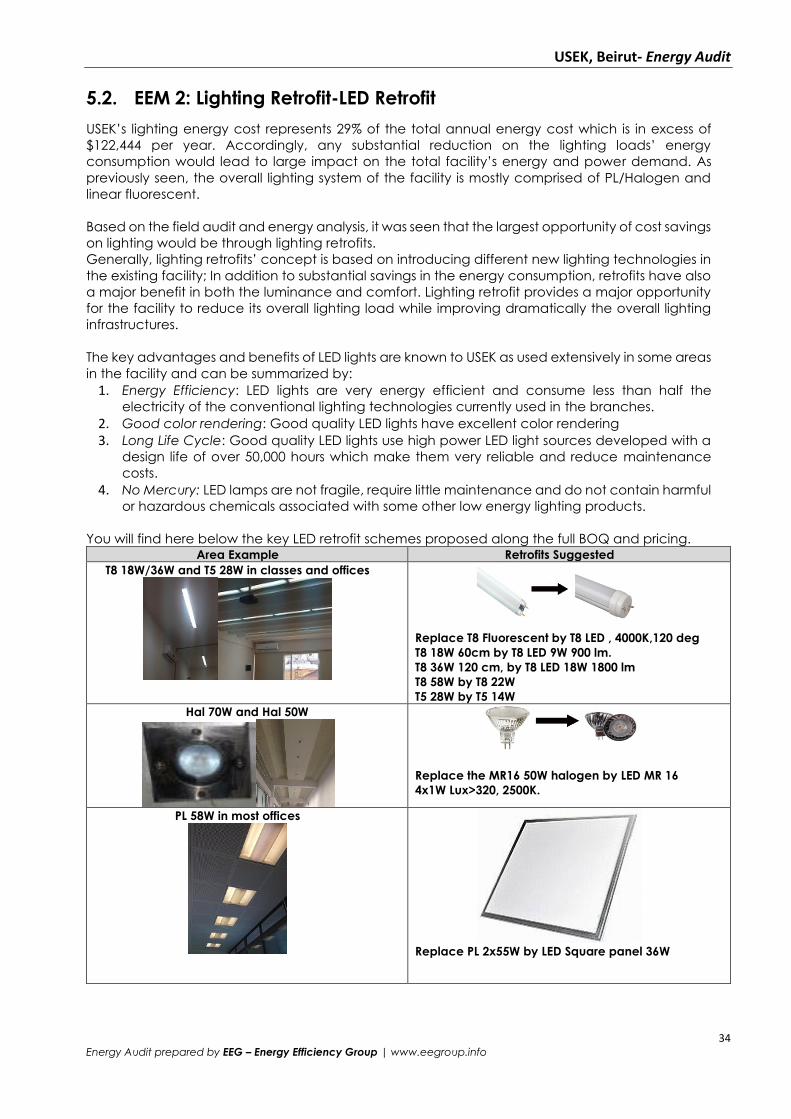
2. EEM 2: Lighting Retrofit-LED Retrofit
3. EEM 3: Occupancy sensor for lighting and cooling systems
4. EEM 4: Retrofit Split Units with DC Inverter technology
5. EEM 5: VRF Retrofit for the DX units in USEK (“What IF” Scenario)
6. EEM 6: Waste Heat Recovery
7. EEM 7: Roof Insulation-Green Roof
8. EEM 8: BMS System Upgrade and Extension
The following sections develop every measure recommended for the facility with the technical
background and financial feasibility.
Page 39
USEK, Beirut- Energy Audit
29 Energy Audit prepared by EEG – Energy Efficiency Group | www.eegroup.info
5.1. EEM 1: Low Cost/ No Cost Energy Efficiency Measures
USEK has the opportunity to have important cost savings from virtually very little or no CAPEX at all.
Those measures are called “Low Cost / No Cost EEMs”.
The flexibility of operation along with a proactive operator approach is of a prime importance in
the implementation of those measures. Ultimately, every small action can count in the bottom
line and this should be the mindset throughout all departments of USEK.
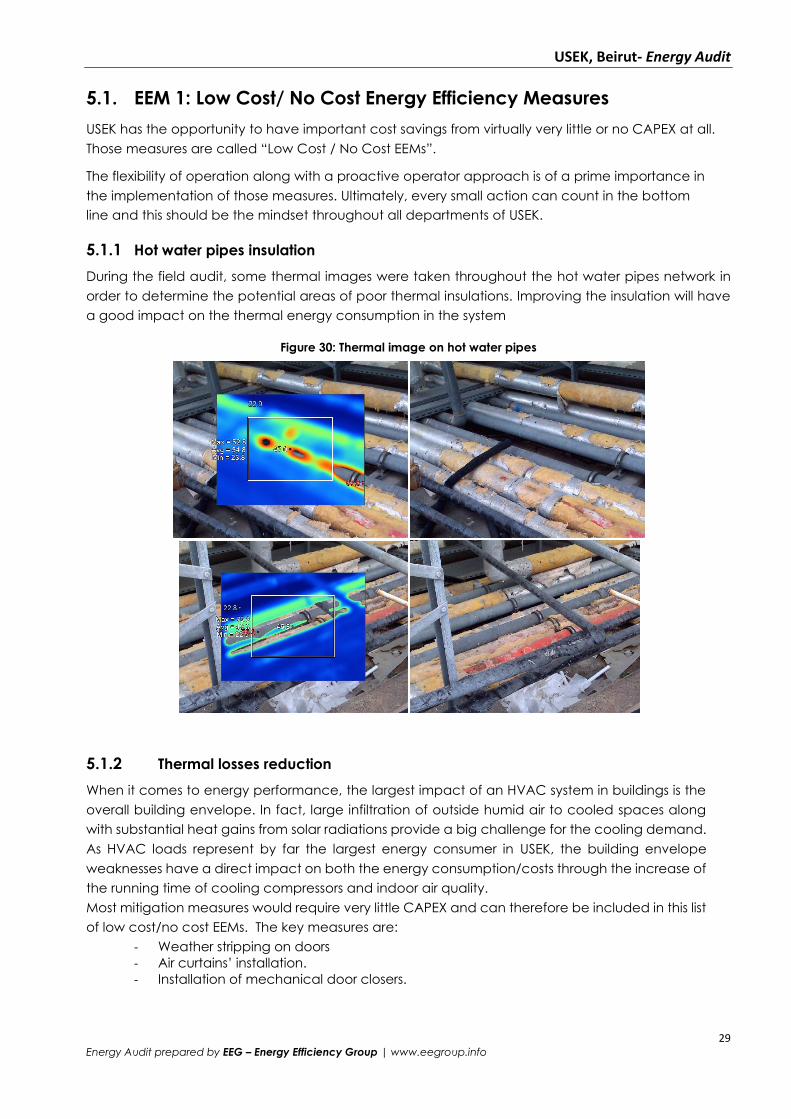
5.1.1 Hot water pipes insulation
During the field audit, some thermal images were taken throughout the hot water pipes network in
order to determine the potential areas of poor thermal insulations. Improving the insulation will have
a good impact on the thermal energy consumption in the system
Figure 30: Thermal image on hot water pipes
5.1.2 Thermal losses reduction
When it comes to energy performance, the largest impact of an HVAC system in buildings is the
overall building envelope. In fact, large infiltration of outside humid air to cooled spaces along
with substantial heat gains from solar radiations provide a big challenge for the cooling demand.
As HVAC loads represent by far the largest energy consumer in USEK, the building envelope
weaknesses have a direct impact on both the energy consumption/costs through the increase of
the running time of cooling compressors and indoor air quality.
Most mitigation measures would require very little CAPEX and can therefore be included in this list
of low cost/no cost EEMs. The key measures are:
- Weather stripping on doors
- Air curtains’ installation.
- Installation of mechanical door closers.
Page 40
USEK, Beirut- Energy Audit
30 Energy Audit prepared by EEG – Energy Efficiency Group | www.eegroup.info
We recommend a thorough assessment throughout all the parts of the various buildings in parallel
with the awareness program in order to validate all potential weaknesses and mitigate them.
Targets are all outdoor/indoor accesses and all cooled spaces with potentially opened doors.
Figure 31: Open windows and doors in cooled areas
As the space is cooled during summer period and heated during winter period, the reduction of
thermal losses at any single point will have an impact. In many cases weather-stripping should be
enough.
Table 18: Thermal losses improvement savings
➔ It has to be noted that USEK has two boilers in block F each with 250,000Kcal/hr for space
heating. Instead, rooms are heated via VRF system and the boilers operation is restricted to
act as back up for the solar system. Retrofitting these two boilers with heat pump can record
dramatic savings in the diesel consumption.
5.1.3 Chilled water temperature reset
Optimizing the operating temperatures of cooling machines is one of the most important aspects of
efficient operation. The COP (Coefficient of Performance) of any machine depends strongly on the
temperature difference against which it operates. Cooling plants typically keep this differential
higher than it needs to be, providing the user with an opportunity for major energy savings.
Chilled water systems are commonly designed to provide full cooling load with a chilled water
temperature of about 7°C chilled water output 35°C ambient temperature. Plant operators typically
leave the chilled water temperature fixed at this value or some other. This is inefficient for most
applications, such as air conditioning, where the load is well below its maximum most of the time.
Typically, you can raise the chilled water temperature by 1°C to 4°C for much of the time. Even at full
load, the typical over sizing of airside components (air handling units, fan-coil units, etc.) usually allows
some increase in chilled water temperature.
USEK’s case:
The weather conditions in Lebanon are well segmented into four different seasons: Spring during
Measure Description KWh savings Cost Saving ($)
Thermal losses improvements 25,645 $3,334
Page 41
USEK, Beirut- Energy Audit
31 Energy Audit prepared by EEG – Energy Efficiency Group | www.eegroup.info
which the temperature varies between 140C and 230C, summer during which the temperature
reaches levels around 29°C, fall where the temperature varies between 150C and 260C and
finally winter when temperature can go as low as 10°C. Those differences are clearly depicted
in the below historical averages.
Figure 32: Beirut-Lebanon Historical Temp/RH averages
USEK is currently operating the chillers only from May to September at a leaving temperature of 6°C
throughout all this period without any variation, we would recommend raising this level to 8°C.
➔ The savings that can be attained annually could easily top the 6% of the chillers’ energy
consumption. An estimated 7,411KWh reduction per year for the three chillers can be achieved
which will bring in around $963 of cost savings on KWh.
Table 19: Chilled water temperature reset savings
Measure Description KWh
savings
cost Saving
($)
Chilled Water Temperature Reset 7,411 $963
5.1.4 Retro-commissioning of all HVAC system in USEK
Background
Page 42
USEK, Beirut- Energy Audit
32 Energy Audit prepared by EEG – Energy Efficiency Group | www.eegroup.info
During construction, commissioning is one of the last steps in the process before a facility is turned
over to the owner. It establishes and documents that the installed systems and components
function and perform in compliance with the project's requirements.
By comparison, retro commissioning of HVAC systems applies the commissioning process to systems
within an existing building with the goal of restoring functionality and performance of those systems
comparable to when the building was new, with one exception: Facilities change, creating
changes in demands on the HVAC systems. In those cases, retrocommissioning identifies the
changes needed to meet the new performance demands.
Why is retro commissioning a necessity? In all system operations, sensors and controls drift out of
calibration, damper seals wear and fail to seal properly, ducts develop leaks, and dirt accumulates
on heat-transfer surfaces. All of these issues contribute to performance creep. But retro
commissioning does more than counteract performance creep.
Most buildings operating today never went through a commissioning process when they were new.
Inefficiencies built into those systems were never identified or corrected. Even with the best
maintenance practices, these inefficiencies will continue to be a drag on system efficiency and
performance.
Retro commissioning helps facility managers identify the entire range of issues harming system
performance, including system creep, improper operation, and design errors and defects that date
back to the original installation. Typical deficiencies identified during the process include sensors
and controls out of calibration, leaking dampers, improperly balanced systems, simultaneous
heating and cooling, and damaged duct and pipe insulation.
Implementation costs for correcting deficiencies identified by the study will vary with the age and
condition of the systems, as well as with the quality of the original construction and past
maintenance practices. Payback for the cost of the study is typically measured in months, not
years.
All three of the above tools can help managers reduce the energy use of their HVAC systems, but to
make those reductions permanent or the first step in actually controlling system energy use,
managers must change the culture of their operations. Without a change from reactive
maintenance — with its quick fixes — to one of managing system operation, any gains from these
strategies will slowly fade away. The behavior of everyone involved, from the technician sent to
correct an issue to the manager who oversees the department, must change. Just good enough is
no longer good enough.
USEK Case
In short Retro commissioning (RCx) is a “’Tune-up’ of the energy systems in an existing facility so they
perform as optimally as possible AND ensure that they continue to operate optimally for the life of the
facility”.
While we recommend undertaking a thorough retro-commissioning process for all the HVAC system
and mainly all the outdoor and indoor units, we strongly believe that the primary focus of the retro
commissioning should be on the calibration of all sensors and thermostats of the related systems.
This would include the normal thermostats controlling every split/DX/VRV or FCU. A proper calibration
after a number of years of operation is important. Ensuring that the readings/signals that are sent to
the system are correct is an important step in the objective of HVAC optimization.
USEK should devise a plan to cover throughout a time period and in phases all the thermostats and
sensors in order to ensure they are properly reacting to changes in setting. The existence of the two
BMS helps substantially reviewing Blocks F and H but the work should include all Blocks and all type of
cooling systems.
Page 43
USEK, Beirut- Energy Audit
33 Energy Audit prepared by EEG – Energy Efficiency Group | www.eegroup.info
➔ The potential savings can be easily in excess of 3% on the cooling system or more than 70,000KWh
annually which will bring in around $10,000 of cost savings.
➔ The investment needed for the Retro-commissioning work is related to the contractor’s /commissioning
company which in the case of USEK should normally be Khater Engineering who originally installed all VRVs
and the 2 BMS units. The expected payback of such a work should be less then 2 years.
➔ Retro-commissioning will also ensure the USEK team are trained in a way to apply a continuous
commissioning as part of their maintenance practices in the future in order to ensure all systems
are optimized at any given point of time.
Table 20: Retro-commissioning of HVAC system in USEK
Measure Description Budget KWh
savings Cost
saving Payback Period
Retro-commissioning of HVAC System
$20,000 70,000 $10,060 2
5.1.5 Employee and Student Engagement
Sustainability is becoming a ‘must do’ concept in the corporate world generally and more
particularly in an educational campus. The cornerstone of a sustainable operation is an
appropriate employee and student engagement.
In fact, a large number of studies showed that occupants’ (employees /students) behavioral
changes have the highest rate of return among any energy efficiency program.
The road ahead will be through a comprehensive awareness program and an alignment
between all departments on utilities management issues. Employee and student engagement
can be tackled through a variety of programs from educational training to visuals (posters,
stickers) and online tools. Furthermore, it is always a positive point to establish and recognize one
or more Energy Champions every year. An Energy Champion
• Could be anyone who sets a good example for others
• Promotes energy conservation and efficiency every day
• Responsibility is to:
- Instill a culture of energy conservation within their respective workspaces with each
occupant and with every piece of equipment.
- Develop conservation strategies specific to their work areas.
- Identify and implement Energy Conservation Measures (ECMs)
- Assure there is no backsliding – Savings must be maintained.
- Share progress, lessons learned, and innovative energy practices with other team
members.
One particular example in USEK is to focus on the engagement of offices and cooled spaces
occupants in terms of setting the thermostats specially when the cooling systems are of the split units
or DX types which are not controlled by the BMS.A setback temperature by 2 degrees will have a
substantial impact on the operation and energy consumption of the cooling units specifically and
other electrical loads generally. Through a comprehensive campaign – including Block F (Dorms) ,
such a scheme will easily provide a 100,000 KWh savings from the total campus energy consumption
Table 21: Retro-commissioning of HVAC system in USEK
Measure Description Budget KWh
savings Cost
saving Payback Period
Employee/Student Engagement $10,000 100,000 $13,060 0.13
Page 44
USEK, Beirut- Energy Audit
34 Energy Audit prepared by EEG – Energy Efficiency Group | www.eegroup.info
5.2. EEM 2: Lighting Retrofit-LED Retrofit
USEK’s lighting energy cost represents 29% of the total annual energy cost which is in excess of
$122,444 per year. Accordingly, any substantial reduction on the lighting loads’ energy
consumption would lead to large impact on the total facility’s energy and power demand. As
previously seen, the overall lighting system of the facility is mostly comprised of PL/Halogen and
linear fluorescent.
Based on the field audit and energy analysis, it was seen that the largest opportunity of cost savings
on lighting would be through lighting retrofits.
Generally, lighting retrofits’ concept is based on introducing different new lighting technologies in
the existing facility; In addition to substantial savings in the energy consumption, retrofits have also
a major benefit in both the luminance and comfort. Lighting retrofit provides a major opportunity
for the facility to reduce its overall lighting load while improving dramatically the overall lighting
infrastructures.
The key advantages and benefits of LED lights are known to USEK as used extensively in some areas
in the facility and can be summarized by:
1. Energy Efficiency: LED lights are very energy efficient and consume less than half the
electricity of the conventional lighting technologies currently used in the branches.
2. Good color rendering: Good quality LED lights have excellent color rendering
3. Long Life Cycle: Good quality LED lights use high power LED light sources developed with a
design life of over 50,000 hours which make them very reliable and reduce maintenance
costs.
4. No Mercury: LED lamps are not fragile, require little maintenance and do not contain harmful
or hazardous chemicals associated with some other low energy lighting products.
You will find here below the key LED retrofit schemes proposed along the full BOQ and pricing. Area Example Retrofits Suggested
T8 18W/36W and T5 28W in classes and offices
Replace T8 Fluorescent by T8 LED , 4000K,120 deg
T8 18W 60cm by T8 LED 9W 900 lm.
T8 36W 120 cm, by T8 LED 18W 1800 lm
T8 58W by T8 22W
T5 28W by T5 14W
Hal 70W and Hal 50W
Replace the MR16 50W halogen by LED MR 16
4x1W Lux>320, 2500K.
PL 58W in most offices
Replace PL 2x55W by LED Square panel 36W
Page 45
USEK, Beirut- Energy Audit
35 Energy Audit prepared by EEG – Energy Efficiency Group | www.eegroup.info
Implementing all the above retrofits throughout the facility would lead to substantial energy and
cost reductions. The below table provides the financial indicators of this EEM.
Savings reach 55% of the total lighting energy consumption and 16% from the total electrical energy
consumption. Table 22: Lighting Retrofit project-LED Retrofit project
Description Retrofit with Qty Unit
Price
Total
Cost
KWh
Savings
Cost
Savings
Simple
Payback
Fluo T8 18W LED T8 9W 141 $15 $2,115 3,026 $393 5.38
Fluo T8 36W LED T8 18W 338 $22 $7,436 14,139 $1,838 4.05
Fluo T8 2x18W LED T8 2x9W 9 $30 $270 702 $91 2.96
Fluo T8 4x18W LED T8 4x9W 683 $60 $40,980 80,489 $10,464 3.92
Fluo T8 2x36W LED T8 2x18W 378 $44 $16,632 55,115 $7,165 2.32
Fluo T8 4x36W LED T8 4x18W 108 $88 $9,504 27,004 $3,511 2.71
Fluo T8 2x58W LED T8 2x22W 296 $64 $18,944 52,733 $6,855 2.76
Fluo T5 28W LED T5 14W 1,981 $9 $17,829 78,163 $10,161 1.75
Hal 50W LED 4W 216 $11 $2,376 4,707 $612 3.88
Hal 70W MR16 6W with
fixture 1,135 $18 $20,430 98,085 $12,751 1.60
PL 26W LED Panel 11W 416 $27 $11,232 9,515 $1,237 9.08
PL 2x26W LED Panel 14W 1,192 $35 $41,720 100,024 $13,003 3.21
PL 58W LED Panel 36W 654 $80 $52,320 17,611 $2,289 22.85
E27 23W LED 4W 119 $11 $1,309 2,130 $277 4.73
2D 36W LED Panel 11W 78 $27 $2,106 5,607 $729 2.89
Economy 2x23W LED Panel 14W 200 $35 $7,000 14,760 $1,919 3.65
Economy 36W LED Panel 11W 29 $27 $783 1,866 $243 3.23
Economy 2x36W LED Panel 14W 108 $35 $3,780 31,761 $4,129 0.92
MH 400W Flood Light 100W 42 $120 $5,040 47,857 $6,221 0.81
PS 250W Flood Light 50W 40 $60 $2,400 31,200 $4,056 0.59
Inc 100W LED bulb 4W 34 $11 $374 6,495 $844 0.44
LED Lighting Retrofit project $264,580 682,987 $88,788 2.98
(*) Payback period calculated excluding any maintenance cost savings.
➔ -building F- 78 halogen fixtures 2x300W each are installed in the kitchens of the dorms. It is
impossible to retrofit the bulb only. It is recommended instead to retrofit the whole fixture.
Important Note on maintenance:
One of the important features of LED lighting retrofit program is its exceptional impact on maintenance
costs. In fact with a life span between 30,000 hrs and 50,000 hrs. LED panels and bulbs would save a
large amount on the maintenance costs of a facility as existing bulbs will be replaced 5 to 8 times
before the LED are replaced. Annual maintenance savings would come from both bulbs and labor
costs. Accordingly, we have considered a conservative $1 savings per year on every T8/T5 fluorescent
replaced and $1 for every MR16 replaced.
It is also crucial to note that the benefits of the reduction in cooling loads and the related energy costs
are excluded from the calculation – although it should be noted they could have a substantial impact
as LED lighting have a much colder operation compared to fluorescent and halogen lights.
Page 46
USEK, Beirut- Energy Audit
36 Energy Audit prepared by EEG – Energy Efficiency Group | www.eegroup.info
5.3. EEM 3: Occupancy sensors for lighting and cooling system control
5.3.1 Introduction
Lighting Control’s concept is based on introducing new lighting control technologies in the existing
lighting system. It provides a major opportunity for any facility to reduce its overall lighting energy
consumption.
Lighting control examples are:
1. Time control
2. Daylight control
3. Occupancy control
The suggested lighting control for USEK is the occupancy sensors which will ensure bypassing any
human error in terms of lighting and HVAC control. below is an example of coverage of the 360°
sensor along the laboratory area.
Figure 33: Motion detector coverage area (Left); Laboratory in building H
the manual control in every targeted area/room will be kept but a presence/occupancy sensor will
be installed in parallel and will ensure any human motion is detected over a line range of 6m with an
angle 0 to 360◦C. This detector will control a dual switch unit controlling both the lighting circuits and
indoor cooling unit. below is a schematic of the installation.
Figure 34: Occupancy sensor installation for lighting and cooling control
Page 47
USEK, Beirut- Energy Audit
37 Energy Audit prepared by EEG – Energy Efficiency Group | www.eegroup.info
5.3.2 USEK Case
As per the energy breakdown in section 4, cooling loads consume 2,564,474KWh annually which
represents 59% of the total energy consumption while lighting consumes 29% of the total energy in
USEK. Accordingly, a properly applied motion detector will ensure maximizing the control of both the
lighting and cooling units.
Motion sensors will shut the controlled lights and cooling units OFF when the space is vacant and will
put them ON when they sense a human presence. Typically motion sensors can provide more than
20% energy savings in areas that are partly unoccupied during the day.
Their installation is rather easy and usually, the objective is to control 70% to 85% of the total lighting
fixtures and cooling units of the controlled area. Based on a physical survey, it was found that class
rooms, administration offices, laboratories and parking are a good opportunity for this EEM.
Figure 35: Operational cooling and lighting in unoccupied areas
Figure 36: Laboratories in the second basement of block H (Left); Administration offices (Right)
As an example for this application, we have taken the areas here above to showcase the potential
installations. In the biology laboratory we can install two sensors due to the laboratory areas
dimensions and shape, on the other hand, all administration offices can be covered with one sensor
per office due to the limited areas.
Page 48
USEK, Beirut- Energy Audit
38 Energy Audit prepared by EEG – Energy Efficiency Group | www.eegroup.info
5.3.3 Energy savings for motion detector installation
Applying this measure will have a good return on investment due to the relatively small budget and
high potential savings. In fact, it is estimated – as per similar facilities, that the potential energy
savings reductions are almost 25% energy savings on the controlled lighting energy consumption and
18% savings on cooling energy consumption.
The below table provides the present EEM’s annual savings:
Table 23: Lighting and cooling Energy Savings-USEK
EEM Description Lighting Energy
Savings (KWh)
Cooling
Energy Savings
(KWh)
Total Energy
Savings
(KWh)
Total Cost
Savings
($)
Occupancy sensors
installation in Block H 39,752 36,987 76,739 $9,976
Occupancy sensors
installation in the rest of
the campus
133,394 226,666 360,060 $46,808
Total 173,146 263,653 436,799 $56,784
Here after is a table providing the financial key indicators of this project showing cost savings
exceeding $56,784 per year which are about 10% savings on the total energy consumption of USEK.
Table 24: Occupancy sensor project key financial indicator
EEM Description Qty Unit Price
($) Total Cost ($)
Total Energy
Savings KWh
Cost
Savings
($)
Simple
Payback
Occupancy sensors with
A/C breaker in block H 205 $100 $20,500 76,739 $9,976 2.05
Occupancy sensors with
A/C breaker in the rest of
the campus
470 $100 $47,000 360,060 $46,808 1
Total 675 $100 $67,500 436,799 $56,784 1.19
5.4. EEM 4: Retrofit Split Units with DC Inverter technology
USEK has a mixture of VRV units, DX units, Split units and chillers. While VRV are considered energy
efficient and chillers have been recently installed and do not have a high load factor, the focus
should be in upgrading the split units that were seen to represent by far the largest installed capacity
and energy end use among the cooling systems. The below measure should be seen as a plan to be
implemented in a phased approach.
5.4.1 What is a DC inverter technology?
An “inverter” is a power conversion circuit that electronically regulates the voltage, current and
frequency of products such as air conditioners. This circuit controls the compressor and, therefore,
the air conditioners output. Raising the frequency increases the output, while lowering the
frequency reduces it. In this way, inverter air conditioners provide much finer temperature control
than conventional models can.
DC inverters provide a range of benefits over conventional start/stop systems. These include:
- Significantly lower running costs compared with conventional systems.
- Quickly and efficiently adjust the room temperature to the user’s set comfort zone.
- Elimination of temperature fluctuations associated with traditional start/stop systems.
Page 49
USEK, Beirut- Energy Audit
39 Energy Audit prepared by EEG – Energy Efficiency Group | www.eegroup.info
- Greatly reduced system noise both inside and outside the space.
Apart from its significantly reduced running costs, inverter technology has two distinct comfort
advantages over conventional air conditioners:
1- Whether cooling or heating, it will reach the selected “Comfort Zone” more quickly as shown
in the graph below.
2- It can then maintain operating temperatures within the “Comfort Zone” at all times, which
conventional air conditioners are unable to do – also as seen in the graph below.
Figure 37: DC inverter and conventional split units' comparison
A major feature of DC inverter air conditioning is its retrofit capability, enabling its integration into
virtually any building, old or new, with the minimum of structural alteration or disturbance to the
daily routine of the staff.
When an inverter air conditioner is switched on, it supplies the exact power needed to heat or cool
the room rapidly. This enables the air conditioner to reach the set temperature in around half the
time required by conventional models. Air conditioning noise levels inside and outside the home are
dramatically reduced by DC inverter systems because they always seek the lowest operating level,
while providing the maximum heating or cooling effect.
Figure 38: DC inverter and conventional split units' temperature variation
5.4.2 DC inverter electrical savings calculation
The savings calculation is based on retrofitting the split units installed in classes and offices by a DC
inverter technology with a COP more than 3.88 which would make the efficiency improvement over
40%. The first step is to calculate the present cooling energy that has been produced annually by the
split units – as per the energy balance of the present energy audit, then to turn this cooling energy
back to electrical energy based on the new units’ efficiency.
Page 50
USEK, Beirut- Energy Audit
40 Energy Audit prepared by EEG – Energy Efficiency Group | www.eegroup.info
Table 25: Split units installed and related energy consumption
Name Description
No.
of
Units
Total
Input
Capacity
(KW)
Electrical
Energy Use
(KWhelectrical)
Cooling
Energy
Needed
(KWhthermal)
Bloc A
AC 18000Btu Bloc A-Music 8 15.2 23,972 64,724
AC 24000Btu Bloc A-Music 38 98.8 151,742 409,703
AC 12000Btu Bloc A-Music 62 80.6 123,790 334,233
AC 28000Btu Bloc A-Music 14 42 62,681 169,239
AC 9000Btu Bloc A 11 11 16,388 44,248
Bloc B
AC 24000Btu Bloc B 51 132.6 240,158 648,427
AC 18000Btu Bloc B 3 5.7 10,803 29,168
AC 12000Btu Bloc B 21 27.3 50,676 136,825
AC 28000Btu Bloc B 4 12 22,275 60,143
Bloc H
AC 12000Btu Bloc H 12 15.6 10,262 27,707
AC 24000Btu Bloc H 2 5.2 3,421 9,237
AC 18000Btu Bloc H 1 1.9 1,276 3,445
AC 9000Btu Bloc H 1 1 638 1,723
Bloc C
AC 28000Btu Bloc C 13 39 57,252 154,580
AC 32000Btu Bloc C 6 20.4 30,388 82,048
AC 12000Btu Bloc C 18 23.4 34,351 92,748
AC 24000Btu Bloc C 29 75.4 110,687 298,855
Bloc D
AC 12000Btu Bloc D 10 13 9,360 25,272
AC 24000Btu Bloc D 22 57.2 38,370 103,599
AC 9000Btu Bloc D 5 5 3,253 8,783
AC 28000Btu Bloc D 5 15 10,062 27,167
AC 32000Btu Bloc D 11 37.4 25,457 68,734
AC 18000Btu Bloc D 4 7.6 5,205 14,054
Bloc E
AC 9000Btu Agronomy 3 2.91 2,386 6,442
AC 12000Btu Agronomy 11 14.3 11,723 31,652
AC 24000Btu Agronomy 21 54.6 44,979 121,443
AC 18000Btu Agronomy 3 5.7 4,795 12,947
AC 28000Btu Agronomy 12 36 29,513 79,685
AC 32000Btu Agronomy 1 3.4 2,828 7,636
Page 51
USEK, Beirut- Energy Audit
41 Energy Audit prepared by EEG – Energy Efficiency Group | www.eegroup.info
Name Description
No.
of
Units
Total Input
Capacity
(KW)
Electrical
Energy Use
(KWhelectrical)
Cooling
Energy
Needed
(KWhthermal)
Block G
AC 18000Btu Block G 7 13.58 14,399 38,877
AC 9000Btu Block G 12 11.64 12,341 33,321
AC 24000Btu Block G 2 5.2 5,514 14,888
AC 12000Btu Block G 12 15.6 16,606 44,836
Block I
AC 10Tons Sports Club 1 12.9 15,964 43,102
AC 24000Btu Sports Club 2 5.2 6,435 17,375
Total 1,209,950 3,266,864
The table here after provides the comparison of the electrical energy consumption needed to
produce the same cooling energy between the existing split units with the COP of 2.7 and the DC
inverter with the COP of 3.88.
Savings attained are 30% from the present conditions and represent about 8.5% of the total
electrical energy consumption of USEK with an annual reduction of around 367,973KWh and a
related cost reduction of $44,893 per year.
Table 26: Comparison of electrical energy consumed to produce the cooling capacity needed
Location
Split Units Energy
Consumption
(KWh)
DC Inverter
Energy
Consumption
(KWh)
KWh
Savings
Cost
Savings
($)
Block A 378,573 263,440 115,133 $14,046
Block B 323,912 225,403 98,509 $12,018
Block C 232,678 161,915 70,763 $8,633
Block D 91,707 63,817 27,890 $3,403
Block E 96,224 66,960 29,264 $3,570
Block G 48,860 34,001 14,859 $1,813
Block H 15,597 10,854 4,743 $579
Block I 22,399 15,587 6,812 $831
Total 1,209,950 841,977 367,973 $44,893
below is the table providing the key financial indicators of the DC inverter technology
installation based on an installed cost of $750 per unit.
Table 27: DC inverter technology Project Key Financial Indicators
EEM Quantity Unit
Price ($)
Total
Cost
KWh
Savings
Cost
Savings
($)
Simple
payback
DC Inverter Technology 438 $650 $262,800 367,973 $44,893 5.8
The choice of the DC inverter split units is further reinforced by the fact that the copper piping don’t
need to be changed and accordingly the installation will be easily done.
Page 52
USEK, Beirut- Energy Audit
42 Energy Audit prepared by EEG – Energy Efficiency Group | www.eegroup.info
5.5. VRF Retrofit for the DX units in USEK (What If Scenario)
The main objective of this exercise is to showcase the “what if” scenario in case USEK has opted for
a centralized cooling system for the areas cooled via DX units. Due to the large DX capacity units
installed with a COP not exceeding 2.7, the current system is not ideal for the operation of many
zones such as the library, the theatre, the cafeteria… the best solution would have been to focus on
a higher performance technology with large capacities and greater energy saving .
5.5.1 What is a VRF system?
Widely acknowledge as the most advanced system, VRF represents a powerful combination of
advanced inverter and heat pump technologies. VRF can switch from cooling to heating or supply
both at the same time to different parts of the building. In its heat recovery format, heat exhausted
from indoor units in the cooling cycle is merely transferred to units in areas requiring heat, maximizing
energy efficiency, reducing electricity cost and leading to part load efficiencies up to 9.
A major feature of VRF air conditioning is its retrofit capability, enabling its integration into virtually
any building, old or new, with the minimum of structural alteration or disturbance to the daily routine
of the staff. Also since the system is intended to be “neither seen nor heard” its refrigerant piping can
be concealed without undue difficulty and its indoor units are designed to blend with interior decors
of all styles and ages. The selection of VRF air conditioning is aimed at providing rapid return on
investment and to provide a high grade indoor environment at low running costs.
The running costs of VRF system are low because it allows each zone to be controlled individually.
That is only those rooms which require air conditioning will be cooled while system can be shut down
completely in rooms where no air conditioning is required. Thanks to inverter technology, the outdoor
units can be easily adjusted to the total load.
5.5.2 VRF System Electrical Savings Calculation
The savings calculation is based on retrofitting the DX units in different areas in USEK by a VRF system
with COP more than 4,5. The area we focused at is classes and offices. The table below shows the
existing DX units installed and the related cooling capacity.
Page 53
USEK, Beirut- Energy Audit
43 Energy Audit prepared by EEG – Energy Efficiency Group | www.eegroup.info
Table 28: Cooling capacity needed
Type Location Quantity Unit
KWcooling
Total
KWcooling
Block A
AC 3Tons Block A-Music 15 10.55 158.25
AC 5Tons Block A 9 17.59 158.27
AC 36000Btu Music 4 10.55 42.20
AC 48000Btu Music 4 14.07 56.27
Block B
AC 5Tons Block B 1 17.50 17.50
AC 32000Btu Block B 2 9.38 18.76
AC 3Tons Block B 1 10.55 10.55
Server Room
AC 15Tons Server room 2 52.70 105.40
AC 10Tons Server room 1 35.17 35.17
Block D
AC 38000Btu Block D 1 11.14 11.14
AC 3Tons Block D 9 10.55 94.95
Block E
AC 48000Btu Cafeteria 6 14 84
AC 40000Btu Theatre 4 11.72 46.88
AC 3Tons Theatre 1 10.55 10.55
AC 36000Btu Faculty of Agronomy 1 10.55 10.55
AC 4Tons Faculty of Agronomy 3 14.00 42.00
AC 5Tons Faculty of Agronomy 6 17.58 105.48
Total 1,007
The rating DX cooling capacity needed is 1,008KW. The table below shows the comparison
between the rated electrical power that must be installed to produce 1,008KWcooling via VRF system
and the installed DX capacities to produce the same cooling capacity. The calculation is based on
COP of 2,7 for the DX units and a COP of 4.5 for the VRF system.
Table 29: Comparison of the electrical rated power to produce the cooling capacity needed
KWcooling Rated DX
KWelectrical
Rated VRF
KWelectrical
Block A 415 145.5 92.2
Block B 46.81 17 10
Server Room 140.6 46.6 31.2
Block D 106 39.2 23.5
Block E 158 58.5 35.1
Theatre 57.43 19.5 12.76
Cafeteria 84 31.2 18.6
Total 1007.84 357.5 223.36
The electrical power installed will be reduced by134KW electrical. The table here after shows an
estimated calculation for the savings of the VRF system. The savings can reach about 177,000 KWh
per year related to $23,022 of annual cost savings.
Page 54
USEK, Beirut- Energy Audit
44 Energy Audit prepared by EEG – Energy Efficiency Group | www.eegroup.info
However, the CAPEX of related VRF units with a total capacity of 285RT will be in excess of $500,000
leading to a non viable payback period. Accordingly, we recommend replacing every set of DX
units or a combination of sets of DX units by a VRF when the related maintenance costs become
high and/or units are close to the end of their life cycle.
Table 30: Estimated energy savings if installed VRF
Location
Electrical Energy
Consumption (KWh) Energy
Savings (KWh)
Cost
Savings
($) DX Units VRF System
Block A 222,211 140,032 82,179 $10,683
Block B 31,612 18,573 13,039 $1,695
Server Room 123,530 82,706 40,824 $5,307
Block D 26,174 15,721 10,453 $1,359
Block E 49,255 29,754 19,501 $2,535
Theatre 6,331 4,134 2,197 $286
Cafeteria 22,048 13,150 8,898 $1,157
Total 481,161 304,070 177,091 $23,022
Page 55
USEK, Beirut- Energy Audit
45 Energy Audit prepared by EEG – Energy Efficiency Group | www.eegroup.info
5.6. EEM 6: Waste Heat Recovery
5.6.1 Waste Heat Recovery Definition
Waste Heat, in the most general sense, is the energy associated with the waste streams of air,
exhaust gases and/or liquids that leave the boundaries of a plant or building and enter the
environment. In other terms, waste heat is that energy, which is rejected from a process at a
temperature high enough above the ambient temperature to allow the economic recovery of
some fraction of that energy for useful purposes. All waste heat that is successfully recovered
directly substitutes for purchased energy and therefore reduces the consumption and cost of that
energy. A second potential benefit is realized when waste heat substitution results in smaller
capacity requirements for energy conversion equipment.
5.6.2 Heat Rejected from generators
Heat recovery on an engine refers to the capture and reutilization of heat energy which is normally
wasted to radiators. This process increasingly common today, improves total system efficiency and
return on investment. New plants designed for this purposes are called cogeneration plants.
Reciprocating engines energy coming from fuel is converted to:
• 30-40% mechanical power
• 20-40% rejected to the jacket water
• 30-40% rejected to exhaust
• 5-7% radiated to the environment
Generally, these data depend on the type of engine and manufacturer.
While the heat rejected by the jacket water can be relatively totally recovered , one can recover
only 50-70% of the exhaust rejected energy due to problem of low temperature of exhaust and
corrosion resistance of heat exchangers
below is a simplified schematic of the engine’s heat recovery along with the various energy content
streams of the engine versus the load and here below a general
Figure 39: Engine Heat Recovery connection (Left) , Engine Energy Balance v/s Load (Right)
Page 56
USEK, Beirut- Energy Audit
46 Energy Audit prepared by EEG – Energy Efficiency Group | www.eegroup.info
5.6.3 USEK Case: Hot water from Jacket water coolant
The facility has six generators 1000kVA each and two generators 700kVA each that are running on a
need basis during power failure. Accordingly, there is a substantial amount of thermal energy that
can be recuperated and used for hot water production.
Normally, USEK could benefit from the heat recovery of both the jacket water cooling and exhaust
gas ones; however, due to the fact that the hot water demand is limited in the campus and that is
currently covered in its majority by solar thermal in the dorms, then the jacket water heat recovery is
enough to fulfill all the demand.
At the present stage the economical assessment is not possible as the savings are those related to
the diesel consumed in both boilers in the dorms and which data is not available.
In any upcoming campus expansion, USEK can also consider this thermal energy source in its
original plans.
In order to calculate the potential thermal energy recovered, we have as a first step to get the
generators’ heat rejected conditions at full load and then work out the new parameters at the
average real loading. The below table provides the conditions at 100% loading for both generators
type.
Table 31: Generator heat rejected Description @ full load
Type Gen 1000kVA Gen 700kVA
Heat Rejected to Exhaust 757kW 641kW
Heat Rejected to Jacket Water Coolant 300kW 234kW
The monthly thermal energy recovered from the jacket cooling of all generators is found in the
below table. It is to be noted that the budget of heat recovery system is about $25,000 per
generator and we recommend targeting the 1,000KVA ones if needed.
Table 32: Thermal energy recovered from the jacket water coolant
Month
Diesel
Consumption
(Liters)
Total
Energy
Recovered
(KWh)
Total
Energy
Recovered
(MJ)
January 8,907 168,739 607,461
February 8,713 152,410 548,675
March 9,584 168,739 607,461
April 12,433 163,296 587,866
May 18,880 168,739 607,461
June 17,677 163,296 587,866
July 41,928 168,739 607,461
August 41,923 168,739 607,461
September 18,874 163,296 587,866
October 9,583 168,739 607,461
November 9,573 163,296 587,866
December 7,011 168,739 607,461
Total 205,086 1,986,768 7,152,365
Page 57
USEK, Beirut- Energy Audit
47 Energy Audit prepared by EEG – Energy Efficiency Group | www.eegroup.info
5.7. EEM 7: Roof Insulation-Green Roof
5.7.1 Introduction
Buildings A and B have a large land area footprint leading to a substantial roof space that exceeds
2,181m2. It has a standard insulation cover that is still enabling large heat gains inside the buildings.
Moreover, 40% of energy consumption of the campus is in these two buildings which increase the
interest of energy savings in block A & B.
Figure 40: Roof of buildings A and B
It is therefore important to research all possible solutions that would reduce the heat gains of the roof
and assist the cooling system of both buildings by reducing the cooling load.
With such a large surface, the first general idea was to install a solar thermal system. However, as the
facility has no need for hot water, while solar thermal cooling will not be financially feasible, the idea
was totally dropped. For informational purpose, note that the budget to cover the roof by solar
panel will exceed the $250,000.
The other obvious solution is to improve the roof insulation. Adding normal gravel would help but the
best solution that would provide the highest savings while providing substantial environmental
benefits is the” Green Roof “concept.
5.7.2 Green Roof Concept and Benefits
A green roof is a continuous layer of vegetation and soil that covers a roof’s surface. The main
components are waterproofing, soil, and the plants themselves. Green roofs are an important
conservation technology because they increase the energy performance of buildings, improve
indoor as well as outdoor air quality, and enhance the health of urban watersheds. There are two
distinct types of contemporary green roofs: extensive and intensive.
Figure 41: Gravel Roof v/s Green Roof components
An extensive green roof consists of a shallow soil
profile with low-growing, horizontally spreading
plants. These plants are primarily succulents that are
adapted to rooftops, where there is often little water
and soil but significant exposure to sunlight and
wind.
Extensive green roofs usually require less structural
support than intensive ones, and they are
considered to be more environmentally effective.
Page 58
USEK, Beirut- Energy Audit
48 Energy Audit prepared by EEG – Energy Efficiency Group | www.eegroup.info
Therefore, this publication focuses on the design and installation of extensive green roofs. All green
roofs are natural systems that effectively cool the temperature of ambient air at roof level. The
vegetation layer shades the roofing membrane, thus significantly reducing heat gain through the
roof. The vegetation cover itself adds green space to areas that otherwise would remain impervious
and uninhabitable to birds, butterflies, and other small wildlife. Green roofs are important to consider
in designing a sustainable facility, especially in urban areas, because roofs make up such a large
percentage of the impervious surfaces in cities. Thus, they contribute to two key problems: the
“urban heat island” effect and urban storm water runoff.
Both problems affect the consumption of energy and water and the demand on energy and water
systems.
Green roofs contribute to energy management and water conservation in both direct and indirect
ways. They provide shade, which reduces solar heat gain through the roof by almost 100 percent
and mitigates the urban heat island effect. Also, a green roof’s soil and vegetation layer absorbs
and filters rain, preventing it from becoming polluted runoff from the roof’s surface. And the
photosynthesis process in vegetation has been shown to help reduce greenhouse gas emissions.
Green roofs absorb, filter, and temporarily store precipitation. This water storage and filtration feature
helps to mitigate the impacts of urban storm water runoff. Volume, peak runoff rates, and
associated non- point-source pollution—primarily sediments and nutrients such as nitrogen and
phosphorus— are of great concern to the health of watersheds, aquatic life, and air quality,
especially in urban centers.
Figure 42: Two examples of Green Roof: In New York (Left); On the Lebanese Central Bank Roof –
CEDRO project (Right)
5.7.3. Energy Saving Mechanism
Green roofs represent a unique, unconventional approach to increasing the energy performance of
buildings through shading, insulation, evapo-transpiration, and thermal mass. Measurable direct
benefits are lower roof surface temperatures and reduced heat transfer through the roof, which
reduce peak air-conditioning and energy demand. These energy-saving properties are different in
summer and winter.
Summer energy savings:
In summer, a green roof forms a protective layer over the waterproofing membrane, thereby
shading the roofing system from direct ultraviolet (UV) radiation. From March to November, a
chemical process occurs in plants known as photosynthesis, in which plants use the energy in sunlight
to form carbohydrates from the carbon dioxide in the air and the water in the soil. Plants on a green
roof thus prevent the surface of the roof from absorbing the sun’s heat energy. This has a direct
impact on the temperature of the indoor air immediately beneath the roof. The plenum heat gain is
Page 59
USEK, Beirut- Energy Audit
49 Energy Audit prepared by EEG – Energy Efficiency Group | www.eegroup.info
reduced, and energy demand for space conditioning is correspondingly reduced. As plants take up
water from soil and transport it through their leaves to the atmosphere (transpiration), water also
evaporates from the soil’s surface and leaves. The total water loss— evapotranspiration— helps to
effectively cool ambient air temperatures at roof level. This has a significant impact on mitigating the
urban heat island effect.
Winter energy savings:
In winter, plants are dormant, and neither photosynthesis nor evapo-transpiration takes place.
During this season, the thin vegetation layer of an extensive green roof adds thermal mass and
provides a barrier that prevents some of the warm air from escaping through the roof. Small air
pockets in the soil and around the roots add insulation.
The insulation value depends on the soil’s moisture content, and it decreases with greater moisture.
The plants, with their various heights and surface textures, help to reduce the velocity of cold winter
winds over the roof, preventing additional heat loss through the surface.
The National Research Council of Canada conducted a field study over a two-year period (2000 to
2002) to evaluate the thermal performance of green roofs. The test roof was evenly divided into an
extensive green roof (green roof) and a modified bituminous roof covered with light gray gravel
(reference roof).
Table 33: Normalized (per unit area) Heat Flow through the Roof Surfaces
The study found that the test green roof significantly reduced heat flow through the roof. It also
reduced the average daily energy demand for space conditioning by 75 percent in summer. The
table above shows heat gain and heat loss in total Btu per square foot. The green roof appeared
highly effective in reducing heat gain in summer. It was less effective in winter, reducing heat loss an
average of 26 percent, as compared with a reduction in heat transfer of 75 percent in summer.
The important notion on green roof is that comparing only the reflectivity of a green roof with that of
a light-colored roof surface can be misleading when determining the more energy-efficient surface.
Almost all traditional building materials, regardless of color, will transmit some heat; a green roof,
however, is a live ecosystem that performs natural processes. Green roofs, though darker in color
and correspondingly lower in reflectivity than light roof surfaces, do not reflect solar radiation;
instead, this solar energy is used by the green roof’s vegetation. Almost none of the sun’s heat
passes into the building. The vegetation uses the solar energy to provide effective cooling through
the evapo- transpiration process described above. Also, because green roofs do not reflect solar
radiation, occupants of neighboring buildings do not have to restrict reflections from them by
installing additional shading.
Practical solution for Lebanon Green Roof
Due to its 6 months of sustained high solar radiations, Lebanon is a perfect candidate for effective
green roofs. All the above mentioned benefits are achievable. On the other hand, economical
Page 60
USEK, Beirut- Energy Audit
50 Energy Audit prepared by EEG – Energy Efficiency Group | www.eegroup.info
practical systems can be found.
Green roof would consist of the following key components:
1. Roof deck, Insulation, Waterproofing
2. Protection and Storage Layer
3. Drainage and Capillarity Layer
4. Root permeable Filter Layer
5. Extensive Growing Media
6. Plants, Vegetation
From the technical and market research, the best available plantations for green roof are Sedum
plants. Sedums are very easy to propagate as almost any tiny leaf or piece of stem that touches the
ground will root. In addition, those plants can resist high temperatures, require practically no
maintenance and need very little irrigation (once a month is enough when there is no rain). Sedum
come in various type and models (the below figure shows two examples) and cost between 7,000LL
and 25,000 LL per unit in the market.
Figure 43: Two examples of Sedum Plants in a Green Roof application
USEK motives:
For USEK, the green roof investment should be perceived mostly from a sustainability leadership
point of view as the direct energy savings to be achieved are limited to the cooling – and to a
much lesser extent potential space heating of the upper floors.
However, the Green Roof project will surely have a greater impact in terms of the reduction of the
Heat Island Effect in the campus and in showing the commitment of USEK to reduce its GHG
emissions in line with its investments in Renewable Energy and Energy Efficiency .
Page 61
USEK, Beirut- Energy Audit
51 Energy Audit prepared by EEG – Energy Efficiency Group | www.eegroup.info
5.8. EEM 8: BMS System Upgrade and Extension
It was previously seen that there are two separate BMS in USEK in Blocks F and H respectively. Both
systems are well designed with a large number of functions used. However, we recommend
advancing the platforms in three ways:
i. Merging the systems for a centralized Operators Management
ii. Expanding the Automation and Control of main equipment
iii. Develop Energy Dashboard and expand metering
Figure 44 - Snapshot from the BMS in the block H (Left); BMS Snapshot in block F (right)
The key recommend actions are found in the below table
Action Description
Merge BMS Platforms A BMS will have its impact greatly improved
when there is a proactive operators approach.
At the present time USEK has two separate
platforms requiring at any given time two
operators. It is far more efficient to have one
central BMS that would connect to both
buildings and any future expansion. This will
allow a better visualization and management of
all the technical services along with assuring a
good implementation of all energy efficiency
procedures and automation.
Expand points of monitoring and control Both systems are already connected to the key
MEP equipment in Blocks F and H such as the
VRF units, fans and boilers. We recommend
extending the points in Block H to include the
three McQuay chillers and their pumps. As a
second phase, USEK can add connections to
the VRF units and large DX units found in Blocks
A and B. This will allow a centralization of all the
technical management and then undertak the
potential soft measures in terms of better
controlling the various units.
On Site Generators To connect all Generators’ main boards to the
BMS in order to have all the key parameters such
as the load, operating hours, KWh , oil
temperature…A diesel flowmeter could be
added to track the diesel consumption of all or
individual generator
Page 62
USEK, Beirut- Energy Audit
52 Energy Audit prepared by EEG – Energy Efficiency Group | www.eegroup.info
The development of the BMS will enable USEK engineering operators to apply a set of control
strategies leading to substantial energy consumption reduction – specially with the help of the BMS
contractor in terms of expanding the automation practices. Furthermore, the energy metering ,
trending , reporting and dashboards will enable a proper tracking , benchmarking and goals setting
which will similarly lead to a reduction of the energy usage,
Expand metering USEK to install and connect energy meters at all
key points of the campus in order to allow
undertaking the detailed load and
consumption allocation. The below figure is an
example of how meters can be connected to
the BMS via the Ethernet infrastructure of the
campus.
Build Trend All values read in the BMS can have their trends
(Data recording) programmed. This should
include the operations of all cooling systems
(VRFs) along all metering points. Building a
historical database of the campus is a very
important milestone on the overall Energy
Management Program and the lack of detailed
data during the present energy audit is a clear
example of the positive impact such a measure
will have.
Energy Dashboard and Energy Reports Once the above metering and expansion are
done, USEK will need to build graphical gauges
for online dashboard along customized energy
reports. Dashboards could include:
- Active total KVA/KW Demand for the total
Campus and for each building Block
- Month to date total KWh for the campus and
for each Block
- Month to Date KWh consumption on all EDL
feeders and per tariff
- Month to date KWh consumption on
generators
- Month to date Generators diesel
consumption