l EPA/690/R-10/024F Final 11-08-2010 Provisional Peer-Reviewed Toxicity Values for Tributyl phosphate (CASRN 126-73-8) Superfund Health Risk Technical Support Center National Center for Environmental Assessment Office of Research and Development U.S. Environmental Protection Agency Cincinnati, OH 45268
Transcript
lEPA/690/R-10/024F
Final 11-08-2010
Provisional Peer-Reviewed Toxicity Values for
Tributyl phosphate (CASRN 126-73-8)
Superfund Health Risk Technical Support Center National Center for Environmental Assessment
Office of Research and Development U.S. Environmental Protection Agency
Cincinnati, OH 45268
AUTHORS, CONTRIBUTORS, AND REVIEWERS CHEMICAL MANAGER
Alan J. Weinrich, CIH, CAE National Center for Environmental Assessment, Cincinnati, OH
DRAFT DOCUMENT PREPARED BY
SRC, Inc. 7502 Round Pond Road North Syracuse, NY 13212
PRIMARY INTERNAL REVIEWERS Debdas Mukerjee, Ph.D.
National Center for Environmental Assessment, Cincinnati, OH
Angela Howard, Ph.D. National Center for Environmental Assessment, Research Triangle Park, NC
This document was externally peer reviewed under contract to
Eastern Research Group, Inc. 110 Hartwell Avenue Lexington, MA 02421-3136
Questions regarding the contents of this document may be directed to the U.S. EPA Office of Research and Development’s National Center for Environmental Assessment, Superfund Health Risk Technical Support Center (513-569-7300)
i
TABLE OF CONTENTS
COMMONLY USED ABBREVIATIONS ........................................................................................... ii BACKGROUND ................................................................................................................................... 1
INTRODUCTION ................................................................................................................................. 2 REVIEW OF PERTINENT DATA ....................................................................................................... 3
OTHER STUDIES ........................................................................................................................... 22 Acute/Short-term Toxicity ........................................................................................................... 22 Other Routes ................................................................................................................................ 23 Neurotoxicity ............................................................................................................................... 23 Genotoxicity ................................................................................................................................ 23
DERIVATION OF SUBCHRONIC AND CHRONIC PROVISIONAL ............................................ 24 RfDs FOR TRIBUTYL PHOSPHATE ............................................................................................... 24
REFERENCES .................................................................................................................................... 37 APPENDIX A. DETAILS OF BENCHMARK DOSE MODELING FOR ORAL SLOPE FACTOR.............................................................................................................................................................. 43 APPENDIX B. DETAILS OF BENCHMARK DOSE MODELING FOR RAT LETHALITY ....... 45
ii
COMMONLY USED ABBREVIATIONS BMC benchmark concentration BMD benchmark dose BMCL benchmark concentration lower bound 95% confidence interval BMDL benchmark dose lower bound 95% confidence interval HEC human equivalent concentration HED human equivalent dose IUR inhalation unit risk LOAEL lowest-observed-adverse-effect level LOAELADJ LOAEL adjusted to continuous exposure duration LOAELHEC LOAEL adjusted for dosimetric differences across species to a human NOAEL no-observed-adverse-effect level NOAELADJ NOAEL adjusted to continuous exposure duration NOAELHEC NOAEL adjusted for dosimetric differences across species to a human NOEL no-observed-effect level OSF oral slope factor p-IUR provisional inhalation unit risk p-OSF provisional oral slope factor p-RfC provisional reference concentration (inhalation) p-RfD provisional reference dose (oral) POD point of departure RfC reference concentration (inhalation) RfD reference dose (oral) UF uncertainty factor UFA animal-to-human uncertainty factor UFC composite uncertainty factor UFD incomplete-to-complete database uncertainty factor UFH interhuman uncertainty factor UFL LOAEL-to-NOAEL uncertainty factor UFS subchronic-to-chronic uncertainty factor WOE weight of evidence
FINAL 11-8-2010
1
PROVISIONAL PEER-REVIEWED TOXICITY VALUES FOR TRIBUTYL PHOSPHATE (CASRN 126-73-8)
BACKGROUND
HISTORY On December 5, 2003, the U.S. Environmental Protection Agency’s (EPA) Office of Superfund Remediation and Technology Innovation (OSRTI) revised its hierarchy of human health toxicity values for Superfund risk assessments, establishing the following three tiers as the new hierarchy:
1) EPA’s Integrated Risk Information System (IRIS) 2) Provisional Peer-Reviewed Toxicity Values (PPRTVs) used in EPA’s Superfund
Program 3) Other (peer-reviewed) toxicity values, including
Minimal Risk Levels produced by the Agency for Toxic Substances and Disease Registry (ATSDR);
California Environmental Protection Agency (CalEPA) values; and EPA Health Effects Assessment Summary Table (HEAST) values.
A PPRTV is defined as a toxicity value derived for use in the Superfund Program when such a value is not available in EPA’s IRIS. PPRTVs are developed according to a Standard Operating Procedure (SOP) and are derived after a review of the relevant scientific literature using the same methods, sources of data, and Agency guidance for value derivation generally used by the EPA IRIS Program. All provisional toxicity values receive internal review by a panel of six EPA scientists and external peer review by three independently selected scientific experts. PPRTVs differ from IRIS values in that PPRTVs do not receive the multiprogram consensus review provided for IRIS values. This is because IRIS values are generally intended to be used in all EPA programs, while PPRTVs are developed specifically for the Superfund Program. Because new information becomes available and scientific methods improve over time, PPRTVs are reviewed on a 5-year basis and updated into the active database. Once an IRIS value for a specific chemical becomes available for Agency review, the analogous PPRTV for that same chemical is retired. It should also be noted that some PPRTV documents conclude that a PPRTV cannot be derived based on inadequate data. DISCLAIMERS
Users of this document should first check to see if any IRIS values exist for the chemical of concern before proceeding to use a PPRTV. If no IRIS value is available, staff in the regional Superfund and Resource Conservation and Recovery Act (RCRA) program offices are advised to carefully review the information provided in this document to ensure that the PPRTVs used are appropriate for the types of exposures and circumstances at the Superfund site or RCRA facility in question. PPRTVs are periodically updated; therefore, users should ensure that the values contained in the PPRTV are current at the time of use.
FINAL 11-8-2010
2
It is important to remember that a provisional value alone tells very little about the adverse effects of a chemical or the quality of evidence on which the value is based. Therefore, users are strongly encouraged to read the entire PPRTV document and understand the strengths and limitations of the derived provisional values. PPRTVs are developed by the EPA Office of Research and Development’s National Center for Environmental Assessment, Superfund Health Risk Technical Support Center for OSRTI. Other EPA programs or external parties who may choose of their own initiative to use these PPRTVs are advised that Superfund resources will not generally be used to respond to challenges of PPRTVs used in a context outside of the Superfund Program. QUESTIONS REGARDING PPRTVS
Questions regarding the contents of the PPRTVs and their appropriate use (e.g., on chemicals not covered, or whether chemicals have pending IRIS toxicity values) may be directed to the EPA Office of Research and Development’s National Center for Environmental Assessment, Superfund Health Risk Technical Support Center (513-569-7300), or OSRTI.
INTRODUCTION
Tributyl phosphate is not listed in IRIS (U.S. EPA, 2008), the Drinking Water Standards and Health Advisory list (U.S. EPA, 2006), the Health Effects Assessment Summary Tables (U.S. EPA, 1997), or the Chemical Assessments and Related Activities (CARA) list (U.S. EPA 1991, 1994). Occupational exposure limits, expressed as 8-hour time-weighted averages, include an Occupational Safety and Health Administration (OSHA, 2008) permissible exposure limit of 5 mg/m3, a National Institute of Occupational Safety and Health (NIOSH, 2005) recommended exposure limit of 2.5 mg/m3 and an American Conference of Governmental Industrial Hygienists (ACGIH, 2001, 2007) threshold limit value (TLV) of 0.2 ppm (2.2 mg/m3), based in part on analogy to triphenyl phosphate, to minimize potential for headache, nausea, and irritation. Neither the Agency for Toxic Substances and Disease Registry (ATSDR) nor the International Agency for Research on Cancer (IARC) has published documents on tributyl phosphate toxicity or carcinogenicity (ATSDR, 2008; IARC, 2008). The National Toxicology Program (NTP, 2008) has not performed toxicity or carcinogenicity assessments for tributyl phosphate and this compound was not on the 11th Report on Carcinogens. The following reviews, which did not derive toxicity values, also were consulted:
• World Health Organization (WHO, 1991) Environmental Health Criteria Document
for tributyl phosphate. • United Nations Organization for Economic Cooperation and Development
(OECD, 2001) SIDS. • A published review of tributyl phosphate toxicity (Bisesi, 2001).
To identify toxicological information pertinent to the derivation of provisional toxicity
values for tributyl phosphate, literature searches initially were conducted in May 2007 and updated in June 2009 using the following databases: MEDLINE, TOXLINE, BIOSIS, TSCATS, CCRIS, DART/ETIC, GENETOX, HSDB, and Current Contents (prior 6 months). Except where noted, the literature searches were not limited by date.
FINAL 11-8-2010
3
REVIEW OF PERTINENT DATA HUMAN STUDIES Oral Exposure
No studies regarding the oral toxicity of tributyl phosphate in humans were located. Inhalation Exposure Among the summary sources consulted, ACGIH (2001) reported unpublished information suggesting that workers exposed to 15 mg/m3 tributyl phosphate complained of nausea and headache and WHO (1991) concluded that airborne exposure to tributyl phosphate caused irritation of human skin, eyes, and respiratory tract.
Reape (1982) conducted a field study to evaluate neurotoxicity endpoints in industrial workers who were exposed to aryl phosphates for an average of 13.3 years. In 1974, modern industrial hygiene controls were installed in the plant to decrease exposure to airborne substances. In 1982, personal and area airborne tributyl phosphate concentrations in the plant ranged from 1 to 15 ppb (0.01 to 0.16 mg/m3), depending on the work area. Other airborne contaminants present in the work areas included triaryl phosphate, dichlorobenzene, other aryl and alkyl phosphates, and other organics; exposures to these contaminants ranged from undetectable to 143 ppb. No air concentration or exposure data were available prior to 1974, when worker exposures probably were much higher because it preceded installation of modern exposure control measures. Observations from clinical neurological examinations, measurements of nerve conduction velocity, and personal interviews of exposed workers were not different from the general population. Reape (1982) concluded there was no apparent association between chronic exposure of workers to these low concentrations of aryl phosphates and development of neurological health effects. However, because former workers who left employment before the study dates were not evaluated, it is unclear whether this conclusion is justified. Former workers who experienced symptoms might have self-selected themselves into different workplaces.
In a follow-up study, 12 workers exposed to air contaminants containing tributyl phosphate and other compounds were evaluated for serum monocyte counts, as determined by monocyte nonspecific esterase staining activity (Mandel et al., 1989). Exposure concentrations and length of exposure to tributyl phosphate for these workers were not reported. Monocyte counts were similar between the general population and workers exposed to tributyl phosphate.
Keegan et al. (2009) reviewed extensive data on exposures to potential chemical warfare agents and their surrogates, in United Kingdom tests of these agents. Significant exposures to tributyl phosphate in 1959–1960 were documented. While this ongoing epidemiological study appears to be a potential source of relevant human data on tributyl phosphate, such data were not available at this writing.
FINAL 11-8-2010
4
ANIMAL STUDIES Oral Exposure
Subchronic Studies There have been several subchronic studies of tributyl phosphate in rats. In one study,
Cascieri et al. (1985; FMC Corporation, 1985) treated Sprague-Dawley rats (15/gender/dose; approximately 44 days of age) with 0, 8, 40, 200, 1000, or 5000 ppm of tributyl phosphate (purity >99%) in the diet for 13 weeks. The doses calculated for this review from body weight and food consumption data reported in the study were 0, 1, 3, 14, 68, and 360 mg/kg-day for males and 0, 1, 3, 16, 81, and 423 mg/kg-day for females. Mortality and clinical signs were evaluated daily and body weights and food consumption measured weekly. Comprehensive hematology and serum chemistry measurements were conducted in five rats/gender/dose at the interim sacrifice of 45 days and at terminal sacrifice. At terminal sacrifice, ophthalmology; brain, heart, liver, kidney, gonad, and adrenal weights; gross necropsy on all major tissues and organs; and histology on all major tissues and organs in the control and high-dose groups, and liver and urinary bladders in all groups also were evaluated. The treatment had no adverse effects with respect to mortality, ophthalmology, interim hematology, or gross necropsy (FMC Corporation, 1985; Cascieri et al., 1985). With the exception of measurements in the brain among 200- and 1000-ppm male rats exposed for 13 weeks, cholinesterase activities (see Table 1) did not vary significantly from controls. The 45-day plasma activities were significantly higher in females at 1 mg/kg-day and 13-week brain values in males at 14 and 68 mg/kg-day; however, no dose-related trends were apparent. Abdominogenital staining was observed sporadically in males and females fed 1000 or 5000 ppm. Body-weight gain was significantly (p < 0.01) lower than controls in both high-dose males (25%) and females (30%). Food consumption was significantly (p < 0.05) decreased throughout the study in the high-dose males (8–14%) and during Weeks 3–5 in the high-dose females (9–12%). Table 2 shows the significant changes observed at termination in hematology, clinical chemistry, organ weights, and histopathology. A significant increase in activated partial thromboplastin (APTT) time was observed in the high-dose males at termination. Alanine aminotransferase (ALT) concentrations were 32% above controls in high-dose males at interim evaluation and 41% elevated in high-dose females at termination. Serum Gamma-glutamyl transpeptidase (GGT) activity was significantly increased in males at 1000 and 5000 ppm and females at 5000 ppm at the interim sampling time, and in high-dose males and females at termination. At terminal sacrifice, significant increases were observed in serum cholesterol among the high-dose females and in albumin and calcium concentrations among the high-dose males. Significant increases in liver/brain weight ratios were observed in the 1000- and 5000-ppm males and in the 5000-ppm females, but no histological abnormalities were observed in any organ other than the urinary bladder of the treated rats. Generalized transitional-cell hyperplasia was observed in the urinary bladders of all 1000- and 5000-ppm males and in 8/9 of the 5000-ppm females; this effect was not observed in rats in lower dose groups. No neoplastic lesions were observed in any tissue examined microscopically. This study identified a NOAEL of 200 ppm (14 mg/kg-day) for urinary bladder hyperplasia in male rats treated with tributyl phosphate in the diet for 13 weeks. The associated LOAEL was 1000 ppm (68 mg/kg-day) at which 10/10 male rats exhibited urinary bladder hyperplasia.
FINAL 11-8-2010
5
Table 1. Acetylcholinesterase Activities from a 13-Week Rat Dietary Studya
aFMC Corporation, 1985; Cascieri et al., 1985 bMean ± standard deviation cSignificantly different from control, p < 0.05 dStatistical tests on incidence data conducted for this review using Fisher’s exact test. ep < 0.01
FINAL 11-8-2010
7
Effects of tributyl phosphate on the urinary bladder were studied in more detail by Arnold et al. (1997) and the Bayer (1996). Groups of 10 male Sprague-Dawley rats were fed diets containing 0, 200, 700, or 3000 ppm of tributyl phosphate (purity 99.7%) for 10 weeks. The doses, calculated by the study authors from body weight and food consumption data in the study, were 0, 15, 53, and 230 mg/kg-day in the control, low-, mid-, and high-dose groups, respectively. Another group received 3000 ppm of tributyl phosphate and 12,300 ppm of ammonium chloride to evaluate the effect of urinary acidification. A final group received 3000 ppm of tributyl phosphate for 10 weeks followed by a 10-week recovery period. Clinical observations were made weekly, as were body weight and food consumption measurements. Urinalysis (pH, total protein, creatinine, calcium, phosphorus, magnesium, and osmolality) was performed on samples collected during Week 11 from all groups and during Week 21 of the high-dose and control recovery groups; scanning electron microscopy (SEM) of the urine also was performed. Upon sacrifice during Week 11 or 21, the animals were necropsied and the bladder and were kidneys weighed. The bladder was examined under SEM and subjected to immunohistochemical analysis for bromodeoxyuridine (BRdU) labeling as a measure of cell proliferation.
There were no significant differences in food consumption between groups, but body weights were significantly (p < 0.05) decreased (~10% based on graphical presentation of data) in the high-dose tributyl phosphate groups, both with and without ammonium chloride (Arnold et al., 1997; Bayer, 1996). Body weights for rats in the recovery group returned to the level of the control rats during the recovery phase. Urine chemistry was similar in treated and control animals apart from a slight, but statistically significant, decrease in osmolarity and creatinine concentrations in high-dose animals. Scanning electron microscopic examination of the urine showed no treatment-related crystalluria, urinary precipitate, or calculi. In the bladder, a statistically significant increase in simple hyperplasia was observed in the mid- and high-dose groups, as well as the group receiving both ammonium chloride and tributyl phosphate (see Table 3) (Arnold et al., 1997; Bayer, 1996). Papillary and nodular hyperplasia also was observed in these three groups, but the increased incidence was significant only in the high-dose group. Focal necrosis of the bladder epithelium, with erosion, ulceration, and hemorrhage into the lumen, was observed in the mid- and high-dose groups, as well as inflammation associated with ulceration in the high-dose group. Classification of the bladder changes using SEM categories (1–5, with Categories 3–5 considered abnormal) confirmed the findings; bladders of 10/10 rats exposed at 700 ppm and 9/10 exposed to 3000 ppm were classified as either Category 4 or 5. Treatments to acidify the urine did not totally inhibit the proliferative response in the bladder epithelium, but it did cause the effects of 10 weeks exposure to 3000 ppm to be less severe. Examination of the recovery group showed the bladder changes to be reversible, with no significant changes being observed upon light or scanning electron microscopy of the epithelia in the treated and control recovery groups. However, an increased fibrosis of the submucosa was observed in the recovery animals, possibly representing scar tissue formed during treatment-related ulceration. This study identifies a NOAEL of 200 ppm (15 mg/kg-day) for urinary bladder cell hyperplasia in male rats treated with tributyl phosphate in the diet for 10 weeks. The associated LOAEL is 700 ppm (53 mg/kg-day) at which 8/10 rats exhibited urinary bladder hyperplasia.
FINAL 11-8-2010
8
Table 3. Effects on the Urinary Bladder of Male Rats Fed Tributyl Phosphate in the Diet for 10 Weeksa
aArnold et al., 1997; Bayer, 1996 bMean ± standard error cSignificantly different from control, p < 0.05 dp < 0.01 by Fisher’s exact test conducted for this review eArnold et al. (1997) reported that this increase was statistically significant when compared with controls but did not report a p-value
Earlier feeding studies in rats were conducted by Oishi et al. (1980, 1982). Male Wistar rats (10–11/dose; 5 weeks of age) were treated with 0, 0.5, or 1% tributyl phosphate (purity >97%) in the diet for 10 weeks (Oishi et al., 1980). Using initial and final body weight and mean food consumption data from the study, the following doses were calculated for this review: 0, 425, and 870 mg/kg-day. Body weights and food and water consumption were measured daily. Upon sacrifice, blood was collected for coagulation time measurements and serum chemistry, including ALT, aspartate aminotransferase (AST), alkaline phosphatase (ALP), total protein, glucose, blood urea nitrogen (BUN), cholesterol, and electrolytes; organ weights (brain, liver, and kidneys) were recorded; and acetylcholinesterase activity in brain, liver, and serum was measured. Gross necropsy and histopathology evaluation were not conducted. Both terminal body weights and food consumption were significantly (p < 0.05) decreased in the low- (17% and 15%, respectively) and high- (31% and 24%, respectively) dose groups. Significant increases in relative brain (15–33% higher than controls) and kidney (10–21% higher) weights were observed in both dose groups, despite significant decreases in the absolute weights of both organs (5–16% decreases) at these doses, indicating that the relative organ weight increases were secondary to body weight reductions. Relative liver weights also were significantly increased (32–56%) at both doses, with no significant change in absolute liver weights, indicating that the relative liver weight changes also were a function of body weight differences. Significant serum protein and cholesterol increases were observed in high-dose animals. Significant increases in serum BUN and blood coagulation time and decreases in serum glucose concentrations were
FINAL 11-8-2010
9
observed in both treated groups while activities of serum ALT, AST, and ALP were decreased in the low-dose group, only. Brain cholinesterase activity was significantly increased in both dose groups, though increases in serum and liver cholinesterase activity were not significant. With the exceptions of ALT, ALP, and brain cholinesterase, the observed changes appeared to be dose-related. This study identified a LOAEL of 0.5% (425 mg/kg-day) for 15–17% decreased body-weight gains, clinical chemistry effects and increased blood coagulation times in rats treated in the diet for 10 weeks; no NOAEL is identified in this study. In a subsequent study by these researchers, male Wistar rats (5 weeks of age) were treated with 0 (18 animals) or 0.5% (8 animals) tributyl phosphate (purity unknown) in the diet for 9 weeks (Oishi et al., 1982). Based on initial and final body weight data from the study and food consumption data from the previous study (Oishi et al., 1980), the doses calculated for this review were 0 and 417 mg/kg-day. The following parameters were used to assess toxicity: body-weight gains; hematology, including prothrombin and APTT time, red (RBC) and white blood cell (WBC) counts, hemoglobin (Hgb) concentrations, hematocrit (Hct), and mean corpuscular volumes (MCV); serum chemistry (total protein, BUN, cholesterol, ALT, AST, ALP, cholinesterase, bile acids, and electrolytes), organ weights (liver, kidneys, spleen, and testes), and histology of the liver, kidney, and spleen. Final body weights of rats treated with tributyl phosphate were significantly (p < 0.05) lower than controls (11%); food consumption data were not reported. BUN concentrations were significantly increased (16% higher than control) in treated rats. Absolute and relative liver weights were significantly (p < 0.05) increased (16% and 32% higher than controls, respectively) in treated rats; other organ weight changes were secondary to body weight decreases in treated animals. No other effects were observed. Oishi et al. (1982) identified a LOAEL of 0.5% (417 mg/kg-day) for an 11% decrease in body weights and increased serum BUN concentrations among male rats treated for 9 weeks; no NOAEL is identified in this study. Laham et al. (1985) conducted a gavage study in rats. Sprague-Dawley rats (12/gender/dose; average body weights 206–294 g) were treated by gavage with 0 or 200 mg/kg of tributyl phosphate (purity 98.4%), 5 days/week, for 18 weeks (Laham et al., 1985). An additional group received similar treatment with 300 mg/kg for 6 weeks, followed by 350 mg/kg for 12 weeks. The time-weighted average doses were 0, 143, and 238 mg/kg-day for the control, low- and high-dose groups, respectively. Clinical examinations were conducted daily and body weights recorded weekly. Upon sacrifice, blood was collected for hematology (RBC and WBC counts, Hct, MCV, Hgb, mean corpuscular hemoglobin concentration, and serum chemistry (RBC acetylcholinesterase, albumin, bilirubin, BUN, cholesterol, creatinine, glucose, total protein, triglycerides, GGT, AST, ALT, ALP, alpha-hydroxybutyrate dehydrogenase, lactate dehydrogenase [LDH], creatinine phosphokinase, amylase, and electrolytes). Organ weights (heart, kidneys, liver, lungs, ovaries, testes, and spleen) were recorded and gross necropsy performed; histology examinations (six rats/gender/dose) were made on weighed organs as well as the adrenals, brain, intestines, stomach, thyroid, and urinary bladder.
The treatment had no adverse effects on clinical signs or hematology findings (Laham et al., 1985). High-dose males had significantly (p < 0.001) decreased body weights (terminal body weights were 14% lower than controls) and significantly increased relative kidney weights (19% higher than controls). High-dose females had significantly decreased RBC acetylcholinesterase activity (8% below controls) and significantly increased relative kidney
FINAL 11-8-2010
10
weight, absolute and relative liver weight, and absolute spleen weight (9, 29, 28, and 24% above controls, respectively). All low- and high-dose rats had diffuse hyperplasia of the urinary bladder epithelium and subepithelial capillaries; severity ranged from mild, in females, to moderate, in males (see Table 4). Focal nodular epithelial hyperplasia was observed in urinary bladders of high-dose males and females and low-dose males. Slight mononuclear cell infiltration was observed in urinary bladders of one low-dose and one high-dose male. Capillary hyperplasia and mononuclear cell infiltration were each observed in the urinary bladders of single female control animals. No other treatment-related gross or histopathological abnormalities were observed. This study identified a LOAEL of 143 mg/kg-day for urinary bladder hyperplasia in all male and female rats treated by gavage for 18 weeks; no NOAEL is identified in this study.
Table 4. Incidence and Severity of Bladder Changes in Rats Exposed to Tributyl Phosphate by Gavage for 18 Weeksa
Healy et al. (1995; Bio-Research Laboratories, 1991) treated 12 Sprague-Dawley rats/gender/dose (age 46–50 days) by gavage with 0, 32.5, 100, or 325 mg/kg-day of tributyl phosphate (>99% pure) in corn oil, 7 days/week, for 13 weeks. The following parameters were used to assess toxicity: mortality, clinical signs, body-weight gains, food consumption, motor activity tests (Days 28, 62, and 92) and qualitative and quantitative functional observation battery (FOB) for neurobehavioral changes (1, 6, and 24 hours following first dosing, and Days 7, 14, 35, 63, and 91). Gross necropsy was performed on major tissues and organs of all groups at study termination and histopathological evaluation of neurological tissues, including brain (several areas), spinal cord (several levels), gastrocnemius muscle, and peripheral structures of the nervous system, was performed on six animals in each of the control and high-dose groups. Healy et al. (1995; Bio-Research Laboratories, 1991) observed salivation, a typical, early cholinergic sign of organophosphate toxicity (Costa, 2008), among
• the low-dose rats in one male on each of only 4/89 days of observations and in one to
three females per day on 15/89 days; • the mid-dose rats in two to twelve males and females, most with slight to moderate
degree, on all but two of the earliest days of observation; and • almost all the high-dose rats, with moderate to severe degree, on every day of
observation.
FINAL 11-8-2010
11
Early in the study, the salivation occurred postdosing, but it also was observed predosing during the second and third months on study, probably a residual effect from the prior day treatment, according to Healy et al. (1995; Bio-Research Laboratories, 1991). Early deaths occurred in two males and one female in the mid-dose groups and in three males and four females in the high-dose groups. Healy et al. (1995; Bio-Research Laboratories, 1991) reported that the clinical and pathological findings indicated that at least some of these deaths resulted from aspiration of saliva into the lungs. It is believed that the deaths resulted from a combination of all three of the following factors:
• Increased salivation caused by the cholinergic response to TBP. • Cholinergic respiratory inhibition (Gallo and Lawryk, 1991; Lotti, 2001). • The gavage treatment, itself.
The rats most likely would have survived if they had not been intubated for gavage. Because the gavage treatment method was a constant while the other two factors were cholinergic responses to TBP ingestion, it is concluded that the dose-dependent frequency of deaths were indicators of severity of the cholinergic response rather than frank effects caused by TBP toxicity.
Muzzle staining was observed in mid- and high-dose females and in high-dose males. Urogenital staining was observed in some high-dose animals during Week 1 of treatment; two high-dose females also had red-colored urine. Incidences of these clinical signs were not reported. Body weights were significantly (p < 0.05) decreased from Day 14 of the study in high-dose males and from Day 35 in females. Based on graphical presentation of body weight data, terminal body weights were approximately 20% and 10% below controls in high-dose males and females, respectively. Body weights were lower than controls in 100 mg/kg-day females throughout the latter half of the study, but the difference did not reach statistical significance. No difference in body weights was observed in low-dose animals of either gender or in mid-dose males. Food consumption was significantly (p < 0.01) decreased in high-dose animals during the first week of treatment. The treatment had no adverse effects on qualitative or quantitative FOB assessments, motor activity tests, or gross pathology (including brain weight, length, or width). Histopathological examination of neurological tissues revealed no abnormalities. This study identifies a NOAEL of 32.5 mg/kg-day and a LOAEL of 100 mg/kg-day for deaths (3/24) that apparently resulted from aspiration of TBP-contaminated saliva. Conclusions based on clinical signs of toxicity (salivation and muzzle staining) in rats treated by gavage for 13 weeks were less clear; 32.5 mg/kg-day might have been a LOAEL for the rarely observed cholinergic salivation or the next higher dose, 100 mg/kg-day, might be considered a LOAEL for this frequently observed sign. Bio/dynamics Inc. (1991a) conducted a subchronic study in mice. CD-1 mice (15/gender/dose; approximately 42 days of age) were treated with 0, 500, 2000, or 8000 ppm of tributyl phosphate (purity 99.7%) in the diet for 13 weeks. The doses, calculated for this review from body weight and food consumption data in the study, were 0, 96, 383, or 1479 mg/kg-day for males and 0, 119, 462, or 1769 mg/kg-day for females. Daily examinations for mortality and clinical signs were made and measures of body weight and food consumption were recorded weekly. Blood was collected for hematology (Hct, RBC, WBC, reticulocyte count, platelet count, differential leukocyte count, erythrocyte morphology) and serum chemistry (AST, ALT, creatinine, ALP, albumin, calcium, phosphorous) at interim sacrifice of five mice/gender/dose
FINAL 11-8-2010
12
after 1 month and on all survivors at termination. At termination, ophthalmology, organ weights (brain, heart, liver, kidneys, gonads, and adrenals), gross necropsy (all major tissues and organs) and histology (all major tissues and organs in control and high-dose groups; gross lesions, epididymides, kidneys, lungs, testes, liver, and urinary bladders in all groups) were evaluated.
The treatment had no adverse effects with respect to mortality, clinical signs, or
ophthalmology (Bio/dynamics Inc., 1991a). In high-dose animals, food consumption was significantly decreased, and both males and females lost weight over the first week of treatment. Overall body-weight gains were decreased (20–29%) in high-dose males and females. Estimates of weekly body-weight gains also were reduced in mid-dose males sporadically during the treatment period. At study termination, body weights of mid- and high-dose males and high-dose females were 97, 99, and 93%, respectively, of controls. Significant changes observed at study termination are shown in Table 5. Slight—but significant—decreases in hematocrit and erythrocyte counts were observed in high-dose females. A significant increase in platelet counts was observed in high-dose females at 30 days, but not at termination. Significant increases in serum calcium and albumin concentrations were observed at 30 days (in females, only albumin increased) and, at study termination, in high-dose males and females. At study termination, significant increases were observed in ALT and ALP in high-dose males and in ALT in high-dose females. The absolute liver weights, the liver/body weight ratios, and the liver/brain weight ratios all were significantly increased in mid- and high-dose males and females. Gross enlargement of the liver was observed in all high-dose animals, in one mid-dose male, and in one mid-dose female. Brown or tan discoloration of the liver was observed in 7 of 20 high-dose animals and in 1 mid-dose male. Incidences of centrilobular hepatocyte hypertrophy were significantly increased (p < 0.05 by Fisher’s exact test conducted for this review) in mid- and high-dose males and in high-dose females (see Table 5); incidences of urinary bladder epithelial hyperplasia were significantly increased (p < 0.01) in mid- and high-dose animals of both genders. The severity of both endpoints was characterized as minimal or slight (mid-dose group) and slight or moderate (high-dose group). This study identified a NOAEL of 500 ppm (96 mg/kg-day) and a LOAEL of 2000 ppm (383 mg/kg-day) for centrilobular hepatocyte hypertrophy (with changes in liver enzymes and gross evidence of toxicity) in mice treated in the diet for 13 weeks. The data for urinary bladder hyperplasia were less clear, demonstrating an 80% (8/10) response rate at 2000 ppm (383 mg/kg-day) and a 10% (1/10) response rate at 500 ppm (96 mg/kg-day). Because the 10% response at 96 mg/kg-day was not significantly greater than the 0/10 response among controls, it is unclear whether this dose should be considered a LOAEL or a NOAEL.
FINAL 11-8-2010
13
Table 5. Significant Changes at Study Termination in Mice Fed Tributyl Phosphate in the Diet for 13 Weeksa
aBio/dynamics Inc., 1991a bMean ± standard deviation cStatistical analysis of incidence data conducted for this review using Fisher’s exact test dp < 0.05 ep < 0.01
Chronic Studies Auletta et al. (1998a) supplied Sprague-Dawley rats (50/gender/dose) with diets
containing 0, 200, 700, or 3000 ppm of tributyl phosphate (purity 99.7%) for 2 years. Auletta et al. (1998a,b) estimated the mean actual intake of tributyl phosphate as 0, 8.9, 32.5, or 143.3 mg/kg-day for males and 0, 11.6, 42.0, or 181.5 mg/kg-day for females in the 0-, 200-, 700-, and 3000-ppm groups, respectively. Body weights and food consumption were measured weekly for the first 13 weeks and monthly thereafter. Hematology analysis (RBC, WBC, differential leukocyte count, and erythrocyte morphology) was performed at 12, 18, and
FINAL 11-8-2010
14
24 months, and urinalysis (pH, occult blood, and sediment examination) was performed at 3 weeks and at 3, 6, 12, and 18 months. All surviving animals were sacrificed at 24 months and received a full gross examination. Histopathological examinations were carried out on a comprehensive set of organs and tissues in high-dose animals, controls, and any rats found dead or sacrificed early, and on target organs (kidneys, liver, urinary bladder, and any tissues with gross lesions) from all groups. Body-weight gains were significantly (p < 0.05) decreased in high-dose rats compared with controls; mean terminal body weights were 19–20% lower in high-dose rats compared with controls. The only clinical sign attributable to tributyl phosphate exposure was increased red discoloration of the urine in some high-dose males (incidences were 2/50, 3/50, 3/50, and 14/50 from control through high-dose). Survival, hematology, and urinalysis parameters were similar in control and treated animals. The only significant nonneoplastic finding was a dose-related increase in the incidence and severity of urinary bladder hyperplasia, as shown in Table 6. No other nonneoplastic lesions associated with dietary administration of tributyl phosphate were observed. This study identified a LOAEL for urinary bladder hyperplasia of 700 ppm (32.5 mg/kg-day for males and 42 mg/kg-day for females) and a NOAEL of 200 ppm (8.9 mg/kg-day for males and 11.6 mg/kg-day for females).
Incidences of urinary bladder tumors in 3000-ppm male and female rats were elevated
compared with control incidences (Auletta et al., 1998a). Table 6 shows the incidences of bladder tumors in all groups. All of the carcinomas were described as transitional cell carcinomas, except for one in the high-dose-male group, which showed a marked squamous cell component. Historical control incidences for urinary bladder transitional cell carcinoma in control Sprague-Dawley rats from the testing laboratory were 1/857 in males and 0/779 in females. Rats with urinary bladder papillomas were reported also “frequently” to have had hyperplasia. In contrast, it was not possible to determine the presence or absence of hyperplasia in rats with urinary bladder carcinomas, because most of the epithelium was involved in the malignancy.
In the chronic mouse study, Auletta et al. (1998b) supplied CD-1 mice (50/gender/dose)
with diets containing 0, 150, 1000, or 3500 ppm of tributyl phosphate (purity 99.7%) for 18 months. Auletta et al. (1998b) estimated the mean actual intake of tributyl phosphate as 0, 28.9, 169, or 585 mg/kg-day for males and 0, 24.1, 206, or 711 mg/kg-day for females in the 0-, 150-, 1000-, and 3500-ppm groups, respectively. Body weights and food consumption were measured weekly for the first 13 weeks and monthly thereafter. Hematology (RBC, WBC, and differential leukocyte count and erythrocyte morphology) was performed for half of the animals at 12 months and for all animals prior to the 18-month sacrifice. All animals received a full gross examination at death or sacrifice. Full histopathological examinations (see list for rat study described previously) were carried out on high-dose and control mice and on target organs (kidneys, liver, lung, urinary bladder, and any tissues with gross lesions) from all groups.
FINAL 11-8-2010
15
Table 6. Incidence of Urinary Bladder Lesions in Rats Fed Tributyl Phosphate in the Diet for 2 Yearsa
Dietary Tributyl Phosphate Control 200 ppm 700 ppm 3000 ppm
Total neoplasms 0/50 0/50 1/49 13/49 aAuletta et al., 1998a bSignificantly different from control by Fisher’s exact test conducted for this review, p < 0.05 cThe number of animals at risk for hyperplasia (denominator) was adjusted to eliminate animals with bladder carcinoma, as hyperplasia could not be evaluated in these animals (see text). dp < 0.01 No clinical effects of tributyl phosphate were observed in any group. Survival of the high-dose males was significantly lower than the mid-dose males but was not significantly reduced compared with controls. Survival of all treated groups was within that of historical controls in the testing laboratory. A significant decrease in weight gain was observed in high-dose animals over the study; terminal body weights were 10% lower than controls in both males and females in this group. There were no hematological changes associated with tributyl phosphate administration. Significant, dose-related increases in absolute liver weights, liver/body weight ratios, and liver/brain weight ratios were observed in mid- and high-dose animals of both genders (see Table 7). Nonneoplastic lesions were not observed in the liver or other tissues. Auletta et al. (1998b) identified the low-dose of 150 ppm (28.9 mg/kg-day in
FINAL 11-8-2010
16
males and 24.1 mg/kg-day in females) as a NOAEL for chronic toxicity. The mid- and high-dose levels were associated with significant increases in absolute and relative liver weight (see Table 7) but without any liver histopathology. Serum chemistry was not analyzed in this study. A 3-month dietary study in CD-1 mice reported increased serum activities of liver enzymes, elevated liver weights, and hepatocyte hypertrophy in mice exposed to dietary concentrations of 2000 or 8000 ppm of tributyl phosphate (Bio/dynamics Inc., 1991a). Auletta et al. (1998b) speculated that the lack of hepatocyte hypertrophy in the 18-month mouse study might have been due to the development of tolerance with chronic administration. Because the changes in liver weight were not associated with other toxicological correlates, this endpoint was not considered adverse for the purpose of identifying a LOAEL. The high dose from this study (585 mg/kg-day in males and 711 mg/kg-day in females) was considered a LOAEL for decreased body weight and the mid dose (169 and 206 mg/kg-day in males and females, respectively) was considered a NOAEL.
Table 7. Changes in Absolute and Relative Liver Weight in CD-1 Mice Fed Tributyl Phosphate in the Diet for 18 Monthsa
Liver/brain weight 2.82 ± 0.46 2.87 ± 0.42 3.61 ± 1.85c 4.00 ± 0.79c aAuletta et al., 1998b bMean ± standard deviation cp < 0.01 dSignificantly different from control, p < 0.05
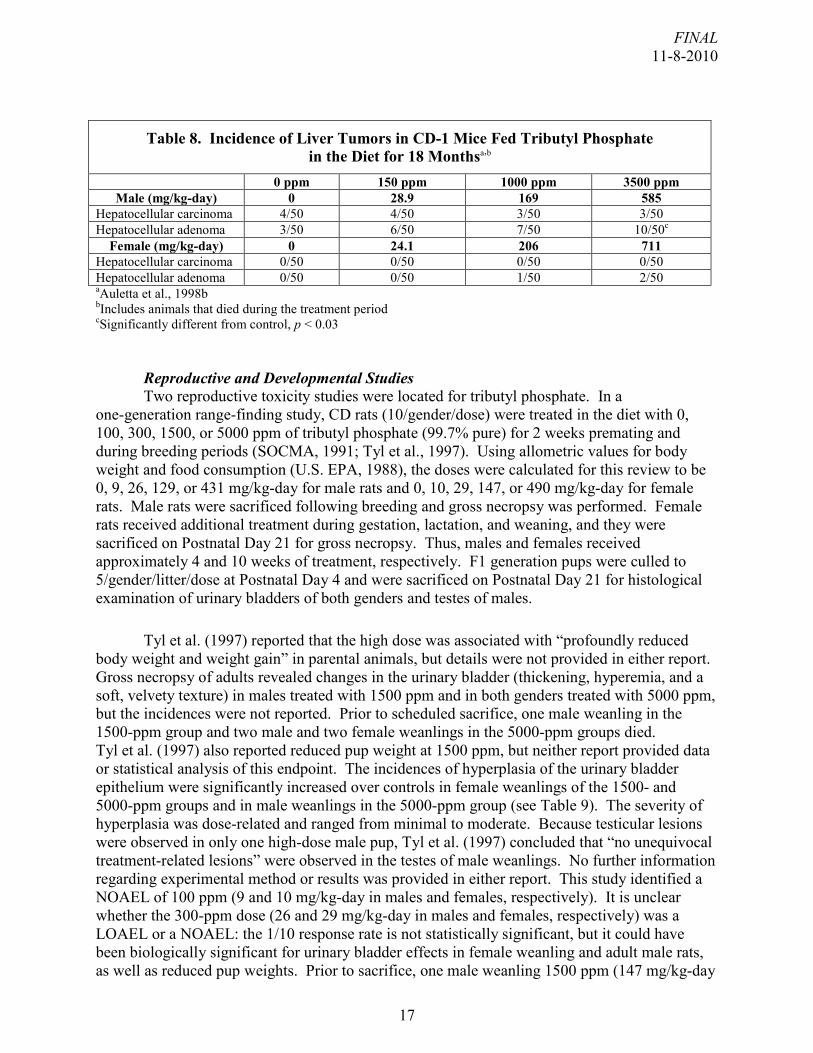
There was a significant increase in the incidence of liver adenomas (see Table 8) in
high-dose males (Auletta et al., 1998b). Historical incidences for hepatocellular adenomas in control male CD-1 mice from the testing laboratory ranged from 2/59 to 10/60. Incidences of hepatocellular carcinomas were not significantly increased in treated mice compared with controls. Exposed groups showed no other increased incidences of neoplastic lesions when compared with the control group.
FINAL 11-8-2010
17
Table 8. Incidence of Liver Tumors in CD-1 Mice Fed Tributyl Phosphate in the Diet for 18 Monthsa,b
Female (mg/kg-day) 0 24.1 206 711 Hepatocellular carcinoma 0/50 0/50 0/50 0/50 Hepatocellular adenoma 0/50 0/50 1/50 2/50 aAuletta et al., 1998b bIncludes animals that died during the treatment period cSignificantly different from control, p < 0.03
Reproductive and Developmental Studies Two reproductive toxicity studies were located for tributyl phosphate. In a
one-generation range-finding study, CD rats (10/gender/dose) were treated in the diet with 0, 100, 300, 1500, or 5000 ppm of tributyl phosphate (99.7% pure) for 2 weeks premating and during breeding periods (SOCMA, 1991; Tyl et al., 1997). Using allometric values for body weight and food consumption (U.S. EPA, 1988), the doses were calculated for this review to be 0, 9, 26, 129, or 431 mg/kg-day for male rats and 0, 10, 29, 147, or 490 mg/kg-day for female rats. Male rats were sacrificed following breeding and gross necropsy was performed. Female rats received additional treatment during gestation, lactation, and weaning, and they were sacrificed on Postnatal Day 21 for gross necropsy. Thus, males and females received approximately 4 and 10 weeks of treatment, respectively. F1 generation pups were culled to 5/gender/litter/dose at Postnatal Day 4 and were sacrificed on Postnatal Day 21 for histological examination of urinary bladders of both genders and testes of males.
Tyl et al. (1997) reported that the high dose was associated with “profoundly reduced body weight and weight gain” in parental animals, but details were not provided in either report. Gross necropsy of adults revealed changes in the urinary bladder (thickening, hyperemia, and a soft, velvety texture) in males treated with 1500 ppm and in both genders treated with 5000 ppm, but the incidences were not reported. Prior to scheduled sacrifice, one male weanling in the 1500-ppm group and two male and two female weanlings in the 5000-ppm groups died. Tyl et al. (1997) also reported reduced pup weight at 1500 ppm, but neither report provided data or statistical analysis of this endpoint. The incidences of hyperplasia of the urinary bladder epithelium were significantly increased over controls in female weanlings of the 1500- and 5000-ppm groups and in male weanlings in the 5000-ppm group (see Table 9). The severity of hyperplasia was dose-related and ranged from minimal to moderate. Because testicular lesions were observed in only one high-dose male pup, Tyl et al. (1997) concluded that “no unequivocal treatment-related lesions” were observed in the testes of male weanlings. No further information regarding experimental method or results was provided in either report. This study identified a NOAEL of 100 ppm (9 and 10 mg/kg-day in males and females, respectively). It is unclear whether the 300-ppm dose (26 and 29 mg/kg-day in males and females, respectively) was a LOAEL or a NOAEL: the 1/10 response rate is not statistically significant, but it could have been biologically significant for urinary bladder effects in female weanling and adult male rats, as well as reduced pup weights. Prior to sacrifice, one male weanling 1500 ppm (147 mg/kg-day
FINAL 11-8-2010
18
maternal dose) died. Tyl et al. (1997) attributed the weanling mortality at the next higher dose (5000 ppm) to tributyl phosphate treatment. However, in the definitive study (described below), no treatment-related fetal or weanling mortality was observed when larger groups of CD rats were exposed to dietary concentrations up to 3000 ppm. Thus, it is not clear whether the death of the single male weanling in the 1500-ppm group of the range-finding study was related to treatment.
Table 9. Incidence of Urinary Bladder Hyperplasia in Weanling Rats Exposed In Utero and Via Lactation to Dietary Tributyl Phosphatea
Female Minimal 1/10 0/10 0/10 5/10 0/8 Mild 0/10 0/10 0/10 2/10 6/8 Moderate 0/10 0/10 0/10 0/10 2/8 Total 1/10 0/10 0/10 7/10b 8/8b aSOCMA, 1991; Tyl et al., 1997 bSignificantly different from control by Fisher’s exact test conducted for this review, p < 0.01
In the definitive two-generation reproductive toxicity study (Tyl et al., 1997), weanling CD rats (30/gender/dose), designated the F0 generation, were administered tributyl phosphate (99.7% pure) in the diet at 0, 200, 700, or 3000 ppm beginning 10 weeks prior to a 3-week mating period (females were randomly mated with males from the same dose group). Exposure to tributyl phosphate was continued throughout the entire study period. Pups (F1 generation) were counted, sexed, and examined grossly on Postnatal Days (PND) 1, 4, 7, 14, and 21. Litters were randomly culled to a maximum of eight (with as equal a gender ratio as possible) on PND 4. At weaning on PND 21, 30 F1 weanlings/gender/group were randomly selected as parents of the F2 generation and the remaining weanlings were examined externally, sacrificed, and 10/gender/group necropsied. Parental F0 animals also were necropsied: males after mating, females after weaning the F1 litters. F1 weanlings continued to consume the F0 diets of their parents for 11 weeks before mating. The F1 parents and the F2 offspring were then treated as described above for the F0 and F1 generations. F0 and F1 parental necropsy included gross examination and histopathological examination of any gross lesions and the following tissues from high-dose and control animals: pituitary, ovaries, testes, vagina, uterus, epididymides, seminal vesicles, prostate, urinary bladder, kidneys, and liver. Gross lesions, urinary bladders, male kidneys, and female livers of mid- and low-dose animals also received microscopic examinations. F1 and F2 weanlings also received a gross examination and gross lesions were preserved, but the lesions were not microscopically examined. The incidence of treatment-related histopathological findings in parental animals was not analyzed statistically. Tyl et al. (1997) calculated tributyl phosphate consumption for each interval based on body
FINAL 11-8-2010
19
weight and food consumption data. Table 10 presents the approximate ranges of tributyl phosphate doses for males and females.
Table 10. Rat Doses in a 2-Generation Reproductive Toxicity Study of Tributyl Phosphatea
Generation Gender Period of Study Approximate doses (mg/kg-day)
aTyl et al., 1997 F0 and F1 males and females in the 3000-ppm group showed significant (p < 0.01) reductions in body weight and body-weight gain over all treatment periods, as did F1 females in the 700-ppm group over most of the treatment periods. Data were presented graphically; however, body weight decrements appeared to be at least 10% following the prebreeding period in both genders exposed at the high dose. No reproductive effects (mating and fertility indices, gestational length, or histology of the reproductive organs) attributable to tributyl phosphate exposure were observed in parental animals from the F0 or F1 generations. There were no effects of treatment at any dose on total or live litter size, gender ratio, or pre- or postnatal loss for F1 or F2 litters. F1 and F2 pup body weights were consistently and significantly (p < 0.05) reduced at 3000 ppm. At 700 ppm, the F2 pup weights (per litter) were significantly reduced on PND 1 and 21, and at 200 ppm F2 pup weights (per litter) were significantly reduced at PND 14. There were no treatment-related clinical observations for pups during lactation and no treatment-related necropsy findings for pups that died during lactation or were necropsied at weaning. For adults, there were no treatment-related gross lesions in F0 or F1 animals in any of the groups. Histologically, both male and female F0 and F1 rats exhibited urinary bladder epithelial hyperplasia in the 700-ppm (incidence 16–22%) and 3000-ppm (incidence 100%) groups. Urinary bladder hyperplasia also was observed in one of the F0 males, two of the F1 males, and in two of the F0 females of the 200-ppm group. Renal pelvic epithelial hyperplasia was observed in F0 and F1 males of the 3000-ppm group but not in males from the other treatment groups. Hepatic centrilobular hypertrophy was observed in F0 and F1 females of the 700- and 3000-ppm groups but not in females from the 200-ppm group. The incidences of liver and kidney lesions are reported in Table 11. Although identification of a clear NOAEL and LOAEL from these data is complicated by the ranges of doses received by the animals, these findings suggest that tributyl phosphate is not a specific reproductive toxicant in the rat. These findings also confirm the appearance of urinary bladder hyperplasia at dietary concentrations of 700 ppm and above, and possibly as low as 200 ppm.
FINAL 11-8-2010
20
The developmental effects of tributyl phosphate have been studied in rats and rabbits. In one rat study, Noda et al. (1994) treated pregnant Wistar rats (20 females/dose) by gavage with 0, 62.5, 125, 250, or 500 mg/kg-day of tributyl phosphate (purity 99.7%) in olive oil on Gestation Day 7–17 and then sacrificed on Gestation Day 20. Parameters used to assess maternal toxicity were mortality; clinical signs; body-weight gain; food consumption; liver, kidney, spleen, and gravid uterus weights; and gross necropsy. The parameters used to assess developmental toxicity include pregnancy rates; early and late resorptions; and fetal viability, body weights, and external, skeletal, and visceral malformations. Data were analyzed using the litter as the statistical unit.
Table 11. Incidence (as percent) of Treatment-Related Histopathological Findings in Two-Generation Rat Reproductive Toxicity Study of Dietary Tributyl Phosphatea
Control 200 ppm 700 ppm 3000 ppm Urinary bladder hyperplasia F0 males 0.0b 3.3 75.9 100 F0 females 0.0 6.7 70.0 100 F1 males 0.0 7.1 53.3 100 F1 females 0.0 0.0 70.0 100 Liver centrilobular hypertrophy F0 males 0.0 NA NA 0.0 F0 females 0.0 0.0 10.0 93.3 F1 males 0.0 NA NA 0.0 F1 females 0.0 0.0 3.3 83.3 Renal pelvic epithelial hyperplasia F0 males 0.0 0.0 0.0 6.7 F0 females 0.0 NA NA 0.0 F1 males 0.0 0.0 0.0 33.3 F1 females 0.0 NA NA 0.0 aTyl et al., 1997 bPercent of animals affected; 29–30 animals examined per gender per group per generation.
Treatment produced a dose-related decrease in maternal body-weight gain and food consumption (Noda et al., 1994). Body weights and body-weight gains adjusted for uterine weights were significantly (p < 0.01) lower than controls in the 250- and 500-mg/kg-day groups. Body weights were 7 and 9% lower than controls in the 250- and 500-mg/kg-day groups, but adjusted body-weight gains were reduced by 39 and 75%, respectively. In addition, based on data presented graphically, body weights in the 125-mg/kg-day group were significantly lower than controls during the last 4 days of gestation. Piloerection and wetting of abdominal hair with urine and salivation were observed in two-thirds of females during treatment with 500 mg/kg-day; these signs disappeared after the end of treatment. Transient salivation was observed in only one female of the 250 mg/kg-day group. Absolute kidney and gravid uterus weights were unaffected by treatment but significantly increased absolute liver weights (7% higher than controls) and decreased spleen weights (11%) were seen in the 500-mg/kg-day group. No significant difference between groups was observed for the numbers of corpora lutea, implants, living fetuses, incidence of dead or resorbed fetuses, gender ratio, or body weight of living fetuses of either gender. One case of malformation was observed in the 125-mg/kg-day group (conjoined twins with 3 forelimbs and 4 hindlimbs). The incidence of rudimentary lumbar
FINAL 11-8-2010
21
rib was significantly increased among fetuses of the 500-mg/kg-day group (34 fetuses from 14 dams affected vs. 6 fetuses from 3 dams in the control group). No treatment-related increase in visceral anomalies was observed. Developmental toxicity in the form of a significant increase in rudimentary lumbar ribs was observed at a LOAEL of 500 mg/kg-day with a NOAEL of 250 mg/kg-day. This study also identified a LOAEL of 125 mg/kg-day for reduced maternal body weight, and a malformed fetus, and a NOAEL of 62.5 mg/kg-day. In an earlier rat study, Bio/dynamics Inc. (1991b) treated pregnant Sprague-Dawley rats (24 females/dose; 64 days of age) by gavage with 0, 188, 375, or 750 mg/kg-day of tributyl phosphate (purity 100%) in corn oil on Gestation Days 6–15 and then were sacrificed on Gestation Day 20. Parameters used to assess maternal toxicity were mortality, clinical signs, body-weight gain, food consumption, liver weight, and gross necropsy. Parameters measured to assess developmental toxicity were pregnancy rates, early and late resorptions, and fetal viability, body weights, and external visceral and skeletal variations and malformations. High-dose dams had a significant increase in mortality rate (7/24). Bio/dynamics Inc. (1991b) considered six of the seven deaths to be related to treatment, although the physiological cause of these deaths was not reported. A dose-related decrease in maternal body-weight gain was observed. After adjustment for uterine weights, total body-weight gains (during Gestation Day 6–20) were 25, 43, and 87% lower than controls in the low-, mid-, and high-dose dams (p < 0.01). Food consumption on Gestation Days 6–11 was significantly decreased in mid- (12%) and high-dose (37%) dams. A dose-related increase in clinical signs (salivation, yellow staining of the skin, red anogenital stains, wetness of ventral abdominal area, excessive lacrimation) was observed in dams of all dose groups. A significant, dose-related increase in relative liver weight was observed in all treatment groups, with no change in absolute liver weight; this effect was probably related to the observed decrease in body-weight gain, rather than a treatment-related effect on the liver. No abnormalities were observed following gross necropsy of dams. The treatment had no adverse effects with respect to pregnancy rate, number of corpora lutea, implantations, early or late resorptions, fetal viability, gender ratio, external or visceral abnormalities, or skeletal malformations. Fetal weight was significantly (p < 0.01) decreased at the high-dose. The incidence of fetuses with one or more ossification variations was significantly (p < 0.01) increased in all treatment groups (69, 86, 91, and 94% in control through high dose); these developmental delays were considered to be mild in the low- and mid-dose groups (some were in the range of historical controls) but were extensive in the high-dose group. This study identifies a LOAEL of 188 mg/kg-day for slight maternal (decreased body-weight gain, clinical signs) and developmental toxicity (increased incidence of ossification variations) and a FEL of 750 mg/kg-day for maternal mortality; no NOAELs are identified in this study. Bio/dynamics Inc. (1991c) treated pregnant New Zealand White rabbits (18 females/dose) by gavage with 0, 50, 150, or 400 mg/kg-day of tributyl phosphate (purity 99.7%) in corn oil on Gestation Days 6–18 and then sacrificed on Gestation Day 30. Evaluations to assess maternal toxicity included mortality, clinical signs, body-weight gain, food consumption, liver weights, gross necropsy, and histology of gross abnormalities. Evaluations to assess developmental toxicity included pregnancy rates and early and late resorptions, and fetal viability, body weights, and external, visceral, and skeletal variations and malformations. The treatment had no adverse effects with respect to clinical signs, relative liver weights, pregnancy rates, abortion, premature delivery, preimplantation loss, fetal viability, body weights, gender distribution or external, visceral or skeletal abnormalities; however, two high-dose females
FINAL 11-8-2010
22
died—one from handling errors and one from unknown causes. Body weight gain on Gestation Days 6–9 was 15, -9, -15, and -34 g in control, low-, mid-, and high-dose females, respectively. The loss of weight in the high-dose group was significantly greater than in controls. After correction for uterine weight, all groups lost weight over the gestation period and there were no treatment-related differences. Nonsignificant decreases in food consumption (9–21%) from Day 7–14 of gestation and nonsignificant increases in number of resorptions/female and ratio of resorptions/implants were observed in high-dose females. Bio/dynamics Inc. (1991c) considered these statistically nonsignificant changes to be suggestive of a treatment-related effect in high-dose females. This study identifies a NOAEL of 150 mg/kg-day and a LOAEL of 400 mg/kg-day for slightly reduced maternal weight gain during Gestation Day 6–9 and for nonsignificant increases in number of fetal resorptions. Because the increase in fetal resorptions was not statistically significant, it is unclear whether the high dose represents a LOAEL or NOAEL for developmental toxicity. Inhalation Exposure
Subchronic Studies A study by Kalinina (1971), summarized in a review by the Bayer (1994), reported that
rats and rabbits (number, strain, and gender not specified) exposed to 13.6 mg/m3 of airborne tributyl phosphate 5 hours/day, 5 days/week, for 4 months, showed a reduction in cholinesterase activity to 33% after 3 months of exposure. Although the report did not specify, this appeared to represent activity compared to that of either the untreated animals or the treated animals prior to exposure. There also were unspecified effects on physiological and biochemical parameters of the liver. Cholinesterase activity returned to normal in the post exposure period. In the same study, exposure to lower concentrations (5.1 mg/m3 for rats and 4.8 mg/m3 for rabbits), for a similar period of time, had no effect on cholinesterase activity. Although no further details of this study were available, 4.8 and 5.1 mg/m3 appear to represent NOAELs in rats and rabbits, respectively, for reduced cholinesterase activity. OTHER STUDIES Acute/Short-term Toxicity In shorter-term studies, gross lesions of the urinary bladder were observed in male rats treated with 1500 ppm in the diet for 4 weeks (SOCMA, 1991). The dose calculated for this review was 129 mg/kg-day based on body weight and food consumption values from EPA, 1988. Slightly decreased body-weight gain was observed in male mice treated in the diet with 5000 ppm for 4 weeks (dose calculated by Bio/dynamics Inc., 1990 was 803 mg/kg-day). Decreased body-weight gain, 20% mortality, and renal tubular damage were observed in rats treated by gavage with 130 mg/kg-day for 1 month (Mitomo et al., 1980). Degenerative changes in seminiferous tubules (1 of 4 rats), hematological and serum chemistry effects, decreased spleen weight, decreased rate of nerve conduction, and histological evidence of toxicity to the peripheral nervous system were observed in rats treated by gavage with 0.42 ml/kg-day (410 mg/kg-day) for 14 days (Laham et al., 1983; Laham and Long, 1984). Eller (1937) reported a 6-hour inhalation LC50 of 1359 mg/m3 in rats and a 4–5 hour LC50 of 2500 mg/m3 in cats. WHO (1991) reported single-dose oral LD50s in rats ranging from approximately 1400 mg/kg (Johannsen et al., 1977; Mitomo et al., 1980) to approximately 3000 mg/kg (Dave and Lidman 1978; Eastman Kodak, 1986); in mice of 400–800 mg/kg
FINAL 11-8-2010
23
(Eastman Kodak, 1986) and 900–1240 mg/kg (Mitomo et al., 1980); and in chickens of 1800 mg/kg (Johannsen et al., 1977). Other Routes The pneumotoxic effects of tributyl phosphate were assessed using biochemical markers of damage in bronchoalveolar lavage fluid (BALF) (Salovsky et al., 1998). A group of 30 male Wistar rats was treated intratracheally with 5 L of a 20% mixture of tributyl phosphate in n-dodecane. A similar group of 30 rats was used as controls, but Salovsky et al. (1998) did not state if these animals received an intratracheal instillation of n-dodecane or were untreated; six animals from each group were sacrificed on posttreatment days 1, 3, 7, 14, and 28. The right lungs were homogenized and the supernatant used for biochemical analysis, the left lungs were lavaged and the BALF was used for cell counting and biochemical analysis. Analyses included (1) for BALF: total cell number, lactate dehydrogenase activity, and total protein content; (2) for serum: cholinesterase activity; and 3) for lung homogenate: superoxide dismutase activity, catalase activity, glutathione peroxidase activity, glutathione reductase activity, cholinesterase activity, and malondialdehyde content. Treated animals showed significant increases in cell number, protein content, and lactate dehydrogenase activity of BALF and significant reductions in serum cholinesterase activity and the activities of superoxide dismutase, glutathione peroxidase, and glutathione reductase in lung homogenate on Day 1 compared with controls. The decrease in superoxide dismutase continued to be significant up until Day 7, but significant differences were not seen in the other enzyme activities at later time points. A single exposure to tributyl phosphate appeared to induce moderate, but transient, injury to the lungs and produced only mild inhibition of cholinesterase.
Neurotoxicity Several studies were designed specifically to investigate the neurological effects of tributyl phosphate. In a neurophysiology study by Laham et al. (1983), Sprague-Dawley rats (10/gender/dose) were treated by gavage with 0, 0.28, or 0.42 ml/kg-day of tributyl phosphate for 14 consecutive days; the corresponding doses were 0, 273, or 410 mg/kg-day. High-dose males had significantly decreased conduction velocity in the caudal nerve, and both genders had histological evidence of toxicity to the sciatic nerve (retraction of Schwann cell processes surrounding unmyelinated fibers) at the high-dose. This study identifies a NOAEL of 273 mg/kg-day and a LOAEL of 410 mg/kg-day for neurotoxicity in rats treated by gavage for 14 days.
Other neurotoxicity studies were conducted on hens. White Leghorn hens given two oral doses of 1500 mg/kg of tributyl phosphate (the oral LD50 in hens, as determined in a preliminary trial), separated by a 21-day interval, did not show behavioral or neuropathological evidence of delayed neurotoxicity (Carrington et al., 1990). In the same study, a single dose of 1500 mg/kg did not inhibit brain neurotoxic esterase in hens. A similar study was conducted by Johannsen et al. (1977). They reported that administration of two oral doses of 1840 mg/kg of tributyl phosphate to White Leghorn hens, separated by a 21-day interval, did not produce behavioral or neuropathological evidence of delayed neurotoxicity. Genotoxicity A series of genotoxicity studies of tributyl phosphate have produced primarily negative results. Tributyl phosphate was negative for genotoxicity in the following bacterial mutagenicity
FINAL 11-8-2010
24
studies: a mutagenicity assay with the TA98, TA100, TA1535, TA1537, and TA1538 strains of S. typhimurium, both with and without metabolic activation (Microbiological Associates, 1977); a mutagenicity assay with the TA98, TA100, TA1535, and TA1537 strains of S. typhimurium, both with and without metabolic activation (Bayer, 1985); a mutagenicity assay with the hisC117, hisG46, hisD3052, TA1530, TA1531, TA1532, and TA1534 strains of S. typhimurium; and a mutagenicity assay with WP2 isogenic strains of Escherichia coli (Hanna and Dyer, 1975). A single Russian bacterial mutagenicity study (Gafieva and Chudin, 1986) reported positive results in the TA1535 and TA1538 strains of S. typhimurium.
Tributyl phosphate also was negative in two in vitro assays with mammalian cells: a CHO/HGPRT mutation assay, both with and without metabolic activation (Microbiological Associates, 1990a), and a cytogenetics assay with Chinese hamster ovary cells, both with and without metabolic activation (Microbiological Associates, 1990b). A recessive lethal mutation test in the Oregon-R strain of Drosophila melanogaster (Hanna and Dyer, 1975) and an in vivo cytogenetics bone marrow assay in rats (Microbiological Associates, 1990c) also gave negative results.
DERIVATION OF SUBCHRONIC AND CHRONIC PROVISIONAL RfDs FOR TRIBUTYL PHOSPHATE
The database for tributyl phosphate includes several well conducted subchronic and chronic toxicity studies in rats and mice, as well as a number of reproductive and developmental toxicity studies in rats and rabbits. Table 12 summarizes the NOAELs and LOAELs from all the subchronic oral studies that were of adequate quality for p-RfD derivation and Table 13 summarizes the chronic data. Short-term studies (<4 weeks duration) are not included because adequate studies of subchronic duration identifying lower LOAELs are available. As Tables 12 and 13 indicate, urinary bladder hyperplasia in male rats was observed at lower doses than other endpoints. This effect has been observed in several subchronic dietary studies (Bayer, 1996; Arnold et al., 1997; FMC Corporation, 1985; Cascieri et al., 1985), in a subchronic gavage study (Laham et al., 1985), in a multigeneration reproductive toxicity study (Tyl et al., 1997), and in a chronic dietary study (Auletta et al., 1998a). Urinary bladder hyperplasia also was observed in mice of both genders exposed to tributyl phosphate for 13 weeks (Bio/dynamics Inc., 1991a). In addition, gross lesions of the urinary bladder were observed in male and female rats exposed to tributyl phosphate in the diet (SOCMA, 1991; Tyl et al., 1997). Thus, the animal data identify urinary bladder hyperplasia as an effect of repeated oral exposure to tributyl phosphate. However, because several studies reported tumors in this same tissue, it is possible that bladder hyperplasia is a preneoplastic or precursor effect. An analysis of the mode of carcinogenic action for the formation of bladder tumors is conducted in this assessment. The results of that analysis indicate that the key events in the hypothesized mode of action of tributyl phosphate-induced bladder neoplasms are not well established, but the available data suggest tributyl phosphate may induce regenerative cell proliferation in response to epithelial damage in the bladders of rats. For this reason, bladder hyperplasia has not been selected as the endpoint for derivation of the p-RfD, anticipating that the provisional oral slope factor will be protective of this effect.
FINAL 11-8-2010
25
Table 12. Summary of Oral Noncancer Dose-Response Information from Subchronic Studies Suitable for RfD Derivation
Species Route Dose (mg/kg-day) NOAEL
(mg/kg-day) LOAEL
(mg/kg-day) Responses at the LOAEL Reference Rat Diet 0, 1, 3, 14, 68, 360 (m);
0, 1, 3, 16, 81, 423 (f) 14 68
(10/10 incidence) Urinary bladder transitional cell hyperplasiaa in males
FMC Corporation, 1985; Cascieri et al., 1985
Rat Diet 0, 15, 53, 230 mg/kg-day for 10 weeks
15 53 (8/10 incidence)
Urinary bladder hyperplasiaa in males Arnold et al., 1997; Bayer, 1996
Rat Diet 0, 425, 870 mg/kg-day for 10 weeks
NA 425 Increased brain cholinesteraseb; decreased body-weight gain, clinical chemistry effects, increased blood coagulation time
Oishi et al., 1980
Rat Diet 0, 417 mg/kg-day, 9 wks NA 417 Decreased body weight and increased BUN Oishi et al., 1982 Rat
Gavage 0, 143, 238 mg/kg-day (adjusted for continuous exposure) for 18 weeks
NA 143 (6/6 incidence)
Urinary bladder hyperplasiaa Laham et al., 1985
Rat Gavage 0, 32.5, 100, 325 mg/kg-day 7 days/week for 13 weeks
NA 32.5 (rare & transient) 100 (frequent & persistent)
Clinical signs of cholinergic toxicity (salivation); muzzle staining, alopecia
Healy et al., 1995; Bio-Research Laboratories, 1991
Diet 0, 96, 383, 1479 mg/kg-day (m) and 0, 119, 462, 1769 mg/kg-day (f) for 13 weeks
96 383 (8/10 incidence)
Centrilobular hepatocyte hypertrophy (with supporting evidence for liver effects)
Bio/dynamics Inc., 1991a
aApparently a preneoplastic lesion bStatistically significant but no dose-related increase in brain cholinesterase cNo statistically significant difference from control response (0/10)
FINAL 11-8-2010
26
Table 13. Summary of Oral Noncancer Dose-Response Information from Chronic and Developmental Studies Suitable for RfD Derivation
Species Gender Dose (mg/kg-day) NOAEL
(mg/kg-day) LOAEL
(mg/kg-day) Responses at the LOAEL Reference Rat Diet
M/F 0, 8.9, 32.5, 143.3 mg/kg-day (m) and 0, 11.6, 42, 181.5 mg/kg-day (f) for 2 years
8.9 (m) 11.6 (f)
32.5 (m) 12/49 incidence 42 (f) 5/49 incidence
Urinary bladder hyperplasiaa Auletta et al., 1998a
Mouse Diet
M/F 0, 28.9, 169, 585mg/kg-day (m) and 0, 24.1, 206, 711 mg/kg-day (f) for 18 months
169 (m) 206 (f)
585 (m) 711 (f)
Decreased body weight Auletta et al., 1998b
Rat Developmental Gavage
F 0, 62.5, 125, 250, 500 mg/kg-day on GD 7–17
62.5 (maternal) 250 (developmental)
125 (maternal) 500 (developmental)
Reduced weight gain in dams; increased incidence rudimentary lumbar ribs in offspring
Noda et al., 1994
Rat Developmental Gavage
F 0, 188, 375, 750 mg/kg-day on GD 6–15
NA 188 (maternal and developmental)
Clinical signs (salivation, staining of skin, red anogenital staining, wetness of abdominal area, lacrimation) in dams; dose-related delays in skeletal ossification
Bio/dynamics Inc., 1991b
Rabbit Developmental Gavage
F 0, 50, 150, 400 mg/kg-day on GD 6–18
150 (maternal) 400 (fetal)
400 (maternal ) NA (fetal)
Significant body weight loss Bio/dynamics Inc., 1991c
Rat 2-generation Reproductive Diet study
M/F 10–21, 36–72, and 160–328 mg/kg-day (m), and 12–31, 41–107, 178–502 mg/kg-day (f)
10–31b (3.3–6.7% incidence, F0; 7.1% incidence, F1 males) 36–107
Urinary bladder hyperplasiaa (both genders and both generations)
Tyl et al., 1997
aApparently a preneoplastic lesion bNot a statistically significant difference from the control response (0%)
FINAL 11-8-2010
27
Evidence of peripheral neurotoxicity was observed in rats treated by gavage with 410 mg/kg-day of tributyl phosphate for 14 days (Laham et al., 1983). No evidence for delayed neurotoxicity was observed in hens exposed orally to 1500–1840 mg/kg, over a 21-day period (Johannsen et al., 1977; Carrington et al., 1990).
In a more comprehensive 13-week gavage study in rats, Healy et al. (1995; Bio-Research Laboratories, 1991) observed increased salivation among a majority of the rats treated with 100 mg/kg-day and occasionally at 32.5 mg/kg-day. Although Healy et al. (1995) did not classify salivation as resulting from neurotoxicity, it is a classic sign of a cholinergic response (Costa, 2008; Lotti, 2001; Rhone-Poulenc, 1992; Union Carbide, 1971; U.S. EPA, 1993). In this same study, 3/24 rats died following treatment with 100mg/kg-day and 7/24 died following treatment with 325 mg/kg-day. However, based on the observations of Healy et al. (1995; Bio-Research Laboratories, 1991) and cholinergic response data reported by Gallo and Lawryk (1991), and Lotti (2001), it is concluded that the deaths are attributable to aspiration of saliva, resulting from the salivation response in concert with respiratory inhibition typical of cholinergic toxicity, and exacerbated by the gavage treatment.
Other studies also reported salivation responses following treatment with TBP. Noda et al. (1994) reported salivation in two-thirds of pregnant rats following gavage treatment with 500 mg/kg-day on gestational Days 7–17, in only 1/20 at 250 mg/kg-day, and among no rats treated with lower doses. Bio/dynamics Inc. (1991b) reported a dose-related increase in clinical signs including salivation in all dose groups of pregnant rats (0, 188, 375, or 750 mg/kg-day via gavage).
Bio/dynamics Inc. (1991c) reported no developmental effects in rabbits treated with doses up to 400 mg/kg-day. Several other oral developmental toxicity studies found no evidence of selective toxicity to the fetus in rats. Developmental effects always were accompanied by maternal toxicity in rats. Noda et al. (1994) found developmental toxicity in the form of a significant increase in rudimentary lumbar ribs at 500 mg/kg-day of tributyl phosphate. Bio/dynamics Inc. (1991b) observed slight developmental toxicity in the form of ossification variations in rats at 188 mg/kg-day of tributyl phosphate and Tyl et al. (1997) observed developmental toxicity in the form of reduced weight of offspring in rats exposed to 3000 ppm (214–217 mg/kg-day) of tributyl phosphate during a 2-generation reproductive study. No exposure-related effects on reproductive performance or reproductive organ histology were found in the 2-generation rat study. However, developmental and reproductive endpoints are not critical for tributyl phosphate because maternal systemic toxicity was evident at much lower doses than those at which developmental or reproductive effects have been reported.
Urinary hyperplasia is not chosen as the critical effect for derivation of p-RfDs because this endpoint was likely to be a preneoplastic effect. However, cholinergic effects, including salivation, were reported in several rat studies; salivation is recognized as an early effect of organophosphate insecticide toxicity (Costa, 2008). The subchronic rat study by Healy et al. (1995; Bio-Research Laboratories, 1991) reported a dose-related increase in salivation among male and female rats gavaged with tributyl phosphate, beginning with occasional effects at 32.5 mg/kg-day. Although Healy et al. (1995; Bio-Research Laboratories, 1991) reported deaths among 3/24 rats at the next higher dose (100 mg/kg-day), these deaths are attributed to aspiration of contaminated saliva. Based on the following data, these deaths are
FINAL 11-8-2010
28
attributed, in part, to the gavage administration and considered indicators of increased severity of the cholinergic salivation response. Another gavage study using doses averaging up to 238 mg/kg-day for 18 weeks (Laham et al., 1985) reported no mortality. In addition, dietary studies using much higher doses of tributyl phosphate, including the following, reported no increased mortality:
• Rats, fed up to 230 mg/kg-day for 10 weeks (Arnold et al., 1997; Bayer, 1996). • Rats, fed up to 423 mg/kg-day for 13 weeks (FMC Corporation, 1985;
Cascieri et al., 1985). • Rats, fed up to 870 mg/kg-day for 10 weeks (Oishi et al., 1980, 1982). • Mice fed up to 1769 mg/kg-day for 13 weeks (Bio/dynamics Inc., 1991a). • Rats fed up to 181.5 mg/kg-day for 2 years (Auletta et al., 1998a). • Female mice fed 711 mg/kg-day for 18 months, although males fed 585 mg/kg-day
exhibited a slight, statistically insignificant increase in mortality (Auletta et al., 1998b).
SUBCHRONIC p-RfD DERIVATION
The subchronic Healy et al. (1995; Bio-Research Laboratories, 1991) rat gavage data demonstrating dose-related increased salivation and deaths is selected as the key study for the subchronic p-RfD. The following potential points of departure (POD) are identified from these data:
• 32.5 mg/kg-day is a LOAEL for occasional salivation. • A BMDL5 of 14.6 mg/kg-day, calculated from the data revealing deaths from
aspiration of saliva among 0/24 male and female rats treated with 32.5 mg/kg-day, 3/24 rats at 100 mg/kg-day, and 7/24 rats at 325 mg/kg-day (see Appendix B). The BMDL10 is not considered as a potential POD because the BMDL10s calculated by all models were greater than the LOAEL (see Table B-1).
Because the mode of action is known, lethality from aspiration of saliva is considered as a surrogate for increased severity of the cholinergic salivation response. Assuming application of the same uncertainty factors (UF) for parameters other than for the POD and rounding to one significant figure, two potential PODs were compared as follows:
• LOAEL of 32.5 mg/kg-day divided by an UFL of 10 = 3.25 mg/kg-day. • BMDL5 of 14.6 mg/kg-day divided by an UFL of 1 = 14.6 mg/kg-day.
Other UFs being equal, the LOAEL of 32.5 mg/kg-day would result in a lower p-RfD and is selected as the POD for deriving a subchronic p-RfD.
A composite UF of 1000 is applied to the LOAEL POD to calculate a subchronic p-RfD as follows:
The composite UF of 1000 is composed of the following:
• An UF of 10 has been applied for extrapolating from a LOAEL to a NOAEL for estimating the POD.
• An UF of 10 has been applied for interspecies extrapolation to account for potential pharmacokinetic and pharmacodynamic differences between rats and humans.
• An UF of 10 for intraspecies differences has been applied to account for potentially susceptible individuals in the absence of information on the variability of response in humans.
• No database uncertainty factor is required. The toxicological database for oral tributyl phosphate included high quality chronic and subchronic bioassays in two species, four developmental toxicity studies in two species, a multigeneration reproduction study, and a subchronic neurotoxicity study. Although there were multigeneration reproductive toxicity data in only one species, available information suggested that systemic maternal toxicity occurred at lower doses than reproductive or developmental effects. Although the critical study (Healy et al., 1995; Bio-Research Laboratories, 1991) demonstrated infrequent effects at the lowest dose tested and a death that apparently was treatment-related occurred at the next higher dose, which was only a factor of 3 higher than the POD dose, other studies (Noda et al., 1994; Bio/dynamics Inc., 1991b) demonstrated higher NOAELs and LOAELs for similar effects. Therefore, it is concluded that additional data are unlikely to result in a lower POD or subchronic p-RfD.
Confidence in the principal study (Healy et al., 1995; Bio-Research Laboratories, 1991) is medium. This was a subchronic oral toxicity study that used 12 animals/gender/dose exposed to a range of doses and measured sensitive endpoints in the species that appeared to be most sensitive. However, it does not identify a NOAEL. Confidence in the database is moderate-to-high. While the animal database contained high quality studies on a variety of endpoints and in multiple species, there were no human data or mechanistic information to determine whether the critical endpoint observed in animal species also is relevant to humans. Confidence in the subchronic p-RfD is, therefore, medium-to-high. CHRONIC p-RfD DERIVATION The 2-year rat bioassay by Auletta et al. (1998a) has been considered as a potential principal study for p-RfD derivation because it identified the lowest chronic LOAEL within the array of animal data. However, the critical effect—urinary bladder hyperplasia—seems likely to be a preneoplastic effect, in light of tumors reported in the same tissue in rats and mice (Auletta et al., 1998a,b). There is uncertainty associated with whether or not this effect is a precursor to tumor formation, and as such, this effect was not chosen for derivation of the p-RfD.
Auletta et al. (1998b) also identified an 18-month NOAEL of 169 mg/kg-day for decreased body-weight gain in mice. The Bio/dynamics Inc. (1991c) developmental study demonstrates a similar 13-day NOAEL of 150 mg/kg-day for weight loss in pregnant rabbits while the Noda et al. (1994) data identify an 11-day NOAEL of 62 mg/kg-day and a LOAEL of 125 mg/kg-day for reduced weight gain in pregnant rats. The only chronic study
FINAL 11-8-2010
30
(Bio/dynamics Inc., 1991b) that demonstrated the subchronic critical effect (cholinergic salivation) identifies a LOAEL of 188 mg/kg-day for that effect. When considering these data in concert with the subchronic data, the subchronic LOAEL of 32.5 mg/kg-day, used as the subchronic POD, also is selected as the POD for deriving the chronic p-RfD.
The subchronic LOAEL of 32.5 mg/kg-day for salivation in male and female rats (Healy et al., 1995; Bio-Research Laboratories, 1991) is used as the POD for calculation of the chronic p-RfD because it is lower than other potential PODs. A composite UF of 3000, as discussed above, is applied to the POD to calculate a chronic p-RfD as follows:
The composite UF of 3000 is composed of the following:
• An UFL of 10 has been applied for using a LOAEL POD. • An UFS of 3 is applied for using subchronic data to derive a chronic p-RfD. The
chronic data demonstrated the salivation effect only at higher doses, and LOAELs for other effects were at similar or higher doses. This suggests that no additional UF would be necessary for application of the subchronic POD. However, a review of the detailed data (Bio-Research Laboratories, 1991, p. B124–131 [tables 67 & 68]) notes a gradual increase in frequency of this effect during the progression of the 13-week study, at the middle and high doses. Although the biology of cholinergic responses suggests it is unlikely for the critical effect to continue to increase in severity, an UF of 3 was applied for using a subchronic POD to derive the chronic p-RfD.
• An UFA of 10 has been applied for interspecies extrapolation to account for potential pharmacokinetic and pharmacodynamic differences between rats and humans.
• An UFH of 10 for intraspecies differences has been applied to account for potentially susceptible individuals in the absence of information on the variability of response in humans.
• No database uncertainty factor is required. The toxicological database for oral tributyl phosphate included high quality chronic and subchronic bioassays in two species, four developmental toxicity studies in two species, a multigeneration reproduction study, and a subchronic neurotoxicity study. Although there were multigeneration reproductive toxicity data in only one species, available information suggested that systemic maternal toxicity occurred at lower doses than reproductive or developmental effects. Although the critical study (Healy et al., 1995; Bio-Research Laboratories, 1991) demonstrated infrequent effects at the lowest dose tested and a death that apparently was treatment-related occurred at the next higher dose, which was only a factor of 3 higher than the POD dose, other studies (Noda et al., 1994; Bio/dynamics Inc., 1991b) demonstrated higher NOAELs and LOAELs for similar effects. Therefore, it is concluded that additional data are unlikely to result in a lower POD or subchronic p-RfD.
FINAL 11-8-2010
31
Confidence in the principal study (Healy et al., 1995; Bio-Research Laboratories, 1991) is medium. This was a subchronic oral toxicity study that used 12 animals/gender/dose exposed to a range of doses and measured sensitive endpoints in the species that appeared to be most sensitive. However, it does not identify a NOAEL. Confidence in the database is medium. While the animal database contained high quality studies on a variety of endpoints and in multiple species, there were no human data or mechanistic information to determine whether the critical endpoint observed in animal species also is relevant to humans. In addition, the critical study was only of subchronic duration. Confidence in the chronic p-RfD is, therefore, medium.
FEASIBILITY OF DERIVING SUBCHRONIC AND CHRONIC PROVISIONAL RfCs FOR TRIBUTYL PHOSPHATE
No human inhalation studies suitable for derivation of subchronic or chronic p-RfCs for tributyl phosphate have been located. Human data were limited to epidemiological studies of workers exposed to mixed compounds, including tributyl phosphate, and animal studies that examined only acute exposure or were inadequately described. Tributyl phosphate has a very low vapor pressure, reported at 25ºC as 4 × 10⁻³ mmHg by NIOSH (2005) and 2.6 × 10⁻⁶ mmHg by OECD (2001). Consequently, inhalation exposures originating from Superfund sites are likely to be low and infrequent.
In the only animal inhalation study identified, Kalinina (1971) reported that rats and
rabbits (number, strain, and gender not specified) exposed to 13.6 mg/m3 of airborne tributyl phosphate 5 hours/day, 5 days/week, for 4 months showed a reduction in cholinesterase activity to 33% after 3 months of exposure. Kalinina (1971) also reported unspecified effects on physiological and biochemical parameters of the liver. Kalinina (1971) reported that cholinesterase activity returned to pretreatment levels in the postexposure period. In the same study, Kalinina (1971) reported exposure to lower concentrations (5.1 mg/m3 for rats and 4.8 mg/m3 for rabbits) for a similar period of time had no effect on cholinesterase activity. No further details of this study were provided. The sketchy inhalation data in rabbits and rats (Kalinina, 1971) are supported by oral data in rats that demonstrated (1) cholinergic responses at 425 mg/kg-day, the lowest dose tested by Oishi et al. (1980), and (2) clinical signs consistent with cholinergic toxicity at doses as low as 32.5 mg/kg-day (Healy et al., 1995; Bio-Research Laboratories, 1991). However, the Kalinina (1971) data were not peer reviewed and available only from a secondary source (Bayer, 1994). In addition, that source did not report particle sizes, animal gender, or strain. The Bayer (1994) source also did not specify whether these data represented cholinesterase activity compared to that found in untreated animals, in treated animals prior to exposure, or in some other benchmark. Because of these reporting deficiencies, the 5 hours/day, 5 days/week, 4-month NOAELs for cholinergic effects of 4.8 mg/m3 in rabbits and 5.1 mg/m3 in rats are not used for derivation of a p-RfC.
Inadequate data are available to attempt to extrapolate an inhalation value using the oral data. Consequently, no p-RfCs are derived.
FINAL 11-8-2010
32
PROVISIONAL CARCINOGENICITY ASSESSMENT FOR TRIBUTYL PHOSPHATE
WEIGHT-OF-EVIDENCE DESCRIPTOR Under the 2005 Guidelines for Carcinogen Risk Assessment (U.S. EPA, 2005), tributyl phosphate is considered “Likely to be Carcinogenic to Humans,” by the oral route of exposure, based on a finding of increased tumor incidence in more than one species, gender, strain, and site. Chronic (24-month) dietary administration of tributyl phosphate at a concentration of 3000 ppm produced statistically significant increased incidences of transitional cell (6/49) or squamous cell (1/49) urinary bladder carcinomas in male rats and of urinary bladder papillomas in male (23/49) and female (11/49) rats (Auletta et al., 1998a). Transitional cell carcinomas also were observed in 2/49 female rats exposed to this dietary concentration, but this incidence was not significantly different from the concurrent control incidence of 0/50. Urinary bladder transitional cell carcinomas are an unusual type of tumor occurring in control male Sprague-Dawley rats at incidences of 1/857 in the testing laboratory and 3/1250 in a breeding laboratory; corresponding female incidences have been reported as 0/779 and 1/1249 (Charles River Laboratories, 1992). The elevated incidences of urinary bladder transitional cell carcinomas in male and female rats are evidence of carcinogenicity due to the rarity of this tumor type. Oral exposure to tributyl phosphate also resulted in an increased incidence of hepatocellular adenomas in male mice exposed to 3500-ppm tributyl phosphate in the diet (Auletta et al., 1998a,b). Numerous short-term tests in both bacterial and mammalian systems have provided no evidence for genotoxic activity of tributyl phosphate. MODE-OF-ACTION DISCUSSION
The EPA (2005) Guidelines for Carcinogen Risk Assessment defines mode of action as a sequence of key events and processes, starting with the interaction of an agent with a cell, proceeding through operational and anatomical changes and resulting in cancer formation. Examples of possible modes of carcinogenic action include mutagenic, mitogenic, antiapoptotic (inhibition of programmed cell death), cytotoxic with reparative cell proliferation and immunologic suppression.
Urinary Bladder Tumors
The mode of action for tributyl phosphate-induced bladder carcinogenesis has not been conclusively identified. Results from short-term in vitro and in vivo genotoxicity tests have been consistently negative. Evidence obtained from a study published by Arnold et al. (1997) provided some support for a hypothesis that carcinogenic responses in the urinary bladder of rats may arise from increased cell proliferative responses to epithelial damage caused by high doses of tributyl phosphate or one of its metabolites. In this study, exposure of male Sprague-Dawley rats for 10 weeks to dietary concentrations of 700 or 3000 ppm of tributyl phosphate (but not 200 ppm) induced increased incidence of urinary bladder hyperplasia that was accompanied, in the more severe cases, by focal necrosis of the epithelium, with erosion, ulceration and hemorrhage into the lumen in some areas (Arnold et al., 1997). Treatments to acidify the urine did not totally inhibit the proliferative response in the bladder epithelium, but it caused the effects of 10-weeks of exposure to 3000 ppm to be less severe (Arnold et al., 1997). Treatments to acidify the urine inhibit the formation of calcium phosphate urinary precipitates (and subsequent urinary bladder hyperplasia) in rats fed high levels of sodium phosphate
FINAL 11-8-2010
33
(Arnold et al., 1997). Microscopic examination of filters used to sieve urine from rats in this study did not show evidence of abnormal precipitate, microcrystals, or calculi, providing evidence that formation of solid material was not the cause of the epithelial necrosis associated with tributyl phosphate exposure (Arnold et al., 1997).
Key Events Based on the limited available data, a hypothetical key event in the mode of action for
tributyl phosphate bladder carcinogenesis may be damage to the bladder epithelial cells, resulting in regenerative hyperplasia and enhanced growth of initiated cells. Cell proliferation is believed to increase tumor formation through one or more of the following mechanisms (Butterworth et al., 1995; Barrett, 1993):
• Increased number of spontaneous initiations occurring during replication. • Inhibition of apoptosis of initiated cells. • Promotion of clonal expansion of initiated cells. • Increased rate of neoplastic progression. • Selective growth advantage of initiated cells. • Reduced time available for DNA repair mechanisms.
Strength, Consistency, Specificity of Association There is abundant information to support an association between tributyl phosphate
exposure and hyperplasia of the urinary bladder epithelium. This association has been observed in both rats and mice in subchronic, chronic, and multigeneration reproductive toxicity studies (FMC Corporation, 1985; Cascieri et al., 1985; Arnold et al., 1997; Bayer, 1996; Laham et al., 1985; Bio/dynamics Inc., 1991a; Auletta et al., 1998a; SOCMA, 1991; Tyl et al., 1997). The data supporting associations between cell toxicity and hyperplasia, and between hyperplasia and neoplasia were more limited. Arnold et al. (1997) reported that the bladders of rats with hyperplasia showed evidence of focal necrosis of the epithelium with erosion, ulceration, and hemorrhage, with dose-related increases in severity. In contrast, another subchronic study in rats did not report evidence of cell toxicity accompanying transitional cell hyperplasia of the bladder (FMC Corporation, 1985; Cascieri et al., 1985). Auletta et al. (1998a) noted that rats with bladder papillomas frequently also had hyperplasia of the bladder, providing limited evidence for a potential link between this key event and tumor formation.
Dose-response Concordance Table 14 shows the dose-response concordance for the available data on key events in
tributyl-phosphate-induced bladder tumors, including cell proliferation, increases in absolute and relative bladder weight, histopathological evidence of hyperplasia, and incidence of bladder tumors in male Sprague-Dawley rats. Overall, the data indicate that evidence of cell proliferation (increased BRdU labeling index), increased bladder weight, and increased tumor formation occurred at dietary concentrations of >3000 ppm and epithelial hyperplasia occurred at dietary concentrations of >700 ppm. Arnold et al. (1997) reported evidence of focal necrosis of the epithelium in the bladders of rats exposed to 700 ppm and higher; however, incidences were not reported. The FMC Corporation (1985; Cascieri et al., 1985) did not report evidence of cell toxicity accompanying transitional cell hyperplasia of the bladder in Sprague-Dawley rats exposed to 1000 or 5000 ppm for 13 weeks. Neither lifetime nor subchronic (10–13 week) exposure of rats to concentrations of 200 ppm induced urinary bladder hyperplasia or urinary
FINAL 11-8-2010
34
Table 14. Dose-Response Concordance of Key Effects in the Urinary Bladder of Male Sprague-Dawley Rats Treated with Tributyl Phosphate in the Diet
Reference Exposure Duration Effect
Dietary Concentration (ppm)
0 200 700 1000 3000 5000 Auletta et al., 1998a
2 years
epithelial hyperplasia (incidence) 3/50 3/50 12/49b NT 17/49c NT papilloma (incidence) 0/50 0/50 2/49 NT 23/49c NT squamous cell carcinoma (incidence) 0/50 0/50 0/49 NT 1/49 NT transitional cell carcinoma (incidence) 0/50 0/50 0/50 NT 6/49d NT
FMC Corporation, 1985; Cascieri et al., 1985
13 weeks transitional cell epithelial hyperplasia (incidence) 0/10 0/10 NT 10/10c NT 10/10c
BRdU labeling index 0.20 ± 0.03 0.34 ± 0.16 0.48 ± 0.12 NT 1.81 ± 0.30d NT Arnold et al., 1997; Bayer, 1996
10 weeks, followed by 10 weeks recovery
simple hyperplasia (incidence) 0/9 NT NT NT 2/8 NT papillary/nodular hyperplasia (incidence) 0/9 NT NT NT 0/8 NT
fibrosis of submucosa (incidence) 0/9 NT NT NT 6/8c NT absolute bladder weight (g) 0.155 ± 0.014 NT NT NT 0.227 ± 0.011b NT bladder/body weight (g/kg) 0.235 ± 0.020 NT NT NT 0.357 ± 0.027b NT BRdU labeling index 0.12 ± 0.02 NT NT NT 0.08 ± 0.01 NT
aMean ± standard error bSignificantly different from control, p < 0.05. cp < 0.01 dArnold et al. (1997) reported that this increase was statistically significant when compared with controls but did not report a p-value. NT = not tested
FINAL 11-8-2010
35
bladder tumors (Arnold et al., 1997; Auletta et al., 1998a; FMC Corporation, 1985), nor was there evidence of cell proliferation after 10 weeks at this concentration (Arnold et al., 1997). Auletta et al., 1998a described 200 ppm (9 and 12 mg/kg-day in male and female rats, respectively) as a “NOEL for chronic toxicity”, and 700 ppm (33 and 42 mg/kg-day in male and female rats, respectively) as a “clear threshold” for oncogenic effects However, Tyl (1997; SOCMA, 1991) reported bladder hyperplasia in 1/10 weanling male rats (see Table 9) following maternal dietary exposure to 100 ppm (10 mg/kg-day).
Temporal Relationships Studies of subchronic duration (10–13 weeks) have shown evidence of bladder epithelial
cell hyperplasia (Arnold et al., 1997; Bayer, 1996; FMC Corporation, 1985) without tumor formation, indicating that hyperplasia may be a precursor to neoplastic growth. Arnold et al. (1997) showed that tributyl phosphate-induced urinary bladder hyperplasia was reversible upon withdrawal of the treatment compound. No urinary bladder epithelial hyperplasia was evident in rats exposed to 3000 ppm of tributyl phosphate for 10 weeks, followed by a 10-week unexposed recovery period, although hyperplasia was evident in all rats exposed to the same concentration for 10 weeks and examined upon treatment termination. However, 6/8 rats in the treated/recovery group showed fibrosis of the submucosa, compared with 0/9 in the control group. Arnold et al. (1997) attributed the fibrosis to scarring, providing further evidence for the role of cell toxicity in the induction of hyperplasia.
Biological Plausibility and Coherence Dibutyl hydrogen phosphate, one of the major metabolites of tributyl phosphate in rats
(Suzuki et al., 1984), has been shown to produce similar regenerative hyperplasia of the urinary bladder in rats (Chemicals Investigation Promoting Committee, 1995), providing potential support for the hypothesized mode of action.
Conclusions The key events in the hypothesized mode of action of tributyl phosphate-induced bladder
neoplasms have not been well established, although available data suggest that tributyl phosphate may induce regenerative cell proliferation in response to epithelial damage in the bladders of rats. It is possible that tributyl phosphate could induce cancer in either rodents or humans by a mode of action not associated with regenerative cell proliferation. Hepatocellular Adenomas Very little information is available on the potential mode of action by which tributyl phosphate increases the incidence of liver tumors in male mice. Only two studies were available in mice: a subchronic toxicity study (Bio/dynamics Inc., 1991a) and the chronic bioassay that reported an increased incidence of hepatocellular adenomas in male CD-1 mice exposed to 3000-ppm tributyl phosphate for 18 months (Auletta et al., 1998b). No mechanistic studies examining this endpoint were located. The subchronic study reported increased absolute and relative liver weights and an increased incidence of centrilobular hepatocyte hypertrophy at dietary concentrations of 2000 ppm and higher, as well as increases in circulating liver enzymes at 8000 ppm (Bio/dynamics Inc., 1991a). The chronic study (Auletta et al., 1998b) reported increased absolute and relative liver weights at >1000 ppm and increased hepatocellular adenomas at 3000 ppm, but it did not observe an increased incidence of hepatocyte hypertrophy, though liver enzymes were not analyzed. Auletta et al. (1998b) attributed the lack of
FINAL 11-8-2010
36
hypertrophy to the development of tolerance to chronic tributyl phosphate administration. These limited data are inadequate for outlining the potential key events in the mode of action for tributyl phosphate-induced hepatocellular adenomas. QUANTITATIVE ESTIMATES OF CARCINOGENIC RISK Oral Exposure
Oral data are sufficient to derive a quantitative estimate of cancer risk from tributyl phosphate; this derivation is shown below. The urinary bladder response in male Sprague-Dawley rats (Auletta et al., 1998a) is the basis of the dose-response analysis because (1) it is the most pronounced carcinogenic response (e.g., compared with the liver tumor response in male mice) and (2) the mechanistic understanding is inadequate to explain species differences in tumorigenic responses to tributyl phosphate or to determine which laboratory animal species is a better model for humans. The mode of action for bladder tumors produced by tributyl phosphate in Sprague-Dawley rats has not been fully elucidated. Available data suggest that development of these tumors may be related to induction of regenerative cell proliferation in response to epithelial damage. Although the available data do not suggest mutagenic action of tributyl phosphate, no alternative mode of action has been sufficiently characterized. Therefore, a linear low-dose extrapolation is conducted.
Table 15 shows the dose-response data used in the quantitative cancer assessment. First, the animal doses in the Auletta et al. (1998a) rat study are converted to human equivalent doses (HEDs) by adjusting for differences in the body weights between humans and rats. In accordance with EPA (2005), a factor of BW3/4 is used for cross-species scaling. Because the test chemical was administered in the diet ad libitum for 2 years, no adjustment for discontinuous exposure or less-than-lifetime administration is necessary. The equation used to calculate the HEDs is shown below and Table 15 presents the HEDs.
HED = Dose × (W ÷70 kg)1/4 where Dose = average daily animal dose W = reference rat body weight for chronic study (0.523 kg) (U.S. EPA, 1988)
70 kg = reference human body weight (U.S. EPA, 1988)
Table 15. Dose-Response Data for Bladder Tumors in Male Ratsa Animal Dose (mg/kg-day)
Human Equivalent Dose (mg/kg-day)
Total Incidence of Bladder Neoplasiab
0 0 0/50 8.9 2.62 0/50
32.5 9.56 2/49 143.3 42.13 30/49
aAuletta et al., 1998a bCombined incidence of transitional cell and squamous cell carcinomas, and papillomas.
FINAL 11-8-2010
37
The dose-response data in Table 15 are modeled to obtain a POD for a quantitative assessment of cancer risk. The POD is an estimated dose, expressed in human-equivalent terms, near the lower end of the observed range that marks the starting point for extrapolation to lower doses. Appendix A provides details of the modeling effort. The multistage (2-degree polynomial) model provides adequate fit to the data and calculates the lower BMDL10HED of the best fitting models. The BMD10HED and BMDL10HED predictions by the multistage model for the bladder tumor data are 14 and 11 mg/kg-day, respectively. The BMDL10HED for bladder tumors (11 mg/kg-day) is used as the POD for the p-OSF. The p-OSF of 0.009 or 9 × 10⁻³ (mg/kg-day)-1 is calculated by dividing 0.1 (10%) by the BMDL10HED of 11 mg/kg-day. Inhalation Exposure No inhalation quantitative estimate (p-IUR) is derived because there were no carcinogenicity data from inhalation exposure studies and no PBPK models for tributyl phosphate in rats and humans that would facilitate extrapolation across routes of exposure.
REFERENCES
ACGIH (American Conference of Governmental Industrial Hygienists). 2001. Tributyl phosphate. In: Documentation of the Threshold Limit Values for Chemical Substances, 7th edition. ACGIH, Cincinnati, OH. ACGIH (American Conference of Governmental Industrial Hygienists). 2007. TLVs® and BEIs®: Threshold Limit Values for Chemical Substances and Physical Agents, Biological Exposure Indices. ACGIH, Cincinnati, OH. Arnold, L.L., W.R. Christenson, M. Cano et al. 1997. Tributyl phosphate effects on urine and bladder epithelium in male Sprague-Dawley rats. Fund. Appl. Toxicol. 40:247–255. ATSDR (Agency for Toxic Substances and Disease Registry). 2008. Toxicological Profile Information Sheet. U.S. Department of Health and Human Services, Public Health Service, Atlanta, GA. Accessed online, September 2008: www.atsdr.cdc.gov/toxpro2.html. Auletta, C.S., M. L. Weiner and W.R. Richter. 1998a. A dietary toxicity/oncogenicity study of tributyl phosphate in the rat. Toxicology. 128:125–134. Auletta, C.S., L.A. Kotkoskie, T. Saulog et al. 1998b. A dietary toxicity/oncogenicity study of tributyl phosphate in the CD-1 mouse. Toxicology. 128:135–141. Barrett, J.C. 1993. Mechanisms of multistep carcinogenesis and carcinogen risk assessment. Environ. Health Perspect. 100:9–20. Bayer, A.G. 1985. Tributylphosphate. Salmonella/mikrosomen-test zur untersuching auf punktmutagene wirking. Submitted by Mobay Chemical Corporation under TSCA 8(d). OTS Fiche # OTS0510287.
FINAL 11-8-2010
38
Bayer. 1994. Summary report of tributyl phosphate with cover letter dated 2/16/94. Submitted by Miles, Inc., under TSCA 8(d). Bayer Corporation, Stilwell Kansas. OTS Fiche # OTS0556718. Bayer. 1996. A special subchronic dietary study to examine the mechanism of urinary bladder carcinogenesis in the rat (Amended report), with cover letter dated 7/8/96. Submitted by Synthetic Organic Chemical Manufacturers Association under TSCA 8(d). Bayer Corporation, Stilwell Kansas. OTS Fiche # OTS0558698. Bio/dynamics Inc. 1990. A four-week range-finding study of tributyl phosphate in the mouse via dietary administration (Final report). Submitted by Synthetic Organic Chemical Manufacturers Association under TSCA 8(e). OTS Fiche # OTS0526409-2. Bio/dynamics Inc. 1991a. A 90-day dietary study of tributyl phosphate in the mouse (Final report). Submitted by Synthetic Organic Chemical Manufacturers Association under TSCA Section 4. OTS Fiche # OTS0534083. Bio/dynamics Inc. 1991b. A developmental toxicity study in rats with tributyl phosphate (Final Report). Submitted by Synthetic Organic Chemical Manufacturers Association under TSCA Section 8(e). OTS Fiche # OTS0526409-5. Bio/dynamics Inc. 1991c. A developmental toxicity study in rabbits with tributyl phosphate (Final Report). Submitted by Synthetic Organic Chemical Manufacturers Association under TSCA Section 4. OTS Fiche # OTS0529398. Bio-Research Laboratories. 1991. A 3-month study of the potential effects of orally administered tributyl phosphate on behavior and neuromorphology in rats. Submitted by Synthetic Organic Chemical Manufacturers Association under TSCA Section 4. OTS Fiche # OTS0529399. Bisesi, M.S. 2001. Esters of carbonic and orthocarbonic acid, organic phosphorus, monocarboxylic halogenated acids, haloalcohols, and organic silicon. In: Patty's Toxicology. Volume 6, 5th ed., E. Bingham, B. Cohrssen and C.H. Powell, Ed. John Wiley and Sons, Inc., New York. p. 933–961. Butterworth, B.E., R.B. Conolly and K.T. Morgan. 1995. A strategy for establishing mode of action of chemical carcinogens as a guide for approaches to risk assessments. Canc. Lett. 93:129–146. Carrington, C.D., D.M. Lapadula, M. Othman et al. 1990. Assessment of delayed neurotoxicity of tributyl phosphate, tributoxyethyl phosphate, and dibutylphenyl phosphate. Toxicol. Ind. Health. 6:415–423. Cascieri, T., E.J. Ballester, L.R. Seaman, R.F. McConnell, J.W. Thackara and M.J. Fletcher. 1985. Subchronic toxicity study with tributyl phosphate in rats. Toxicologist. 5:97.
FINAL 11-8-2010
39
Charles River Laboratories. 1992. Spontaneous neoplastic lesions and selected nonneoplastic lesions in the Crl:CD BR rat (19 groups). Charles River Laboratories, Kingston NY (Cited in Auletta et al., 1998a). Chemicals Investigation Promoting Committee. 1995. Office of Environmental Chemical Safety, Environmental Health Bureau, Ministry of Health and Welfare, Japan. Toxicity Testing Reports of Environmental Chemicals - Dibutyl Phosphate (CAS No. 107-66-4). 2:55–58. (Cited in Auletta et al., 1998a). Costa, L.G. 2008. Toxic Effects of Pesticides. In: Casarett & Doull’s Toxicology, 7th ed., C.D. Klaassen, Ed. McGraw-Hill Companies, Inc., New York. p. 890–892. Dave, G. and U. Lidman. 1978. Range-finding acute toxicity in the rainbow trout and in the rat. Hydrometallurgy 3:201–216. Cited in WHO, 1991. Eastman Kodak. 1986. Summary of tributyl phosphate testing for acute toxicity, skin irritation, eye irritation and dermal sensitivity. Submitted to US EPA, Office of Toxic Substances, Washington DC) (TSCA 8(d) 062684(2)). Cited in WHO, 1991. Eaton D.L. and S.G. Gilbert. 2008. Principles of toxicology. In: Casarett & Doull’s Toxicology, 7th ed., C.D. Klaassen, Ed. McGraw-Hill Companies, Inc., New York. p.11–43. Eller, H. 1937. [The toxicology of technical plasticizers: Dissertation]. University of Würzburg (in German; cited in WHO 1991). FMC Corporation. 1985. Thirteen week feeding study of tributyl phosphate in rats. FMC Study No. I82-705. Final Report. Volume I and II. April 2. OTS Fiche # OTS0510254. Section 8D. Gafieva, Z.A. and V.A. Chudin. 1986. Evaluation of the mutagenic activity of tributyl phosphate on Salmonella typhimurium. Gig. Sanit. 9:81. (Russian). Gallo, M.A. and N.J. Lawryk. 1991. Organic phosphorus pesticides. In: Handbook of Pesticide Toxicology. W.J. Hayes and E.R. Laws, Ed. Academic Press, San Diego. p. 917–1123. Hanna, P. and K.F. Dyer. 1975. Mutagenicity of organophosphorus compounds in bacteria and drosophila. Mutat. Res. 28:405–420. Healy, C.E., P.C. Beyrouty and B.R. Broxup. 1995. Acute and subchronic neurotoxicity studies with tri-n-butyl phosphate in adult Sprague-Dawley rats. Am. Ind. Hyg. Assoc. J. 56:349–355. IARC (International Agency for Research on Cancer). 2008. Search IARC Monographs. Accessed online, September 2008: http://monographs.iarc.fr/ENG/Monographs/allmonos90.php. Johannsen, F.R., P.L. Wright, D.E. Gordon, G.J. Levinskas, R.W. Radue and P.R. Graham. 1977. Evaluation of delayed neurotoxicity and dose-response relationships of phosphate esters in the adult hen. Toxicol. Appl. Pharmacol. 41:291–304.
FINAL 11-8-2010
40
Kalinina, N.I. 1971. [Toxicity of Phosphoroorganic platificators tributyl phosphate and di(2-ethylhexyl) phenyl phosphate.] Gig. Tr. Prof. Zabol. 15(8):30–33. (Russian) (Cited in Bayer, 1994). Keegan, T.J., Walker, S.A.S., C. Brooks et al. 2009. Exposures Recorded for Participants in the UK Chemical Warfare Agent Human Research Programme, 1941–1989. Ann. Occup. Hyg. 53:83–97. Laham, S., J. Szabo and G. Long. 1983. Effects of tri-n-butyl phosphate on the peripheral nervous system of the Sprague-Dawley rat. Drug Chem. Toxicol. 6:363–377. Laham, S. and G. Long. 1984. Subacute oral toxicity of tri-n-butyl phosphate in the Sprague-Dawley rat. J. Appl. Toxicol. 4:150–154. Laham, S., G. Long and B. Broxup. 1985. Induction of urinary bladder hyperplasia in Sprague-Dawley rats orally administered tri-n-butyl phosphate. Arch. Environ. Health. 40:301–306. Lotti, M. 2001. Clinical toxicology of anticholinesterases in humans. In: Handbook of Pesticide Toxicology, 2nd ed. R. Krieger, Ed. Academic Press, San Diego. p. 1043–1085. Mandel, J.S., N.T. Berlinger, N. Kay et al. 1989. Organophosphate exposure inhibits non-specific esterase staining in human blood monocytes. Am. J. Ind. Med. 15:207–212. Microbiological Associates. 1977. Activity of C-8013-132-5 in the Salmonella microsomal assay for bacterial mutagenicity. Submitted by FMC Corporation under TSCA Section 4. OTS Fiche # OTS0523054. Microbiological Associates. 1990a. CHO/HGPRT mutation assay with tributyl phosphate (Final report). TSCA Section 4 Submission. OTS Fiche # OTS0528320. Microbiological Associates. 1990b. Chromosome aberrations in Chinese Hamster ovary (CHO) cells with tributyl phosphate (Final report). TSCA Section 4 Submission. OTS Fiche # OTS0528320. Microbiological Associates. 1990c. Acute in vivo cytogenetics assay in rats (Final report). TSCA Section 4 Submission. OTS Fiche # OTS0534089. Mitomo, T., T. Ito, Y. Ueno et al. 1980. Toxicological studies on tributyl phosphate. (I) Acute and subacute toxicities. J. Toxicol. Sci. 5:270–271. NIOSH (National Institute for Occupational Safety and Health). 2005. Tributyl phosphate. In: NIOSH Pocket Guide to Chemical Hazards. Accessed online, September 2008: http://cdc.gov/niosh/npg/npgd0625.html. Noda, T., Y. Yamano, M. Shimizu et al. 1994. Effects of tri-n-butyl phosphate on pregnancy in rats. Food Chem. Toxicol. 32(11):1031–1036.
FINAL 11-8-2010
41
NTP (National Toxicology Program). 2008. Management Status Report. Accessed online, September 2008: http://ntp-server.niehs.nih.gov/. OECD (Organization for Economic Cooperation and Development). 2001. SIDS Initial Assessment Report for 12th SIAM – Tributyl Phosphate, CAS No. 126-73-8. March 2002, United Nations Environment Program Publications, Paris. Accessed online, September 2008: http://www.inchem.org/documents/sids/sids/126-73-8.pdf. Oishi H., S. Oishi and K. Hiraga. 1980. Toxicity of tri-n-butyl phosphate, with special reference to organ weights, serum components and cholinesterase activity in male rats. Toxicol. Lett. 6:81–85. Oishi H., S. Oishi and K. Hiraga. 1982. Toxicity of several phosphoric acid esters in rats. Toxicol. Lett. 13:29–34. OSHA (Occupational Safety and Health Administration). 2008. OSHA Standard 1910.1000 for Air Contaminants. Part Z, Toxic and Hazardous Substances. Accessed online, September 2008: http://www.osha.gov/pls/oshaweb/owadisp.show_document?p_table=STANDARDS&p_id=9991. Reape III, M.J. 1982. Neurological health impact on workers with chronic low dose exposure to aryl phosphates. Ph.D. Thesis submitted to University of Minnesota. Rhone-Poulenc. 1992. MRID No. 423730-01; HED Doc. No. 0010459. Rhone-Poulenc Ag Company. Available from EPA, Washington, DC 20460. Cited in US EPA, 1993. Salovsky, P., V. Shopova and V. Dancheva. 1998. Antioxidant defense mechanisms in the lung toxicity of tri-n-butyl phosphate. Am. J. Ind. Med. 33:11–15. SOCMA (Synthetic Organic Chemical Manufacturers Association). 1991. Follow-up to Notice of Substantial Risk under TSCA 8(e) for tributyl phosphate (TBP) when administered in the diet to rats in a range-finding reproductive effects study. TSCA Section 4 Submission. OTS Fiche # OTS0529391. Suzuki, T., K. Sasaki, M. Takeda et al. 1984. Metabolism of tributyl phosphate in male rats. J. Agric. Food. Chem. 32:603–610. Tyl, R.W., J.M. Gerhart, C.B. Meyers et al. 1997. Two-generation reproductive toxicity study of dietary tributyl phosphate in CD rats. Fund. Appl. Toxicol. 40:90–100. U.S. EPA. 1988. Recommendations for and Documentation of Biological Values for Use in Risk Assessment. Prepared by Office of Health and Environmental Assessment, Environmental Criteria and Assessment Office, Cincinnati, OH for the Office of Solid Waste and Emergency Response, Washington, DC. EPA/600/6-87/008. PB88-179874. Accessed online, September 2008: http://cfpub.epa.gov/ncea/cfm/recordisplay.cfm?deid=34855.
FINAL 11-8-2010
42
U.S. EPA. 1991. Chemical Assessments and Related Activities (CARA). Office of Health and Environmental Assessment, Washington, DC. April. U.S. EPA. 1993. Aldicarb. Integrated Risk Information System (IRIS). Office of Research and Development, National Center for Environmental Assessment, Washington, DC. Accessed online, September 2008: http://www.epa.gov/ncea/iris/subst/0003.htm. U.S. EPA. 1994. Chemical Assessments and Related Activities (CARA). Office of Health and Environmental Assessment, Washington, DC. December. U.S. EPA. 1997. Health Effects Assessment Summary Tables (HEAST). FY-1997 Update. Prepared by the Office of Research and Development, National Center for Environmental Assessment, Cincinnati, OH, for the Office of Emergency and Remedial Response, Washington, DC. July. EPA/540/R-97/036. NTIS PB 97-921199. U.S. EPA. 2000. Benchmark Dose Technical Guidance Document [external review draft]. EPA/630/R-00/001. Accessed online, September 2008: http://www.epa.gov/nceawww1/pdfs/bmds/BMD-External_10_13_2000.pdf. U.S. EPA. 2005. Guidelines for Carcinogen Risk Assessment. Risk Assessment Forum, Washington, DC. EPA/630/P-03/001F. Accessed online, September 2008: http://cfpub.epa.gov/ncea/raf/recordisplay.cfm?deid=116283. U.S. EPA. 2006. Drinking Water Standards and Health Advisories. Office of Water, Washington, DC. Summer 2006. Accessed online, September 2008: http://www.epa.gov/waterscience/criteria/drinking/dwstandards.pdf. U.S. EPA. 2008. Integrated Risk Information System (IRIS). Online. Office of Research and Development, National Center for Environmental Assessment, Washington, DC. Accessed online, September 2008: http://cfpub.epa.gov/ncea/iris/index.cfm?fuseaction=iris.showSubstanceList. Union Carbide. 1971. MRID No. 00101911; HED Doc. No. 010450. Union Carbide Corporation. Available from EPA, Washington, DC 20460. Cited in US EPA, 1993. WHO (World Health Organization). 1991. Tri-n-butyl Phosphate. Environmental Health Criteria 112. Geneva, Switzerland. Accessed online, September 2008: http://www.inchem.org/documents/ehc/ehc/ehc112.htm.
FINAL 11-8-2010
43
APPENDIX A. DETAILS OF BENCHMARK DOSE MODELING FOR ORAL SLOPE FACTOR
The preferred multistage cancer model in the EPA BMDS (version 1.4.1b) is fit to the dichotomous incidence data using the extra risk option. The multistage cancer model is run for all polynomial degrees up to n-1, where n is the number of dose groups including control; the lowest degree polynomial providing adequate fit for comparison is used with the other models, per EPA (2000) guidance. In accordance with EPA (2000) guidance, the benchmark doses (BMDs) and lower bounds on the BMD (BMDLs) associated with an extra risk of 10% for all models are calculated.
Table 15 shows the dose-response data for total neoplasms of the urinary bladder in male rats (Auletta et al., 1998a). The incidence and human-equivalent dose data are modeled according the procedure outlined above. As assessed by the χ2 goodness-of-fit test, the 2- and 3-degree polynomial multistage models in the software provide adequate fits to the data for the incidence of bladder tumors in male rats (χ2 p > 0.1) (see Table A-1). The multistage (2-degree polynomial) model is used because it provides adequate fit to the data with the lowest degree polynomial. Figure A-1 shows the fit of this multistage model to the data.
Table A-1. Multistage Cancer Model Predictions for Bladder Tumors in Male Ratsa
Multistage (degree = 3)b 3 0.15 0.9273 86.4344 15.51 10.93 aAuletta et al., 1998a bDegree of polynomial initially set to (n-1) where n = number of dose groups including control. Betas restricted to >0.
FINAL 11-8-2010
44
0
0.1
0.2
0.3
0.4
0.5
0.6
0.7
0 10 20 30 40
Frac
tion
Affe
cted
dose
Multistage Model with 0.95 Confidence Level
20:37 07/22 2007
BMDBMDL
Multistage
Dose
Figure A-1. Fit of Multistage (2-Degree) Model to Data on Bladder Tumors in Male Rats
FINAL 11-8-2010
45
APPENDIX B. DETAILS OF BENCHMARK DOSE MODELING FOR RAT LETHALITY
The model-fitting procedure for dichotomous data is as follows. All available dichotomous models in the EPA BMDS (version 1.4.1b) are fit to the incidence data using the extra risk option. The multistage model is run for all polynomial degrees up to n - 1 (where n is the number of dose groups including controls); the lowest degree polynomial providing adequate fit is used for comparison with the other models, per EPA (2000) guidance. Goodness-of-fit is assessed by the χ2 test. When several models provide adequate fit to the data (χ2 p > 0.1), models usually are compared using the Akaike Information Criterion (AIC). The model with the lowest AIC would be considered to provide the best fit to the data. When several models have similar AICs, the model resulting in the lowest BMDL is selected. Because, in this instance, lethality data is being modeled, benchmark doses (BMDs), and lower bounds on the BMD (BMDLs) associated with an extra risk of 5% and 10% are calculated for all models.
The Healy et al. (1995; Bio-Research Laboratories, 1991) rat lethality data are modeled according to the procedure outlined above. As assessed by the χ2 goodness-of-fit test, all models in the software provide adequate fits to the data for the incidence of lethality in male and female rats (χ2 p > 0.1) (see Table B-1). The Probit model using log-scaled dose data, is chosen because it is most commonly used for analyzing lethality data (Eaton and Gilbert, 2008), and it provides the lowest scaled residual at the lowest tested dose. Figure B-1 shows the fit of this model to the data.
FINAL 11-8-2010
46
Table B-1. Benchmark Dose Modeling Summary Data for Deaths Among Male and Female Rats Treated 7 Days/Week via Gavage with Tributyl Phosphatea,b