53
Prysmian Group Company Presentation March 2017
| Date post: | 15-Apr-2018 |
| Category: |
Documents |
| Upload: | truongminh |
| View: | 221 times |
| Download: | 2 times |

Prysmian Group Company Presentation
March 2017

Agenda
Company Presentation – March 2017 2
Group overview
Results by business
Financial Results
Appendix

Company Presentation – March 2017 3
Energy Projects
36%
E&I 22%
Industrial & Netw.Comp.
18%
Oil&Gas 1%
Telecom 23%
Energy Projects
22%
E&I 40%
Industrial & Netw.Comp.
18%
Other 1%
Oil&Gas 4%
Telecom 15%
Prysmian group at a glance FY 2016 Financial Results
Sales breakdown by business Sales breakdown by geography
€ 7,567m
Energy Products
59%
EMEA
67% North America
14%
Latin America
6%
APAC
13%
€ 7,567m
Adj. EBITDA by business Adj. EBITDA margin
Energy Products
40%
€ 711m
15.9%
5.1%
9.5%
2.7%
14.0%
9.4%
Energy Projects
E&I Industrial& Netw.Comp.
Telecom Total Oil&Gas
Company Presentation – March 2017 4
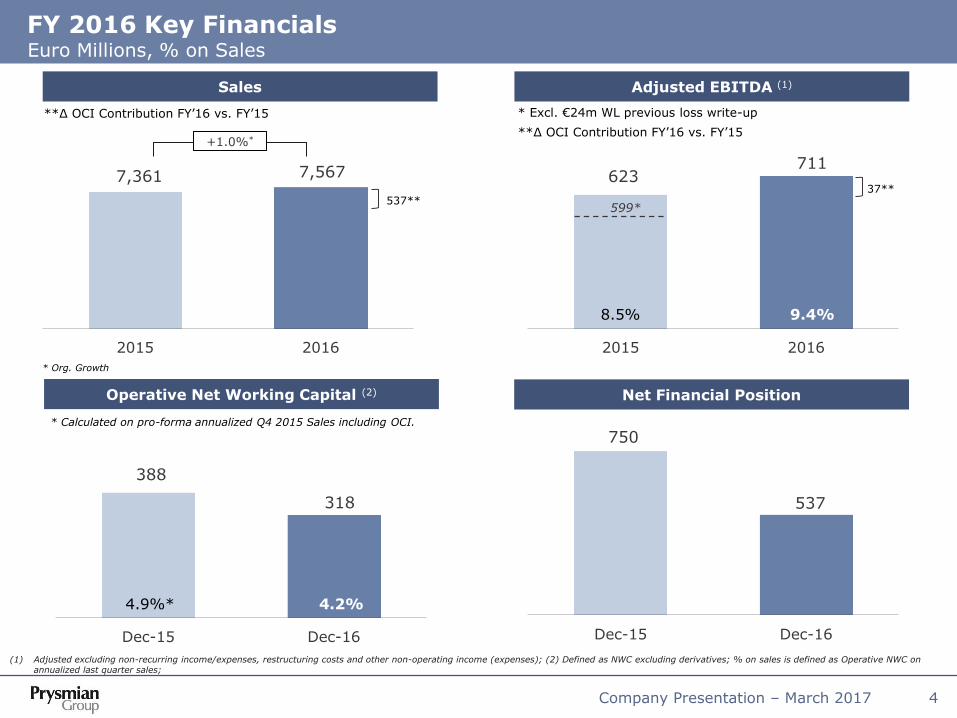
623 711
2015 2016
FY 2016 Key Financials Euro Millions, % on Sales
Sales Adjusted EBITDA (1)
Operative Net Working Capital (2) Net Financial Position
388
318
Dec-15 Dec-16
750
537
Dec-15 Dec-16
(1) Adjusted excluding non-recurring income/expenses, restructuring costs and other non-operating income (expenses); (2) Defined as NWC excluding derivatives; % on sales is defined as Operative NWC on annualized last quarter sales;
* Calculated on pro-forma annualized Q4 2015 Sales including OCI.
**∆ OCI Contribution FY’16 vs. FY’15
**∆ OCI Contribution FY’16 vs. FY’15 * Excl. €24m WL previous loss write-up
* Org. Growth
7,361 7,567
2015 2016
+1.0%*
537**
8.5% 9.4%
37**
4.9%* 4.2%
599*
Company Presentation – March 2017 5
221
260
128
154
122 127
16 8
134
163
15.6% 15.9%
4.6% 5.1% 8.1%
9.5%
3.8% 2.7%
12.1% 14.0% 8.5% 9.4%
Continued profitability improvement
FY’15 FY’16
Energy Projects
Underlying margin increase in all business excluding Oil&Gas
Oil&Gas Industrial & NWC.
Telecom Total
Ad
j. E
BITD
A (
€ m
illio
n) /
% O
rg
. G
ro
wth
E&I
+18.5% -3.1% -4.6% -29.3% +8.5%
Ad
j. E
BIT
DA
Marg
in
+1.0%
Energy Projects Oil&Gas
Industrial & NWC. Telecom Total E&I
FY’15 FY’16
±X.X% = Organic Growth
* Excl. €24m WL previous loss write-up
37**
**∆ OCI Contribution FY’16 vs. FY’15
37**
197*
~14%*
* Excl. €24m WL provision write-up
599*
8.1%*
711
623
14.7%**
** Excl. €8m bad debt provision

Agenda
Company Presentation – March 2017 6
Group overview
Results by business
Financial Results
Appendix
Company Presentation – March 2017 7
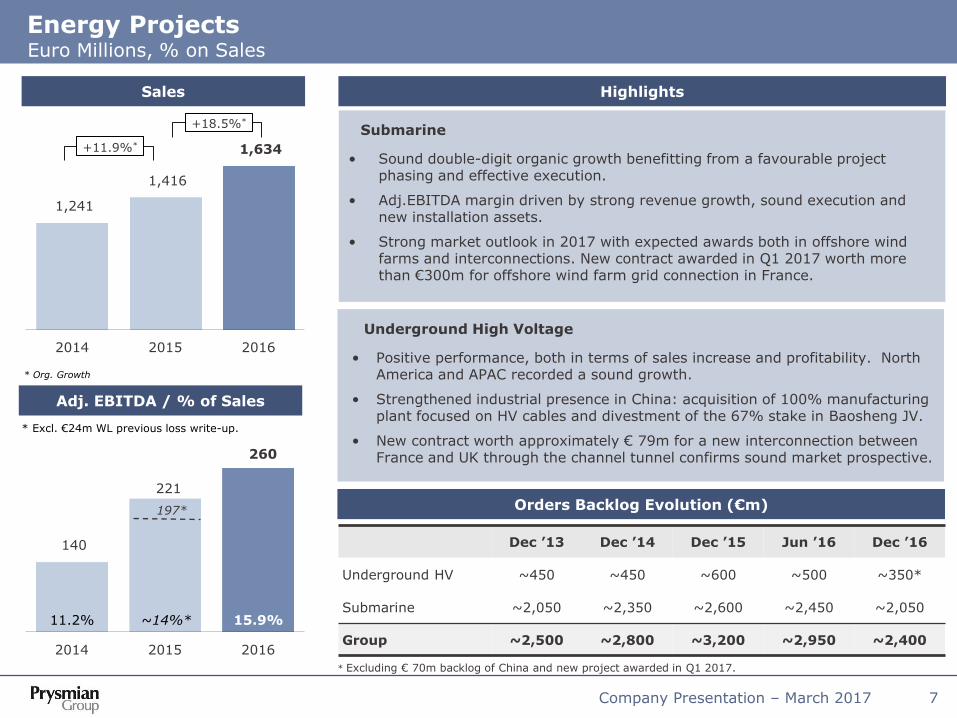
Energy Projects Euro Millions, % on Sales
Sales
Adj. EBITDA / % of Sales
Highlights
Orders Backlog Evolution (€m)
Dec ’13 Dec ’14 Dec ’15 Jun ’16 Dec ’16
Underground HV ~450 ~450 ~600 ~500 ~350*
Submarine ~2,050 ~2,350 ~2,600 ~2,450 ~2,050
Group ~2,500 ~2,800 ~3,200 ~2,950 ~2,400
Submarine
• Sound double-digit organic growth benefitting from a favourable project phasing and effective execution.
• Adj.EBITDA margin driven by strong revenue growth, sound execution and new installation assets.
• Strong market outlook in 2017 with expected awards both in offshore wind farms and interconnections. New contract awarded in Q1 2017 worth more than €300m for offshore wind farm grid connection in France.
Underground High Voltage
• Positive performance, both in terms of sales increase and profitability. North America and APAC recorded a sound growth.
• Strengthened industrial presence in China: acquisition of 100% manufacturing plant focused on HV cables and divestment of the 67% stake in Baosheng JV.
• New contract worth approximately € 79m for a new interconnection between France and UK through the channel tunnel confirms sound market prospective.
1,241
1,416
1,634
2014 2015 2016
* Org. Growth
+18.5%*
140
221
260
2014 2015 2016
11.2% ~14%* 15.9%
* Excl. €24m WL previous loss write-up.
+11.9%*
197*
* Excluding € 70m backlog of China and new project awarded in Q1 2017.
Company Presentation – March 2017 8
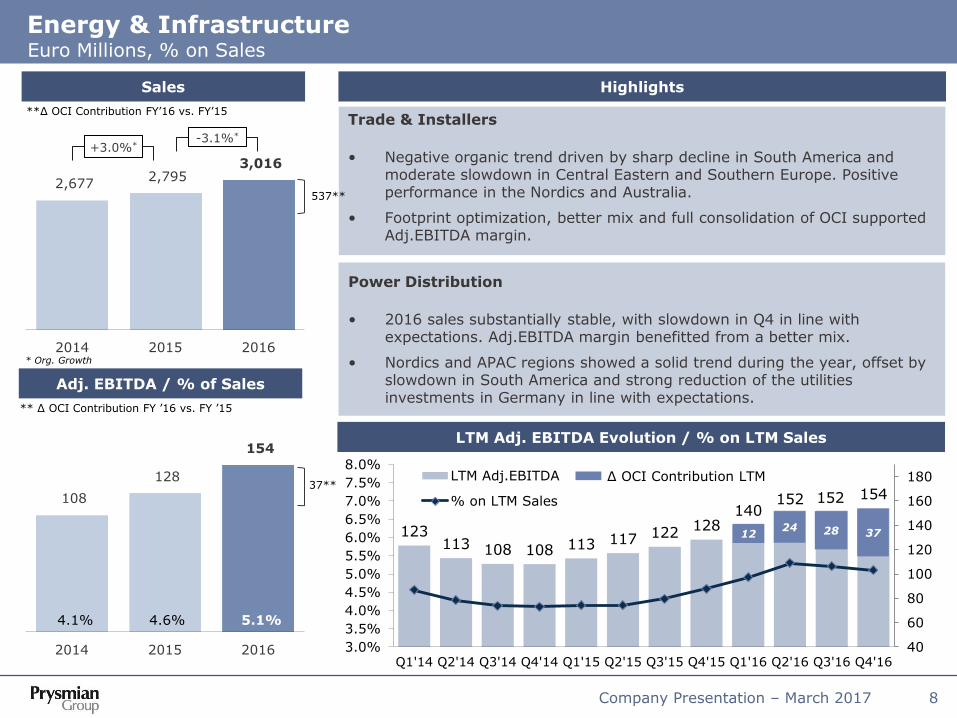
Energy & Infrastructure Euro Millions, % on Sales
Sales
Adj. EBITDA / % of Sales
Highlights
LTM Adj. EBITDA Evolution / % on LTM Sales
123 113 108 108 113 117 122
128 140
152 152 154
40
60
80
100
120
140
160
180
3.0%
3.5%
4.0%
4.5%
5.0%
5.5%
6.0%
6.5%
7.0%
7.5%
8.0%
Q1'14 Q2'14 Q3'14 Q4'14 Q1'15 Q2'15 Q3'15 Q4'15 Q1'16 Q2'16 Q3'16 Q4'16
LTM Adj.EBITDA
% on LTM Sales
24
∆ OCI Contribution LTM
12
2,677 2,795
3,016
2014 2015 2016* Org. Growth
-3.1%*
**∆ OCI Contribution FY’16 vs. FY’15
108
128
154
2014 2015 2016
4.1% 4.6% 5.1%
** ∆ OCI Contribution FY ’16 vs. FY ’15
37**
28 37
+3.0%*
Trade & Installers
• Negative organic trend driven by sharp decline in South America and moderate slowdown in Central Eastern and Southern Europe. Positive performance in the Nordics and Australia.
• Footprint optimization, better mix and full consolidation of OCI supported Adj.EBITDA margin.
Power Distribution
• 2016 sales substantially stable, with slowdown in Q4 in line with expectations. Adj.EBITDA margin benefitted from a better mix.
• Nordics and APAC regions showed a solid trend during the year, offset by slowdown in South America and strong reduction of the utilities investments in Germany in line with expectations.
537**

Company Presentation – March 2017 9
Industrial & Network Components Euro Millions, % on Sales
Highlights Sales
Adj. EBITDA / % of Sales
Specialties, OEMs & Renewables
• Mid single digit organic decline, due to slowdown in Renewables segment (mainly China) and volume drop in Mining, Nuclear and Railway, partially offset by the strong performance in Defense and Marine.
• Sound results in North America; general weakness in Europe, Turkey and Argentina.
• Profitability sustained by favourable product and country mix.
Elevator
• Sound growth driven by a solid performance in North America and EMEA, partially offset by weakening trend in China.
• Increasing penetration in after market products and services supported margin growth.
Automotive
• Stable volume with better margin benefitting from re-footprint in Europe and favourable product mix. Solid market demand in APAC compensated the weakness of Latin America.
Network Components
• Sound performance in HV and Extra HV supported by footprint optimization in Europe and China and the launch of new products.
• Soft demand in MV and LV accessories in Europe, offset by good performance in North America and APAC.
1,440 1,499
1,343
2014 2015 2016* Org. Growth
-4.6%*
115
122
127
2014 2015 2016
8.0% 8.1% 9.5%
-0.8%*
Company Presentation – March 2017 10
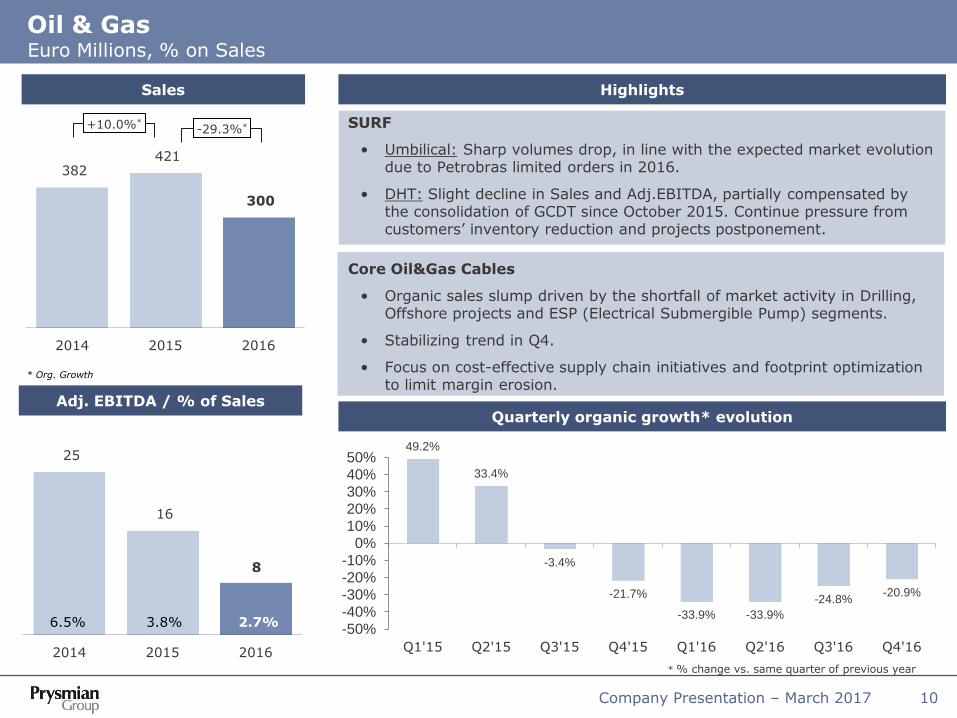
Oil & Gas Euro Millions, % on Sales
Sales
Adj. EBITDA / % of Sales
Highlights
Quarterly organic growth* evolution
49.2%
33.4%
-3.4%
-21.7%
-33.9% -33.9%
-24.8% -20.9%
-50%-40%-30%-20%-10%
0%10%20%30%40%50%
Q1'15 Q2'15 Q3'15 Q4'15 Q1'16 Q2'16 Q3'16 Q4'16
SURF
• Umbilical: Sharp volumes drop, in line with the expected market evolution due to Petrobras limited orders in 2016.
• DHT: Slight decline in Sales and Adj.EBITDA, partially compensated by the consolidation of GCDT since October 2015. Continue pressure from customers’ inventory reduction and projects postponement.
Core Oil&Gas Cables
• Organic sales slump driven by the shortfall of market activity in Drilling, Offshore projects and ESP (Electrical Submergible Pump) segments.
• Stabilizing trend in Q4.
• Focus on cost-effective supply chain initiatives and footprint optimization to limit margin erosion.
382 421
300
2014 2015 2016
* Org. Growth
-29.3%*
25
16
8
2014 2015 2016
6.5% 3.8% 2.7%
+10.0%*
* % change vs. same quarter of previous year

Company Presentation – March 2017 11
116 134 163
2014 2015 2016
994
1,109 1,164
2014 2015 2016
Telecom Euro Millions, % on Sales
Highlights
Quarterly LTM Adj. EBITDA and % on Sales evolution
Sales
Adj. EBITDA / % of Sales
104 99 100 116
126 144 146
134 147 141
157 163
-
50
100
150
200
9%
10%
11%
12%
13%
14%
15%
16%LTM Adj.Ebitda
% on LTM Sales
* Adj. EBITDA margin excl. €8mln bad debt provision in Brazil
* Org. Growth
+8.5%*
11.7% 12.1% 14.0%
14.7%*
Telecom Solutions
• Positive trend in Optical cables and fiber, accelerating in Q4, driven by solid performance in the US, France, Eastern Europe and Australia.
• Investments in fiber manufacturing efficiency paying off.
• Adj.EBITDA Margin benefitting from production footprint rationalization with the creation of excellence centres worldwide.
• Double-digit organic trend in copper cables fuelled by the positive market momentum in Australia.
MMS
• Profitable growth in Europe supported by production capacity extension in copper cables business and footprint optimization in fiber cable. Positive performance in South America.
€8m bad debt provision
+9.9%*

Agenda
Company Presentation – March 2017 12
Group overview
Results by business
Financial Results
Appendix
Company Presentation – March 2017 13
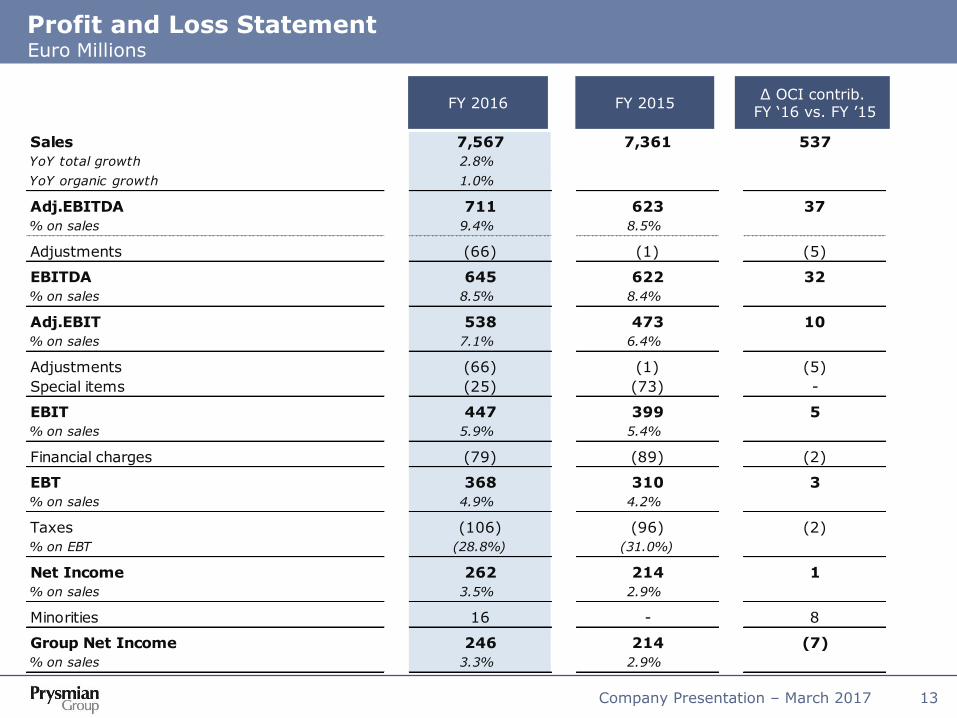
FY 2016 FY 2015 ∆ OCI contrib.
FY ‘16 vs. FY ’15
Profit and Loss Statement Euro Millions
Sales 7,567 7,361 537
YoY total growth 2.8% 7.6% 0.0%
YoY organic growth 1.0% 5.3% 0.0%
Adj.EBITDA 711 623 37
% on sales 9.4% 8.5%
Adjustments (66) (1) (5)
EBITDA 645 622 32
% on sales 8.5% 8.4%
Adj.EBIT 538 473 10
% on sales 7.1% 6.4%
Adjustments (66) (1) (5)
Special items (25) (73) -
EBIT 447 399 5
% on sales 5.9% 5.4%
Financial charges (79) (89) (2)
EBT 368 310 3
% on sales 4.9% 4.2%
Taxes (106) (96) (2)
% on EBT (28.8%) (31.0%)
Net Income 262 214 1
% on sales 3.5% 2.9%
Minorities 16 - 8
Group Net Income 246 214 (7)
% on sales 3.3% 2.9%

Company Presentation – March 2017 14
Adjustments and Special Items on EBIT Euro Millions
FY 2016 FY 2015
Non-recurring Items (Antitrust Investigation) 1 29
Restructuring (50) (48)
Other Non-operating Income / (Expenses) (17) 18
EBITDA adjustments (66) (1)
Special items (25) (73)
Gain/(loss) on metal derivatives 54 (27)
Assets impairment (30) (21)
Other (49) (25)
EBIT adjustments (91) (74)
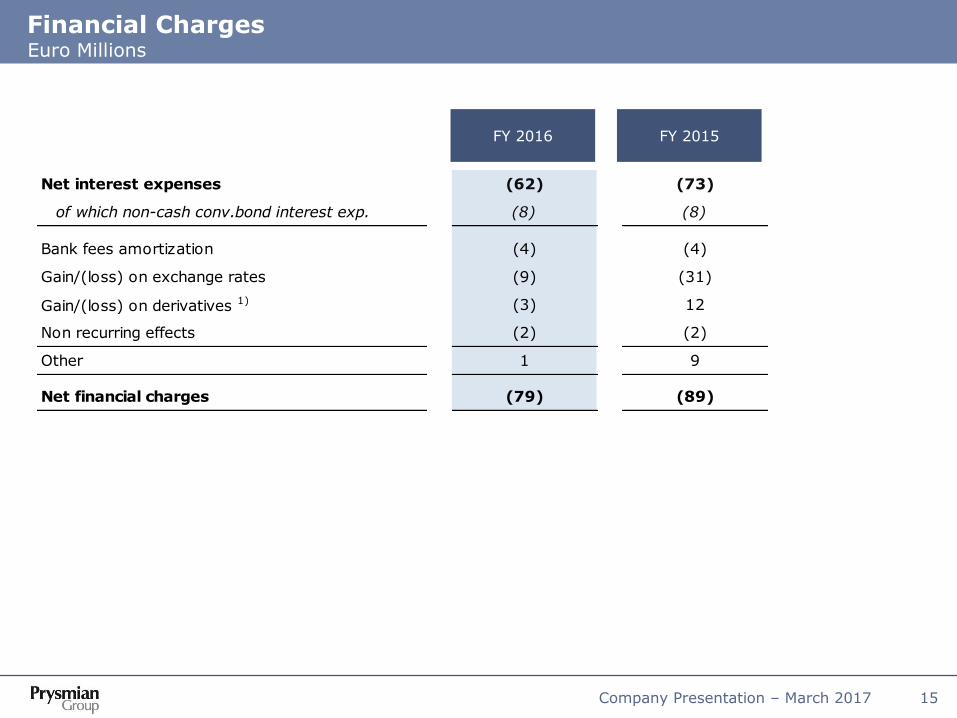
Company Presentation – March 2017 15
FY 2016 FY 2015
Financial Charges Euro Millions
Net interest expenses (62) (73)
of which non-cash conv.bond interest exp. (8) (8)
Bank fees amortization (4) (4)
Gain/(loss) on exchange rates (9) (31)
Gain/(loss) on derivatives 1) (3) 12
Non recurring effects (2) (2)
Other 1 9
Net financial charges (79) (89)
Company Presentation – March 2017 16
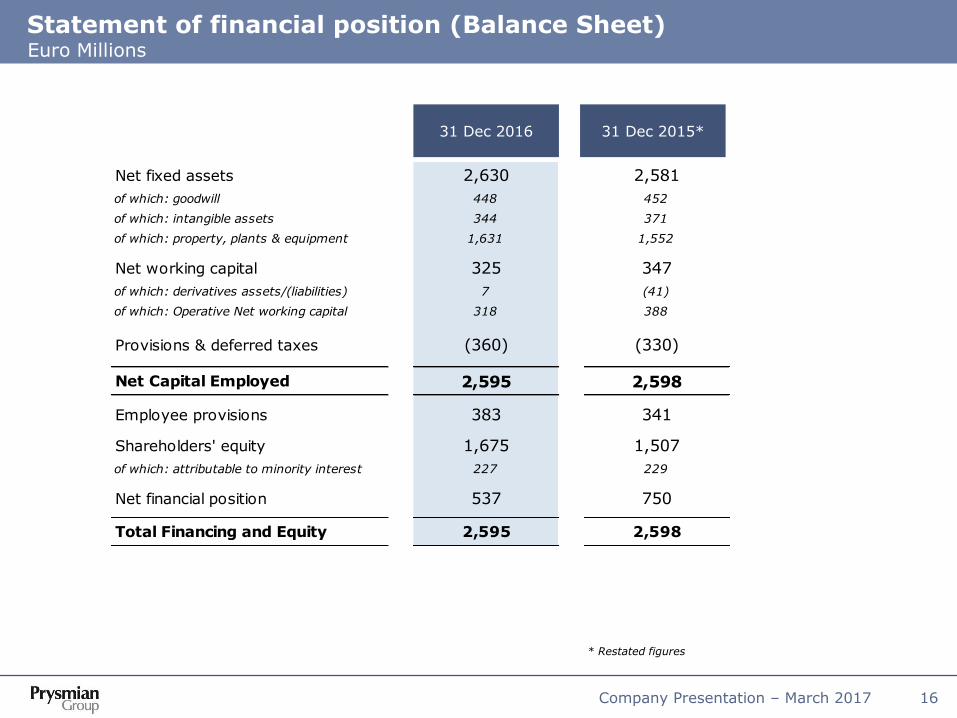
Statement of financial position (Balance Sheet) Euro Millions
31 Dec 2016 31 Dec 2015*
* Restated figures
Net fixed assets 2,630 2,581
of which: goodwill 448 452
of which: intangible assets 344 371
of which: property, plants & equipment 1,631 1,552
Net working capital 325 347
of which: derivatives assets/(liabilities) 7 (41)
of which: Operative Net working capital 318 388
Provisions & deferred taxes (360) (330)
Net Capital Employed 2,595 2,598
Employee provisions 383 341
Shareholders' equity 1,675 1,507
of which: attributable to minority interest 227 229
Net financial position 537 750
Total Financing and Equity 2,595 2,598
Company Presentation – March 2017 17
Adj.EBITDA 711 623 52
Adjustments (66) (1) (5)
EBITDA 645 622 47
Net Change in provisions & others - (75) -
Share of income from investments in op.activities (31) (39) -
Cash Flow from operations (bef. WC changes) 614 508 47
Working Capital changes 67 243 55
Dividends received 10 17 -
Paid Income Taxes (76) (71) (6)
Cash flow from operations 615 697 96
Acquisitions & Disposals 31 (138) -
Net Operative CAPEX (227) (200) (6)
of which acquisitions of assets of ShenHuan (11) - -
Free Cash Flow (unlevered) 419 359 90
Financial charges (68) (100) (1)
Free Cash Flow (levered) 351 259 89
Free Cash Flow (levered) excl. Acquisitions & Disposals** 331 397 89
Dividends (102) (91) (11)*
Treasury shares buy-back & other equity movements - 3 -
Net Cash Flow 249 171 78
NFP beginning of the period (750) (802)
Net cash flow 249 171
Other variations (36) (119)
NFP end of the period (537) (750)
Cash Flow Euro Millions
FY 2016 FY 2015 Full OCI FY 2016
Cash-flow
* Considering only dividends paid to minority shareholders ** Calculated as FCF (levered) excluding acquisitions of assets of ShenHuan and “Acquisitions & Disposals”.

Agenda
Company Presentation – March 2017 18
Group overview
Results by business
Financial Results
Appendix
o Prysmian at a glance
o OCI Acquisition
o Financials
o Energy Projects and Energy Products
o Telecom

Company Presentation – March 2017 19
9.2%
4.7%
6.3%
3.8%
-0.8%
1.4%
3.2%
4.6%
6.6%
9.1% 9.3%
9.0%
6.8% 5.7%
6.5% 6.7%
5.3% 6.4%
7.1%
-5%
0%
5%
10%
15%
20%
25%
1998 1999 2000 2001 2002 2003 2004 2005 2006 2007 2008 2009 2010 2011 2012 2013 2014 2015 2016
Sales Energy Sales Telecom Adj.EBIT %
Key milestones
Group Sales - € bn
2005 2001
Growth by acquisition
Restructuring process
Profitable growth
Acquisitions (Siemens,
NKF, MM, BICC)
Closure of 11 plants
Disposal of non core activities
July 2005: GS
acquisition and birth
of Prysmian Group
May 2007: Listing on the
Milan Stock Exchange
(IPO)
Listing
2011 2008
Managing the downturn
Strategic investments preparing
for the economic recovery
March ‘10:
Prysmian became
a full Public
Company
Public Company
February ‘11:
Draka acquisition
#1 Cable Maker
Reacting to downturn through consolidation
1998
Source: 1998-2003 Pirelli Group Annual Reports, data reported under Italian GAAP; 2004-2010 Prysmian accounts, data reported under IFRS; 2011 Draka full combined; 2011-2013 restated in application of IFRS 10-11 and reclassification of share of net income
2011-14 A new level of operating
efficiency
Post merger integration
2015
3.9
4.6 4.7
3.5
3.1 3.4
3.7
5.0 5.1 5.1
3.7
4.6
7.7 7.6
7.0 7.4
2.8
7.6
“Bolt-On” Acquisitions
Acquisitions (GCDT,
Oman Cables Industry)
6.8

Company Presentation – March 2017 20
Power Distribution
Optical Cables & Fibre
T&I
Submarine
Tlc Copper Cables
PROFITABILITY
High Voltage
Industrial
High
Medium
Low
Medium Low High
Oil&Gas
LONG TERM GROWTH
~ 76% of FY’16
Adj.EBITDA
Prysmian Group business portfolio
Look for Profitable Growth
• Focus on solutions
• Diversification and innovation
• Competition on a global basis
• Take selective M&A opportunities
• Focus on products and service
• Limited product diversification within regions • Regional competition
Manage for Cash
~ 24% of FY’16
Adj.EBITDA
Focus on high value added segments
Network Components
Company Presentation – March 2017 21
Cash Flow generation as key priority to create value for shareholders Growing capabilities to invest organically/acquisitions and remunerate shareholders
Cash Flow generation
2.2x
1.4x
1.1x
1.2x 1.2x
1.8x
1.4x 1.3x
1.6x
0.8x
0.5x
0.8x
1.0x
1.3x
1.5x
1.8x
2.0x
2.3x
0
80
160
240
320
400
2006 2007 2008 2009 2010 2011 2012 2013 2014 2015 2016
Free Cash Flow (levered) excl. Acquisitions (L axis) NFP / Adj. EBITDA (R axis)
€ mln
75 74 75 Dividends paid 35 44 89
Almost €670m distributed to shareholders since IPO Approx. € 230m average free cash flow per year
generated in 2006-16
90
Note: 2011 combined; 2012-13 restated in application of IFRS 10-11 and reclassification of share of net income
91
1.1x*
*Calculated as NFP reported as of 31 December 2015 divided by Pro-Forma FY2015 EBITDA including OCI and GCDT full contributions.
90
Company Presentation – March 2017 22
Disciplined Capex to grow in high margin business and out of Europe Investments focused on business with long term drivers and high entry barriers
CAPEX 2007-2016 (€ mln)
49 57 63 54 83 75 55 49
97 94
89 116 107 102
158 139 138
163
210 233
2007 2008 2009 2010 2011 2012 2013 2014 2015 2016
Cap. Increase & Product mix
2011 Combined; 2012-13 restated in application of IFRS 10-11 and reclassification of share of net income
Prysmian + Draka
Approx. € 680 million
cumulated CAPEX 2007-16 to
sustain growth in strategic
high value-added segments
EMEA 72%
North America 15%
Latin America 4%
APAC 9%
FY’16 CAPEX € 233m
Energy Projects 23%
Energy Products 12%
Telecom 5%
Baseload 11%
Efficiency 30%
IT, R&D 7%
Other 12%
FY’16 CAPEX € 233m
Cap.increase & Product mix
40%
CAPEX 2015 breakdown

Company Presentation – March 2017 23
Metal Price Impact on Profitability
• Metal price fluctuations are normally passed through to customers under supply contracts
• Hedging strategy is performed in order to systematically minimize profitability risks
High
Low
• Projects (Energy transmission)
• Cables for industrial applications (eg. OGP)
Predetermined delivery date
Metal Influence on Cable Price Metal Fluctuation Management Main Application Supply
Contract
Impact Impact
Frame contracts
• Technology and design content are the main elements of the “solution” offered
• Pricing little affected by metals
Spot orders
• Cables for energy utilities (e.g. power distribution cables)
• Cables for construction and civil engineering
• Pricing defined as hollow, thus mechanical price adjustment through formulas linked to metal publicly available quotation
• Standard products, high copper content, limited value added
• Price adjusted through formulas linked to metal publicly available quotation (average last month, …)
• Profitability protection through systematic hedging (short order-to-delivery cycle)
• Pricing locked-in at order intake • Profitability protection through
systematic hedging (long order-to-delivery cycle)
• Pricing managed through price lists, thus leading to some delay
• Competitive pressure may impact on delay of price adjustment
• Hedging based on forecasted volumes rather than orders

Agenda
Company Presentation – March 2017 24
Group overview
Results by business
Financial Results
Appendix
o Prysmian at a glance
o OCI Acquisition
o Financials
o Energy Projects and Energy Products
o Telecom
Company Presentation – March 2017 25
Focus on Oman Cables Industry Acquisition A perfect example of “Bolt-on” acquisition.
Structure of the Deal 2015 Sales Breakdown (€ million (1))
STRUCTURE OF THE DEAL
• Acquisition of approx. 16% stake in listed company OCI
• Total cash consideration € 105 million
• OCI Balance Sheet consolidated at 31 Dec 2015; P&L consolidated as of 1st Jan 2016.
STRATEGIC RATIONALE
• Geographic diversification toward middle-east region.
• No import duties in GCC market.
• Low integration risk. Solid track record.
Product Range
Strategic Position
• Building Wire and Cable
• LV and MV power cables (up to 33kV)
• Control cables for industrial applications
Domestic
43% MENA
57%
Sales FY15 € 664 m
(1) 2015 average EUROMR spot FX rate 0.4268
GCC area

Agenda
Company Presentation – March 2017 26
Group overview
Results by business
Financial Results
Appendix
o Prysmian at a glance
o OCI Acquisition
o Financials
o Energy Projects and Energy Products
o Telecom

Company Presentation – March 2017 27
Profit and Loss Statement Euro Millions
FY 2016 ∆ OCI contrib.
FY ‘16 vs. FY ’15 Full OCI FY’16
Results FY 2015
Sales 7,567 7,361 537 537
YoY total growth 2.8% 7.6% 0.0% 0.0%
YoY organic growth 1.0% 5.3% 0.0% 0.0%
Adj.EBITDA 711 623 37 52
% on sales 9.4% 8.5% 9.7%
of which share of net income 31 39 (15) -
Adjustments (66) (1) (5) (5)
EBITDA 645 622 32 47
% on sales 8.5% 8.4% 8.7%
Adj.EBIT 538 473 10 25
% on sales 7.1% 6.4% 4.6%
Adjustments (66) (1) (5) (5)
Special items (25) (73) - -
EBIT 447 399 5 20
% on sales 5.9% 5.4% 3.7%
Financial charges (79) (89) (2) (2)
EBT 368 310 3 18
% on sales 4.9% 4.2% 3.4%
Taxes (106) (96) (2) (2)
% on EBT (28.8%) (31.0%) (11.4%)
Net Income 262 214 1 16
% on sales 3.5% 2.9% 3.0%
Minorities 16 - 8 8
Group Net Income 246 214 (7) 8
% on sales 3.3% 2.9% 1.4%

Company Presentation – March 2017 28
Energy Projects Segment – Profit and Loss Statement Euro Millions
FY 2016 FY 2015
Sales to Third Parties 1,634 1,416
YoY total growth 15.4% 0.0%
YoY organic growth 18.5% 0.0%
Adj. EBITDA 260 221
% on sales 15.9% 15.6%
Adj. EBIT 224 187
% on sales 13.7% 13.2%

Company Presentation – March 2017 29
Energy Products Segment – Profit and Loss Statement Euro Millions
Sale
s t
o T
hird P
art
ies
Adj.
EBIT
DA
Adj.
EBIT
FY 2016 FY 2015 ∆ OCI Contribution FY ‘16 vs. FY ’15
E&I 3,016 2,795 537
YoY total growth 7.9% 0.0%
YoY organic growth (3.1%) 0.0%
Industrial & Netw. Comp. 1,343 1,499 -
YoY total growth (10.4%) 0.0%
YoY organic growth (4.6%) 0.0%
Other 110 121 -
YoY total growth (8.6%) 0.0%
YoY organic growth (4.4%) 0.0%
ENERGY PRODUCTS 4,469 4,415 537
YoY total growth 1.2% 0.0%
YoY organic growth (3.6%) 0.0%
E&I 154 128 37
% on sales 5.1% 4.6% 0.0%
Industrial & Netw. Comp. 127 122 -
% on sales 9.5% 8.1% 0.0%
Other (1) 2 -
% on sales (0.8%) 1.9% 0.0%
ENERGY PRODUCTS 280 252 37
% on sales 6.3% 5.7% 0.0%
E&I 92 93 10
% on sales 3.0% 3.3% 0.0%
Industrial & Netw. Comp. 108 100 -
% on sales 8.0% 6.7% 0.0%
Other (2) - -
% on sales (1.9%) 0.0%
ENERGY PRODUCTS 198 193 10
% on sales 4.4% 4.4% 0.0%

Company Presentation – March 2017 30
Oil&Gas Segment – Profit and Loss Statement Euro Millions
FY 2016 FY 2015
Sales to Third Parties 300 421
YoY total growth (28.9%) 0.0%
YoY organic growth (29.3%) 0.0%
Adj. EBITDA 8 16
% on sales 2.7% 3.8%
Adj. EBIT (7) 3
% on sales (2.4%) 0.7%
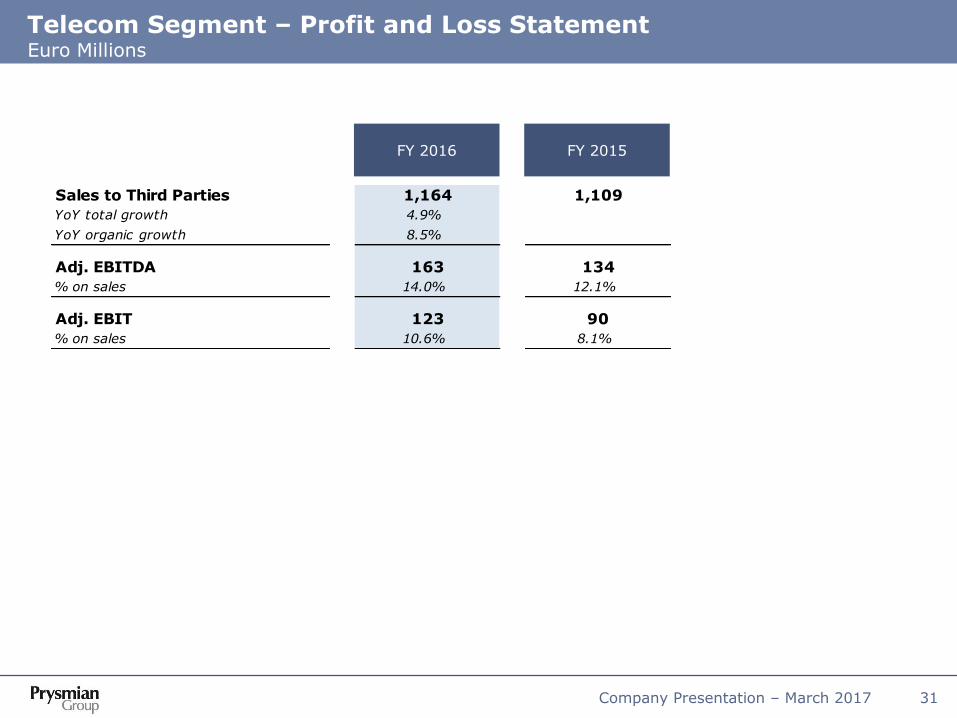
Company Presentation – March 2017 31
FY 2016 FY 2015
Telecom Segment – Profit and Loss Statement Euro Millions
Sales to Third Parties 1,164 1,109
YoY total growth 4.9% 11.6%
YoY organic growth 8.5% 9.9%
Adj. EBITDA 163 134
% on sales 14.0% 12.1%
Adj. EBIT 123 90
% on sales 10.6% 8.1%
Company Presentation – March 2017 32
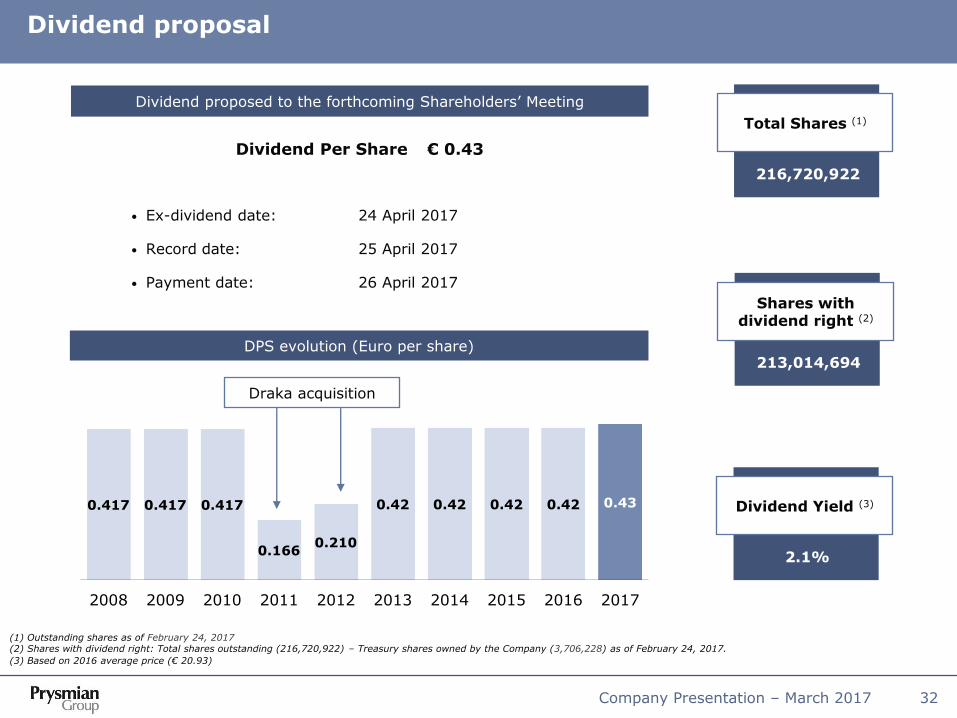
Dividend proposal
Dividend Per Share € 0.43
• Ex-dividend date: 24 April 2017
• Record date: 25 April 2017
• Payment date: 26 April 2017
(1) Outstanding shares as of February 24, 2017 (2) Shares with dividend right: Total shares outstanding (216,720,922) – Treasury shares owned by the Company (3,706,228) as of February 24, 2017.
(3) Based on 2016 average price (€ 20.93)
Dividend proposed to the forthcoming Shareholders’ Meeting
216,720,922
0.417 0.417 0.417
0.166 0.210
0.42 0.42 0.42 0.42 0.43
2008 2009 2010 2011 2012 2013 2014 2015 2016 2017
DPS evolution (Euro per share)
Total Shares (1)
213,014,694
Shares with dividend right (2)
2.1%
Dividend Yield (3)
Draka acquisition

Company Presentation – March 2017 33
Successful placement of €500m equity-linked bond
Equity-linked Bond
New Shares Buy-Back Programme
Key Features:
• Total amount: € 500 million
• Coupon: Zero Coupon
• Initial Conversion Price: €34.2949 (41.25% premium)
• Maturity: January 2022 (5 Years)
• Redemption at maturity: 100%
• Issuer call (130% trigger): 1 February 2020
Finance possible M&A deals
Fund shares buy-back
General corporate purposes
1.
2.
3.
AMOUNT
Up to €125 mln 3.706.228 shares*
Of which 1.087.911 purchased as of February 24, 2017 since the beginning of the program on January 23, 2017.
TREASURY SHARES CURRENTLY OWNED
PERIOD
Start 23 Jan. 2017
End 30 Sep. 2017
To serve possible M&A deals with shares exchange
To serve any conversion right under the bond
OBJECTIVES
* Treasury shares as of February 24, 2017.

Agenda
Company Presentation – March 2017 34
Group overview
Results by business
Financial Results
Appendix
o Prysmian at a glance
o OCI Acquisition
o Financials
o Energy Projects and Energy Products
o Telecom
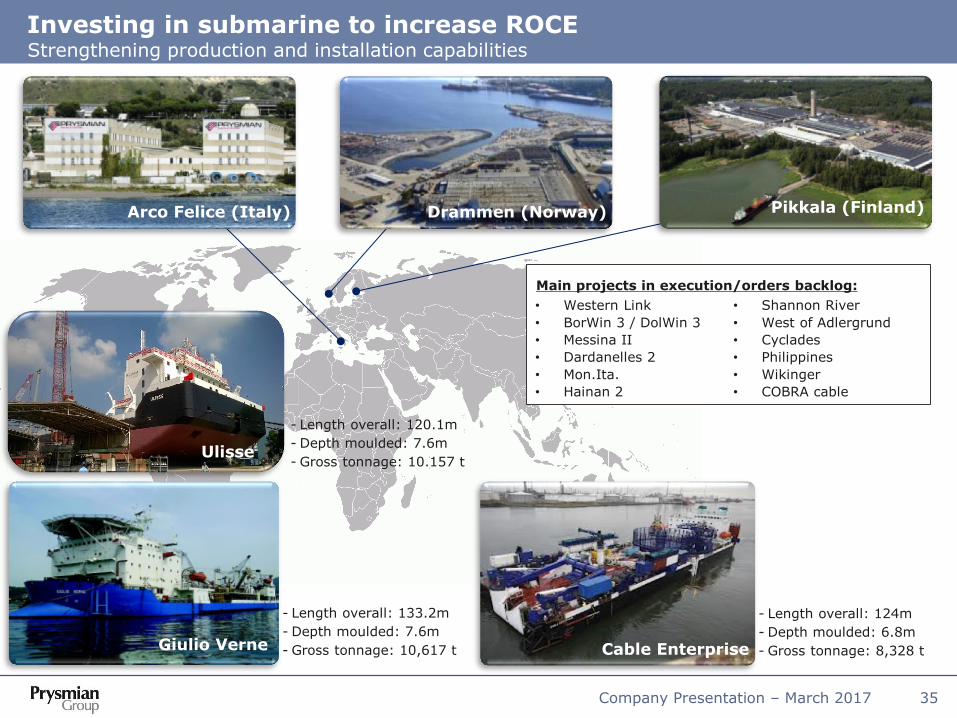
Company Presentation – March 2017 35
Giulio Verne
- Length overall: 124m
- Depth moulded: 6.8m
- Gross tonnage: 8,328 t
- Length overall: 133.2m
- Depth moulded: 7.6m
- Gross tonnage: 10,617 t
Drammen (Norway) Arco Felice (Italy)
Investing in submarine to increase ROCE Strengthening production and installation capabilities
Cable Enterprise
• Western Link
• BorWin 3 / DolWin 3
• Messina II
• Dardanelles 2
• Mon.Ita.
• Hainan 2
• Shannon River
• West of Adlergrund
• Cyclades
• Philippines
• Wikinger
• COBRA cable
Main projects in execution/orders backlog:
Pikkala (Finland)
Giulio Verne Ulisse
- Length overall: 120.1m
- Depth moulded: 7.6m
- Gross tonnage: 10.157 t
Company Presentation – March 2017 36
NKT 13%
ABB 18%
NSW 17%
High visibility on new projects to be awarded next quarters
Off-shore wind development in Europe
12.6 GW UK
5.2 GW
Belgium 0.7 GW
Germany 4.1 GW
Denmark 1.3 GW
Netherlands 1.1 GW
Others 0.2 GW
2.1 3.0 3.8 5.0
6.6 8.0
12.6
24.2
00.20.40.60.811.21.41.61.822.22.42.62.833.2
0
2
4
6
8
10
12
14
16
18
20
Th
ou
san
ds
Cumulated Offshore Wind capacity (L axis)
Annual Additional capacity (R axis)
Source: EWEA (January 2017)
21
22
20
• Capacity Increase: 1.6 GW in 2016 (-18% vs. 2015)
• Total capacity: 12.6 GW at end 2016 (+14% vs. 2015)
• Under construction: 4.8 GW at end 2016
• Consented: 24.6 GW
Europe 2016 Cumulated Capacity by Country Europe Offshore Wind capacity (GW)
47%
Mkt share of export cable suppliers in 2016 *
* Calculated on no. of cables fully or partially completed, percentage. EWEA (January 2017)
11
4.8

Company Presentation – March 2017 37
1. Germany (HVDC Grid Offshore)
2. France Off-Shore (Export cable
awarder, Inter-array to be awarded)
3. France – UK (Eurotunnel)
4. Western Isles Link
5. Italy-Switzerland
6. Denmark – UK (Viking Link)
7. Tunisia – Italy
8. Marseille – Languedoc
9. Denmark – Germany
10. France – UK (IFA2)
11. France – UK (FAB)
12. SACOI 3
13. Italy - Austria
1
2
3
4
5
Source: ENTSO-E
Main power flow trends
Main planned subsea & underground projects
7
8
Main subsea and underground projects of pan-European significance
6
List of main projects
9
10
Other Projects: Spain-France (sub), Ireland-France (sub), Israel-Cyprus-Crete-Greece (sub), Ireland-UK (sub), Egypt-Saudi Arabia (sub), North-South Germany (underground).
Major transmission projects to be awarded Large pipeline of pan-European projects under development
11
12
13

Company Presentation – March 2017 38
Latest submarine projects awarded
* Prysmian portion of the project
• Track record and reliability
• Ability to design/execute turnkey solution
• Quality of network services
• Product innovation
• State-of-the-art cable laying ships
• Cable Enterprise vessel conversion to improve installation capacity
• New investment worth approx. €40m in Pikkala and Arco Felice to enhance the production capability to meet the order backlog requirements
• Leverage on strong off-shore wind-farms trend
• Secure orders to protect long-term growth
• Focus on execution
Key success factors
Action plan
Frence Offshore RTE 2018-20 >300
ElecLink Groupe Eurotunnel 2017-19 79
COBRA cable TenneT – Energinet.dk 2016-18 250
Hainan II China South Grid 2016-19 $140m
NSN Link Statnett SF – National Grid 2015-21 550
West of Adlergrund Option 50Hertz Offshore GmbH 2015-18 230
Wikinger Iberdrola Renovables Offshore 2015-17 60
Philippines NGCP 2015-16 90
Dardanelles 2 TEIAS 2015-16 64
Cyclades IPTO 2015-16 95
West of Adlergrund 50Hertz Offshore GmbH 2015-18 480
Shannon River Crossing ESB 2014-16 40
Zakum offshore oil field Emirates Holding 2014-15 30
BorWin3 TenneT 2014-17 250
Capri Terna 2014-15 70
US Offshore platforms ExxonMobil's 2014-15 $100m
Balearic Islands Red Eléctrica de España 2014-15 85
DolWin3 TenneT 2014-16 350
Normandie 3 Jersey Electricity plc 2013-14 45
Mon.Ita Terna 2013-17 400
Dardanelles TEIAS 2012-14 67
Phu Quoc EVNSPC 2012-14 67
Western Link National Grid-Scottish Power JV 2012-17 800
HelWin2 TenneT 2012-15 200
Hudson Project Hudson Transm. Partners LLC 2012-13 $175m
SylWin1 TenneT 2012-15 280
Latest Key projects Customers Period €m*
Company Presentation – March 2017 39
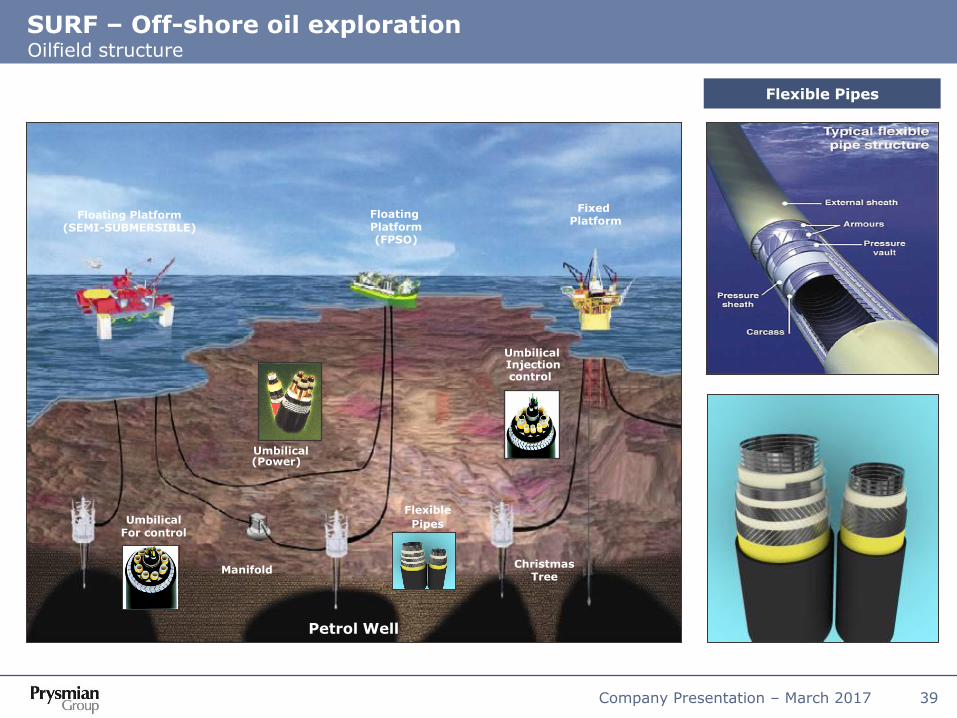
Oilfield structure
Manifold
Umbilical Injection control
Umbilical For control
Umbilical (Power)
Floating Platform (SEMI-SUBMERSIBLE)
Flexible
Pipes
Floating Platform (FPSO)
Fixed Platform
Christmas Tree
Petrol Well
Flexible Pipes
SURF – Off-shore oil exploration
Company Presentation – March 2017 40
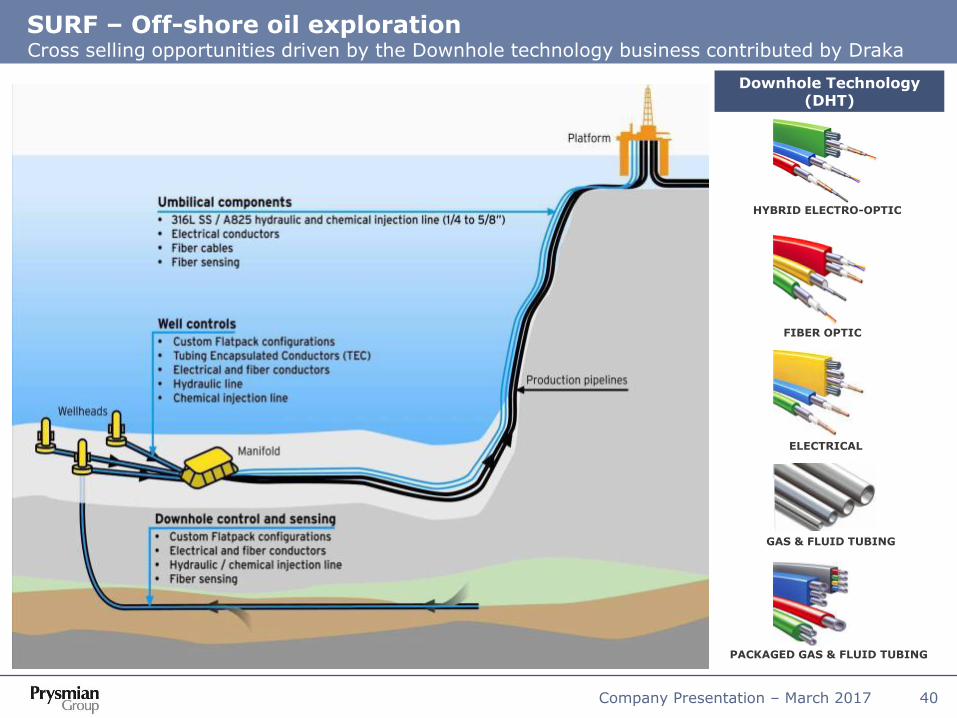
SURF – Off-shore oil exploration
HYBRID ELECTRO-OPTIC
FIBER OPTIC
ELECTRICAL
GAS & FLUID TUBING
PACKAGED GAS & FLUID TUBING
Downhole Technology (DHT)
Cross selling opportunities driven by the Downhole technology business contributed by Draka
Company Presentation – March 2017 41
Trade & Installers – Overview
Global partner with strong local presence
Full Product range
Technological leadership and product excellence
Customer centric approach
Capillary logistical distribution network and
service
Technical support
Extra services
Unique industry expertize
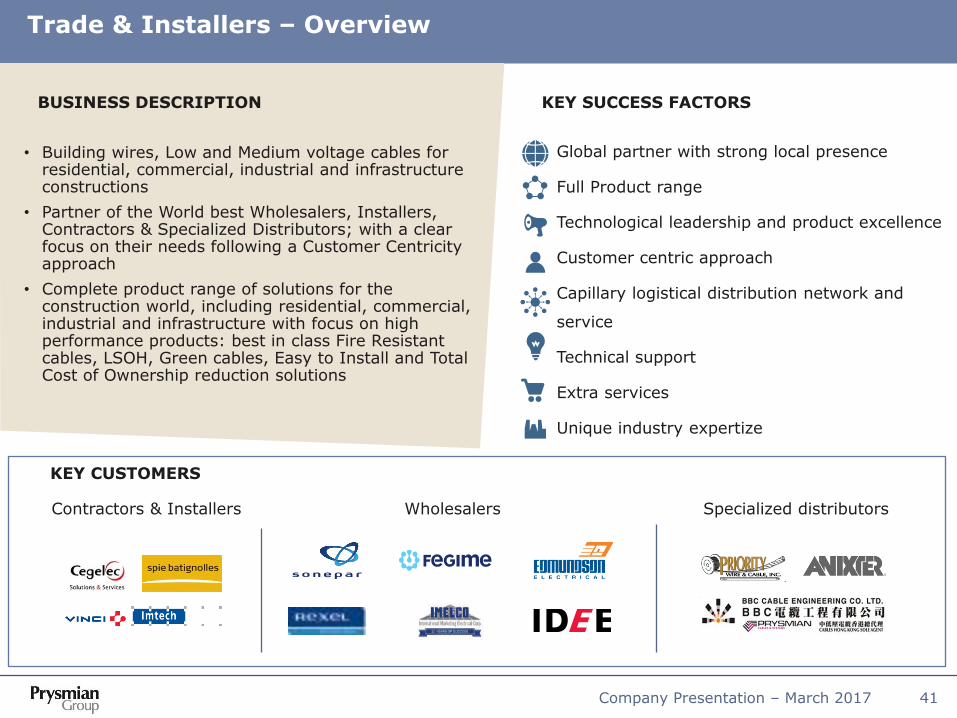
Contractors & Installers
KEY CUSTOMERS
KEY SUCCESS FACTORS
Wholesalers Specialized distributors
• Building wires, Low and Medium voltage cables for residential, commercial, industrial and infrastructure constructions
• Partner of the World best Wholesalers, Installers, Contractors & Specialized Distributors; with a clear focus on their needs following a Customer Centricity approach
• Complete product range of solutions for the construction world, including residential, commercial, industrial and infrastructure with focus on high performance products: best in class Fire Resistant cables, LSOH, Green cables, Easy to Install and Total Cost of Ownership reduction solutions
BUSINESS DESCRIPTION
Company Presentation – March 2017 42
Trade & Installers
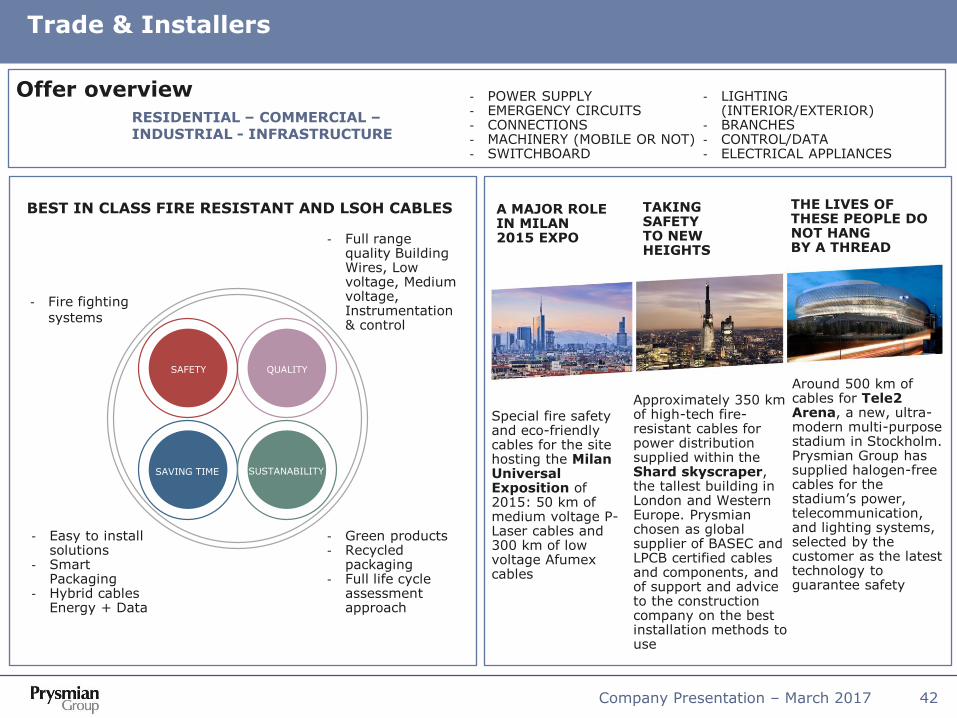
Offer overview
BEST IN CLASS FIRE RESISTANT AND LSOH CABLES
- Full range quality Building Wires, Low voltage, Medium voltage, Instrumentation & control
- Easy to install solutions
- Smart Packaging
- Hybrid cables Energy + Data
- Green products - Recycled
packaging - Full life cycle
assessment approach
- POWER SUPPLY - EMERGENCY CIRCUITS - CONNECTIONS - MACHINERY (MOBILE OR NOT) - SWITCHBOARD
- LIGHTING (INTERIOR/EXTERIOR)
- BRANCHES - CONTROL/DATA - ELECTRICAL APPLIANCES
RESIDENTIAL – COMMERCIAL – INDUSTRIAL - INFRASTRUCTURE
SAFETY QUALITY
SUSTANABILITY SAVING TIME
- Fire fighting systems
Special fire safety and eco-friendly cables for the site hosting the Milan Universal Exposition of 2015: 50 km of medium voltage P-Laser cables and 300 km of low voltage Afumex cables
Approximately 350 km of high-tech fire-resistant cables for power distribution supplied within the Shard skyscraper, the tallest building in London and Western Europe. Prysmian chosen as global supplier of BASEC and LPCB certified cables and components, and of support and advice to the construction company on the best installation methods to use
Around 500 km of cables for Tele2 Arena, a new, ultra-modern multi-purpose stadium in Stockholm. Prysmian Group has supplied halogen-free cables for the stadium’s power, telecommunication, and lighting systems, selected by the customer as the latest technology to guarantee safety
A MAJOR ROLE IN MILAN 2015 EXPO
TAKING SAFETY TO NEW HEIGHTS
THE LIVES OF THESE PEOPLE DO NOT HANG BY A THREAD

Company Presentation – March 2017 43
Elevator Meeting the global demand for high-performing, durable and safe elevator cable and components we design manufacture and distribute packaged solutions for the elevator industry
Automotive Standard and specialist cables for the automotive and transport industry, collaborating with the sector’s leading international manufacturers
Specialties & OEM Products for mining, crane , marine, railway, rolling stock, nuclear, renewables, defense and other niches
Integrated cable solutions highly customized to our industrial customers worldwide
Large and differentiated customer base generally served through direct sales
Industrial & Network Components – Overview
Business description Key customers
Network Components Network accessories and components to connect cables and other network elements

Company Presentation – March 2017 44
Product macro structure Production process
Conductor (Cu, Al)
Internal Semiconductive
Insulation (XLPE, EPDM)
External Semiconductive
WB yarns
Cu tape
Outer jacket (Polyolefine, PVC, …)
Conductor
production
(drawing,
stranding)
Insulation Screening Sheathing Lay up Armouring
Final
quality
inspection
Building
Wire
(T&I)
Low Voltage
(T&I+PD)
Medium
Voltage
High voltage
(PD+HV)
Industrial
Cables
(Industrial)
Macro-structure of Energy Cables
Agenda
Company Presentation – March 2017 45
Group overview
Results by business
Financial Results
Appendix
o Prysmian at a glance
o OCI Acquisition
o Financials
o Energy Projects and Energy Products
o Telecom

Company Presentation – March 2017 46
Telecom solutions Optical cables: tailored for all today’s challenging environments from underground ducts to overhead lines, rail tunnels and sewerage pipes Copper cables: broad portfolio for underground and overhead solutions, residential and commercial buildings Connectivity: FTTH systems based upon existing technologies and specially developed proprietary optical fibres
Optical Fiber Optical fiber products: single-mode optical fiber, multimode optical fibers and specialty fibers (DrakaElite) Manufacturing: our proprietary manufacturing process for Plasma-activated Chemical Vapor Deposition and Licensed OVD Technology (600 unique inventions corresponding to > 1.4K patents) positions us at the forefront of today’s technology
Integrated cable solutions focused on high -end Telecom Key customers include key operators in the telecom sector
MMS Multimedia specials: solutions for radio, TV and film, harsh industrial environments, radio frequency, central office switching and datacom Mobile networks: Antenna line products for mobile operators Railway infrastructure: Buried distribution & railfoot cables for long distance telecommunication and advanced signalling cables for such applications as light signalling and track switching
Telecom – Overview
Business description Key customers

Company Presentation – March 2017 47
Optical cables Global overview
• Fiber optic represents the major single
component cost of optical cables
• Fiber optic production has high entry barriers:
• Proprietary technology or licenses difficult
to obtain
• Long time to develop know-how
• Capital intensity
• When fiber optic is short, vertically integrated
cable manufacturers leverage on a strong
competitive advantage
• Maintain & reinforce position with key
established clients
• Further penetration of large incumbents in
emerging regions
• Optimize utilization of low cost manufacturing
units
• Expand distribution model in Domestic & Export
• Streamline the inter-company process
• Fully integrated products sales
• Refocus on export activities
• Increase level and effectiveness of agents
• Demand function of level of capital expenditures
budgeted by large telecom companies
(PTT/incumbents as well as alternative
operators) for network infrastructures, mainly
as a consequence of:
• Growing number of internet users data
traffic
• Diffusion of broadband services / other high-
tech services (i.e. IPTV)
• Continuous innovation and development of new
cable & fibre products
• Cable design innovation with special focus on
installation cost reduction
• Relentless activity to maintain the highest quality
and service level
• Focus on costs to remain competitive in a highly
price sensitive environment
Action plan Strategic value of fibre
Key success factors Market trends

Company Presentation – March 2017 48
BACKBONE METROPOLITAN RING ACCESS NETWORK
Telecom Cables Main Applications

Company Presentation – March 2017 49
0
2
4
6
8
10
2013 2014 2015 2016 2017E
Telecom – Market trend Growth opportunities coming from the development of broadband in Europe
0%
20%
40%
60%
80%
100%
2010 2011 2012 2013 2014 2015 EU2020
TargetNGA coverage
High speed (>30Mbps) take-up
Ultrafast (>100Mbps) take-up
• Coverage of NGA technologies doubled since 2010, but
further efforts are requested to meet 2020 target of
100% coverage
• Take-up of ultrafast (>100Mbps) broadband remains
marginal (3% of homes) still faraway from 2020 target
(50%)
Italy
Source: CRU, January 2017; European Commission Digital Agenda Scoreboard 2016
France • Coverage of NGA in
France (43%) well
below EU average
(68%) at end 2014
• THD plan to attract
€20bn public/private
investments in 2012-22
to develop high speed
and ultrafast
infrastructures
• NGA coverage at 36% in
2014 Vs EU average of
68%
• More than €10bn
investment announced
by telecom operators for
the development of NGA
in the coming years.
Source: European Commission Digital Agenda Scoreboard 2016
0
1
2
3
4
2013 2014 2015 2016 2017E
CAGR +13.4%
Evolution of NGA (Next Generation Access) coverage and high-speed (>30Mbps) / ultrafast
(>100Mbps) take-up (% of homes) in the EU
Consumption of fiber optic cable (‘000,000 fiber km)
Opportunities coming from national plans to achieve EU 2020 Digital Agenda targets
CAGR +21%

Company Presentation – March 2017 50
Antenna towers used by 4G and LTE
networks
Roof top antenna towers for urban
applications
Distributed antenna systems for dense mobile
populations areas
Telecom – FTTA as key driver of optical demand 4G and Long Term Evolution (LTE) deployments require Fiber-to-the-Antenna (FTTA)
# of users
Global LTE Growth Forecast
Source: Informa Telecoms & Media, WCIS+, March 2014

Company Presentation – March 2017 51
Product macro structure Production process
Main Technologies:
OVD - VAD - MCVD
Core (10 Micron)
Cladding (125 Micron)
Primary Coating (250 Micron)
Pre form deposition Consolidation Drawing
Conductor
production Insulation Twinning Sheathing Lay up Armouring
Colouring Lay up
Armouring
(yarn or
metal)
Sheathing
Sheath
Ripcords
Fillers
Central
strength
member (Tracking resistant)
Sheathing Compound
Optical
fibres Loose tubes
Aramid Yarns
Stranded pairs core Screen/Armour
Outer sheath Insulated Conductors
Fibre
optic
Optical
cables
Copper
cables
Final quality
inspection
Final
quality
inspection
Final
quality
inspection
Buffering
Macro-structure of Telecom Cables
Company Presentation – March 2017 52
Reference Scenario Commodities & Forex
Based on monthly average data Source: Nasdaq OMX
Brent Copper Aluminium
EUR / USD EUR / GBP EUR / BRL
500
1,000
1,500
2,000
2,500
3,000
3,500
J-08J-09J-10J-11J-12J-13J-14J-15J-16J-17
Aluminium $/ton
Aluminium €/ton
2,000
4,000
6,000
8,000
10,000
12,000
J-08
J-09
J-10
J-11
J-12
J-13
J-14
J-15
J-16
J-17
Copper $/ton
Copper €/ton
25
50
75
100
125
150
J-08
J-09
J-10
J-11
J-12
J-13
J-14
J-15
J-16
J-17
Brent $/bbl
Brent €/bbl
2.00
2.50
3.00
3.50
4.00
4.50
J-08
J-09
J-10
J-11
J-12
J-13
J-14
J-15
J-16
J-17
0.70
0.75
0.80
0.85
0.90
0.95
J-08
J-09
J-10
J-11
J-12
J-13
J-14
J-15
J-16
J-17
1.00
1.10
1.20
1.30
1.40
1.50
1.60
J-08
J-09
J-10
J-11
J-12
J-13
J-14
J-15
J-16
J-17

Company Presentation – March 2017 53
Disclaimer
• The managers responsible for preparing the company's financial reports, A.Bott and C.Soprano, declare, pursuant
to paragraph 2 of Article 154-bis of the Consolidated Financial Act, that the accounting information contained in
this presentation corresponds to the results documented in the books, accounting and other records of the
company.
• Certain information included in this document is forward looking and is subject to important risks and
uncertainties that could cause actual results to differ materially. The Company's businesses include its Energy
Projects, Energy Products and Telecom Operating Segments, and its outlook is predominantly based on its
interpretation of what it considers to be the key economic factors affecting these businesses.
• Any estimates or forward-looking statements contained in this document are referred to the current date and,
therefore, any of the assumptions underlying this document or any of the circumstances or data mentioned in this
document may change. Prysmian S.p.A. expressly disclaims and does not assume any liability in connection with
any inaccuracies in any of these estimates or forward-looking statements or in connection with any use by any
third party of such estimates or forward-looking statements. This document does not represent investment advice
or a recommendation for the purchase or sale of financial products and/or of any kind of financial services. Finally,
this document does not represent an investment solicitation in Italy, pursuant to Section 1, letter (t) of Legislative
Decree no. 58 of February 24, 1998, or in any other country or state.
• In addition to the standard financial reporting formats and indicators required under IFRS, this document contains
a number of reclassified tables and alternative performance indicators. The purpose is to help users better
evaluate the Group's economic and financial performance. However, these tables and indicators should not be
treated as a substitute for the standard ones required by IFRS.


