Impact Investigation of a Mercury Reducing GEM in Stream Microcosms & Construction of Mercury Reducing Reporter Strains Based on the Safety Strain Ps. putida KT2440 Von der Gemeinsamen Naturwissenschaftlichen Fakultät der Technischen Universität Carolo-Wilhelmina zu Braunschweig zur Erlangung des Grades einer Doktorin der Naturwissenschaften (Dr.rer.nat.) genehmigte D i s s e r t a t i o n von Björg Veronika Pauling geboren in Wiesbaden
Transcript
Impact Investigation of a Mercury Reducing GEM in Stream Microcosms &
Construction of Mercury Reducing Reporter Strains Based on the Safety Strain Ps. putida KT2440
Von der Gemeinsamen Naturwissenschaftlichen Fakultät
der Technischen Universität Carolo-Wilhelmina
zu Braunschweig
zur Erlangung des Grades einer
Doktorin der Naturwissenschaften
(Dr.rer.nat.)
genehmigte
D i s s e r t a t i o n
von Björg Veronika Pauling
geboren in Wiesbaden
1. Referentin: PD I. Wagner-Döbler
2. Referent: Prof. D. Jahn
eingereicht am: 13.02.2003
mündliche Prüfung (Disputation) am: 09.04.2003
Vorveröffentlichungen der Dissertation
Vorveröffentlichungen der Dissertation Teilergebnisse aus dieser Arbeit wurden mit Genehmigung der Gemeinsamen Naturwissenschaft-lichen Fakultät, vertreten durch die Mentorin der Arbeit, in folgenden Beiträgen vorab veröffentlicht: Publikationen: Felske, A., Pauling, B. V., von Canstein, H. F., Li, Y., Lauber, J., Buer, J., Wagner-Döbler, I. Detection
of Small Sequence Differences Using Competitive PCR: Molecular Monitoring of Genetically Improved, Mercury-Reducing Bacteria. BioTechniques 30: 142-148 (2001).
Felske , A., Vandieken V., Pauling, B. V., von Canstein, H. F., Wagner-Döbler, I. Molecular
Quantification of Genes Encoding for Green Fluorescent Proteins. Journal of Microbiological Methods 52 (2003) 297– 304
Vorträge: Wagner-Döbler, I., von Canstein, H. F., Lünsdorf, H., Li, Y., Felske, A., Pauling, B. V. Bioremediation
of electrolysis wastewater by mercury resistant Pseudomonas strains. Proceedings 4th International Symposium on Environmental Biotechnology (ISEB), April 10-12, Noordwijkerhout, The Netherlands: 197-200 (2000).
Wagner-Döbler, I., von Canstein, H. F., Li, Y., Felske, A., Pauling, B. V. Mercury remediation- a new
solution to an old problem. Remediation of Hazardous waste- environmental protection technologies. Biotechnology for Conservation of the environment. 2nd International Symposium. EXPO2000, Hannover, July 9-12, Munster, Germany (2000).
Tagungsbeiträge Pauling, B. V., Wagner-Döbler, I.: Construction of a Hg-Reducing Reporter Strain for Biosafety
Experiments in Flow Microcosms. 2nd International MAREP conference- Marker/Reporter Genes in Microbial Ecology, December 4-7, Stockholm, Sweden (1999).
Pauling, B. V., Wagner-Döbler, I.: Construction of a Hg-Reducing Reporter Strain for Biosafety
Experiments in Stream Microcosms. Microbiology 2000, VAAM Frühjahrstagung, March 12-16, München, Germany (2000).
Wagner-Döbler, I., von Canstein, H. F., Li, Y., Felske, A., Pauling, B. V.: Application of microbial
mercury resistance to wastewater remediation. Microbiology 2000, VAAM Frühjahrstagung, March 12-16, München, Germany (2000).
Wagner-Döbler, I., von Canstein, H. F., Li, Y., Felske., A., Pauling, B. V..: New bioremediation
technology for mercury containing wastewater. Sectoral meeting, June 14-16, Roskilde, Denmark (2000).
Felske, A., Pauling, B. V., von Canstein, H. F., Li, Y., Wagner-Döbler, I.: Molecular monitoring of
genetically improved bacteria in mercury retention bioreactors. Sectoral meeting, June 14-16, Roskilde, Denmark (2000).
Felske, A., Pauling, B. V., von Canstein, H. F., Li, Y., Wagner-Döbler, I.: Mercury retention bioreactors
and monitoring of genetically improved Pseudomonads by a quantitative PCR/TGGE method. Biotechnology 2000-The World Congress on Biotechnology, Sept 3-8, Berlin, Germany (2000).
Vorveröffentlichungen der Dissertation
Wagner-Döbler, I., von Canstein, H. F., Li, Y., Felske, A., Pauling, B. V.: Mercury resistant bacteria as
catalysts for new wastewater remediation technology. Biotechnology 2000- The World Congress on Biotechnology, Sept 3-8, Berlin, Germany (2000).
Wagner-Döbler, I., von Canstein, H. F., Li, Y., Felske, A., Pauling, B. V.: Microbial mercury reduction-
industrial application and microbial ecology. Implementation of in-situ Remediation Techniques. International Congress, October, Utrecht, The Netherlands (2000).
Pauling, B. V., Wagner-Döbler, I.: Assessing the Safety of the Hg-reducing GEM Pseudomonas putida
KT2442::mer73 in Stream Microcosms. VAAM Frühjahrstagung, March, Oldenburg, Germany (2001).
Wagner-Döbler, I., von Canstein, H., Leonhäuser, J., Li, Y., Felske, A., Pauling, B.: Mercury reducing
biofilms technical application and microbial ecology. Society for Experimental Biology- Annual Meeting 2nd – 6th April, The University of Kent, Canterbury (2001).
Felske, A., Pauling B. V., von Canstein, H. F., Wagner-Döbler, I.: DNA-based Detection of Mercury
Reducing Biocatalysts in the Environment. 9th International Symposium of Microbial Ecology (ISME9), August 26-31, Amsterdam, The Netherlands (2001).
Wagner-Döbler, I., von Canstein, H. F., Leonhäuser, J., Li, Y., Felske, A., Pauling, B. V.: Mercury
remediation- a new solution to an old problem. 9th International Symposium of Microbial Ecology (ISME9), August 26-31, Amsterdam, The Netherlands (2001).
Wagner-Döbler, I., von Canstein, H. F., Leonhäuser, J., Li, Y., Felske, A., Pauling, B. V.: Mercury
remediation- a new solution to an old problem. 6th International Conference on Mercury as a Global Pollutant, October 15-19, Minamata, Japan (2001).
Pauling, B. V., Wagner-Döbler, I.: Construction of mercury reducing, fluorescent Pseudomonas
strains. VAAM Frühjahrstagung, March 24-27, Göttingen Germany (2002).
The insults to humanity through science
1. The astronomical insult
- the planet earth is not the centre of the universe
2. The genetic insult
- humankind is not the centre of the living world
- the genetic code is universal
- the enzymes and biochemical pathways are universal
- sequence homologies exist
- horizontal gene transfers may take place
3. The psychological insult
- our mind is split into the conscious and the unconscious
- in case of disagreement, the unconscious always wins
1.1.5.1 GEMs in Mercury Bioremediation.............................................................. 6
1.1.5.2 Rationales for New Mercury Reducing Construct Strains .......................... 7
1.2 Safety Aspects in the use of GEMs .........................................................................8
1.2.1 European Guidelines .......................................................................................... 8
1.2.2 Why use Ps. putida KT2440 as Parent in the Construction of GEMs?............ 10
1.3 Detection and Quantification of Bacteria..............................................................10 1.3.1 Cultivation-Dependent Detection..................................................................... 11
2.3.2 Preparation of Genomic DNA from Bacteria................................................... 26
2.3.2.1 From Overnight Culture- Method 1 (Asubel et al. 1990) ......................... 26
2.3.2.2 From Overnight Culture- Method 2 .......................................................... 26
2.3.2.3 From Sediment Samples............................................................................ 27
2.3.2.4 From Water Samples................................................................................. 28
2.3.3 Plasmid Preparation and Purification ............................................................... 28
2.4 DNA Standard Techniques.....................................................................................28 2.4.1 DNA Gel Electrophoresis................................................................................. 28
2.4.1.1 DNA Size Markers .................................................................................... 29
2.4.2 DNA Quantification ......................................................................................... 30
2.4.3 Enzymatic DNA modification.......................................................................... 31
2.6 PCR-Temperature Gradient Gel Electrophoresis (TGGE) ...................................42 2.6.1 PCR for TGGE Analysis of Total Bacterial Community (16S rDNA)............ 42
2.6.2 PCR for TGGE Analysis of Mercury-Resistant Community (merA) .............. 43
2.6.3 Culture-Independent Detection of Ps. putida KT2442::mer73 by Quantitative,
2.6.6 TGGE Standard ................................................................................................ 45
2.7 Sequencing..............................................................................................................46 2.7.1.1 Data Recording and Sequence Analysis.................................................... 47
3.1.9 Mercury Resistant Community ........................................................................ 75
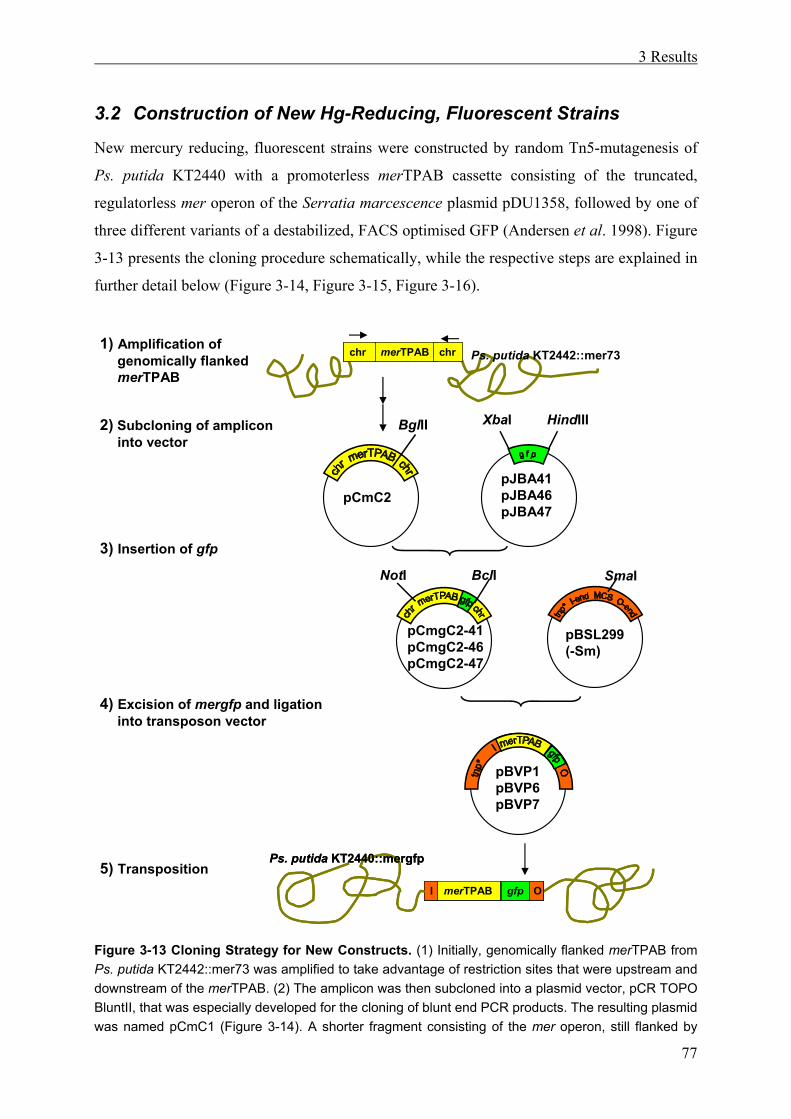
3.2 Construction of New Hg-Reducing, Fluorescent Strains ....................................77
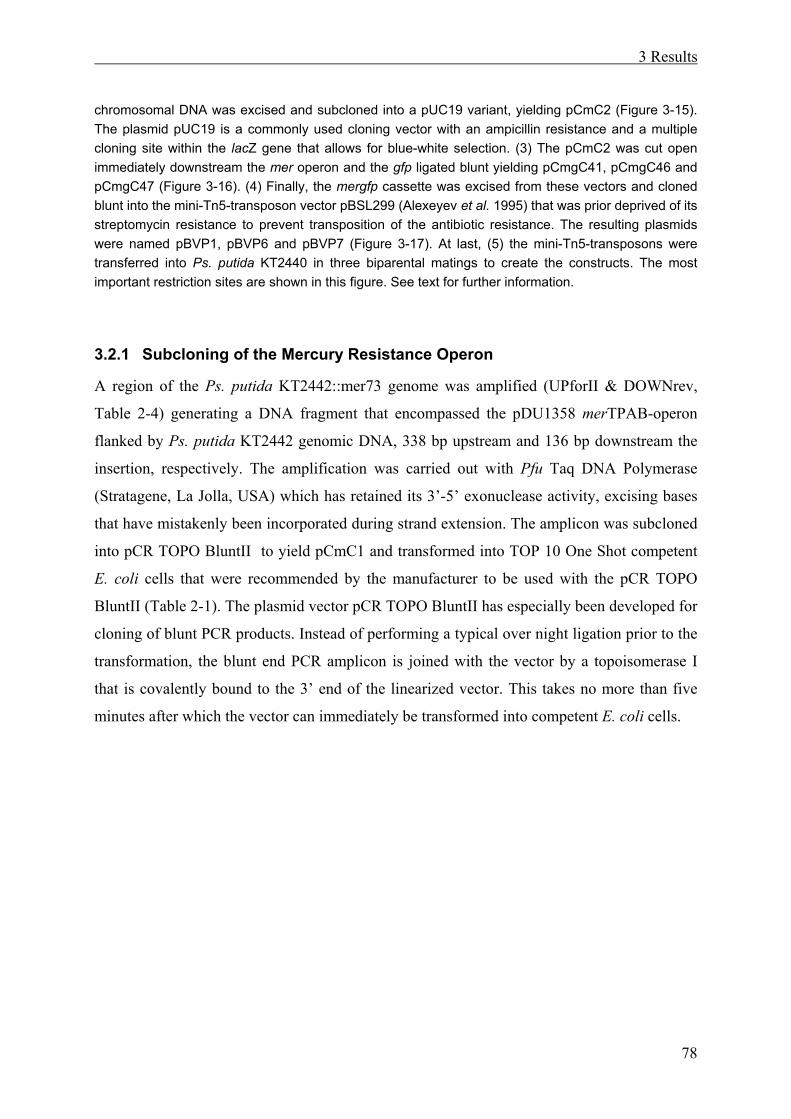
3.2.1 Subcloning of the Mercury Resistance Operon................................................ 78
3.2.2 Creation of the mergfp Cassette ....................................................................... 81
3.2.3 Cloning of the mergfp Tn5 Minitransposon..................................................... 81
3.2.4 Selection of New Mercury Resistant Ps. putida Constructs ............................ 84
3.2.5 PCR Proof of mergfp Integration ..................................................................... 88
3.3 Integration Sites and Genomic Environment in Ps. putida KT2442::mer73 and in the New Constructs ....................................................................................89
3.3.1 Revealing the Insertion Sites in Ps. putida KT2442::mer73 and in the New
4.2 Ps. putida constructs for Bioremediation of Mercury Contaminated Waste Water .....................................................................................................................121
4.2.1 Construct Ps. putida KT2442::mer73 ............................................................ 121
4.2.2 Tn5 Transposition Target Site Selection ........................................................ 122
4.2.3 Integration/ Protein Functions Assigned to Ps. putida KT2440 Open Reading
Symbols and Abbreviations ...................................................................................................155
1 Introduction
1
1 Introduction
1.1 Bacterial Bioremediation of Mercury Contaminated Water
1.1.1 Mercury in the Environment
Mercury has been present in the environment for aeons. Erupted from the centre of the earth
by volcanic activity mercury exists as mineral (mainly as cinnabar -red HgS-, but also as
mercury oxide, oxychloride, sulfate mineral; Kim et al. 2001) or as elemental mercury, the
only metal to be a liquid at room temperature but also existing as gas due to its high vapour
pressure. In a bio-geo-chemical cycle mercury is globally dispersed undergoing many
physical and chemical transformations (Barkay 2000): (1) In the atmosphere elemental
mercury is photo-oxidised to ionic mercury (Hg2+). (2) Rain precipitates the anorganic
mercury on the surface of the earth where, carried out mainly by microorganisms in aquatic
systems, it is (3) reduced back to its elemental form or (4) methylated. (5) Elemental mercury
evaporates into air where the cycle begins anew. Mercury is emitted by four main natural
processes: (1) degassing from geological mineral deposits, (2) emissions from volcanic
activities, (3) photoreduction of divalent mercury in aquatic systems, (4) biological formation
of elemental and methyl-mercury (OECD/GD(94)98).
Although it remains undisputed that mercury occurs naturally in the environment and in toxic
concentrations locally, mercury emissions owing to anthropogenic activities in industry
(mainly through chlor-alkali-electrolysis), mining (Korte 1999), and fossil fuel combustion or
waste incineration are immense and are thought to substantially contribute to the mercury
pool participating in the bio-geo-chemical cycle. While natural mercury emission is estimated
at 1000 t y-1, 2000 t of industrial mercury are assumed to be emitted per year (Mason et al.
1994). However, the concentrations of mercury in various compartments from natural and
anthropogenic sources are highly variable. Thus, estimations for mercury emissions to air
have previously ranged from 2500 to 125,000 t y-1 (OECD/GD(94)98).
Worldwide many areas are mercury polluted and present a threat to people and environment
(Fukuda et al., 1999; Cleckner et al. 1999, Xiao et al. 1998, Horvat et al. 1999). Owing to the
mercury cycle described above, regional emissions may be deposited elsewhere, e.g. in the
Arctic where increased mercury levels have been found (Macdonald et al. 2000), hence
contaminations do not remain confined to a particular area but may affect ecosystems
globally.
1 Introduction
2
Via the food chain, and most efficiently in the aquatic food web, mercury (mostly as
methylmercury) accumulates in carnivorous fish, a process called biomagnification, poisoning
people consuming the fish. The syndromes (neurological disorders, see below) resulting from
the poisoning have been named Minamata Disease after the tragedy in the late 1950s when
over 3000 people in Japan were severely poisoned by methylmercury pollution caused by a
chemical manufacturing plant (Langford & Ferner 1999).
1.1.2 Toxicity of Mercury
Mercury is known to most people in the western world from every day life. Before the
prohibition by the European Union directive (European Council Directive 93/42/EEC) it was
widely used in clinical thermometers, moreover mercury can be found in several medications
and it is still used in dental fillings nowadays. However, its toxicity has also been known and
recorded for two milleniums (Langford & Ferner 1999).
Different forms of the heavy metal possess different characteristics rendering it a hazard to
living organisms. The toxicity of highly reactive mercuric mercury (Hg2+) is attributed to it
binding to the sulfhydryl groups of the cysteines of essential enzymes and proteins, thus
disturbing vital cell functions. In the body water-soluble ionic mercury salts are not efficiently
absorbed. Rather, they are eliminated from the body via the kidneys acutely causing damage
to the gut and the renal system in cases of poisoning. Hg2+ is generated in large amounts in
mercury cells during chlor-alkali electrolysis. Waste water from this industrial process that
produces chlorine and caustic soda normally contains between 1 and 10 ppm of mercury.
The hazard arising from elemental mercury (Hg0) is owed to its high vapour pressure allowing
it to be easily inhaled. Absorbed by the lungs it enters the blood stream and is distributed
around the body including the brain. Elemental mercury is transformed in the red blood cells,
the liver and the central nervous system to Hg2+ and methylmercury. Repeated or prolonged
exposure mainly results in vasomotor disturbances, tremor, and behavioural disturbances.
Organic mercury forms such as monomethyl- or dimethylmercury or phenyl mercuric acetate
(PMA) are lipid-soluble and thus readily absorbed in the body. They penetrate membranes
and cross the blood brain barrier. A large proportion of organic mercury is transformed into
reactive Hg2+ (Strasdeit 1998) and can severely damage the central nervous system causing
neuromuscular malfunctions, ranging from numb limbs and visual disorders to paralysis and
even death (Barkay 2000). Because transformation to Hg2+ occurs slowly, symptoms of
poisoning with organic mercury may appear weeks or months after the poisoning as in the
case of Karen Wetterhahn, a chemistry professor who tragically died after she had spilled not
1 Introduction
3
more than a drop or two of dimethylmercury on her hand that she supposed to have protected
with a latex glove. She did follow safety procedures immediately after the incidence. First
symptoms of neurological impairment did occur no earlier than 5 months after the accident,
she passed away 10 months after the spill (Nierenberg et al. 1998).
1.1.3 Bacterial Resistance to Mercury
Mercuric mercury forms complexes with organic and inorganic ligands and easily adsorbs to
surfaces of particulates owing to its high reactivity and affinity to thiol groups (Barkay 2000).
Mercury bio-availability therefore plays a crucial role in the evaluation of microbial resistance
levels. There is some tolerance towards mercury owing solely to unspecific sequestration by
cells walls and lipopolysaccharide (LPS) layers (Langley & Beveridge 1999).
Bioaccumulation of mercury by means of active transport of the mercury ions into the cell
and subsequent tethering by metallothioneins has not been observed in natural bacteria
(Osborn et al. 1997). Metallothioneins are small proteins with a strong metal-binding capacity
by virtue of their cysteine-residues. They are ubiquitous in the plant and animal kingdom and
have therefore been of interest in the construction of bacterial strains for bioremediation of
mercury (Hg2+) contaminated waste water (Chen et al. 1998, Valls et al. 2000).
True mercury resistance is characterized by active enzymatic detoxification. Among bacteria
mercury resistance is ancient, highly conserved and has been identified across a wide range of
bacterial genera including gram positive and gram negative bacteria. Bacteria resistant to
mercury have been isolated world-wide from a diverse range of habitats and locations
(Osborn et al. 1997). The genes encoding it are organised within the so-called mer operon and
can be found even in microorganisms that have not particularly been isolated from mercury-
contaminated sites, although the frequency of mer genes at these sites is lower than in the
presence of mercury (Barkay et al. 1991, Rasmussen & Sørensen 1998, Smit et al. 1998).
Some mer operons have been found to be encoded chromosomally (Inoue et al. 1989, Wang
et al. 1989, Iohara et al. 2001), however most have been isolated from (self-transmissible)
plasmids (Osborn et al. 1997, Rasmussen & Sørensen 1998, Smit et al. 1998). The operon can
also be spread by transposition and has been found on several natural transposons (Liebert et
al. 1997, Liebert et al. 1999, Hobman et al. 1994, Misra et al. 1984). Horizontal gene transfer
by transposition is presumed to be the reason for the presence of two or more mer operons in
one strain of Bacillus (Gupta et al. 1999, Huang et al. 1999). The mercury resistance operon
comprises three major functions: Transport of Hg2+ into the cell, enzymatic NADPH-
dependent conversion of the ionic mercury into relatively non-toxic elemental mercury (Hg0)
1 Introduction
4
and the regulation of the genes (Misra 1992, Cervantes & Silver 1996). Resistance operons
restricted to these functions are termed “narrow spectrum”. The detoxification of organic
mercury requires a fourth function, namely cleavage of mercury from the organic residue. If
this is included in the mercury resistance operon it is labelled “broad spectrum”. The genes
conferring these functions are designated merT, merP (transport), merA (mercury reduction),
merB (cleavage of Hg from organic residue), merR, and merD (regulatory genes). Further mer
genes have been identified recently: merC and merF, both membrane proteins, confer
transport functions (Wilson et al. 2000), while the merG product provides resistance to
phenylmercury (Kiyono & Pan-Hou 1999). Most mercury resistance operons are inducible,
i.e. Hg2+ has to be present in order to activate expression of the resistance whereas
transcription is suppressed in the absence of mercury (Misra 1992). If, however, switched on
by mercury at a contaminated site, the bacterial mercury resistance forms the basis of natural
on-site detoxification of mercury (Silver et al. 1994) under aerobic conditions.
1.1.4 Utilizing the Bacterial Mercury Resistance in Bioremediation
The ability of bacteria to detoxify mercury can be utilized to bioremediate mercury
contaminated waste water. In fact, it seems as if this potential was solely confined to
microbial species as no naturally occurring plant or animal species have been reported to
detoxify mercury. Nevertheless, plants have been engineered to overexpress the bacterial
mercury resistance and transform organic and inorganic mercury to elemental mercury with
promising results for the phytoremediation of mercury contaminated sites (Rugh et al. 1998,
Bizily et al. 1999). Plants combine many practical benefits for the bioremediation of
contaminated sites. With the mercury transforming transgenic yellow poplar of Rugh et al.
1998, large areas of contamination could be planted. In addition to decontamination, the trees
would stabilize the soil surface with a stout root systems and provide niches for the
inhabitation of (mercury-reducing) microorganisms. However, the mercury reducing plants
emit volatile Hg0 into the air, which although non-significant on a global scale may contribute
to increased mercury concentrations locally.
One of the initial efforts to retain mercury in bacterial bioreactors was made by Brunke et al.
(1993). They managed to capture elemental mercury in globules up to 5 µm in diameter in
fixed-bed columns using genetically engineered mercury reducing bacteria that were
immobilized on ceramic carriers, glass or in alginate beads. Some years later, von Canstein et
al. (1999) demonstrated the removal of mercury from chloralkali electrolysis waste water by a
mercury resistant Pseudomonas putida strain. This natural isolate was capable of coping with
1 Introduction
5
up to 8 mg L-1 of mercury in the waste water, transforming 97.3% (cellulose fibres) or 98.5%
(Siran), depending on the carrier material. These laboratory-scale reactor results formed the
basis for the development of a technical-scale bioreactor that de-contaminated mercury-
polluted chlor-alkali-electrolysis waste water under on-site conditions (Wagner-Döbler et al.
2000a&b). Mercury retention could be achieved at 95% efficiency, and the discharge limit for
mercury in industrial waste water (50 µg L-1) could be met reliably with the help of an
activated carbon filter at the end of the line, capturing residual traces of mercury. The
elemental mercury accumulated in the bioreactor, this, however, did not affect the efficacy of
the bioreactor.
Bioremediation exploiting the bacterial resistance system is very cost-effective in comparison
with chemical methods of mercury-decontamination such as sulfide precipitation or ion
exchange columns. All it requires in addition to the bacteria is a sucrose feeding solution from
which they can derive the energy needed for the reduction of mercury. In the flow-through
reactor dead cells are flushed from the system and are constantly replaced by fresh re-growth.
It was found that although inoculated with several mercury reducing isolates, foreign
mercury-resistant bacteria invaded the bioreactor and a new consortium of mercury-
transforming bacteria evolved that dynamically changed over time (von Canstein et al. 2002b)
having to cope with temporary high inflow mercury concentrations, temperature increase,
oxygen and nutrient gradients and fluctuating concentrations of chloride. The efficiency of
mercury reduction, however, was at no stage impaired by the changing bioreactor community.
Some of the original inoculants could be detected throughout the time of operation, others
became temporarily non-detectable and re-appeared at later stages. In additional experiments
in the laboratory-scale bioreactors, the presence of a consortium could be shown to be of
benefit for a reliable, disturbance-independent mercury-removal (von Canstein et al. 2002a).
Due to the continuous selective pressure in the bioreactor, mercury resistant bacteria are
enriched that are most properly adapted to on site conditions and thus best suited to improve
bioreactor stability.
1.1.5 Genetically Engineered Microorganisms (GEMs) in Biotechnology and Bioremediation
Recombinant microorganisms have proven very valuable for biotechnology for decades. By
now they are indispensable for the production of amino acids, vitamins, alcohol, antibiotics or
secondary metabolites for health and nutrition (Demain 2000). Furthermore, bacteria have
been isolated and engineered to biodegrade or detoxify pollutants (Barkay & Schaefer 2001).
1 Introduction
6
Industrialization has taken its toll by leaving many environmental habitats, especially rivers,
polluted and ecosystems severely damaged. However, bacteria have had an aeons lasting
history of adaptation to adverse conditions, that have forced upon them the capacity to cope
with pollutants, having already evolved a detoxifying mechanism or developing one under the
selective pressure of the toxin, e.g. by expanding the substrate range of an enzyme that is
already present (de Lorenzo 2001). Recombinant DNA technology has provided a tool for
accelerating this process in a rational way. The improvement of microbes that appear
promising for bioremediation may be achieved e.g. by creating new metabolic routes, by
optimising substrate routing, improving turnover rate or enhancing process-relevant properties
of the microorganism (Timmis & Pieper 1999, Pieper & Reineke 2000).
1.1.5.1 GEMs in Mercury Bioremediation
Genetic modification of microorganisms for the possible use of mercury-remediation has
aimed at increasing mercury resistance by multiplying mer operon copy number in E. coli and
Ps. putida (Kurabayashi et al. 1997), providing strains already holding special functions, such
as the radiation resistant Deinococcus radiourans, with the mercury resistance (Brim et al.
2000), combining the transport system of the mercury resistance and metallothionein for
biosorption in one recombinant E. coli strain (Chen et al. 1998), or expressing metallothionein
on the cell surface of Ralstonia metallidurans or Ps. putida (Valls et al. 2000).
The bacterial strain Ps. putida KT2442::mer73 is another example for a mercury reducing
genetically engineered microbe. It was constructed by Horn et al. (1994) and selected for its
high and constitutive mercury resistance. The rationale was that the construct strain would be
better adapted to cope with fluctuating mercury concentrations than natural bacteria with an
inducible mercury resistance. The mercury resistance used in this manipulation was taken
from the natural plasmid pDU1358 from Serratia marcescens and integrated into the Ps.
putida KT2442 genome by mini-Tn5-transposon mutagenesis without transfer of the
transposase, thus integrating only the necessary genes stably into the chromosome. Being a
candidate for bioremediation, Ps. putida KT2442::mer73 was tested in the laboratory scale
bioreactors described above in a monospecies mercury-reducing biofilm (von Canstein et al.
2002a). In this and previous experiments with non-sterile mercury-containing waste water
(Felske et al. 2001), the GEM was readily lost and did not seem to establish good biofilms in
the bioreactor unless feeding was increased. Insufficient growth and a prolonged lag-phase
were probably the reason for this.
1 Introduction
7
1.1.5.2 Rationales for New Mercury Reducing Construct Strains
For Ps. putida KT2442::mer73 it was shown that high mercury reduction was not sufficient
for good performance in the bioreactors. In contrast, mixed culture biofilms consisting of
several mercury-resistant isolates efficiently retained mercury and were not affected by
disturbances such as rapid increases of mercury or continuously high mercury concentrations.
Von Canstein et al. (2002a) impressively showed that a moderately mercury reducing isolate
(“Bro62”) that did not perform well under mono-species conditions, dominated the very
successful mercury reducing multi-species biofilm, where it was probably protected by better
resistant cells that, however, were only present in very low abundance. With regard to
microorganisms used for bioremediation this shows that besides creating a super-organism by
combining several features in one strain, a consortium of GEMs with different abilities (which
could also include natural bacteria) could be of value for a successful bioremediation strategy,
especially if microorganisms in the bioreactor face changing conditions, that may require
different abilities.
Bacteria used in packed bed bioreactors in industrial applications need to establish good
biofilms and cope well with disturbances (temporary high inflow mercury concentrations,
temperature increase, oxygen and nutrient gradients and fluctuating concentrations of
chloride). For the construction of new mercury-reducing GEMs to be used in such bioreactors
these are traits to decide on. A new highly mercury resistant GEM could be used in
combination with a natural consortium, playing a bio-protective role, e.g. in case of sudden
mercury peaks in the bioreactor inflow (for bio-protection of an activated sludge microbial
community during pollutant shocks see Eichner et al. 1999). A GEM’s task could also be to
fortify the integrity of the biofilm, facilitating attachment of other mercury transforming
community members.
Easy monitoring of mercury reduction within the bioreactor is crucial to evaluate the
performance of the strain. On-line determination of mercury can serve as indirect measure for
the activity of the mercuric reductase, however only the performance of the bioreactor as a
whole can be represented in that way and discrimination of individual strains is not possible.
By transcriptional fusion of the mercury resistance with a reporter gene (e.g. GFP, see below),
the activity of the mercury reduction of a new GEM can be monitored directly. The same
reporter can also be used to monitor the fate of the GEM within the bioreactor or in case of
escape outside of it. This work describes the construction of mercury reducing Ps. putida
strains by random Tn5 mutagenesis with a promoterless mer-gfp cassette. Details of the
recipient strain and the reporter gene used are described in 1.2 and 1.3.2.2 respectively.
1 Introduction
8
1.2 Safety Aspects in the use of GEMs
1.2.1 European Guidelines
By definition a "[…] genetically modified organism (GMO) means an organism, with the
exception of human beings, in which the genetic material has been altered in a way that does
not occur naturally by mating and/or natural recombination; […]” (2001/18/EC). Since the
first utilization of GMOs for industrial processes or in agriculture, there has been discussion
and to a great extent concern and scepticism about the safety of the newly created strains in
case of an accidental or deliberate release into the environment (e.g. Stotzky & Babich 1984,
Wöhrmann 1991, Kellenberger 1994, Sheridan 2000). In the following the abbreviation GMO
will be used to refer to all modified organisms while GEM will only be used in the context of
genetically engineered microorganisms. In Europe, these concerns have resulted in legislative
consequences in form of a set of regulations and guidelines for the use of GEMs. One of the
essential pre-requisites for the use of GEMs are good knowledge and description of the donor
and recipient (or parental organism/s) and the vector/s used in the construction. Approval of
the deliberate release of a GEM requires documented description of its ecology and
environmental impact. An environmental risk assessment (e.r.a., Table 1-1) of a release of
GEMs requires knowledge of microbial survival, growth, activity and dispersal within the
environment, and of the persistence of recombinant DNA and its transfer to the indigenous
microflora. Although a variety of microbes have been optimised for bioremediation, these
efforts were mainly restricted to the laboratory and confined systems, and only very few data
are available from field applications (Sayler & Ripp 2000). For an evaluation of GEMs used
in in situ bioremediation, however, it is essential that long-term field studies are performed to
yield information about the competence of the GEM and the risks associated with its
introduction into natural ecosystems.
Table 1-1 Excerpt of the Directive 2001/18/EC. European Parliament and the Council of 12
March 2001, ANNEX II Principles for the Environmental Risk Assessment, D. Conclusions on
the potential environmental impact from the release or the placing on the market of GMOs.
“[…] 1. Likelihood of the GMO to become persistent and invasive in natural habitats under the conditions of the proposed release(s).
1 Introduction
9
2. Any selective advantage or disadvantage conferred to the GMO and the likelihood of this becoming realised under the conditions of the proposed release(s). 3. Potential for gene transfer to other species under conditions of the proposed release of the GMO and any selective advantage or disadvantage conferred to those species. 4. Potential immediate and/or delayed environmental impact of the direct and indirect interactions between the GMO and target organisms (if applicable). 5. Potential immediate and/or delayed environmental impact of the direct and indirect interactions between the GMO with non-target organisms, including impact on population levels of competitors, prey, hosts, symbionts, predators, parasites and pathogens. 6. Possible immediate and/or delayed effects on human health resulting from potential direct and indirect interactions of the GMO and persons working with, coming into contact with or in the vicinity of the GMO releases(s). 7. Possible immediate and/or delayed effects on animal health and consequences for the feed/food chain resulting from consumption of the GMO and any product derived from it if it is intended to be used as animal feed. 8. Possible immediate and/or delayed effects on biogeochemical processes resulting from potential direct and indirect interactions of the GMO and target and non-target organisms in the vicinity of the GMO release(s). 9. Possible immediate and/or delayed, direct and indirect environmental impacts of the specific techniques used for the management of the GMO where these are different from those used for non-GMOs.”
In summary, the Directive differentiates between "direct" and “indirect effects” referring to
primary effects on human health or the environment which are a result of the GMO itself and
which do not occur through a causal chain of events, or to effects on human health or the
environment occurring through a causal chain of events. Observations of indirect effects are
likely to be delayed. Consequently, the Directive includes the time coordinate and recognizes
"immediate effects" referring to effects on human health or the environment which are
observed during the period of the release of the GMO. Immediate effects may be direct or
indirect. "Delayed effects", on the other hand, refer to effects on human health or the
environment which may not be observed during the period of the release of the GMO but
become apparent as a direct or indirect effect either at a later stage or after termination of the
release. Adverse effects may occur directly or indirectly through mechanisms which may
include the spread of the GMO(s) in the environment, the transfer of the recombinant genetic
material to other organisms, phenotypic and genetic instability, interactions with other
organisms or changes in management.
1 Introduction
10
In this work, the mercury-resistant GEM Ps. putida KT2442::mer73 was assessed regarding
its safety. In accordance with the European Directive 2001/18/EC, survival of the GEM, gene
transfer of the foreign genes and its impact on indigenous bacterial communities were
especially scrutinized.
1.2.2 Why use Ps. putida KT2440 as Parent in the Construction of GEMs?
Ps. putida KT2440 (Bagdasarian et al. 1981) is a cured, spontaneous restriction-deficient
derivative of Ps. putida mt2 (Murray et al. 1972) which was isolated from soil by virtue of its
ability to use benzoate as the sole source of carbon and which was shown to readily acquire
recombinant DNA, expanding its own set of degradative enzymes (Ramos et al. 1994). Ps.
putida KT2440 has been recognized as non-pathogenic by the National Institute of Health of
the USA and has been under investigation in a number of physiological and genetic studies
(e.g. Ramos-Diaz & Ramos 1998). Its genome has recently been sequenced (Nelson et al.
2002, Institute for Genomic Research-TIGR Rockville, MD, USA) and can be obtained now
at http://www.tigr.org/tigr-scripts/CMR2/GenomePage3.spl?database=gpp, or at the National
Center for Biotechnology Information (NCBI, http://www.ncbi.nlm.nih.gov:80/cgi-
bin/Entrez/framik?db=genome&gi=266). The complete sequence elucidates to a large degree
the genotype of Ps. putida KT2440 and facilitates description of genetic modifications, an
aspect that was central for this work. Ps. putida KT2440 is easily genetically manipulated
(Mermod et al. 1986), expresses foreign genes (e.g. Horn et al. 1994) and colonizes plant
rhizosphere, making it potentially useful for phyto-rhizoremediation and for the development
of bio-pesticides (Molina et al. 2000). Moreover, regarding mercury resistance in bacteria,
Silver et al. (1994) found Pseudomonas species to be the predominant isolates from mercury
contaminated sites in Minamata. Pseudomonas strains also dominated the isolates with the
highest resistance to mercury in bioreactors cleaning mercury polluted factory wastewater. Ps.
putida KT2440 thus appeared to be a promising candidate for the expression of the mercury
resistance and GFP.
1.3 Detection and Quantification of Bacteria
In a risk assessment and quite generally in many different contexts of microbiology, bacterial
densities need to be determined. In a culture or likewise in an environmental sample the total
bacterial density can be quantified, or a subgroup or single strain possessing a specific
characteristic can be detected or selected for. This trait may be a specific DNA sequence or a
1 Introduction
11
phenotypic characteristic and it may be natural or introduced. Prerequisite for the detection
and/or quantification of a GEM is that it possesses a feature that is unique and absent in the
natural community that the organism has been introduced into. Before the rise of molecular
techniques, the quantification of microorganisms was based on cultivation in liquid or on
solid media, for specific organisms with the application of a selective pressure. With
microscopy and the development of DNA staining dyes bacteria could be visualized, however
not discriminated. By now a number of cultivation-independent, i.e. molecular-based,
methods, have become available and are alternatively used along with cultivation-dependent
methods as will be described in the following.
1.3.1 Cultivation-Dependent Detection
Spreading an appropriate dilution of a liquid sample on solid medium for counting colony
forming units (cfu) is one of the most classical methods to quantify cell density. It can also be
used to detect/quantify cells that exhibit a specific phenotype, e.g. expression of an antibiotic
or heavy metal resistance, or the ability to degrade certain compounds. These traits may serve
as intrinsic or introduced markers for a particular group of bacteria and the DNA underlying
the phenotype, the marker gene, can be defined as “[…] a DNA sequence, introduced into an
organism, which confers a distinct genotype or phenotype to enable monitoring in a given
environment. An intrinsic marker is a non-introduced DNA sequence or natural phenotype
that serves as a signature for a particular organism or group of organisms” (Jansson et al.
2000). Examples for genetic markers that can serve as selective markers are resistance to
1)Gesellschaft für Biotechnologische Forschung (GBF), Braunschweig, Germany 2)National Environmental Research Institute, Department of Marine Ecology and Microbiology,
Roskilde, Denmark
2.2 Cultivation of Microorganisms
2.2.1 Media
The following media were used solid or in liquid form to cultivate bacteria. All media were
either autoclaved for 20 min at 121°C, 1 bar vapour pressure or sterilized through a 0.22 µm
membrane filter. Carbon sources, mercury, antibiotics, and trace elements that could not be
autoclaved were filter sterilized separately and aseptically added to the medium. For solid
medium 15 gL-1 Bacto Agar was added before autoclaving.
2 Materials and Methods
21
2.2.1.1 Supplements
Media were supplemented with antibiotics or heavy metals to create a selective pressure and
prevent contamination during cultivation. The inductor isopropyl-β-D-thiogalactopyranosid
(IPTG) was used to induce transcription from the lac promoter, 5-bromo-4-chloro-3-indoyl-β-
D-galactosid (x-gal) was used in a blue-white screening as a substrate that is metabolised by
the intact β-galactosidase yielding bright blue products. If however, the DNA coding for the
enzyme (lacZ) is disrupted (because a DNA sequence was cloned into the multiple sequence
site that lies within the gene), the substrate cannot be metabolised and colonies growing in the
presence of x-gal remain white.
For different purposes, different concentrations of mercury in the medium were appropriate.
Luria Bertani (LB) medium binds substantial amounts of HgCl2 (see below, Chang et al.
1993, Farrell et al. 1993), owing to SH-groups present in tryptone and yeast extract (Misra,
1992). Therefore, for the same bioavailable Hg-concentration more mercury needed to be
added to LB medium than to a minimal medium. Moreover, Ps. putida can tolerate many
toxic (organic) compounds to a certain extent without expressing the actual resistance
enzyme. This may partially be due to alterations of the outer cell membrane, e.g. mechanisms
such as cis-trans isomerization (Heipieper 1996). Hence, higher PMA concentrations were
appropriate for Ps. putida than e.g. for E. coli. Cultivation with mercury as selection pressure
required lower concentrations than selection of mercury-resistant transformants after a
conjugation experiment (see chapter 3.2.4).
Supplements were added to the medium in the following solvents and concentrations (Table
2-2):
2 Materials and Methods
22
Table 2-2 Supplements in Media
Additive Solvent Stock Concentration End Concentration
Ampicillin 70% Ethanol 100 mg ml-1 100 µg ml-1
Kanamycin dH2O 60 mg ml-1 60 µg ml-1
Streptomycin dH2O 120 mg ml-1 120 µg ml-1
Rifampicin DMSO 50 mg ml-1 100 µg ml-1
Tetracyclin dH2O 5 mg ml-1 10 µg ml-1
HgCl2 dH2O 10 mg ml-1 as specified
Phenyl mercuric acetate (PMA)
dH2O 1 mg ml-1 as specified
IPTG dH2O 50 mg ml-1 50µg ml-1
x-gal DMF (Dimethylformamide)
40 mg ml-1 40 µg ml-1
2.2.1.2 Luria Bertani Medium (Sambrook et al. 1989)
Tryptone and Yeast Extract were obtained from Oxoid (Ltd Basingstoke, Hampshire UK) and
Gibco BRL (now Invitrogen- Life Technologies, Karlsruhe, Germany), respectively. Bacto
Agar was obtained from Difco Laboratories, Heidelberg, Germany and sodium chloride was
purchased from Fluka (Buchs, Switzerland).
Tryptone 10 g
Yeast Extract 5 g
NaCl 10 g 17.1 mM
(Bacto Agar 15 g)
dH2O ad 1000 ml
2.2.1.3 SOC Medium
Tryptone 20.0 g
Yeast Extract 5.0 g
NaCl 0.5 g
dH2O ad 980 ml
After autoclaving, 10 ml of MgCl2 and 10 ml of MgSO4 are added. Prior to use, 2 ml of 20%
(w/v) filter-sterilized glucose are added to 100 ml medium.
2.2.1.4 R2A Agar
R2A Agar is recommended by its distributor Fluka for plate counts of water samples using
longer incubation periods and was used for plate counts in the Microcosm Experiments. R2A
2 Materials and Methods
23
Agar is available in a ready to dissolve composition and 18.12 g must be suspended in 1 L of
distilled water.
Casein acid hydrolysate 0.5 g
Yeast Extract 0.5 g
Proteose Peptone 0.5 g
Dextrose 0.5 g
Starch soluble 0.5 g
Dipotassium phosphate 0.3 g
Magnesium sulfate 0.024 g
Sodium pyruvate 0.3 g
Agar 15 g
dH2O ad 1000 ml
2.2.1.5 M9- Minimal Medium (Sambrook et al. 1989)
M9-Salt Solution (x10) 100 ml
Trace Element Solution 2.5 ml
dH2O ad 1000 ml
M9 minimal medium was supplemented with 0.2% Na-citrate (×1H2O) or 10 mM benzoate as
carbon sources.
2.2.1.5.1 M9 Salt Solution (×10)
Na2HPO4 x 2 H2O 89.00 g 0.500 M
KH2PO4 29.94 g 0.220 M
NaCl 49.67 g 0.850 M
NH4Cl 4.01 g 0.075 M
dH2O ad 1000 ml
2.2.1.5.2 Trace Element Solution (×400)
2x Salt Solution 50 ml
MgSO4 25 ml 6.16 g 0.25 M
FeSO4 × 7H2O 2.5 ml 0.25 g 0.018 M
dH2O ad 100 ml
MgSO4 and FeSO4 were prepared separately before addition. MgSO4 was added from a 1 M
stock solution and a 10% FeSO4 stock solution was prepared that was titrated to pH 2 by the
addition of H2SO4. Both stock solutions were sterilized by filtration prior to use.
2 Materials and Methods
24
2.2.1.5.3 Salt Solution (×2)
MgO 0.75 g 0.018 M
FeSO4 x 7 H2O 2.0 g 0.007 M
ZnSO4 x 7 H2O 1.44 g 0.005 M
MnSO4 x 4 H2O 1.12 g 0.007 M
CuSO4 x 5 H2O 0.25 g 0.001 M
CoSO4 x 7 H2O 0.28 g 0.0009 M
H3BO3 x 7 H2O 0.06 g 0.0003 M
37% HCl 51.3 ml
CHCl3 2 ml
dH20 ad 1000 ml
2.2.2 Culture Conditions
Bacteria were cultivated in a suitable medium (see above) and shaken on a rotary shaker
overnight for 14-18 h at 180-220 rpm and 30°C (Ps. putida) or 37°C (E. coli).
2.2.3 Growth Measurements
2.2.3.1 Optical Density
Growth in liquid culture was followed by measuring the optical density at 600 nm with
Shimadzu Cell Positioner CPS-260 Spectrophotometer (Shimadzu Deutschland GmbH,
Duisburg, Germany) or Ultrospec100 (Pharmacia Biotech, now Amersham Biosciences,
Freiburg, Germany).
2.2.3.2 Determination of Cell Density by Cultivation
For the determination of cell density the liquid culture was diluted with 1% NaCl so that
colony numbers on solid medium (petri dish, 16 cm in diameter) could suitably be counted
(between 30 and 300 colonies per plate). Serial dilutions of the liquid culture were prepared of
which three successive dilutions were plated in triplicates to validate the results (see also
1) Mixture of a 1018 bp fragment and its multimers and pBR322 fragments (23 fragments) 2) λ-DNA, cleaved with HindIII (8 fragments) 3) Enzyme pattern of specifically constructed enzyme (15 fragments)
2.4.2 DNA Quantification
Boehringer Mannheim (now Roche) provides λ phage DNA solutions of defined
concentrations (62.5, 125. 250, 500 ng/6 µl) which are useful for a rough estimation of the
sample DNA concentration from the ethidium bromide signal in the agarose gel. For more
exact measurements, the absorption at 260 nm was determined in a spectrophotometer. An
absorption of 1 equals 50 µg dsDNA ml-1 (Sambrook et al. 1989). Protein contamination
could be taken into consideration by taking an additional absorption measurement at 280 nm.
The ratio [absorption at 260 nm/ absorption at 280 nm] should be approximately 1.8 - 1.9 for
pure DNA (Sambrook et al. 1989).
2 Materials and Methods
31
2.4.3 Enzymatic DNA modification
2.4.3.1 Restriction Enzyme Cleavage
Restriction digests were performed with restriction enzymes from New England Biolabs
(NEB, Inc., Beverly, Maine, USA), with the appropriate 1× buffer for 2 h, at the temperature
that was recommended for a particular enzyme by the manufacturer. Incubations were carried
out in a thermoblock or waterbath, and Bovine Serum Albumin (BSA) was added if
recommended by the manufacturer. Enzyme concentration was chosen in agreement with the
recommendations of NEB depending on DNA and enzyme stock concentration, adding 1 µl of
enzyme to 50 µl restriction digest mix.
2.4.3.2 DNA Dephosphorylation
In the progress of cloning, insert and vector may be ligated after having been digested with
the same restriction enzyme(s). If digested with a single restriction enzyme only, the vector
can recircularise during ligation without incorporating an insert fragment, and thus reducing
cloning efficiency by increasing the vector background. This can be avoided if the vector is
dephosphorylated, i.e. if the DNA 5’-phosphoryl termini required by ligases are removed.
Dephosphorylation was achieved by treatment with Calf Intestine Alkaline Phosphatase (CIP,
Boehringer Mannheim, now Roche, Mannheim, Germany), during which 1 pmol 5’
phosphorylated (sticky or blunt end) DNA were incubated with 1 unit of Alkaline
Phosphatase for 1 h at 37°C.
2.4.3.3 Fill-In of 3’ Recessed Ends
The Large Fragment (Klenow Fragment) of E. coli DNA Polymerase I possesses the ability
for polymerisations but in contrast to the holoenzyme does not degrade 5’ termini. It was used
for filling in 3’ recessed ends, i.e. making blunt ends from sticky ends, if no suitable
restriction site was to be found for a cloning strategy. If a particular orientation of the insert
within the plasmid was desired, restriction digest or PCR needed to be performed for analysis
of the plasmid.
2.4.3.4 Ligation
For genetic manipulations it was commonly necessary to insert a fragment into a particular
plasmid vector. To achieve this, the circular plasmid vector was cut open enzymatically with
either the same endonuclease that had been used to prepare the insert, or with an enzyme that
resulted in compatible overhangs. Plasmid and vector then needed to be ligated to be
2 Materials and Methods
32
covalently bonded. The enzyme T4 DNA ligase catalyses the formation of a phosphodiester
bond between juxtaposed 5’ phosphate and 3’ hyroxyl termini in duplex DNA or RNA in the
presence of ATP. It can join both, blunt-end and cohesive end termini and repair single
stranded nicks in duplex DNA or RNA. For a ligation a surplus of the insert was supplied
exceeding the plasmid vector by 3–10 times. The 10 µl reaction volume was made up of 1 µl
of 10×ATP-containing reaction buffer, 1 µl of T4 DNA ligase (New England Biolabs GmbH,
Frankfurt/Main, Germany), between 5 and 15 ng of plasmid vector and between 45 and 100
ng of insert. If the total volume of 10 µl was not reached, the corresponding amount of dH2O
was also added to the mixture. The ligation mixture was incubated over night at 14 °C and
plasmids transformed the next day (see 2.4.5).
2.4.4 DNA Purification Techniques
For most molecular applications pure DNA is required as contamination may have inhibitory
effects on enzymatic reactions. Hence, the removal of RNA, proteins or salts is mandatory.
2.4.4.1 RNA Removal
Plasmid DNA isolated with the Alkaline Lysis Method was usually contaminated with RNA
which could be fully removed if 1 µl of 100 µg ml-1 RNAse (Bovine Pancreas, Boehringer
Mannheim, now Roche, Mannheim, Germany) was added to a 30 or 50 µl restriction digest.
2.4.4.2 Phenol/Chloroform Extraction
Preparations of chromosomal DNA could not be purified in spin columns due to the size of
the genome. However, it could be purged of protein by chloroform/isoamyl alcohol
(24:1 (v/v)) extraction. For very pure DNA, a phenol/chloroform/isoamyl alcohol (25:24:1)
extraction was performed. Phenol removes proteins more powerfully but it interferes with
many molecular methods (e.g. inhibits PCR if present in concentrations >0.2%; QIAGEN
News Letter, no.1, 1997). Therefore, if phenol extractions could not be avoided they were
always succeeded by chloroform extraction by which most of the phenol was removed. Traces
of the volatile chloroform disappeared if the DNA was vacuum dried (DNA Speed Vac-
Actinosynnema mirum (I), Actinoplanes auranticolor (J), and Pseudomonas fluorescens R2f
(K; Figure 2-1).
2 Materials and Methods
46
M A B C D E M F G H I J KM
A
B
CD
EF
G
H
I
J
K
M A B C D E M F G H I J KMM A B C D E M F G H I J KM
A
B
CD
EF
G
H
I
J
K
Figure 2-1 Composition of 16S rDNA standard used in Thermo Gradient Gels. See text for the strains matching the 16S rDNA bands in lanes A - K. A combination of the marker strains was run in the lanes designated M. The most protruding bands are associated with the organisms from which they derive, however, most organisms can be matched with several bands of which not all are indicated for lane M.
2.7 Sequencing
DNA sequencing was carried out with ABI PRISM™ 377 und ABI PRISM™ 3100 Genetic
Analyser exploiting the dideoxy mediated chain termination method devised by Sanger et al.
Perkin Elmer, Überlingen, Germany). Detection was at 253.7 nm, the gap opening was 2 nm
and a 5 mA Hollow Cathode Lamp (HLC) was the source of light. The detection limit was
0.4 µg L-1. Measurements were compared with a calibration curve obtained by chemical
reduction of a standard mercury solution (1 g L-1 HgNO3) with SnCl2. Mercury transformation
2 Materials and Methods
53
rates increased in a linear fashion between 0 and 14 mg L-1 Hg. The data were recorded with a
dot matrix printer (Perkin Elmer EX800).
For kinetic studies, precultures of the constructs were grown overnight in M9 (+benzoate)
medium without mercury, inoculated 10% into fresh M9 (+benzoate) medium without
mercury and grown to an optical density of 1.3 at 600 nm (late exponential phase). Mercury
reduction of Hg2+Cl2 to Hg0 was initiated by injecting 1 ml of cell suspension into 5 ml
M9 (+benzoate) medium amended with mercury (3 or 6 mg L-1 Hg2+ as HgCl2). The
measurements were carried our in triplicates, each vessel (Nalgene, polycarbonate, 50 ml) was
incubated at 30 °C for 2.5 min after injection. The cell suspension was mixed inside the vessel
with a magnetic stirrer at 350 rpm and ultimately aerated vigorously with compressed air for
0.5 min to blow the produced Hg0 into the CVAAS. This procedure was repeated 4 times for
each vessel for a full measurement.
Before and after the injection, the cells were spread on LB agar medium in order to determine
the number of cultivatable cells injected into the mercury solution and to elucidate the fraction
of cells surviving the treatment.
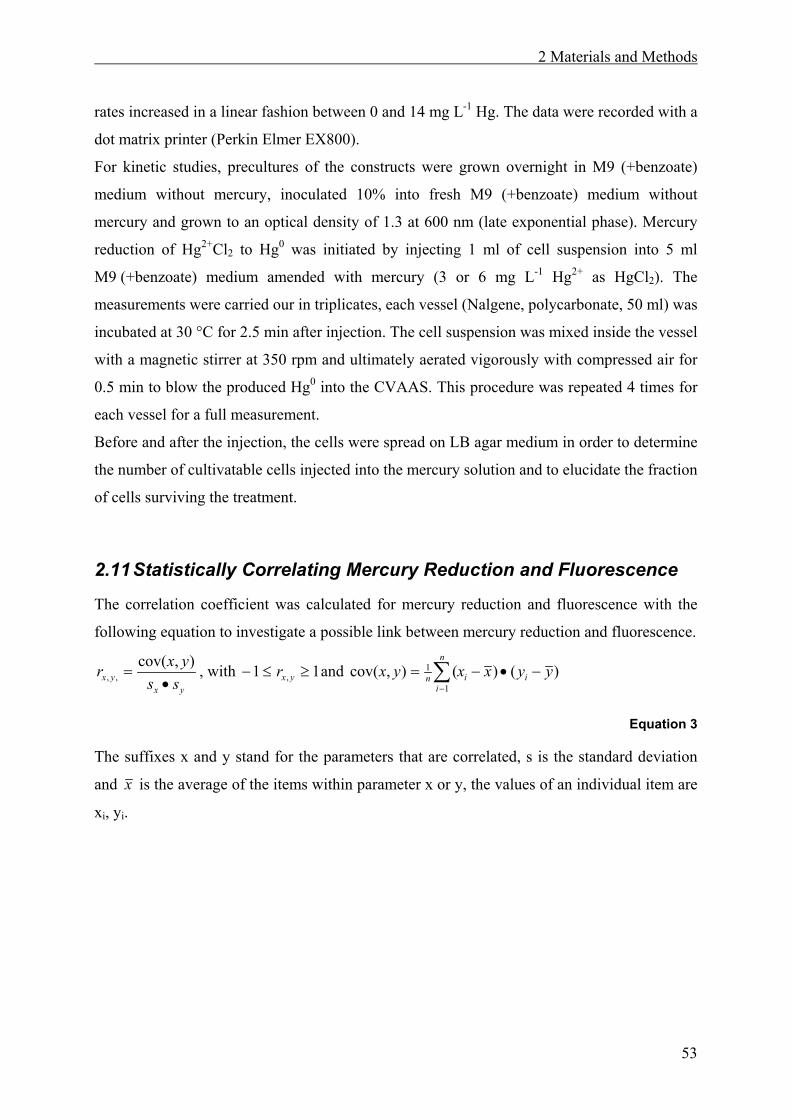
2.11 Statistically Correlating Mercury Reduction and Fluorescence
The correlation coefficient was calculated for mercury reduction and fluorescence with the
following equation to investigate a possible link between mercury reduction and fluorescence.
yxyx ss
yxr•
=),cov(
,, , with 11 , ≥≤− yxr and )()(),cov(1
1 yyxxyx ii
n
in −•−= ∑
−
Equation 3
The suffixes x and y stand for the parameters that are correlated, s is the standard deviation
and x is the average of the items within parameter x or y, the values of an individual item are
xi, yi.
3 Results
54
3 Results
3.1 Stream Microcosm Experiments
Knowledge of the genetic modification in a GEM is important as it might explain deviating
behaviour of the GEM from the wildtype or parent. The deduced effects of the modification
remain, however, mere speculation, unless the behaviour of both, modified and unmodified
strain, are examined under specified conditions. Here, the influence of the GEM on the
indigenous bacterial community in river water and sediment microcosms was investigated to
evaluate its safety in the situation of a release.
Two main microcosm experiments were conducted. The first experiment was carried out to
examine the survival of the GEM and its effect on the indigenous microbial community. The
second experiment was performed to investigate gene transfer in the presence or absence of
phenyl mercuric acetate (PMA) as selective pressure. In the following these experiments will
sometimes be referred to as first and second microcosm experiment.
3.1.1 Stream Microcosm Design
A beaker filled with water and a hand full of sediment (and sometimes leaves) can be
sufficient to make a microcosm (e.g. Bale et al. 1988, Iwasaki et al. 1993, Muela et al. 1994,
Sobecky et al. 1996, Leff et al. 1997). These so called ‘simple’ microcosms have the benefit
that experiments carried out in them are relatively easily controlled, since comparably few
parameters influence the course of events during the experiment. In terms of simplicity,
reproducibility, and costs, such a microcosm would be the system of choice. However, it
encompasses only few features of the environment under study and largely ignores most other
parameters. ‘Complex’ microcosms on the other hand attempt to include more of the physical
and chemical variables and dynamics associated with the environmental habitat. This
complexity irrevocably results in quite extensive experimental set-ups (e.g. Rochelle et al.
1989, Wagner-Döbler et al. 1992, Hill et al 1994, Ashelford et al. 1995, Pauling & Wagner-
Döbler, submitted) paying tribute to the multilayered nature of the habitat. For this work
stream microcosms were best capable to represent the characteristics of a river in the
laboratory (Warren & Davis 1971).
3 Results
55
overflow
Water recycling
GEM or wt H 2 O
M9
Sediment
water
air inPre-chamber
Main chamber
Post chamber
Figure 3-1 Schematic view of the stream microcosm. The GEM or the parent strain Ps. putida KT2440 (“wildtype” = wt) or both were cultivated respectively in chemostats containing M9 minimal medium (Wagner-Döbler et al. 1992) with benzoate as sole carbon source. The microorganisms were added continuously to the respective microcosms. Water and inoculated bacteria were mixed in the pre-chamber by bubbling air in through an aeration stone.
For the stream microcosm constructed for this work, downstream flow was achieved by the
continuous addition of water. To increase water flow and to avoid build-up of bacterial
density- or nutrient- gradients, the water was recirculated. A plant light was implemented to
control primary production and water temperature was constant at 22°C. The microcosms
were filled with near riverbank sediment and water from the Elbe River at Magdeburg. After a
recycling period of 1½ weeks during which a stable bacterial community could establish, the
microcosms were continously fed with tap water and superfluous water was drained.
Inoculation occurred continuously from chemostats. For more technical information refer to
chapter 2.8.1.
Many stream microcosms in the literature have been constructed to be used outdoor (e.g.
Schulz & Liess 2001, Dodds et al. 1999). The microcosms described here (Figure 3-1) were
built to be operated indoor, in a laboratory. Three parallel microcosms (each 70 × 15 × 25 cm
in length, depth and height) could easily be fit under a fume hood (ca. 150 × 70 cm in length
and depth), allowing research involving toxic and volatile compounds (PMA was used in the
second microcosm experiment).
3 Results
56
3.1.2 Flow Characterisation of the Stream Microcosm
The rationale of constructing a new stream microcosm was to develop a system that would
well represent near-bed conditions of a river to carry out experiments regarding the impact of
Ps. putida KT2442::mer73. Requirements were that the flow of water through the microcosm
be relatively laminar to allow bacteria to settle to the sediment and avoid abrasion by
turbulent flow. Flow velocity was to resemble speeds that can be found in nature, although
flow velocities close to the sediment are regularly slow.
Therefore, examination of the microcosm concerning its flow characteristics was mandatory
before carrying out the impact experiments. Flow visualization experiments were carried out
by pipetting a saturated solution of Crystal Violet into the inflow (see 2.8.2).
00’’ 04’’ 08’’
12’’ 16’’ 20’’
24’’ 28’’ 36’’
44’’ 52’’
00’’ 04’’ 08’’
12’’ 16’’ 20’’
24’’ 28’’ 36’’
44’’ 52’’
00’’ 04’’ 08’’
12’’ 16’’ 20’’
24’’ 28’’ 36’’
44’’ 52’’
Figure 3-2 Visualization of Flow in the Stream Microcosm. A saturated crystal violet solution was added to the pre-chamber via a Pasteur pipette and the time course of its distribution photographed. Time-lapses between the pictures were as indicated. Good mixing of dye and water could be observed before the crystal violet entered the main-chamber. Surface flow was visibly quicker initially, however, a dye front reaching down to the sediment bottom reached the outflow collimator. Further mixing of dye and water in the main-chamber accounted for attenuation of outflow. Turbulence of water flow was transitional with a Reynolds number between 400 and 1650.
During the addition of crystal violet to the microcosm, it could be observed that flow within
the funnel (connecting the tube with the acrylglas trough) was spiralling (data not shown).
The aeration stone supplying air to the system was placed directly in front of the inflow
funnel and helped to distribute the water within the pre-chamber before it would flow through
the collimator (Figure 3-1). Air bubbles from the aeration stone affected the current adding an
3 Results
57
upward momentum. Thus flow appeared first at the surface in the main chamber and a clear
spot remained in the lower part of the water column for about one third of the main chamber
length. This spot successively filled with dye coming from the pre-chamber as well as through
some backward flow as current progressed.
Since turbulence is a major parameter in rivers controlling such events like settling of bacteria
and availability of nutrients, the Reynolds number is an important measure. The Reynolds
number which describes the turbulence of a moving gas or liquid is given in the following
equation:
ReUL
=ν
Equation 4
where U is the velocity of the water (here 9.3×10⁻⁴ m sec-1), L is the characteristic length, i.e.
the length of the main chamber in our case (0.5 m), and ν is the kinematic viscosity
(1.004×10⁻⁶ m2 s-1 for freshwater at 20°C). With these parameters the Reynolds number was
463, indicating laminar flow. Only at Reynolds numbers greater than 2000 flow is turbulent
(Vogel 1989). However, Allan (1995) termed “transitional flow” in addition to laminar and
turbulent flow if the Reynolds numbers lies between 500 and 103-104. Visually determined
velocity in the main chamber was considerably higher than theoretically expected (Figure 2).
Passage of the dye through the main chamber took approximately 24 sec, i.e. flow speed was
3.3×10⁻³ m sec-1, which was nearly a factor 4 quicker. With this velocity the Reynolds number
computed to 1650, for which flow could be considered transitional. This discrepancy between
calculated and visually determined flow velocity can be attributed to differences in local flow
patterns. For example a nearly still area could be observed in the bottom part of the post-
chamber reducing the effective volume in the velocity calculations. A delayed entrance into
the main chamber or the post-chamber could be seen at the collimators. For these reasons,
water velocity in the main chamber was considerably higher than theoretically calculated for
the whole microcosm system.
3.1.3 Preliminary Microcosm Experiments
Before starting with the microcosm experiments, several questions needed clarification. Was
there a bacterial density gradient over the length of the microcosm? In this case sampling at
different positions in the microcosm would have been valuable. What would be the most
effective method to remove bacteria that were attached to sediment particles? This problem
3 Results
58
has already been discussed in 1.3.1. In the second microcosm experiment one microcosm was
operated with PMA to create a selective pressure. What concentration should be used? The
results of experiments that were performed to give answer to these questions are presented in
the following.
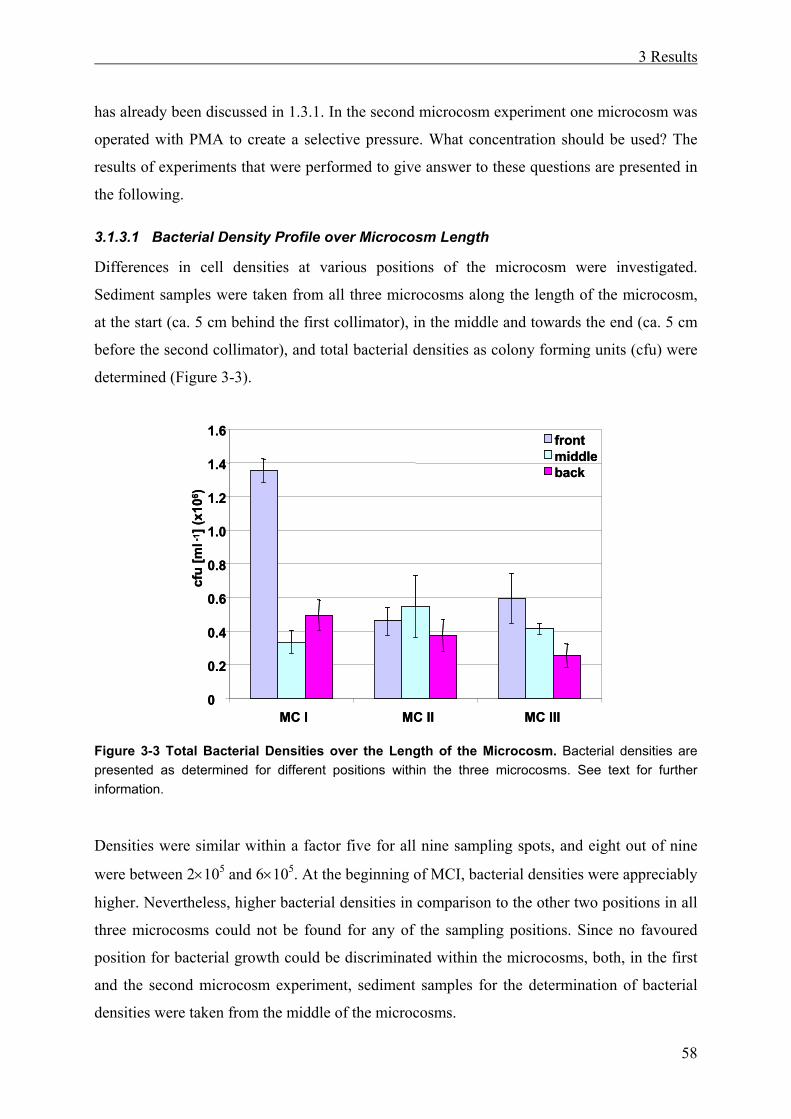
3.1.3.1 Bacterial Density Profile over Microcosm Length
Differences in cell densities at various positions of the microcosm were investigated.
Sediment samples were taken from all three microcosms along the length of the microcosm,
at the start (ca. 5 cm behind the first collimator), in the middle and towards the end (ca. 5 cm
before the second collimator), and total bacterial densities as colony forming units (cfu) were
determined (Figure 3-3).
0
0.2
0.4
0.6
0.8
1.0
1.2
1.4
1.6
MC I MC II MC III
cfu
[ml-1
] (x1
06)
frontmiddleback
0
0.2
0.4
0.6
0.8
1.0
1.2
1.4
1.6
MC I MC II MC III
cfu
[ml-1
] (x1
06)
frontmiddleback
Figure 3-3 Total Bacterial Densities over the Length of the Microcosm. Bacterial densities are presented as determined for different positions within the three microcosms. See text for further information.
Densities were similar within a factor five for all nine sampling spots, and eight out of nine
were between 2×10⁵ and 6×10⁵. At the beginning of MCI, bacterial densities were appreciably
higher. Nevertheless, higher bacterial densities in comparison to the other two positions in all
three microcosms could not be found for any of the sampling positions. Since no favoured
position for bacterial growth could be discriminated within the microcosms, both, in the first
and the second microcosm experiment, sediment samples for the determination of bacterial
densities were taken from the middle of the microcosms.
3 Results
59
3.1.3.2 Detachment of Bacteria from Sediment Particles
For the determination of total or mercury-resistant colony numbers in sediment it was
essential to detach the bacteria from the sediment particles and transfer them to a liquid phase
that could be diluted and easily spread on agar medium. Cells can be removed from soil or
sediment particles by vigorous shaking (on a vortex at full speed, 2500 rpm, MS 1
Minishaker-Vortexer, IKA-Werke GmbH & Co. KG, Staufen, Germany) or by sonication
(Sonorex Super RK510H Bandelin, Berlin, Germany). Wagner-Döbler et al. (1992) extracted
bacteria from sediment by diluting the sediment sample 1:4 (w/v) in phosphate buffer and
shaking it on a vortex for 1 minute. To test what treatment would most successfully extract
the cells from the sediment, sediment samples were diluted 1:1 in PBS Buffer and subjected
to sonication or vigorous shaking for different periods of time (Figure 3-4). The treatment was
carried out in duplicate and each treatment sample spread in three serial dilutions and
triplicates as described in 2.8.6. Two minutes of sonication or vigorous shaking yielded the
greatest number of cfu. While extension of vigorous shaking did not seem to have much of an
effect, two min of sonication rendered nearly 10 times as many colonies as 1 min of
sonication.
In a second experiment combinations of vigorous shaking and sonication were tried (Figure
3-5). One min of mixing, 2 min of sonication and an additional min of shaking yielded the
greatest number of colonies, while if the time for sonication was increased, the number of
colonies was reduced. Again, different times of mixing on the vortex did not yield significant
greater colony numbers. Mixing the sediment sample on the vortex for 2 min yielded similar
colony numbers as in the first (Figure 3-4).
3 Results
60
100
101
102
103
104
105
106
107
2'V 1'V 30''V 1'S 2'S
cfu
g-1
Exp.1Exp.2
100
101
102
103
104
105
106
107
2'V 1'V 30''V 1'S 2'S
cfu
g-1
100
101
102
103
104
105
106
107
2'V 1'V 30''V 1'S 2'S
cfu
g-1
Exp.1Exp.2
Figure 3-4 Detachment of Bacteria from Sediment Particles I. Sediment samples were mixed with PBS Buffer in a 1:1 (w/v) ratio and spread on R2A agar medium in serial dilutions and in triplicates. On the x-axis “minute” and “second” are abbreviated with their navigational pendants, “V” stands for vortex treatment and “S” for sonication (e.g. “2’V” means that the sample was shaken on the vortex for 2 min). The blue and purple bars represent results from two separate however identical experiments. Although plated in several dilutions, merely the results from the 10-3 dilution are shown for statistical comparability (also see chapter 2.8.7). Cfu counts at other dilutions, however, yielded similar results. The standard deviation from triplicate plating is shown by error bars.
100
101
102
103
104
105
106
107
2'V
1'V2'S
2'V2'S
1'V2'S
1'V
1'V3'S
1'V
1'V10
'S1'V
cfu
g-1
100
101
102
103
104
105
106
107
2'V
1'V2'S
2'V2'S
1'V2'S
1'V
1'V3'S
1'V
1'V10
'S1'V
cfu
g-1
Figure 3-5 Detachment of Bacteria from Sediment Particles II. Since the duplicates from the first experiment had yielded similar colony counts, single treatments for the second experiment were performed, only. However, each treatment sample was spread in three serial dilutions and in triplicates. One treatment (“2’V”) from the first trial was repeated and rendered similar colony counts as in the first experiment.
3 Results
61
3.1.3.3 Effect of PMA on Bacterial Densities
The effect of different PMA concentrations on total bacterial densities was tested in a separate
experiment using 250 ml Erlenmeyer flasks. Each flask was filled with 30 g of wet sediment
from the Elbe River (corresponding to 10.6 g dry sediment) which was covered with 150 ml
Elbe River water and supplemented with 0, 100, 250 or 1000 µg Hg (PMA) per Litre
(corresponding to 0, 0.5, 1.25 and 5 µM Hg). Each mercury concentration was tested in
duplicate flasks. The Erlenmeyer flasks were shaken gently at 120 rpm to avoid suspension of
the sediment but to allow movement of the water phase. After 36 h the flasks were sampled
and the total bacterial densitiy determined for sediment on R2A Agar (see section 2.2.1.4).
When the experiment was repeated, flasks were sampled after merely 6 h and total bacterial
densities determined both, for water and sediment. Unexpectedly, cell densities only differed
by a factor five when amended with 1000 µg L-1 PMA compared with no addition of PMA. It
was even more surprising to find cell density increase in the sediment with increasing
mercury concentrations. This trend was confirmed in the second experiment although the
effect was not as pronounced and total cell densities determined half of those in the first
experiment. A possible explanation is the die-off of cells that were not resistant but released
compounds which served as nutrients to the surviving cells, thus promoting their growth.
After 36 h (and to a lesser extent after 6 h) the PMA-resistant bacteria could have transformed
the mercury allowing for continued growth of sensitive cells. However, the differences were
only minimal and within one order of magnitude.
In the water, cell densities were an order of magnitude lower than in the sediment. Here, the
cell densities were decreasing with increasing PMA concentrations, although the trend was
only minimal, with the density at 1000 µg L-1 mercury being not even half the density without
mercury. The fact that less cultivatable cells were in the water while the cfu increased for the
sediment supports the above suggestion that dead cells may have served as a source of
nutrients for the remaining bacteria.
For the second microcosm experiment, when PMA was added to one of the microcosms in
order to create a selective pressure, a concentration of 250 µg L-1 mercury (PMA) was chosen.
In this preliminary experiment it was shown that PMA at this concentration did not eliminate
the majority of the bacteria and did show a notable effect, in water and sediment.
3 Results
62
(A):
0
1
2
3
4
5
6
7
0 100 250 1000Hg concentration [µg L-1]
CFU
ml-1
(x10
5 )
36h6h
0
1
2
3
4
5
6
7
0 100 250 1000Hg concentration [µg L-1]
CFU
ml-1
(x10
5 )
0
1
2
3
4
5
6
7
0 100 250 1000Hg concentration [µg L-1]
CFU
ml-1
(x10
5 )
36h6h
(B):
0
1
2
3
4
5
6
7
8
0 100 250 1000Hg concentration [µg L-1]
CFU
ml-1
(x10
4 )
0
1
2
3
4
5
6
7
8
0 100 250 1000Hg concentration [µg L-1]
CFU
ml-1
(x10
4 )
Figure 3-6 Effect of different PMA concentrations on culturable cell densities in sediment (A) and water (B). Slurry microcosms were incubated for 36 h or 6 h and the sediment (or water and sediment) sampled to determine total bacterial densities. While it was a surprise to find the density increase in sediment with higher mercury concentrations, at the same time total bacterial density decreased in water.
3.1.4 Survival of Ps. putida KT2442::mer73 in Stream Microcosms
In order to investigate the survival of the GEM Ps. putida KT2442::mer73 in stream water
and sediment, three microcosms were operated in parallel. One was inoculated with the GEM
(designated MCI), one with the parent strain Ps. putida KT2440 (MCII) and one remained
uninoculated (MCIII) to obtain background data.
The microcosms were allowed to stabilize for 10 days prior to inoculation (recycling period)
with recirculation of water at 1000 ml min-1. For comparison, Eichner et al. (1999) operated
3 Results
63
laboratory scale sewage plants which they allowed to equilibrate for 1 week before they
started with their experiments. Schulz & Liess (2001) let their stream microcosms establish
for three weeks before introduction of the (macroinvertebrate) organisms.
On day 10, the tap water inflow was opened and fresh water added to the microcosms at
15 ml min-1. Ps. putida KT2442::mer73 was inoculated continuously into the system from
day 10 on to yield GEM numbers in the water between 101 and 102 cfu ml-1 (Figure 3-7).
From then on a slight decrease in total bacterial density was observed to day 55, the end of the
experiment. Although rivers in nature do not encounter repeated flow of nutrients and/or
bacteria, recirculation in this model was the best possible way to maintain a stable bacterial
community without access to natural river water. The implementation of a recirculation also
permitted much faster flow velocities.
The long-term inoculation of relatively small numbers of GEMs was performed to simulate a
continuous leak or wash-out of GEMs into a river. Two weeks after the start of inoculation, a
cell shock was performed, inoculating with the GEM to yield 2×10⁶ cfu ml-1 to imitate a
different scenario, namely the introduction of large numbers of GEM into a river, e.g. if
bioreactor contents would accidentally be flushed. In the water, the GEM did not grow to
higher cell numbers than introduced over the course of the experiment, neither by continuous
inoculation of low cell numbers, nor through introduction of large cell numbers (Figure 3-7).
In the sediment, a tenfold increase of GEM density could be observed over the time course of
the experiment (Figure 3-8). However, bacterial densities were fluctuating and a longer
observation period would have been necessary to confirm this trend.
3 Results
64
Cell shock 2×10⁶ cells ml-1 recycling
100
101
102
103
104
105
106
107
0 5 10 15 20 25 30 35 40 45 50 55
Time[d]
CFU
[ml-1
]
Total Bacterial Density in Water
100
101
102
103
104
105
106
107
0 5 10 15 20 25 30 35 40 45 50 55
Time[d]
CFU
[ml-1
]
recycling Cell shock 2×10⁶ cells ml-1
Density of Mercury Resistant Bacteria in Water
Figure 3-7 Microcosm Experiment I: Effect of the GEM on Densities of Total and Mercury Resistant Bacteria in the Water. [ ] Microcosm inoculated with the GEM (MCI), [ ] control microcosm that was inoculated with the parental wild type (MCII), [ ] un-inoculated control microcosm (MCIII), and [ ] GEM. Elbe water was recycled through the microcosms for 10 days before continuous addition of tap water and GEM or parent strain. At day 24 shock loads of the GEM were added to MCI yielding 2×10⁶ cells ml-1. For every sample bacterial densities were determined as cfu in triplicate. The standard deviation (sn-1) is also shown in the figures, although sometimes masked by the symbols.
3 Results
65
100
101
102
103
104
105
106
107
0 5 10 15 20 25 30 35 40 45 50 55
Time[d]
CFU
[g-1
]
recycling Cell shock 2×10⁶ cells ml-1
Total Bacterial Density in Sediment
100
101
102
103
104
105
106
107
0 5 10 15 20 25 30 35 40 45 50 55
Time[d]
CFU
[g-1
]
recycling Cell shock 2×10⁶ cells ml-1
Density of Mercury Resistant Bacteria in Sediment
Figure 3-8 Microcosm Experiment I: Effect of the GEM on Densities of Total and Mercury Resistant Bacteria in the Sediment. [ ] Microcosm inoculated with the GEM (MCI), [ ] control microcosm that was inoculated with the parental wild type (MCII), [ ] un-inoculated control microcosm (MCIII), and [ ] GEM. Elbe water was recycled through the microcosms for 10 days before continuous addition of tap water and GEM or parent strain. At day 24 shock loads of the GEM were added to MCI yielding 2×10⁶ cells ml-1. For every sample the bacterial densities were determined as cfu in triplicate. The standard deviation (sn-1) is also shown in the figures, although sometimes masked by the symbols.
3.1.5 Effect of the GEM on Total and Mercury Resistant Bacterial Densities
To determine an influence of the GEM on the cultivatable total or mercury resistant bacterial
numbers, cfu were determined over the course of the experiment (Figure 3-7 & Figure 3-8).
3 Results
66
Total bacterial densities declined approximately 10fold over time, both in sediment and water.
However, the same trend could be observed in all three microcosms (uninoculated and
inoculated with the GEM or the wild type Ps. putida KT2440) and thus cannot be ascribed to
the GEM. Mercury resistant bacterial densities remained stable after inoculation for about five
weeks both in water and sediment before declining 5-10fold.
During the recycling period total bacterial densities remained stable in the sediment and
increased 5fold in the water. In addition, mercury resistant bacterial densities increased in the
water from 3×10² to approximately 104 cfu ml-1 during this time period. At the same time
mercury resistant bacterial densities decreased one order of magnitude in the sediment. These
effects may be accredited to population shifts resulting from to the new constraints of the
microcosm (“artefacts of enclosure”, “succession and self-organisation”, “bottle effect”: Berg
et al. 1999, Schäfer et al. 2000, Beyers & Odum 1993, Wagner-Döbler et al. 1992). With the
cell shock on day 24, a brief increase of total and mercury resistant bacterial densities in water
could be observed in the GEM inoculated microcosm. Mercury resistant bacterial densities
were similar to those determined for the GEM, and after 8 days they had declined to densities
found in the control microcosms. The same effect was seen for total bacterial densities in the
water. In the sediment, densities of total and mercury-resistant bacteria remained rather
unaffected by the cell shock, possibly because GEMs only penetrated into the top layer of the
sediment after introduction.
3.1.6 Statistical Analysis of Total and Mercury Resistant Bacterial Densities
Figure 3-7 & Figure 3-8 suggest that total bacterial densities in all three microcosms were
identical. Statistical analysis was performed to confirm this homogeneity between the
microcosms (Table 3-1) by applying the t-test for paired observations (see 2.8.7; Sachs 1968).
This t-test takes the differences of the bacterial densities of two microcosms and compares
them to zero. If the two densities are equal (i.e. if the difference is close to or equal to zero),
the resulting t-values are below the critical t-value. If the differences between the two
microcosms are significant, the t-value will be greater than the critical t-value.
The t-values for total and mercury resistant cell densities in water and sediment confirmed
that there was no difference in the bacterial densities between the three parallel microcosms.
3 Results
67
Table 3-1 The t-values for the statistical analysis of the bacterial densities obtained for total and mercury reducing bacteria in the water and in the sediment. The critical t-value for a two sided t-test at a significance level of α=0.05 and 15 degrees of freedom (Total cfu in water) was ±2.131, for all other curves it was ±2.120 (α=0.05, df=16). Values below the critical t-value indicate equal bacterial densities that were significant.
t-values
MCI/MCII (+GEM/ +parent
strain)
MCI/MCIII (+GEM/
uninoculated)
MCII/MCIII (+parent strain/ uninoculated
Total cfu in the water 0.357 0.719 0.635
Hg-resistant cfu in the water 0.231 1.619 1.478
Total cfu in the sediment -1.094 -1.159 0.021
Hg-resistant cfu in the sediment -0.883 1.018 2.012
3.1.7 Influence of the GEM on the Indigenous Bacterial Community
TGGE has proven to be a powerful tool for community monitoring after environmental
changes (Muyzer and Smalla 1998). To detect whether the GEM would influence the
indigenous microbial community in sediment and water, samples from the first microcosm
experiment were profiled as patterns of amplified 16S rDNA fragments on thermogradient
polyacrylamide gels (Figure 3-9).
3.1.7.1 Changes in the Bacterial Community in the Sediment
The sediment samples yielded an extremely complex profile. More than 50 bands could be
detected with the naked eye. For comparison, Eichner et al. (1999) could find a maximum of
18 bands in activated sludge samples. The TGGE 16S rDNA profile from soil presented by
Engelen et al. (1998) contained ca. 20-30 bands, and with DGGE Rasmussen et al. (1998)
could visualise 25 vs. 50 16S rDNA bands for mercury contaminated soil vs. untreated soil.
A small community shift could be observed as the sediment was transferred from the Elbe
River to the microcosms (confinement effect, see above). Small differences between the
microcosms could further be observed in the beginning before inoculation (d=4), which might
well be within the experimental variability since they often occurred in all three samples from
one date. Later, there were no differences between the microcosms detectable. The 16S rDNA
band of the GEM ran in accordance with one community band. Since Ps. putida is a
widespread organism, likely also to inhabit Elbe River sediment, it is not surprising that the
community band could be observed on the gel before inoculation with the GEM.
3 Results
68
(A):
M M MM Elbe
d=0
1 2 3 1 2 3 1 2 3 1 2 3 1 2 31 2 3 GEM
GEM
d=4 d=9 d=14 d=21 d=28 d=42
(B):
M1 32 1 32 1 32 1 32 1 32 1 32M MM GEM
GEM
d=4 d=9 d=14 d=21 d=28 d=42
Elbe
d=0
Figure 3-9 Bacterial Community Profiles based on TGGE of 16S rDNA fragments amplified from sediment (A) and water (B) over the time course of the microcosm experiment. A 16S rDNA marker (M) and the pure GEM were included in the gel for reference. Of the three parallel microcosms, one remained un-inoculated (1), one was inoculated with the parent strain Ps. putida KT2440 (2) and one was inoculated with the GEM, Ps. putida KT2442::mer73 (3). The days of sampling are indicated above the sample triplets.
3 Results
69
3.1.7.2 Changes in Bacterial Community in the Water
Fewer bands could be amplified from the water samples. This was probably caused by
differences in diversity, as discussed by Torsvik et al. (2002). A drastic decline in the number
of bands after transfer of the samples to the laboratory could be observed with more than
30 bands in lane 1, representing the undisturbed water community based on 16S rDNA. The
complexity of the pattern was reduced over the course of the experiment to approximately
20 bands of which some became very dominant. Differences between the three microcosms
were undetectable on day 4 (before inoculation) and on days 21 - 42 (after inoculation).
Pronounced differences were, however, observed on day 9 (before inoculation) and on day 14
(after inoculation). This was also the time of a reduction in diversity from 30 to 20 bands,
caused by increased growth of some phylotypes and disappearance of others. Thus,
differences in community profiles may have been caused by differences in the succession
process, although the profiles eventually converged on day 21. The 16S rDNA band from a
pure culture of the GEM ran in accordance with a community band that may have been
derived from the GEM or from a wildtype Ps. putida strain since it was already present before
inoculation.
3.1.8 Gene Transfer in Stream Microcosms
Gene transfer to an isogenic recipient strain in a simulated river environment was investigated
in a second microcosm experiment including the influence of a cell shock and selective
pressure (Figure 3-10). Three microcosms were run in parallel of which one (MCI) was
inoculated both with the donor (Ps. putida KT2442::mer73) and the recipient (Ps. putida
KT2442::Tc). Phenyl mercuric acetate (PMA) was added to the inflowing tap water to a final
concentration of 250 µg L-1. The second microcosm (MCII) was also inoculated both with
donor and recipient but did not contain any mercury, and the third (MCIII) microcosm was
operated without the addition of donor and recipient and without mercury. During the
experiments donor and recipient were introduced continuously from two chemostats to yield
cultivatable inoculant densities between 104 and 106 g-1 sediment (wet weight). On day 48 a
cell shock was performed in MCI and MCII with 108 donor cells ml-1 in the water column. On
day 53 PMA was added to MCI to give a concentration of 10 mg L-1 mercury.
3 Results
70
(A): +PMA
100
101
102
103
104
105
106
107
0 5 10 15 20 25 30 35 40 45 50 55 60
Time [d]
CFU
[g-1
]
inoculation cell shock108 cells ml-1
Hg shock10 ppm Hg as PMA
100
101
102
103
104
105
106
107
0 5 10 15 20 25 30 35 40 45 50 55 60
Time [d]
CFU
[g-1
]
inoculation cell shock108 cells ml-1
Hg shock10 ppm Hg as PMA
(B): -PMA
100
101
102
103
104
105
106
107
0 5 10 15 20 25 30 35 40 45 50 55 60Time [d]
CFU
[g-1
]
inoculation cell shock108 cells ml-1
100
101
102
103
104
105
106
107
0 5 10 15 20 25 30 35 40 45 50 55 60Time [d]
CFU
[g-1
]
inoculation cell shock108 cells ml-1
Figure 3-10 Gene Transfer Experiment. Bacterial densities in the sediment of microcosms MCI (A) and MCII (B), both were inoculated with the donor Ps. putida KT2442::mer73 and the recipient Ps. putida KT2442::Tc. MCI (A) was in addition amended with PMA to create a selective pressure. Total bacterial densities are depicted with a square , mercury resistant micro-organisms with a triangle
, and donor and recipient are represented by a pink , and an orange star , respectively.
3 Results
71
Total bacterial densities in MCI (+PMA, inoculated with the GEM and the parent strain) and
MCII (-PMA, inoculated with the GEM and the parent strain) were approximately 106 per g
of sediment over the duration of the experiment (57 d) and slightly higher in MCI (but well
below 107 per g). The control microcosm MCIII also retained 106 cfu g-1 over the course of
the experiment (data not shown, for natural background see Table 3-2). This bacterial density
of cultivatable bacteria lies within the range that has been found before in uninoculated
aquatic sediment microcosms with sediments from the Rhine River, Germany (Pipke et al.
1992).
Table 3-2 Background levels of mercury and antibiotic resistant bacteria in Elbe River water and sediment samples. Samples were spread on agar plates directly after Elbe River sampling.
Growth medium Bacterial density in water (SD1)) [cfu ml-1]
Bacterial density in sediment (SD) [cfu g-1]
R2A 9.00×10³(0) 7.33×10⁵(4.44×10⁵)
R2A-PMA2) bd bd
R2A-Tc bd bd
R2A-Rif bd bd
M93) 9.67×101 (1,07×10²) 1.95×10³ (2.27×10³)
M9-PMA4) bd bd
M9-Tc bd bd
M9-Rif bd bd
bd: below detection 1)SD= standard deviation from triplicate plating 2)5 and 10 ppm mercury 3)supplemented with 10 mM benzoate as sole carbon source 4)1 ppm mercury
Mercury resistant bacteria both in MCI and MCII were mainly made up of the donor. In the
control microcosm (MCIII), mercury resistant bacteria rendered between 10 and 100 cfu g-1
only (data not shown, for natural background see Table 3-2) as determined on R2A agar with
5 ppm mercury (PMA). For soil much higher frequencies have been determined (Smit et al.
1998). However, others have found mercury resistant cell densities in soil (Ranjard et al.
2000) or marine sediments (Rasmussen & Sørensen 1998) within the same range.
With the above assumption, that determination of mercury resistant bacteria did in fact yield
donor numbers, the sparse data points for donor density can be completed and were between
104 and 105 ml-1 in MCI (+ PMA), i.e. up to one order of a magnitude greater than in MCII
3 Results
72
(no mercury). A possible explanation is a competitive advantage of the mercury resistant
donor strain compared with the natural population under selective pressure.
Recipient numbers were determined to be an order of magnitude higher compared with donor
numbers in both, MCI and MCII despite identical treatment with regard to cultivation and
inoculation to the microcosms. This was a consequence of different cell densities in the
chemostats in favour of the recipient (108 cfu ml-1 vs. cfu 107 ml-1). Rochelle et al. (1989)
found highest frequencies for conjugal gene transfer of a mercury encoding plasmid from a
mixed natural suspension of epilithic bacteria to Pseudomonas sp. at donor/ recipient ratios of
1.2 ×10⁻¹ and 1.7×10⁻³, therefore it may have been favourable for gene transfer to occur to
have a surplus of the recipients. In the control microcosm recipient selective plates showed a
background of between 102 and 103 cfu g-1 (for bacterial background levels see Table 3-2).
However, recipient cell densities in the inoculated microcosms were generally two to three
orders of a magnitude higher, thus the background did not affect the results
Transconjugant colonies were not found for the duration of the experiment. On selective
medium for false positives transconjugants colonies could sometimes be observed, especially
if much sediment was plated out together with the supernatant. However, those bacteria failed
to grow if transferred to fresh medium containing mercury and tetracycline.
3.1.8.1 Influence of a Cell Shock on Gene Transfer
The cell shock raised donor cfu densities temporarily but did not have any notable effect on
gene transfer. No transconjugant colonies could be made out even under conditions of
temporary donor surplus. It must be stated that recipient numbers were high throughout and
that the surplus of the donor only lasted for one day maximum. Nevertheless, the
donor/recipient ratio was altered from ca. 10-1 to nearly 1 until the end of the experiment.
However, this had no effect on gene transfer and did not result in transconjugant colonies.
3.1.8.2 Influence of a Mercury Shock on Gene Transfer
The mercury shock was applied as a selective force for the microorganisms to acquire
mercury resistance genes in order to survive. One day after the mercury shock both, recipient
and donor densities had dropped by at least one order of magnitude, probably due to die-off as
a direct consequence of the mercury shock. It was surprising to find the mercury resistant
GEM density diminish to a similar extent as the non-resistant recipient. This could be
explained by the high concentration of mercury added. Von Canstein et al. (2002a)
demonstrated highest mercury transformation rates in chloralkali waste water at 10 ppm
mercury. However, they used HgCl2 while in this experiment PMA was added. Horn et al.
3 Results
73
(1994) who constructed the GEM determined resistance levels towards PMA of up to 65 ppm.
They did, however, not add the mercury until the liquid culture had reached midlog phase.
They also used a medium containing citrate and casaminoacids which may have bound some
of the bioavailable mercury.
Since the total exchange of water in the microcosm was accomplished within 14 h it is not
surprising that cultivatable bacterial numbers recovered quickly. This included total bacterial
density and mercury resistant density that were not determined until 4 days after the mercury
shock. Until the end of the experiment no transconjugant colonies could be recovered.
3.1.8.3 Quantification of the GEM in Sediment Samples by Competitive PCR (cPCR)
Determination of bacterial densities by a cultivation-dependent method such as cfu
measurements bears numerous sources for error as already described in 1.3.1. Therefore, an
alternative approach that was cultivation-independent was pursued to quantify the GEM Ps.
putida KT2442::mer73 determining its chromosome equivalents (Felske et al., 2001). The
basis for this method was the elucidation of the flanking chromosomal sequences to the
insertion site of the mer operon in the construct strain (see 3.3). Both, Ps. putida genomic
DNA and mer operon DNA sequence can be found in many environmental samples.
However, the chimerical DNA region consisting of one end of the integrated mer operon
sequence and the flanking construct genomic DNA was specific for the GEM and hence
Figure 3-11 TGGE of PCR products from a competitive PCR co-amplifying a standard with total genomic DNA from MCII sediment samples. Standard concentrations added to the reactions were (1) 40, (2) 40/3 = 13.3, (3) 40/9 = 4.4, (4) 40/27 = 1.5, and (5) 40/81 = 0.5 fg. These correspond to (1) 4.6 × 10⁷, (2) 1.5 × 10⁷, (3) 5.2 × 10⁶, (4) 1.7 × 10⁶, and (5) 5.7 × 10⁵ GEM chromosomal equivalents.
The primers used for the amplification were RECb and GC-RECp (Table 2-4) that yielded a
fragment of 181 (142 + 39) bp in length. Besides the DNA sample from MCII (containing the
GEM, -PMA), another template, the so called standard was added to the reaction mixture in
known concentrations. This standard was almost identical to the GEM sequence to be
3 Results
74
amplified, except for a single base, that however, drastically changed the melting behaviour of
the product. The products of the two templates could therefore be separated in a thermo
gradient polyacrylamide gel (Figure 3-11).
To calculate the corresponding chromosome equivalents from the TGGE signals, the
molecular weight of one base pair which is approximately 650 g mol-1 was an important
parameter. The size of the standard DNA (or GEM chromosomal template between and
including the primer sites) was 159 bp which amounts to 1.0335 × 10⁵ g mol-1 of standard
DNA. In terms of standard molecule numbers (1 mol = 6 × 10²³ standard molecules or
chromosome equivalents), this corresponds to 5.8055 × 10³ per femtogram of standard
molecules (or 1.7225 × 10⁻¹⁹ g per molecule of standard or GEM chromosomal template
between and including the primer sites). Standard and template signals of equal intensity
could be found either in lane four (days 13 and 18) or in lane five (days 23 or 28). Lane 4
shows the reaction to which 8.6 × 10³ standard molecules had been added while lane 5 depicts
the reaction with 2.9 × 10³ standard molecules. When translating this into chromosome
equivalents per g sediment, the dilution added by the DNA extraction has to be taken into
account: DNA from 0.5 g of sediment were extracted and resuspended in 100 µl of sterile,
demineralised water of which 1 µl was added to the competitive polymerase chain reaction.
Hence, lanes four and five represent respectively 1.7 × 10⁶ and 5.6 × 10⁵ GEM chromosome
equivalents per g sediment. Interestingly, for these four sample dates, the cell density
determined in this way was tenfold compared with the results obtained by the cultivation
dependent measurements. However, it seems reasonable that the PCR also detected DNA of
dead, or non-culturable cells of the GEM. Moreover, upon introduction to the microcosm a
portion of the inoculated bacteria probably lysed, liberating their genomic DNA which may
have been stabilised by sediment components (clay minerals, humic acids) for some time
(Lorenz & Wackernagel 1994). In fact, the 142 bp DNA region necessary to obtain a signal in
the PCR may have remained intact much longer than the full genomic molecule. Similarly,
Felske et al. (2001) found a discrepancy between cfu and chromosome equivalents up to two
orders of a magnitude for bioreactor effluents which they attributed to the wash-out of mainly
old biofilm fragments harbouring dead cells or cells in no good condition that would not have
been culturable.
Here, the results of only four sampling dates and only for sediment samples are shown.
However, water samples and sediment DNA from different sample dates were submitted to
cPCR but did not give (good) signals. Moreover, to confirm these results, lower standard
3 Results
75
concentrations would have to be added since results here were mainly obtained for the lowest
of the five standard concentrations.
3.1.9 Mercury Resistant Community
The diversity of the merA gene in the different microcosms was investigated for the second
microcosm experiment, where PMA was added to one of the microcosms in order to create a
selective pressure (Figure 3-12). Community profiles of all three microcosms are shown for
each sampling date. Day 11 represents the last day of water recycling, before inoculation. Day
49 represents the day immediately after the cell shock. The sample was taken ca. 15 h after
the cell shock, so that a full exchange of water had occurred since the addition of bacteria. A
mercury shock was performed in MCI at day 53 with the addition of mercury yielding an
initial mercury concentration of 10 ppm in the microcosm.
Neither in the water nor in the sediment samples the GEM signals could be found reliably.
Although some diversity between the microcosms could be detected at all sampling dates
(including the time period before inoculation and PMA amendment), the appearance and
disappearance of bands seemed erratic and did not allow inferences.
The merA PCR involves an initial touch-down PCR and further cycles including an annealing
temperature as low as 46°C. The signals obtained gave rather diffuse bands in agarose gels
(not shown) suggesting the presence of unspecific bands However, with a community DNA
template the diffuse signal could also have been derived from a variety of specific merA
products of different lengths and was thus feasible.
3 Results
76
(A): d=11 d=23 d=38 d=49 d=53 d=57
M 1 2 3 1 2 3 G M 1 2 3 1 2 3 G M 1 2 3 1 2 3 G Md=11 d=23 d=38 d=49 d=53 d=57
M 1 2 3 1 2 3 G M 1 2 3 1 2 3 G M 1 2 3 1 2 3 G M
(B):
d=11 d=23 d=38 d=49 d=53 d=57M G 1 2 3 1 2 3 1 2 3 G M 1 2 3 1 2 3 1 2 3 G M
d=11 d=23 d=38 d=49 d=53 d=57M G 1 2 3 1 2 3 1 2 3 G M 1 2 3 1 2 3 1 2 3 G M
Figure 3-12 Community Profiles of merA (mercuric reductase) Fragments in Stream Microcosm. Profiles ar shown for (A) water and (B) sediment. M = 16S rDNA size marker, G = pure culture of the GEM Ps. putida KT2442::mer73. Days of sampling were as indicated. Profiles for MCI, MCII and MCIII are shown in lanes labelled 1,2,3 respectively.
3 Results
77
3.2 Construction of New Hg-Reducing, Fluorescent Strains
New mercury reducing, fluorescent strains were constructed by random Tn5-mutagenesis of
Ps. putida KT2440 with a promoterless merTPAB cassette consisting of the truncated,
regulatorless mer operon of the Serratia marcescence plasmid pDU1358, followed by one of
three different variants of a destabilized, FACS optimised GFP (Andersen et al. 1998). Figure
3-13 presents the cloning procedure schematically, while the respective steps are explained in
further detail below (Figure 3-14, Figure 3-15, Figure 3-16).
Ps. putida KT2442::mer73merTPABchr chrmerTPABchr chr
pCmC2
BglII
pJBA41pJBA46pJBA47
XbaI HindIII
pCmgC2-41 pCmgC2-46 pCmgC2-47
NotI BclI
pBSL299(-Sm)
merTPABI Ogfp
Ps. putida KT2440::mergfp
merTPABI OgfpmerTPABI Ogfp
Ps. putida KT2440::mergfp
pBVP1 pBVP6 pBVP7
SmaI
1) Amplification of genomically flanked merTPAB
2) Subcloning of amplicon into vector
3) Insertion of gfp
4) Excision of mergfp and ligation into transposon vector
5) Transposition
Figure 3-13 Cloning Strategy for New Constructs. (1) Initially, genomically flanked merTPAB from Ps. putida KT2442::mer73 was amplified to take advantage of restriction sites that were upstream and downstream of the merTPAB. (2) The amplicon was then subcloned into a plasmid vector, pCR TOPO BluntII, that was especially developed for the cloning of blunt end PCR products. The resulting plasmid was named pCmC1 (Figure 3-14). A shorter fragment consisting of the mer operon, still flanked by
3 Results
78
chromosomal DNA was excised and subcloned into a pUC19 variant, yielding pCmC2 (Figure 3-15). The plasmid pUC19 is a commonly used cloning vector with an ampicillin resistance and a multiple cloning site within the lacZ gene that allows for blue-white selection. (3) The pCmC2 was cut open immediately downstream the mer operon and the gfp ligated blunt yielding pCmgC41, pCmgC46 and pCmgC47 (Figure 3-16). (4) Finally, the mergfp cassette was excised from these vectors and cloned blunt into the mini-Tn5-transposon vector pBSL299 (Alexeyev et al. 1995) that was prior deprived of its streptomycin resistance to prevent transposition of the antibiotic resistance. The resulting plasmids were named pBVP1, pBVP6 and pBVP7 (Figure 3-17). At last, (5) the mini-Tn5-transposons were transferred into Ps. putida KT2440 in three biparental matings to create the constructs. The most important restriction sites are shown in this figure. See text for further information.
3.2.1 Subcloning of the Mercury Resistance Operon
A region of the Ps. putida KT2442::mer73 genome was amplified (UPforII & DOWNrev,
Table 2-4) generating a DNA fragment that encompassed the pDU1358 merTPAB-operon
flanked by Ps. putida KT2442 genomic DNA, 338 bp upstream and 136 bp downstream the
insertion, respectively. The amplification was carried out with Pfu Taq DNA Polymerase
(Stratagene, La Jolla, USA) which has retained its 3’-5’ exonuclease activity, excising bases
that have mistakenly been incorporated during strand extension. The amplicon was subcloned
into pCR TOPO BluntII to yield pCmC1 and transformed into TOP 10 One Shot competent
E. coli cells that were recommended by the manufacturer to be used with the pCR TOPO
BluntII (Table 2-1). The plasmid vector pCR TOPO BluntII has especially been developed for
cloning of blunt PCR products. Instead of performing a typical over night ligation prior to the
transformation, the blunt end PCR amplicon is joined with the vector by a topoisomerase I
that is covalently bound to the 3’ end of the linearized vector. This takes no more than five
minutes after which the vector can immediately be transformed into competent E. coli cells.
3 Results
79
+
Figure 3-14: Cloning of pCmC1. Ps. putida KT2442::mer73 genomic DNA served as template for a PCR yielding a fragment that consisted of merTPAB flanked by Ps. putida KT2442 chromosomal DNA. This amplicon was inserted into the TOPO cloning site of pCR BluntII TOPO. I- and O-ends of the previous transposition are shown as well as important recognition sites for restriction endonucleases and for primer annealing including their position on the plasmid. While the primer pair UPforII/DOWNrev was used for the generation of the fragment, the primer pair ALLES/DRAN marks the very ends of the merTPAB, amplifying the entire operon. MCS = multiple cloning site. Tm = melting point for the associated primer.
The resulting plasmid pCmC1 was digested with AvaI and ClaI, rendering a fragment with
310 bp of genomic DNA upstream and 104 bp downstream the merTPAB insertion which was
subcloned into AccI and AvaI digested pUC19oriT. Since AccI and ClaI are compatible
overhangs, this was a possible conjunction. The plasmid vector pUC19oriT carries in addition
to the ampicillin resistance and the lacZ an origin of transfer and can thus be transferred by
bacterial strains carrying tra-functions or if these are provided in trans. Although not relevant
3 Results
80
for this construction, for other applications the oriT can be of importance, for example to
transfer the plasmid by conjugation to bacterial strains, such as Pseudomonas, which are not
as easily transformed as E. coli. However, for this construction the resulting plasmid, pCmC2,
was transformed into Epicurian Coli® Electroporation-Competent Cells (E. coli XL1 Blue;
Table 2-1).
++
Figure 3-15 Cloning of pCmC2. Ps. putida KT2442::mer73 mer operon flanked by chromosomal DNA was inserted into pUC19oriT as AvaI/ClaI fragment from pCmC1. I- and O- ends of Ps. putida KT2442::mer73 are shown, as well as relevant recognition sites for endonucleases and sites for primer annealing and their positions on the plasmid.
3 Results
81
3.2.2 Creation of the mergfp Cassette
Three destabilized gfp variants with different half lives were used in this construction. The
last three amino acids of the GFP from pJBA41 are LAA, this variant has a half life of 2½
min. The GFPs from pJBA46 and pJBA47 end with ASV and AGA respectively and exhibit
half lives of 6 and >30 min. These GFP half lives were determined for E. coli (personal
communication with M. Strätz and B. Andersen). The first two variants, -LAA and -ASV,
were published in Andersen et al. (1998) where they were presented with half lives in E. coli
of 40 and 110 min respectively. The last GFP version, -AGA, was not presented in the
publication. Half lives, in Ps. putida KT2440, both for the -LAA and the -ASV variant were
determined in the publication to be 190 min. However, in this work, the variants differed
appreciably regarding their fluorescence due to differences in their transcriptional control.
The genes for the variants of destabilized GFP were excised from pJBA41, 46 and 47
(Andersen et al., 1998) with XbaI and HindIII and the cohesive ends filled with Klenow
Fragment to create blunt ends. The gfp fragments were inserted into pCmC2 that had been
prior digested with BglII, which lies immediately downstream the mer operon, and the
resulting sticky ends filled with Klenow Fragment. Both, fragment and plasmid were ligated
to yield pCmgC2-41, pCmgC2-46 and pCmgC2-47 (Figure 3-16) and transformed into E. coli
JM110. For mercury reduction and GFP fluorescence to be coupled it was mandatory that gfp
and mer operon be orientated in the same direction and transcribed from the same host
promoter. Therefore, orientation of the gfp in the pCmgC2 variants were verified by a PCR
that amplified the mergfp cassette (primers ALLES and GFPrev, data not shown, compare
Figure 3-20).
3.2.3 Cloning of the mergfp Tn5 Minitransposon
The mini-Tn5 transposon that was used for the integration of the mercury-resistance genes
and the gene for green fluorescence (mergfp) into the Ps. putida KT2440 genome, was
derived from pBSL299 (Alexeyev et al. 1995). This transposon plasmid vector carried a
streptomycin resistance gene between I- and O-ends which was excised with MluI and the
plasmid subsequently re-ligated to yield pBSL299∆Sm. This resistance would otherwise have
been transposed as well (see also 2.4.5.4).
3 Results
82
+
Figure 3-16 Insertion of gfp directly downstream mer. Cloning of the mer-gfp cassette into pCmC2 is shown for the most unstable GFP variant. Creation of the plasmid vectors containing the other two gfp variants was achieved likewise. I- and O-ends, relevant restriction sites and primers annealing sites are shown in the figure including their positions on the plasmid.
The mergfp fragment was obtained from pCmgC2-41, pCmgC2-46, and pCmgC2-47 with
NotI and BclI and blunted with Klenow fragment. In most E. coli strains the BclI restriction
cut site is methylated by the Dam methylase which transfers a methyl group from S-
adenosylmethionine to the N5 position of the adenine residue in the sequence GATC. It was
therefore crucial that the plasmids be transformed into the Dam- E. coli JM110 before they
could be digested with BclI. The resulting blunt-end mergfp fragments with the three
respective gfp variants were ligated into the SmaI site of the pBSL299∆Sm multi cloning site.
Ultimately, the resulting donor mini-Tn5 transposons pBVP1, pBVP6 and pBVP7 were
transformed into E. coli S17-1/λpir. This E. coli strain expresses the pir protein which is
essential for replication of the transposon plasmids (see also 2.4.5.4).
3 Results
83
+
-1
-2
Figure 3-17 Cloning of mergfp mini-Tn5 transposons. The mergfp cassette from pCmgC2-41 was excised and ligated blunt into pBSL299∆Sm, resulting in two types of vectors with opposite orientation of the mergfp cassette (pBVP1-1 and pBVP1-2). The recognition sites of the pBSL299∆Sm multi cloning site are shown as well as relevant restriction sites and primer annealing sites of CmgC2-41. The mergfp cassettes of pCmgC2-46 and pCmgC2-47 were processed likewise yielding pBVP6 and pBVP7. See text for further information.
3 Results
84
3.2.4 Selection of New Mercury Resistant Ps. putida Constructs
In three separate bi-parental matings pBVP1, pBVP6 and pBVP7 were transferred to the
recipient Ps. putida KT2440. Ps. putida does not express the π-protein and is therefore
incapable of replicating plasmids with a π-protein-dependent origin of replication such as the
pBSL299 derived donor plasmids. In the cells in which transposition occurred the mer-gfp-
cassette was integrated into the Pseudomonas genome (frequency of transposition of the
pBSL minitransposons was tested by Alexeyev et a1. 1995 in Klebsiella oxytoca and was in
the range of 10-5). Mercury-resistant Pseudomonas-strains were selected on M9-minimal
medium containing 10 mM benzoate as sole carbon source (which cannot be metabolised by
E. coli) and 6 ppm Hg2+ (as HgCl2).
From the selection plates 92 single colonies (30 each resulting from mutagenesis with pBVP1
and pBVP6, and 32 from mutagenesis with pBVP7) were picked and transferred to M9
minimal medium with 10 mM benzoate and 1 ppm Hg2+. This is appreciably less mercury
than was present in the selection medium. However, for the selection of transformants, a
concentrated cell suspension was added to the agar plates after the mating, i.e. biomass
containing proteins and amino acids with thiol groups that bind Hg2+ and thus decrease the
bio-available mercury (Chang et al., 1993; Farrel et al. 1993). If less biomass is sequestering
the mercury, lower Hg2+ concentrations are necessary to select for mercury-resistance in
bacteria. Nevertheless, all transformants grew well with 1 ppm, therefore single colonies of all
were transferred to solid M9 minimal medium with 3 ppm and 5 ppm Hg2+ (as HgCl2).
While all transformants were still growing equally well with 3 ppm, differences in growth
could be observed on plates with 5 ppm, i.e. some growing in thick streaks while others grew
thin with single colonies only, suggesting cell death of a great number of bacteria. Although
the number of colonies transferred from one plate to the next cannot be exactly quantified,
transfer of all colonies was performed equally by sterilizing the inoculation loop in the
Bunsen burner flame, then cooling it on the agar plate carefully before lifting a single colony
and streaking it onto the fresh agar plate. Colony size was approximately 0.3-0.5 cm in
diameter after three days (data not shown). To confirm the results obtained for the different
construct strains, single colonies of all transformants were streaked on fresh plates with 3 ppm
and 5 ppm Hg2+ once more (data not shown). Twenty strains with superior mercury resistance
were selected based on these results.
For these 20 transformants, the mercury resistance level was in addition determined
qualitatively by spreading overnight M9 (benzoate) cultures on solid M9 (benzoate) medium
and adding one drop (10 µl) of a concentrated [10 g L-1] HgCl2 stock-solution to the middle of
3 Results
85
the inoculated agar plate. After three days of growth, the diameters of the growth inhibition
zones were determined and the plates photographed (Figure 3-18, Table 3-3).
41-2 41-8 41-17 41-20 46-2 46-7
46-8 46-16 47-1 47-2 47-3 47-5
47-11 47-12 47-14 47-16 47-21 47-30
47-31 47-32 Mer73 KT2440
Figure 3-18 Inhibition Zones: Growth on M9 Agar with HgCl2. Fresh liquid overnight cultures of the 20 construct strains were spread on solid M9 minimal medium with benzoate as carbon source, and 10 µl of a 10 ppm mercury stock solution (HgCl2) were added to the centre of the plate. The agar plates were then incubated for three days at 30 °C and photographed.
3 Results
86
Table 3-3 Growth on M9 Agar with HgCl2: Diameters of Inhibition Zones. Seven of the new construct strains with the smallest inhibition zones are highlighted by bold print
Construct Strain (Ps. putida KT2440::mergfp)
Inhibition Zone- Diameter [cm]
Ps. putida KT2442::mer73 3.1 Ps. putida KT2440 4.3
41-2 3.2
41-8 3.6
41-17 3.2
41-20 3.6
46-2 3.6
46-7 3.2
46-8 3.3
46-16 3.5
47-1 2.8
47-2 3.5
47-3 3.4
47-5 3.6
47-11 3.4
47-12 3.5
47-14 3.1
47-16 3.61)
47-21 3.61)
47-30 4.0
47-31 3.5
47-32 3.11)
1)Since the inhibition zone for these strains was distorted, measure was taken in both dimension of the ellipse and the average was given.
In another preliminary experiment conducted to characterize mercury resistance of the strains,
10 µl of liquid cultures (M9 + benzoate; OD=1.3) were added in serial dilutions to freshly
prepared M9 (+ benzoate) agar plates containing 0, 3, 4, 5, 6 or 7 ppm of Hg (HgCl2). Plates
were incubated for three days and colonies counted.
After three days all construct strains showed colony densities on the plates ranging between 1
and 7×10⁸ cfu ml-1. All strains including the non-mercury-resistant Ps. putida KT2440 grew
on agar plates containing up to 4 ppm Hg (HgCl2), but not with 5 ppm Hg (HgCl2) or higher
concentrations.
3 Results
87
The non-resistant Ps. putida KT2440 formed notably smaller colonies on mercury containing
plates than on agar without mercury. Colony densities determined on agar plates without
mercury varied between the strains by a maximal factor of eight (Figure 3-19, results shown
for 10-5 dilution). Moreover, although colony densities were determined in triplicate, the
volume of culture added to the plate was minimal (10 µl), yielding relatively few colonies and
giving high standard deviations as indicated by the error bars.
However, if the attention is drawn to the decline in bacterial density at higher mercury
concentrations, the construct strains behave differently. Strains that hardly showed a decline
in colony densities with higher mercury concentrations were: Ps. putida
KT2440::mergfp 46-7, 46-8, 47-1, 47-3, 47-8, 47-11, 47-14, 47-16, 47-31, 47-32, and the two
mercury reducing strains Ps. putida KT2442::mer73 and Ps. putida KT2442::mer::gfp11. Ps.
putida KT2440::mergfp 47-21 failed to grow at all in this experiment.
To validate these results statistically, the experiment would have to be repeated using higher
volumes of culture added to agar plates. The sudden failure of all construct strains to grow
with 5 ppm Hg (HgCl2) cannot be fully accounted for, however, this has been observed before
with other mercury resistant bacterial strains (personal communication with Wanda Fehr). A
possible explanation that, remains to be confirmed would be that at this concentration (5 ppm
Hg), all unspecific binding sites within the agar, from dead cells or the petri-dish rendering
additional protection for the cells were saturated with mercury, so that a maximal number of
mercury molecules was acting on the cells.
3 Results
88
0
1
2
3
4
5
6
7
8
9
10
41-2
41-8
41-17
41-20 46
-246
-746
-846
-16 47-1
47-2
47-3
47-5
47-11
47-12
47-14
47-16
47-30
47-31
47-32
mergfpmer7
3KT40
cfu
ml-1
(x10
8 )
0 ppm3 ppm4 ppm
0
1
2
3
4
5
6
7
8
9
10
41-2
41-8
41-17
41-20 46
-246
-746
-846
-16 47-1
47-2
47-3
47-5
47-11
47-12
47-14
47-16
47-30
47-31
47-32
mergfpmer7
3KT40
cfu
ml-1
(x10
8 )
0 ppm3 ppm4 ppm
Figure 3-19 Decline in bacterial density with increasing mercury concentrations. Over night liquid cultures (10 µl) were pipetted in serial dilutions on agar plates with different mercury concentrations. Although, even without mercury, construct cultures did not yield the same densities, the decline in density allows differentiation of the strains with regard to their mercury resistance. Standard deviations from triplicates are shown by the error bars. See text for further discussion.
In order to verify purity of the transformants, M9 (+ benzoate) overnight cultures were
streaked on LB-medium and colony morphology observed to allow differentiation of Ps.
putida and E. coli. Colonies for all construct strains appeared to be Pseudomonas. However,
on LB agar medium it was not possible to select for transformant Ps. putida strains, as both,
donor and recipient were fluorescent and resistant to mercury. So purification of the
Pseudomonas construct strains relied on frequent transfers and cultivation on M9 minimal
medium with benzoate as sole carbon source which cannot be metabolised by E. coli.
A preliminary selection of the strains with the highest mercury resistance was undertaken
with the information obtained with the above tests. These were observed with a fluorescence
microscope (FITC filter: excitation at 475 nm, emission at 515 nm) to confirm GFP
fluorescence. The strains showing best fluorescence and mercury resistance are listed in Table
3-5.
3.2.5 PCR Proof of mergfp Integration
Integration of the mer-gfp cassette into the genome of the recipient Ps. putida KT2440 was
verified by PCR with primers binding to the 5’end of the mer operon and the 3’ end of the
gfp, respectively (ALLES & GFPrev, see Table 2-4), anticipating an amplicon of 3801 bp
(Figure 3-20). One PCR-tube contained the reaction mixture, however, DNA template was
3 Results
89
omitted in order to exclude signals due to contamination in the reaction mixture. Another
PCR-tube was complemented with ca. 1 ng of the donor vector pCmgC41 as positive control.
The genomic DNA of all selected constructs and of the positive control gave a PCR signal of
the expected length. The negative control did not give a signal.
2 8 17 20 2 7 8 16 1 241 46 47
3 5 11 12 14 16 21 30 31 32 47
40723054
40723054
(-)
(+)
2 8 17 20 2 7 8 16 1 241 46 47
3 5 11 12 14 16 21 30 31 32 47
40723054
40723054
2 8 17 20 2 7 8 16 1 241 46 47
2 8 17 20 2 7 8 16 1 24141 4646 4747
3 5 11 12 14 16 21 30 31 32 47
3 5 11 12 14 16 21 30 31 32 47
407230544072407230543054
407230544072407230543054
(-)
(+)
Figure 3-20 PCR proof of mer-gfp integration into the chromosomal DNA of Ps. putida. With chromosomal DNA as template the region between ALLES and GFPrev was amplified, expecting to yield an amplicon of 3.8 kb in length. The negative control did not contain any DNA template, the positive control contained pCmgC41 as template. The marker used was the 1 kb ladder (see Table 2-3).
3.3 Integration Sites and Genomic Environment in Ps. putida KT2442::mer73 and in the New Constructs
3.3.1 Revealing the Insertion Sites in Ps. putida KT2442::mer73 and in the New Constructs
Knowledge of the insertion site of a genetically engineered construct may help predict or
explain the abilities (or disabilities) of the modified strain. The Directive of the European
Parliament (2001/18/EC) considers good knowledge or description of the donor and recipient
and the vector used in the construction as essential prerequisites for the use of modified
organisms. Moreover, the integration site after transposon mutagenesis is unique for each
construct and can form the basis for a detection with molecular techniques.
3 Results
90
3.3.1.1 Sequencing the mer Integration Site in Ps. putida KT2442::mer73
To reveal the modified genotypes of both, Ps. putida KT2442::mer73 and the new constructs
the sequence of genomic DNA immediately flanking the insertion site was elucidated. One
method to amplify an unknown (genomic) sequence that lies next to a known DNA region is
by using inverse primers that anneal to both ends of the known region (in this case the mer
operon of Ps. putida KT2442::mer73, or mergfp cassette in the new constructs) but are
directed outwards. The inverse PCR renders a signal if the ends of the template consisting of
known (mer operon) and unknown sequence (genomic DNA) are joined (Figure 3-21). For
more technical details see section 2.4.7.
...TGCCACCGCACGGGATTTCGATGCCGTTGTAGGT...
PCR with inverse primers
self-ligation
Sequencing of the flanking chromosomal region
Restriction digest of genomic DNA Southern blot for size
determination of the mer carrying fragment
-
mer
Flanking chromosomal sequences
...TGCCACCGCACGGGATTTCGATGCCGTTGTAGGT...
-
mer
2
1
3
4
Figure 3-21 Inverse Polymerase Chain Reaction (redrawn from Ochman et al. 1988). (1) genomic construct DNA was digested with a restriction endonuclease. (2) The resulting fragments were self-ligated and (3) PCR performed with inverse primers. (4) The amplification signals were then sequenced. See text for further information.
Before the IPCR was performed, the size of the fragments carrying the mer operon was
revealed in a Southern blot (Figure 3-22). Ps. putida KT2442::mer73 genomic DNA was
digested with 12 different restriction endonucleases that did not cut within the mer operon,
blotted onto nylon membrane and hybridised with a DIG-labelled probe against the
transposed mer operon. Detection was achieved with a DIG-recognizing antibody-Alkaline
Phosphatase conjugate and a substrate that was dephosphorylated. The resulting phenolate
anion disintegrates to emit light that was detected on Kodak X-Omat x-ray film.
Figure 3-22 Southern Blot showing genomic Fragments containing the mer Operon. The arrow indicates the KpnI digested fragment that gave a good signal in the IPCR. Marker specifications in the first and last lane of the blot are indicated as kilobases.
Fragments resulting from digests with the 12 enzymes of genomic Ps. putida KT2442::mer73
DNA were also self-ligated and IPCR was performed (Figure 3-23) with the primers TSRIF &
LAIRT (Table 2-4). Knowing the size of the mer containing fragment (5.3 kb for KpnI-
digested chromosomal DNA), the length of the expected amplicon could be calculated by
subtracting the length of the mer operon (3.1 kb). Out of 12 enzymes 6 yielded mer-carrying
fragments greater 10 kb (see Figure 3-22), making it difficult to obtain a signal in the IPCR,
as PCR efficiency decreases with very long amplicons. With the KpnI digested, ligated
chromosome as template, the primer pair was expected to give a signal at 2.2 kb (Figure
3-23). A bright signal of that size could indeed be obtained and was confirmed by a nested
PCR with inverse primers annealing to the outermost regions of the mer operon (Table 2-4).
A diffuse signal was obtained that was shorter than the first IPCR signal by approximately
300 bp, which is the length difference of the amplicons of the two primer pairs.
The bright 2.2 kb amplicon from the initial IPCR was excised from the agarose gel and
sequenced with all four primers used in the IPCR and nested IPCR (TSRIF, LAIRT, SELLA,
NARD; Table 2-4). Of the mer-genome hybrid sequence 174 bp have been deposited in
GenBank under the accession number AJ251632.
3 Results
92
IPCR Nested IPCR
40723054203616351018
40723054203616351018
M Aa Ap B D K N Sm SpSs P Xb Xh M M Aa Ap B D K N Sm Sp Ss P Xb Xh MIPCR Nested IPCR
40723054203616351018
40723054203616351018
IPCR Nested IPCR
40723054203616351018
40723054203616351018
M Aa Ap B D K N Sm SpSs P Xb Xh M M Aa Ap B D K N Sm Sp Ss P Xb Xh M
Figure 3-23 IPCR and nested IPCR. Re-circulated, chromosomal fragments of the GEM were templates for a PCR with inverse primers against the ends of the mer operon. A nested IPCR was performed to verify the signal(s) from the original IPCR. The size of the marker (M) bands is indicated as number of basepairs. The individual lanes show results from genomic fragments that were created with different endonucleases: Aa=AatI, Ap=ApaI, B=BamHI, D=DraI, K=KpnI, N=NotI, Sm=SmaI, Sp=SpeI, Ss=SspI, P=PstI, Xb=XbaI, Xh=XhoI.
3.3.1.2 Sequencing the mergfp Integration Site in the New Constructs
How many mergfp cassettes have been transposed into the genomes of the construct strains
remains to be elucidated for all twenty new constructs. Since transposition is relatively rare
(10-5) it is highly likely that the constructs have received only one cassette, however, the
experimental proof by Southern Blot and hybridisation still needs to be furnished.
Inverse PCR with genomic construct DNA as templates was performed as described above
but with the primer pairs TSRIF & LAIRT for the first IPCR, and SELLA & GFPrevinv
(Table 2-4) for the nested IPCR (Figure 3-24). In contrast to the digests with many different
enzymes of Ps. putida KT2442::mer73 DNA, for the new constructs restriction digests before
IPCR were only carried out with KpnI and not with a whole range of enzymes. KpnI was
chosen because Ps. putida KT2442::mer73 DNA had yielded a good IPCR signal. Moreover,
Ramos et al. (2000) used KpnI for localization of an insertion in a Ps. putida KT2440
construct by a similar approach. The enzyme seemed to yield an optimal number of fragments
and fragment lengths with Ps. putida KT2440 DNA that appeared to be good templates for
IPCR.
The second round IPCR did not only serve to confirm the right signal in the first PCR, in
some cases the first IPCR yielded no or only weak products that however sufficed as
templates and yielded stronger signals in the nested IPCR (46-2, 47-12, 47-30).
If no product was obtained even in the nested PCR (41-7, 41-20), this was probably due to a
mergfp containing fragment that was too large to be amplified.
3 Results
93
Sometimes, the first IPCR yielded shorter signals than the nested PCR (41-2, 41-8). For these
constructs the signal of the first IPCR was below 1 kb, which is much shorter than would be
expected since the ends of the mergfp cassette already constitute 1.2 kb of the expected
amplicon and IPCR would yield an amplicon of that size even without adjoining genomic
DNA. The signal was therefore probably unspecific or derived from a fragment template that
was damaged having lost some of the ends of the fragment with the mergfp cassette. In these
cases probably a much weaker signal that was not detectable in the first IPCR served as
Figure 3-24 IPCR and subsequent nested IPCR. The products from IPCR (TSRIF/LAIRT) and nested IPCR (SELLA/GFPrevinv) with genomic DNA from all construct strains as templates were separated in a 0.8% agarose gel. The different constructs are indicated by their previously used numbering. A negative control reaction without template DNA is shown (-). The size of each marker fragment of the DNA size marker was as indicated.
Since all of the constructs with the gfp variant designated 41 showed a signal at 0.8 kb, it was
assumed that this signal was not specific.
Although not all bands obtained with the nested IPCR could be matched with a corresponding
signal in the first IPCR that was longer by 1.1 kb all good signals from the nested IPCR, were
excised from the gel and submitted to sequencing (see 2.7). SELLA and GFPrevinv were used
as sequence primers in two separate amplification reactions for each excised band.
3 Results
94
Table 3-4 Amplicon Lengths with SELLA & GFPrevinv and TSRIF & LAIRT. The table shows the sizes of the bands that were visualised after IPCR and nested IPCR in the agarose gel electrophoresis. Numbers in parentheses are weak bands. Numbers in bold print are bands that were excised and sequenced.
47-32 3.8 (3.0) 2.7 1.1 1) nested PCR product exceeded original PCR in size 2) ns = not specified
3.3.1.3 Genetic Characterization of the Construct
For 15 out of the 20 constructs the genomic DNA sequence immediately next to the insertion
could be revealed by IPCR and subsequent sequencing (Figure 3-25 & Figure 3-26, Table
3-5). The sequence could not be elucidated for Ps. putida KT2440::mergfp41-7, 41-20, 46-16,
47-1 and 47-3 owing either to a lack of or insufficient IPCR product resulting in no or bad
sequence data. Sequences were compared with the corresponding chromatogram (data not
shown) and bases corrected if necessary.
Genetic differences of the new mercury reducing, fluorescent constructs could be observed at
several levels (Figure 3-25 & Figure 3-26): (1) The genotypes differed by definition by the
3 Results
95
respective integration sites of the mergfp cassette in the genome of the recipient. (2) As has
been described earlier, three groups could further be categorized by the gfp version used in the
construction (derived from pBJA41, pBJA46 or pBJA47, with different half lives of the
protein, Table 2-1). (3) Furthermore, as a consequence of the blunt end ligation of the mer-gfp
cassette into the transposon vector, the gfp was flanked by the I-end in the constructs from the
41 and 47 series, while in the constructs from the 46 series, gfp was flanked by the O-end.
This had no consequence for the transposition of the mergfp cassette or later gene expression.
Nevertheless, the fact had to be acknowledged for the analysis of the genetic data.
An alignment of the mergfp cassette - genomic DNA transitional region of the constructs was
performed using ClustalX (1.64b; Protein Weight Matrix: BLOSUM series, Gap Opening 15,
Gap Extension 6.66) and editing was carried out with GeneDoc-Multiple Sequence Alignment
Editor & Shading Utility, version 2.6.002. With this alignment the genetic differences among
the constructs could clearly be discerned (Figure 3-25).
The insertion site sequences of 47-11 and 47-12 proved identical. In their mercury reduction
kinetics and fluorescence intensity, however, the two constructs could clearly be differentiated
(3.3.4), it is therefore highly unlikely that the two strains would have been identical. The
clone 47-12 did not give a signal in the IPCR, but only in the nested PCR, so that it may be
that the latter signal was an artefact probably caused by contamination.
Another noteworthy observation in Figure 3-25 were the purple or turquoise patches at the
beginning of the genomic DNA. The first base column after the O-end shows 80% identity
among the constructs. The 4th, the 6th, the 9th and the 11th base column after the O-end still
show 60% identity, while after that base identity remains below 60%. The accumulation of
identical base pairs seemed to be locally confined to the 11 bases downstream the integration,
suggesting a site selection for the Tn5 transposition (also see 4.2.2).
3 Results
96
-
I mergfp O
-
I mergfp O
-
I mergfp O
I mergfp O
Figure 3-25 Genetic Differentiation of the Constructs: Genomic Ps. putida DNA bordering the O-end of the mer-gfp insertion. Sequence primer was GFPrev (41 series & 47 series) or SELLA (46 series). The alignment shows the 3’ end of gfp (41 and 47 series), the partial multiple cloning site and the O-end of pBSL299∆Sm. Note that in the constructs of the 46 series the mer operon, and not the GFP gene, is flanked by the O-end (not shown). The two GFP versions shown differ in their last three amino acids. Shading was chosen as follows: Blue indicated complete identity, purple was used if 80% and turquoise if 60% of the bases in one column were identical. White indicated no similarity. Nine bases of genomic Ps. putida KT2440 DNA were duplicated at the insertion site during the integration and are indicated with (+). For further information see text.
By enzyme restriction digest of the construct DNA with KpnI, the I-end and its immediately
flanking genomic region were cut off due to a KpnI recognition site in the multiple cloning
site of pBSL299∆Sm (Figure 3-17). Hence, the KpnI fragment holding the mer-gfp cassette
comprised at one end partial multiple cloning site and genomic DNA at the other end. When
3 Results
97
self-ligated the genomic DNA immediately flanking the KpnI site of the mer-gfp cassette
therefore presented the genomic DNA further upstream the O-end and not the downstream
DNA immediately flanking the I-end (Figure 3-26). However, the obtained genomic sequence
bordering the KpnI site proved extremely valuable for verifying the integration site of a
particular construct strain. The insertion sequence was identified by comparing the genomic
sequence flanking the O-end with the Ps. putida KT2440 genome database (see Figure 3-28).
Only if the genomic sequence bordering the KpnI site could be found further upstream of the
identified integration site in the Ps. putida KT2440 genome the place of insertion could be
confirmed.
I MCS mergfp O
Figure 3-26 Genomic Ps. putida DNA bordering the KpnI site of the self-ligated fragment. Sequence primer was SELLA (41 series & 47 series) or GFPrevinv (46 series). The alignment shows the DNA upstream the 5’ end of the mer operon (41 series and 47 series only) and the partial multiple cloning site of the Tn5-minitransposon. Note that in the constructs of the 46 series gfp, and not the mer operon, is flanked by the I-end (not shown). Shading was chosen as follows: Purple indicated 80% and turquoise 60% identity of the bases in one column. White indicated no similarity. Genomic Ps. putida KT2440 DNA begins at the transition of purple to white. Note that the KpnI digest produced fragments with genomic DNA at one end and the pBSL299∆Sm multi cloning site at the other end. Hence, after self-ligation of that fragment, the genomic DNA upstream the mer genes in the construct was found bordering the cassette at the KpnI site. MCS=multiple cloning site.
3 Results
98
3.3.2 Localization of the Integration Sites
To localize the insertion sequence within the Ps. putida KT2442::mer73 genome, the genomic
sequence was initially compared with the contig database available from the Ps. putida
KT2440 Genome Project (The Institute for Genomic Research - TIGR/ German Consortium,
Prof. Dr. KN Timmis, “http://www.tigr.org”). Ps. putida KT2440 and Ps. putida KT2442
(who was the parent for the construction of the GEM) are genetically identical except for a
single base mutation rendering the latter resistant to rifampicin. The GEM sequence flanking
the mer operon integration could be found within contig #10458 (March 2000), and with this
information could be located within 50 – 60 kb from the SwaI restriction site separating the
fragments SwD and SwB (German Consortium, Prof. Dr. B. Tümmler, Figure 3-27).
With the combined physical and genetic map of the Ps. putida KT2440 genome of Ramos-
Díaz & Ramos (1998) the insertion site of the mer operon in Ps. putida KT2442::mer73 could
be located in genomic neighbourhood to rpoS (RpoS- σ factor) on the SwB fragment.
merTPAB insertion50-60 kb from SwaI
rpoS
merTPAB insertion50-60 kb from SwaI
rpoS
Figure 3-27: Pseudomonas putida KT2440 genomic map and insertion of merTPAB in Ps. putida KT2442::mer73. The circular chromosome is represented as a series of fragments of the 6 MB Ps. putida KT2440 genome when cut with the endonucleases SwaI (Sw, outer circle) and I-CeuI (Ce, inner circle) (Ramos-Díaz & Ramos 1998). The site of insertion of the mer operon into the Ps. putida genome is indicated as well as the location of the rpoS gene on the SwB fragment. Figure modified, original figure kindly provided by Christian Weinel (MH Hannover).
3 Results
99
3.3.3 Identification of the mer Operon Insertion Site with the Annotated Ps. putida KT2440 Genome
Only recently, the Ps. putida KT2440 genome was published and the annotated sequence
submitted to NCBI where it can be obtained with the accession number NC_002947
(http://www.ncbi.nlm.nih.gov:80/cgi-bin/Entrez/framik?db=genome&gi=266, Peterson et al.
2001, Nelson et al. 2002,). With this information the insertions could be further identified in
terms of affected gene functions for Ps. putida KT2442::mer73 and for the new constructs.
The obtained sequences were submitted to the Ps. putida KT2440 genomic DNA database
using BlastN (Figure 3-28). This search rendered an alignment of the submitted sequence with
the matching Ps. putida KT2440 genomic region. Furthermore the numbers of the
corresponding basepairs were gained according to the database numbering which were crucial
for the identification of the annotated function to the DNA sequence received in this search.
For the new constructs only the region immediately adjacent to the O-end represented the
integration site, because of a KpnI cut site immediately after the gfp.
Figure 3-28 Finding the Integration Site. By BlastN alignment of the construct sequence obtained from the KpnI IPCR signal (“Query”, here shown for genomic DNA adjacent to the O-end in Ps. putida KT2440::mergfp41-2) with the Ps. putida KT2440 genome (Subject) the insertion site could be localized in terms of base number (bold print). In Ps. putida KT2440::mergfp41-2 bases 2662416 to 2662424 were duplicated as the mergfp cassette was integrated into the genome (bold print). See text for further information.
For Ps. putida KT2442::mer73 and for the 15 constructs for which good sequences had been
obtained the insertion sites could be described in terms of gene environment and gene
disruption (Table 3-5). Although the Ps. putida KT2440 genome has now been fully
sequenced many gene functions remain unknown. Open reading frames that could not be
annotated have been designated hypothetical protein or conserved hypothetical protein on the
basis of sequence similarities with other proteins found in databases. It would be
3 Results
100
presumptuous to infer that these genes were of no great significance to the bacterium,
however, their relevance is not presently known. Among the 15 constructs more than one
third of the identified integrations were within hypothetical proteins that could not further be
the gene in these cases did not exterminate survival of the cell nor did it deteriorate growth, at
least not in M9 medium with benzoate (Figure 3-29).
In some cases, the insertion occurred within or between genes that were assigned to a group
of proteins but were no further characterized (putative carboxyvinyl carboxyphosphonate
phosphoryl synthase of Ps. putida KT2440::mergfp41-2, putative lipoprotein of Ps. putida
KT2440::mergfp41-8, sohB protein of the U7 peptidase family and phosphoglycerate mutase
family protein of Ps. putida KT2440::mergfp46-8, decarboxylase family protein of Ps. putida
KT2440::mergfp47-5).
Other genes with the same annotated functions were found within the genome for putative
carboxyvinyl carboxyphosphonate phosphoryl synthase of Ps. putida KT2440::mergfp41-2,
putative lipoprotein of Ps. putida KT2440::mergfp41-8, phosphoglycerate mutase family
protein of Ps. putida KT2440::mergfp46-8, 3-dehydroquinate dehydratase (aroQ) of Ps.
putida KT2440::mergfp47-16, tRNA-Ala-6 of Ps. putida KT2440::mergfp47-30 and Pp23SF-
rRNA of Ps. putida KT2440::mergfp47-32. These multiple present genes could have
prevented the insertion from being lethal by surrogating the function of the disturbed gene.
In two cases the insertion occurred between two genes (between the small and large
acetolactate synthase subunits of Ps. putida KT2440::mergfp46-7 and in Ps. putida
KT2440::mergfp46-8 between a phosphoglycerate mutase family protein and a sohB protein,
peptidase U7 family, that could not further be characterized). In Ps. putida
KT2440::mergfp46-7, however, the cassette insertion cut off the stop codon of the large
subunit, so that translation would have continued into the sequence of the cassette, possibly
compromising the function of the enzyme. Although other acetolactate synthases were present
in the genome, this particular biosynthetic type (ilvN, ilvB) that is involved in amino acid
synthesis was only present once. In Ps. putida KT2440::mergfp46-8 the insertion took place
between two genes that were regulated in opposite directions, on the sense and the antisense
strand. The question that needed answering was if although the genes themselves were not
affected by the insertion, their regulatory DNA sequences might have been affected. Promoter
regions were searched for with the Baylor College of Medicine (BCM) Search Launcher
(http://searchlauncher.bcm.tmc.edu/seq-search/gene-search.html). The insertion was found
between the regulatory region of the phosphoglycerate mutase family protein and the gene. In
3 Results
101
fact two promoter regions for the gene could be identified, which might be responsible for the
good performance and fluorescence of the strain. The enhanced distance to the promoter
could, however, have resulted in a deteriorated transcription of the phosphoglycerate mutase.
Nevertheless, other similar genes were present that could have taken over the function. The
promoter for the sohB family protein could not be found within 1000 bp upstream the start
codon. The gene might have been transcribed from a promoter that was further away or the
ORF that was found and annotated was not a functional gene in vivo. This finding subscribes
the need for expressional studies beyond mere genetic studies.
An exception among the insertions was the γδ electron transferring subunit of the NADH
dehydrogenase I, also called NADH:ubiquinone oxidoreductase (nuoCD) or complex I which
was only present once in the genome. The NADH dehydrogenase I consists of 13 subunits
and is the first component of the respiratory chain with the lowest redox potential of all
components. It is hence an essential enzyme for respiration and thus for growth of the aerobic
Ps. putida.
In Ps. putida KT2442::mer73 the mer operon was inserted into the alanyl-tRNA-synthase
sequence about 130 bp towards the 3’ end of the ORF. The next ORF downstream was a
putative major-facilitator-superfamily (MFS)-transporter. Although the insertion did occur
within a coding sequence, apparently it did not destroy gene function of Ps. putida
KT2442::mer73. Ps. putida KT2440 harbours only one gene coding for alanyl-tRNA-synthase
which is essential in protein biosynthesis and the GEM would not have survived if the
insertion would have been lethal (see 4.2.1 for further discussion).
3 Results
102
Table 3-5 Integration sites of the mergfp cassette in the constructs and of the mer operon in Ps. putida KT2442::mer73.
GFP-version (last 3 amino acids,
half life)1)
Construct Strain [Ps. putida
KT2440::mergfp]
Orientation-localization
Disrupted gene
41-2 bp 2662416-24 (PP2334) carboxyvinyl-carboxyphosphonate
phosphorylmutase, putative 41-8 bp 1508422-30 (PP1322)
lipoprotein, putative 41-17 ND
41 LAA
t1/2= 2½ min
41-20
O-end-gfp-mer-
I-end, ND
46-2 bp 5189985-93 (PP4570) conserved hypothetical protein
46-7 bp 5317650-58 (between PP4679 and PP4680)
acetolactate synthase, small subunit and large subunit
(ilvN,ilvB) 46-8 bp 4428945-53 (between PP3922
and PP3923) sohB protein- peptidase U7 family, phosphoglycerate mutase family
protein
46 ASV
t1/2= 6 min
46-16
I-end-gfp-mer-
O-end
ND 47-1 ND 47-2 bp 4328586-94 (PP3798)
conserved hypothetical protein 47-3 ND 47-5 bp 4159361-69 (PP3662)
decarboxylase family protein 47-112) bp 2014141-48 (PP1794)
hypothetical protein 47-122) bp 2014141-48 (PP1794)
hypothetical protein 47-14 bp 4657856-64 (PP4121)
γδ NADH-dehydrogenase I subunit (nuoCD)
47-16 bp 650676-84 (PP0560) 3-dehydroquinate dehydratase,
type II (aroQ) 47-21 bp 3486177-85 (PP3092)
conserved hypothetical protein 47-30 bp 699539-47 (tRNA-Ala-6)
tRNA 47-31 bp 2797630-38 (PP2450)
conserved hypothetical protein
47 AGA
T1/2= >30 min
47-32
O-end-gfp-mer-I-end
bp2552025-33 (PP23SF) rRNA
-- Ps. putida KT2442::mer73
O-end-mer- I-end
bp1270955-63 (PP1111) synthetase, putative
ND - not determined 1)These half lives were determined for E. coli (personal communication with M. Strätz and B. Andersen), see section 3.2.2. 2)Clones 47-11 and 47-12 were identical (compare alignment)
3 Results
103
3.3.4 Growth in M9 Minimal Medium (+Benzoate)
By observing the growth of the bacterial construct strains, a first evaluation of their
physiological intactness despite the insertion could be achieved. The new Ps. putida
KT2440::mergfp constructs, the parent strain Ps. putida KT2440 and the mercury reducing
constructs Ps. putida KT2442::mer73 and Ps. putida KT2442::mer::gfp11 (Suarez et al. 1997)
were grown with M9 minimal medium and benzoate as sole carbon source (Figure 3-29). Ps.
putida KT2442::mer::gfp11 is a mercury resistant, fluorescing strain that contains a stable
GFP version, which is, however, not linked with the mercury resistance. All strains grew to
similar maximum optical densities. However, Ps. putida KT2442::mer73, Ps. putida
KT2440::mergfp46-2 and 46-7, Ps. putida KT2442::mer::gfp11 grew with a delayed lag
phase while Ps. putida KT2440::mergfp46-8 decelerated its growth in mid-log phase.
Nevertheless, this growth experiment shows preliminary results that need to be validated.
Figure 3-29 Growth of constructs in M9 minimal medium with benzoate as sole carbon source. Growth curves are shown for nine of the constructs that had been selected for their mercury resistance. The constructs are specified by their numbers. The parent strain Ps. putida KT2440 (KT40) was included into the growth experiment as well as the mercury resistant strain Ps. putida KT2442::mer73 (mer73) and Ps. putida KT2442::mer::gfp11 (mergfp). The latter possesses green fluorescent protein in addition to the mercury resistance.
3 Results
104
3.3.5 Expression of Mercury Resistance and GFP
3.3.5.1 Fluorescence During Colony Growth
Although the new Pseudomonas constructs were selected for their capability to transform
mercury, an important feature was their fluorescence, enabling easy detection of the
constructs in complex bacterial consortia as well as quantification of the mercury resistance
activity via fluorescence intensity.
23h
49h
72h
96h
124h
KT40mer73 41-2 41-8 41-17
Figure 3-30 Green Fluorescence during colony growth in the 41 series. Fluorescence is shown for single colonies of the Ps. putida KT2440::mergfp constructs carrying the most unstable of the three GFP versions (Andersen et al. 1998). For comparison, Ps. putida KT2442::mer73 (“mer73”) and the parent strain Ps. putida KT2440 (“KT40”) are also shown. The magnification was ×25, colonies were observed with a FITC filter set (see 2.9.1).
In order to determine which construct strains showed highest fluorescence, growing colonies
were observed over a period of 170 h with a fluorescence microscope, a 2.5× objective and
FITC Filter Set III (see also 3.3.5.1). Figures 3-27 to 3-29 show the fluorescence during
colony growth of three construct strains from each series (41, 46, 47) with the strongest
3 Results
105
fluorescence as determined by eye. After 124 h the fluorescence intensity and size of the
colonies did not change, therefore later pictures have been omitted in the figures.
The most striking observation was that the constructs with the most unstable GFP-version (the
41-series) showed only very low fluorescence that was not appreciably higher than the auto-
fluorescence of the Pseudomonas parent strain (compare Ps. putida KT2440; Figure 3-30).
23h
49h
72h
96h
124h
KT40mer73 46-2 46-7 46-8
Figure 3-31 Green Fluorescence during colony growth in the 46 series. Fluorescence is shown for single colonies of Ps. putida KT2440::mergfp constructs carrying a moderately stable GFP versions with a half time of 6 min in E. coli (Andersen et al. 1998). For comparison, Ps. putida KT2442::mer73 (“mer73”) and the parent strain Ps. putida KT2440 (“KT40”) are also shown. The magnification was ×25. Colonies were observed with a FITC filter set (see 2.9.1).
Most of the constructs with the GFP-version that was more stable (the 46-series) displayed a
fluorescence intensity that was clearly higher than the Pseudomonas auto-fluorescence
(Figure 3-31), while many constructs with the most stable of the three GFP-version (the 47-
series) were by bright fluorescent, comparable with Ps. putida KT2442::mer::gfp11 (Figure
3-32) that carries a stable GFP version in its chromosome (Suarez et al. 1997). Both the 41-
series and the 46-series were under-represented (4 construct strains each) in comparison to the
3 Results
106
47-series (12 construct strains), thus this phenomenon may be attributed to statistical error.
However, a correlation of increasing fluorescence intensity with an increase in GFP stability
could clearly be observed. Besides the varying GFP fluorescence intensities among the
different construct strains, changes in intensity could also be observed within a single colony
during its growth. In Ps. putida KT2440::mergfp46-7 this could be easily observed (Figure
3-31). In the young colony (23 h) fluorescence was uniformly distributed but soon (49 h) the
core became darker in comparison to a ring of medial distance from the centre. However, the
edges of the colony remained dark. At later colony growth stages (72 h) the whole colony
fluoresced uniformly, later (96 h) fluorescence ceased except for the edges and the core
region, fluorescing fading at the borders (124 h).The construct strains of the 47 series also
displayed spatial differences of fluorescence during colony growth (Figure 3-32). While not
very pronounced in Ps. putida KT2440::mergfp47-11 who fluoresced homogeneously without
the formation of fluorescing rings, Ps. putida KT2440::mergfp47-1 and Ps. putida
KT2440::mergfp47-32 did show spatial variation of fluorescence within the colonies. Ps.
putida KT2440::mergfp47-1 fluoresced uniformly from the beginning (23 h) but with a darker
core. The colony then developed bright fluorescing borders and a broad ring of high
fluorescence around the immediate centre (49 h). Fluorescence ceased first at the edges (72 h)
and then more and more around the centre (96 h and 124 h). Ps. putida KT2440::mergfp47-32
showed the brightest fluorescence of the construct strains. The strain still fluoresced brightly
after 170 h (data not shown, however, intensity was comparable with that at 124 h). At 23 h a
slightly darker core region could be detected and the formation of fluorescent rings at 49 h.
After that fluorescence faded slightly, however several fluorescent rings could be detected.
Fluorescence ceased first at the borders while remaining bright towards the centre (72 h, 96 h,
124 h).
Moreover, while some colonies grew in close vicinity to neighbouring colonies, others had
more space on the agar plate leading to a greater relative resource of nutrients. Therefore,
fluorescence patterns could also have depended upon nutrient availability and should be
confirmed in additional experiments.
3 Results
107
47-1 47-3247-11mergfp KT40
23h
49h
72h
96h
124h
Figure 3-32 Green Fluorescence during colony growth in the 47 series. Fluorescence is shown for Ps. putida KT2440::mergfp constructs carrying the most stable of the three GFP versions with a half time of more than 30 min in E. coli (Andersen et al. 1998). For comparison, Ps. putida KT2442::mer::gfp (“mergfp”) and the parent strain Ps. putida KT2440 (“KT40”) are also shown. The magnification was ×25. The colonies were observed with a FITC filter set (see 2.9.1).
3.3.5.2 Correlating Mercury Resistance and Fluorescence
One of the prospects of creating transcriptional mer-gfp fusions was the possibility to monitor
mercury-reduction by measuring GFP fluorescence. In order to investigate this possibility,
samples were drawn at late logarithmic stage (OD600 nm = 1.3) from M9 medium liquid
cultures (+10 mM benzoate) and both, fluorescence and mercury reduction, were quantified.
Mercury reduction is highest during logarithmic growth and decreases dramatically in
stationary phase (personal communication with Wanda Fehr). Moreover, high cell densities
were desired for a maximum of fluorescence facilitating quantification. Therefore, the late
logarithmic growth phase was chosen for sampling.
3 Results
108
3.3.5.2.1 Mercury Reduction Rates
From each construct series with a particular GFP variant three candidates with the best
mercury resistance were chosen on the basis of the preliminary tests (compare sections 3.2.4,
3.3.4). For the determination of fluorescence intensity, 1 ml of the culture was measured in a
fluorescence spectrophotometer (see section 2.9.2), with excitation at 475 nm and emission at
515 nm. For the determination of the mercury transformation rates, triplicate samples (1 ml)
were injected into an Atomic Absorption Spectrometer (AAS; see section 2.10) and subjected
to 3 ppm Hg2+ and the best performing strains later to 6 ppm Hg2+ (HgCl2).
Four construct strains showed superior transformation rates with 3 ppm Hg2+: Ps. putida
KT2440::mergfp46-7, 47-1, 47-11 and 47-32 (Figure 3-33). If expressed as transformation
rate per cell, however, Ps. putida KT2440::mergfp46-2 was superior to Ps. putida
KT2440::mergfp47-1 which must be attributed to the extraordinary high cell density of Ps.
putida KT2440::mergfp47-1 (OD600 nm = 1.3) that was 5-10fold higher than that of the other
construct strains (see Figure 3-34). Performance of Ps. putida KT2440::mergfp 47-1 thus
seemed to be lower than Ps. putida KT2440::mergfp46-2. This observation could not be
confirmed in the experiment with 6 ppm Hg2+. Here, performance of Ps. putida
KT2440::mergfp47-1 was second highest also if expressed as transformation rate per cell. The
other five strains with high mercury transformation rates also possessed high mercury
transformation per cell.
Since Ps. putida KT2440::mergfp46-7, 47-1, 47-11, 47-32, Ps. putida KT2442::mer73 and
Ps. putida KT2440::mer::gfp11 showed enormously high mercury transformation rates with
3 ppm Hg2+ (HgCl2), for these six strains, the mercury transformation rates were also
determined with 6 ppm of Hg2+ (HgCl; Figure 3-35 & Figure 3-36) to further investigate their
mercury reducing capacity: Ps. putida KT2440::mergfp46-7 had the lowest transformation
rate of the construct strains, although comparable with Ps. putida KT2442::mer::gfp but lower
than Ps. putida KT2442::mer73. All three strains of the 47 series showed higher mercury
transformation rates than Ps. putida KT2442::mer73. Ps. putida KT2440::mergfp47-32 had
the highest mercury transformation.
3.3.5.2.2 Survival During Mercury Transformation
Another approach to determine how well the construct strains could cope with mercury was to
determine survival during the mercury transformation measurement when the strains were
subjected to 3 or 6 ppm Hg2+ (Figure 3-34). Of Ps. putida KT2440::mergfp46-2, 46-7, 47-1,
47-11, 47-32, Ps. putida KT2442::mer73 and Ps. putida KT2442::mer::gfp11 between 1 and
3 Results
109
10% survived the kinetic measurement, while a substantial number of cells died of all
construct strains of the 41 series (lowest GFP stability), of Ps. putida KT2440::mergfp46-8
and of the parent strain Ps. putida KT2440. Of Ps. putida KT2440::mergfp41-8 and 46-8 no
cell survived the measurement. When mercury transformation rates were determined with
6 ppm, Ps. putida KT2440::mergfp46-7 and Ps. putida KT2442::mer::gfp11 failed to survive.
Of the strains tested, the constructs of the 47 series and Ps. putida KT2442::mer73 survived
best during mercury transformation with 6 ppm Hg2+ (Figure 3-36).
3.3.5.2.3 Fluorescence and its Correlation with the Mercury Resistance
Differences in fluorescence could be observed between the GFP variants (Figure 3-33). While
fluorescence of the most unstable (41) series was not above the non-fluorescent control strains
(Ps. putida KT2440 and Ps. putida KT2442::mer73, which however showed some
autofluorescence), in the construct strains of the 46 series (moderate stability) fluorescence
was slightly higher than in the controls. In the constructs with the most stable GFP variant (47
series), fluorescence was notably higher than in the other strains. Since the more stable GFP
versions retain more GFP molecules this result was not surprising. Although the mercury
reducing, fluorescent Ps. putida KT2442::mer::gfp11 was included in the experiment as a
control, intensity of fluorescence could not be directly compared the fluorescence of the
construct strains since the gfp of Ps. putida KT2442::mer::gfp11 was not FACS optimised and
fluoresced most intensely at 395 nm, and not at 488 nm.
In the 46 construct series mercury transformation rates from virtually none (Ps. putida
KT2440::mergfp46-8, mercury transformation was not above control with Ps. putida
KT2440) to high transformation rates (Ps. putida KT2440::mergfp46-7) were existent. This
observed increase of mercury transformation with the increase in GFP stability, however,
does not yet allow inferences about a correlation between mercury transformation and
fluorescence. Due to the fact that strains with more stable GFP contain more molecules,
crucially, fluorescence within one GFP construct series had to be regarded for which only few
data were available.
Correlation coefficients were calculated with Equation 3. For the 41 and for the 46 series
higher mercury transformation at 3 ppm mercury was correlated with higher (logarithmic)
relative fluorescence (r41=0.97, r46=0.99), however, these calculations were based on three
data points for each feature only. In the 47 construct series differences in mercury
transformation between the strains could not be resolved well with 3 ppm. Therefore the
measurements were repeated with 6 ppm Hg2+ (HgCl2; Figure 3-35 and Figure 3-36). The
3 Results
110
correlation coefficients between mercury transformation and (the logarithmic of) the relative
fluorescence in the 47 series were r47(3)=-0.61 for the measurements at 3 ppm mercury and
r47(6)=0.57. More data must be collected before a correlation of mercury transformation and
fluorescence can be confirmed. While certainly more data from constructs with all different
GFP variants would be informative, the preliminary experiments conducted here (Figure 3-33
to Figure 3-36) suggest that the constructs of the 47 series are most promising as they showed
both, high mercury transformation and fluorescence. Alternatively, investigation of the 46
series could yield further insight as they demonstrated the greatest variation, both in mercury
transformation and in fluorescence, among the strains.
3 Results
111
35982
0
10
20
30
40
50
60
70
80
41-2
41-8
41-17 46
-246
-746
-847
-147
-1147
-32
KT::mer-
73
KT::merg
fp
KT 2440
0
10
20
30
40
50
60
70
80
ng H
g se
c-1
rela
tive
fluor
esce
nce
(x 0
.01)
Hg
sec-1
cell-1
(x 1
03 )
35982
0
10
20
30
40
50
60
70
80
41-2
41-8
41-17 46
-246
-746
-847
-147
-1147
-32
KT::mer-
73
KT::merg
fp
KT 2440
0
10
20
30
40
50
60
70
80
ng H
g se
c-1ng
Hg
sec-1
rela
tive
fluor
esce
nce
(x 0
.01)
rela
tive
fluor
esce
nce
(x 0
.01)
Hg
sec-1
cell-1
(x 1
03 )H
g se
c-1ce
ll-1(x
103 )
Figure 3-33 Mercury Transformation Rate with 3 ppm Hg2+ and Fluorescence of the Ps. putida KT2440::mergfp Construct Strains and controls. The relative fluorescence for Ps. putida KT2440::mergfp47-11 and 47-32 exceeded the scale and is indicated with numbers. Standard deviations from triplicates are shown for the mercury transformation rates.
Figure 3-34 Survival During Transformation of 3 ppm Hg2+. The figure shows the bacterial densities (and the standard deviation) in the vessel used to determine mercury transformation rates before and after the injections of 3 ppm Hg2+. Survival of the cells is also expressed as percentage of surviving cells (for further information see text). No cells survived the mercury transformation measurement of Ps. putida KT2440::mergfp41-8 and 46-8.
3 Results
112
81 334
0
2
4
6
8
10
12
14
16
18
20
46-7 47-1 47-11 47-32 KT::mer-73KT::mer-gfp0
8
16
24
32
40
48
56
64
72
80
ng H
g se
c-1
rela
tive
fluor
esce
nce
(x 0
.01)
Hg
sec-
1ce
ll-1
(x 1
03)
81 334
0
2
4
6
8
10
12
14
16
18
20
46-7 47-1 47-11 47-32 KT::mer-73KT::mer-gfp0
8
16
24
32
40
48
56
64
72
80
ng H
g se
c-1
ng H
g se
c-1
rela
tive
fluor
esce
nce
(x 0
.01)
rela
tive
fluor
esce
nce
(x 0
.01)
Hg
sec-
1ce
ll-1
(x 1
03)
Hg
sec-
1ce
ll-1
(x 1
03)
Figure 3-35 Transformation Rate of 6 ppm Hg2+ and Fluorescence of Selected Cells. For Ps. putida KT2440::mergfp47-11 and 47-32 relative fluorescence exceeded the scale and is indicated with a number. Standard deviations from triplicates are shown for the mercury transformation rates.
100
101
102
103
104
105
106
107
108
109
46-7 47-1 47-11 47-32 mer73 mergfp
cfu
[ml-1
]
100
101
102
103
104
105
106
107
108
109
46-7 47-1 47-11 47-32 mer73 mergfp
cfu
[ml-1
]
before afterbefore after
0.00% 0.31% 0.02% 2.48% 0,01% 0,00%
Figure 3-36 Survival During Transformation of 6 ppm Hg2+. The figure shows the bacterial densities (and the standard deviation) in the vessel used to determine mercury transformation rates before and after the injections of 6 ppm Hg2+. Survival is shown only for the best six construct strains and is also expressed as percentage of surviving cells (for further information see text). No cells survived the mercury transformation measurement of Ps. putida KT2440::mergfp46-7 and of the control strain Ps. putida KT2442::mer::gfp11.
4 Discussion
113
4 Discussion
4.1 Microcosm Experiments - GEM Safety
4.1.1 Stream Microbiology
Streams and rivers are crucial mediators between terrestrial environments and the oceans.
Consequently, most major cities developed near rivers that supplied water for drinking and
irrigation (and fish, as a valuable source of nutrients) but furthermore rivers provided a means
for the transport of goods and wastes. Rivers in nature run for several hundreds or thousands
of Kilometres with tributaries or waste water influents and along its course a river may
constantly face changing vegetation, geology or agricultural use (Allan 1995). Estimates of
the amount of water discharged by rivers to the world’s oceans range between 32000 and
37000 km3yr-1. Generally, flow rate can be considered the most important abiotic force in
streams. This means that bacterial dissemination will be mainly controlled by current speed.
As has been understood nowadays microbes play an important role in the cycling of elements
and nutrients in the environment. Microbial carbon cycling and the degradation of toxins is
particularly important in rivers that collect agricultural, municipal and industrial wastes. The
benthos, i.e. all surfaces, including sediments, rocks, leaves, woods, etc., serves as matrix for
microbial biofilms, a place of intricate microbial interactions, probably of frequent gene
transfer, a place capable of somewhat protecting bacteria from predation or toxins, including
antibiotics (Leff 1994). Brümmer et al. (2000) demonstrated the seasonal dynamics of river
biofilm communities of Elbe and Spittelwasser, two German rivers which are polluted to
different degrees, thereby showing the complexity of the river microbial communities and
suggesting an influence of pollution on community composition.
Besides being the playground for microbial activity, benthic biofilms are also a great source
of bacteria for the water column owing to abrasion by the current. The main characteristic of
streams that distinguishes it from other aquatic systems is a longitudinal succession:
everything is transported downstream. By so called spiralling of particles, however,
everything (e.g. nutrients, bacteria, genes) settles at one point and stays for some time before
released again, taken up by the current and transported further downstream.
4.1.2 Stream Microcosms
In this work, the fate of a mercury-reducing GEM and its influence on the indigenous
microbial community was investigated. These experiments had to be carried out in an
4 Discussion
114
artificial system –a microcosm- and since biofilms seemed to be a habitat with great microbial
interaction it was assumed that an effect could most likely be seen in the near-bed
environment, i.e. in the upper layer of the sediment that first came in contact with the GEM if
it was introduced to the water stream above it. For the design of the experiments this also
meant that lower stream velocities sufficed to represent the near-bed situation found in nature.
A new stream microcosm design requires thorough examination of its flow behaviour. In
nature flow varies appreciably within the cross-section of a river. While common current
velocities range between 0.01 and 1 m s-1 (Silvester & Sleigh 1985), speed decreases towards
the bottom and the sides of the channel. In these regions, the boundary layer greatly protects
the residing biota from being swept away by the current (Allan 1995). Flow patterns and
velocity control the availability of nutrients and the forces applied on organisms living within
the stream and at the water-sediment interface (Allan 1995, Silvester & Sleigh 1985, Vogel
1989). The surface velocity of the Elbe River at the time of sampling was 0.45 m sec-1. Even
with seasonally fluctuating discharge volumes this speed should not vary much as “[...] mean
current speed at a particular station along a river only doubles for every tenfold increase in
discharge.” (Vogel 1989). The Elbe River surface water velocity was 136fold higher than the
visually determined speed in the microcosm. However, velocity is reduced to near zero
towards the river bed. As can be seen in Figure 3-2, flow very near the sediment layer was
slow and the dye only reached down to the bottom after the dye front had nearly reached the
second collimator. Therefore, near-bed velocity under natural river conditions was reflected
well by the microcosm.
In the environment laminar flow, i.e. usually shallow, very slow moving water, is rarely found
and turbulence mostly the rule. Near the sediment, turbulence mainly depends on the
roughness if the surface. The Reynolds number describes the turbulence of a moving gas or
liquid (see 3.1.2) and was used here for the purpose microcosm characterization. Flow in this
microcosm was not highly turbulent, however, not laminar either. With 463 the Reynolds
number indicated transitional flow, thus resembling real environmental conditions.
Experiments carried out in complex microcosms are associated with high experimental work
loads and costs associated with construction and operation of the microcosms. By using
(stream) microcosms that could be operated in a laboratory an attempt was made, to find a
way between finding a precise answer to the scientific question posed, however not ignoring
the (largely unknown) natural complexity of the system.
4 Discussion
115
It is impossible to consider all possible parameters that would influence the survival and/or
proliferation of the GEM in a river. However, the system for GEM safety studies does
represent a river environment as realistically as possible.
Some loss of controllability in comparison to simple microcosms (see 3.1.1) is reconciled by
the retention of at least some of the complexity of the real environment. Although others (e.g.
Jungmann et al. 2001) have constructed similar indoor streams to investigate the ecology of
benthic or lotic macroinvertebrate communities their microcosms were operated as closed-
circuit systems or were filled with pebbles as sediment. The microcosms described here can
be universally applied to investigate stream bacterial ecology (Leff 1994) and are novel in this
application.
4.1.3 Survival of the GEM: Persistence and Dissemination
Survival of introduced bacteria depends on several biotic and abiotic factors (Smalla et al.
1989). Nutrients as well as predation (Jürgens et al. 1999) are major determinants. However,
abiotic factors, such as temperature, pH, oxygen demand, water activity play additional roles
in the adaptation process. It has also been speculated that viruses play an important role in the
mortality of bacteria (Thingstad et al. 1993), however, evidence has been sparse.
Nevertheless, “top-down” control as achieved by predators or viruses and “bottom-up”
control e.g. through the limitation of nutrients are the major factors contributing to the
abundance of bacteria. Liang et al. (1982) suggest “that some species persist in environments
in which they are not indigenous because they tolerate abiotic stresses, do not lose viability
readily when starved, and coexist with antagonists. The species that fails to survive need only
be affected by one of these factors”. So far, GEM survival in rivers has mainly been
monitored by inoculation with large cell numbers of the strain at the beginning of the
experiments and following the die-off (e.g. Iwasaki et al. 1993, Janakiraman & Leff 1999,
Leff et al. 1997, Pechurkin et al. 1999). However, a feasible scenario is leakage of the GEM-
containing system and subsequent escape of relatively small numbers of bacteria over a
considerable time period. Despite rapid dilution of the GEM by the current, establishment of
the strain would be conceivable due to continuous re-inoculation from the leakage. In this
investigation both situations (persistent low cell density or sudden high cell density entry) are
considered. However, increasing cell numbers in water could not be observed and only a
slight increase was found in the sediment. Ps. putida is widely spread in the environment.
With a number of closely related competitors and no selective pressure offering an advantage
for the GEM, it seems plausible that increased growth would be difficult to achieve.
4 Discussion
116
Nevertheless, persistence below the detection limit of 10 cfu ml-1 would not have been
determined.
4.1.3.1 Viable But Non Culturable State (VBNC)
For the experiments described here, the so called viable nut non culturable (VBNC) state had
a number of implications. A bacterial cell can be described as VBNC if it “fails to grow on
the routine bacteriological media on which it would normally grow and develop into a colony,
but which in fact is alive and metabolically active”. If the GEM survives in a physically
unstable condition, it may not be detected, neither by the cultivation approach used in this
work, and perhaps not in the competitive PCR either. Oliver (2000) reports that 300 times the
amount of DNA were necessary for a PCR signal detecting VBNC cells as compared with
culturable bacteria. This was assumed to be due to the production of stress-induced proteins
that either modified DNA supercoiling or blocked the DNA polymerase from binding to the
DNA. It can be theorized that a GEM cell introduced into the microcosm enters VBNC state
and is not detectable with PCR, either, although later, it may recover to be culturable and
PCR-detectable again. The time period over which the microcosms were operated was longer
than in most experiments of this kind. However, even longer experimental periods might be
necessary to enhance the chance of recuperation from VBNC, if some cells were temporarily
undetectable by PCR or cultivation.
4.1.4 GEM Impact on the Indigenous Microbial Community in Stream Microcosms
TGGE/DGGE have proven to be powerful tools to observe community structure based solely
on the 16S rDNA sequences of the organisms in the sample (Muyzer et al. 1993, Muyzer &
Smalla 1998), thus avoiding cultivation-derived artefacts. Separation of the 16S rDNA PCR
products on a polyacrylamide gel plus the application of a thermogradient allow
discrimination of sequences of the same length differing in only one base (Felske et al. 2001,
Nübel et al. 1996, Rosenbaum & Riesner 1987). The resulting TGGE banding patterns are
subject to bias owing to selectivity during DNA extraction procedures, due to potential
preferential amplification during PCR, and chimera formation (Wintzingerode et al. 1997).
Moreover, TGGE/DGGE can only show the predominant species present in the community.
Of the estimated <104 genomes only bacterial populations that make up more than 1% or
more of the total community can be detected by PCR-DGGE (Muyzer & Smalla 1998), this
leaves a many phylotypes of the microbial community undetected. The profile may thus not
reveal the “true” community composition and. However, TGGE/DGGE are well suited to
4 Discussion
117
depict changes in the diversity of complex bacterial caused by disturbances (e.g. GEM
influence, pollutants, temperature, grazing, pH). Eichner et al. (1999) have used TGGE
analysis to determine structural changes in community patterns after a pollutant shock with
and without the presence of a pollutant-degrading GEM. The effect of root exudates on a
bacterial soil community contaminated with different levels of heavy metals has been
investigated using TGGE/DGGE (Kozdrój & van Elsas 2000) as well as the impact of
mercury and herbicides on the soil bacterial community (Rasmussen & Sørensen 2001,
Engelen et al. 1998). Here, the effect of the presence/absence of the genetically engineered
Ps. putida KT2442::mer73 on sediment and water communities was examined. Moreover, one
microcosm was inoculated with the non-recombinant Ps. putida KT2440 to exclude an
inherent effect of the inoculation of a Pseudomonas putida strain. The received 16S rDNA
patterns were highly complex for water and even more so for the sediment samples, forming a
firm foundation for interpretation. However, an effect of inoculation could not be detected.
4.1.5 Gene Transfer
4.1.5.1 Horizontal Transfer of Chromosomally Integrated Genes
Gene transfer usually requires the presence of mobile elements, e.g. a plasmid, bacteriophage
or a transposon, that have the ability to take up DNA and release it in another cell in a form
that it can be translated into protein. Conjugation, transduction and transposition have been
studied and found to occur in the environment (Bogdanova et al. 2001, Davison 1999, Miller
2001). The uptake of naked DNA, both of chromosomal or plasmid origin, which is liberated
if cells lyse has also been shown to be of environmental relevance (Lorenz & Wackernagel
1994). Chromosomal DNA, on the other hand, is generally regarded stable (Abebe et al.
1997), transfer is assumed to occur too rarely for detection (Sengeløv et al. 2001) and the
bacterial genome viewed to be a safe place for genetic engineering. However, conserved
chromosomal sequences such as DNA coding for ribosomal RNA could be relatively frequent
targets for homologous recombination and thus serve as natural vehicles for horizontal gene
transfer (Strätz et al. 1996, Arber 2000). This could e.g. affect gene transfer of the cassette in
the new construct Ps. putida KT2440::mergfp47-32 which inserted into 23S rRNA. Insertions
in most of the other constructs were found in double or multiple occurring genes, although the
sequences of these genes were not as conserved as the 23S rRNA.
The microcosm experiments in this work provided the following possibilities for the
dissemination of the chromosomally integrated genes: (I) The construction of Ps. putida
KT2442::mer73 was accomplished by transposon mutagenesis. Although the transposase was
4 Discussion
118
not transferred in the course, inner and outer 19 bp Tn5 ends were and might later be
recognized by natural broad host range Tn5 transposase variants. (II) Inoculation into
microcosms must have caused a great number of cells to lyse and thus huge amounts of free
DNA were delivered into the microcosm available for transformation. Preliminary results of a
quantitative PCR approach (for the method see Felske et al. 2001) with stream microcosm
samples showed a discrepancy between bacterial density as determined by cultivation and
chromosome equivalents by two orders of a magnitude (see section 3.1.8.3). Nielsen et al.
(2000) found that although chromosomal DNA can persist in soil for weeks, if protected by
soil minerals, it may not be transformable for the same length of time. However, in the
experiments of this work cells were inoculated continuously and “fresh” DNA constantly
renewed. Although Ps. putida has not been shown to enter a competence state, it can be
transformed by chemical treatment or electroporation in the laboratory. Lorenz &
Wackernagel (1994) summarize procedures by which DNA can be translocated into cells and
they point out that environmental situations may be similar to those procedures. Osmotic
shock experienced by the inoculants in our experiments when they were transferred to the
microcosms could e.g. have rendered them receptive for the uptake of DNA. (III) The
mercury resistance operon is widely spread among bacteria and some sequences highly
conserved (e.g. merA, Osborn et al. 1997, Felske et al. submitted). By homologous
recombination the mer operon or parts of it could be exchanged if the GEM would take up a
plasmid bearing the mercury resistance genes. However, this would remain a silent transfer
that would not have been detected, unless the plasmid was transferred to the recipient. In this
case, the mercury resistance genes coming from the donor or indigenous bacteria could not be
discriminated. Furthermore, if the constitutive promoter regulating merTPAB in the GEM
was transferred by homologous recombination, a recipient with an inducible promoter could
obtain constitutive expression. (IV) Bacteriophages have been shown to be abundant both in
freshwater and marine environments (Miller 2001). Transduction has been a mechanism for
maintaining an otherwise counter-selected phenotype in a continuous culture model (Replicon
et al. 1995) and transduction frequencies in a freshwater environment have been shown to be
enhanced in the presence of SPM, where bacteria and bacteriophages can aggregate (Ripp &
Miller 1995). Free phage particles can be assumed to have been abundant also in the
microcosms used in this study. These could have infected and lysed the donor, randomly
producing mer operon-containing phage particles for which then there would have been a
great possibility of transducing the recipient.
4 Discussion
119
Although some of the above scenarios may appear highly speculative, none of them can be
ruled out completely. Gene transfer mechanisms operating in the environment may be much
more complex than anticipated on the basis of our present knowledge. Thus, the experimental
proof of lack of gene transfer under the specified conditions cannot be replaced by theoretical
considerations, however convincing they may be.
While the dissemination of genes from genetically engineered microorganisms (GEMs) is
regarded as posing an unpredictable risk by some (Ashelford et al. 2001), for others it could
represent a valuable means in bioremediation in providing a rather wide variety of
microorganisms with the detoxifying or degrading capabilities in question (Barkay et al.
1993, de Lipthay et al. 2001). Gene transfer from Ps. putida KT2442::mer73 cannot be
viewed as risk, since bacterial mercury resistance genes are ubiquitous and can be found even
in non-contaminated environments (Osborn et al. 1997). The dissemination of the genes in
mercury contaminated regions would aid biological mercury transformation and the site profit
with regard to pollution severity.
4.1.5.2 Effect of Selective Pressure on Gene Transfer
Rensing et al. (2002) review the influence of selective pressure on the horizontal transfer of
DNA in soil bacteria. The presence of mercury has for example been shown to increase the
frequency of mercury resistance plasmids. Smit et al. (1998) could demonstrate greater
occurrence of self-transmissible mercury-resistance plasmids in mercury amended soil and
suggested that the gene-mobilizing capacity be enhanced as mercury stress was applied.
Rasmussen & Sørensen (1998) also found higher occurrence of mercury resistance and of
self-transmissible plasmids in mercury contaminated marine sediment compared to unpolluted
sediment. A positive effect of selective pressure on the emergence of transconjugants could be
shown for phenoxyacetic acid and the tfdA bearing plasmid pRO103 (coding for a 2,4-
dichlorophenoxyacetic acid dioxygenase, de Lipthay et al. 2001).
These studies show that the application of a mercury selective pressure can increase the
frequency of horizontal transfer of the mercury resistance genes, and was hence an adequate
measure to promote transconjugants in the experiments of this work. Despite this fact gene
transfer could not be observed in the experiments for this thesis.
4.1.5.3 Effect of Cell Density on Gene Transfer
That cell densities do play an important role in horizontal gene transfer has been recognized
(see below). It is conceivable that for a gene transfer mechanism that requires cell to cell
contact such as conjugation the chance for horizontal gene exchange would rise with
4 Discussion
120
increasing cell densities. For filter mating fresh overnight cultures are commonly used and
concentrated to increase the cell density on the filter. Accordingly, Ravatn et al. (1998) found
decreasing transconjugant frequencies with lower cell densities. Fry and Day (1990)
admonish against using low initial cell densities or too few donors because conjugal transfer
frequencies were declining rapidly (in the epilithon) if densities were below 2×10⁵ cfu cm-2.
They found the optimal donor to recipient ratio to be between 1:60 and 16:1. Donor densities
used to study conjugal transfer to indigenous aquatic microorganisms or to bacteria within a
pilot-scale percolating filter bed were ca. 105 or 106 cfu ml-1 (Ashelford et al. 2001, Barkay et
al. 1993). For the experiments in this work this meant that gene transfer was expected in the
more densely populated sediment rather than in the water column. If the continuous release of
lower cell densities did not result in gene transfer, a cell shock with high cell density might
possibly induce it. However, neither approach did result in the detection of transconjugants.
Transformation is dependent on cell-DNA contact frequencies which in turn are also
increased with higher cell densities and DNA concentrations. However, other parameters may
also play a crucial role in the transformation process, e.g. half life of free DNA in the
environment in question and competence state of the recipient. These factors are reviewed by
Lorenz & Wackernagel (1994). As addressed above, in this work a constant renewal of fresh
DNA-molecules was probably provided from lysed inoculants of which some would have
been transformable even if a great portion was degraded by DNase.
4.1.6 Mercury Resistant Community & Molecular Determination of Bacterial Density
The mercury resistant community in the microcosms was to be shown by a merA specific
PCR and subsequent separation of the amplicons with TGGE. PCR was also employed to
determine bacterial densities in the microcosms using primers specific for the GEM Ps. putida
KT2442::mer73. Both methods, however, did not yield the expected results in terms of PCR
amplicon quality.
Both, merA PCR and cPCR were tried here with samples from the second microcosm
experiment, for which the sediment sample had been obtained from the Elbe River in October
2000. The sediment DNA looked sheared on agarose gel (data not shown), although the same
extraction method was used as in the first microcosm experiment (July 2000) for isolation of
good quality sediment DNA, and despite changing extraction parameters (such as the duration
of bead beating), no distinct bands for genomic DNA could be obtained.
4 Discussion
121
Both, the merA PCR and the cPCR have been shown to work well with other (biofilm)
samples (Felske et al. submitted, Felske et al. 2001), however, with decreasing DNA quality
and especially in connection with possible sediment-derived impurities in the DNA sample,
PCR sensitivity diminishes and gives way to non-specific products.
The merA PCR-TGGE protocol used in this work was adopted from Felske et al. (submitted)
who were able to monitor a mercury resistant bioreactor community with this approach.
However, they had to optimise the PCR for the different biofilm participants as signals for all
strains could only be obtained by using a rather complicated combination of PCR cycles and
annealing temperatures. Although they could also identify new bands, the PCR was primarily
aimed at detecting the known strains in the bioreactor. In the work presented here, however,
the merA PCR was performed with samples of an entirely different origin and thus probably
with a completely different set of mercury resistant bacteria and their resistance genes (in the
sediment mercury resistant bacteria were between 104 and 105 per g or 1-10% of the total
bacteria, see Figure 3-10). The thermogradient acrylamide gels with water and sediment
samples showed a high background in most of the lanes that could have been derived from
unspecific PCR artefacts, however, if the diversity of merA genes in the samples was grand
and the number of each merA type comparably low, the formation of distinct bands would
have been more difficult. Hence, rather than being unspecific, the background may have been
the result of many different merA PCR products. Moreover, if the merA genes found in the
Elbe River samples would have been much different from the genes found in the bioreactor,
the merA PCR may have not been optimal for the Elbe River samples and PCR cycling may
have needed improvement for these samples.
4.2 Ps. putida constructs for Bioremediation of Mercury Contaminated Waste Water
4.2.1 Construct Ps. putida KT2442::mer73
The mercury reducing GEM Ps. putida KT2440::mer73 was constructed in 1994 by Joanne
Horn and co-workers and appeared a promising candidate for the use in bioremediation of
mercury contaminated waste water on the basis of very high and constitutive mercury
transformation in pure laboratory cultures. In this work, Ps. putida KT2442::mer73 was tested
for its influence on indigenous bacterial communities in the microcosm experiments. In
laboratory scale bioreactors, however, the strain did not establish well (von Canstein et al.
4 Discussion
122
2002a), it was washed out quickly possibly owing to a relatively long lag phase during growth
(also see Figure 3-29) and not to a general lack of biofilm forming capability, as the GEM did
prove to form good biofilms in microdishes.
Localization of the transposed genes in this work revealed integration at the very 3’ end of an
alanyl-tRNA-synthetase, probably not disturbing the function of the enzyme and not
interfering with the regulation of the next gene downstream, a transport protein of the major
facilitator superfamily. Alanyl-tRNA-synthetase is an important enzyme in protein synthesis
and only one copy of the genetic code for the enzyme can be found in the Ps. putida KT2440
genome. Moreover, aminoacyl-tRNA-synthetases are very specific (Gottschalk 1985) and no
other aminoacyl-tRNA-synthetase could have taken over the function of the alanyl-tRNA-
synthetase. Thus, it is highly unlikely that enzyme function would have been destroyed
because the cell would not have survived.. Furthermore, by scrutinizing the insertion site it
could be found that no frame shift occurred, however, stop codons upstream the mer operon
would have terminated transcription of the alanyl-tRNA-synthetase. However, it cannot be
ruled out completely that the gene insertion is in fact responsible for the deteriorated growth
and thus for the lack of establishing an active biofilm in the bioreactors
4.2.2 Tn5 Transposition Target Site Selection
Tn5 belongs to the class I transposons, that perform non-replicative transposition using a cut-
and-paste mechanism and creates 9 bp duplications in the target DNA. Tn5 derivatives have
been described useful for random mutagenesis (Horn et al. 1994, Alexeyev et al. 1995).
Nevertheless, although it has been shown that no specific DNA sequence is required for Tn5
transposition and that insertions occur at many different sites of the bacterial genome (e.g.
Herrero et al. 1990, this work), class I transposons have also been observed to prefer target
DNA with a certain similarity to the outer ends. The preferred sequence of Tn5 transposase
for integration has been deduced to be in GNT T/C A/T A/G ANC (G=guanine, T=thymine,
A=adenine, C=cytosine, N=any of the four bases) from a total of 354 Tn5 insertions
(Goryshin et al. 1998).
In this work, particular bases within the duplication could be found at higher frequencies
(>60%) at base positions 1 (G), 4 (C), 6 (A), 9 (C), 11(G) downstream of the O-end. This
observation was in full agreement with the preferred Tn5 target sequence except of the G at
position 11, that was not part of the duplicated sequence. Other positions also harmonized
with the preferred integration site: At position 3 thymine dominated with 47%, at position 5
an adenine or thymine could be found in 67% of the cases. Position 7 contained an A in 40%
4 Discussion
123
of the sequences. The consensus sequence found by Goryshin et al. (1998) was clearly not an
absolute requirement for transposition. They found many of their inserts at sequences
different from the consensus sequence at one or more positions and this was the same with the
constructs in this work. Still, the accumulation of higher base frequencies within the
duplicated sequence was remarkable. However, among the 20 constructs that were analysed,
the insertion sites were well distributed over the recipient genome.
4.2.3 Integration/Protein Functions Assigned to Ps. putida KT2440 Open Reading Frames
Although the Ps. putida KT2440 genome has now been fully sequenced (Nelson et al. 2002),
accurate annotations for the DNA sequences are lagging behind. Often times assigned gene
functions in the annotations have not been experimentally verified, rather similar DNA
sequences have been found in databases for which a particular function could be elucidated
(on the basis of experimental data or merely protein motifs). Misassignment during the
annotation process owing to error propagation and a lack of experimental data cannot be ruled
out (Peterson et al. 2001). Hence, annotated proteins whose functions have not been proven
experimentally must be viewed with care. Furthermore, this demonstrates the need for
experimental protein research that remains crucial if one wants to understand the meaning of
the genetic data that has been obtained.
In general, transposon mutagenesis, selects for constructs that are viable. If transposition
occurs within a gene that is essential but destroyed by the insertion, the strain will not be able
to thrive and form colonies, thus lethal insertions are counter-selected. On the other hand the
selection of the constructs with mercury required the mercury resistance to be expressed in
adequate amounts. Transcription from a promoter that was sufficiently strong was thus
compulsory for the strains to grow on the selection medium. Strong promoters, however,
indicate a relative importance of the gene(s) they are regulating. It was thus not surprising that
many of the insertions were found within genes, that are necessary for maintenance or house-
keeping of the cell (see below: aroQ, nuoCD, rrn, ilvN & ilvB) and it raises a special interest
in the identity of the hypothetical proteins. For a bacterium to grow despite disruption of a
particular gene it either needs other genes with the same functions to surrogate the destroyed
gene or the function of the disrupted gene was not (completely) destroyed by the insertion.
In this work, localization of the gene insertion in the constructs was carried out to partially
characterize the newly created strains. Although many of the genetic modifications could
indeed be elucidated, information about the kind of transcriptional control exerted on the
4 Discussion
124
inserted genes was often lacking or incomplete, however, two of the insertions were found in
RNAs (Ps. putida KT2440::mergfp47-30 & 47-32) that are usually transcribed from
extraordinarily strong, growth-rate regulated promoters. High expression was also true for the
GEM of Horn et al. (1994) that was used in this work for safety studies and for Ps. putida
KT2440::mergfp46-7, 47-14 and 47-16. In these strains the integration occurred between the
small and large subunits of the biosynthetic acetolactate synthase (ilvN and ilvB), within the
coding region for an electron transferring subunit of the NADH dehydrogenase I (nuoCD) or
within the 3-dehydroquinate dehydrogenase (aroQ) respectively for the three strains. The first
and the latter are crucial in amino acid biosynthesis (isoleucine, leucine, valine/
phenylalanine, see 3.3.3 for discussion of aroQ insertion), while NADH dehydrogenase I is
an essential component of the respiratory chain. The insertion into nuoCD in Ps. putida
KT2440::mergfp47-14 occurred nearly 500 bp downstream of the 5’ end of the 1800 bp gene.
When growth of Ps. putida KT2440::mergfp47-14 in M9 medium with benzoate (data not
shown) was compared with growth of the other constructs the strain showed indeed a
prolonged lag phase which may be accredited to the insertion. However, this was a
preliminary result which must be confirmed. Impeded growth of Ps. putida
KT2440::mergfp47-14 could not be found on M9+benzoate agar plates. As the name indicates
nuoCD comprises two functions. One can speculate that the insertion only impaired but did
not fully destroy the function of the particular subunit or of the entire NADH:ubiquinone
oxidoreductase.
Among the other construct strains growth in M9 (+benzoate) was quite similar and not
deviant to the parent Ps. putida KT2440 (Figure 3-29). Besides the mercury reducing GEM
Ps. putida KT2442::mer73 and the mercury reducing fluorescent Ps. putida
KT2442::mer::gfp11, a delayed lag phase compared to the other constructs and the wildtype
was also found in Ps. putida KT2442::mergfp46-2, 46-7 and 46-8, possibly a result of the
insertion in these strains. Again, these are preliminary results, and effects during growth under
different conditions (different medium, temperature, carbon source etc.) might reveal other
effects of the gene insertion. As a link between genetic and physiological characterization,
proteomics could be capable of yielding important information about the behaviour of the
construct strains.
Differences among the strains could be found in the development of fluorescence during
colony growth (see 3.3.5.1). Andersen et al. (1998) also observed a heterogeneous and
changing distribution of the GFP fluorescence. Remarkably, they did not observe dark centres
(as with Ps. putida KT2440::mergfp47-32 in this work), rather they found the centres to be
4 Discussion
125
the brightest spots within colonies of Ps. putida KT2442 that had been trans-mutagenised
with a GFP version (last three amino acids AAV, that had a similar half time to the 46 version
(-ASV) used in this work. They speculated this to be caused by cannibalism of the cells in the
centre keeping them metabolically active. In contrast they soon found brightest fluorescence
at the borders of the colony in the strain carrying a GFP version with LAA at the last three
positions (least stable GFP variant that was also used in this work).
Although the constructs in this work mostly showed bright centres, darker cores could
sometimes be found after some time with the concurrent appearance of a ring pattern. The gfp
cassette of Andersen et al. (1998) contained a LacI repressible promoter (PA1/04/03) while the
mergfp cassette used in this work was integrated into the host genome without transcriptional
control of its own but was dependent upon host transcriptional machinery to be expressed. In
Ps. putida KT2440::mergfp47-11 fluorescence was distributed homogenously during colony
growth (Figure 3-32) and was present even in the old colony, while in Ps. putida
KT2440::mergfp47-1, fluorescence concentrated in the centre of the colony and diminished
after a few days. Sequence data about the genomic integration site could not reveal further
clues as there was no good sequence for Ps. putida KT2440::mergfp47-1 and the annotation
for Ps. putida KT2440::mergfp47-11 merely rendered a hypothetical protein without a hint
about its function. As already described above many of the unambiguously identified genes
were constitutively transcribed. However, the promoter is not known for all identified
insertions. Differences in the transcriptional control could be made responsible for variations
in fluorescence patterns within the colonies if cassettes were under the control of promoters
active only during certain stages of the growth cycle. Metabolic activity is crucial for GFP
expression especially with the destabilized GFP versions However, different transcriptional
regulation may be responsible for differences in expression.
4.2.4 Fluorescence as a Reporter of Mercury Transformation
The visualisation of bacteria by virtue of GFP fluorescence has found wide application (Unge
et al. 1998, Errampalli et al. 1999). Only some of the benefits are the non-invasiveness of the
approach, the possibility for on-line or real time monitoring. Furthermore, GFP unlike Lux
does not require a co-factor for fluorescence. Detection is relatively easy by fluorescence
microscopy, fluorescence activated cell sorting (FACS) or spectrofluorometry.
Although useful for detection of bacterial cells, including those that are no longer
metabolically active, stable GFP accumulates and may become a burden to the bacterial cell.
Therefore, destabilized GFP variants were used in this work which possessed different
4 Discussion
126
C-terminal tags conferring different susceptibilities to tail-specific proteases (Andersen et al.
1998). Three variants with different half lives were used to allow for a spectrum of
fluorescence intensities of the transformant strains. Among the strains obtained in the
modification one strain with a medium fluorescing GFP variant (46 series), and several strains
with a relatively stable GFP variant (47 series) displayed fluorescence intensities that would
render them easy for detection. In combination with a high mercury transformation rate, that
in some cases was notably higher than that of Ps. putida KT2442::mer73, some of these
strains are promising candidates to be used in bioremediation of waste water contaminated
with ionic or organic mercury. Furthermore, fate, persistence and performance of a construct
strain within a bioreactor biofilm could easily be monitored, without laborious molecular
based methods.
Green Fluorescent Protein has been widely used as reporter gene for gene expression in
mammalian (Kain et al. 1995) and plant cells (Blumenthal et al. 1999) as well as in
prokaryotes (Southward & Surette 2002). In bacteria gfp has frequently been fused with a
promoter of interest to study gene regulation but without the actual expression of the protein
that is normally transcribed from this promoter. Targets of interest were e.g. promoter
elements of heat shock stress proteins (transcription factor σ32, protease subunit ClpB, DnaK;
Cha et al. 1999) to study stress response in E. coli cells or pmer and its regulatory gene merR
for the detection of bioavailable mercury using E. coli and Ps. putida (Hansen & Sørensen
2000). Furthermore, gfp has been fused with the growth-rate regulated E. coli rrnBP1
promoter to enable monitoring of the distribution of growth activities in flow-chamber
biofilms (Sternberg et al. 2001). On the other side, simultaneous co-transcription of gfp and
chloramphenicol acetyl-transferase (cat) has been achieved in E. coli to demonstrate the
possibility of on-line monitoring of a fermentation product (DeLisa et al. 1999).
Here, the two genes gfp and mer were under control of the same host promoter in the
construct strain, thus transcription of the two functions in each individual strain was linked
and fluorescence intensity most probably reflected mercury transformation. However this
should be experimentally confirmed for each individual strain during cell growth. In a
preliminary experiment the correlation of mercury transformation and gfp fluorescence
intensity was investigated. High mercury transformation rates were anticipated to be
correlated with high fluorescence intensity. For the constructs with the shortest (41) and the
medium half life (46) this correlation could be found, although differences in fluorescence
and mercury transformation were only marginal for constructs from the 41 series. Among the
constructs with the most stable GFP (47) the strain with medium mercury transformation rate
4 Discussion
127
showed lowest fluorescence. The basis for this result needs to be investigated further. It is
feasible to quantify the mRNA for GFP and mercuric reductase to gain more information on
the transcription of the two. If transcription was unambiguously found to be equal, then the
low correlation of fluorescence and mercury transformation activity must be due to
differences on the translational level.
Differences between the mer operon and gfp on the transcriptional level are highly unlikely.
Nevertheless, while fluorescence intensity is directly dependent on the number of GFP
molecules in the cell, mercury transformation depends on a variety of factors including the
energy balance of the cell (NADH can be a limiting factor in the reduction of ionic mercury).
The cells were sampled in late logarithmic phase. However, growth is not fully synchronized,
i.e. in late logarithmic phase some cells have already reached stationary phase while others
are still in the physiological state of mid-logarithmic phase. It is possible that one culture
contained more cells already in stationary phase than another culture. This would inevitably
have lead to a reduction of mercury transformation. In stationary phase GFP degradation by
the protease would also have been attenuated, hence more molecules would have remained in
the bacterial cell, despite decreased biosynthesis of GFP. Mercury transformation rate and
fluorescence intensity over a growth cycle will have to be monitored for the individual
construct strains to elucidate the relationship between the two functions.
4.2.5 The Best Fluorescent, Mercury Reducing Constructs for Bioremediation in a Bioreactor
Clearly, the three strains of the 47 series (Ps. putida KT2440::mergfp47-1, 47-11, 47-32)
were superior both in fluorescence and mercury transformation and exceeded the mercury
transformation of the GEM Ps. putida KT2442::mer73. While Ps. putida
KT2440::mergfp46-7 showed high fluorescence, mercury transformation rates were good but
below those of Ps. putida KT2442::mer73. In the few physiological tests no defect of these
strains could be detected when compared to the parent strain Ps. putida KT2440, except for
Ps. putida KT2440::mergfp46-7 which seemed to have a longer lag phase when compared
with the other strains.
Of these three strains, the function of the disrupted gene was undoubtedly revealed only for
Ps. putida KT2440::mergfp47-32. Here, a rRNA gene was disrupted that, however, was
present in the genome in multiple copies. The construct showed the highest fluorescence as
well as the highest mercury transformation rate. On this basis, Ps. putida KT2440::mergfp47-
32 would be the strain of choice to be used in a bioreactor. Since it has been shown that multi-
4 Discussion
128
species biofilms are advantageous to mono-species biofilms (von Canstein et al. 2002a), it
would be feasible to introduce the construct into a multi-species bioreactor in order to protect
the community from abrupt mercury peaks which the construct should be able to cope with
well due to its constitutive expression. The bioreactor community could be made of wildtype
isolates/invaders or of other construct strains that in a concerted action would best be able to
bioremediate mercury contaminated waste water.
The safety of the new construct strains was enhanced by using a fully sequenced safety strain
as a parent, by choosing the variant without the rifampicin resistance of Ps. putida KT2442,
by the full genetic elucidation of the insertions and through the provision of GFP as part of
the insertion cassette for easier detection.
An important question towards the monitoring of the constructs in mercury reducing biofilms
is the prospect of single cell detection. A number of Pseudomonads that occur in nature show
(mostly greenish) autofluorescence (e.g. see fluorescence of the parent Ps. putida KT2440 in
comparison to the GFP-strains, Figure 3-30 to Figure 3-32). Thus for GFP fluorescence to be
useful for monitoring, it needs to be clearly discernable from the autofluorescence of other
strains. Overnight liquid cultures (LB medium) of the constructs were observed under the
microscope (×400, ×1000 magnification with the fluorescence microscope, data not shown),
however, except for Ps. putida KT2440::mergfp47-32 who fluoresced brightly, fluorescence
seemed rather weak for the other constructs of the 47 series, and of the 41 and 46 series only
Ps. putida KT2440::mergfp46-7 could be detected with the fluorescence microscope. The
non-GFP-fluorescent Ps. putida KT2440 or Ps. putida KT2442::mer73 could not be detected
in this way. However, these were preliminary tests that need confirmation. In a bioreactor, the
constructs would grow continuously and not in batch as the overnight cultures that were
observed here. The possibility of single cell detection in a bioreactor biofilm needs further
investigation of construct fluorescence during different growth phases and in continuous
culture. Moreover, construct detection within a non-fluorescent community needs further
investigation. However, using confocal laser scanning microscopy and an appropriate
experimental design it might in principle be possible to monitor the mercury reducing activity
of the new constructs in a non-destructive way in intact biofilm samples. In this way,
information on gradients of activity and interactions between individual biofilm cells in
multispecies biofilm might be obtained.
5 Summary
129
5 Summary
A Stream Microcosm was designed to carry out ecological experiments regarding the impact
of Ps. putida KT2442::mer73, a Tn5 mutagenised, mercury reducing GEM, if introduced into
native bacterial river water and sediment communities. Since discharge of a bioreactor
containing the GEM would most likely enter a river, a stream microcosm was chosen as the
model system. Streams are tremendously complex environments that cannot be modelled
efficiently in a simple system. Therefore, a complex microcosm was designed for the
experiments. Flow visualization revealed laminar to transitional flow suitable for these kinds
of experiments.
Survival and Persistence of the GEM were monitored during long-term low density
inoculation and shock inoculation by cultivation on selective agar plates. Long-term
inoculation was achieved by connecting the microcosm with a chemostat. While there was a
minimal trend of higher bacterial densities in the sediment, no long-term effect could be seen
in the water. After a recycling period of 10 days, the microcosms were sampled for a total of
43 days. This is longer than most experiments of this kind were performed.
The Bacterial Community from water and sediment was profiled as 16S rDNA-PCR-TGGE
banding pattern. An influence of the GEM on the bacterial community could not be detected.
Gene Transfer was monitored in a second microcosm experiment during which the
microcosms were inoculated with the GEM and a tetracycline resistant Ps. putida KT2440 as
close relative and thus probable recipient in a gene transfer event. This experiment was
operated for 45 days after the recycling period including one microcosm that was
continuously amended with PMA to create a selection pressure. However, gene transfer could
not be detected.
The Insertion Site of the mer operon of Ps. putida KT2442::mer73 was elucidated by
restriction digest and IPCR and subsequent sequencing of the neighbouring genomic DNA.
This knowledge allowed the development of a quantitative, competitive PCR method for
specific detection and quantification of the GEM.
5 Summary
130
New Mercury Reducing Fluorescent Ps. putida Strains were constructed for a possible use
in bioremediation of mercury contaminated waste water by mini-Tn5 mutagenesis of a mergfp
cassette into the genome of the safety strain Ps. putida KT2440. Three destabilized versions
of GFP with different half lives were used in the construction. Of the obtained strains some
were highly resistant to mercury exceeding the capabilities of Ps. putida KT2442::mer73. The
integrated mergfp cassette should allow detection of the cell due to its green fluorescence, and
monitoring of mercury reducing activity during bioremediation.
The Insertion of the mergfp Cassette was Localized in most of the new strains with the help
of the information obtained from the Ps. putida KT2440 genome project. Most insertions had
occurred within encoding regions for hypothetical or putative proteins. Of the disturbed
codons that could be unambiguously identified, nearly all had multiple copies present in the
Ps. putida KT2440 genome. An exception were Ps. putida KT2440::mergfp47-14 which
carried the sequence within the gene for the NADH dehydrogenase which is crucial for
respiration and Ps. putida KT2442::mer73 in which the insertion was within an alanyl-tRNA-
synthetase. Despite the insertion the strains grew well, however, with a prolonged lag-phase.
The possibility to use GFP Fluorescence as a Reporter for Mercury Transformation
Activity was investigated. A weak correlation between GFP fluorescence and mercury
transformation could be found among the strains regardless of the promoter, however, this
correlation would have to be proven for the individual strains in a growth experiment.
Ps. putida KT2440::mergfp47-32 was found to possess highest mercury transformation rates
as well as highest fluorescence and was therefore the best strain among the constructs of this
work. Ps. putida KT2440::mergfp47-1 and Ps. putida KT2440::mergfp47-11 also performed
and fluoresced extremely well and are possible candidates for bioremediation in a mercury
reducing bioreactor.
6 References
131
6 References
Abebe HM, Seidler RJ, Lindow SE, Short KA, Clark E, King RJ (1997). Relative expression
and stability of a chromosomally integrated and plasmid-borne marker gene fusion in
environmentally competent bacteria. Current Microbiology 34:71-78.
Alexeyev MF, Shokolenko IN, Croughan TP (1995). New mini-Tn5 derivatives for insertion
mutagenesis and genetic engineering in Gram-negative bacteria. Canadian Journal of
Microbiology 41:1053-1055
Allan JD (1995). Stream Ecology. Structure and function of waters. Kluwer Academic
Publishers, Dordrecht, The Netherlands
Andersen JB, Sternberg C, Poulsen LK, Bjørn SP, Givskov M, Molin S (1998). New unstable
variants of green fluorescent protein for studies of transient gene expression in bacteria.
Applied and Environmental Microbiology 64(6):2240-2246
Arber W (2000). Genetic variation: molecular mechanisms and impact on microbial
evolution. Microbiology Reviews 24:1-7
Artiguenave F, Vilaginès R, Danglot C (1997). High-efficiency transposon mutagenesis by
electroporation of a Pseudomonas fluorescence strain. FEMS Microbiology Letters 153:363-
369
Ashelford KE, Fry JC, Learner MA (1995). Plasmid transfer between strains of Pseudomonas
putida, and their survival, within a pilot scale percolating-filter sewage treatment system.
FEMS Microbiology Ecology 18:15-26
Ashelford KE, Fry JC, Day MJ, Hill KE, Learner MA, Marchesi JR, Perkins CD, Weightman
AJ (1997). Using microcosms to study gene transfer in aquatic habitats. FEMS Microbiology
Ecology 23:81-94
6 References
132
Ashelford KE, Learner MA, Fry JC (2001).Gene transfer and plasmid instability within pilot-
scale sewage filter beds and the invertebrates that live in them. FEMS Microbiology Ecology
35:197-205
Asubel FM, Brent R, Kingston RE, Moore DD, Seidman JG, Struhl K (1990). Current
Protocols in Molecular Biology. Supplement 9, unit 2.4: Preparation of Genomic DNA from
strains: nucleotide sequence of M13mp18 and pUC19 vectors. Gene 33: 103-119
6 References
154
Yee YC, Kisslinger B, Yu VL, Jin DJ (1996). A mechanism of rifamycin inhibition and
resistance in Pseudomonas aeruginosa. Journal of Antimicrobials and Chemotherapy
36:1915-1921
Symbols and Abbreviations
155
Symbols and Abbreviations
AAS atomic absorption spectroscopie
bp basepairs
cfu colony forming units
cPCR competitive PCR
CTAB hexa-decyl-trimethyl ammonium bromide
ed(s). editor(s)
EDTA ethylendiamine tetra acetate
e.r.a. environmental risk assessment
et al. et alii/ et alia, Latin for: and others
etc. et cetera, Latin for : and so on
FACS fluorescence-activated cell sorting
FITC fluorescein isothiocyanate
×g times gravity
gfp gene for GFP
GEM genetically engineered microorganism
GFP Green Fluorescent Protein
GMO genetically modified organism
Hg mercury
Hg0 elemental mercury
Hg2+ divalent ionic mercury
IPCR inverse polymerase chain reaction
kb kilobases
L litre, length
LB Luria Bertani Medium
mer mercury resistance operon
mergfp gene cassette consisting of merTPAB and gfp
ν kinematic viscosity
NADH nicotinamide-adenine dinucleotide
NCBI National Center for Biotechnology Information
OD600 optical density at 600 nm
ORF open reading frame
PCR polymerase chain reaction
Symbols and Abbreviations
156
PMA phenyl mercuric acetate
ppb parts per billion [µg L-1]
ppm parts per million [mg L-1]
Re Reynolds number
Rif rifampicin
SDS sodium dodecyl sulfate
SSC sodium chloride, sodium citrate
t time
t½ halflife
TE Tris-EDTA
TIGR Institute for Genomis Research
TGGE thermo gradient gel electrophoresis
Tn5 transposon 5
U velocity
v/v volume per volume
wt wildtype
w/v weight per volume
Danksagung
157
Danksagung Bei Herrn Prof. Dr. K. N. Timmis bedanke ich mich für die Möglichkeit, diese Doktorarbeit im Bereich Mikrobiologie and der Gesellschaft für Biotechnologische (GBF) Forschung durchführen zu können. Mein besonderer Dank gilt Frau PD Dr. Irene Wagner-Döbler für die interessante Themenstellung und ihre genausten Korrekturen und Kommentare zu dieser Arbeit. Der Europäischen Union bin ich für die Finanzierung dieser Studien zu Dank verpflichtet, sowie den Projektpartnern von BIOTECH BIO4-CT-98-0168, insbesondere Niels Kroer für seinen Rat zu den Mikrokosmos Experimenten. Herrn Prof. Dr. Dieter Jahn danke ich für die Übernahme des Zweitgutachtens. Herrn Prof. Deckwer und Dr. Rolf-Joachim Müller danke ich für die ausgesprochen herzliche Aufnahme in die Räume der Umweltverfahrenstechnik der GBF im Y-Gebäude, 2. Stock. Weiteren (ehemaligen) Mitgliedern meiner (ehemaligen) Arbeitsgruppe bzw. des Labors D0.11, Ina Pubantz, Harald von Canstein, Ingrid Brümmer, Kerstin Wilken, Andreas Felske, Marita Sylla und Verena Heindl, sowie Daniela Regenhardt und Stefanie Tilmann danke ich für die verlässliche fachliche und moralische Unterstützung. Ganz besonders dankbar bin ich Christa Hoch, Alexander Neef und Carmela sowie Akın Akkoyun. Sie waren die ersten, die diese Arbeit gelesen und kommentiert haben. Ebenso bedanke ich mich bei Michael Strätz und Bernd Hofer für ihre offene Ohren bei Fragen molekulargenetischer Art. Mit Herrn Possins Hilfsbereitschaft und seinem unendlich großen Herzen waren etliche Probleme viel leichter lösbar. Ihm sei dafür ganz besonders herzlich gedankt. Jens Schumacher danke ich für seine Laufpartnerschaft. Die Abendstimmung an den Riddagshäuser Seen immer wieder zu erleben, zählte zu den herrlichsten und entspannendsten Erlebnissen während der Promotion. Olaf Schäfer danke ich für die technischen Tipps bei der Konstruktion der Mikrokosmen, seine qualifizierten Berechnungen und seinen Sinn für Perfektion. Meiner neuen Chefin, Frau Prof. Dr. Brigitte Jockusch, bin ich dankbar, dass sie mich einstellte und mir die Möglichkeit gab, neben dem Zusammenschreiben der Doktorarbeit, eine so außerordentlich befriedigende, interessante und lehrreiche Aufgabe zu übernehmen. Den größten Dank schulde ich Wanda Fehr. Ihre praktische Art, gepaart mit so viel Herzlichkeit hat die Zeit der Doktorarbeit unvergesslich gemacht. Sie war eine große Hilfe, und wir in meinen Augen ein tolles Team! Hoffentlich irgendwann mal wieder! „Last but not least“, danke ich Dietmar Pauling und Hella Zipp, denen ich vieles verdanke, das mir das Leben nicht immer leicht aber ausgesprochen lebenswert macht.