PSAT Meta Data Analysis Project Mike Musyl, Rich Brill, Yonat Swimmer, Lianne McNaughton Michael Domeier, Nicole Nasby-Lucas, Molly Lutcavage, Ben Galuardi, Francois Royer, Steve Wilson, Joe Liddle
Transcript
PSAT Meta Data Analysis ProjectMike Musyl, Rich Brill, Yonat Swimmer, Lianne McNaughton
Michael Domeier, Nicole Nasby-Lucas, Molly Lutcavage, Ben Galuardi, Francois Royer, Steve Wilson, Joe Liddle
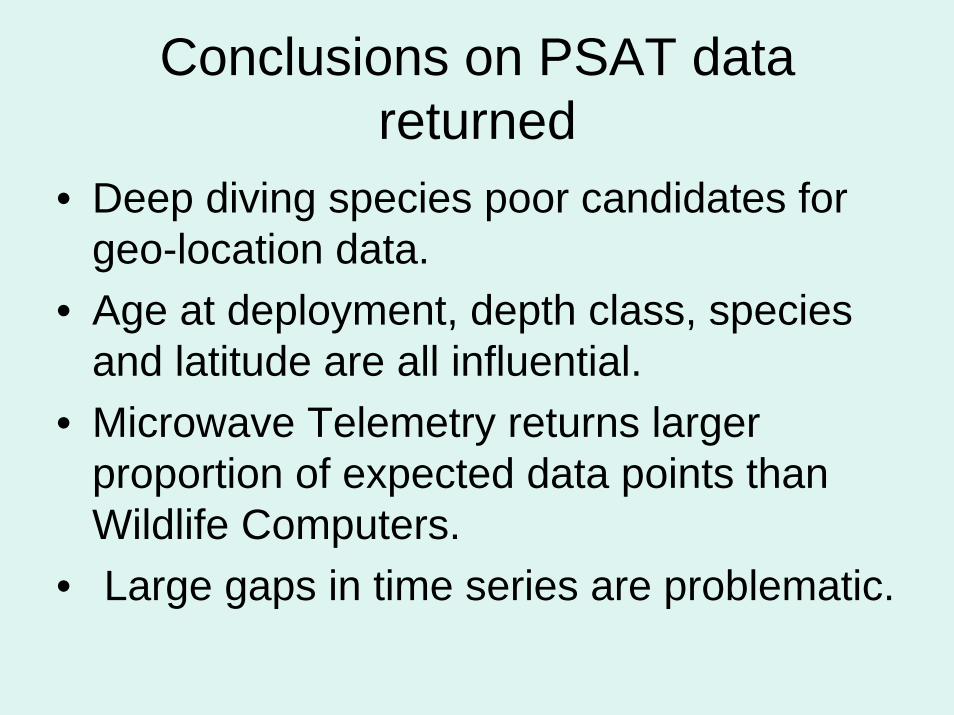
• Failure rates (percent reporting)
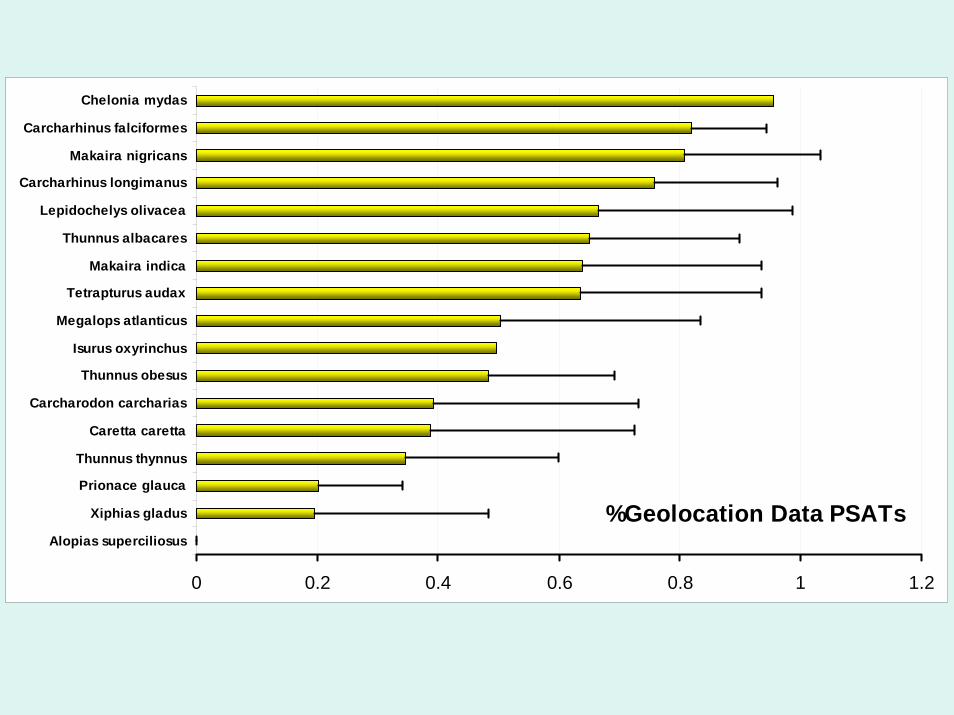
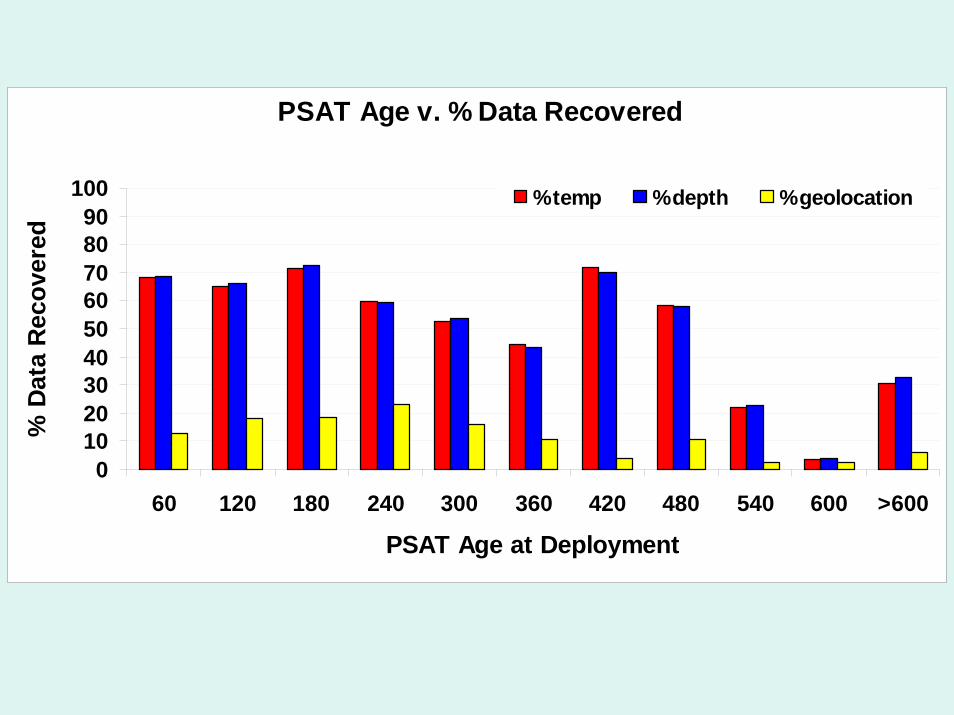
• Percentage of retrieved depth, temperature, and geolocation data
• Retention rates
• Longevity of attachment
This study is designed to look at variables explaining:
Comparisons to be made using data from 662 PSATs Comparisons to be made using data from 662 PSATs deployments worldwidedeployments worldwide
It is anticipated that:
Patterns will emerge with respect to:attachment methodologies, target species,experimental design.
Allows unprecedented critical appraisal of the overall efficacy of PSAT technology.
Cost Benefit analysis to improve experimental design
Variables in the PSAT Performance Evaluation:
Tag Birthday Tag Serial Number
Programmed Pop-off date Date Deployed
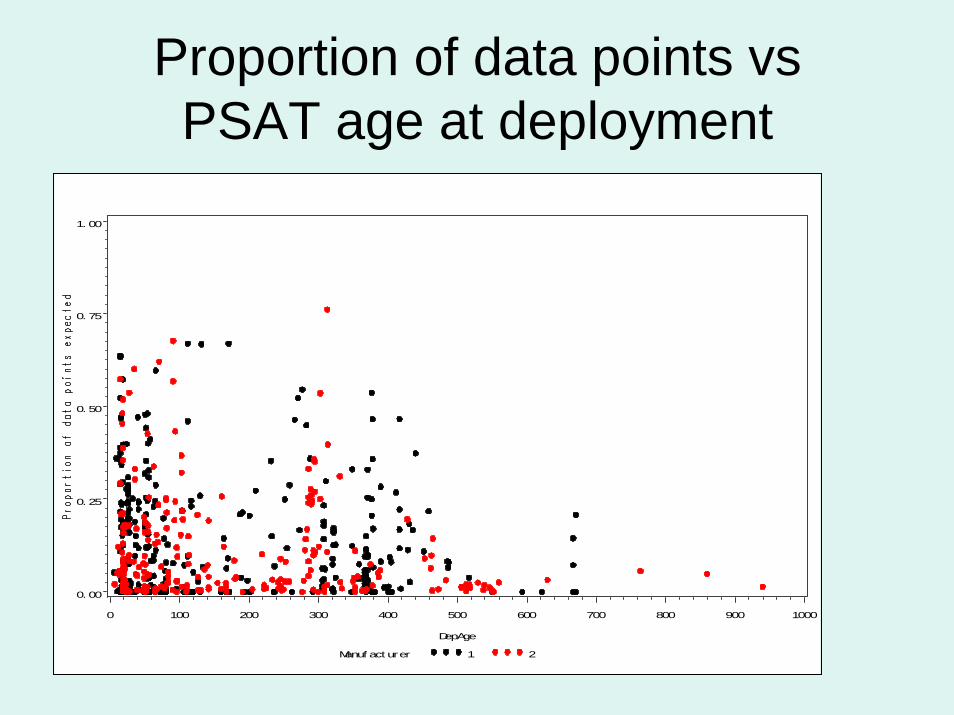
Age of Tag at Deployment Species Tagged
Sex Days-at-liberty
% Temperature % Depth
% Geolocation ARGOS latitude
ARGOS longitude RD1500
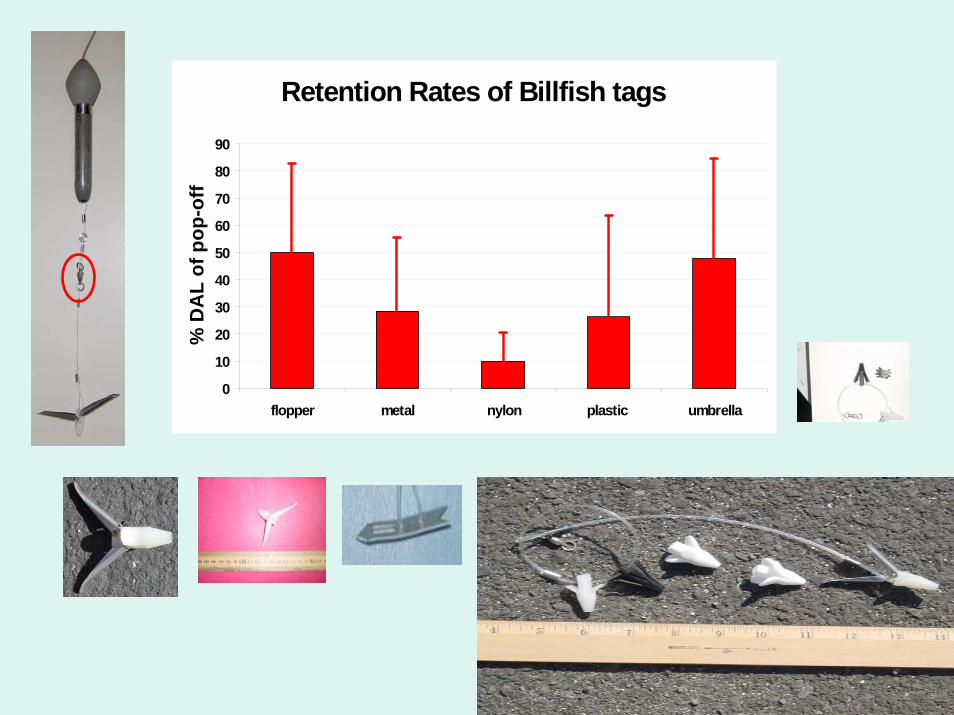
Swivel Tether material
Tag Head Attachment methods
Manufacturer
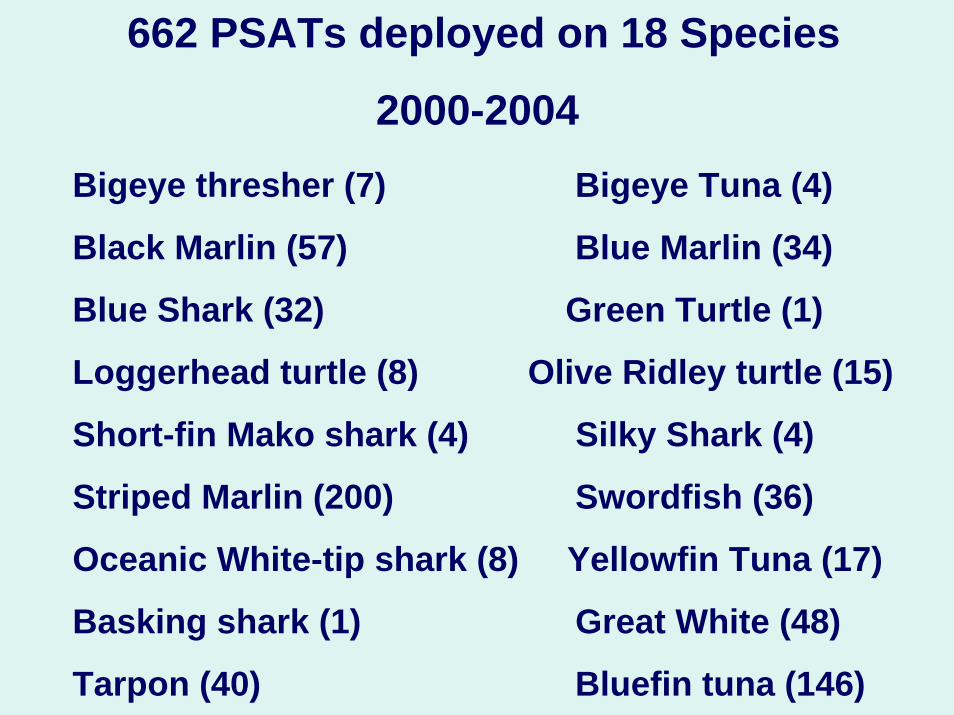
662 PSATs deployed on 18 Species
2000-2004Bigeye thresher (7) Bigeye Tuna (4)
Black Marlin (57) Blue Marlin (34)
Blue Shark (32) Green Turtle (1)
Loggerhead turtle (8) Olive Ridley turtle (15)
Short-fin Mako shark (4) Silky Shark (4)
Striped Marlin (200) Swordfish (36)
Oceanic White-tip shark (8) Yellowfin Tuna (17)
Basking shark (1) Great White (48)
Tarpon (40) Bluefin tuna (146)
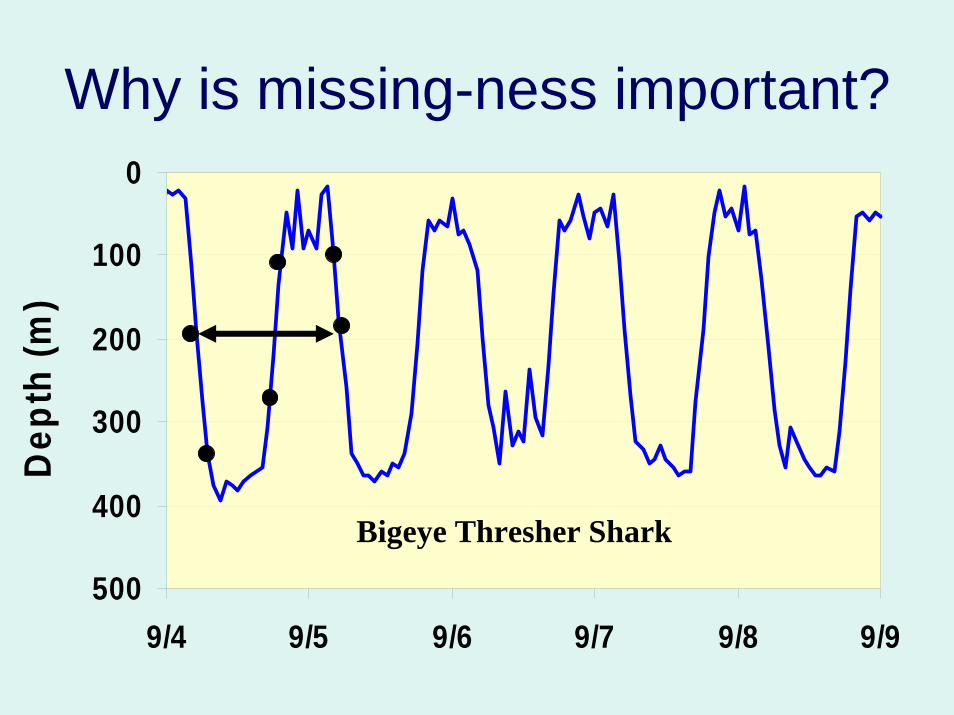
Difficult problemPSAT failure rates
• Never hear from failed PSATS• Very few PSATs recovered for inspection • Exact failure mode(s) unknown
•Shouldn't limit discovery
•Exploration of data reveals much
• Ideas to improve methods
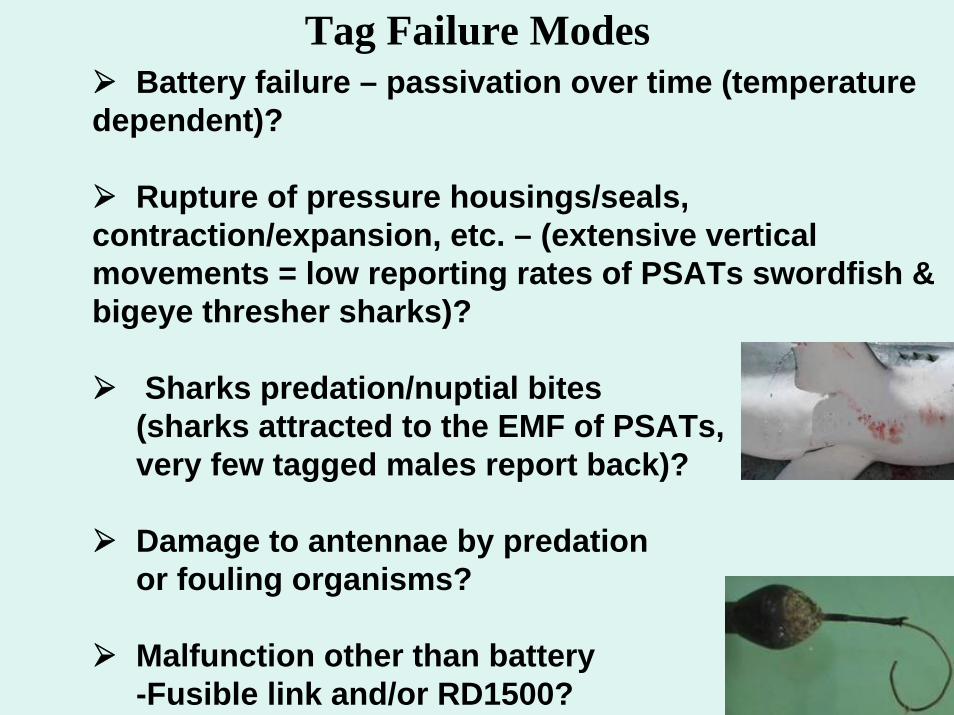
Tag Failure Modes• Battery failure – passivation over time (temperature
dependent)?
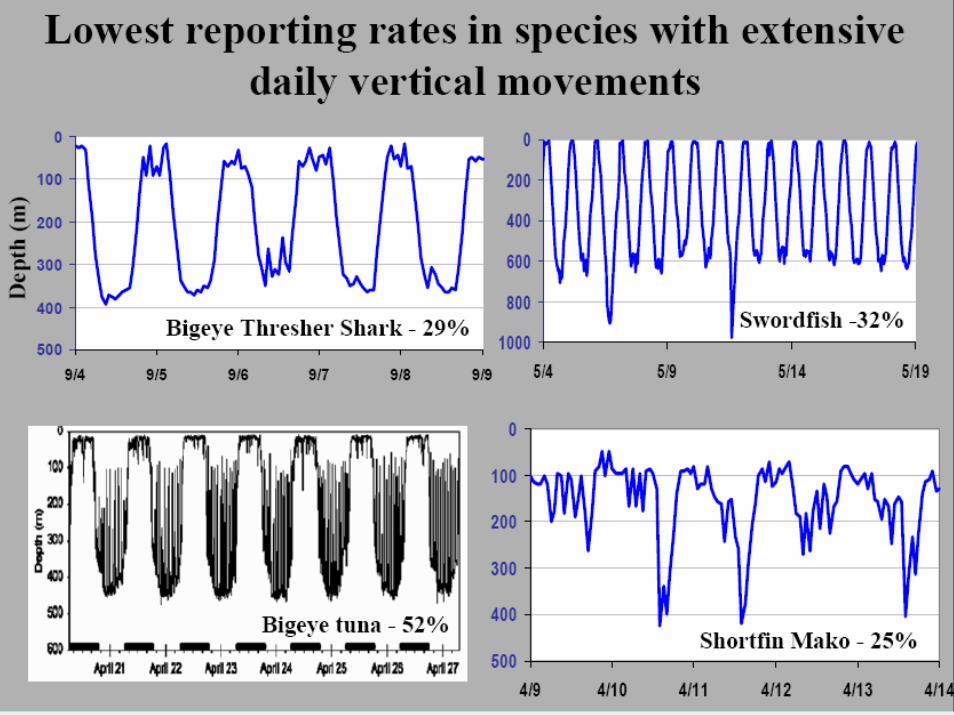
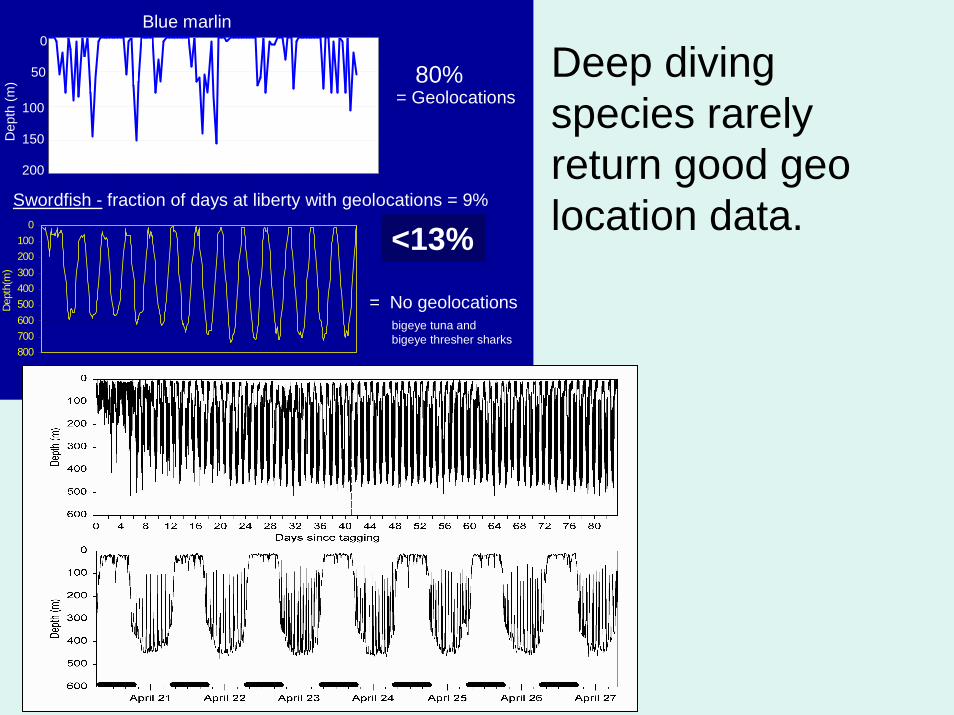
• Rupture of pressure housings/seals, contraction/expansion, etc. – (extensive vertical movements = low reporting rates of PSATs swordfish & bigeye thresher sharks)?
• Sharks predation/nuptial bites• (sharks attracted to the EMF of PSATs,• very few tagged males report back)?
• Damage to antennae by predation • or fouling organisms?
• Malfunction other than battery• -Fusible link and/or RD1500?
Attachment Failure
79%Responded
No response21%
System Failure
662 PSATs Deployed
Tag Damaged
Pressure Housing Fails
Battery Fails
Diving stresses Housing
Severance Failure
Detaches early80%
Hits Pop off20%
animal dies(sample Hawaii)
Taghead/tether failsSeverance Mechanism Failure: too early
Tetherbreaks
Taghead rots out
Mono chaffedPin breaks on nosecone
nupital bitesAnimal is eaten
corrosional link failure - temp dependent?
repeated dives stress housingAnimal dives
faster than pop off mechanism
RD1500, 1800 failure
Out of ARGOS view Tag Failure
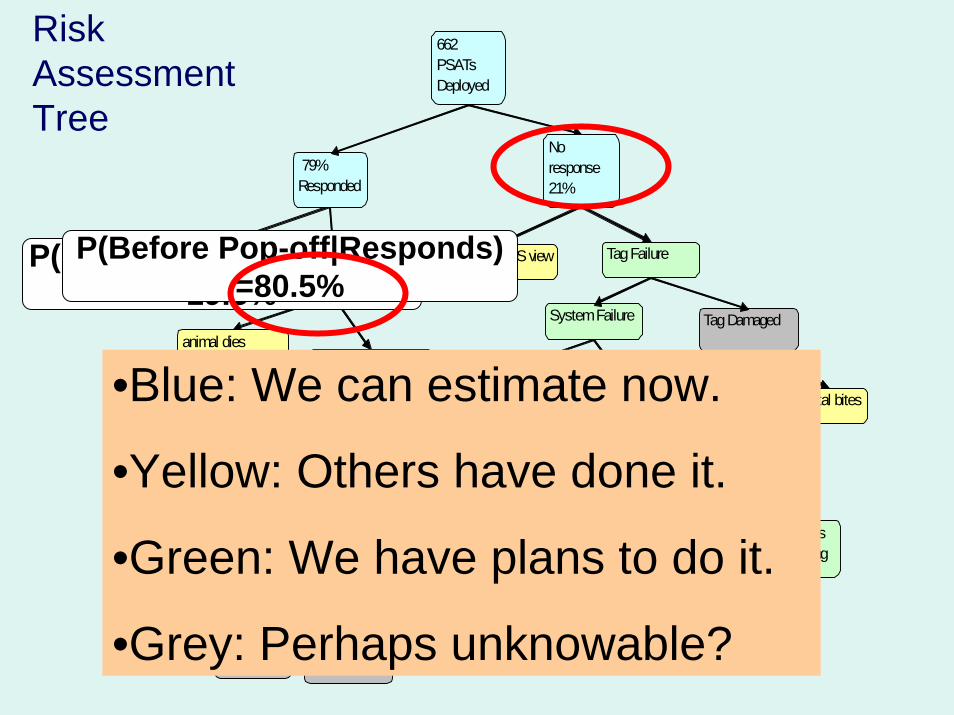
RiskAssessmentTree
P(Hits Pop-off|Responds)=19.5%
P(Before Pop-off|Responds)=80.5%
•Blue: We can estimate now.
•Yellow: Others have done it.
•Green: We have plans to do it.
•Grey: Perhaps unknowable?
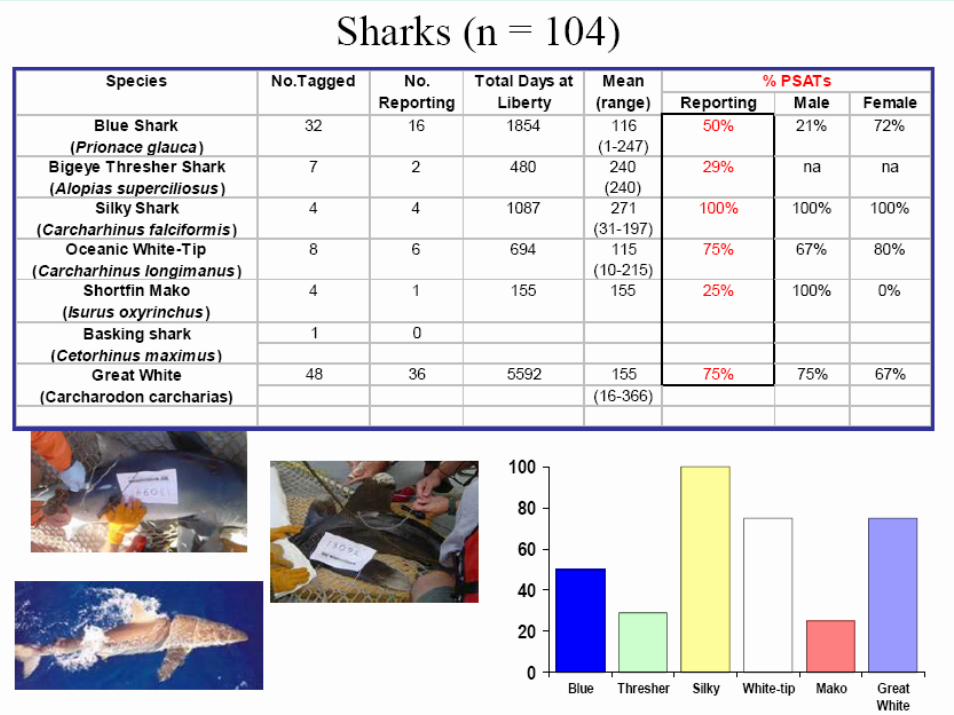
Of 662 PSATs attached to sharks, billfish, tunas and turtles, 520 or 79% reported data.
87 or 17% hit their programmed pop-off date
142 or 21% Non-reporting tags is not synonymous with mortality.
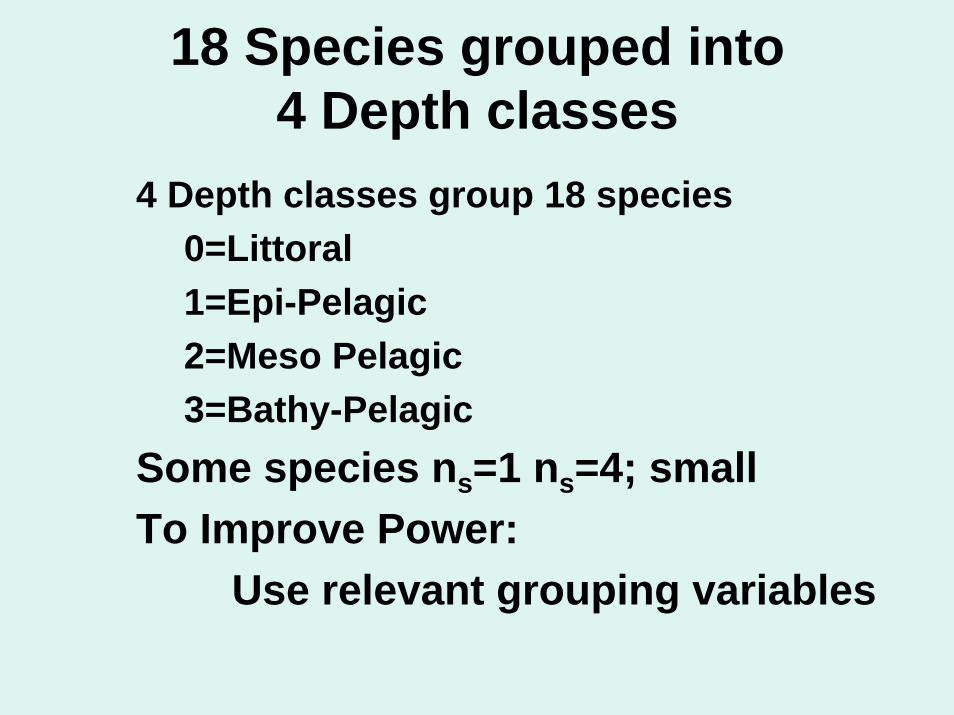
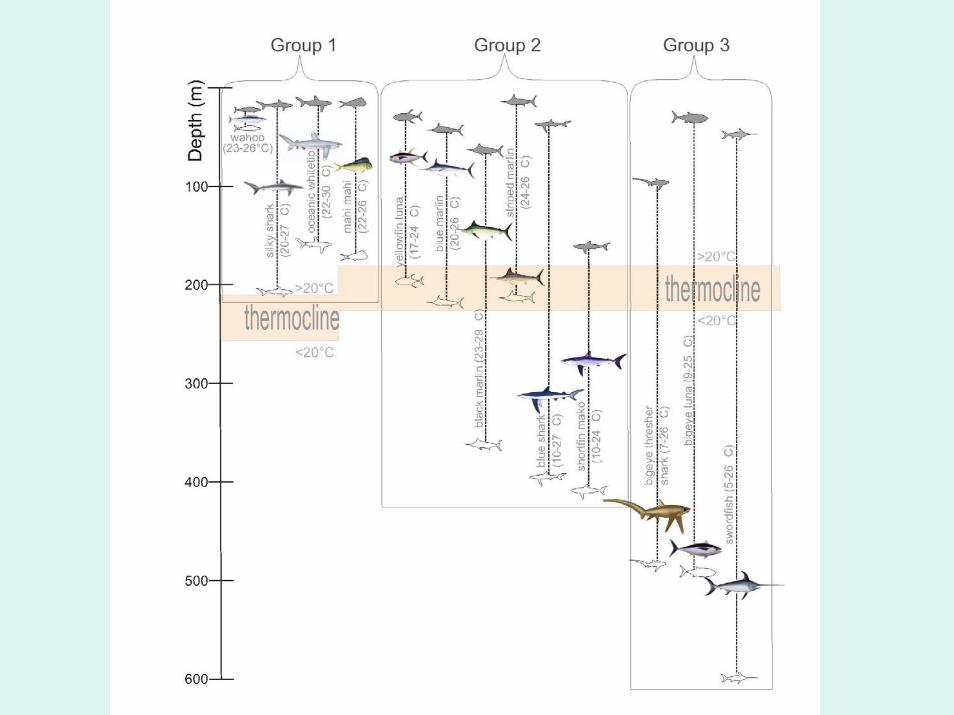
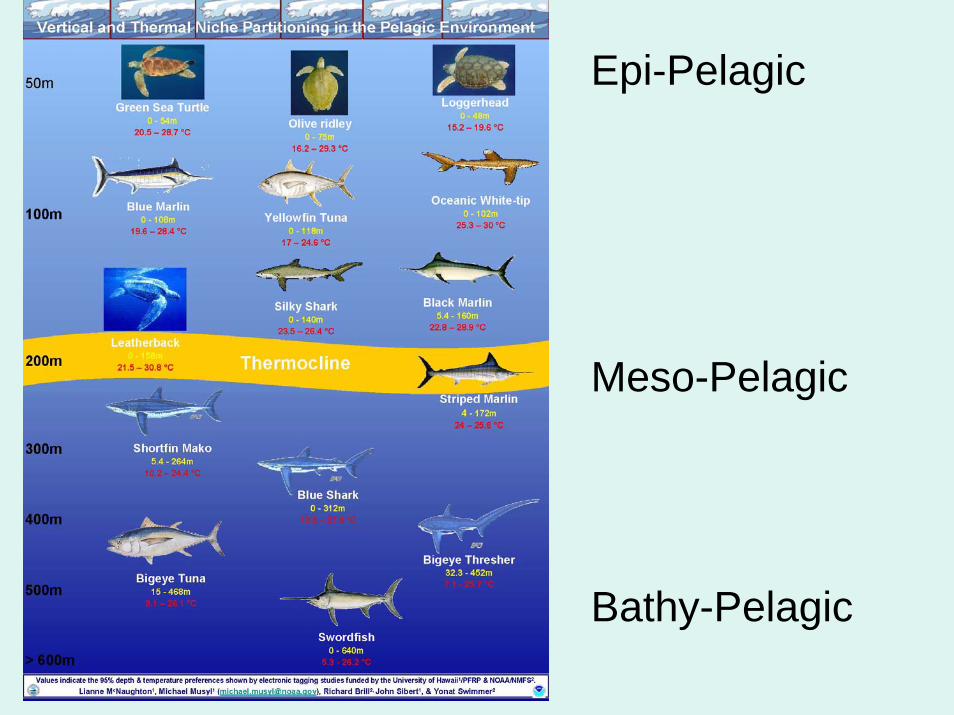
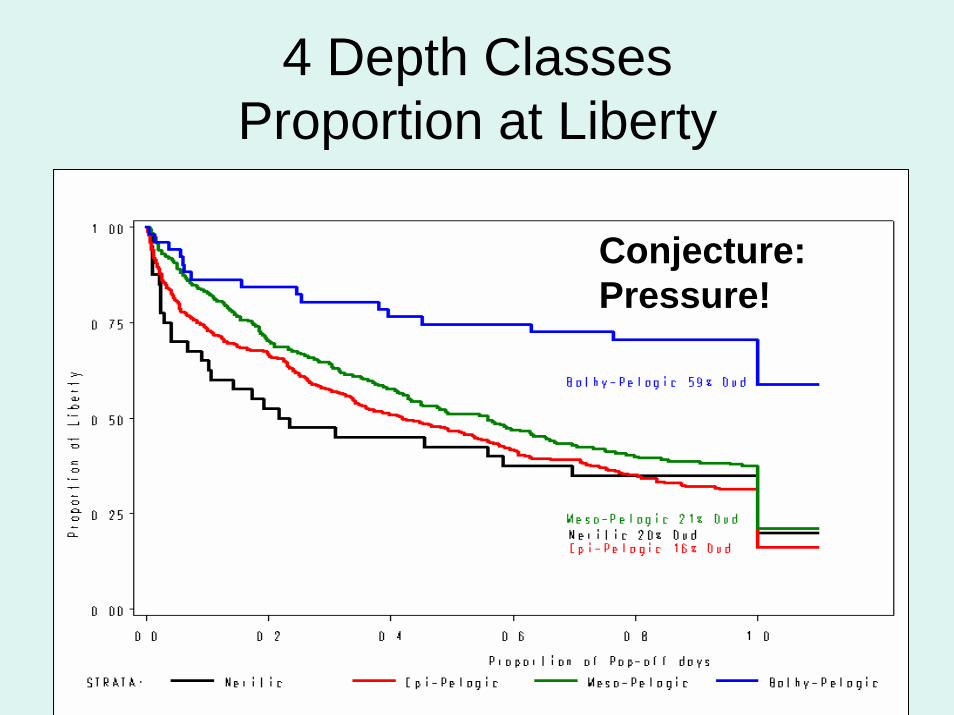
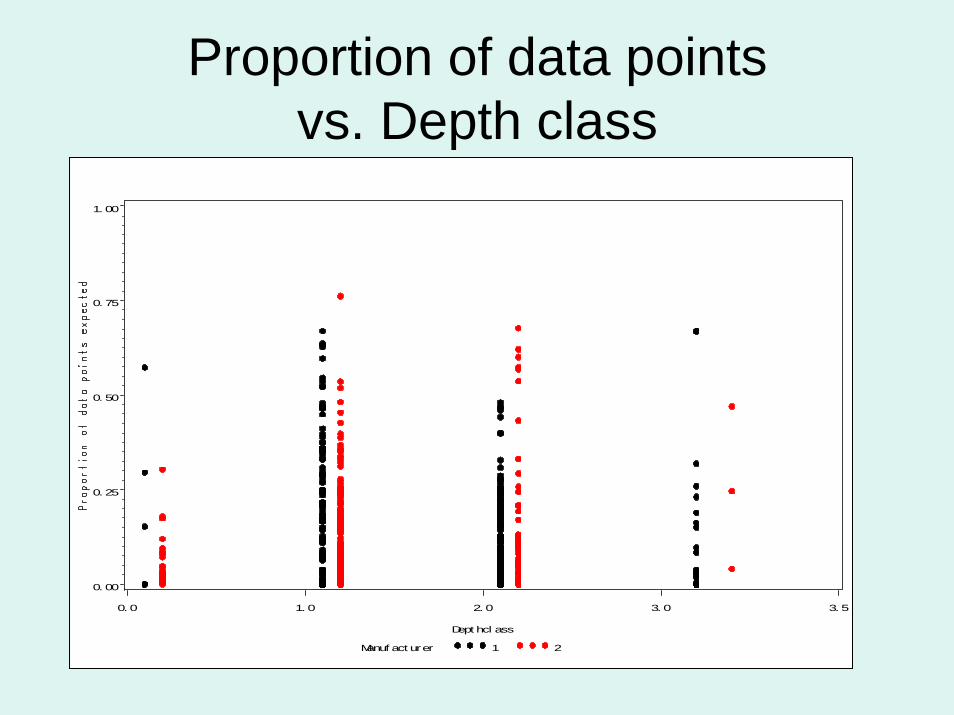
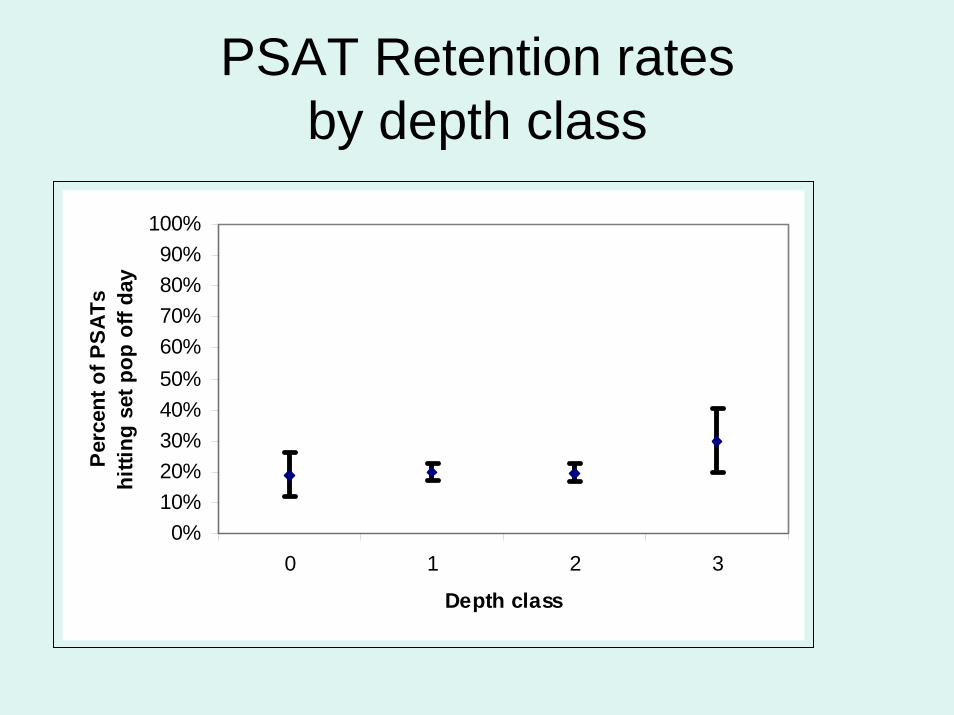
18 Species grouped into 4 Depth classes
4 Depth classes group 18 species0=Littoral1=Epi-Pelagic2=Meso Pelagic3=Bathy-Pelagic
Some species ns=1 ns=4; smallTo Improve Power:
Use relevant grouping variables
Epi-Pelagic
Meso-Pelagic
Bathy-Pelagic
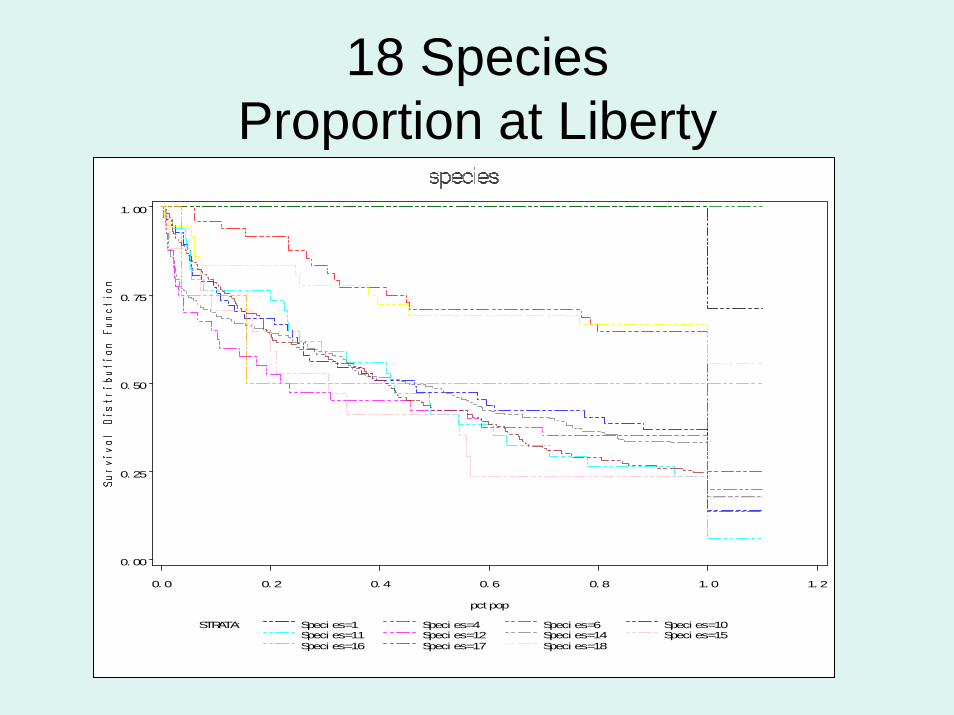
18 SpeciesProportion at Liberty
0. 00
0. 25
0. 50
0. 75
1. 00
pct pop
0. 0 0. 2 0. 4 0. 6 0. 8 1. 0 1. 2
STRATA: Speci es=1 Speci es=4 Speci es=6 Speci es=10Speci es=11 Speci es=12 Speci es=14 Speci es=15Speci es=16 Speci es=17 Speci es=18
4 Depth ClassesProportion at Liberty
Conjecture: Pressure!
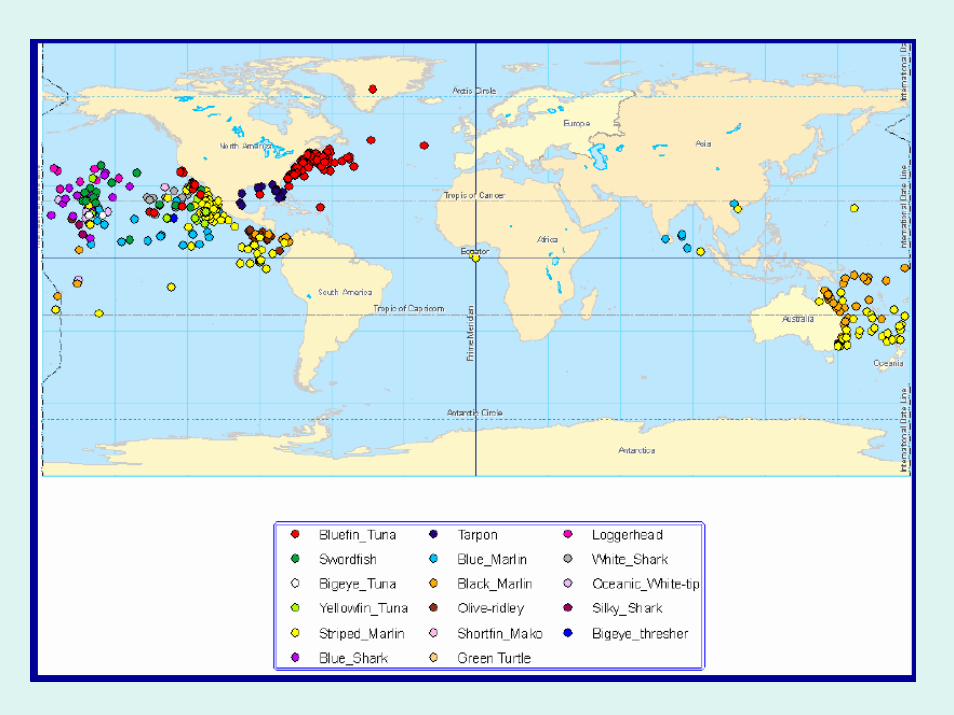
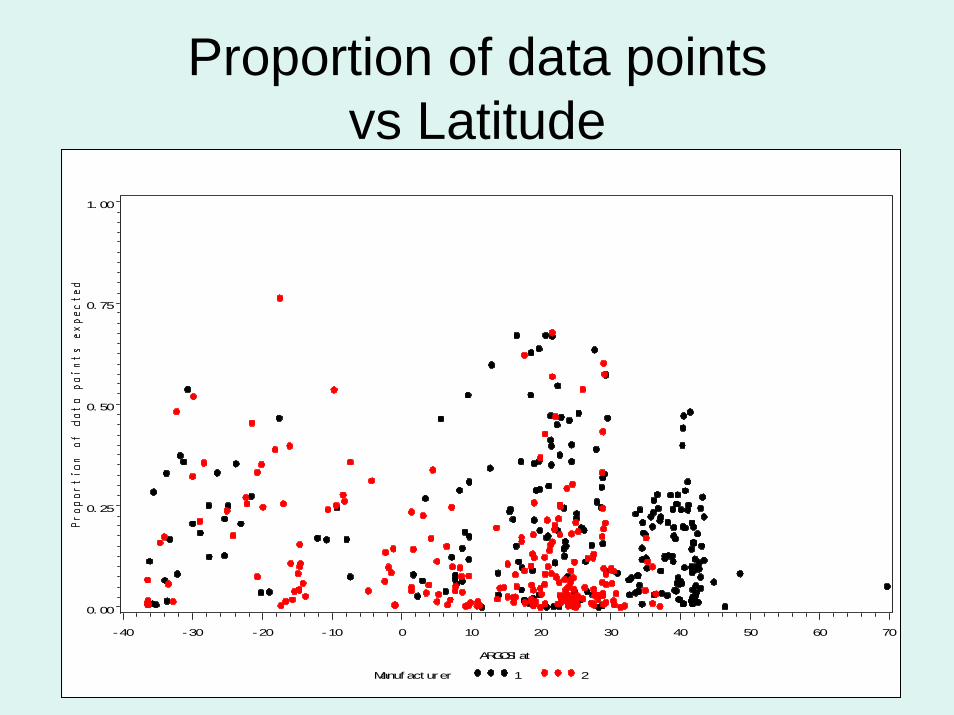
Geographic Location
• Retention model has Latitude at pop off• Tagger teams operate in different regions.• Thus tagger team is also a REGION
variable.
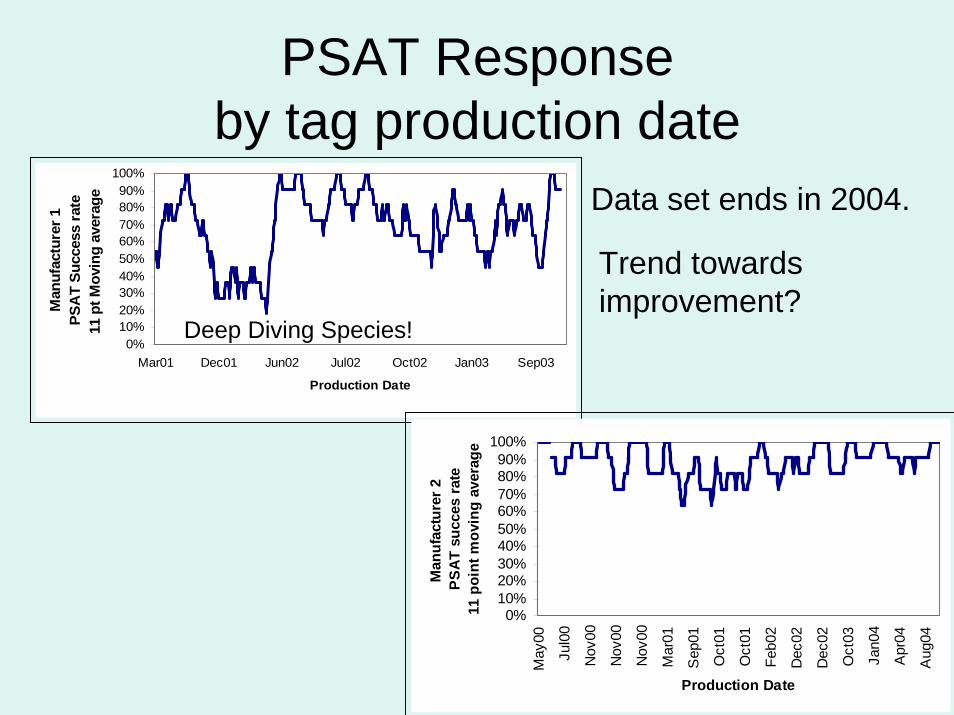
PSAT Response by tag production date
0%10%20%30%40%50%60%70%80%90%
100%
Mar01 Dec01 Jun02 Jul02 Oct02 Jan03 Sep03
Production Date
Man
ufac
ture
r 1PS
AT
Succ
ess
rate
11 p
t Mov
ing
aver
age
0%10%20%30%40%50%60%70%80%90%
100%
May
00
Jul0
0
Nov
00
Nov
00
Nov
00
Mar
01
Sep
01
Oct
01
Oct
01
Feb0
2
Dec
02
Dec
02
Oct
03
Jan0
4
Apr
04
Aug
04
Production Date
Man
ufac
ture
r 2PS
AT
succ
es ra
te 1
1 po
int m
ovin
g av
erag
e
Data set ends in 2004.
Trend towards improvement?
Deep Diving Species!
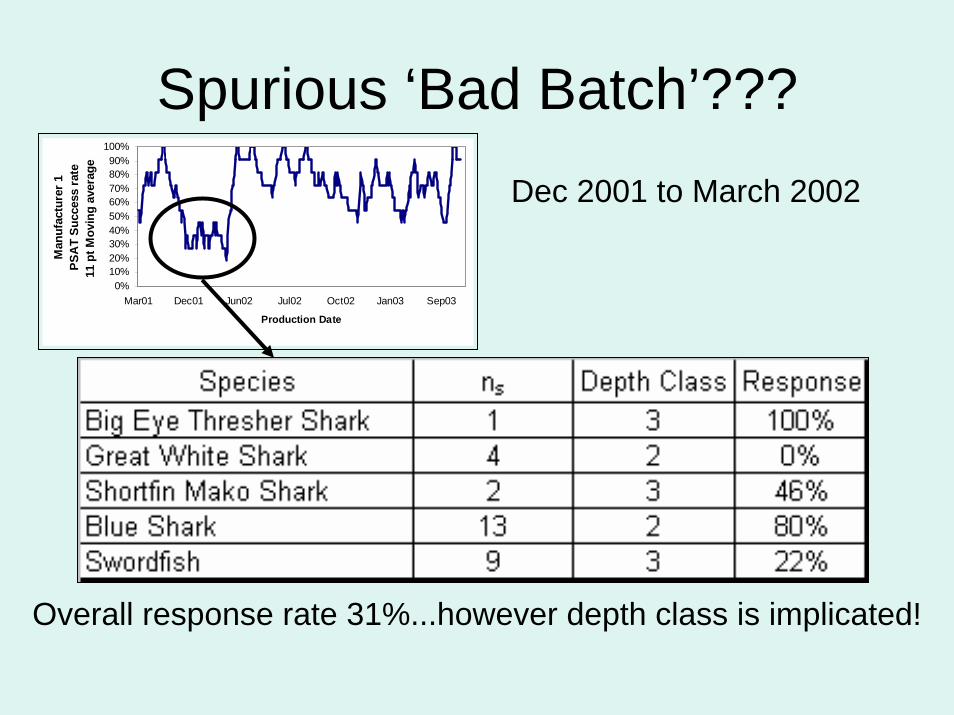
Spurious ‘Bad Batch’???
0%10%20%30%40%50%60%70%80%90%
100%
Mar01 Dec01 Jun02 Jul02 Oct02 Jan03 Sep03
Production Date
Man
ufac
ture
r 1PS
AT
Succ
ess
rate
11 p
t Mov
ing
aver
age
Overall response rate 31%...however depth class is implicated!
Dec 2001 to March 2002
PSAT Response Rate
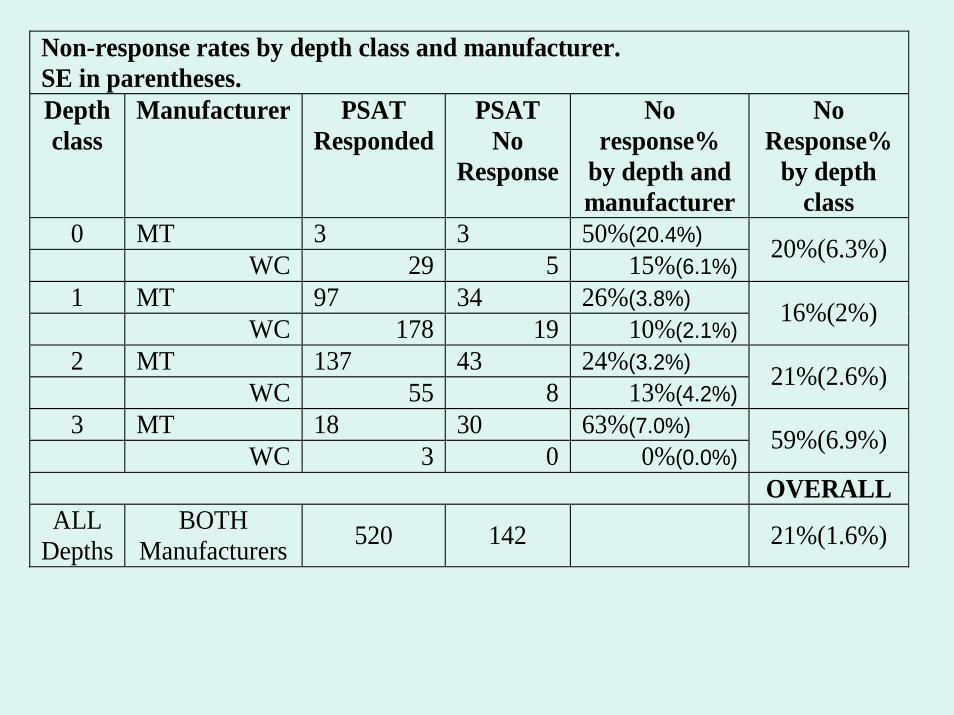
Non-response rates by depth class and manufacturer. SE in parentheses. Depth class
Manufacturer PSAT Responded
PSAT No
Response
No response%
by depth and manufacturer
No Response%
by depth class
0 MT 3 3 50%(20.4%) WC 29 5 15%(6.1%)
20%(6.3%)
1 MT 97 34 26%(3.8%) WC 178 19 10%(2.1%)
16%(2%)
2 MT 137 43 24%(3.2%) WC 55 8 13%(4.2%)
21%(2.6%)
3 MT 18 30 63%(7.0%) WC 3 0 0%(0.0%)
59%(6.9%)
OVERALL ALL
Depths BOTH
Manufacturers 520 142 21%(1.6%)
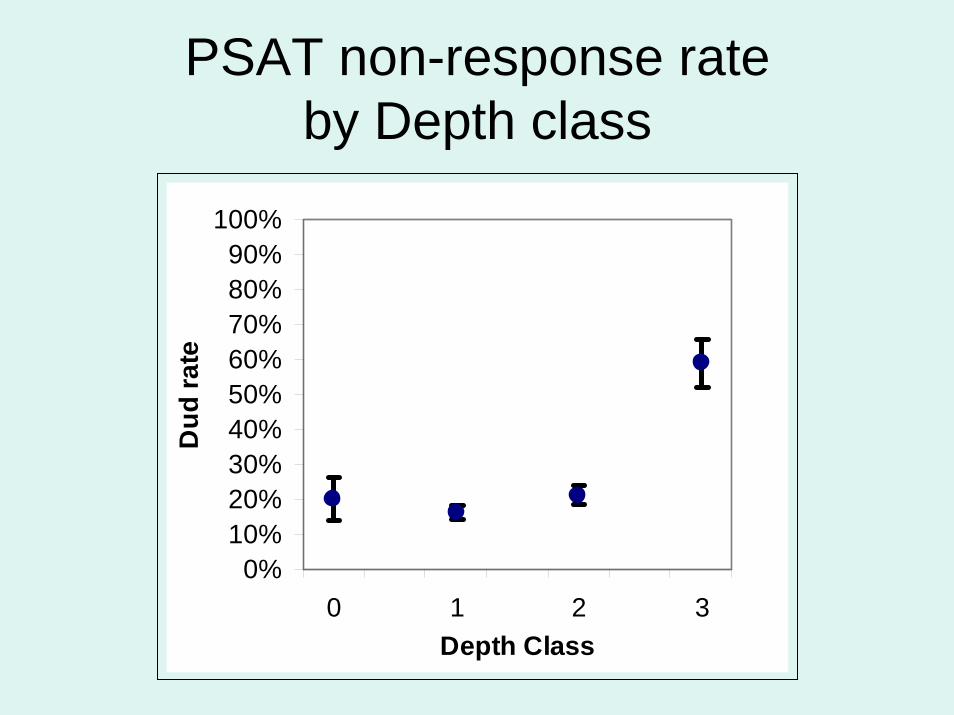
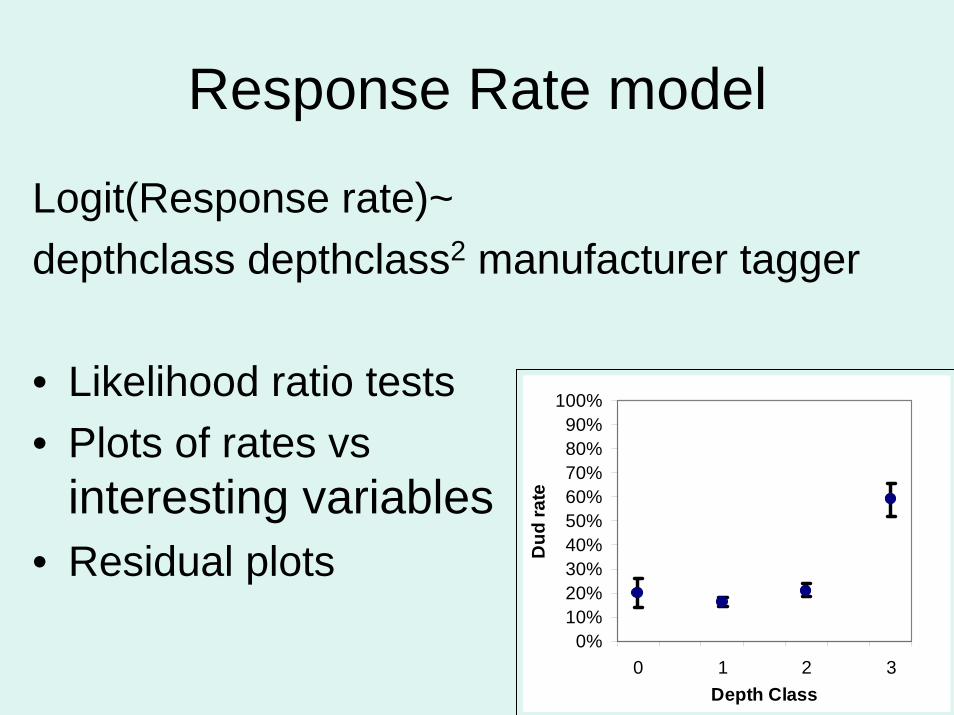
PSAT non-response rate by Depth class
0%10%20%30%40%50%60%70%80%90%
100%
0 1 2 3Depth Class
Dud
rate
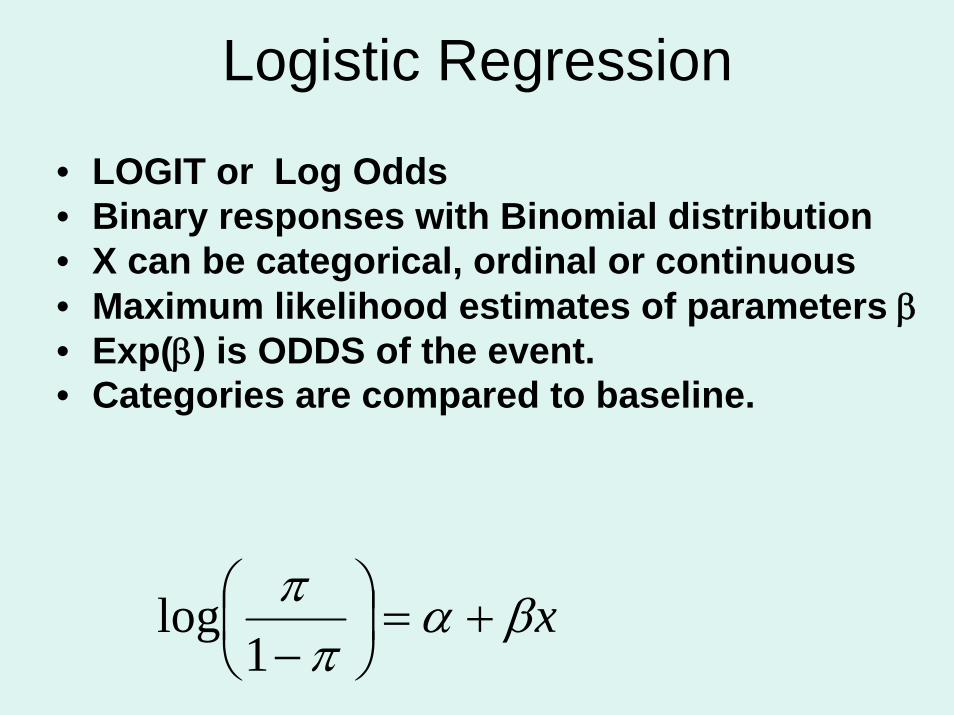
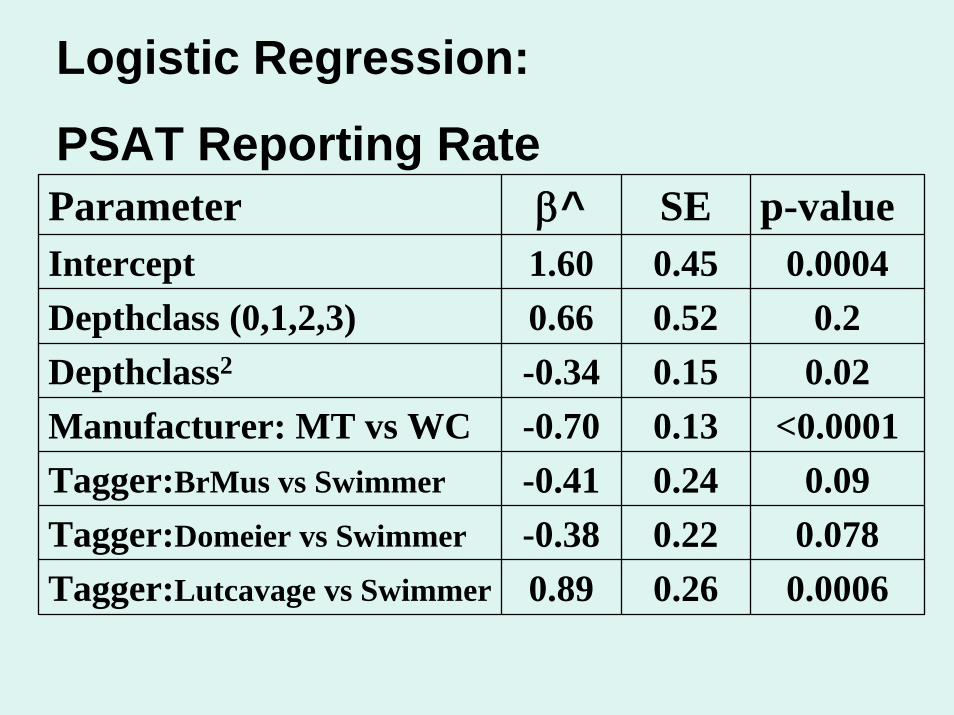
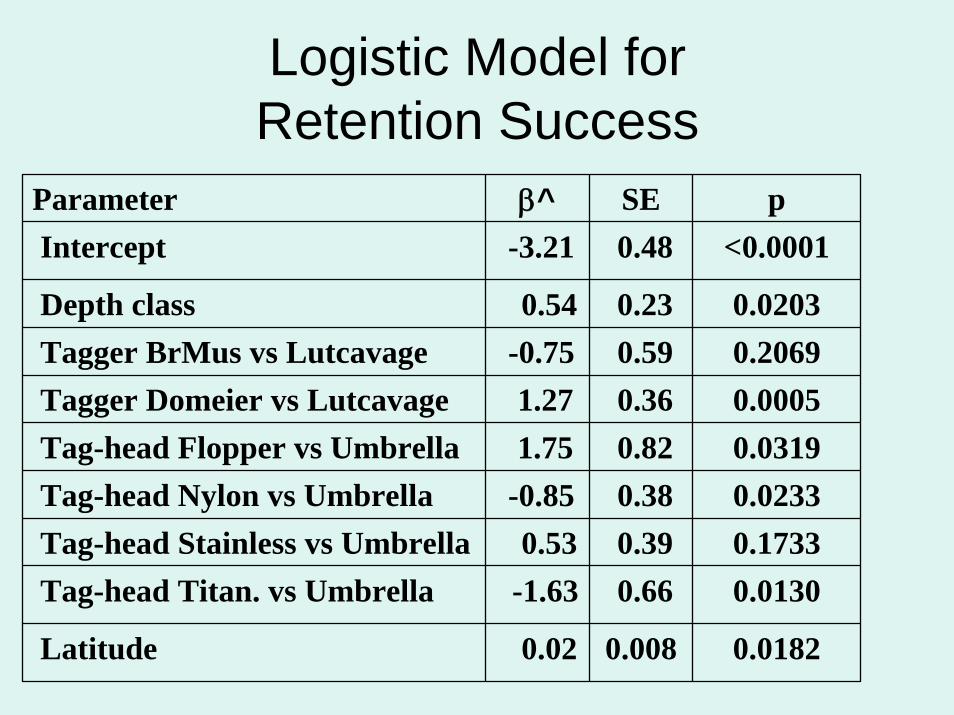
Logistic Regression
• LOGIT or Log Odds • Binary responses with Binomial distribution• X can be categorical, ordinal or continuous• Maximum likelihood estimates of parameters β• Exp(β) is ODDS of the event.• Categories are compared to baseline.
xβαπ
π+=⎟
⎠⎞
⎜⎝⎛−1
log
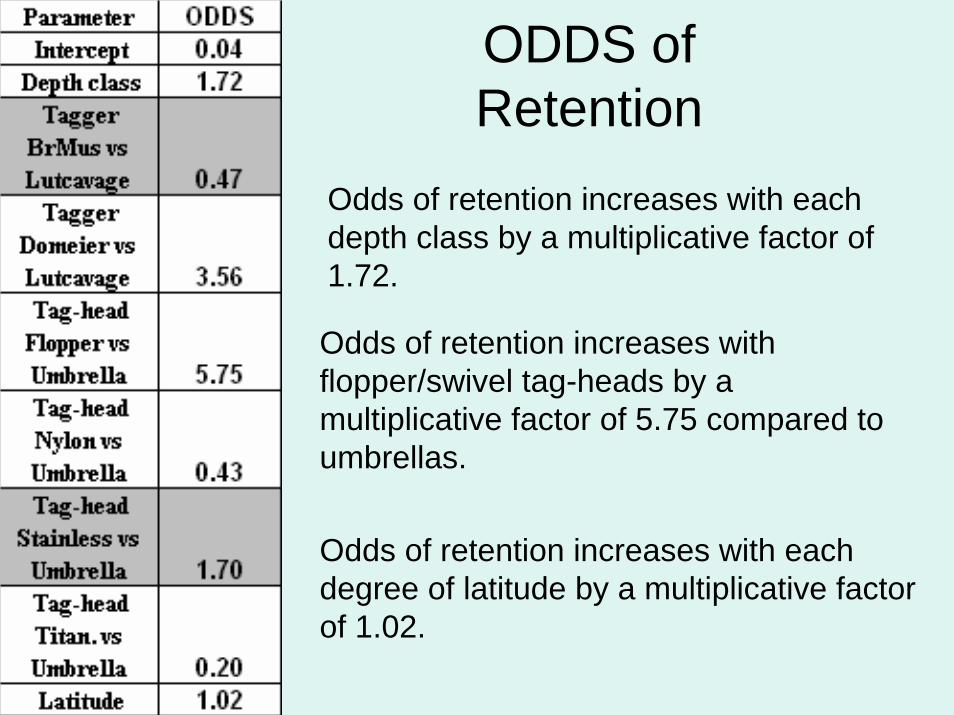
Comment on Interpretations
• Parameters β are ‘log odds’• Exp(β) of parameters are ODDS of the