65
Ex.-WEC-Hunger-2 PSC REF#:230447 Public Service Commission of Wisconsin RECEIVED: 01/26/15, 12:12:46 PM

Ex.-WEC-Hunger-2
PSC REF#:230447Public Service Commission of Wisconsin
RECEIVED: 01/26/15, 12:12:46 PM

UNITED STATES OF AMERICA BEFORE THE
FEDERAL ENERGY REGULATORY COMMISSION
Wisconsin Energy Corporation ) Docket No. EC14-___-000 )
Integrys Energy Group, Inc. )
JOINT APPLICATION FOR AUTHORIZATION OF DISPOSITION OF JURISDICTIONAL ASSETS
AND MERGER UNDER SECTIONS 203(a)(1) AND 203(a)(2) OF THE FEDERAL POWER ACT
Catherine P. McCarthy Seth Lucia Bracewell & Giuliani LLP 2000 K Street, N.W. Suite 500 Washington, DC 20006 (202) 828-5839 [email protected] [email protected] Jodi J. Caro Vice President, General Counsel and Secretary M. Gavin McCarty Mary Klyasheff Integrys Business Support, LLC 200 East Randolph Street Chicago, IL 60601 (312) 240-4470 [email protected] [email protected] [email protected] Counsel to Integrys Energy Group, Inc.
Mike Naeve Matthew W.S. Estes Skadden, Arps, Slate, Meagher & Flom LLP 1440 New York Avenue, N.W. Washington, DC 20005 (202) 371-7000 [email protected] [email protected] Susan H. Martin Exec VP, Gen Counsel & Corp Secretary Wisconsin Energy Corporation 231 W. Michigan Street Milwaukee, WI 53203 (414) 221-2712 [email protected] Counsel to Wisconsin Energy Corporation
August 15, 2014
Ex.-WEC-Hunger-2 Page 1 of 71

Exhibit No. J-1
UNITED STATES OF AMERICA
BEFORE THE FEDERAL ENERGY REGULATORY COMMISSION
Wisconsin Energy Corporation Integrys Energy Group, Inc.
) ) )
Docket No. EC14-___-000
APPLICATION UNDER SECTION 203 OF THE FEDERAL POWER ACT
PREPARED DIRECT TESTIMONY AND EXHIBITS OF WILLIAM H. HIERONYMUS AND DAVID HUNGER
ON BEHALF OF APPLICANTS
Ex.-WEC-Hunger-2 Page 2 of 71

Exhibit No. J-1
DIRECT TESTIMONY OF WILLIAM H. HIERONYMUS AND DAVID HUNGER
Table of Contents
PURPOSE, SUMMARY OF ANALYSIS AND CONCLUSIONS ............................................... 3
Introduction ............................................................................................................................. 3
Purpose ..................................................................................................................................... 4
Summary of Analysis and Conclusions ................................................................................ 5
FRAMEWORK FOR THE ANALYSIS ........................................................................................ 18
Horizontal Market Power Issues ........................................................................................ 19
Vertical Market Power Issues ............................................................................................. 26
DESCRIPTION OF METHODOLOGY ....................................................................................... 33
Ex.-WEC-Hunger-2 Page 3 of 71

Exhibit No. J-1
3
PURPOSE, SUMMARY OF ANALYSIS AND CONCLUSIONS
Introduction
Q. DR. HIERONYMUS, PLEASE STATE YOUR FULL NAME AND BUSINESS
ADDRESS.
A. My name is William H. Hieronymus. I am a Vice President of Charles River Associates
(“CRA”). My business address is 200 Clarendon Street, T-33, Boston, MA 02116.
Q. PLEASE SUMMARIZE YOUR RELEVANT PROFESSIONAL BACKGROUND.
A. For the past 35 years, the primary focus of my consulting has been on the electricity
industry. For the past 20 years, I have worked primarily on the restructuring of the
electricity industry from a fully regulated to a more competitively oriented model, both in
the U.S. and abroad. Much of my time has been spent on market power issues. I have
testified before the Federal Energy Regulatory Commission (“Commission”) and other
regulatory bodies on market power on numerous occasions. This includes a number of
mergers and acquisitions over the past 18 years, including more than 30 mergers among
electric utilities and “convergence” mergers of electric utilities and natural gas pipelines. A
summary of my background and relevant experience is attached as Exhibit J-2.
Q. DR. HUNGER, PLEASE STATE YOUR FULL NAME AND BUSINESS
ADDRESSA. My name is David Hunger. I am a Vice President of Charles River
Associates. My business address is 1201 F Street, NW, Suite 700, Washington, DC
20004-1229.
Q. PLEASE SUMMARIZE YOUR RELEVANT PROFESSIONAL BACKGROUND
A. I am experienced in energy market analysis, and was formerly a senior economist at the
Commission. For 14 years at the Commission, I led analyses involving mergers and other
corporate transactions; market power in market-based rates cases; investigations of
market manipulation in electricity and natural gas markets, demand response
compensation, compliance cases for Regional Transmission Organizations (“RTOs”); and
competition issues in electricity markets. Since leaving the Commission and joining
CRA in June 2013, I have testified in several Commission proceedings involving the
organized markets administered by independent system operators (“ISOs”) and RTOs.
Ex.-WEC-Hunger-2 Page 4 of 71

Exhibit No. J-1
4
Since 2001, I have also been an affiliated professor at the Georgetown Public Policy
Institute (GPPI), where I teach microeconomic theory, energy policy, and public finance.
A summary of my background and relevant experience is provided in Exhibit J-3.
Purpose
Q. WHAT IS THE PURPOSE OF YOUR TESTIMONY?
A. We have been asked by counsel for Wisconsin Energy Corporation and all of its
jurisdictional public utilities (collectively, “Wisconsin Energy” or “WEC”)1 and counsel
for Integrys Energy Group, Inc. and all of its jurisdictional public utilities (collectively,
“Integrys”),2 together, “Applicants”, to evaluate the potential competitive impact of the
merger of the Applicants on relevant electricity markets. We performed the Competitive
Analysis Screen described in Appendix A to the Commission’s Merger Policy Statement
(“Order No. 592”),3 as modified in the Revised Filing Requirements under Part 33 of the
1 As described in more detail in Section II.A of the Applicants’ FPA Section 203 Application (the “Application”),
Wisconsin Energy owns the franchised electric and natural gas utility operations of Wisconsin Electric Power Company (“Wisconsin Electric”), and Wisconsin Gas LLC., a local natural gas distribution company, and two steam/district heating systems. In addition, Wisconsin Energy owns a non-utility project company, W.E. Power, LLC (“We Power”). Wisconsin Electric also owns shares in American Transmission Company LLC (“ATC”), a regional transmission company owning transmission in Wisconsin, Illinois, Michigan and Minnesota.
2 As described in more detail in Section II.B of the Application, Integrys owns two franchised electric utilities, Wisconsin Public Service Corporation (“WPS”), located in Wisconsin and Michigan, and Upper Peninsula Power Company (“UPPCO”), located in Michigan. On January 24. 2014, Integrys Energy announced that it was selling UPPCO to Balfour Beatty Infrastructure Partners. Once that transaction is approved by the Commission, all the necessary regulatory approvals will be in place to allow the UPPCO transaction to close. See In the Matter of Upper Peninsula Power Company, et al., Docket No. EC14-68-000 (filed March 14, 2014). For purposes of our 2016 test year analysis, we assume that the transaction has been completed. Integrys also owns five natural gas distributors in the upper Midwest that serve a total of approximately 1.7 million customers. These are Wisconsin Public Service Corporation in Wisconsin, The Peoples Gas Light and Coke Company and North Shore Gas Company in northern Illinois, Minnesota Energy Resources Corporation in Minnesota and Michigan Gas Utilities Corporation in southeastern Michigan. Integrys also is a part owner of ATC. Integrys also owns Integrys Energy Services, Inc. (“Integrys Energy Services”) which primarily is a commercial and industrial retail gas and electric services provider and provider of electric and gas commodity services to aggregated customers in the upper Midwest. Integrys Energy Services also owns limited amounts of renewable energy production facilities, primarily distributed solar. Integrys Energy Services also owns Combined Locks Energy Center, LLC, a public utility with market-based rate authority. Integrys has announced plans to sell Integrys Energy Services to Exelon Corporation prior to the closing of this transaction. However, Combined Locks Energy Center, LLC and the distributed solar resources will not be divested and will remain with Integrys as part of the Transaction. Since there is no guarantee that the sale to Exelon will be consummated before the Applicants’ merger, to be conservative we have assumed that generation owned by Integrys Energy Services is a part of this transaction and will be acquired by WEC.
3 Inquiry Concerning the Comm’n’s Merger Policy Under the Fed. Power Act: Policy Statement, Order No. 592, FERC Stats. & Regs. ¶ 31,044 (1996), reconsideration denied, Order No. 592-A, 79 FERC ¶ 61,321 (1997).
Ex.-WEC-Hunger-2 Page 5 of 71

Exhibit No. J-1
5
Commission’s Regulations.4 The Competitive Analysis Screen is intended to comport
with the Department of Justice and Federal Trade Commission (“DOJ/FTC”) Horizontal
Merger Guidelines (“Guidelines”).
The primary focus of our testimony is to analyze whether the combination of the electric
generating assets owned or controlled by Wisconsin Energy and those owned or
controlled by Integrys potentially could create or enhance the Applicants’ ability to
increase prices in the relevant geographic electricity market. We also address the
potential impact of the merger on vertical market power, including barriers to entry that
might undercut the presumption that long-run generation markets are competitive and,
more specifically, the potential to use control over fuels supplies, fuel transportation
facilities, generation sites or electric transmission to exert vertical market power to
increase competitors’ costs.
Summary of Analysis and Conclusions
Q. DOES YOUR HORIZONTAL MARKET POWER ANALYSIS INDICATE THAT
THE MERGER RAISES COMPETITIVE CONCERNS?
A. No. The only area in which Applicants’ supply capabilities overlap is in the
Midcontinent Independent System Operator, Inc. (“MISO”). Both WEC and Integrys
have retail franchises and embedded wholesale load in MISO and own or control
generation used principally to serve those customers. The Commission has determined
that “day 2” RTOs such as MISO are the default geographic market for merger (and
market-based rate) analyses. With the exception of small amounts of renewable energy
controlled by Integrys Energy Services, Inc., neither Applicant controls generation
outside of MISO. Consequently, we focused our analysis on the MISO market.5
4 Revised Filing Requirements Under Part 33 of the Comm’n’s Regulations, Order No. 642, FERC Stats. & Regs.
¶ 31,111 (2000), order on reh’g, Order No. 642-A, 94 FERC ¶ 61,289 (2001) (“Revised Filing Requirements” or “Order No. 642”).
5 In 2013, MISO changed its name and its footprint as a result of the integration of Entergy and CLECO into it. Our analysis is based on the current MISO membership in 2014, and we also examine the pre-integration MISO market.
Ex.-WEC-Hunger-2 Page 6 of 71

Exhibit No. J-1
6
Q. DID YOU ANALYZE ANY SUB-MARKETS WITHIN MISO?
A. No. There are known exceptions to the presumption that an RTO is the smallest relevant
market when a sub-area within an RTO has been defined as a load pocket that needs to be
analyzed separately. Examples are Long Island and New York City in NYISO, and
regions within ISO-NE and PJM (e.g., Connecticut, Southwest Connecticut,, Eastern
PJM).6 The Commission has not identified any such geographic markets within MISO,
despite that it has been asked to do so on more than one occasion. Most recently, in
2013, the Commission rejected an intervenor’s position that a separate sub-market in
MISO should have been analyzed in considering Dynegy’s acquisition of Ameren’s
merchant plants.7
In the case of the instant merger, most of Applicants’ loads and supplies are located in the
MISO area historically referred to as Wisconsin and Upper Michigan System
(“WUMS”). In 2005, the Commission declined to require WUMS to be treated as a
relevant geographic market,8 and again declined to do so in 2007 in Order No. 697 when
the Commission defined the “default” submarkets within RTOs that are required to be
analyzed separately in market power analyses.9 The Commission’s precedent is to define
sub-markets for which analysis is required only when the area is a load pocket that is
price-separated from the larger market on a frequent basis. Here, WUMS is not a load
pocket with price separation. MISO forecasts a 700 MW surplus in the WUMS region
for 2016.10 In addition, an examination of prices within MISO (described below) shows
that WUMS prices are highly correlated with MISO prices. Further, prices in WUMS
tend to be slightly lower than prices in MISO generally on average and in most DPT time 6 Order 697 explains that the default market definition for suppliers in an RTO is the RTO except where the
Commission has determined previously that a sub-area within the RTO is a geographic area that is presumptively a separate market. The order specifically names all such market areas. None are in MISO and to the best of our knowledge, there has been no subsequent determination that areas of MISO require analysis. See Market-Based Rates for Wholesale Sales of Electric Energy, Capacity and Ancillary Services By Public Utilities, Order No. 697, FERC Stats. & Regs. ¶ 31,252 (2007), especially paragraphs 231 and 246.
7 Ameren Energy Generating Co., 145 FERC ¶ 61,034 at P 55 (2013).
8 Wisc. Elec. Power Co., 110 FERC ¶ 61,340 at PP 19-20, reh’g denied, 111 FERC ¶ 61,361 at PP 13-15 (2005).
9 Order No. 697 at P 236.
10 MISO 2016 Resource Adequacy Forecast at p. 10. (June 5, 2014).
Ex.-WEC-Hunger-2 Page 7 of 71

Exhibit No. J-1
7
periods. Therefore, we see no reason to depart from the Commission’s prior rulings that
it is appropriate to analyze the MISO market as a whole without any submarkets.
We do acknowledge, however, that since the Commission’s holdings that no submarkets
in MISO need be analyzed, Entergy and CLECO have joined MISO and the facilities in
their former Balancing Authority Areas (“BAAs”) make up what has been designated as
“MISO South.” Consequently, as a sensitivity case, we analyzed the effect of the merger
on MISO excluding MISO South, which we call “MISO Classic.”
Q. PLEASE DESCRIBE THE ANALYSES YOU HAVE PERFORMED AND THE
CONCLUSIONS YOU REACH BASED ON THOSE ANALYSES.
A. As explained above, because Applicants’ generation capacity overlaps in MISO, we
conducted a full delivered price test (“DPT”) for the MISO BAA. Consistent with the
Commission’s requirement that merger analyses be forward-looking, our analysis is
based on expected market conditions in 2016. These conditions are similar to market
conditions at present and/or in the recent past, but do take into account relevant projected
near-term generation changes, transmission upgrades and changes in loads and fuels
prices.
As described later in our testimony, the prices that we used in our analysis were derived
from MISO day-ahead LMP prices for 2012-2013, adjusted to reflect forecast fuel prices
for the 2016 modeled year.11
Q. WHAT MEASURES DID YOU USE TO ANALYZE THE PROPOSED MERGER?
A. In MISO, there is little retail access. Both Wisconsin Electric and WPS, Integrys’
principal electric company in MISO, continue to serve their loads in Wisconsin as
traditionally regulated utilities that have divested their transmission assets.12 Hence,
11 Henry Hub futures along with historical basis differentials were used to update peak period price levels from
historic to forecast 2016 levels. Ventyx coal price forecasts were used to update off-peak prices. 12 Michigan has adopted a limited retail choice option that is applicable to UPPCO's and WEC’s customers
located in Michigan's Upper Peninsula, but this option is available to only a limited number of retail customers—all other customers continue to be served as bundled retail customers. Further, the Applicants’ load in Michigan constitutes only a small portion of the load of the combined companies.
Ex.-WEC-Hunger-2 Page 8 of 71

Exhibit No. J-1
8
under Commission precedent, the Available Economic Capacity (“AEC”) analysis is
given primary weight in analyzing the Applicants’ horizontal market power.13 We note
that, in the Dynegy-Ameren Order that we mentioned above, the Commission stated that
it is appropriate to analyze both AEC and Economic Capacity (“EC”) in MISO because
some utilities have switched to retail access while others have not.14 We therefore have
performed an EC analysis and include the results in our testimony.
Q. WHAT ARE THE RESULTS OF YOUR ANALYSES?
A. As shown in Table 1, AEC is unconcentrated in all periods. In the off-peak periods,
Applicants share is zero and there is no change in the Herfindahl-Hirschman Index
(“HHI”). In all time periods, the change in HHI is well less than 10 points.
13 See, e.g., Silver Merger Sub, Inc., 145 FERC ¶ 61,261 at P 34 (2013); Duke Energy Corp., 136 FERC ¶ 61,245
at P 124 (2011); Great Plains Energy, Inc., 121 FERC ¶ 61,069 at P 34 & n.44 (2007) (“Great Plains”), reh’g denied, 122 FERC ¶ 61,177 (2008).
14 Ameren Energy Generating Co., 145 FERC ¶ 61,034 at P 56 n.55.
Ex.-WEC-Hunger-2 Page 9 of 71

Exhibit No. J-1
9
Table 1: Available Economic Capacity in MISO
Pre-Merger Post-Merger
WEC Integrys
WEC Energy Group
Period Energy Price
MW Market Share
MW Market Share
Market Size HHI
MW Market Share
Market Size
HHI HHI Chg
S_SP1 $134 636 2.0% 0 0% 31,536 800 636 2.0% 31,536 800 0
S_SP2 $84 1,116 3.4% 79 0.2% 32,527 767 1,196 3.7% 32,527 769 2
S_P $40 1,612 5.7% 0 0% 28,286 903 1,612 5.7% 28,286 903 0
S_OP $28 0 0% 0 0% 16,438 805 0 0% 16,438 805 0
W_SP $40 293 1.0% 0 0% 28,513 823 293 1.0% 28,513 823 0
W_P $36 0 0% 0 0% 28,629 819 0 0% 28,629 819 0
W_OP $28 0 0% 0 0% 18,939 825 0 0% 18,939 825 0
SH_SP $47 1,386 4.3% 22 0.1% 32,245 709 1,408 4.4% 32,245 709 1
SH_P $38 1,399 4.6% 0 0% 30,289 762 1,399 4.6% 30,289 762 0
SH_OP $28 0 0% 0 0% 18,220 795 0 0% 18,220 795 0
Source: CRA Analysis
Our EC analysis shows that the merger is still less problematic than under an AEC
analysis. As shown in Table 2, the MISO EC market is unconcentrated in all time
periods and Applicants’ combined share is well below 10 percent. Commission policy
requires sensitivity analyses showing the horizontal analyses with prices 10 percent
above and below base case prices. The sensitivity analyses for both EC and AEC
products are contained in our workpapers and similarly show no screen failures.15 The
highest HHI changes, which occurs in the Summer Peak Period is 13 points in a period
with a post-merger HHIs of less than 400.
15 See Workpapers section J - 6.8.
Ex.-WEC-Hunger-2 Page 10 of 71

Exhibit No. J-1
10
Table 2: Economic Capacity in MISO
Pre-Merger Post-Merger
WEC Integrys
WEC Energy Group
Period Price MW Market Share
MW Market Share
Market Size
HHI MW Market Share
Market Size
HHI HHI Chg
S_SP1 $134 6,444 4.0% 2,302 1.4% 161,060 424 8,746 5.4% 161,060 436 11
S_SP2 $84 6,444 4.0% 2,302 1.4% 160,985 424 8,746 5.4% 160,985 435 11
S_P $40 5,431 4.5% 1,801 1.5% 121,197 324 7,232 6.0% 121,197 337 13
S_OP $28 1,058 2% 380 0.7% 54,809 441 1,438 2.6% 54,809 444 3
W_SP $40 3,873 3.6% 1,190 1.1% 108,069 332 5,063 4.7% 108,069 339 8
W_P $36 2,983 3% 971 1.0% 97,885 341 3,954 4.0% 97,885 347 6
W_OP $28 1,100 2% 360 0.6% 55,633 420 1,461 2.6% 55,633 422 3
SH_SP $47 5,192 3.9% 1,781 1.3% 134,305 431 6,974 5.2% 134,305 441 10
SH_P $38 4,641 4.1% 1,572 1.4% 112,126 322 6,213 5.5% 112,126 333 12
SH_OP $28 1,126 2% 359 0.7% 52,291 441 1,485 2.8% 52,291 444 3
Source: CRA Analysis
As noted, we also performed the Delivered Price Test (“DPT”) for the MISO Classic
market (the MISO market without the former BAAs of Entergy and CLECO) for both
AEC and EC. While the market size of MISO Classic is predictably smaller, the results
are quite similar, with nothing even approaching a screen failure for AEC or EC in any
season/load condition. While MISO Classic is moderately concentrated for AEC in all
but three of the season/load periods, the largest HHI increase is only 4 points. The MISO
Classic EC market is unconcentrated in all periods, and the largest HHI increase is only
25 points.
Ex.-WEC-Hunger-2 Page 11 of 71
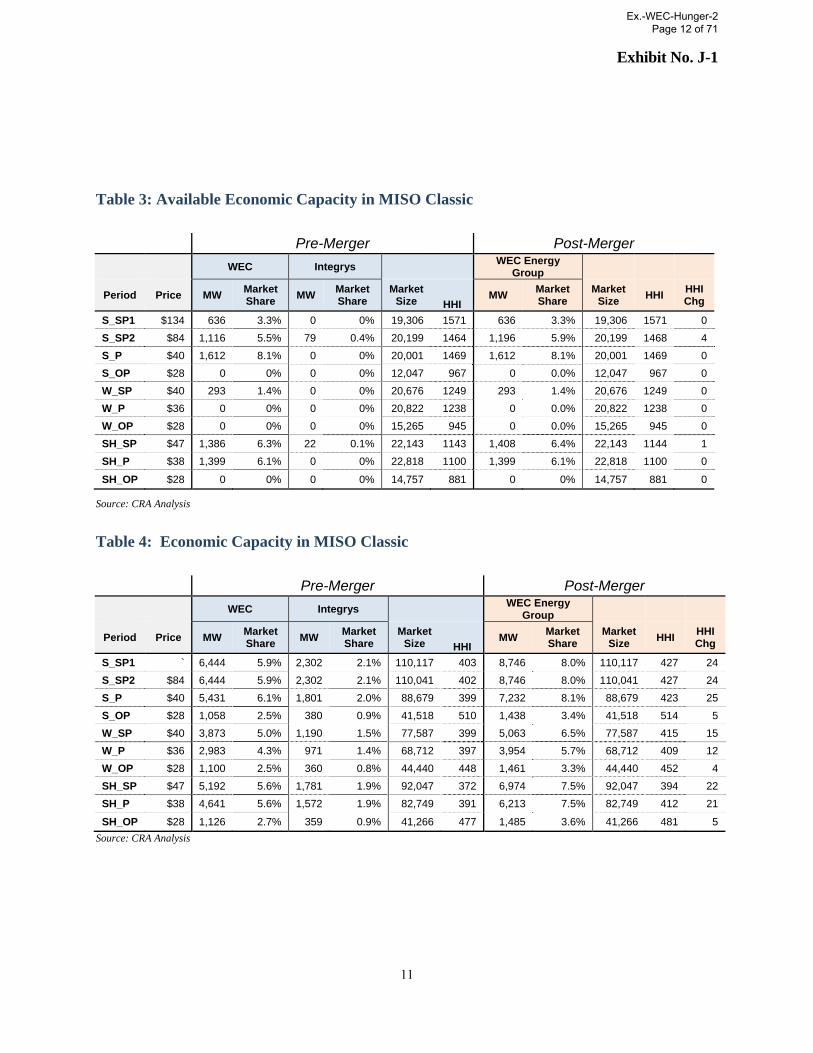
Exhibit No. J-1
11
Table 3: Available Economic Capacity in MISO Classic
Pre-Merger Post-Merger
WEC Integrys
WEC Energy Group
Period Price MW Market Share
MW Market Share
Market Size HHI
MW Market Share
Market Size
HHI HHI Chg
S_SP1 $134 636 3.3% 0 0% 19,306 1571 636 3.3% 19,306 1571 0
S_SP2 $84 1,116 5.5% 79 0.4% 20,199 1464 1,196 5.9% 20,199 1468 4
S_P $40 1,612 8.1% 0 0% 20,001 1469 1,612 8.1% 20,001 1469 0
S_OP $28 0 0% 0 0% 12,047 967 0 0.0% 12,047 967 0
W_SP $40 293 1.4% 0 0% 20,676 1249 293 1.4% 20,676 1249 0
W_P $36 0 0% 0 0% 20,822 1238 0 0.0% 20,822 1238 0
W_OP $28 0 0% 0 0% 15,265 945 0 0.0% 15,265 945 0
SH_SP $47 1,386 6.3% 22 0.1% 22,143 1143 1,408 6.4% 22,143 1144 1
SH_P $38 1,399 6.1% 0 0% 22,818 1100 1,399 6.1% 22,818 1100 0
SH_OP $28 0 0% 0 0% 14,757 881 0 0% 14,757 881 0
Source: CRA Analysis
Table 4: Economic Capacity in MISO Classic
Pre-Merger Post-Merger
WEC Integrys
WEC Energy Group
Period Price MW Market Share
MW Market Share
Market Size HHI
MW Market Share
Market Size
HHI HHI Chg
S_SP1 ` 6,444 5.9% 2,302 2.1% 110,117 403 8,746 8.0% 110,117 427 24
S_SP2 $84 6,444 5.9% 2,302 2.1% 110,041 402 8,746 8.0% 110,041 427 24
S_P $40 5,431 6.1% 1,801 2.0% 88,679 399 7,232 8.1% 88,679 423 25
S_OP $28 1,058 2.5% 380 0.9% 41,518 510 1,438 3.4% 41,518 514 5
W_SP $40 3,873 5.0% 1,190 1.5% 77,587 399 5,063 6.5% 77,587 415 15
W_P $36 2,983 4.3% 971 1.4% 68,712 397 3,954 5.7% 68,712 409 12
W_OP $28 1,100 2.5% 360 0.8% 44,440 448 1,461 3.3% 44,440 452 4
SH_SP $47 5,192 5.6% 1,781 1.9% 92,047 372 6,974 7.5% 92,047 394 22
SH_P $38 4,641 5.6% 1,572 1.9% 82,749 391 6,213 7.5% 82,749 412 21
SH_OP $28 1,126 2.7% 359 0.9% 41,266 477 1,485 3.6% 41,266 481 5
Source: CRA Analysis
Ex.-WEC-Hunger-2 Page 12 of 71

Exhibit No. J-1
12
Q. PLEASE DESCRIBE YOUR REVIEW OF THE EFFECT ON COMPETITION IN
MISO ANCILLARY SERVICES MARKETS
A. MISO jointly optimizes ancillary services markets for regulation and contingency
reserves (spinning and supplemental) with the real-time energy market. As such, these
markets are very much affected by competitive conditions in the energy markets. In fact,
in MISO, “clearing prices for regulating reserves are considerably higher than the highest
cleared offers because the prices reflect opportunity costs incurred when resources must
be dispatched up or down from their economic level to provide bi-directional regulation
capability.”16 So it is often the energy price that sets the price for regulation, the highest
quality operating reserve. Regulation in turn can be substituted for spinning and non-
spinning reserves because it is a higher quality product.
Unlike energy markets, the Commission has not specified a particular framework for
analyzing the effect on competition in ancillary services markets. This partly is because
data equivalent to that used in analyzing energy markets usually is not available. A
useful starting point for regulation and contingency reserves is to look at the effect of a
transaction on competition in energy markets, which the Commission has accepted in a
number of Section 203 proceedings as indicative of competitive effects on ancillary
services markets.17 As discussed above, our analysis indicates that the transaction will
not adversely affect competition in the energy market, which is unconcentrated.
Also relevant is the fact that the MISO ancillary services are over-supplied, so
Applicants’ supplies cannot be critical, much less pivotal. For example, regulation offers
in MISO have been as high as 2,700 MW in 2013, with a monthly average of more than
2,000 MW, relative to the 2013 requirement of about 450 MW (of which the Applicants
16 2013 State of the Market Report for the MISO Electricity Markets Appendix: Real-Time Market Performance at
page A-64. 17 See, e.g., FirstEnergy Corp. and Allegheny Energy, Inc., 133 FERC ¶ 61,222 (2010), accepting applicants’
argument that generally unconcentrated nature of the PJM energy market indicated a lack of competitive concern in ancillary series markets. The Commission has also found that energy-related ancillary services such as imbalance energy and operating reserves can be sold pursuant to the general market-based rates tariff. Third-Party Provision of Ancillary Services; Accounting and Financial Reporting for New Electric Storage Technologies, Order No. 784, FERC Stats. & Regs. ¶ 31,349 (2013).
Ex.-WEC-Hunger-2 Page 13 of 71
Exhibit No. J-1
13
combined provided approximately 60 MWs on average).18 In addition, for contingency
reserves, the spinning reserve capability in MISO was as high as 5,800 MW in 2013, with
a monthly average of about 4,300 MW, relative to a spinning reserve requirement of
about 1,000 MW (of which the Applicants combined provided approximately 90 MWs on
average).19 Overall, the Applicants combined have traditionally provided only
approximately ten percent of reserves cleared in the MISO markets.20 Based on these
benign competitive characteristics of the MISO ancillary services markets and the
Applicants’ limited market shares in these markets, we conclude that the transaction will
not adversely affect competition in the MISO ancillary services markets.
Q. PLEASE DESCRIBE YOUR REVIEW OF THE EFFECT ON COMPETITION IN
MISO CAPACITY MARKETS
A. As part of its resource adequacy plan, MISO requires load serving entities (“LSEs”) to
obtain planning resources on an annual basis. LSEs may choose to self-schedule, enter
into bilateral contracts, or participate in the voluntary annual auction. The most recent
MISO voluntary Planning Resource Auction (April 14, 2014) cleared 136,912 MW of
resources.21 All of the Applicants capacity resources are located in Local Resource Zone
2 which cleared as part of the broader swath of most of MISO North and Central (Local
Resource Zones (2-7). We analyzed the market for planning resources in those zones,
which accounted for 83,748 of the 136,912 MWs cleared, and found a maximum change
in concentration of 24 HHI, well below the screening thresholds for even a highly
concentrated market – which the MISO market is not, as we explain below.22
18 2013 State of the Market Report for the MISO Electricity Markets Appendix: Real-Time Market Performance at
page A-65 Figure A38: Regulation Offers and Scheduling 2013. 19 2013 State of the Market Report Appendix: Real-Time Market Performance Page A-66 Figure A39:
Contingency Reserves Offers and Scheduling 2013 20 Based on data from 2011-2013, See Workpapers section J - 6.9.
21 2014/2015 Planning Resource Auction (PRA) published by MISO on April 14, 2014.
22 Based on change in HHI (2AB) from highest price DPT results and 2014/2015MISO Planning Resource Auction Results. See Workpapers section J - 6.10.
Ex.-WEC-Hunger-2 Page 14 of 71

Exhibit No. J-1
14
A further indication of the lack of competitive effect on the capacity market is the level
and change in the level of concentration in the Summer Super Peak 1 time period.
Because this period corresponds to the one percent highest summer peak load hours,
nearly all capacity is economic in this period. The Economic Capacity HHI for MISO
Classic in this period is 428 and the change in HHI is 25 points. In addition, we ran a
DPT with an assumed price high enough to make virtually all capacity in MISO
economic. As shown in Table 5, the post-merger HHI was 427 with a change in HHI of
24 points.23 Table 6 shows the Economic Capacity for all of MISO with similar results –
a post-merger HHI of 431 with a merger-related increase of 11 points. We therefore
conclude that the proposed transaction will not adversely affect competition in the MISO
capacity market.
Table 5: Economic Capacity in MISO Classic during Extreme Peak Load
Pre-Merger Post-Merger
WEC Integrys
WEC Energy Group
Period Price MW Market Share
MW Market Share
Market Size HHI
MW Market Share
Market Size
HHI HHI Chg
S_SP1 $1,000 6,624 5.9% 2,314 2.1% 112,691 403 8,938 7.9% 112,691 427 24
Table 6: Economic Capacity in MISO during Extreme Peak Load
Pre-Merger Post-Merger
WEC Integrys
WEC Energy Group
Period Price MW Market Share
MW Market Share
Market Size HHI
MW Market Share
Market Size
HHI HHI Chg
S_SP1 $1,000 6,624 4.0% 2,314 1.4% 163,696 420 8,938 5.5% 163,696 431 11
23 The Commission has recognized this metric as a reasonable proxy for capacity in a number of FPA section 203
cases.
Ex.-WEC-Hunger-2 Page 15 of 71

Exhibit No. J-1
15
Q. DOES YOUR ANALYSIS OF VERTICAL MARKET POWER REVEAL ANY
COMPETITIVE CONCERNS?
A. No. Neither Applicant controls fuel supplies. Neither owns or controls interstate natural
gas pipeline facilities, though both Applicants have gas distribution systems which in
Integrys’ case are extensive. However, the key issue concerning fuels and transportation
supplies is the ability to limit or manipulate their availability to rivals competing with
Applicants’ generation in order to disadvantage them and/or increase prices. Here, the
Applicants’ gas distribution systems are subject to state-regulated open access tariffs that
prevent the Applicants from disadvantaging competing generators that are served from
their distribution facilities. With respect to new gas-fired generation, we note further that
most new utility-scale gas-fired generation either does, or easily could, connect directly
to high pressure gas transmission pipelines.
Moreover, as discussed below, most of the gas-fired generation served by Applicants’ gas
distribution systems is owned or controlled by Applicants electric operations, and only a
few non-affiliated generation facilities in MISO are served by the Applicants’ systems.
With the exception of one 245 MW combined cycle unit in Minnesota, most are small
peaking units owned by municipal utilities. There can be no potential incremental
vertical addition to the amount of generation controlled by Applicants arising from
attributing their own generation to the distribution system that serves it, and the minor
amount of unaffiliated generation served can have no material effect on competition even
if somehow the state open access requirements were ineffective.
We also analyzed the Applicants’ contracts for capacity rights on upstream interstate
natural gas pipelines, even though the Commission indicated in Order No. 697 that such
rights cannot be used to exercise vertical market power. The Commission’s vertical
analysis for mergers such as this that involve gas and electric assets is based on the
premise that both the upstream (gas) and downstream (electric) markets need to be highly
concentrated for there to be a potential vertical market power problem.24 Therefore, a
showing that either the upstream or downstream market is not highly concentrated 24 Order No. 642 at 31,911.
Ex.-WEC-Hunger-2 Page 16 of 71

Exhibit No. J-1
16
sufficiently shows that the merger does not harm competition by creating or enhancing a
vertical market problem.25 As discussed in detail below, our calculations show that the
upstream market is not highly concentrated (actually unconcentrated with an HHI of less
than 1,000), and therefore the combination of the Applicants’ capacity contracts does not
create any vertical market power problems by the Commission’s standards.
The other major potential vertical issue for electric mergers arises from control over
electric transmission. Here, Applicants do not directly control any transmission facilities
other than those that connect their generating plants to the grid, having divested their
transmission to ATC. Moreover, Commission precedent is to regard control of
transmission facilities by an RTO, and related market power monitoring and mitigation,
as sufficient to quiet vertical market power concerns and, in the case of the Applicants,
the transmission facilities divested to ATC are under the control of MISO.
Applicants do have ownership interests in ATC that give them an indirect degree of
ownership and presumptive limited control over the transmission facilities owned by
ATC. While ATC’s participation in MISO should moot any concerns about vertical
market power arising from Applicants’ interests in ATC, Applicants accept that the
merger will transform two minority owners of shares in ATC into an entity owning
approximately 60 percent of equity in it. As described in the Application, on all issues
pertaining to the planning, operations, expansion, and management of the ATC system,
Applicants have agreed to vote only the 34 percent of shares currently controlled by
Integrys. The remainder will be passive and voted in the same pattern as is the 40 percent
of shares not owned by Applicants. Hence, there will be no increase in the amount of
control of ATC exercisable by an Applicant decision-maker arising from the transaction.
The Commission also has expressed a potential concern that merging entities may control
potential generation sites and use that control to block entry. MISO is a very large
25 See, e.g., Duke Energy Corp. and Cinergy Corp., 113 FERC ¶ 61,297 at P 98 (2005) (“In Order No. 642, we
stated that in order for a merger to create or enhance vertical market power, both the upstream and downstream markets must be highly concentrated. Applicants’ witness has demonstrated that neither the upstream markets nor the downstream markets are highly concentrated, nor will they be after the merger. Thus, there would not be the possibility of market foreclosure or raising rivals’ costs in order to harm competition.)Footnotes omitted.
Ex.-WEC-Hunger-2 Page 17 of 71

Exhibit No. J-1
17
market and the few sites that Applicants control are not essential facilities needed for
entry by rivals.
Q. PLEASE SUMMARILY DESCRIBE THE APPLICANTS’ GENERATING
ASSETS AND WHERE THEY ARE LOCATED.
A. As shown in Exhibit J-4, WEC currently owns a total of approximately 6,342 MW
(summer Maximum Dependable Capacity (“MDC”) in Wisconsin and the Upper
Peninsula of Michigan. This consists of 3,825 MW of coal-fired capacity, 1,864 MW of
gas-fired plant (primarily combined cycle), 337 MW of wind, 180 MWs of oil-fired
capacity, a 50 MW biomass plant and 86 MW of low head hydro. In addition WEC has
long term contracts to purchase 1,018 MW of nuclear power and 236.54 MW of gas-fired
power from a cogeneration facility.
WEC also has one sales contract that conveys control over generation facilities to the
buyer. This is a contract for the 344 MW Presque Isle power plant in Michigan. WEC’s
subsidiary, Wisconsin Electric, was seeking to suspend operations at Presque Isle, an
aging coal plant composed of small units. However, MISO concluded that this plant is
required to remain in operations for reliability in the Michigan Upper Peninsula area. The
plant is now contracted to MISO under a System Support Resource (“SSR”) agreement
that allows MISO to dispatch the plant and requires WEC to sell energy from it at its
incremental cost. Wisconsin Electric has subsequently notified MISO that it intends to
retire Presque Isle.
Integrys’ MISO generation26 is shown on Exhibit J-5. Its 2,690 MW (summer MDC) of
generation consists of 1,353 of coal-fired, 1147 MW of gas- and oil- fired. 108 MW of
wind and 82 MW of hydro. Integrys also buys 2 MW of RDF (landfill gas generation)
and 76.5 MW of wind.
26 Integrys Energy Services controls 94 MW of generation. One 51 MW gas cogeneration unit is located in MISO
and included in the MISO totals discussed herein and used in our DPT analyses. The remaining 43 MW is landfill gas and (primarily) Solar PV scattered around the country outside of MISO.
Ex.-WEC-Hunger-2 Page 18 of 71

Exhibit No. J-1
18
FRAMEWORK FOR THE ANALYSIS
Q. WHAT ARE THE GENERAL MARKET POWER ISSUES RAISED BY MERGER
PROPOSALS?
A. Market power is the ability of a firm profitably to maintain prices above competitive
levels for a significant period of time. Market power analysis of a merger proposal
examines whether the merger would cause a material increase in the merging firms’
market power or a significant reduction in the competitiveness of relevant markets. The
focus is on the effects of the merger, which means that the merger analysis examines
those business areas in which the merging firms are competitors. This is referred to as
horizontal market power assessment. In most instances, a merger will not affect
competition in markets in which the merging firms do not compete. In the context of the
proposed merger, therefore, the focus is properly on those markets in which WEC and
Integrys are actual or (under some circumstances) potential competitors. The analysis is
intended to measure the adverse impact, if any, of the elimination of a competitor as a
result of the combination.
Potential vertical market effects of the merger relate to the merging firms’ ability and
incentives to use their market position over a product or service to affect competition in a
related business or market. For example, vertical effects could result if the merger of two
electric utilities created an opportunity and incentive to operate transmission in a manner
that created market power for the generation activity of the merged company that did not
exist previously. The Commission has identified market power as also potentially arising
from dominant control over potential generation sites or over fuels supplies and delivery
systems. Such control could undercut the presumption that long-run generation markets
are competitive.
Q. WHAT ARE THE MAIN ELEMENTS IN DEVELOPING AN ANALYSIS OF
MARKET POWER?
A. Understanding the competitive impact of a merger requires defining the relevant market
(or markets) in which the merging firms participate. Participants in a relevant market
include all suppliers, and in some instances potential suppliers, who can compete to
Ex.-WEC-Hunger-2 Page 19 of 71

Exhibit No. J-1
19
supply the products produced by the merging parties and whose ability to do so
diminishes the ability of the merging parties to increase prices. Hence, determining the
scope of a market is fundamentally an analysis of the potential for competitors to respond
to an attempted price increase. Typically, markets are defined in two dimensions:
geographic and product. Thus, the relevant market is composed of companies that can
supply a given product (or its close substitute) to customers in a given geographic area.
Horizontal Market Power Issues
Q. HOW HAS THE COMMISSION TYPICALLY EXAMINED PROPOSED
MERGERS INVOLVING ELECTRIC UTILITIES?
A. In December 1996, the Commission issued Order No. 592,27 the “Merger Policy
Statement,” which provides a detailed analytic framework for assessing the horizontal
market power arising from electric utility mergers. This analytic framework is organized
around a market concentration analysis. The Commission adopted the approach
employed by DOJ/FTC, described in their Horizontal Merger Guidelines, of measuring
market concentration levels by the HHI as its principal screen for merger-related market
power.28
To determine whether a proposed merger requires further investigation because of a
potential for a significant anti-competitive impact, the analysis considers the level of the
HHI after the merger (the post-merger HHI) and the change in the HHI that results from
the combination of the market shares of the merging entities. Markets with a post-merger
HHI of less than 1000 are considered “unconcentrated.” The Commission generally
considers mergers in such markets to have no anti-competitive impact. Markets with
post-merger HHIs of 1000 to 1800 are considered “moderately concentrated.” In those
markets, mergers that result in an HHI change of 100 points or fewer are considered
27
Order No. 592, FERC Stats & Regs. ¶ 31,044.
28 In 2010, subsequent to the issuance of the Merger Policy Statement, DOJ/FTC revised the Horizontal Merger Guidelines to increase the thresholds that they use to evaluate the competitive effects of a merger. The Commission, however, has declined to follow suit and continues to use the previously-applied thresholds. Analysis of Horizontal Market Power under the Federal Power Act, 138 FERC ¶ 61,109 (2012) (order reaffirming commission policy and terminating proceeding).
Ex.-WEC-Hunger-2 Page 20 of 71

Exhibit No. J-1
20
unlikely to have anti-competitive effects. Finally, post-merger HHIs of more than 1800
are considered to indicate “highly concentrated” markets. The Commission’s Merger
Policy Statement suggests that in these markets, mergers that increase the HHI by 50
points or fewer are unlikely to have a significant anti-competitive impact, while mergers
that increase the HHI by more than 100 points are considered likely to reduce market
competitiveness.
On November 15, 2000, the Commission issued its Revised Filing Requirements Under
Part 33 of the Commission’s Regulations,29 which affirmed the screening approach to
mergers consistent with the Appendix A analysis set forth in the Merger Policy
Statement, and codified the need to file a screen analysis and the exceptions therefrom.
Appendix A of the Merger Policy Statement, the Competitive Analysis Screen, specifies
a “delivered price” screening test, referred to as the DPT herein, to measure Economic
Capacity, defined as energy that can be delivered into a destination market at a delivered
cost less than 105 percent of the destination market price. The DPT screening test also
provides for an analysis of Available Economic Capacity, defined as energy over and
above that required to meet native load and other long-term obligations that meets the
delivered price test.
If a proposed merger raises no market power concerns (i.e., passes the Appendix A
screen), the inquiry generally is terminated. Both the Merger Policy Statement and the
Revised Filing Requirements accept that merger applications involving no overlap in
relevant geographic markets do not require a screen analysis or filing of the data needed
for the screen analysis.30
The DPT is intended to be a conservative screen to determine whether further analysis of
market power is necessary. If the Appendix A analysis shows that a company will not be
able to exercise market power in the destination markets where their generation resides, it
generally follows that the Applicants will not have market power in more broadly defined
29
Order No. 642, FERC Stats. & Regs. ¶ 31,111; 18 C.F.R. Part 33.
30 18 C.F.R. ¶ 33.3(a)(2)(i) (2010).
Ex.-WEC-Hunger-2 Page 21 of 71

Exhibit No. J-1
21
and more geographically remote markets. The screen is the first step in determining
whether there is a need for further investigation. If the screening test is not passed,
leaving open the issue of whether the merger will create market power, the Commission
invites Applicants to propose mitigation remedies targeted to reduce potential anti-
competitive effects to safe harbor levels. In the alternative, the Commission will
undertake a proceeding to determine whether unmitigated market power concerns mean
that the merger is contrary to the public interest.
Q. WHAT PRODUCTS HAS THE COMMISSION GENERALLY CONSIDERED?
A. The Commission generally has been concerned with three relevant product markets: non-
firm energy, short-term capacity (firm energy) and long-term capacity. Both Economic
Capacity and Available Economic Capacity31 are used as measures of energy.
Additionally, where relevant and where requisite information is available, the
Commission requires analysis of impacts on ancillary services and capacity markets. For
the most part, competitive conditions in ancillary services markets will correlate to
conditions in energy markets.32 Competitive conditions in the energy market in peak
periods closely correlate with conditions in capacity markets.
Under the Economic Capacity and Available Economic Capacity measures, energy
production capability that is attributed to a market participant is that capacity controlled
by it that can reach the destination market, taking transmission constraints and costs into
account, at a variable cost no higher than 105 percent of the destination market price. As
described above, the two measures differ as to the treatment of capacity used to meet
native load requirements.
31 As we noted in the Summary of Conclusions and discuss in more detail below, Available Economic Capacity is
the relevant measure in the context of non-restructured markets such as those in most of the MISO states such as Wisconsin.
32 The Commission has found that energy-related ancillary services such as imbalance energy and operating reserves can be sold pursuant to the general market-based rate tariff. Third-Party Provision of Ancillary Services; Accounting and Financial Reporting for New Electric Storage Technologies, Order No. 784, FERC Stats. & Regs. ¶ 31,349 (2013).
Ex.-WEC-Hunger-2 Page 22 of 71

Exhibit No. J-1
22
The Commission has determined that long-term capacity markets are presumed to be
competitive, unless special factors exist that limit the ability of new generation to be sited
or receive fuel.33
Order No. 642 directs applicants to analyze relevant ancillary services markets
(specifically, reserves and imbalance energy) “when the necessary data are available.” In
the relevant geographic market, MISO, there are formalized ancillary services markets
for some products, and we analyze these markets to the extent data are available. MISO
also has a voluntary capacity market, and our analysis examines this product market as
well.
Q. HOW HAS THE COMMISSION ANALYZED GEOGRAPHIC MARKETS?
A. Traditionally, the Commission has defined the relevant geographic markets as centered
on the areas where applicants own generation and on the balancing authority areas
directly interconnected with the applicants’ generation. Both Order No. 592 and the
Revised Filing Requirements continue to define the relevant geographic market in terms
of destination markets.34 Further, in a merger context, the Commission considers as
potential additional destination markets other utilities that historically have been
customers of the applicants.
Destination markets typically are defined as individual BAAs (previously, control areas).
However, the Commission’s practice has been to aggregate customers that have the same
supply alternatives into a single destination market and RTOs and Independent System
33 The market for long-term capacity generally does not need to be analyzed since the Commission has concluded
as a generic matter that the potential for entry ensures that the long-term capacity market is competitive. See Promoting Wholesale Competition Through Open Access Non-Discriminatory Transmission Servs. by Pub. Utils.; Recovery of Stranded Costs by Pub. Utils. & Transmitting Utils., Order No. 888, FERC Stats. & Regs. ¶ 31,036 at 31,657 (1996). The presumption that long-term capacity markets are competitive can be overcome if the applicants have dominant control over power plant sites or fuels supplies and delivery systems. This exception is addressed below.
34 18 C.F.R. 33.3(c)(2) (2010) (providing that the Competitive Analysis Screen must “identify each wholesale power sales customer or set of customers (destination market) affected by the proposed transaction. Affected customers are, at a minimum, those entities directly interconnected to any of the merging entities and entities that have purchased electricity at wholesale from any of the merging entities during the two years prior to the date of the application)”
Ex.-WEC-Hunger-2 Page 23 of 71

Exhibit No. J-1
23
Operators (“ISOs”) generally are default markets where applicable.35 The Commission’s
indicative screens for purposes of determining eligibility to obtain authority to sell at
market-based rates also use BAAs or RTOs/ISOs as default geographic markets.36 In
cases where material transmission constraints exist within an RTO/ISO, resulting in
frequent and significant price separation on the two sides of the constraint(s) the
Commission also has considered submarkets as separate geographic markets.37
Q. WHAT GEOGRAPHIC MARKETS DID YOU ANALYZE?
A. As noted previously, Applicants compete solely within the MISO BAA. Since the
Commission has not designated any areas within MISO as markets requiring an analysis
of smaller areas, this is the market we have analyzed.
Q. IS THERE A NEED TO ANALYZE ANY SUBMARKETS WITHIN MISO?
A. No. Although almost all of the Applicants’ generation is located in the “WUMS”
(Wisconsin and Upper Michigan System) region that traditionally has been subject to
some amount of transmission congestion, the Commission has never found WUMS to be
a relevant geographic market since it has been part of MISO for either FPA section 203
or Market-Based Rates market power studies.
There are also physical and economic reasons not to deviate from the Commission’s
previous findings not to consider WUMS as a relevant geographic market. When
considering whether an area ought to be treated as a separate market, the primary factor
to consider is whether prices are separated between the area and the remainder of the
large market. If prices are frequently and systematically different, this is evidence that
suppliers on the lower priced side of the constraint are not always able to compete with
and hence discipline price offers from suppliers on the high side of the constraint. The
35 Order No. 642, FERC Stats. & Regs. ¶ 31,111 at 31,890-1, citing Atlantic City Elec. Co., 80 FERC ¶ 61,126
(1997); Consolidated Edison, Inc., 91 FERC ¶ 61,225 (2000). To the extent there are internal transmission constraints within these markets, the Commission has considered smaller markets within these single control areas as potentially relevant.
36 Order No. 697 at P 231.
37 Id. at P 246 (citing to a number of Commission decisions involving electric utility mergers).
Ex.-WEC-Hunger-2 Page 24 of 71

Exhibit No. J-1
24
larger and more frequent the price differential, the more compelling is the evidence that
the high side submarket should be evaluated as a separate market.
The existence of transmission constraints between two market areas also is indirect
evidence that there may be separate markets. We say “indirect” because constraints may
be solved by redispatch with little or no price effects. Moreover, attempting to define
submarkets merely on the basis of constraint frequency is difficult unless markets are
connected by only very few transmission lines. For example, most of the imports from
upstate into New York City come through a single corridor. The constraints on that
corridor occur frequently during high load hours or when there are major outages in in-
City generation. AP South in PJM similarly is a frequently constrained major corridor
that also is composed of a few transmission lines. On the other hand, if constraints occur
at different times and on numerous different transmission facilities, as is the case between
WUMS and the rest of MISO,38 there will be times when a part of the “market” will be
constrained away from the larger area, but not all of it. Indeed, in many cases, such
constraints will cause price separation within the geographic area being considered, with
parts of it constrained away from both the larger area and other parts of the submarket.
According to MISO and ATC studies, transmission expansion projects have relieved
transmission constraints into and within WUMS, and transmission congestion into
WUMS has declined significantly since 2007, when the Commission declined to define
WUMS as a default submarket in Order No. 697.39 In addition, at the same time net
generation capacity has increased in WUMS. MISO projects a capacity surplus of 700
MW in 2016 for Zone 2 (ATC).40 Given that WUMS was not deemed to be a separate
submarket when Order No. 697 was issued in 2007, and in view of the extensive work on
improving and expanding transmission capability and generation capacity in and around
38 WUMS is connected to the rest of MISO by five 345 kV lines (two to the west and three to the south) and a
number of lower voltage lines. 39 A number of projects have been completed or are scheduled to be completed by 2016. For example, Monroe
County – Council Creek 345 kV line; Arnold 345/138 kV transformer; Kenosha – Lakeville 138 kV rebuild; Pleasant Prairie – Zion Energy Center 345 kV line; and Hiawatha – Indian Lake 138 kV energize. Based on data from American Transmission Company: Market and PROMOD Congestion Report (2013).
40 MISO 2016 Resource Adequacy Forecast at p. 10 (June 5, 2014).
Ex.-WEC-Hunger-2 Page 25 of 71

Exhibit No. J-1
25
WUMS in the last 10 years, there is even less reason to do so when analyzing the effects
of this transaction, which is not expected to close until 2015.
Because there are various flowgates showing congestion within WUMS, or between
WUMS and the rest of MISO or PJM, we have analyzed price data to determine whether
this congestion has caused price separation and higher prices in WUMS than in the rest of
MISO. The results of our analysis are summarized in Table 7, below. The table shows
that none of the flowgates have caused WUMS to have consistently higher prices than
elsewhere in MISO. Indeed, the data indicate that WUMS generally is a “low-side”
market, which is not consistent with it being a separate submarket for purposes of
conducting the Competitive Analysis Screen. In addition, the analysis of real-time prices
between WUMS and the rest of MISO showed a correlation coefficient of 0.960,
indicating a very strong price correlation, as would be expected for a single market.41
Table 7: Real-Time WUMS and MISO Energy Price Comparison (2012-2013)
Period WUMS
($/MWh) MISO
($/MWh) Delta %
Difference Winter Super Peak $44.11 $45.44 -$1.33 -3.0%
Winter Peak $31.66 $33.16 -$1.50 -4.6%
Winter Off-Peak $24.15 $23.98 $0.17 0.7%
Summer Peak Top 1% $121.03 $122.73 -$1.70 -1.4%
Summer Super Peak $72.51 $77.20 -$4.69 -6.3%
Summer Peak $32.45 $34.57 -$2.12 -6.3%
Summer Off-Peak $24.63 $24.20 $0.43 1.8%
Shoulder Super Peak $34.98 $35.63 -$0.65 -1.8%
Shoulder Peak $30.55 $31.57 -$1.02 -3.3%
Shoulder Off-Peak $24.68 $24.73 -$0.05 -0.2%
Source: CRA Analysis
Q. WHAT DO YOU CONCLUDE ABOUT THE NEED TO ANALYZE WUMS AS A
SUBMARKET?
A. In cases where the Commission has determined a submarket within an RTO, it has been
because the area was a load pocket, and thus more susceptible to the exercise of market
41 Based on 2012-2013 MISO LMP data. See calculation in workpapers section J - 6.7.
Ex.-WEC-Hunger-2 Page 26 of 71

Exhibit No. J-1
26
power.42 The price data in Table 7 shows that WUMS is not a load pocket—it is little
separated from the rest of MISO and often sees lower prices than the surrounding areas.
Consequently, this price data supports our conclusion that MISO should continue to be
analyzed as a geographic market without establishing WUMS as a separate submarket.
Q. ISN’T IT THE CASE THAT THE MISO MARKET MONITOR REGARDS
WUMS TO BE A “NARROWLY CONSTRAINED AREA”?
A. While that is true, the sole basis used by the market monitor to define such areas is the
number of constraint hours counted, without regard for whether there is any substantial
price separation or whether the constraints affect all or merely a small part of the zone.
As discussed above, there is little price separation between WUMS and the rest of MISO
and, as a result, this designation by the market monitor does not change our conclusion.43
Vertical Market Power Issues
Q. WHAT ARE THE POTENTIALLY RELEVANT VERTICAL MARKET POWER
ISSUES?
A. In the Revised Filing Requirements, the Commission set out several vertical issues
potentially arising from mergers with input suppliers. The principal issue identified is
whether the merger may create or enhance the ability of the merged firms to exercise
market power in downstream electricity markets by reason of their control over the
supply of inputs used by rival producers of electricity. Three potential abuses have been
identified: the upstream firm has the ability to raise rivals’ costs or foreclose them from
the market in order to increase prices received by the downstream affiliate; the upstream
firm has the ability to facilitate collusion among downstream firms; or transactions
between vertical affiliates could be used to frustrate regulatory oversight of the cost/price
42 Each of the six submarkets that the Commission listed Order No 697 as having been identified as a sub-market
requiring separate analysis was a load pocket that was constrained away from lower cost generation in adjacent areas.
43 The upper peninsula of Michigan has higher prices than the rest of WUMS and MISO. However, Applicants control little generation in this area, the largest unit being Presque Isle, which is controlled by MISO under an SSR agreement and is slated to be retired.
Ex.-WEC-Hunger-2 Page 27 of 71

Exhibit No. J-1
27
relationship of prices charged by the downstream electricity supplier.44 The downstream
products to be analyzed in a vertical analysis are the same as in the horizontal analysis.
With respect to the vertical analysis, the Commission defines the downstream geographic
and product markets in the same manner as in the horizontal analysis.45 For upstream
markets, the relevant geographic market has not been defined by the Commission. In
concept, it should include the area in which suppliers to generators competing in the
downstream market are located.
Q. HOW DOES THE FRAMEWORK FOR ASSESSING VERTICAL MARKET
POWER DIFFER FROM THE HORIZONTAL ANALYSIS FRAMEWORK?
A. For the vertical market power screen, the Commission’s focus is on the structural
competitiveness of downstream and upstream product markets, as measured by HHIs.
The main difference from the horizontal analysis is that in the vertical analysis, the focus
is not on the change in HHIs resulting from the merger, but on the structure of those
upstream and downstream product markets in geographic markets in which one or both
merging parties sells upstream products and in which the other or both merging parties
sells downstream products.46
Q. WHAT ARE THE VERTICAL MARKET POWER ISSUES THAT THE
COMMISSION HAS FOUND REQUIRE INVESTIGATION IN THE CONTEXT
OF MERGERS BETWEEN ELECTRIC UTILITIES AND GAS
TRANSPORTATION PROVIDERS?
A. The Commission has expressed its concern, in decisions addressing “convergence
mergers” between electric utilities and natural gas pipelines and in Order No. 642, that
vertical mergers “may create or enhance the incentive and/or ability for the merged firm
44 While Order No. 642 identifies these three types of effects, the third is more properly an effect on rates and
regulation, review criteria that exist separately from market power. 45 Order No. 642, FERC Stats. & Regs. ¶ 31,111 at 31,909; 18 C.F.R. § 33.4(c)(3).
46 The vertical market power test is thus quite unrelated to the effects of a merger since neither the Applicants’ shares nor the change in HHIs arising from the merger is relevant to the test, unless the merger were to raise the concentration in the upstream or downstream market to 1,800 or over.
Ex.-WEC-Hunger-2 Page 28 of 71
Exhibit No. J-1
28
to adversely affect prices and output in the downstream electricity market and to
discourage entry by new generators.”47
In addition to the three generic areas of vertical concern noted above, the Commission
also has expressed concerns that (a) convergence mergers involving an upstream gas
supplier serving the downstream merger partner, as well as competitors of that partner,
could result in preferential terms of service; and (b) a pipeline serving electric generation
could provide commercially valuable information to newly affiliated electricity
generating or marketing operations.
Finally, the Commission also has expressed the concern that an entity that controls
electric transmission could use that control to favor its own generation.
Q. WHAT VERTICAL ISSUES ARE RAISED IN THIS MERGER BY THE
COMBINATION OF THE APPLICANTS’ GENERATION AND NATURAL GAS
ASSETS?
A. Neither of the Applicants owns or controls fuels supplies or any interstate natural gas
pipeline facilities. Consequently, the transaction does not involve the type of
“convergence” merger between electric utilities and interstate natural gas pipelines that
formed the primary concern raised by the Commission when considering the combination
of electric generation and interstate natural gas pipeline facilities. Although the
Applicants do not own interstate natural gas pipelines, each of the Applicants does own
natural gas local distribution facilities. WEC serves 1,074,000 customers in MISO and
Integrys serves 878,000 customers in MISO and 1,154,000 customers in PJM. The
Applicants also have contractual capacity rights on upstream interstate natural gas
pipelines. However, in each case, such ownership does not raise vertical market power
problems.
47 Order No. 642, FERC Stats. & Regs. ¶ 31,111 at 31,904.
Ex.-WEC-Hunger-2 Page 29 of 71

Exhibit No. J-1
29
Q. WHY DOES THE APPLICANTS’ OWNERSHIP OF LOCAL NATURAL GAS
DISTRIBUTION FACILITIES NOT RAISE VERTICAL MARKET POWER
CONCERNS?
A. First of all, the Commission has recognized that most local natural gas distribution
facilities operate under state mandated open-access requirements that prevent the exercise
of vertical market power. Consequently, in Order No. 697, the Commission established a
rebuttable presumption that ownership of such facilities does not create vertical market
power concerns.48 Consistent with this finding, the Commission on several occasions has
found that the combination of electric generation facilities and local distribution facilities
does not raise vertical market power concerns.49 Here, we understand that all of the
Applicants’ local distribution facilities provide open access services under state-approved
tariffs, and therefore the presumption should apply. Additionally, these states also
impose non-discrimination requirements.50
Moreover, most of the gas-fired generation in MISO served by the Applicants’ gas
distribution systems is generation that is owned or controlled by the Applicants
themselves. WEC serves no natural gas-fired generation that it does it does not control
via ownership or long term contract. Integrys serves one 245 MW merchant combined
cycle unit and three small peaking facilities in Minnesota, two small peaking facilities in
Wisconsin, and two small peaking facilities in Michigan. There can be no potential
vertical market power concerns raised by combining the Applicants’ distribution systems
when those systems serve generation that already is owned or controlled by the
Applicants rather than by the Applicants’ competitors. Even if the few unaffiliated
generators served by the Applicants were thereby deemed to be controlled by the
Applicants, that would not cause the MISO generation markets to be highly concentrated
which, as we note below, is the test the Commission applies when evaluating vertical
market power issues.
48 Order No. 697 at P 446.
49 See, e.g. Exelon Corp., 138 FERC ¶ 61,167 at P 113 (2012); PPL Corp., 133 FERC ¶ 61,083 at PP 16, 19 (2010); Exelon Corp., 127 FERC ¶ 61,161 at PP 90, 93 (2009).
50 The citations to these requirements are provided in the Application.
Ex.-WEC-Hunger-2 Page 30 of 71

Exhibit No. J-1
30
Q. WHY DOES THE APPLICANTS’ OWNERSHIP OF CAPACITY RIGHTS ON
UPSTREAM NATURAL GAS PIPELINES NOT RAISE VERTICAL MARKET
POWER CONCERNS?
A. We observe that such contractual rights are not mentioned in Order No. 642 or the
Commission’s Merger Regulations as creating vertical market power concerns. Nor should
the Commission find that they do here. For one thing, the contractual rights are used by the
Applicants to serve their natural gas distribution load, and thus the customers, not the
Applicants, control when the rights are used. Further, under the Commission’s open access
rules applicable to interstate natural gas pipelines, the Applicants cannot withhold the
capacity from the market if it is not being used because, if not used by the Applicants, the
capacity is made available to others on an interruptible basis. It is for this reason that the
Commission found in Order No. 697 that ownership of such capacity rights cannot be used
to exercise vertical market power.51
We recognize, however, that in the past some merger applicants have submitted vertical
market power analyses of their interstate natural gas pipeline contractual capacity rights
and, in fact, Dr. Hieronymus has conducted such analyses in past merger proceedings.
Consequently, we conducted an analysis of whether such rights could be used to exercise
vertical market power in accordance with the requirements for such analyses established by
the Commission in addition to looking at the concentration of pipelines and storage serving
the MISO area.
Q. HOW DOES THE COMMISSION DIRECT THAT VERTICAL MARKET POWER
ISSUES BE ANALYZED?
A. The Commission has stated that a necessary condition for a convergence merger to cause
a vertical concern is that both the upstream and downstream markets are highly
concentrated.52 In other words, the screen is passed if the downstream (or upstream)
51 See Order No. 697 at P 430 (holding that ownership of capacity rights on interstate natural gas pipelines does
not raise vertical market power issues because “interstate pipeline capacity held by firm shippers that is not utilized or released is available from the pipeline on an interruptible basis”).
52 “[H]ighly concentrated upstream and downstream markets are necessary, but not sufficient, conditions for a vertical foreclosure strategy to be effective . . . .” Id. at 31,911. “A vertical merger can create or enhance the incentive and ability of the merged firm to adversely affect electricity prices or output in the downstream
Ex.-WEC-Hunger-2 Page 31 of 71
Exhibit No. J-1
31
market is not highly concentrated, irrespective of the degree of concentration of the
upstream (or downstream) market.
Q. WHAT ANALYSIS DID YOU PERFORM?
A. Here, we know that the downstream market is unconcentrated when analyzed under the
Commission’s horizontal market power requirements, as shown in Tables 1-4, and it is
very likely that such would be the case under the Commission’s vertical market power
analysis.53
Performing such an analysis is very data intensive, however, since it requires knowing
which pipeline serves which gas-fired plant for all of MISO. Consequently, we instead
conducted an analysis of the upstream market concentration pursuant to the
Commission’s vertical market power regulations and found the upstream market to be
unconcentrated. The MISO region is well served by multiple pipelines coming from all
directions. Conservatively examining just the MISO Classic region, there are 21
pipelines serving the region with over 26 Bcf/day of flow. The largest pipeline in terms
of daily follow capacity is the Northern Border pipeline with just over 2.3 Bcf per day
(approximately a 9 percent market share). Because of the large number of pipelines
serving the region, the market is unconcentrated with an HHI of only 565.54
In addition, using Index of Customers data for delivered gas into the MISO Classic
market we calculated HHIs based on customers’ contractual rights to capacity on the
market by raising rivals’ input costs if market power could be exercised in both the upstream and downstream geographic markets.” Id. at 31,904. This was confirmed in Energy East. “Applicants correctly conclude that because they have shown that the downstream markets are not highly concentrated, there is no concern about foreclosure or raising rivals’ costs in this case.” Energy East Corp., 96 FERC ¶ 61,322 at 62,229 (2001).
53 A vertical analysis differs from the horizontal analysis only in that gas-fired power plants are assumed to be controlled by the pipeline supplying them. The effect of this reattribution of control is to separate control of the gas generation from non-gas generation which remains attributed as controlled by its owners. In our experience, and given the unconcentrated upstream natural gas market, the result of this reallocation invariably is to reduce concentration. Since the MISO wholesale electric market already is unconcentrated, the reallocated market that would be modelled in a vertical analysis almost certainly not highly concentrated.
54 Details in Workpapers section J - 6.6, based on data from Gas and Electric Infrastructure Interdependency Analysis Prepared for The Midwest Independent Transmission System Operator (2012).
Ex.-WEC-Hunger-2 Page 32 of 71

Exhibit No. J-1
32
interstate natural gas pipelines. This calculation shows a post-merger HHI of 327.55
Including MISO South would only dilute the market shares, resulting in an even lower
concentration level.
Because Integrys owns and controls some market area storage in MISO, as a conservative
additional test, we calculated an upstream HHI of gas storage in the MISO Classic region,
and also found it to be unconcentrated, with a post-merger HHI of 717.56
Q WHAT DO YOU CONCLUDE FROM YOUR ANALYSIS?
A. As we noted above, the Commission’s vertical market power screen is failed only if both
markets are highly concentrated. Because the upstream market is not highly
concentrated, it was not necessary for us to analyze the downstream market in order to
conclude that the Commission’s test for vertical market power is satisfied.57
Q. WHAT VERTICAL MARKET POWER CONCERNS ARE RAISED WITH
RESPECT TO ELECTRIC TRANSMISSION FACILITIES?
A. With respect to assessing the impact of ownership of electric transmission facilities, the
Commission in the past has focused on the extent to which the transmission owner
provides open-access transmission or has transferred operational control over its
transmission facilities to an ISO or an RTO. The transmission facilities serving
Applicants are owned by ATC and are controlled by the MISO RTO pursuant to a
Commission-approved open access transmission tariff. Based on Commission policy and
precedent, the transaction raises no transmission-related vertical market power issue.
Thus, even if Applicants were deemed to wholly control ATC, this would not raise a
vertical market power issue. As noted previously, Applicants have agreed that they will
not increase their ATC voting rights on matters pertaining to transmission planning,
expansion, operations or management beyond what Integrys controls currently.
55 Data and calculations in Workpapers section J - 6.6.
56 Data and calculations in Workpapers section J - 6.6.
57 See, e.g., National Grid plc and KeySpan Corp., 117 FERC ¶ 61,080 at P 44 (2006).
Ex.-WEC-Hunger-2 Page 33 of 71

Exhibit No. J-1
33
Q. DO APPLICANTS HAVE THE ABILITY TO FORECLOSE ENTRY BY
REASONS OF THEIR CONTROL OF POTENTIAL GENERATION SITES?
A, No. MISO is a very large market with many existing and potential generation sites that
Applicants do not control.58
DESCRIPTION OF METHODOLOGY
Q. PLEASE SUMMARIZE THE METHODOLOGY THAT YOU USED TO
ANALYZE THE COMPETITIVE EFFECTS OF THE MERGER.
A. We evaluated the competitive effects of the merger using the delivered price test outlined
in Appendix A and the Revised Filing Requirements. We implemented this analysis
using a proprietary CRA model called the “Competitive Analysis Screening Model”
(“CASm”). As discussed below, a version of CASm has been created to eliminate the
complex allocation of transmission CRA previously employed in favor of the simpler
allocation of the simultaneous import limit (“SIL”) that became Commission policy in
2012.59 This version of the model is used to create an alternative analysis contained in
workpapers.
Q. WHAT DESTINATION MARKETS DID YOU CONSIDER?
A. The sole balancing authority area in which Applicants compete is MISO, which now
includes Entergy and CLECO. In our analysis of the MISO market, we included PJM as
a first tier market, but did not separately analyze the effect of the market on PJM. As a
conservative analysis, we also analyzed the MISO market not including MISO South
(“MISO Classic”).
58 See Integrys Triennial Market Market-Based Rates Update at p. 5, Docket Nos. ER10-1984 et al (June 26,
2012) and Wisconsin Electric Power Company, Triennial Market Power Analysis at p. 7, Docket Nos. ER10-2563 et al. (June 29, 2012).
59 NRG Energy, Inc., 141 FERC ¶ 61,207 at P 53 (2012) (explaining that “…applicants appear to have used an incorrect pro rata allocation method for imports into the study area (the model appears to allocate imports from first tier BAAs independently rather than allocating uncommitted capacity from an aggregated first tier),” (citing to the series of orders beginning with Order No. 697, detailing the methodology to be used in market-based rate filings under Section 205).
Ex.-WEC-Hunger-2 Page 34 of 71

Exhibit No. J-1
34
Q. WHAT TIME PERIODS/LOAD CONDITIONS DID YOU ANALYZE?
A. We examined ten time periods/load conditions in the context of the DPT. We used these
ten time periods for both the Economic Capacity and Available Economic Capacity
analyses. While the taxonomy is largely dictated by Commission policy and precedent, it
is useful to recall that the origin of the DPT time periods is to provide snapshots that
reflect a broad range of system conditions. We evaluated hourly load data to aggregate
similar hours. We defined periods within three seasons (Summer, Winter and Shoulder)
to reflect the differences in unit availability, load and transmission capacity. Hours were
first separated into seasons to reflect differences in generating availability and then
further differentiated by load levels during each season.60 For each season, hours were
segmented into peak- and off-peak periods.61 The periods evaluated (and the
designations used to refer to these periods in exhibits) are:
SUMMER (June-July-August)
Super Peak 1 (S_SP1): Top one percent of peak load hours
Super Peak 2 (S_SP2): Top ten percent of peak load hours
Peak (S_P): Remaining peak hours
Off-peak (S_OP): All off-peak hours
WINTER (December-January-February)
Super Peak (W_SP): Top ten percent of peak load hours
Peak (W_P): Remaining peak hours
Off-peak (W_OP): All off-peak hours
SHOULDER (March-April-May-September-October-November)
60
Appendix A requires applicants to evaluate the merger’s impact on competition under different system conditions. For example, aggregating summer peak and shoulder peak conditions may mask important differences in unit availability and, therefore, a merger could potentially affect competition differently in these seasons. Thus, applicants are directed to evaluate enough sufficiently different conditions to show the merger’s impact across a range of system conditions. On the other hand, the DOJ/FTC Horizontal Merger Guidelines discuss the ability to “sustain” a price increase, and a finding that a structural test (like the HHI statistic) violates the safe harbor for some small subset of hours during the year may not be indicative of any market power problems.
61 Peak and off-peak hours were defined according to NERC’s definition, except that we did not consider
Saturdays to be peak days. For the Eastern Time Zone, on-peak hours include Hour Ending (HE) 0800−HE 2300 EST Monday through Saturday and off-peak hours include HE 2400−HE 0700 EST Monday through Saturday. See http://www.nerc.com/files/opman_12-13Mar08.pdf.
Ex.-WEC-Hunger-2 Page 35 of 71

Exhibit No. J-1
35
Super Peak (SH_SP): Top ten percent of peak load hours
Peak (SH_P): Remaining peak hours
Off-peak (SH_OP): All off-peak hours
Q. WHAT COMPETITIVE PRICE LEVELS DID YOU ANALYZE IN YOUR
ANALYSES?
A. We evaluated conditions assuming destination market prices ranging from prices in the
Off-Peak periods in which only baseload generation is economic to high prices in the
highest Summer Super Peak period during which all but the very least economic
generation is in merit. In Order No. 642, the Commission indicated that sub-periods
within a season should be determined by load levels rather than by time periods. As
discussed below, we analyzed each market at prices that range from the levels that would
apply at the lowest load levels to those consistent with the highest load levels.
We used average MISO day-ahead prices for 2012 and 2013 for each of the 10 time
periods as a starting point. Two years were used to set the baseline consistent with
Commission direction. Incremental spark spreads were computed for each period relative
to fuels costs in the historic period. These then were carried forward to the 2016 test year
based on the Ventyx forecast of gas price escalation.62 Coal prices are assumed to be the
marginal fuel in off-peak periods; accordingly we adjusted off-peak prices based on 2016
forward coal prices. In addition, we conducted price sensitivity analyses around these
base case prices, which evaluated 10 percent higher and lower prices.63 The price
sensitivity tests also showed no screen failures in any season/load levels for AEC or EC
for either MISO or MISO Classic.
62 Calculations are shown in Workpapers section J – 6.2.2
63 These sensitivity analyses are provided in workpapers J - 6.8.
Ex.-WEC-Hunger-2 Page 36 of 71

Exhibit No. J-1
36
Q. PLEASE DESCRIBE THE BASIC MODEL ARCHITECTURE YOU USED IN
ANALYZING THIS MERGER.
A. We used CRA’s proprietary model, CASm, to perform the analysis. CASm was built
initially in 1997 to implement the new analysis required in Order No. 592. It is a linear
programming model developed specifically to perform the calculations required in
undertaking the DPT and has been used to provide analyses supporting scores of filings
before the Commission. As designed, the model included each potential supplier as a
distinct “node” or area that is connected via a transportation (or “pipes”) representation of
the transmission network. Each link in the network had its own non-simultaneous limit
and cost. Potential suppliers are allowed to use all economically and physically feasible
links or paths to reach the destination market. In instances where more generation meets
the economic element of the DPT (e.g., 105 percent of the market price) than can actually
be delivered on the transmission network, transmission capacity is allocated based on the
relative amount of economic or available economic generation that each party controls at
a constrained interface.
Q. HOW DID YOU ALLOCATE TRANSMISSION CAPACITY FOR THIS
TRANSACTION?
A. Appendix A notes that there are various methods for allocating transmission and that
applicants should support the method used.64 We allocated transmission first to parties
holding firm reservation and having contractual or ownership access to generation in the
external area,65 then allocated remaining transmission based on a pro rata, “squeeze
down” method based on relative ownership shares of capacity at a transmission interface,
rather than on the basis of economics, which would allocate limited transmission first to
64
See Order No. 592, FERC Stats. and Regs. ¶ 31,044 at 30,133 (“In many cases, multiple suppliers could be subject to the same transmission path limitation to reach the same destination market and the sum of their economic generation capacity could exceed the transmission capability available to them. In these cases, the [Available Transfer Capability] must be allocated among the potential suppliers for analytic purposes. There are various methods for accomplishing this allocation. Applicants should support the method used.”)
65 We were not able to find evidence of firm point-to-point reservations from controlled power plants in PJM use to serve load in MISO. Indeed, because power prices and capacity prices in PJM are higher than in MISO, the firm transmission reservations of which we are aware exist to transfer firm capacity from MISO to PJM. Hence, the only portion of the SIL that was allocated before proration was the 108 MW of transmission from Manitoba allocated to Integrys.
Ex.-WEC-Hunger-2 Page 37 of 71

Exhibit No. J-1
37
the generation with the lowest variable costs. The pro rata “squeeze-down” method, so-
named because it seeks to prorate capacity at each node, is the closest approximation to
what the Commission applied in FirstEnergy66 that is computationally feasible. In earlier
merger analyses, CRA made the squeeze down allocation on a node by node basis,
subject to an overall simultaneous import limit.
In 2012, the Commission issued revised guidance on how it wanted applicants to allocate
available transmission. It directed that the method it had adopted for market-based rate
filings should also be used for Section 203 merger filings.67 Hence, in one set of our
analyses, we allocated the available transmission, as quantified by the simultaneous
import limit (“SIL”) on a pro rata basis from an aggregated first tier irrespective of path
limits.68 Given our interpretation of the most recent Commission guidance regarding
transmission allocation, however, we perform an analysis that considers both the overall
SIL and the physical transfer limitations of the grid for connections to each first-tier
market in allocating imports. The former analysis is in our workpapers. The latter is our
base case as shown in Tables 1-4.69
Q. WHAT MEASURE OF SIMULTANEOUS IMPORT CAPABILITY DID YOU
USE?
A. The last SIL computed by MISO was in December 2011. It is badly out of date,
particularly as a result of Duke Ohio leaving, and Entergy joining MISO. The only
recent Commission-accepted SIL of which we are aware was computed in connection
with the Dynegy acquisition of Ameren’s Illinois generation and accepted by the
66 Ohio Edison Co., 80 FERC ¶ 61,039 at 61,106-07 (1997) (“When there was more economic capacity (or
available economic capacity) outside of a transmission interface than the unreserved capability would allow to be delivered into the destination market, the transmission capability was allocated to the suppliers in proportion to the amount of economic capacity each supplier had outside the interface.”).
67 NRG Energy, Inc., 141 FERC ¶ 61,207 at P 53 (2012) (explaining that “…applicants appear to have used an incorrect pro rata allocation method for imports into the study area (the model appears to allocate imports from first tier BAAs independently rather than allocating uncommitted capacity from an aggregated first tier)”, (citing to the series of orders beginning with Order No. 697, detailing the methodology to be used in market-based rate filings under Section 205).
68 See Workpapers section J - 6.9 for this specification.
69 See Tucson Electric Power Co., Docket No. EC14-88-000 (July 24, 2014) (letter requesting further information), citing 18 C.F.R. § 33.3(c)(4)(i)(C).
Ex.-WEC-Hunger-2 Page 38 of 71

Exhibit No. J-1
38
Commission. The analysis determining the revised SILs in the Dynegy case takes into
account the changes in MISO composition that have taken place since 2011. The SILs
for the entire MISO market are 10,165 MW Summer, 11,480 MW Winter and 11,589
MW Shoulder; and the SILs for MISO Classic are 5,571 MW Summer, 7,531 MW
Winter and 7,821 MW Shoulder.70
Q. WHAT YEAR DID YOUR ANALYSIS COVER?
A. We analyzed 2016 market conditions, consistent with the Order No. 642 requirement that
the analysis be forward looking. The year 2016 was selected since the merger is not
expected to be finalized until the second half of 2015. Strictly speaking, the period used
is December 2015 through November 2016, consistent with the Commission’s required
methodology.71
Even though our analysis approximates 2016 market conditions, the primary source of
data on generation and transmission is current and recent historical data. Where
appropriate, we adjusted relevant data to approximate expected 2016 conditions. This
includes load and generation dispatch (i.e., fuel and other variable) costs. We also
reflected generation additions and retirements in MISO expected to occur in the relevant
time frame.
Q. HOW DO YOU ACCOUNT FOR LONG-TERM PURCHASES AND SALES?
A. The Commission’s policy favors assigning control to the contractual party with dispatch
rights.72 Since MISO is so unconcentrated, the general treatment of purchases and sales
is inconsequential in terms of the results of our analysis, except with respect to those
70 Ameren et al. Supplemental Information Filing, Docket No. EC13-93-000 (Aug. 5, 2013).
71 See, e.g., Order 697-A at Appendix D.
72 See 18 C.F.R. § 33.3(c)(4)(i)(A), stating: Economic capacity means the amount of generating capacity owned or controlled by a potential supplier with variable costs low enough that energy from such capacity could be economically delivered to the destination market. Prior to applying the delivered price test, the generating capacity meeting this definition must be adjusted by subtracting capacity committed under long-term firm sales contracts and adding capacity acquired under long-term firm purchase contracts (i.e., contracts with a remaining commitment of more than one year). The capacity associated with any such adjustments must be attributed to the party that has authority to decide when generating resources are available for operation. Other generating capacity may also be attributed to another supplier based on operational control criteria as deemed necessary, but the applicant must explain the reasons for doing so. Id. Order No 697 provides some further guidance on what constitutes control but accepts that judgments will be necessary and declines to be highly prescriptive.
Ex.-WEC-Hunger-2 Page 39 of 71

Exhibit No. J-1
39
affecting Applicants’ contracts. As described below, we have assumed, as appropriate,
that contracts transferring control to Applicants are treated as such. Because data on
contractual terms of power sales not involving Applicants generally are unavailable, we
assumed that all other generation is controlled by the owner. In light of the low level of
HHIs for both EC and AEC, any change of control that might arise from reassignment of
controlled generation among non-Applicants would not affect our conclusions.
As discussed earlier and shown in Exhibit J-4, Wisconsin Energy has a long term
purchase of 1,033 MW (Summer MDC) from the Point Beach nuclear plant and 236.5
MW (summer) from the Whitewater Cogeneration Facility. We treat these as controlled
by WEC. As discussed earlier, its 344 MW Presque Isle coal station is under contract to
MISO and we treat it as controlled by MISO.
As shown in Exhibit J-5, Integrys has long term contracts with Brown County landfill (2
MW), Forward Wind Farm (57.5 MW)73 and Shirley Wind Farm (19 MW). In addition,
it has a 108 MW around the clock purchase from Manitoba. We treat this as controlled
by Applicants despite that it does not relate to specific generation and we also allocate
that amount (108 MWs) of the SIL to Integrys, consistent with Commission policy to
allocate the SIL to Applicants’ remote generation before any pro rata allocation of the
remaining SIL
Q. WHAT PLANNED GENERATION RETIREMENTS AND ADDITIONS DO YOU
REFLECT FOR APPLICANTS?
A. WEC has announced its intent to retire the Presque Isle Power Plant (“PIPP”), which is
providing SSR Service to MISO in lieu of suspension of operations. It is expected that
PIPP will continue to provide SSR service in lieu of retirement. WPS is retiring Pulliam 5
and 6 and Weston in 2015 and these units are excluded from our analysis.
73 Under the terms of the agreement with other off-takers, WPS dispatches the full 129 MW. Its output share is
57.5 MW. We assume for analysis purposes that WPS controls the entire unit.
Ex.-WEC-Hunger-2 Page 40 of 71

Exhibit No. J-1
40
Q. PLEASE DESCRIBE THE WHOLESALE CUSTOMER CONTRACTS FOR
WHICH APPLICANTS ARE THE SELLERS.
A. As shown on Exhibit J-4, WEC has long term or evergreening contracts with four
entities, WPPI energy, Cloverland Electric Cooperative, Great Lakes Utilities and MGE
Energy, Inc. These total 185 MW. For the AEC analyses, we added these loads to
WECs loads before subtracting the generation needed to serve these loads from WEC’s
Economic Capacity
As shown on Exhibit J-5, Integrys also has long term or evergreening wholesale contracts
with four entities: WPPI Energy, Great Lakes Utilities, Ontonagon Municipal and
Balfour Beatty Infrastructure Partners. These total 219 MW. As with WEC, these loads
were added to Integrys’ load in computing its AEC
Q. PLEASE SUMMARIZE YOUR RECOMMENDATION.
A. We recommend that the Commission determine that this merger will not have an adverse
effect on competition in markets subject to its jurisdiction.
Q. DOES THIS COMPLETE YOUR TESTIMONY?
A. Yes.
Ex.-WEC-Hunger-2 Page 41 of 71
Wisconsin Energy Corporation
Integrys Energy Group, Inc.
) ) )
Docket No. EC14- -000
APPLICATION UNDER SECTION 203 OF THE FEDERAL POWER ACT
PREPARED DIRECT TESTIMONY AND EXHIBITS OF WILLIAM H. HIERONYMUS AND DAVID HUNGER
ON BEHALF OF APPLICANTS
!, William H. Hieronymus, being duly sworn, depose and state that the foregoing Declaration on behalf of Wisconsin Energy Corporation and Integrys Energy Group, is true, correct, accurate and complete to the best of my information, knowledge and belief.
Subscribed and sworn to before me This 14th day of August, 2014
William H. Hieronymus
Ex.-WEC-Hunger-2 Page 42 of 71

UNITED STATES OF AMERICA BEFORE THE
FEDERAL ENERGY REGULATORY COMMISSION
Wisconsin Energy Corporation
Integrys Energy Group, Inc.
) ) )
Docket No. EC14- -000
APPLICATION UNDER SECTION 203 OF THE FEDERAL POWER ACT
PREPARED DIRECT TESTIMONY AND EXIDBITS OF WILLIAM H. HIERONYMUS AND DAVID HUNGER
ON BEHALF OF APPLICANTS
I, David Hunger, Ph.D., being duly sworn, depose and state that the foregoing Declaration on
behalf of the Wisconsin Energy Corporation and Integrys Energy Group, Inc.is true, correct,
accurate, and complete to the best of my knowledge, information, and belief .
.. ". "', .' \ y. c ~ ". ",'" <. ~i' / ~ '. 't-~y Pi/.": ;~"" _,.r ~> 0' ~\ -p \ . __ EXP. ...... •
: ...... "... s . • •
\
·.3-14-1019j ,~, ~';$ *. (J\.I': .••••• .."" ,Ilfj
II ..f>1. ....... ~"fPJ ; era,
'~.Q,£ . BED AND SWO~ before me this fl day of ' 2014
f!ttW (}. &fiil5 Notary Public Q . J /
My commission expires: [I./J1../! / I; :;2..tJ /9 ;:r 7
Ex.-WEC-Hunger-2 Page 43 of 71

Exhibit No. J-1
41
EXHIBITS
Exhibit J-1 Testimony
Exhibit J-2 Resume of William H. Hieronymus
Exhibit J-3 Resume of David Hunger
Exhibit J-4 Wisconsin Energy Generation
Exhibit J-5 Integrys Energy Generation
Ex.-WEC-Hunger-2 Page 44 of 71

1
William H. Hieronymus Vice President
Ph.D. Economics University of Michigan
M.A. Economics
University of Michigan
B.A. Social Sciences
University of Iowa
William Hieronymus has consulted extensively to managements of electricity and gas companies, their counsel, regulators, and policymakers. His principal areas of concentration are the economics, structure and regulation of network utilities and associated management, policy, and regulatory issues. Dr.
Hieronymus has spent the last twenty-five years working on the restructuring and privatization of utility systems in the U.S. and internationally. In this context he has assisted the managements of energy companies on corporate and regulatory strategy, particularly relating to asset acquisition and divestiture.
He has testified extensively on regulatory policy issues and on market power issues related to market design, mergers and acquisitions and claims of market manipulation. In his nearly forty years of consulting to this sector, he also has performed a number of more specific functional tasks, including
analyzing potential investments; assisting in negotiation of power contracts, tariff formation, demand forecasting, and fuels market forecasting. Dr. Hieronymus has testified frequently on behalf of energy sector clients before regulatory bodies, federal courts, arbitrators and legislative bodies in the United
States, the United Kingdom and Australia. He has contributed to numerous projects, including the following:
ELECTRICITYSECTORSTRUCTURE,REGULATION,AND
RELATEDMANAGEMENTANDPLANNINGISSUES
U.S. Market Restructuring Assignments
Dr. Hieronymus has served as an advisor to the senior executives of electric utilities on restructuring and related regulatory issues, and he has worked with senior management in developing strategies
for shaping and adapting to the emerging competitive market in electricity. Related to some of these assignments, he has testified before state agencies on regulatory policies and on contract and asset valuation.
Ex.-WEC-Hunger-2 Page 45 of 71

2
For utilities seeking merger approval, Dr. Hieronymus has prepared and testified to market power analyses at FERC and before state commissions. He also has assisted in discussions with the Antitrust Division of the Department of Justice and in responding to information requests. The
mergers on which Dr. Hieronymus has testified include both electricity mergers and combination mergers involving electricity and gas companies. Among the major mergers on which he has testified are Duke-Progress, Duke-Cinergy, NSTAR-Northeast Utilities, First Energy-Allegheny
Sempra (Enova and Pacific Enterprises), Xcel (New Century Energy and Northern States Power), Exelon (Commonwealth Edison and Philadelphia Electric), AEP (American Electric Power and Central and Southwest), Dynegy-Illinois Power, Con Edison-Orange and Rockland, Dominion-
Consolidated Natural Gas, NiSource-Columbia Energy, E-on-PowerGen/LG&E and NYSEG-RG&E, Iberdrola-Energy East, Texas Energy Futures-TXU, GDF/Suez-FirstLight and MacQuarie-Puget Sound and Fortis Energy-NUS (Tucson Electric). He also submitted testimony in mergers that were
terminated, usually for unrelated reasons, including Exelon-NRG, EEG (Exelon and PSEG), Constellation-FPL Energy, Entergy-Florida Power and Light, Northern States Power and Wisconsin Energy, KCP&L and Utilicorp and Consolidated Edison-Northeast Utilities. Testimony on similar
topics has been filed for a number of smaller utility mergers and for numerous asset acquisitions. Dr. Hieronymus has also assisted numerous clients in the pre-merger screening of potential acquisitions and merger partners.
For utilities seeking to establish or extend market rate authority, Dr. Hieronymus has provided scores of analyses concerning market power in support of submissions under Sections 205 and/or 206 of the Federal Power Act.
For utilities and power pools engaged in restructuring activities, he has assisted in examining various facets of proposed reforms. Such analysis has included features of the proposals affecting market efficiency and revenue adequacy and those that have potential consequences for market power.
Where relevant, the analysis also has examined the effects of alternative reforms on the market performance, and achievement of the client’s objectives. In some cases, these analyses have led to testimony and/or participation in stakeholder processes.
For a group of generation companies in ERCOT, he developed potential changes in the energy market structure and forecasts of the effects of such changes on prices in the market and on the revenues earned by new generators. For another company he led a study assessing the impact of a
more reliable system arising from adoption of a capacity market on the Texas economy. For another major generation owner he testified concerning the impacts of relaxation of restrictions on its bidding behavior on market prices and market revenue adequacy. For yet another company, he led
analyses and testified respecting the need for a capacity market to supplement the ERCOT energy market in PUCT Project 400000.
For a group of generation owners in PJM, he is assisting in developing analyses, filings and
testimony concerning changes needed to make the capacity market revenue adequate. The issues addressed include participation requirements for imports and demand-side resources, the need for measures to assure adequate winter supplies and needed changes in the capacity market design.
Ex.-WEC-Hunger-2 Page 46 of 71

3
For generators and marketers, Dr. Hieronymus has testified extensively on market power and market manipulation. Current and past assignments include analysis of (and in some cases testimony concerning) market manipulation on electricity trading platforms and in electricity physical product
markets, allegations of market power arising from agency and partnering arrangements with other suppliers, economic withholding in capacity markets and the use of contracts to gain leverage to increase profits from such withholding. Some of this testimony related to the electricity crisis in the
WECC that occurred during the period May 2000 through May 2001 and took place in various dockets over the following decade. His testimony concerning this period covered, inter alia, the economics of long term contracts entered into during that period the behavior of market participants
during the crisis period and the nexus between purportedly dysfunctional spot markets and forward contracts. He also provided testimony and other regulatory support in dockets concerned with economic and physical withholding, partnership arrangements and bidding and scheduling practices
potentially in violation of the California ISO tariff and/or FERC anti-manipulation policies. He also has testified concerning market power and market manipulation in East Coast markets and concerning damages arising from potential manipulation of outage schedules in a Canadian market.
In connection with a major investigation of alleged market manipulation by a trading house he directed a number of analyses of the firms incentives to engage in manipulative behavior and on the market impact of its alleged actions.
For the New England Power Pool (NEPOOL), Dr. Hieronymus examined the issue of market power in connection with NEPOOL’s movement to market-based pricing for energy, capacity, and ancillary services. He also assisted the New England utilities in preparing their market power mitigation
proposal. The main results of his analysis were incorporated in NEPOOL’s market power filing before FERC and in ISO-New England’s market power mitigation rules.
For a coalition of independent generators, he provided affidavits advising FERC on changes to the
rules under which the northeastern U.S. power pools operate.
For both utilities and generators he has testified on a number of occasions on market mitigation rules for the New York City load pocket and their relationship to policy goals such as market-based entry.
Currently, he is assisting a coalition of major utilities in both the FERC generic inquiry into capacity markets and the reform of aspects of the PJM market rules
Valuation of Utility Assets in North America
Dr. Hieronymus has testified in state securitization and stranded cost quantification proceedings,
primarily in forecasting the level of market prices that should be used in assessing the future revenues and the operating contribution earned by the owner of utility assets in energy and capacity markets. The market price analyses are tailored to the specific features of the market in which a
utility will operate and reflect transmission-constrained trading over a wide geographic area. He also has testified in rebuttal to other parties’ testimony concerning stranded costs, and has assisted companies in internal stranded cost and asset valuation studies.
He was the primary valuation witness on behalf of a western utility in an arbitration proceeding concerning the value of a combined cycle plant coming off lease that the utility wished to purchase.
He assisted a bidder in determining the commercial terms of plant purchase offers as well as
assisting clients in assessing the regulatory feasibility of potential acquisitions and mergers.
Ex.-WEC-Hunger-2 Page 47 of 71

4
He has testified concerning the value of terminated long-term contracts in connection with contract defaults by bankrupt power marketers and merchant generators.
In connection with the Western U.S. long term contracts proceeding, he testified with respect to
benchmarking of contracts and to the relationship between market prices and long run marginal costs of new generation.
Other U.S. Utility Engagements
In an arbitration proceeding, Dr. Hieronymus testified with respect to contract terms relating to
security provisions for repaying front-end loaded contract payments.
Dr. Hieronymus has contributed to the development of several benchmarking analyses for U.S. utilities. These have been used in work with clients to develop regulatory proposals, set cost
reduction targets, restructure internal operations, and assess merger savings.
Dr. Hieronymus was a co-developer of a market simulation package tailored to region-specific applications. He teamed to conduct numerous multi-day training sessions using the package to help
utility clients in educating management regarding the consequences of wholesale and retail deregulation and in developing the skills necessary to succeed in this environment.
He has made numerous presentations to U.S. utility managements regarding overseas electricity
systems and market restructuring.
In connection with nuclear generating plants then-nearing completion, he has testified in Pennsylvania, Louisiana, Arizona, Illinois, Missouri, New York, Texas, Arkansas, New Mexico, and
before the Federal Energy Regulatory Commission regarding plant-in-service rate cases on the issues of equitable and economically efficient treatment of plant costs for tariff-setting purposes, regulatory treatment of new plants in other jurisdictions, the prudence of past system planning
decisions and assumptions, performance incentives, and the life-cycle costs and benefits of the units. In these and other utility regulatory proceedings, Dr. Hieronymus and his colleagues have provided extensive support to counsel, including preparation of interrogatories, cross-examination
support, and assistance in writing briefs.
On behalf of utilities in the states of Michigan, Massachusetts, New York, Maine, Indiana, Pennsylvania, New Hampshire, and Illinois, he has submitted testimony in regulatory proceedings on
the economics of completing nuclear generating plants that were then under construction. His testimony has covered the likely cost of plant completion; forecasts of operating performance; and extensive analyses of the impacts of completion, deferral, and cancellation upon ratepayers and
shareholders. For the senior managements and boards of utilities engaged in nuclear plant construction, Dr. Hieronymus performed analyses to inform strategic decisions concerning the continuance of construction.
For an eastern Pennsylvania utility that suffered a nuclear plant shutdown due to NRC sanctions relating to plant management, he filed testimony regarding the extent to which replacement power cost exceeded the costs that would have occurred but for the shutdown.
For a major Midwestern utility, Dr. Hieronymus headed a team that assisted senior management in devising its strategic plans, including examination of such issues as plant refurbishment/life extension strategies, impacts of increased competition, and available diversification opportunities.
Ex.-WEC-Hunger-2 Page 48 of 71

5
On behalf of two West Coast utilities, Dr. Hieronymus testified in a needs certification hearing for a major coal-fired generation complex concerning the economics of the facility relative to competing sources of power, particularly unconventional sources and demand reductions.
For a large western combination utility, he participated in a major 18-month effort to provide the client with an integrated planning and rate case management system.
For two Midwestern utilities, Dr. Hieronymus prepared an analysis of intervenor-proposed
modifications to the utilities' resource plans. He then testified on their behalf before a legislative committee.
U.K. Assignments (Primarily 1988-1994)
Following promulgation of the white paper that established the general framework for privatization of
the electricity industry in the United Kingdom, Dr. Hieronymus participated extensively in the task forces charged with developing the new market system and regulatory regime. His work on behalf of the Electricity Council and the twelve regional distribution and retail supply companies focused on
the proposed regulatory regime, including the price cap and regulatory formulas, and distribution and transmission use of system tariffs. He was an active participant in industry-government task forces charged with creating the legislation, regulatory framework, initial contracts, and rules of the pooling
and settlements system. He also assisted the regional companies in the valuation of initial contract offers from the generators, including supporting their successful refusal to contract for the proposed nuclear power plants that subsequently were canceled as being non-commercial.
During the preparation for privatization, Dr. Hieronymus assisted several individual U.K. electricity companies in understanding the evolving system, in developing use of system tariffs, and in enhancing commercial capabilities in power purchasing and contracting. He continued to advise a
number of clients, including regional companies, power developers, large industrial customers, and financial institutions on the U.K. power system for a number of years after privatization.
Dr. Hieronymus assisted four of the regional electricity companies in negotiating equity ownership
positions and developing the power purchase contracts for a 1,825 megawatt combined cycle gas station. He also assisted clients in evaluating other potential generating investments including cogeneration and non-conventional resources.
Dr. Hieronymus also has consulted on the separate reorganization and privatization of the Scottish electricity sector. Part of his role in that privatization included advising the larger of the two Scottish companies and, through it, the Secretary of State on all phases of the restructuring and privatization,
including the drafting of regulations, asset valuation, and company strategy.
He assisted one of the Regional Electricity Companies in England and Wales in the 1993 through 1995 regulatory proceedings that reset the price caps for its retailing and distribution businesses.
Included in this assignment was consideration of such policy issues as incentives for the economic purchasing of power, the scope of price control, and the use of comparisons among companies as a basis for price regulation. Dr. Hieronymus’s model for determining network refurbishment needs was
used by the regulator in determining revenue allowances for capital investments.
He assisted one of the Regional Electricity Companies in its defense against a hostile takeover, including preparation of its submission to the Cabinet Minister who had the responsibility for
determining whether the merger should be referred to the competition authority.
Ex.-WEC-Hunger-2 Page 49 of 71

6
In 2013 he was principal author of a paper submitted to OFGEM in its “RPI-X at 25” inquiry, suggesting changes in how rates are regulated.
Also I 2013 he participated, along with others at CRA in an analysis of market power issues
concerning the upcoming forward capacity market.
Assignments Outside of the U.S. and U.K.
Dr. Hieronymus testified before the federal court of Australia concerning the market power implications of acquisition of a share of a large coal-fired generating facility by a large retail and
distribution company.
For the European Bank for Reconstruction and Development, he performed analyses of least-cost power options and evaluated the return on a major investment that the Bank was considering for a
partially completed nuclear plant in Slovakia. Part of this assignment involved developing a forecast of electricity prices, both in Eastern Europe and for potential exports to the West.
For the OECD he performed a study of energy subsidies worldwide and the impact of subsidy
elimination on the environment, particularly on greenhouse gases.
For the Magyar Villamos Muvek Troszt, the electricity company of Hungary, Dr. Hieronymus developed a contract framework to link the operations of the different entities of an electricity sector
in the process of moving from a centralized command- and-control system to a decentralized, corporatized system.
For Iberdrola, the largest investor-owned Spanish electricity company, he assisted in development of
its proposal for a fundamental reorganization of the electricity sector, its means of compensating generation and distribution companies, its regulation, and the phasing out of subsidies. He also has assisted the company in evaluating generation expansion options and in valuing offers for imported
power.
Dr. Hieronymus contributed extensively to a project for the Ukrainian Electricity Ministry, the goal of which was to reorganize the Ukrainian electricity sector and prepare it for transfer to the private
sector and the attraction of foreign capital.
At the request of the Ministry of Power of the USSR, Dr. Hieronymus participated in the creation of a seminar on electricity restructuring and privatization. The seminar was given for 200 invited
Ministerial staff and senior managers for the USSR power system. His specific role was to introduce the requirements and methods of privatization. Subsequent to the breakup of the Soviet Union, Dr. Hieronymus continued to advise both the Russian energy and power ministry and the government-
owned generation and transmission company on restructuring and market development issues.
On behalf of a large continental electricity company, Dr. Hieronymus analyzed the proposed directives from the European Commission on gas and electricity transit (open access regimes) and
on the internal market for electricity. The purpose of this assignment was to forecast likely developments in the structure and regulation of the electricity sector in the common market and to assist the client in understanding their implications.
For the electric utility company of the Republic of Ireland, he assessed the likely economic benefit of building an interconnector between Eire and Wales for the sharing of reserves and the interchange of power.
Ex.-WEC-Hunger-2 Page 50 of 71

7
For a task force representing the Treasury, electricity generating, and electricity distribution industries in New Zealand, Dr. Hieronymus undertook an analysis of industry structure and regulatory alternatives for achieving the economically efficient generation of electricity. The analysis
explored how the industry likely would operate under alternative regimes and their implications for asset valuation, electricity pricing, competition, and regulatory requirements.
TARIFFDESIGNMETHODOLOGIES
ANDPOLICYISSUES
Dr. Hieronymus participated in a series of studies for the National Grid Company of the United Kingdom and for Scottish Power on appropriate pricing methodologies for transmission, including
incentives for efficient investment and location decisions.
For a U.S. utility client, he directed an analysis of time-differentiated costs based on accounting concepts. The study required selection of rating periods and allocation of costs to time periods and
within time periods to rate classes.
For EPRI, Dr. Hieronymus directed a study that examined the effects of time-of-day rates on the level and pattern of residential electricity consumption.
For the EPRI-NARUC Rate Design Study, he developed a methodology for designing optimum cost-tracking block rate structures.
On behalf of a group of co-generators, Dr. Hieronymus filed testimony before the Energy Select
Committee of the UK Parliament on the effects of prices on cogeneration development.
For the Edison Electric Institute (EEI), he prepared a statement of the industry's position on proposed federal guidelines regarding fuel adjustment clauses. He also assisted EEI in responding to the U.S.
Department of Energy (DOE) guidelines on cost-of-service standards.
For private utility clients, Dr. Hieronymus assisted in the preparation both of their comments on draft FERC regulations and of their compliance plans for PURPA Section l33.
For a state utilities commission, Dr. Hieronymus assessed its utilities' existing automatic adjustment clauses to determine their compliance with PURPA and recommended modifications.
For DOE, he developed an analysis of automatic adjustment clauses currently employed by electric
utilities. The focus of this analysis was on efficiency incentive effects.
For the commissioners of a public utility commission, Dr. Hieronymus assisted in preparation of briefing papers, lines of questioning, and proposed findings of fact in a generic rate design
proceeding.
Ex.-WEC-Hunger-2 Page 51 of 71

8
SALESFORECASTINGMETHODOLOGIES
FORGASANDELECTRICUTILITIES
For the White House Sub-Cabinet Task Force on the future of the electric utility industry, Dr.
Hieronymus co-directed a major analysis of "least-cost planning studies" and "low-growth energy futures." That analysis was the sole demand-side study commissioned by the task force, and it formed a basis for the task force's conclusions concerning the need for new facilities and the relative
roles of new construction and customer side-of-the-meter programs in utility planning.
For a large eastern utility, Dr. Hieronymus developed a load forecasting model designed to interface with the utility's revenue forecasting system-planning functions. The model forecasts detailed
monthly sales and seasonal peaks for a 10-year period.
For DOE, he directed development of an independent needs assessment model for use by state public utility commissions. This major study developed the capabilities required for independent
forecasting by state commissions and provided a forecasting model for their interim use.
For state regulatory commissions, Dr. Hieronymus has consulted in the development of service area-level forecasting models of electric utility companies.
For EPRI, he authored a study of electricity demand and load forecasting models. The study surveyed state-of-the-art models of electricity demand and subjected the most promising models to empirical testing to determine their potential for use in long-term forecasting.
For a Midwestern electric utility, he provided consulting assistance in improving the client’s load forecast, and testified in defense of the revised forecasting models.
For an East Coast gas utility, Dr. Hieronymus testified with respect to sales forecasts and provided
consulting assistance in improving the models used to forecast residential and commercial sales.
OTHERSTUDIESPERTAININGTO
REGULATEDANDENERGYCOMPANIES
For the owner of a proposed LNG terminal, Dr. Hieronymus testified with respect to market power relating to the terminal and associated transmission. Relying substantially on his testimony FERC concluded that such terminals generically should be treated as equivalent to wellhead gas and hence
should not be price regulated.
For two gas distribution utilities with overlapping franchise areas, Dr. Hieronymus testified concerning the impact of the merger on competition to serve customers and whether the loss of such
competition was in the public interest.
Ex.-WEC-Hunger-2 Page 52 of 71
9
In a number of antitrust and regulatory matters, Dr. Hieronymus has performed analyses and litigation support tasks. These cases have included Sherman Act Section 1 and 2 allegations, contract negotiations, generic rate hearings, ITC hearings, and a major asset valuation suit. In a
major antitrust case, he testified with respect to the demand for business telecommunications services and the impact of various practices on demand and on the market share of a new entrant. For a major electrical equipment vendor, Dr. Hieronymus testified on damages with respect to
alleged defects and associated fraud and warranty claims. In connection with mergers for which he is the market power expert, Dr. Hieronymus assists clients in Hart-Scott-Rodino investigations by the Antitrust Division of the U.S. Department of Justice and the Federal Trade Commission. In an
arbitration case, he testified as to changed circumstances affecting the equitable nature of a contract. In a municipalization case, he testified concerning the reasonable expectation period for the supplier of power and transmission services to a municipality. In two Surface Transportation
Board proceedings, he testified on the sufficiency of product market competition to inhibit the exercise of market power by railroads transporting coal to power plants.
For one owner of the Trans-Alaskan Pipeline, he submitted testimony to FERC in 2010 concerning
cost pooling and related issues of cost and revenue allocation among co-owner.
For a landholder, Dr. Hieronymus examined the feasibility and value of an energy conversion project that sought a long-term lease. The analysis was used in preparing contract negotiation strategies.
For an industrial client considering development and marketing of a total energy system for cogeneration of electricity and low-grade heat, Dr. Hieronymus developed an estimate of the potential market for the system by geographic area.
For the U.S. Environmental Protection Agency (EPA), he was the principal investigator in a series of studies that forecasted future supply availability and production costs for various grades of steam and metallurgical coal to be consumed in process heat and utility uses.
Dr. Hieronymus has been an invited speaker at numerous conferences on such issues as market power, industry restructuring, utility pricing in competitive markets, international developments in utility structure and regulation, risk analysis for regulated investments, price squeezes, rate design, forecasting customer
response to innovative rates, intervener strategies in utility regulatory proceedings, utility deregulation, and utility-related opportunities for investment bankers.
Prior to rejoining CRA in June 2001, Dr. Hieronymus was a Member of the Management Group at PA
Consulting, which acquired Hagler Bailly, Inc. in October 2000. He was a Senior Vice President of Hagler Bailly. In 1998, Hagler Bailly acquired Dr. Hieronymus’s former employer, Putnam, Hayes & Bartlett, Inc. He was a Managing Director at PHB. He joined PHB in 1978. From 1973 to 1978 he was a Senior
Research Associate and Program Manager for Energy Market Analysis at CRA. Previously, he served as a project director at Systems Technology Corporation and as an economist while serving as a Captain in the U.S. Army.
Ex.-WEC-Hunger-2 Page 53 of 71

David Hunger Vice President
PhD, Economics University of Oregon
MS, Economics
University of Oregon
BA, Mathematics University of Massachusetts, Boston
David Hunger is Vice President with the Energy Practice of CRA. Formerly a senior economist at the Federal Energy Regulatory Commission (FERC), Dr. Hunger is an expert in energy market merger analysis and market rate matters, as well as energy and capacity market rules in the FERC-regulated Regional Transmission Organizations. For fourteen years at FERC, he led analyses involving mergers and other corporate transactions, market power in market-based rates cases, affiliate transactions, investigations of market manipulation in electricity and natural gas markets, demand response compensation, compliance cases for capacity and energy market rules in Regional Transmission Organizations, and competition issues in electricity markets.
Since 2001, Dr. Hunger has been an affiliated professor at the Georgetown Public Policy Institute where he teaches microeconomic theory, energy policy, and advises on energy-related thesis projects. His research interests include energy and capacity market design, market power in energy markets, and energy policy. He frequently speaks on energy market issues and publishes articles on energy economics and policy; and has an extensive network of relationships inside and outside the government and academia.
Experience
2013 - Present Vice President, Charles River Associates
1999–2013 Federal Energy Regulatory Commission
Senior Economist, Office of Energy Policy and Innovation (OEPI) (2010–2013)
Deputy Director, Division of Electric Power Regulation – West (2008–2010)
Supervisory Energy Industry Analyst (2006–2008)
Senior Economist (2003–2006)
Economist (1999–2003)
During his time at FERC, Dr. Hunger led analyses involving: the effect on competition in mergers and other corporate transactions; market power in market-based rates cases; rules regarding affiliate transactions; market manipulation in electricity and natural gas markets, demand response compensation, compliance cases for Regional Transmission Organizations (OEPI lead for energy market compliance cases in California ISO, Midwest ISO, ISO-New England, New York ISO, SPP and PJM; worked on capacity
Ex.-WEC-Hunger-2 Page 54 of 71

David Hunger Charles River Associates Page 2
market compliance cases for ISO-NE and PJM); and competition issues in electricity markets. Dr. Hunger was the technical lead on FERC Order No. 707 (Affiliate Transactions, 2007); Supplemental Merger Policy Statement (2007); and Order No. 745 (Demand Response Compensation, 2012).
Dr. Hunger has worked on market design issues in each of the FERC-regulated RTO’s, for example:
CAISO – Tariff amendments related to pricing of spinning and non-spinning reserves; virtual bidding at the CAISO/WECC interties;
NYISO – design of Net Benefits Test for demand response compensation;
ISO-NE - rules for compensating behind-the-meter generators in energy, capacity, and ancillary services markets; capacity market design regarding resource retirements; demand curve design; and exemption for renewable resources;
PJM – tariff language for integrating DR resources into the PJM dispatch process for Order No. 745 compliance; capacity market tariff revisions related to demand response, imports, and incremental auctions;
MISO – product definition for energy resources to include demand response resources; design of Net Benefits Test for demand response compensation;
SPP – cost allocation for demand response compensation in the SPP energy imbalance market
2012 –Present Adjunct Professor, Penn State University
Energy Business and Finance – Energy and Environmental Economics
2001–Present Affiliated Professor, Georgetown University, Graduate Public Policy Institute
Classes taught: Microeconomic Theory, Energy Policy, Public Finance, Macroeconomics, and Master’s Thesis advising.
2000–2001 Adjunct Assistant Professor of Economics, American University
Classes taught: Principles of Microeconomics and Principles of Macroeconomics
1998–1999 Assistant Professor of Economics, Oglethorpe University
Classes taught: Managerial Economics and International Economics (MBA); Principles of Economics, Intermediate Microeconomics, Macroeconomics, International Economics and Industrial Organization (undergraduate)
Ex.-WEC-Hunger-2 Page 55 of 71

David Hunger Charles River Associates Page 3
1994–1998 Graduate Teaching Fellow, Department of Economics, University of Oregon
Classes taught: Econometrics, Industrial Organization, and Principles of Microeconomics
Filed Testimony
Petition for Determination Of Cost Effective Generation Alternative To Meet Need Prior to 2018, by
Duke Energy Florida, Inc. Docket No. 140111-EI A Testimony on behalf of Calpine Construction Finance Company, L.P.; before the Florida Public Service Commission. July, 2014
ISO-New England Inc. and New England Power Pool Participants Committee. Docket No. ER14-
1639-000. Affidavit in Support of Brookfield Energy Marketing LP’s Answer to the ISO-NE Answer, related to MOPR exemption for renewables in the ISO-Ne Forward Capacity Market, before the Federal Energy Regulatory Commission. May, 2014.
Protest of the New England Power Generators Association, Inc. and the Electric Power Supply
Association. Docket No. ER14-1639-000. Affidavit in Support of Protest by NEPGA and EPSA regarding Minimum Offer Price Rules exemptions in the ISO-NE Forward Capacity Market, before the Federal Energy Regulatory Commission. April, 2014.
Revisions to the PJM Open Access Transmission Tariff and Reliability Assurance Agreement
Among Load Serving Entities in the PJM Region to Limit and Protect Against Speculative Offers
Submitted in RPM Auctions. Docket No. ER14-1461-000. Affidavit in Support of Comments by American Electric Power, Duke Energy Ohio, First Energy Corp, Dayton Power & Light, and East Kentucky Electric Cooperative, before the Federal Energy Regulatory Commission. March, 2014.
Southwest Power Pool, Inc. Docket Nos. ER14-1174-000 and EL14-21-000 .Affidavit in Support of Comments of the Southwest Power Pool Transmission Owners, before the Federal Energy Regulatory Commission, February, 2014.
Complaint by New England Power Generators Association, Inc. v. ISO-NE, Inc. Respondent. Docket No. EL14-17. Affidavit in Support of Complaint by New England Power Generators Association regarding non-price retirement rules in the ISO-NE Forward Capacity Market, before the Federal Energy Regulatory Commission, January, 2014.
Limited and Sub-Annual DR Resources filing submitted by PJM Interconnection, L.L.C. Docket No. ER14-504. Affidavit in support of Reply Comments by American Electric Power, Duke Energy Ohio, First Energy Corp, Dayton Power & Light, East Kentucky Electric Cooperative, and PPL Companies before the Federal Energy Regulatory Commission, January, 2014.
Capacity Imports Filing submitted by PJM Interconnection, L.L.C. Docket No. ER14-503. Affidavit in support of Reply Comments by American Electric Power, Duke Energy Ohio, First Energy Corp., Dayton Power & Light, East Kentucky Electric Cooperative, and PPL Companies before the Federal Energy Regulatory Commission, January, 2014.
Ex.-WEC-Hunger-2 Page 56 of 71

David Hunger Charles River Associates Page 4
Limited and Sub-Annual DR Resources filing submitted by PJM Interconnection, L.L.C. Docket No. ER14-504. Affidavit in support of filing by American Electric Power, Duke Energy Ohio, First Energy Corp, Dayton Power & Light, East Kentucky Electric Cooperative, and PPL Companies before the Federal Energy Regulatory Commission, December, 2013.
Capacity Imports Filing submitted by PJM Interconnection, L.L.C. Docket No. ER14-503. Affidavit in support of filing by American Electric Power, Duke Energy Ohio, First Energy Corp., Dayton Power & Light, East Kentucky Electric Cooperative, and PPL Companies before the Federal Energy Regulatory Commission, December, 2013.
Demand Response Sell Offer Plan Filing submitted by PJM Interconnection, L.L.C. Docket No. ER13-2108. Affidavit in support of filing by American Electric Power, Duke Energy Ohio, First Energy Corp., and Dayton Power & Light before the Federal Energy Regulatory Commission, December, 2013.
Statement of David Hunger In the Matter of PJM Up-to Congestion Transactions, Federal Energy
Regulatory Commission Docket No. IN10-5-000, on Behalf of Powhatan Energy Fund, October 2013.
Reports and publications
“Analyzing Gas and Electric Convergence Mergers: A Supply Curve is Worth a Thousand Words.” Journal of Regulatory Economics, vol. 24, no. 2, 2003, pp. 161-173
“Final Report on Price Manipulation in Western Markets: Fact-Finding Investigation of Potential Manipulation of Electric and Natural Gas Prices.” Federal Energy Regulatory Commission Staff Report to the US Congress, March 2003.
“Initial Report on Company –Specific Separate Proceedings; Published Natural Gas Price Data; and Enron Trading Strategies: Fact-Finding Investigation of Potential Manipulation of Electric and Natural Gas Prices.” Federal Energy Regulatory Commission Staff Report to the US Congress, August 2002.
“Determining the Competitiveness of Wholesale Electricity Markets: It Starts with Defining the
Markets.” In Markets, Pricing and Deregulation of Utilities. Michael Crew and Joseph Schuh, eds. Kluwer Academic Publishers, 2002.
“Demand Response in Electricity Markets.” Federal Energy Regulatory Commission Staff Paper, January 2002.
Presentations
“Demand Response Compensation.” Advanced Workshop in Regulation and Competition, Rutgers University Center for Research in Regulated Industries, 21st Annual Western Conference, Monterey, CA, June 2010.
Ex.-WEC-Hunger-2 Page 57 of 71

David Hunger Charles River Associates Page 5
“The Role of Sector-Specific Regulators in Merger Review.” American Bar Association 2009 Fall Forum, November 2009.
“Developing a Sustainable Energy Policy.” Georgetown Public Policy Institute Policy Conference Washington, DC, February 2007.
“Fixing the Natural Gas Price Indices.” US Department of Energy, Electricity Working Group, Washington, DC, March 2005.
“Re-bundling in the Electric Power Industry.” Advanced Workshop in Regulation and Competition, Rutgers University Center for Research in Regulated Industries, 23rd Annual Conference, Skytop, PA, May 2004.
“Manipulation of Natural Gas Price Indexes: Causes, Effects and Solutions.” Advanced Workshop in Regulation and Competition, Rutgers University Center for Research in Regulated Industries, 22nd Annual Conference, Skytop, PA, May 2003.
“The Role of Economics and Economists at the FERC.” Federal Energy Regulatory Commission, Briefing for Indiana University of Pennsylvania, Economics Department, Washington, DC, September 2002.
“Defining Wholesale Electricity Markets.” Advanced Workshop in Regulation and Competition, Rutgers University Center for Research in Regulated Industries, 21st Annual Conference, Newport, RI, May 2002.
“Markets, Pricing and Deregulation of Utilities.” Rutgers University Research Seminar, Newark, NJ, May 2002.
“How FERC Analyzes Markets.” Federal Energy Regulatory Commission, Briefing for Indiana University of Pennsylvania, Economics Department, Washington, DC, October 2001.
“Briefing on Competitive Analysis for the State Development Planning Commission of the People's Republic of China.” Federal Energy Regulatory Commission, Washington, DC, May 2001.
“Electric Utility Mergers Involving Generation and Transmission: It Takes Ability and Incentive.” Advanced Workshop in Regulation and Competition, Rutgers University Center for Research in Regulated Industries, 20th Annual Conference, Tamiment, PA, May 2001.
“Natural Gas and Electricity Mergers: Vertical Restraints or Vertical Market Power.” US Department of Energy, Electricity Working Group, Washington, DC, October 2000.
“Vertical Merger Review at the Federal Energy Regulatory Commission.” International Association for Energy Economics, 21st Annual Conference, Philadelphia, PA, September 2000.
“Gas and Electric Convergence Mergers: A Supply Curve is Worth a Thousand Words.” Advanced Workshop in Regulation and Competition, Rutgers University Center for Research in Regulated Industries, 19th Annual Conference, Lake George, NY, May 2000.
“Pollution Regulation in a Model of International Trade.” Northwest Conference for Environmental Economics, Eugene, OR, May 1999.
Ex.-WEC-Hunger-2 Page 58 of 71

David Hunger Charles River Associates Page 6
“The Adoption of Energy-Saving Technologies in the Electricity Industry.” Advanced Workshop in Regulation and Competition, Rutgers University Center for Research in Regulated Industries, 17th
Annual Conference, Vergennes, VT, May 1998.
“Entry Decisions and Regulatory Distortions in the Electric Power Industry.” Advanced Workshop in Regulation and Competition, Rutgers University Center for Research in Regulated Industries, 16th
Annual Conference, Lake George, NY, May 1997.
“Entry of Non-Utility Generators in the Northwest.” Pacific Northwest Regional Economic Conference, Spokane, WA, April 1997.
Awards and associations
Federal Energy Regulatory Commission, Awards for Quality Service in the Public Interest: December 2000; July 2001; September 2001; September 2002; May 2003; July 2003; September 2003; April 2004; July 2004; September 2004; June 2005; August 2005; January 2006; March 2006; August 2006; May 2007; August 2007; April 2008; July 2008; January 2009; July 2009; February 2010; August 2011; August 2012
University of Oregon - Outstanding Graduate Teaching Award, 1998
Official Scorekeeper – Oglethorpe University Women’s Basketball 1998-1999
Member, American Economic Association
Member, International Association for Energy Economics
Law360 Energy Editorial Advisory Board, 2014
Journal of Regulatory Economics – reviewer
Energy Economics - reviewer
Georgetown Public Policy Institute, Masters Thesis Advising
The Effect of State-Level Funding on Energy Efficiency Outcomes, Annie Downs, 2013.
Diversity of Fuel Sources for Electricity Generation in an Evolving U.S. Power Sector, Janelle G. DiLuccia, 2013.
The Effects of Revenue Decoupling on State-Level Gains in Demand-Side Energy Efficiency, Robert Anders, 2011.
“What Drives Innovation in Renewable Energy Technology? Evidence Based on Patent Count,” Jesse McCormick, 2011.
“Renewable Portfolio Standards and the Growth of Wind Power Capacity in the United States,”
Andrew MacBride, 2008.
“The Effect of State-level Demand-side Management Spending on Aggregate State-level Energy Efficiency,” Stephen Caldwell, 2008.
Ex.-WEC-Hunger-2 Page 59 of 71

David Hunger Charles River Associates Page 7
“Assessing the Real World Air Quality Improvements and Resulting Human Health Benefits Of the US Acid Rain Program: A Feasibility Study,” David Risley, 2008.
“Public Opinion about Climate Change: the Roles of Risk Perception and Scientific Knowledge in Preventing Passivity,” Courtney Brown, 2008.
“Statistical Examination of the Relationship between Return on Equity and Plant Investment for Natural Gas Pipelines,” Adam Pollack, 2007.
“Fuel Excise Taxes and Consumer Gasoline Demand: Comparing Average Retail Price Effects and Gasoline Tax Effects,” William Sauer, 2007.
“GDP Growth, Electricity and Renewable Energy in the Pacific Rim: Can Renewable Energy help developing nations achieve and sustain higher long term growth rates?” Bryan J. Di Pietro, 2007.
“Rate Regulation and Carbon Emissions from US Electric Plants,” Michael Pomorski, 2007.
“An Analysis of the Efficacy of US Greenhouse Gas Emissions Reduction Policy,” Russell Meyer, 2006.
“Wind Energy Cost Reductions: A Learning Curve Analysis with Evidence from the United States, Germany, Denmark, Spain, and the United Kingdom,” Charles Goff, 2006.
“Electricity for the Rural Poor: Limit of Traditional Grid-electricity Services and Implications for Renewable Energy in China,” Hayato Kobayashi, 2004.
“How Does Oil Influence Conflict?” Megan Ellinger, 2004.
“Electricity Generation and Fuel Sources: Does Greater Diversity Reduce Price Volatility?” Timothy Herzog, 2004.
Ex.-WEC-Hunger-2 Page 60 of 71

Exhibit No. J-4
EXHIBIT J-4
Wisconsin Energy Corp. Owned Capacity for Central Region Market Power Study
NERC Region
Control Area Plant Name
Total Capacity (Summer)
(MW)
Ownership Share
Net Interest (MW)
Purchases (Sales)
Uncommitted Summer Capacity
(MW)
MRO US MISO Appleton Hydro 2.2 100% 2.2 0 2.2
MRO US MISO Big Quinnesec 61 4.4 100% 4.4 0 4.4
MRO US MISO Big Quinnesec 92 16.0 100% 16.0 0 16.0
MRO US MISO Blue Sky Green Field Wind Project 145.2 100% 145.2 0 145.2
MRO US MISO Brule 5.3 100% 5.3 0 5.3
MRO US MISO Byron Wind Project 0.2 100% 0.2 0 0.2
MRO US MISO Chalk Hill 7.8 100% 7.8 0 7.8
MRO US MISO Concord (WI) 352.0 100% 352.0 0 352.0
MRO US MISO Elm Road 1,268.0 83% 1,056.8 0 1,056.8
MRO US MISO Germantown 258.0 100% 258.0 0 258.0
MRO US MISO Glacer Hills Wind Park 162.0 100% 162.0 0 162.0
MRO US MISO Hemlock Falls 2.8 100% 2.8 0 2.8
MRO US MISO Kingsford 7.2 100% 7.2 0 7.2
MRO US MISO Michigamme Falls 9.6 100% 9.6 0 9.6
MRO US MISO Milwaukee County 7.0 100% 7.0 0 7.0
MRO US MISO Montfort 30.0 100% 30.0 0 30.0
MRO US MISO Oak Creek 993.0 100% 993.0 0 993.0
MRO US MISO Paris Generating Station 352.0 100% 352.0 0 352.0
MRO US MISO Peavey Falls 12.0 100% 12.0 0 12.0
MRO US MISO Pine 3.6 100% 3.6 0 3.6
MRO US MISO Pleasant Prairie 1,188.0 100% 1,188.0 0 1,188.0
MRO US MISO Port Washington 1,081.6 100% 1,081.6 0 1,081.6
MRO US MISO Presque Isle 344.0 100% 344.0 0 344.0
MRO US MISO Rothschild (WI) 50.0 100% 50.0 0 50.0
MRO US MISO Twin Falls (We Energies) 6.3 100% 6.3 0 6.3
MRO US MISO Valley (WI) 236.0 100% 236.0 0 236.0
MRO US MISO White Rapids 7.2 100% 7.2 0 7.2
MRO US MISO Way Dam 1.8 100% 1.8 0 1.8
Sub-Total 6,553 6,342 0 6,342
Source: Wisconsin Energy, Ventyx
Ex.-WEC-Hunger-2 Page 61 of 71

Exhibit No. J-4
Wisconsin Energy Corp. Contracted Capacity for Central Region Market Power Study
NERC Region
Control Area Plant Name
Summer Purchases
(MW)
Summer Sales (MW)
Net (MW)
MRO US MISO Point Beach - Nuclear units 1,018.0 1,018.0 MRO US MISO Point Beach – CT 15.0 15.0 MRO US MISO Presque Isle (344.0) (344.0) MRO US MISO Whitewater Cogeneration Facility 236.5 236.5 MRO US MISO WPPI Energy (50.0) (50.0) MRO US MISO Madison Gas & Electric (50.0) (50.0) MRO US MISO Cloverland Electric Cooperative (55.0) (55.0) MRO US MISO Great Lakes Utilities (30.0) (30.0) MRO US MISO Ontonagon Rural Electric Cooperative (0.5) (0.5) MRO US MISO Wisconsin Power & Light (4.5) (4.5) MRO US MISO Waste Management – Metro 9.1 9.1 MRO US MISO Waste Management - Omega Hills 13.1 13.1 MRO US MISO Waste Management - Pheasant Run 9.0 9.0 MRO US MISO Waste Management - Deer Track 6.4 6.4
Sub-Total 1,307 (534) 773
Ex.-WEC-Hunger-2 Page 62 of 71

Exhibit No. J-5
EXHIBIT J-5
Integrys Owned Capacity for Central Region Market Power Study
NERC Region
Control Area Plant Name
Total Capacity (Summer)
(MW)
Ownership Share
Net Interest (MW)
Purchases (Sales)
Uncommitted Summer Capacity
(MW)
MRO US MISO Castle Rock 15.0 50% 7.5 0 7.5
MRO US MISO Juneau 12.4 50% 6.2 0 6.2
MRO US MISO Petenwell 20.0 50% 10.0 0 10.0
MRO US MISO Alexander 4.2 100% 4.2 0 4.2
MRO US MISO Caldron Falls 6.4 100% 6.4 0 6.4
MRO US MISO Columbia 1&2 1,103.0 32% 350.8 0 350.8
MRO US MISO DePere EC 164.2 100% 164.2 0 164.2
MRO US MISO Edgewater 4 297.0 32% 94.4 0 94.4
MRO US MISO Fox EC 556.1 100% 556.1 0 556.1
MRO US MISO Grand Rapids 7.5 100% 7.5 0 7.5
MRO US MISO Grandfather Falls 17.2 100% 17.2 0 17.2
MRO US MISO Hat Rapids 1.0 100% 1.0 0 1.0
MRO US MISO High Falls 7.0 100% 7.0 0 7.0
MRO US MISO Johnson Falls 3.5 100% 3.5 0 3.5
MRO US MISO Lincoln 9.0 100% 9.0 0 9.0
MRO US MISO Merrill 2.3 100% 2.3 0 2.3
MRO US MISO Potato Rapids 1.4 100% 1.4 0 1.4
MRO US MISO Pulliam 7&8 209.0 100% 209.0 0 209.0
MRO US MISO Pulliam 31 85.0 100% 85.0 0 85.0
MRO US MISO Sandstone Rapids 3.8 100% 3.8 0 3.8
MRO US MISO Tomahawk 2.6 100% 2.6 0 2.6
MRO US MISO Wausau 5.4 100% 5.4 0 5.4
MRO US MISO West Marinette 153.5 100% 153.5 0 153.5
MRO US MISO Weston Unit 2 76.1 100% 76.1 0 76.1
MRO US MISO Weston Unit 3 323.3 100% 323.3 0 323.3
MRO US MISO Weston Unit 4 536.9 70% 375.8 0 375.8
MRO US MISO Weston 31&32 55.3 100% 55.3 0 55.3
MRO US MISO Crane Creek 99.0 100% 99.0 0 99.0
MRO US MISO Peshtigo 0.6 100% 0.6 0 0.6
MRO US MISO Jersy 0.5 100% 0.5 0 0.5
MRO US MISO Otter 0.4 100% 0.4 0 0.4
Sub-Total 3,779 2,639 0 2,639
Ex.-WEC-Hunger-2 Page 63 of 71

Exhibit No. J-5
Integrys Contracted Capacity for Central Region Market Power Study
NERC Region
Control Area Plant Name
Summer Purchases
(MW)
Summer Sales (MW)
Net (MW)
MRO US MISO Brown County Landfill 2.0 2.0 MRO US MISO Forward Wind Energy Center 57.5 57.5 MRO US MISO Shirley Wind Farm 19.0 19.0 MRO US MISO Manitoba Hydro 108.0 108.0 MRO US MISO Balfour Beatly Infrastructure Partners LP (49.0) (49.0) MRO US MISO Great Lakes Utiilties (15.0) (15.0) MRO US MISO Ontonagon MI (5.0) (5.0) MRO US MISO WPPI Energy (150.0) (150.0)
Sub-Total 187 (219) (32.5)
Ex.-WEC-Hunger-2 Page 64 of 71


