ANALYSIS OF THE PSYCHOGRAPHIC SEGMENTATION FRAMEWORK FOR THE MICE SECTOR IN PUNE Member Name Roll No. Aishwarya Dev 03 Ankit Jha 12 Ashish Kumar 20 Ashwani Singh 22 Deepak Malhan 28 Itee Yadav 36 Member Name Roll No. Mini K.V 43 Pallak Kochhar 49 Rakesh Santosh 52 Samarth Salalpuria 57 Sriju Nair 68 Vivek Sharma 72
Transcript
ANALYSIS OF THE PSYCHOGRAPHIC SEGMENTATION FRAMEWORK FOR
THE MICE SECTOR IN PUNE
Member Name Roll No.
Aishwarya Dev 03
Ankit Jha 12
Ashish Kumar 20
Ashwani Singh 22
Deepak Malhan 28
Itee Yadav 36
Member Name Roll No.
Mini K.V 43
Pallak Kochhar 49
Rakesh Santosh 52
Samarth Salalpuria 57
Sriju Nair 68
Vivek Sharma 72
Date Day count Schedule
January 3, 2014 Day 1 Secondary research on topic
January 4, 2014 Day 2 Discussion on topicPilot study-visit to service providers
January 5, 2014 Day 3 Pilot study-visit to service providers
January 6, 2014 Day 4 Discussion on pilot study conducted
January 7, 2014 Day 5 Frame hypothesis for researchTeams formed and locations for visit decided
January 8, 2014 Day 6 Questionnaire + Fieldwork
January 9, 2014 Day 7 Field work
January 10, 2014 Day 8 Field work+ work status meeting
January 11, 2014 Day 9 Field work
January 12, 2014 Day 10 Field work+ work status meeting
January 13, 2014 Day 11 Data entry
January 14, 2014 Day 12 Data analysis
January 15, 2014 Day 13 Report Making + Presentation
January 16, 2014 Day 14 Documentation
All team members divided in group of two for field work
“Almost 350 billion dollars are spent annually on the MICE market across
the globe.” Ashwini Kakkar , Executive Vice Chairman, Mercury Travels
“In most hotels, approximately 28% to 30% of the volumes come from MICE.”-Rajan Bahadur , Regional general manager , Starwood hotels and resorts
“25% to 30% of the hotel business today is from MICE. Many hotelcompanies look at MICE in a big way when it comes to partnering ormanaging hotels. They consider location, facilities, design and otherelements. A lot of thinking goes into the planning of a successful MICEevent.”-Biswajit chakraborty, General Manager, Movenpick hotel
“Between 1.2 to 1.5 million Indians will travel only for MICE purposes.These might include going abroad, or those who will attend meetings andconferences, exhibitions within India. These 1.2 to 1.5 million people willinduce expenses of more than Rs 5,000 crore or approximately 1 to 1.3billion US dollars.”- Ashwini Kakkar
14 February 2015Psychographic segmentation framework for the MICE sector in Pune 3
1.Selection of topicThe topic selected was to analyse the Psychographic segmentation framework for the MICE Sector in Pune
2.Selection of sampleThe sample respondents for the study were 30 service providers including Hotels, Tours and travels agencies, educational institutes ,convention andexhibition centres. Also for client perspective,90 professionals from different companies availing MICE services in Pune were interviewed. Sample sizetaken was 120.
3.Pilot StudyTo test the feasibility of the research topic, a test questionnaire of 10 questions was prepared. This study was conducted with a sample size of 5respondents by means of stratified random sampling.
4. Data CollectionA) Primary data was collected. A copy of the sample questionnaire used has been presented as appendix.B) Secondary data was collected through the internet, journals.
5. Analysis of DataThe data collected is presented in form of tables and graphs under Results.
14 February 2015Psychographic segmentation framework for the MICE sector in Pune 5
DATA ANALYSIS
28
16
13
7
6
6
5
5
4
0 5 10 15 20 25 30
Manufacturing
IT sector
Consultancy
Education
Pharma
Banking
Insurance
Logistics
Automobile
12
34
56
78
9
BIFURCATION OF CLIENTS
16
5
4
3
2
0 5 10 15 20
Hotel
Education institutes
convention centers
Travel agents
Event…
14
32
5
BIFURCATION OF SERVICE PROVIDER
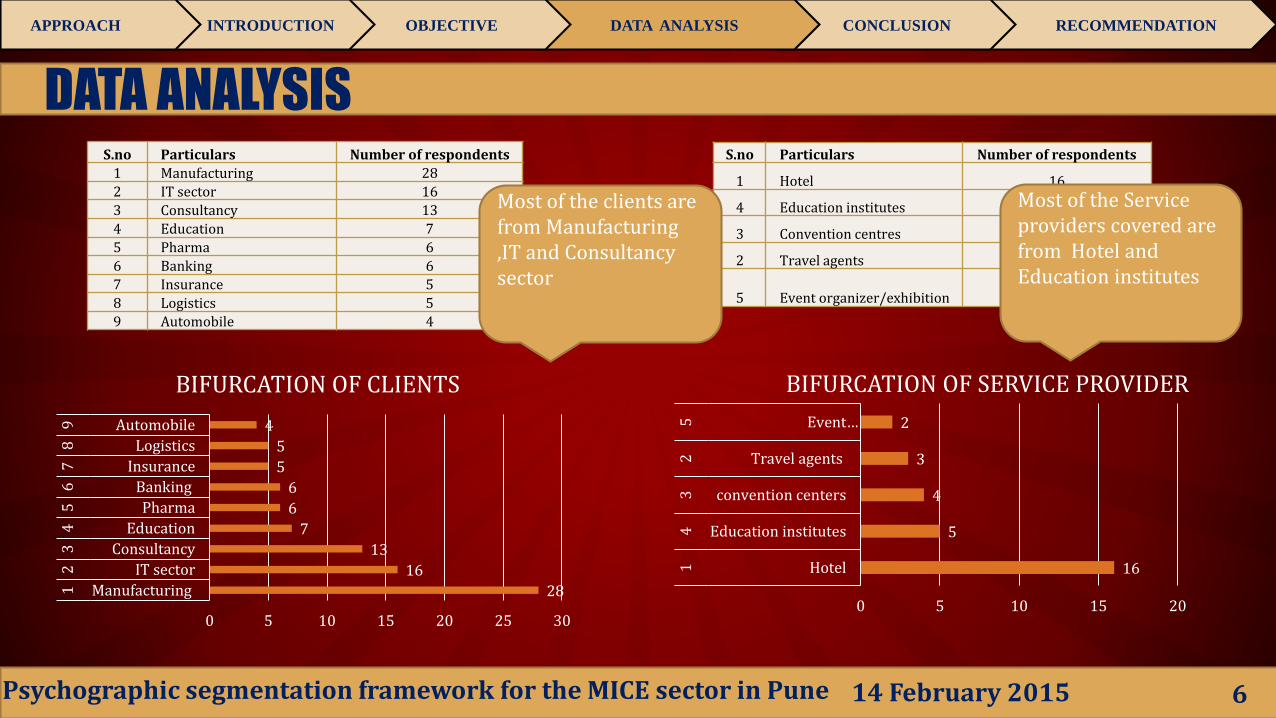
S.no Particulars Number of respondents
1 Manufacturing 28
2 IT sector 16
3 Consultancy 13
4 Education 7
5 Pharma 6
6 Banking 6
7 Insurance 5
8 Logistics 5
9 Automobile 4
S.no Particulars Number of respondents
1 Hotel 16
4 Education institutes 5
3 Convention centres 4
2 Travel agents 3
5 Event organizer/exhibition 2
Most of the clients are from Manufacturing ,IT and Consultancy sector
Most of the Service providers covered are from Hotel and Education institutes
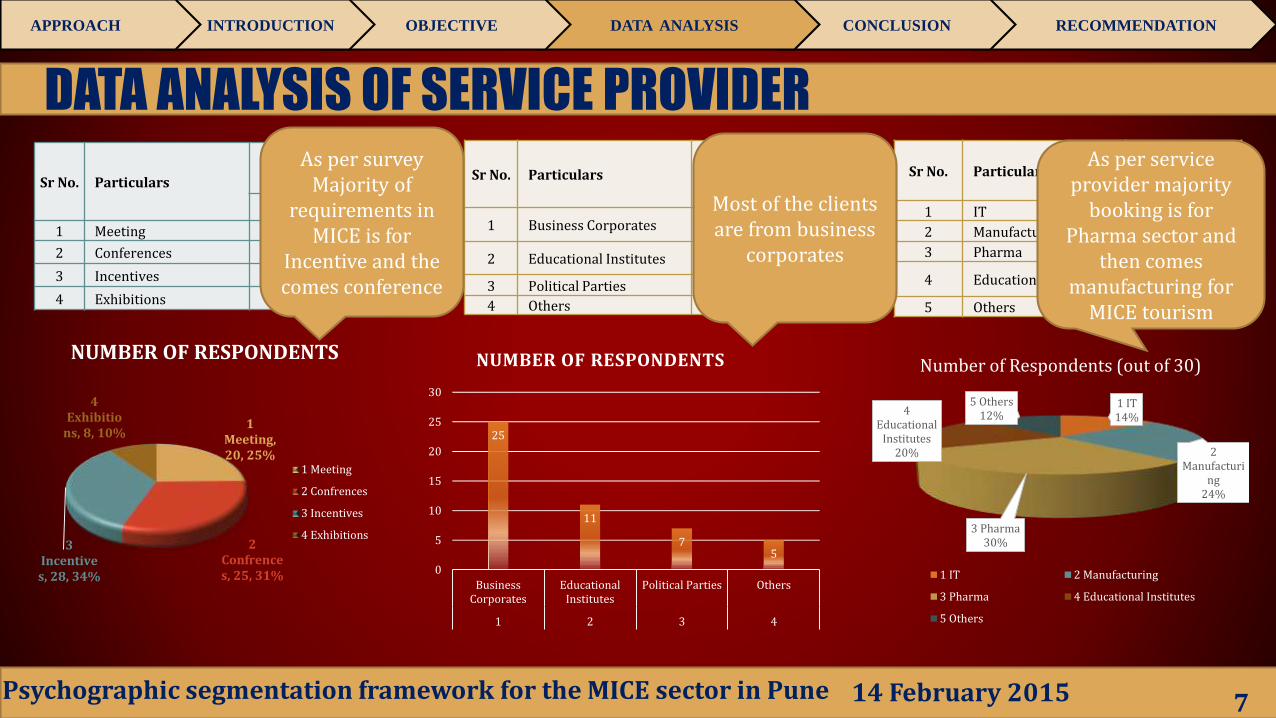
Number of Respondents (out of 30) Sr No. ParticularsNumber of Respondents
(out of 30)
1 Cost effectiveness 17
2 Status of the company 5
3 Value Added Services 13
4 Brand of the Provider 4
5 Location 14
As per service provider in Mice tourism , most ofthe bookings are through Company sales teamsand serving agents
clients deal with the sales team of the serviceprovider at the most followed by the serviceagents and direct calling
Very few of the clients opt for Direct calling(21%) and company portal (11%)
As per service provider cost effectiveness , locationand added service have more importance thanstatus of company and brand of the provider exceptin the case of high rating service provider.
Star companies prefer branded service provider tosustain their status .
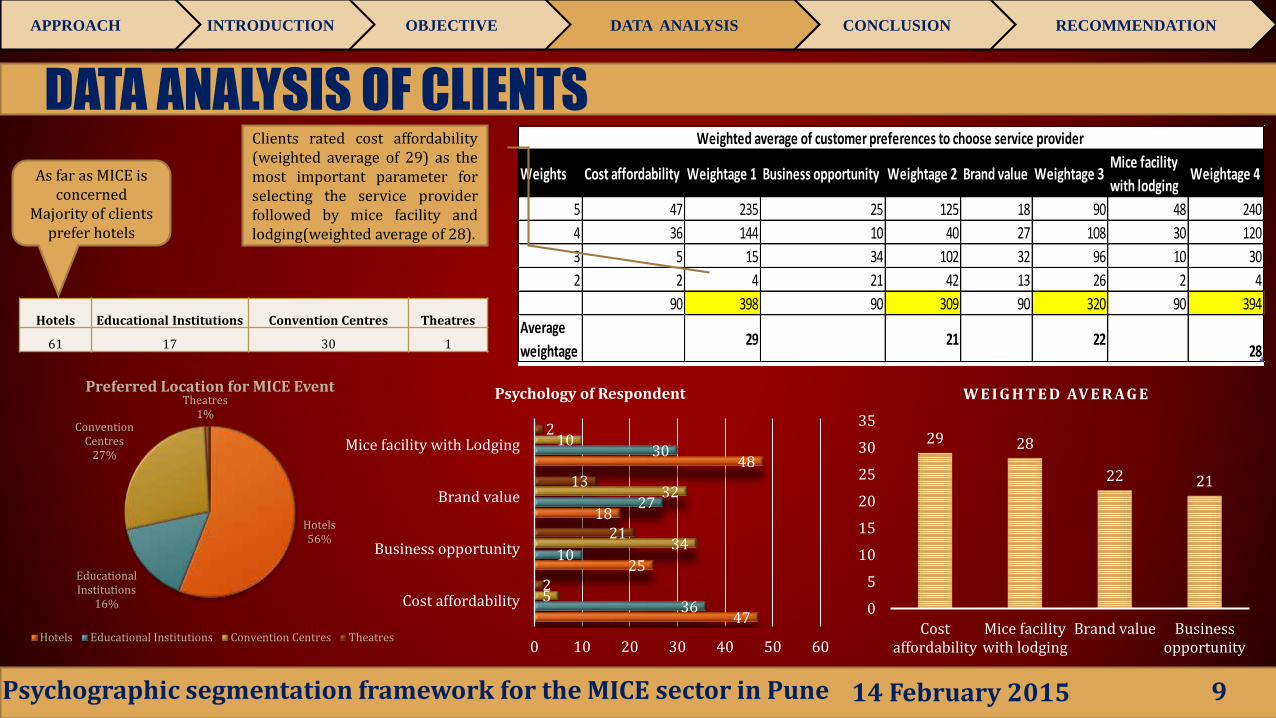
Clients rated cost affordability(weighted average of 29) as themost important parameter forselecting the service providerfollowed by mice facility andlodging(weighted average of 28).
14 February 2015Psychographic segmentation framework for the MICE sector in Pune 9
50 40 35 3010
30 24 20 20 1515
12011090 80 80 75 70 65 60 50 50 50 45 45 40
14
50
12
020406080
100120140
Le
mer
dia
n
Sun
.n.S
and
Th
e P
rid
e…
JW m
arri
ot
Th
e W
esti
n
pan
chra
tna
Ro
yal
orc
hid
Fo
ur
po
ints
Ho
tel S
agar
…
Cen
turi
on
Kap
ila…
Mcc
ai
Qu
alit
y…
TU
I -
Tra
vel
…
Le
Ro
yce…
Oak
wo
od
…
Am
ber
…
rad
isso
n
Kes
ari m
ice
Reg
us
Sym
bio
sis…
QM
TI
SIU
Sym
bio
sis…
Dec
can
…
Sim
s
Sub
izz
Mak
e m
y tr
ip
Wad
hw
a…
Average corporate tie-ups in an year
Convention Centers Educational Institute Event Organizers Hotel Travel agent
Hotels have the maximum average number(50-120) of tie ups in a year followed byconvention centre with an average of (25-50).The least are for exhibitions andeducational centres.
10%
23%
50%
7%
7% 3%
0-6 Months
6-12 Months
1 - 2 years
2 - 3 years
3 - 5 years
5 + years
Sr No. Particulars (tenure
of Tie-up)
Number of
Respondents
Percentage
1 0-6 Months 3 10
2 6-12 Months 7 23
3 1 - 2 years 15 50
4 2 - 3 years 2 7
5 3 - 5 years 2 7
6 5 + years 1 305
10152025
158
2114
Number of Respondents (out of 30)
Number of Respondents (out of 30)
Sr No. Particulars Number of Respondents (out
of 30)
1 Monthly Interactions 15
2 Gifts/ Vouchers 8
3 Emails/News Letters 21
4 Discounts/Offers 14
Loyalty programs/other special offers offeredTenure of tie ups with clients
14 February 2015Psychographic segmentation framework for the MICE sector in Pune 10
14 February 2015Psychographic segmentation framework for the MICE sector in Pune 11
53
2522
0
10
20
30
40
50
60
Very Important Important Neutral
ATTITUDE/ BEHAVIOR/ SERVICE OF SERVICE PROVIDER
It can be concluded that Clients considers various parameter basis which clients choose theservice provider.
The survey also concluded that customers consider cost effectiveness as the most importantparameter for service provider selection.
The above objective 2 proves the hypothesis 1 incorrect which states “Brand image is a primarycriteria for selection of a service provider by the clients”. Hence hypothesis 1 is rejected
The above objective 1 prove hypothesis 2 correct which states that “Value added service andpackage deals offered by service provider acts as a major client puller”. Hence hypothesis 2 isaccepted.
12
Objective 1 –”To study the services provided by the various MICE sector service providers ” and “To study and analyze the service provider’s involvement in customer’s decision.”
Objective 2 –”To Study and analyze the general perception of customers for opting for a specific service and a service provider”
Despite brand image being an effective parameter for attracting clients for MICE sector, it is
crucial for service providers to consider cost effectiveness in their services.
Corporate should seek new destinations for MICE trip beyond traditional destinations and
themes, thereby providing them unique experience
14 February 2015Psychographic segmentation framework for the MICE sector in Pune
Scope of substantial expansion
Pune being one of the major cities and having many site seeing places nearby can build upon attracting
more business customers for incentives. Being one of the IT hubs it can also provides enormous
business opportunities to those business travellers.
Developing Mice tourism In Pune
The Pune MICE market though, in its nascent stage leaves a lot of scope for substantial expansion. it canimprove in its infrastructure and top class facilities to conduct international conferences and meeting.
13
ANNEXURE 1
ORGANIZATION Symbiosis Centre of Education
GROUP CONTACT, DESIGNATION Mr. Sriju Nair
EVENT DATE March 2014 (dates to be intimated)
MINIMUM GUARANTEE 25 pax minimum guaranteed
FUNCTION TYPE Conference Lunch
VENUE Sovereign (subject to availability)
SEATING ARRANGEMENT To be intimated
FUNCTION TIMINGS 9am to 6pm sharp
BILLING INSTRUCTIONS 80 % advance prior the event. balance
immediate after the function
SALES PROPOSAL-Le meridian
AV REQUIREMENTS (IF REQUIRED)
LCD Projector @ Rs.3500 + tax
Collar Mike @ Rs. 1000 + tax
Cordless Mike @ Rs. 1000 + tax
Internet connection @ Rs. 5000 + tax
Laptop @ Rs. 2500 + tax
MEAL PRICES
Lunch: Buffet lunch will be charged at a rate of Rs. 875 plus taxes (as applicable) plus 5% service charge per person
Buffet lunch menu structure1 Soup2 Salads1 curd preparation1 chaat preparation2 Non Veg Main Course2 Veg Main Course1 Dal & 1 RiceAssorted Indian BreadsPapad pickle chutney2 Desserts1 ice cream