International Journal of Business and Management Invention ISSN (Online): 2319 – 8028, ISSN (Print): 2319 – 801X www.ijbmi.org || Volume 4 Issue 12 || December. 2015 || PP-13-19 www.ijbmi.org 13 | Page Psychographic Segmentation of Restaurant Service Market: A Study on Psychographic Profile of Restaurant Visitors of Silchar Town in Assam Rupam Roy 1 , Dr. Brajesh Kumar 2 1 (Department of Commerce, Radhamadhab College, India) 2 (Department of Commerce, Assam University, India) ABSTRACT: Silchar town is the economic gateway to the state of Mizoram and Manipur. The town of Silchar has tremendous commercial importance and is one of the most important towns in Assam as well as in North- East Region. Restaurant business is always considered as one of the profitable business especially for town like Silchar which have increasing commercial importance. Its business directly determined by psychographic profile of the inhabitants/respondents besides other demographic and economic factors. The study attempts to analyse the existing position as well as prospect of Restaurant business in Silchar on the basis of the psychographic profile of the people of Silchar. KEYWORDS: Demographic, economic, psychographic, restaurant, Silchar. I. INTRODUCTION Just as the term demographics refer to certain physical and social characteristics of people, the term “psychographics” refers to people‟s lifestyle characteristics. Psychographi cs gained popularity among marketers beginning in the late 1960s and became a staple of marketing by the mid 1970s. Marketers realized that the emotional and psychological connections people make with particular brands often arise from how well the brands fit into the lives of consumers. As such, market researchers were presented with the challenge of measuring consumer lifestyles, and the term psychographics was born. Psychographics was never intended to replace demographics as a means of predicting and explaining consumer marketplace behaviour. Instead, psychographics supplement demographics by adding the richness of the social and behavioural sciences to standard demographic descriptions of people. This way marketers could not only describe the types of people that buy their products, they could also consider more systematically the reasons why those people buy them. The preset study attempts to analyse the existing position as well as prospect of Restaurant business in Silchar on the basis of the psychographic profile of the people of Silchar. II. BRIEF PROFILE OF SILCHAR Silchar is the headquarter of the Cachar district in Assam. The district was created in 1832 after the annexation of Kachari Kingdom by the British. In 1854, North Cachar was annexed and tagged to the district but in 1951 erstwhile North Cachar Subdivision was made a separate district of Assam and taken out of Cachar. The total population of the district is 17, 36,319 comprising 8, 86,616 (51.06%) males and 8, 49,703 (48.94%) females. The total rural population is 14, 20,309 (81.8%) and that of the urban population is 3, 16, 010 (18.2%). The sex ratio is 958 females per 1000 males. The literacy rate of the district is 80.36%. The growth of population in Silchar from 1951 to 2011 is shown below Table Table 1: Population and Growth in Silchar Town, 1951-2011 Year Population Annual growth rate (%) 1951 34000 - 1991 115483 6 2001 142199 2.3 2011 172709 2.1 Source: Office of the Registrar General and Census Commissioner (web), Population Census India (web) Silchar town as an urban agglomeration constitute a population above 100,000 as per 2011 census as shown in the Table below.
Transcript
International Journal of Business and Management Invention
Psychographic Segmentation of Restaurant Service...
www.ijbmi.org 15 | Page
VII. PSYCHOGRAPHIC SEGMENTS & ANALYSIS
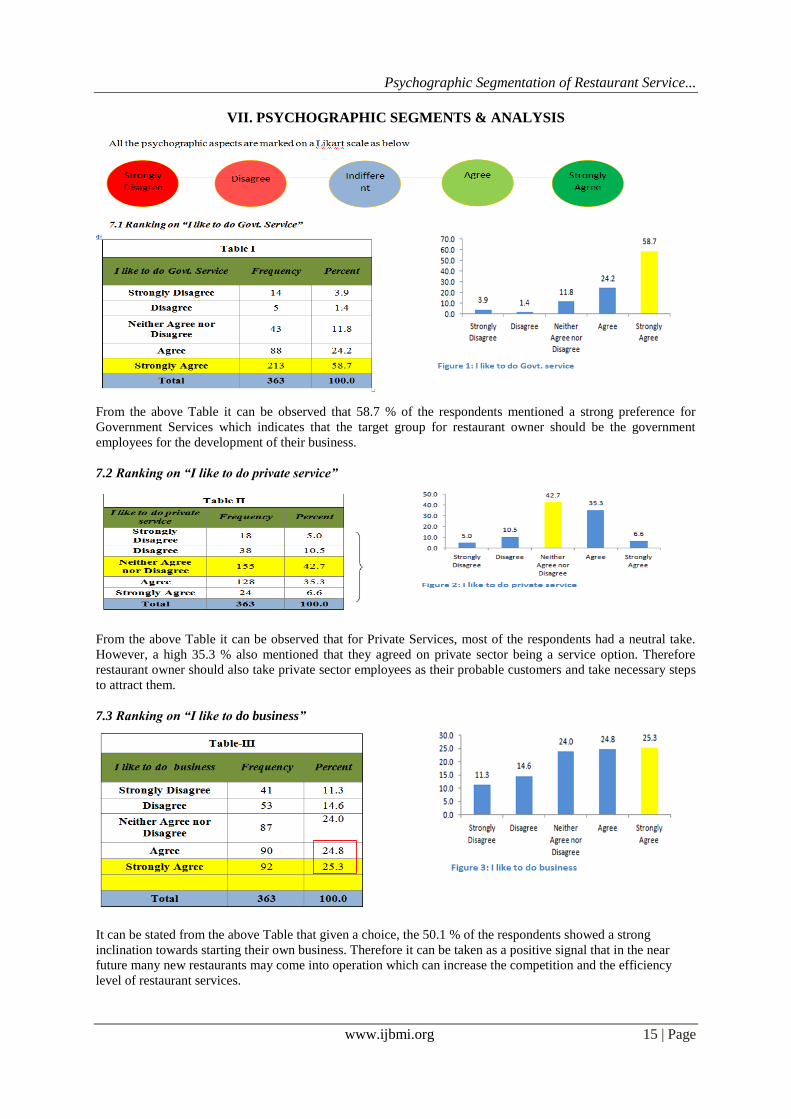
From the above Table it can be observed that 58.7 % of the respondents mentioned a strong preference for
Government Services which indicates that the target group for restaurant owner should be the government
employees for the development of their business.
7.2 Ranking on “I like to do private service”
From the above Table it can be observed that for Private Services, most of the respondents had a neutral take.
However, a high 35.3 % also mentioned that they agreed on private sector being a service option. Therefore
restaurant owner should also take private sector employees as their probable customers and take necessary steps
to attract them.
7.3 Ranking on “I like to do business”
It can be stated from the above Table that given a choice, the 50.1 % of the respondents showed a strong
inclination towards starting their own business. Therefore it can be taken as a positive signal that in the near
future many new restaurants may come into operation which can increase the competition and the efficiency
level of restaurant services.
Psychographic Segmentation of Restaurant Service...
www.ijbmi.org 16 | Page
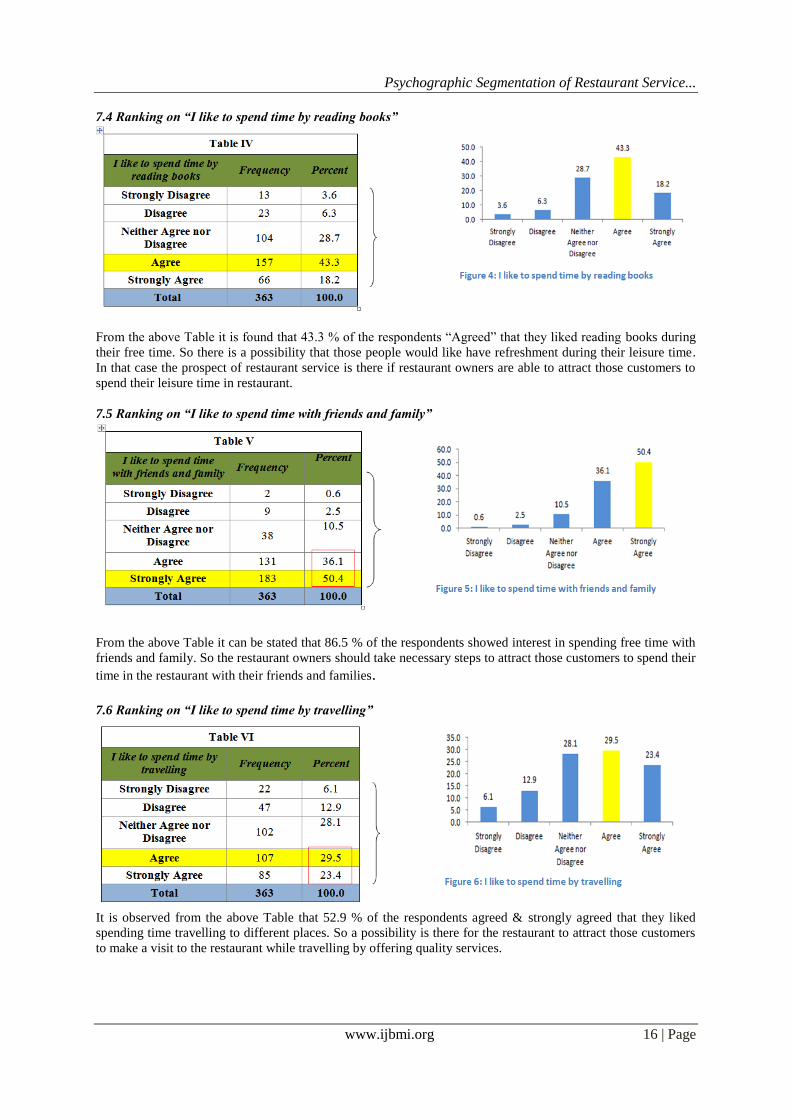
7.4 Ranking on “I like to spend time by reading books”
From the above Table it is found that 43.3 % of the respondents “Agreed” that they liked reading books during
their free time. So there is a possibility that those people would like have refreshment during their leisure time.
In that case the prospect of restaurant service is there if restaurant owners are able to attract those customers to
spend their leisure time in restaurant.
7.5 Ranking on “I like to spend time with friends and family”
From the above Table it can be stated that 86.5 % of the respondents showed interest in spending free time with
friends and family. So the restaurant owners should take necessary steps to attract those customers to spend their
time in the restaurant with their friends and families.
7.6 Ranking on “I like to spend time by travelling”
It is observed from the above Table that 52.9 % of the respondents agreed & strongly agreed that they liked
spending time travelling to different places. So a possibility is there for the restaurant to attract those customers
to make a visit to the restaurant while travelling by offering quality services.
Psychographic Segmentation of Restaurant Service...
www.ijbmi.org 17 | Page
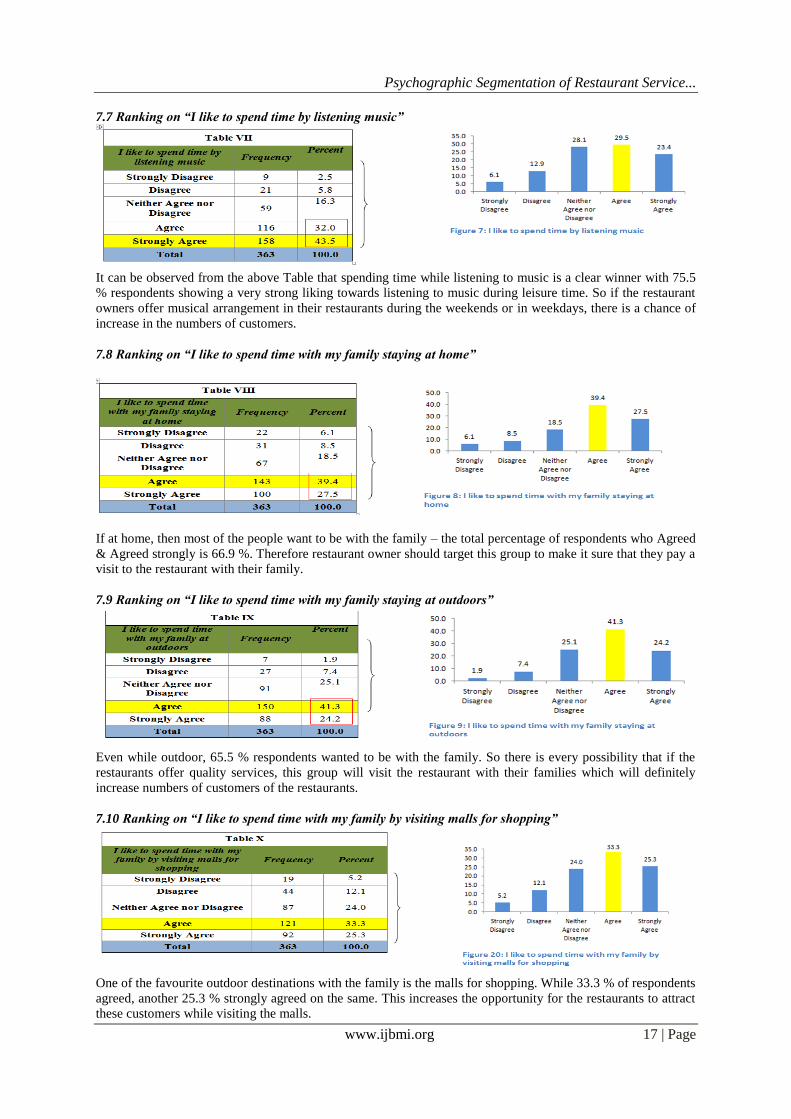
7.7 Ranking on “I like to spend time by listening music”
It can be observed from the above Table that spending time while listening to music is a clear winner with 75.5
% respondents showing a very strong liking towards listening to music during leisure time. So if the restaurant
owners offer musical arrangement in their restaurants during the weekends or in weekdays, there is a chance of
increase in the numbers of customers.
7.8 Ranking on “I like to spend time with my family staying at home”
If at home, then most of the people want to be with the family – the total percentage of respondents who Agreed
& Agreed strongly is 66.9 %. Therefore restaurant owner should target this group to make it sure that they pay a
visit to the restaurant with their family.
7.9 Ranking on “I like to spend time with my family staying at outdoors”
Even while outdoor, 65.5 % respondents wanted to be with the family. So there is every possibility that if the
restaurants offer quality services, this group will visit the restaurant with their families which will definitely
increase numbers of customers of the restaurants.
7.10 Ranking on “I like to spend time with my family by visiting malls for shopping”
One of the favourite outdoor destinations with the family is the malls for shopping. While 33.3 % of respondents
agreed, another 25.3 % strongly agreed on the same. This increases the opportunity for the restaurants to attract
these customers while visiting the malls.
Psychographic Segmentation of Restaurant Service...
www.ijbmi.org 18 | Page
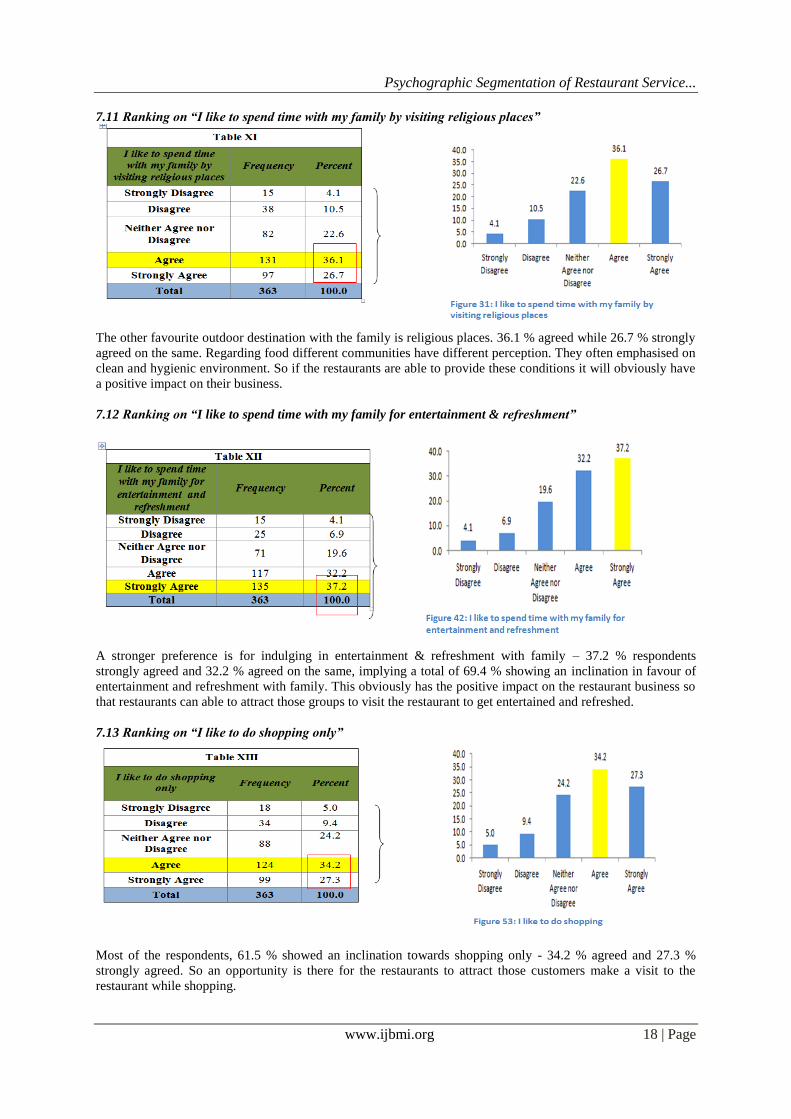
7.11 Ranking on “I like to spend time with my family by visiting religious places”
The other favourite outdoor destination with the family is religious places. 36.1 % agreed while 26.7 % strongly
agreed on the same. Regarding food different communities have different perception. They often emphasised on
clean and hygienic environment. So if the restaurants are able to provide these conditions it will obviously have
a positive impact on their business.
7.12 Ranking on “I like to spend time with my family for entertainment & refreshment”
A stronger preference is for indulging in entertainment & refreshment with family – 37.2 % respondents
strongly agreed and 32.2 % agreed on the same, implying a total of 69.4 % showing an inclination in favour of
entertainment and refreshment with family. This obviously has the positive impact on the restaurant business so
that restaurants can able to attract those groups to visit the restaurant to get entertained and refreshed.
7.13 Ranking on “I like to do shopping only”
Most of the respondents, 61.5 % showed an inclination towards shopping only - 34.2 % agreed and 27.3 %
strongly agreed. So an opportunity is there for the restaurants to attract those customers make a visit to the
restaurant while shopping.
Psychographic Segmentation of Restaurant Service...
www.ijbmi.org 19 | Page
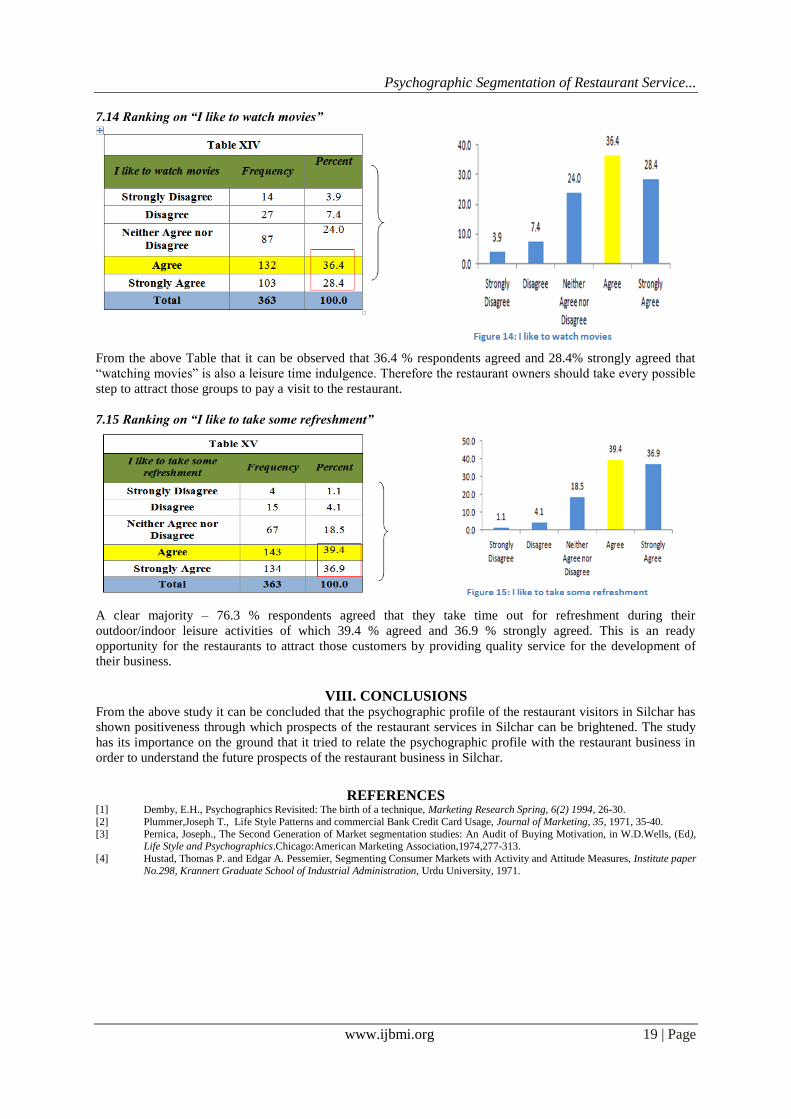
7.14 Ranking on “I like to watch movies”
From the above Table that it can be observed that 36.4 % respondents agreed and 28.4% strongly agreed that
“watching movies” is also a leisure time indulgence. Therefore the restaurant owners should take every possible
step to attract those groups to pay a visit to the restaurant.
7.15 Ranking on “I like to take some refreshment”
A clear majority – 76.3 % respondents agreed that they take time out for refreshment during their
outdoor/indoor leisure activities of which 39.4 % agreed and 36.9 % strongly agreed. This is an ready
opportunity for the restaurants to attract those customers by providing quality service for the development of
their business.
VIII. CONCLUSIONS
From the above study it can be concluded that the psychographic profile of the restaurant visitors in Silchar has
shown positiveness through which prospects of the restaurant services in Silchar can be brightened. The study
has its importance on the ground that it tried to relate the psychographic profile with the restaurant business in
order to understand the future prospects of the restaurant business in Silchar.
REFERENCES
[1] Demby, E.H., Psychographics Revisited: The birth of a technique, Marketing Research Spring, 6(2) 1994, 26-30. [2] Plummer,Joseph T., Life Style Patterns and commercial Bank Credit Card Usage, Journal of Marketing, 35, 1971, 35-40. [3] Pernica, Joseph., The Second Generation of Market segmentation studies: An Audit of Buying Motivation, in W.D.Wells, (Ed),
Life Style and Psychographics.Chicago:American Marketing Association,1974,277-313.
[4] Hustad, Thomas P. and Edgar A. Pessemier, Segmenting Consumer Markets with Activity and Attitude Measures, Institute paper
No.298, Krannert Graduate School of Industrial Administration, Urdu University, 1971.