23
COLLEGE PHYSICS Chapter # Chapter Title PowerPoint Image Slideshow PSYCHOLOGY Chapter 2 PSYCHOLOGICAL RESEARCH PowerPoint Image Slideshow
| Date post: | 30-Jul-2015 |
| Category: |
Documents |
| Upload: | lumen-learning |
| View: | 26 times |
| Download: | 0 times |

PSYCHOLOGYChapter 2 PSYCHOLOGICAL RESEARCH
PowerPoint Image Slideshow
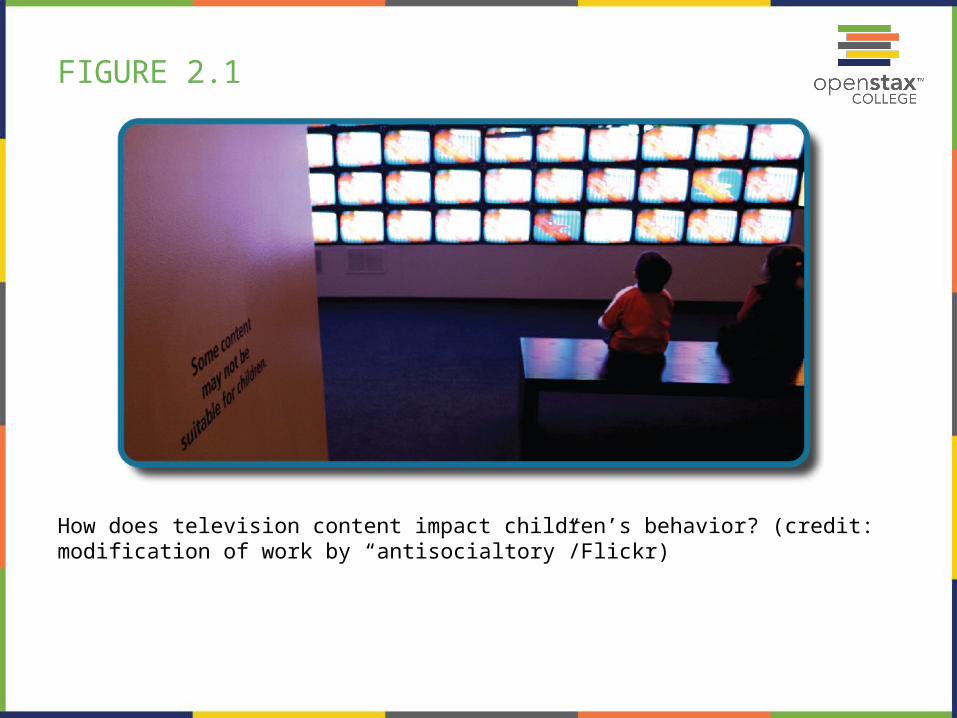
FIGURE 2.1
How does television content impact children’s behavior? (credit: modification of work by “antisocialtory”/Flickr)
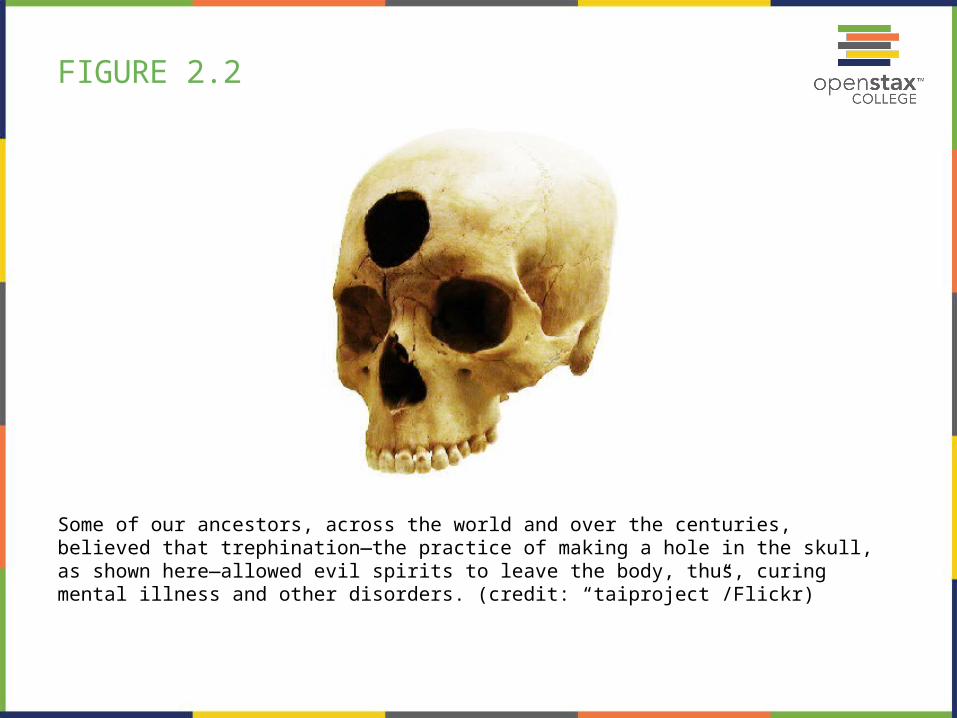
FIGURE 2.2
Some of our ancestors, across the world and over the centuries, believed that trephination—the practice of making a hole in the skull, as shown here—allowed evil spirits to leave the body, thus, curing mental illness and other disorders. (credit: “taiproject”/Flickr)

FIGURE 2.3
The D.A.R.E. program continues to be popular in schools around the world despite research suggesting that it is ineffective.
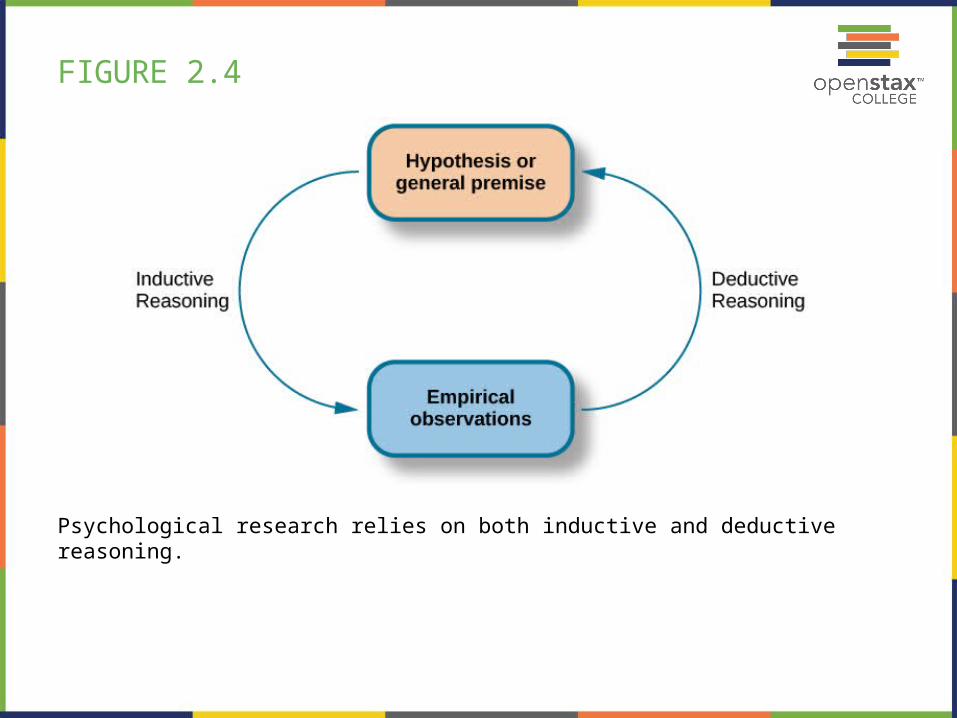
FIGURE 2.4
Psychological research relies on both inductive and deductive reasoning.
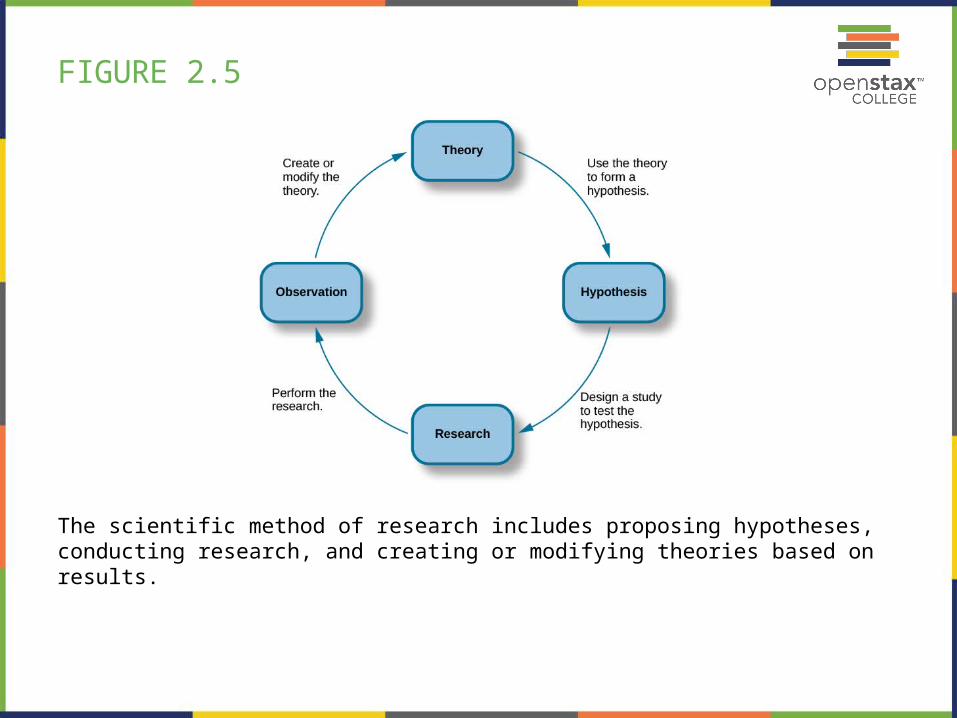
FIGURE 2.5
The scientific method of research includes proposing hypotheses, conducting research, and creating or modifying theories based on results.
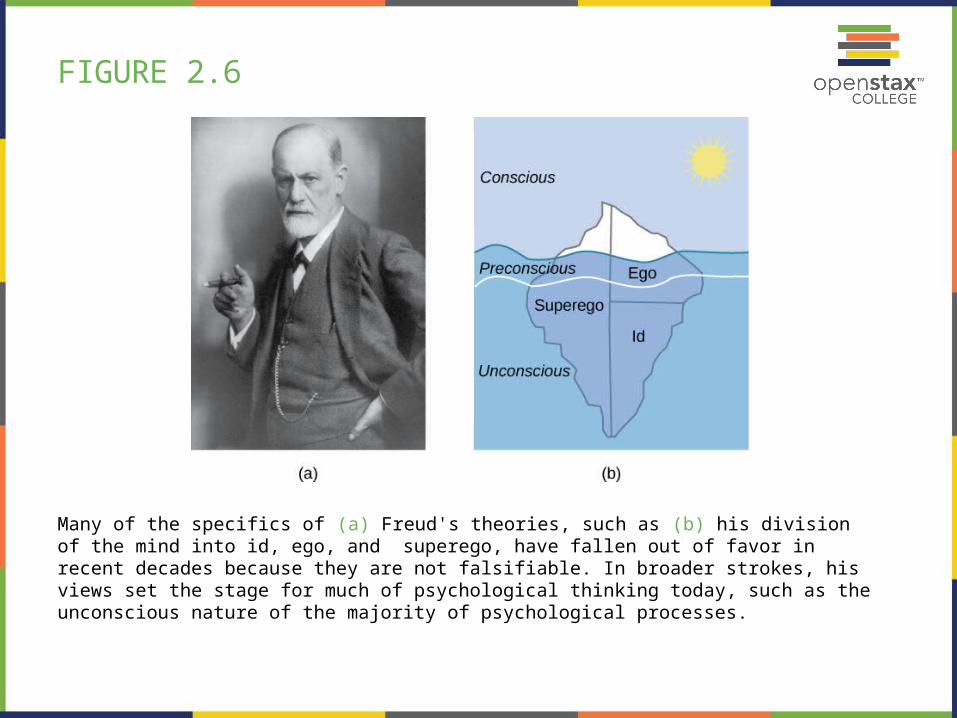
FIGURE 2.6
Many of the specifics of (a) Freud's theories, such as (b) his division of the mind into id, ego, and superego, have fallen out of favor in recent decades because they are not falsifiable. In broader strokes, his views set the stage for much of psychological thinking today, such as the unconscious nature of the majority of psychological processes.

FIGURE 2.7
Seeing a police car behind you would probably affect your driving behavior. (credit: Michael Gil)

FIGURE 2.8
(a) Jane Goodall made a career of conducting naturalistic observations of
(b) chimpanzee behavior. (credit “Jane Goodall”: modification of work by Erik Hersman; “chimpanzee”: modification of work by “Afrika Force”/Flickr.com)
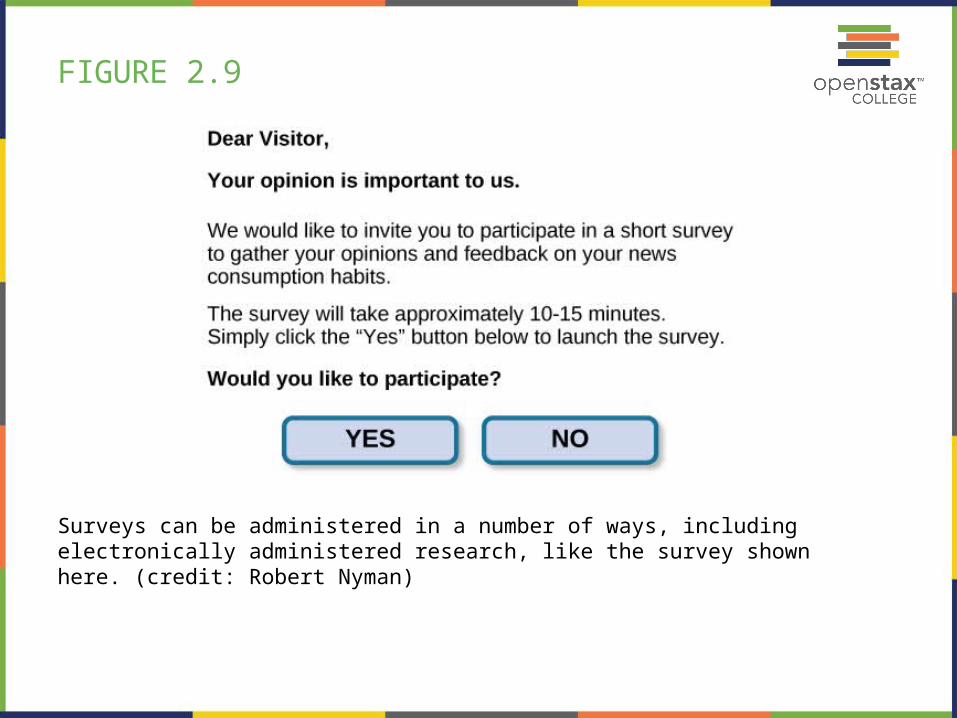
FIGURE 2.9
Surveys can be administered in a number of ways, including electronically administered research, like the survey shown here. (credit: Robert Nyman)
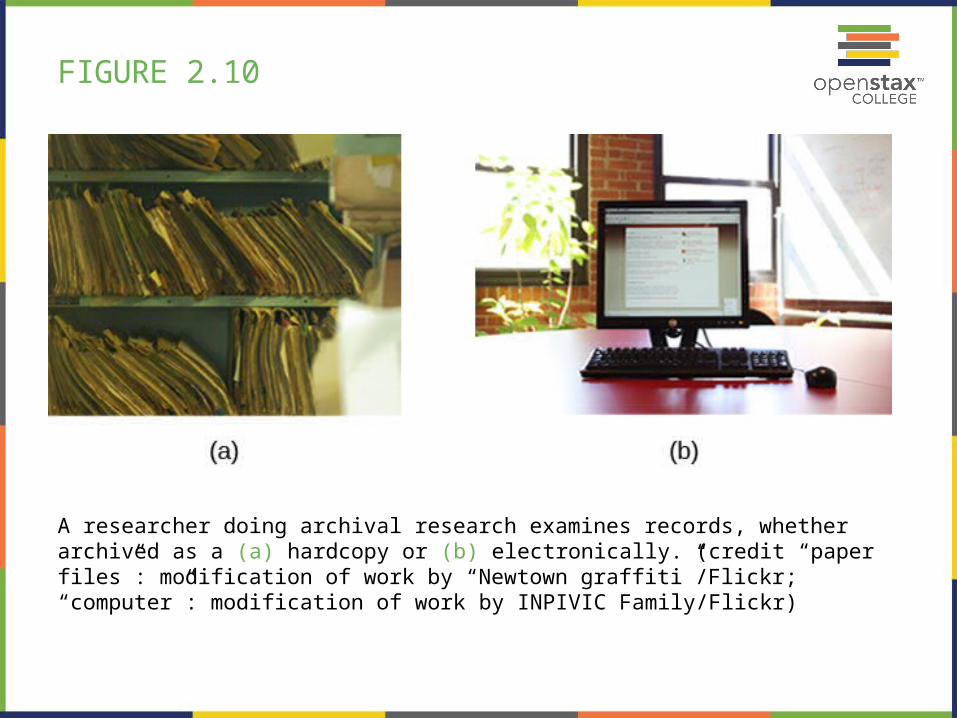
FIGURE 2.10
A researcher doing archival research examines records, whether archived as a (a) hardcopy or (b) electronically. (credit “paper files”: modification of work by “Newtown graffiti”/Flickr; “computer”: modification of work by INPIVIC Family/Flickr)
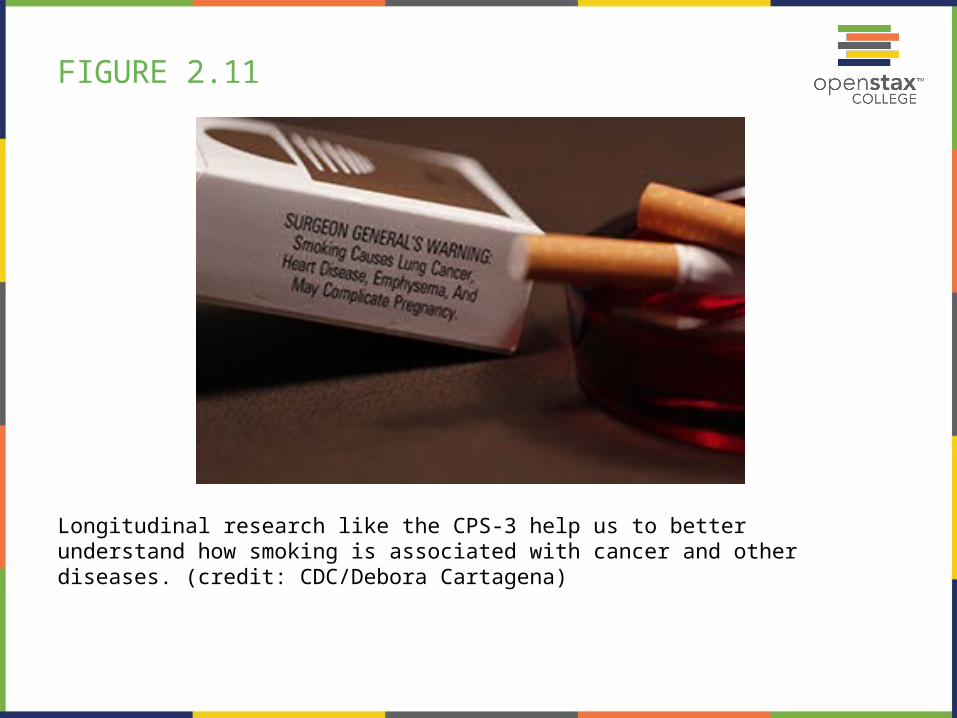
FIGURE 2.11
Longitudinal research like the CPS-3 help us to better understand how smoking is associated with cancer and other diseases. (credit: CDC/Debora Cartagena)
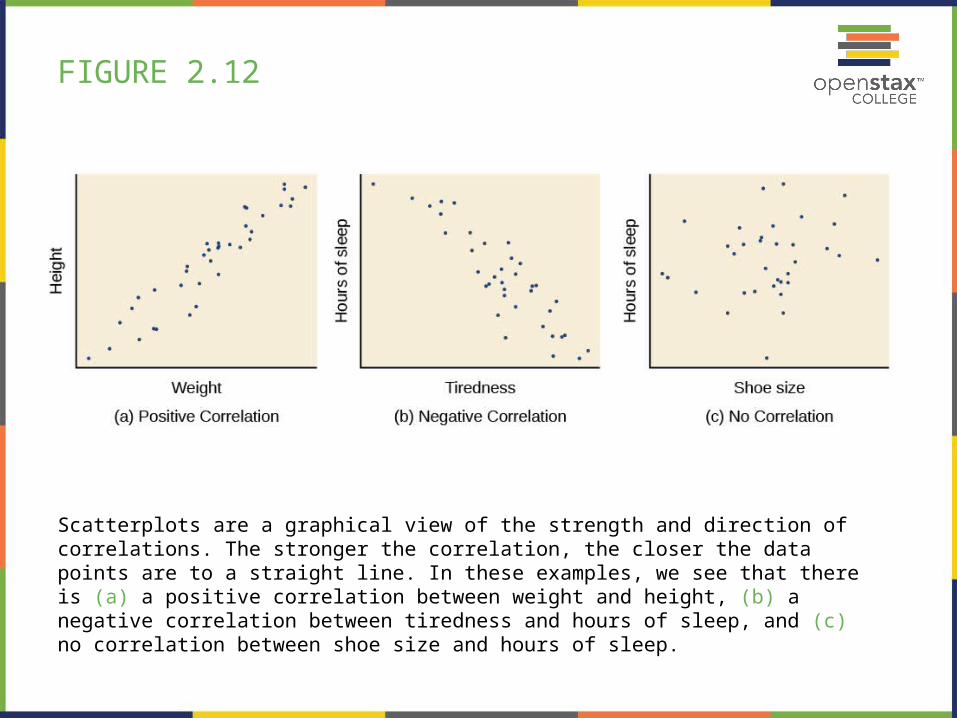
FIGURE 2.12
Scatterplots are a graphical view of the strength and direction of correlations. The stronger the correlation, the closer the data points are to a straight line. In these examples, we see that there is (a) a positive correlation between weight and height, (b) a negative correlation between tiredness and hours of sleep, and (c) no correlation between shoe size and hours of sleep.
FIGURE 2.13
Does eating cereal really cause someone to be a healthy weight? (credit: Tim Skillern)

FIGURE 2.14
Many people believe that a full moon makes people behave oddly. (credit: Cory Zanker)
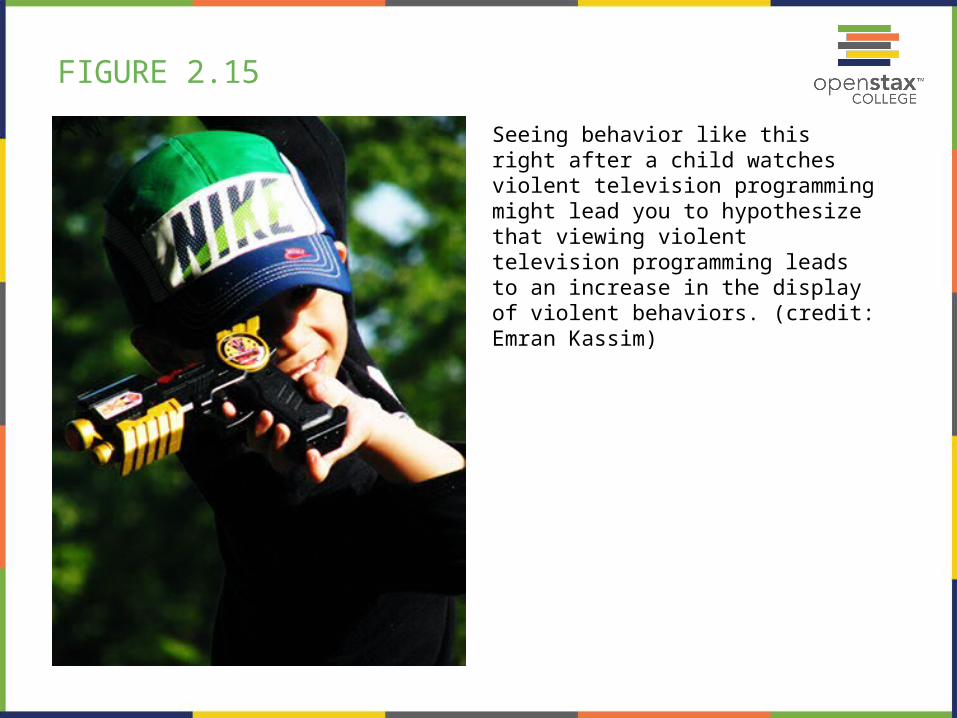
FIGURE 2.15
Seeing behavior like this right after a child watches violent television programming might lead you to hypothesize that viewing violent television programming leads to an increase in the display of violent behaviors. (credit: Emran Kassim)
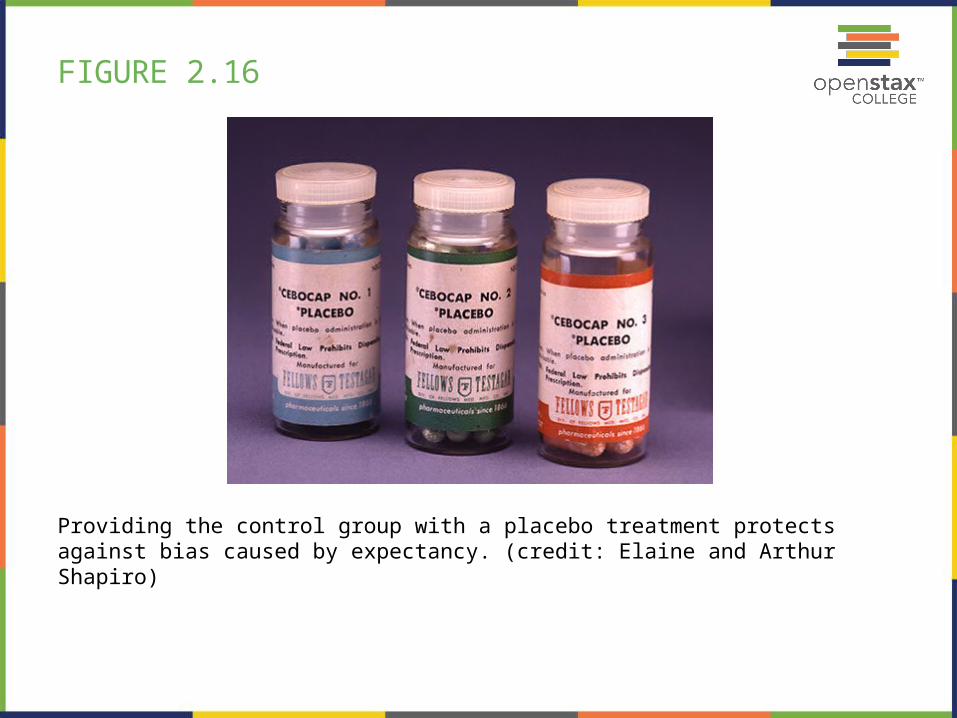
FIGURE 2.16
Providing the control group with a placebo treatment protects against bias caused by expectancy. (credit: Elaine and Arthur Shapiro)

FIGURE 2.17
In an experiment, manipulations of the independent variable are expected to result in changes in the dependent variable. (credit “automatic weapon”: modification of work by Daniel Oines; credit “toy gun”: modification of work by Emran Kassim)
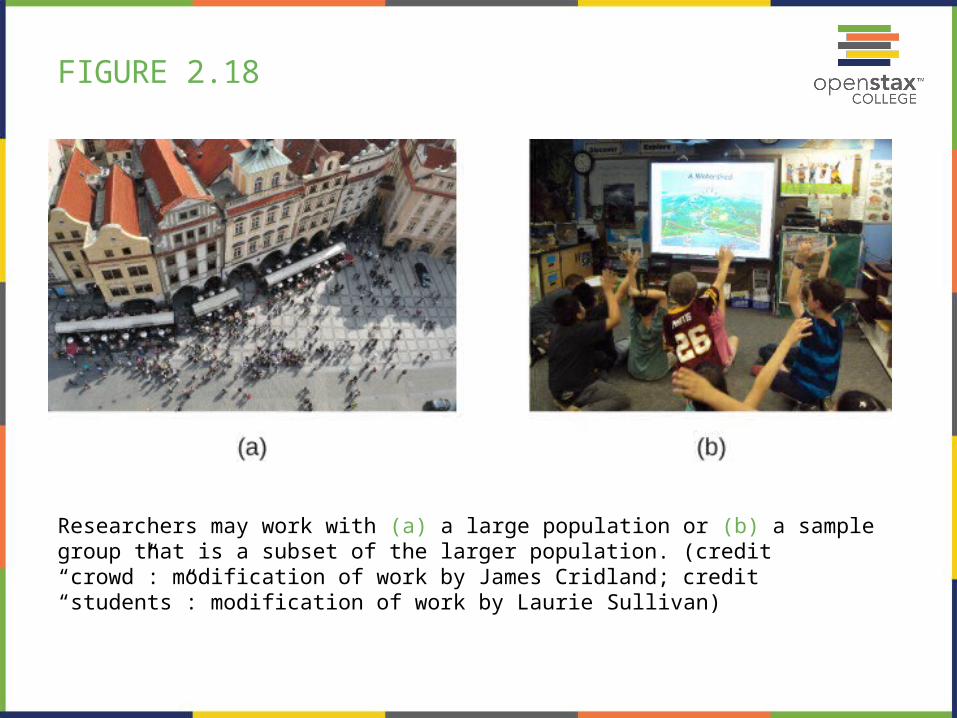
FIGURE 2.18
Researchers may work with (a) a large population or (b) a sample group that is a subset of the larger population. (credit “crowd”: modification of work by James Cridland; credit “students”: modification of work by Laurie Sullivan)
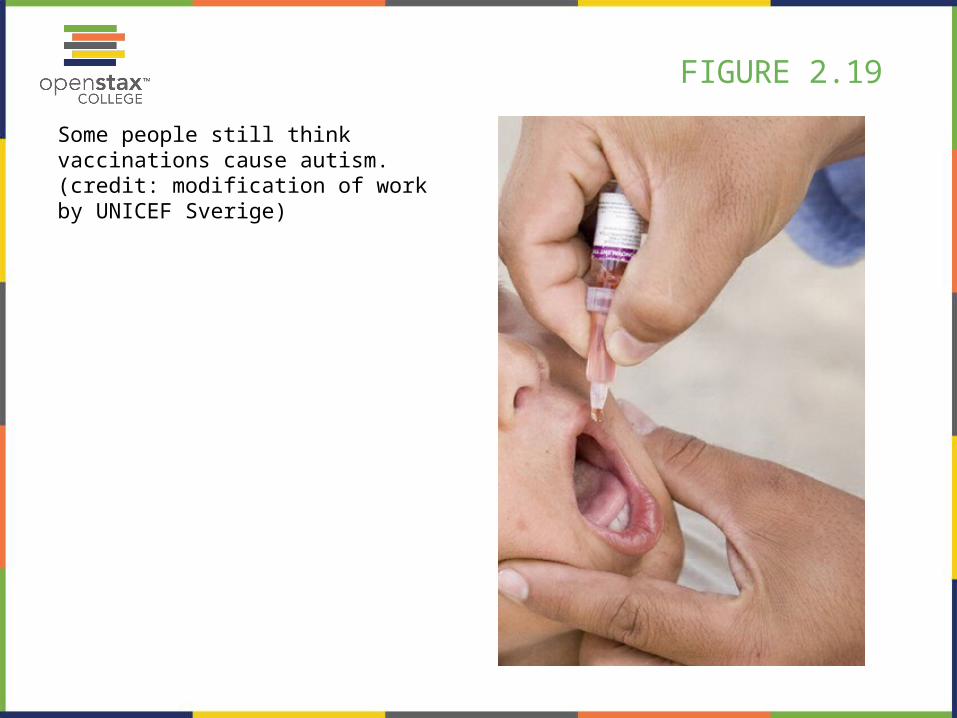
FIGURE 2.19
Some people still think vaccinations cause autism. (credit: modification of work by UNICEF Sverige)
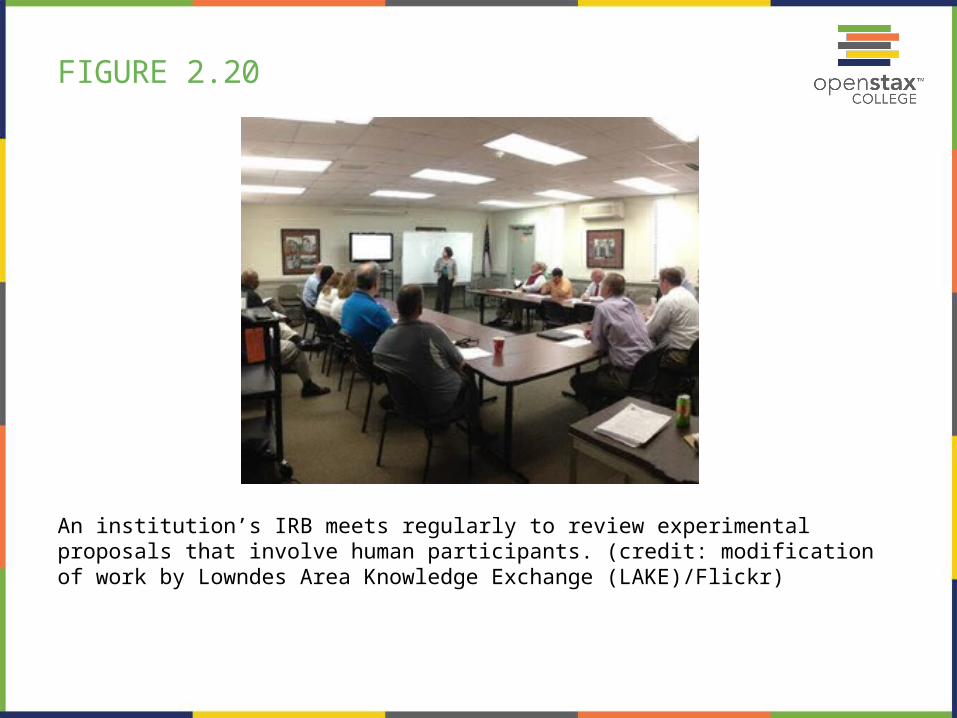
FIGURE 2.20
An institution’s IRB meets regularly to review experimental proposals that involve human participants. (credit: modification of work by Lowndes Area Knowledge Exchange (LAKE)/Flickr)
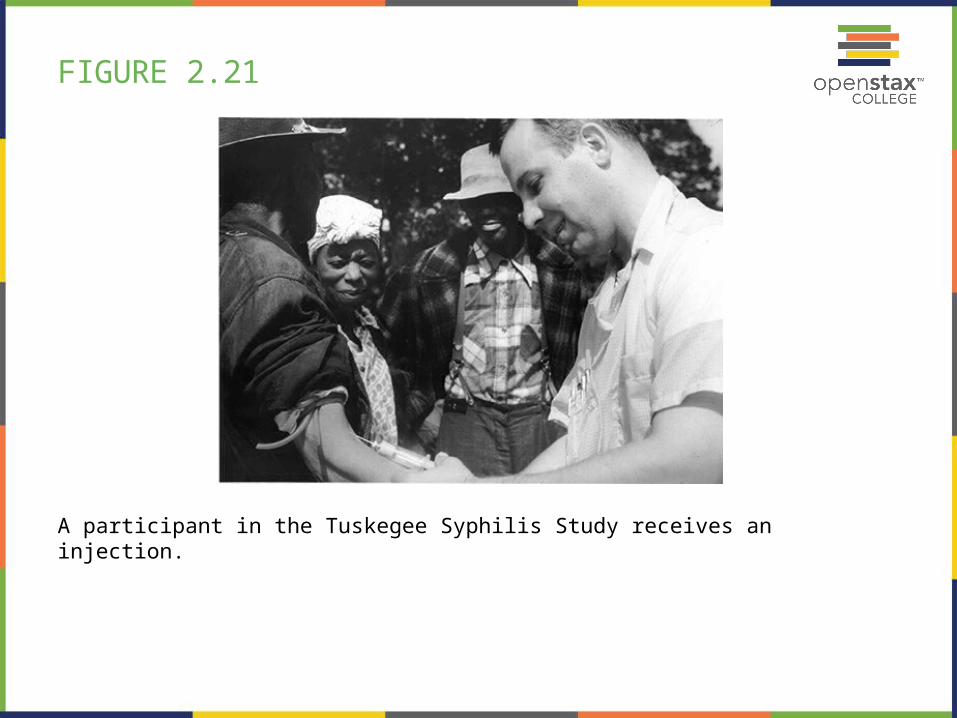
FIGURE 2.21
A participant in the Tuskegee Syphilis Study receives an injection.
FIGURE 2.22
Rats, like the one shown here, often serve as the subjects of animal research.


