30
Psychrophiles: from Biodiversity to Biotechnology

Psychrophiles: from Biodiversity to Biotechnology

Rosa Margesin • Franz SchinnerJean-Claude Marx • Charles GerdayEditors
Psychrophiles:from Biodiversity to Biotechnology
Rosa Margesin Jean-Claude MarxInstitute of Microbiology Laboratory of BiochemistryUniversity of Innsbruck University of LiègeTechnikerstrasse 25 Institute of Chemistry B66020 Innsbruck 4000 LiègeAustria [email protected] [email protected]
Franz Schinner Charles GerdayInstitute of Microbiology Laboratory of BiochemistryUniversity of Innsbruck University of LiègeTechnikerstrasse 25 Institute of Chemistry B66020 Innsbruck 4000 LiègeAustria [email protected] [email protected]
ISBN 978-3-540-74334-7 e-ISBN 978-3-540-74335-4
Library of Congress Control Number: 2007934827
© 2008 Springer-Verlag Berlin Heidelberg
This work is subject to copyright. All rights are reserved, whether the whole or part of the material is concerned, specifically the rights of translation, reprinting, reuse of illustrations, recitation, broadcasting, reproduction on microfilm or in any other way, and storage in data banks. Duplication of this publication or parts thereof is permitted only under the provisions of the German Copyright Law of September 9, 1965, in its current version, and permission for use must always be obtained from Springer. Violations are liable to prosecution under the German Copyright Law.
The use of general descriptive names, registered names, trademarks, etc. in this publication does not imply, even in the absence of a specific statement, that such names are exempt from the relevant protective laws and regulations and therefore free for general use.
Cover design: WMXDesign GmbH, Heidelberg, Germany
Printed on acid-free paper
9 8 7 6 5 4 3 2 1
springer.com
Cover illustration: Ice floe (upside down, about 80 cm thick) with dense populations of pennate diatoms at the sea-ice water interface, indicated by brown color that is caused by their main light harvesting pigment fucoxanthin (photo by David N. Thomas, see Chap. 17)
v
Preface
Most scientists in the middle of the twentieth century would probably not have believed that life was possible at extreme values of environmental factors, such as pH values close to 0 (e.g. sulfurous environments) or to 14 (e.g. soda lakes), salini-ties of 6 M NaCl (e.g. Dead Sea), hydrostatic pressures approaching 0.1 MPa (deep sea) and temperatures exceeding 100°C (thermal vents or hot springs) or as low as –20°C (e.g. polar regions). Of the current studies on extremophiles, approximately 30,000 articles by the year 2007, almost two-thirds have been performed on organ-isms adapted to outstanding temperatures, but much more attention has been paid to thermophiles than to psychrophiles. However, over the past 10 years, scientific publications on cold-adapted microorganisms have increased by a factor of ten.
If one considers the extent of cold habitats, psychrophiles, i.e. cold-loving organisms, should largely lead in this comparison with thermophiles because a great proportion of the Earth’s biosphere never reaches temperatures above 5°C. Nearly three-quarters of the Earth is covered by oceans whose deep water masses, irrespective of latitude, are constantly between 2 and 4°C. The large continent of Antarctica also provides a permanently cold terrestrial environment as well as an aquatic niche in the surrounding ice that melts during the summer. Other examples of cold habitats are permafrost soils, high alpine soils, cold deserts, cold caves, marine sediments, snow, glacier and sea ice. Cold ecosystems host a wide diversity of psychrophiles, including bacteria, archaea, yeasts, filamentous fungi, and algae. These microorganisms have evolved a number of strategies to thrive success-fully in cold habitats where they play key roles in nutrient cycling, such as nitrogen fixation, nitrification and denitrification, photosynthesis, sulfur oxidation and reduction, methanogenesis, and transformation of organic compounds.
This book is focused on psychrophiles and describes, at the edge of knowledge, representative groups of cold-adapted microorganisms as well as the habitats in which they live and their strategies to cope with the cold. It is subdivided into four main sections:
(i) boundary conditions for microbial life at low temperatures(ii) biodiversity
(iii) molecular adaptations (iv) biotechnological aspects
thus covering almost all the fields of knowledge in “cold” microbiological research.
It is certainly not by chance that this book is published during the International Polar Year 2007-2008, which is the fourth polar year following those in 1882-1883, 1932-1933 and 1957-1958 and involving over 200 projects, with thousands of sci-entists from over 60 nations examining a wide range of physical, biological and social research topics. Therefore, this book perfectly matches the current demands and trends and provides an additional source of information to all those scientists who are interested in “cold” microbiology.
Last but certainly not least, the editors of this book want to thank all the authors, who are the leading scientists in the respective field, for having accepted to write a chapter of this book, even though all these persons are also very busy and highly solicited scientists. We also thank Springer - Life Sciences, especially Dr. Dieter Czeschlik and Dr. Jutta Lindenborn, for their continuous support and trust in our capacity to successfully achieve the editing of this book.
Innsbruck, Austria Rosa Margesin, Franz SchinnerLiège, Belgium Jean-Claude Marx, Charles GerdayJuly 2007
vi Preface
vii
Contents
Part I Boundary Conditions for Microbial Life at Low Temperatures
1 The Climate of Snow and Ice as Boundary Condition for Microbial Life. . . . . . . . . . . . . . . . . . . . . . . . . . . . . . . . . . . . . . . . . . . . 3Michael Kuhn
2 Limits for Microbial Life at Subzero Temperatures. . . . . . . . . . . . . . . . 17Corien Bakermans
Part II Microbial Diversity in Cold Ecosystems
3 Bacteria in Snow and Glacier Ice . . . . . . . . . . . . . . . . . . . . . . . . . . . . . . . 31Vanya Miteva
4 Bacteria in Subglacial Environments . . . . . . . . . . . . . . . . . . . . . . . . . . . . 51Brent C. Christner, Mark L. Skidmore, John C. Priscu, Martyn Tranter, and Christine M. Foreman
5 Bacteria in the Deep Sea: Psychropiezophiles. . . . . . . . . . . . . . . . . . . . . 73Yuichi Nogi
6 Bacteria in Permafrost. . . . . . . . . . . . . . . . . . . . . . . . . . . . . . . . . . . . . . . . 83David Gilichinsky, Tatiana Vishnivetskaya, Mayya Petrova, Elena Spirina, Vladimir Mamykin, and Elizaveta Rivkina
7 Anaerobic Bacteria and Archaea in Cold Ecosystems . . . . . . . . . . . . . . 103Kai Finster
8 Cyanobacteria in Cold Ecosystems . . . . . . . . . . . . . . . . . . . . . . . . . . . . . 121Frédéric Zakhia, Anne-Dorothee Jungblut, Arnaud Taton, Warwick F. Vincent, and Annick Wilmotte
9 Fungi in Cold Ecosystems . . . . . . . . . . . . . . . . . . . . . . . . . . . . . . . . . . . . 137Jens C. Frisvad
10 Cold-Active Viruses . . . . . . . . . . . . . . . . . . . . . . . . . . . . . . . . . . . . . . . . . 157Llyd E. Wells
Part III Molecular Adaptations to Cold Habitats
11 Membrane Components and Cold Sensing . . . . . . . . . . . . . . . . . . . . . . 177Nicholas J. Russell
12 Cold-Shock Proteins . . . . . . . . . . . . . . . . . . . . . . . . . . . . . . . . . . . . . . . . 191Sangita Phadtare and Masayori Inouye
13 Fundamentals of Cold-Adapted Enzymes . . . . . . . . . . . . . . . . . . . . . . . 211Tony Collins, Frédéric Roulling, Florence Piette, Jean-Claude Marx, Georges Feller, Charles Gerday, and Salvino D’Amico
14 Cryoprotectants and Ice-Binding Proteins . . . . . . . . . . . . . . . . . . . . . . 229Hidehisa Kawahara
15 The Role of Exopolymers in Microbial Adaptation to Sea Ice. . . . . . . . . . . . . . . . . . . . . . . . . . . . . . . . . . . . . . . . 247Christopher Krembs and Jody W. Deming
16 Genomic Analysis of Psychrophilic Prokaryotes . . . . . . . . . . . . . . . . . 265John P. Bowman
17 Microalgae in Polar Regions: Linking Functional Genomics and Physiology with Environmental Conditions . . . . . . . . . . . . . . . . . . 285Thomas Mock and David N. Thomas
18 Metagenomics: Microbial Community Genomes Revealed . . . . . . . . . . . . . . . . . . . . . . . . . . . . . . . . . . . . . . . . . . 313Sara Sjöling and Don A. Cowan
19 Proteomic Studies of Psychrophilic Microorganisms . . . . . . . . . . . . . . 333Tatsuo Kurihara and Nobuyoshi Esaki
Part IV Biotechnological Aspects
20 Biotechnological Aspects of Cold-Adapted Enzymes . . . . . . . . . . . . . . 347Adrienne L. Huston
viii Contents
21 Heterologous Protein Expression in Psychrophilic Hosts . . . . . . . . . . . . . . . . . . . . . . . . . . . . . . . . . . . . . . . . . . . . . . . . . . . . . 365Ermenegilda Parrilli, Angela Duilio, and Maria Luisa Tutino
22 Cold-Adapted Fungi as a Source for Valuable Metabolites . . . . . . . . . . . . . . . . . . . . . . . . . . . . . . . . . . . . . . . . 381Jens C. Frisvad
23 Natural and Stimulated Biodegradation of Petroleum in Cold Marine Environments . . . . . . . . . . . . . . . . . . . . . . . . . . . . . . . . 389Odd Gunnar Brakstad
24 Microbial Adaptation to Boreal Saturated Subsurface: Implications in Bioremediation of Polychlorophenols . . . . . . . . . . . . . 409Jörg H. Langwaldt, Marja Tiirola, and Jaakko A. Puhakka
25 Biological Iron Oxidation and Sulfate Reduction in the Treatment of Acid Mine Drainage at Low Temperatures . . . . . . . . . . . . . . . . . . . . . . . . . . . . . . . . . . . . . . . . . . . . . . 429Anna H. Kaksonen, Mark Dopson, Olia Karnachuk, Olli H. Tuovinen, and Jaakko A. Puhakka
Index . . . . . . . . . . . . . . . . . . . . . . . . . . . . . . . . . . . . . . . . . . . . . . . . . . . . . . . . . 455
Contents ix
xi
Contributors
Bakermans, CorienCenter for Microbial Ecology, Michigan State University, East Lansing, MI 48824, USA
Bowman, John P.Australian Food Safety Centre of Excellence, School of Agricultural Science, University of Tasmania, Private Bag 54, Hobart, Tasmania, 7001, Australia
Brakstad, Odd GunnarSINTEF Materials and Chemistry, Marine Environmental Technology, Brattørkaia 17B, N-7465 Trondheim, Norway
Christner, Brent C.Department of Biological Sciences, 202 Life Sciences Building, Louisiana State University, Baton Rouge, Louisiana 70803, USA
Collins, TonyLaboratory of Biochemistry, University of Liege, Institute of Chemistry, B6, B-4000,Liege, Belgium
Cowan, Don A.Department of Biotechnology, University of the Western Cape, Bellville 7535, Cape Town, South Africa
D’Amico, SalvinoLaboratory of Biochemistry, University of Liege, Institute of Chemistry, B6, B-4000Liege, Belgium
Dopson, MarkDepartment of Molecular Biology, Umeå University, SE-901 87 Umeå, Sweden
Duilio, AngelaDip. Chimica Organica e Biochimica - Università di Napoli Federico II, Complesso Universitario M. S. Angelo, via Cynthia, I-80126 Napoli, Italy
Esaki, NobuyoshiInstitute for Chemical Research, Kyoto University, Gokasho, Uji, Kyoto 611-0011, Japan
Feller, Georges Laboratory of Biochemistry, University of Liege, Institute of Chemistry, B6, B-4000 Liege, Belgium
Finster, KaiInstitute of Biological Sciences, Microbiology Section, University of Aarhus, DK-8000 Aarhus C, Denmark
Foreman, Christine M.Department of Land Resources and Environmental Sciences, 334 Leon Johnson Hall, Montana State University, Bozeman, Montana 59717, USA
Frisvad, Jens C.Center for Microbial Biotechnology, BioCentrum-DTU, Building 221, Technical University of Denmark, DK-2800 Kgs. Lyngby, Denmark
Gerday, Charles Laboratory of Biochemistry, University of Liege, Institute of Chemistry, B6, B-4000 Liege, Belgium
Gilichinsky, DavidSoil Cryology Laboratory, Institute of Physicochemical and Biological Problems in Soil Science, Russian Academy of Sciences, 142290 Pushchino, Russia
Huston, Adrienne L.2006-2007 AAAS Science and Technology Policy Fellow, American Association for the Advancement of Science (AAAS), 1200 New York Avenue NW, Washington, DC 20005, USA
Inouye, MasayoriDepartment of Biochemistry, Robert Wood Johnson Medical School, 675 Hoes Lane, Piscataway, New Jersey 08854, USA
Jungblut, Anne-DorotheeCentre d’Études Nordiques & Département de Biologie, Laval University, Quebec City, Quebec G1K 7P4, Canada
Kaksonen, Anna H.Institute of Environmental Engineering and Biotechnology, Tampere University of Technology, P.O. Box 541, FI-33101 Tampere, Finland
Karnachuk, OliaDepartment of Plant Physiology and Biotechnology, Tomsk State University, Lenina Street 36, Tomsk, Russia
xii Contributors
Kawahara, HidehisaDepartment of Biotechnology, Faculty of Engineering, Kansai University, Osaka, 564-8680 Japan
Kuhn, MichaelInstitute of Meteorology and Geophysics, University of Innsbruck, Innrain 52, A-6020 Innsbruck, Austria
Kurihara, TatsuoInstitute for Chemical Research, Kyoto University, Gokasho, Uji, Kyoto611-0011, Japan
Langwaldt, Jörg H.Mineral Processing, Geological Survey of Finland, Tutkijankatu 1, 83500 Outokumpu, Finland
Mamykin, VladimirSoil Cryology Laboratory, Institute of Physicochemical and Biological Problems in Soil Science, Russian Academy of Sciences, 142290 Pushchino, Russia
Marx, Jean-Claude Laboratory of Biochemistry, University of Liege, Institute of Chemistry, B6, B-4000 Liege, Belgium
Miteva, VanyaDepartment of Biochemistry and Molecular Biology, The Pennsylvania State University, University Park, PA 16803, USA
Mock, ThomasSchool of Oceanography, University of Washington, 98195 Seattle, USA
Nogi, YuichiExtremobiosphere Research Center, Japan Agency for Marine-Earth Science and Technology, 2-15 Natsushima-cho, Yokosuka 237-0061, Japan
Parrilli, ErmengildaDip. Chimica Organica e Biochimica - Università di Napoli Federico II, Complesso Universitario M. S. Angelo, via Cynthia, I-80126 Napoli, Italy
Petrova, MayyaInstitute of Molecular Genetics, Russian Academy of Sciences, 123182 Moscow, Russia
Phadtare, SangitaDepartment of Biochemistry, Robert Wood Johnson Medical School, 675 Hoes Lane, Piscataway, New Jersey 08854, USA
Piette, Florence Laboratory of Biochemistry, University of Liege, Institute of Chemistry, B6, B-4000 Liege, Belgium
Contributors xiii
Priscu, John C.Department of Land Resources and Environmental Sciences, 334 Leon Johnson Hall, Montana State University, Bozeman, Montana 59717, USA
Puhakka, Jaakko A.Institute of Environmental Engineering and Biotechnology, Tampere University of Technology, P.O. Box 541, 33101 Tampere, Finland
Rivkina, ElizavetaSoil Cryology Laboratory, Institute of Physicochemical and Biological Problems in Soil Science, Russian Academy of Sciences, 142290 Pushchino, Russia
Roulling, FrédéricLaboratory of Biochemistry, University of Liege, Institute of Chemistry, B6, B-4000 Liege, Belgium
Russell, Nicholas J.Imperial College London, Wye campus, Wye, Ashford, Kent TN25 5AH, United Kingdom
Sjöling, SaraSchool of Life Sciences, University College Södertörn, S-14189 Huddinge, Sweden
Skidmore, Mark L.Department of Earth Sciences, 200 Traphagen Hall, Montana State University, Bozeman, Montana 59717, USA
Spirina, ElenaSoil Cryology Laboratory, Institute of Physicochemical and Biological Problems in Soil Science, Russian Academy of Sciences, 142290 Pushchino, Russia
Taton, ArnaudCentre for Protein Engineering, Institute of Chemistry B6, University of Liège, B-4000 Liège, Belgium
Thomas, David N.Ocean Sciences, College of Natural Sciences, University of Wales-Bangor, Menai Bridge, Anglesey, LL59 5AB, United Kingdom
Tiirola, MarjyDepartment of Biological and Environmental Science, University of Jyväskylä, PO Box 35, 40351 Jyväskylä, Finland
Tranter, MartynBristol Glaciology Centre, School of Geographical Sciences, University of Bristol, Bristol, BS8 1SS, United Kingdom
Tuovinen, Olli H.Department of Microbiology, Ohio State University, 484 West 12th Avenue, Columbus, OH 43210, USA
xiv Contributors
Tutino, Maria LuisaDip. Chimica Organica e Biochimica - Università di Napoli Federico II, Complesso Universitario M. S. Angelo, via Cynthia, I-80126 Napoli, Italy
Vincent, Warwick F.Centre d’Études Nordiques & Département de Biologie, Laval University, Quebec City, Quebec G1K 7P4, Canada
Vishnivetskaya, TatianaOak Ridge National Laboratory, Biosciences Division, Oak Ridge, TN 37831, USA
Wells, Llyd E.Center for Northern Studies, Sterling College, P.O. Box 72, Craftsbury Common, VT 05827, USA
Wilmotte, AnnickCentre for Protein Engineering, Institute of Chemistry B6, University of Liège, B-4000 Liège, Belgium
Zakhia, FrédéricCentre for Protein Engineering, Institute of Chemistry B6, University of Liège, B-4000 Liège, Belgium
Contributors xv

Part IBoundary Conditions for Microbial Life
at Low Temperatures
Chapter 1The Climate of Snow and Ice as Boundary Condition for Microbial Life
Michael Kuhn
1.1 The source of energy: solar radiation
The Earth’s surface is the place where the biosphere, the atmosphere, the hydrosphereand the lithosphere interact most extensively. In mountains and polar regions, the cryosphere adds more facets to this multiple interaction. The biogeochemical cycles at the Earth’s surface are driven by the vertical exchange of energy and water locally, and by the horizontal motion of air and water in the global circulation. The energy absorbed from the incident solar radiation is used to heat the ground, snow, or water, which in turn heat the overlying air by turbulent convection; to evaporate water, melt or sublimate ice; and in part is re-emitted as infrared radiation.
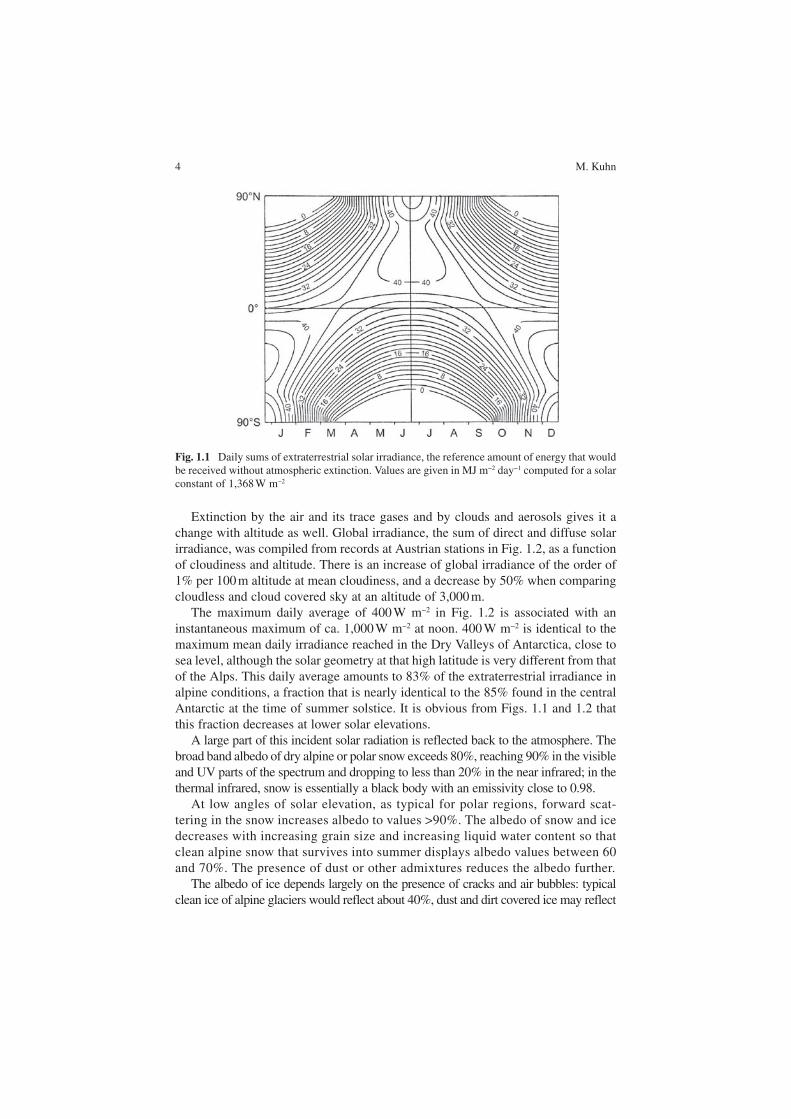
Solar radiation, the prime energy source of all climatic and biotic processes, has a strong daily and seasonal variation in mid and high latitudes. This is best illus-trated by its reference value, the extraterrestrial irradiance, the amount of energy that would be received if there were no atmospheric extinction. Daily sums of extraterrestrial irradiance are displayed in Fig. 1.1 in response to geographical lati-tude and time of the year. While the tropics have the highest annual sums, the two polar regions reach the highest daily totals in their respective summers, with Antarctica receiving more than the Arctic since the Earth is closest to the Sun in the Austral summer.
R. Margesin et al. (eds.) Psychrophiles: from Biodiversity to Biotechnology. 3© Springer-Verlag Berlin Heidelberg 2008
Michael KuhnInstitute of Meteorology and Geophysics, University of Innsbruck, Innrain 52, 6020 Innsbruck, Austriae-mail: [email protected]
Contents1.1 The source of energy: solar radiation ................................................................................ 31.2 Distribution of energy: the energy balance of snow and ice ............................................. 51.3 Air temperature: effects of altitude and latitude ............................................................... 61.4 Atmospheric humidity and precipitation .......................................................................... 81.5 The cryosphere: a matrix for life ...................................................................................... 91.6 Liquid water in the cryosphere ......................................................................................... 111.7 Hot spots in the ice ............................................................................................................ 131.8 Conclusions ....................................................................................................................... 14References .................................................................................................................................. 14
4 M. Kuhn
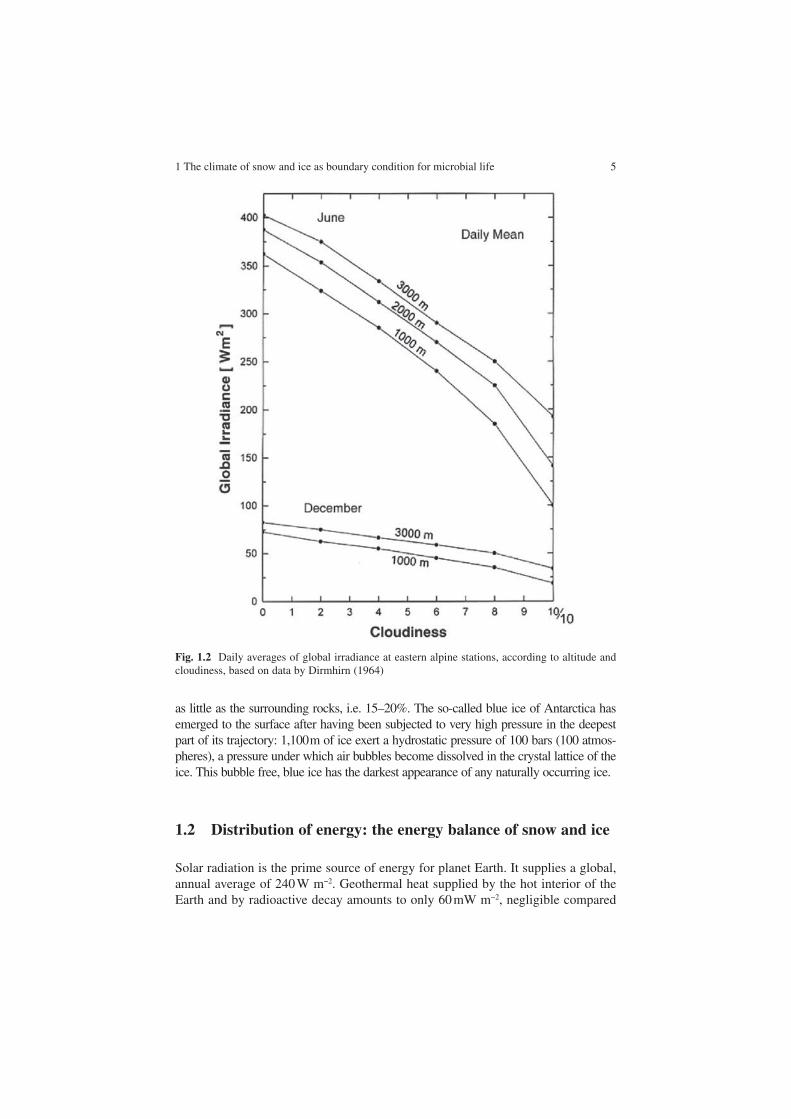
Extinction by the air and its trace gases and by clouds and aerosols gives it a change with altitude as well. Global irradiance, the sum of direct and diffuse solar irradiance, was compiled from records at Austrian stations in Fig. 1.2, as a function of cloudiness and altitude. There is an increase of global irradiance of the order of 1% per 100 m altitude at mean cloudiness, and a decrease by 50% when comparing cloudless and cloud covered sky at an altitude of 3,000 m.
The maximum daily average of 400 W m−2 in Fig. 1.2 is associated with an instantaneous maximum of ca. 1,000 W m−2 at noon. 400 W m−2 is identical to the maximum mean daily irradiance reached in the Dry Valleys of Antarctica, close to sea level, although the solar geometry at that high latitude is very different from that of the Alps. This daily average amounts to 83% of the extraterrestrial irradiance in alpine conditions, a fraction that is nearly identical to the 85% found in the central Antarctic at the time of summer solstice. It is obvious from Figs. 1.1 and 1.2 that this fraction decreases at lower solar elevations.
A large part of this incident solar radiation is reflected back to the atmosphere. The broad band albedo of dry alpine or polar snow exceeds 80%, reaching 90% in the visible and UV parts of the spectrum and dropping to less than 20% in the near infrared; in the thermal infrared, snow is essentially a black body with an emissivity close to 0.98.
At low angles of solar elevation, as typical for polar regions, forward scat-tering in the snow increases albedo to values >90%. The albedo of snow and ice decreases with increasing grain size and increasing liquid water content so that clean alpine snow that survives into summer displays albedo values between 60 and 70%. The presence of dust or other admixtures reduces the albedo further.
The albedo of ice depends largely on the presence of cracks and air bubbles: typical clean ice of alpine glaciers would reflect about 40%, dust and dirt covered ice may reflect
Fig. 1.1 Daily sums of extraterrestrial solar irradiance, the reference amount of energy that would be received without atmospheric extinction. Values are given in MJ m−2 day−1 computed for a solar constant of 1,368 W m−2
1 The climate of snow and ice as boundary condition for microbial life 5
as little as the surrounding rocks, i.e. 15–20%. The so-called blue ice of Antarctica has emerged to the surface after having been subjected to very high pressure in the deepest part of its trajectory: 1,100 m of ice exert a hydrostatic pressure of 100 bars (100 atmos-pheres), a pressure under which air bubbles become dissolved in the crystal lattice of the ice. This bubble free, blue ice has the darkest appearance of any naturally occurring ice.
1.2 Distribution of energy: the energy balance of snow and ice
Solar radiation is the prime source of energy for planet Earth. It supplies a global, annual average of 240 W m−2. Geothermal heat supplied by the hot interior of the Earth and by radioactive decay amounts to only 60 mW m−2, negligible compared
Fig. 1.2 Daily averages of global irradiance at eastern alpine stations, according to altitude and cloudiness, based on data by Dirmhirn (1964)
6 M. Kuhn
to solar radiation, but of vital importance at the base of ice sheets. When discussing the distribution and balance of energy fluxes, we clearly need to distinguish the atmosphere, the surface of snow and ice, its interior and its base.
The principle of the energy balance is most clearly and generally demonstrated for the case of the snow surface, the cryosphere/atmosphere interface. Here, solar (or shortwave) radiation S↓ is supplemented by atmospheric infrared (longwave) radiation L↓ emitted by greenhouse gases, clouds and aerosols, while part is reflected S↑, or emitted from the surface L↑. The net value of the four fluxes is called the radiation balance. The amount delivered, or lost by the surface, is distributed in four ways:
(1) heat supply C to or from the snow by conduction, penetration of solar radiation, or convection in the pore space of the snow, which all may change the snow temperature;
(2) turbulent transfer of sensible heat H to or from the atmospheric boundary layer;(3) turbulent transfer of latent heat of evaporation, sublimation or condensation LE;(4) the latent heat of melting or refreezing LM.
All fluxes are defined positive if they deliver energy to the surface so that, at the surface, their total must be zero.
S↓ + S↑ + L↓ + L↑ + C + H + LE + LM = 0
These quantities are usually expressed as energy flux densities in W m−2. As they depend on atmospheric variables that are not locally determined we first need infor-mation on the local climatic boundary conditions.
1.3 Air temperature: effects of altitude and latitude
The change of temperature and other environmental conditions with altitude in mid latitude mountains has often been compared to their change with latitude: a 1,000-m higher altitude in the Alps may roughly be equivalent to a 1,000-km move north-ward. In the case of temperature, however, the reasons for the decrease with altitude are basically different from those for the decrease with latitude. If a parcel of dry air is moved upward, it loses pressure, expands and thereby cools at a rate of 1° per 100 m altitude; in the case of moist air, condensation may reduce this figure to 0.6° per 100 m. In both cases, the cooling is the consequence of vertical motion. The decrease of temperature with increasing latitude, on the other hand, follows from the decreasing annual supply of solar radiation (Fig. 1.1).
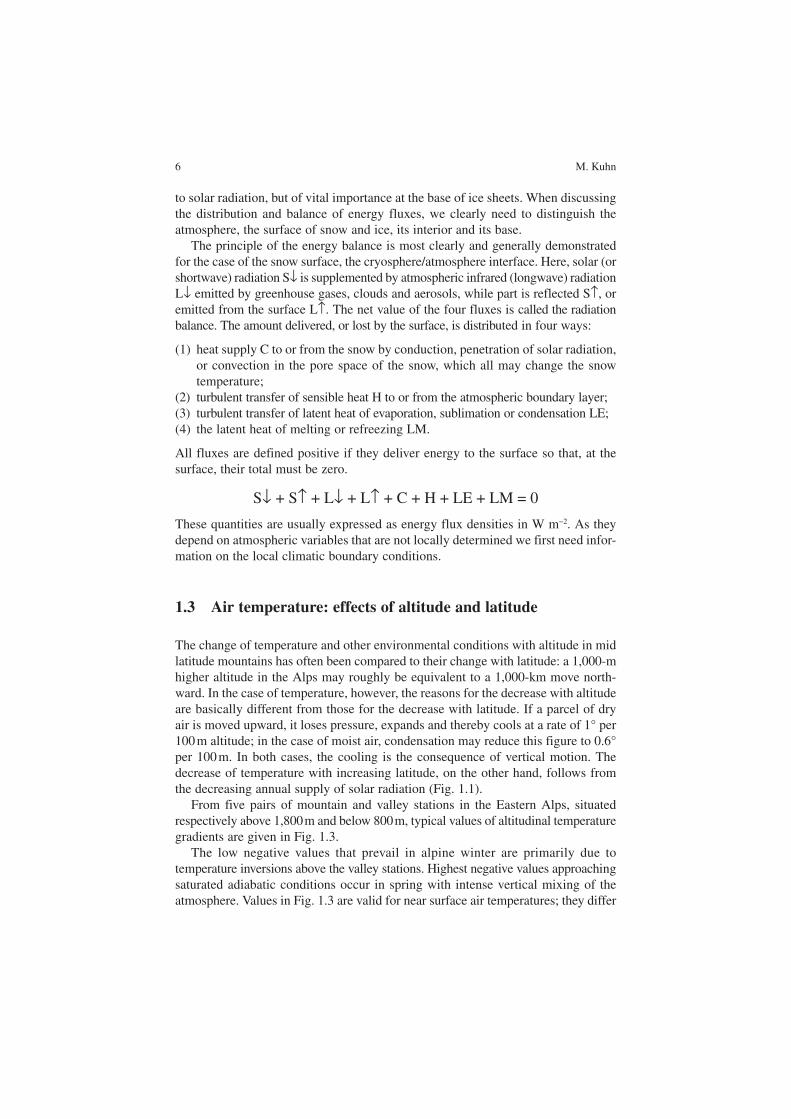
From five pairs of mountain and valley stations in the Eastern Alps, situated respectively above 1,800 m and below 800 m, typical values of altitudinal temperaturegradients are given in Fig. 1.3.
The low negative values that prevail in alpine winter are primarily due to temperature inversions above the valley stations. Highest negative values approaching saturated adiabatic conditions occur in spring with intense vertical mixing of the atmosphere. Values in Fig. 1.3 are valid for near surface air temperatures; they differ
1 The climate of snow and ice as boundary condition for microbial life 7
from gradients in the free atmosphere. Although based on alpine records, they are representative for many mountain areas around the world.
Mountain stations generally have smaller diurnal and annual temperature ranges as illustrated by Table 1.1. This is a ventilation effect due to higher wind speeds at mountain peaks, i.e. due to relative topography rather than to absolute altitude.
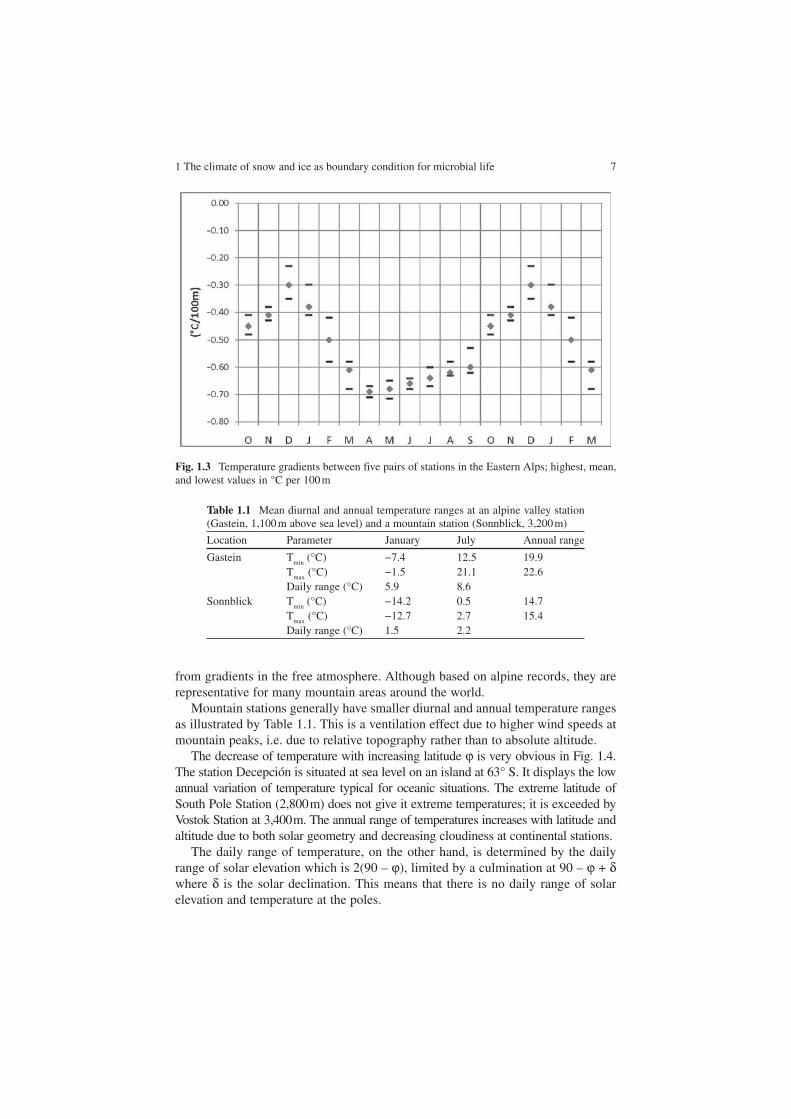
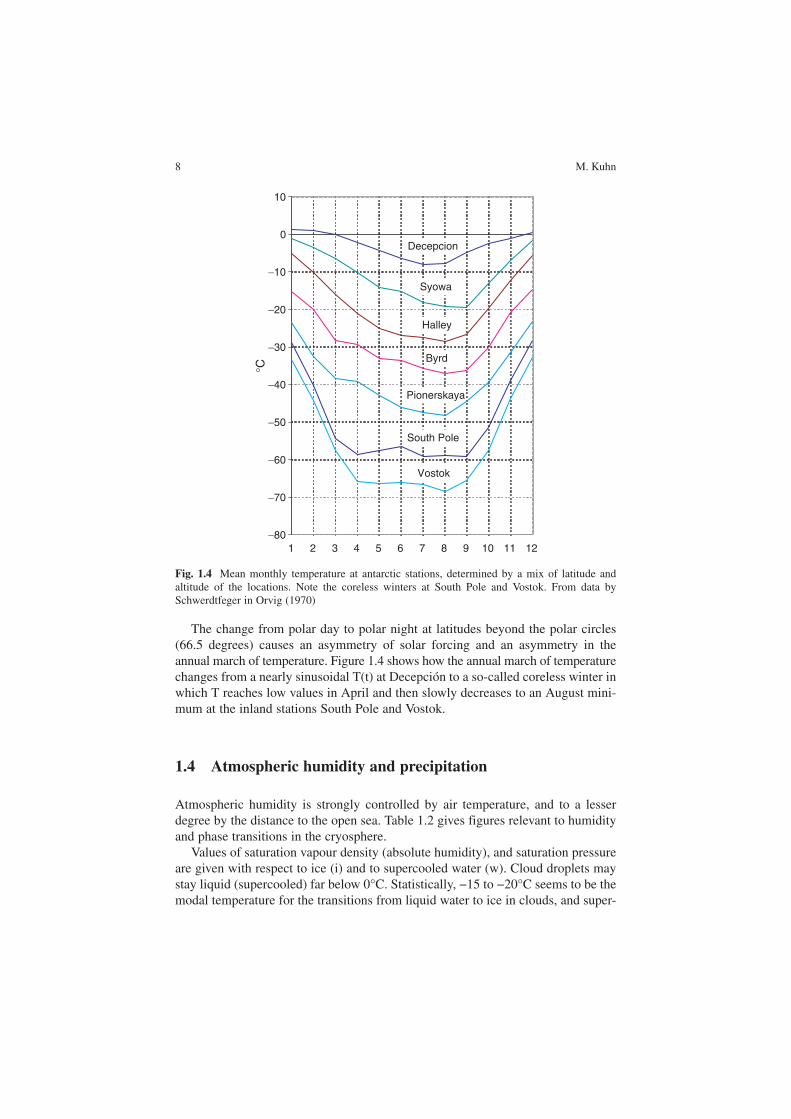
The decrease of temperature with increasing latitude ϕ is very obvious in Fig. 1.4. The station Decepción is situated at sea level on an island at 63° S. It displays the low annual variation of temperature typical for oceanic situations. The extreme latitude of South Pole Station (2,800 m) does not give it extreme temperatures; it is exceeded by Vostok Station at 3,400 m. The annual range of temperatures increases with latitude and altitude due to both solar geometry and decreasing cloudiness at continental stations.
The daily range of temperature, on the other hand, is determined by the daily range of solar elevation which is 2(90 – ϕ), limited by a culmination at 90 – ϕ + δwhere δ is the solar declination. This means that there is no daily range of solar elevation and temperature at the poles.
Fig. 1.3 Temperature gradients between five pairs of stations in the Eastern Alps; highest, mean, and lowest values in °C per 100 m
Table 1.1 Mean diurnal and annual temperature ranges at an alpine valley station (Gastein, 1,100 m above sea level) and a mountain station (Sonnblick, 3,200 m)
Location Parameter January July Annual range
Gastein Tmin
(°C) −7.4 12.5 19.9 T
max (°C) −1.5 21.1 22.6
Daily range (°C) 5.9 8.6 Sonnblick T
min (°C) −14.2 0.5 14.7
Tmax
(°C) −12.7 2.7 15.4Daily range (°C) 1.5 2.2
8 M. Kuhn
The change from polar day to polar night at latitudes beyond the polar circles (66.5 degrees) causes an asymmetry of solar forcing and an asymmetry in the annual march of temperature. Figure 1.4 shows how the annual march of temperaturechanges from a nearly sinusoidal T(t) at Decepción to a so-called coreless winter in which T reaches low values in April and then slowly decreases to an August mini-mum at the inland stations South Pole and Vostok.
1.4 Atmospheric humidity and precipitation
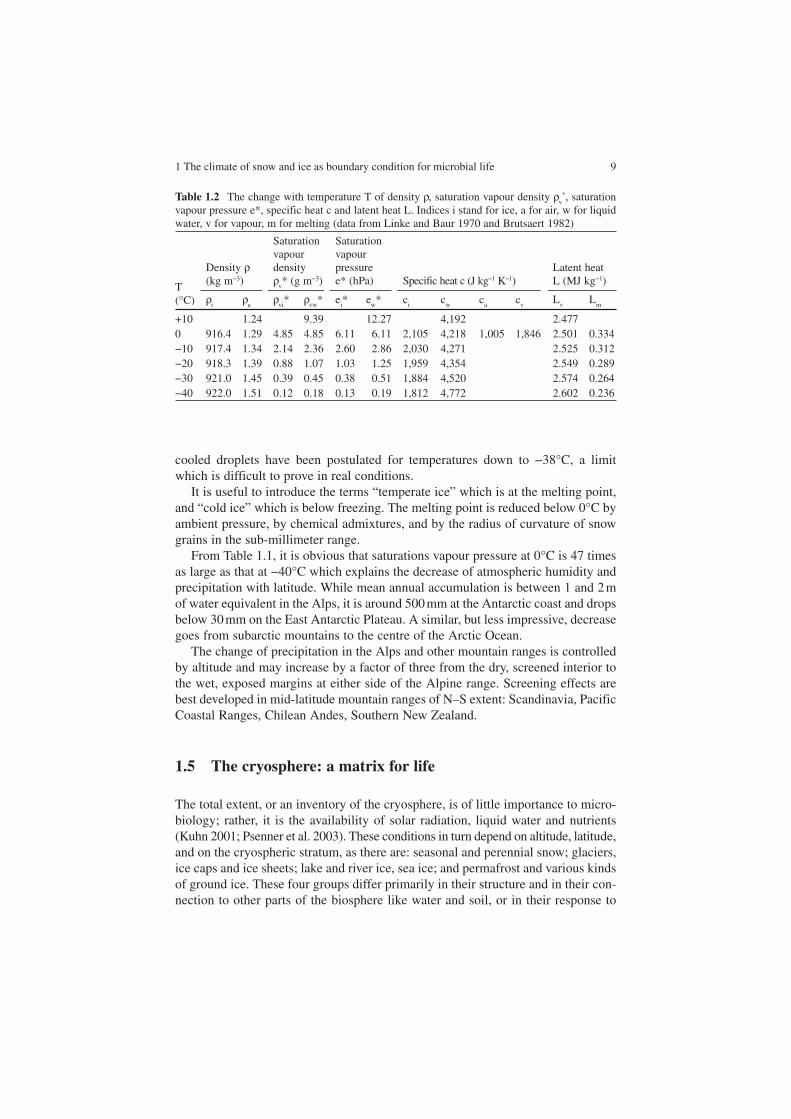
Atmospheric humidity is strongly controlled by air temperature, and to a lesser degree by the distance to the open sea. Table 1.2 gives figures relevant to humidity and phase transitions in the cryosphere.
Values of saturation vapour density (absolute humidity), and saturation pressure are given with respect to ice (i) and to supercooled water (w). Cloud droplets may stay liquid (supercooled) far below 0°C. Statistically, −15 to −20°C seems to be the modal temperature for the transitions from liquid water to ice in clouds, and super-
South Pole
Byrd
Vostok
Halley
Syowa
Decepcion
Pionerskaya
−80
−70
−60
−50
−40
−30
−20
−10
0
10
1 2 3 4 5 6 7 8 9 10 11 12
°C
Fig. 1.4 Mean monthly temperature at antarctic stations, determined by a mix of latitude and altitude of the locations. Note the coreless winters at South Pole and Vostok. From data by Schwerdtfeger in Orvig (1970)
1 The climate of snow and ice as boundary condition for microbial life 9
cooled droplets have been postulated for temperatures down to −38°C, a limit which is difficult to prove in real conditions.
It is useful to introduce the terms “temperate ice” which is at the melting point, and “cold ice” which is below freezing. The melting point is reduced below 0°C by ambient pressure, by chemical admixtures, and by the radius of curvature of snow grains in the sub-millimeter range.
From Table 1.1, it is obvious that saturations vapour pressure at 0°C is 47 times as large as that at −40°C which explains the decrease of atmospheric humidity and precipitation with latitude. While mean annual accumulation is between 1 and 2 m of water equivalent in the Alps, it is around 500 mm at the Antarctic coast and drops below 30 mm on the East Antarctic Plateau. A similar, but less impressive, decrease goes from subarctic mountains to the centre of the Arctic Ocean.
The change of precipitation in the Alps and other mountain ranges is controlled by altitude and may increase by a factor of three from the dry, screened interior to the wet, exposed margins at either side of the Alpine range. Screening effects are best developed in mid-latitude mountain ranges of N–S extent: Scandinavia, Pacific Coastal Ranges, Chilean Andes, Southern New Zealand.
1.5 The cryosphere: a matrix for life
The total extent, or an inventory of the cryosphere, is of little importance to micro-biology; rather, it is the availability of solar radiation, liquid water and nutrients (Kuhn 2001; Psenner et al. 2003). These conditions in turn depend on altitude, latitude,and on the cryospheric stratum, as there are: seasonal and perennial snow; glaciers, ice caps and ice sheets; lake and river ice, sea ice; and permafrost and various kinds of ground ice. These four groups differ primarily in their structure and in their con-nection to other parts of the biosphere like water and soil, or in their response to
Table 1.2 The change with temperature T of density ρ, saturation vapour density ρv*, saturation
vapour pressure e*, specific heat c and latent heat L. Indices i stand for ice, a for air, w for liquid water, v for vapour, m for melting (data from Linke and Baur 1970 and Brutsaert 1982)
T(°C)
Density ρ(kg m−3)
Saturationvapour densityρ
v* (g m−3)
Saturationvapour pressuree* (hPa) Specific heat c (J kg−1 K−1)
Latent heat L (MJ kg−1)
ρi
ρa
ρvi* ρ
vw* e
i* e
w* c
ic
wc
ac
vL
vL
m
+10 1.24 9.39 12.27 4,192 2.4770 916.4 1.29 4.85 4.85 6.11 6.11 2,105 4,218 1,005 1,846 2.501 0.334−10 917.4 1.34 2.14 2.36 2.60 2.86 2,030 4,271 2.525 0.312−20 918.3 1.39 0.88 1.07 1.03 1.25 1,959 4,354 2.549 0.289−30 921.0 1.45 0.39 0.45 0.38 0.51 1,884 4,520 2.574 0.264−40 922.0 1.51 0.12 0.18 0.13 0.19 1,812 4,772 2.602 0.236
10 M. Kuhn
climatic changes: while the seasonal snow pack receives an atmospheric forcing first, ground ice or the base of ice sheets are last. The structure of the cryospheric strata determines the transport of energy, water and nutrients, where both energy and nutrient fluxes may be connected to liquid water.
Of the four groups, lake, sea and ground ice are frozen water (congelation ice), while snow and glacier ice is of atmospheric origin (meteoric ice). Airborne crystals of a large variety of shapes, that are systematically determined by temperature and supersaturation of atmospheric water vapour, precipitate to build the snow pack at the Earth’s surface. The original, delicate snow crystals immediately start changing into rounded grains by what is called destructive metamorphism that transfers molecules from tips and convex sites on the crystal surface to the grooves and concave sites. The various stages of transformation are very well illustrated in the International Classification of Snow on the Ground (Colbeck et al. 1990). The granular shape makes for a denser packing of the snow, a density of about 300 kg m−3
being typical for old, dry alpine as well as polar snow.Early winter snow packs experience heat flow from the ground beneath and heat
loss to the atmosphere from the top layer, which may result in temperature gradi-ents of several degrees per meter. Associated with the temperature gradient there is a strong gradient of vapour pressure in the pore space, which induces upward dif-fusion of water vapour and the build-up of facetted crystals of a size of several mm, the so-called constructive metamorphism.
In polar snow, in the absence of melting and with weak temperature gradients, the further growth of snow grains and the final, gradual conversion to ice proceeds slowly. Under alpine conditions with frequent melt-freeze cycles, the grains become repeatedly surrounded by liquid water films. In that stage of metamorphism, the melting point of small grains is lower than that of the larger ones which will attain a modal size of 1–2 mm. This is the uniform snow that skiers indulge in, calling it firn in their terminology (in glaciological terms, firn is the snow that has survived one hydrological year).
The snow matrix in the most general case consists of ice, liquid water, water vapour, air. It has peculiar properties, being permeable to both air and water flows at bulk snow densities of up to 830 kg m−3, and permeable to short wave radiation at any density. Its pore space, that is the volume not filled by ice, may contain water or gases. Convection in the pore space may transport latent heat of evaporation/sublimation, and sensible heat. There is a net radiative transfer of long wave (infrared) radiation from one pore wall to the opposite wall in a general temperature gradient. There is, of course, molecular conduction of heat through the snow matrix.
In summary, there are fluxes of air and liquid water through the snow pack, both including soluble and insoluble impurities. Electromagnetic radiation penetrates the snow pack, directly in the short wave range and wall-to-wall in the infrared. The molecular conduction becomes increasingly important in the deeper layers with increasing bulk density. It is usually formulated as
C = λ dT/dzwhere the depth z is positive into the ground and C is positive when directed towards the surface. The thermal conductivity λ and the thermal diffusivity K effectively
1 The climate of snow and ice as boundary condition for microbial life 11
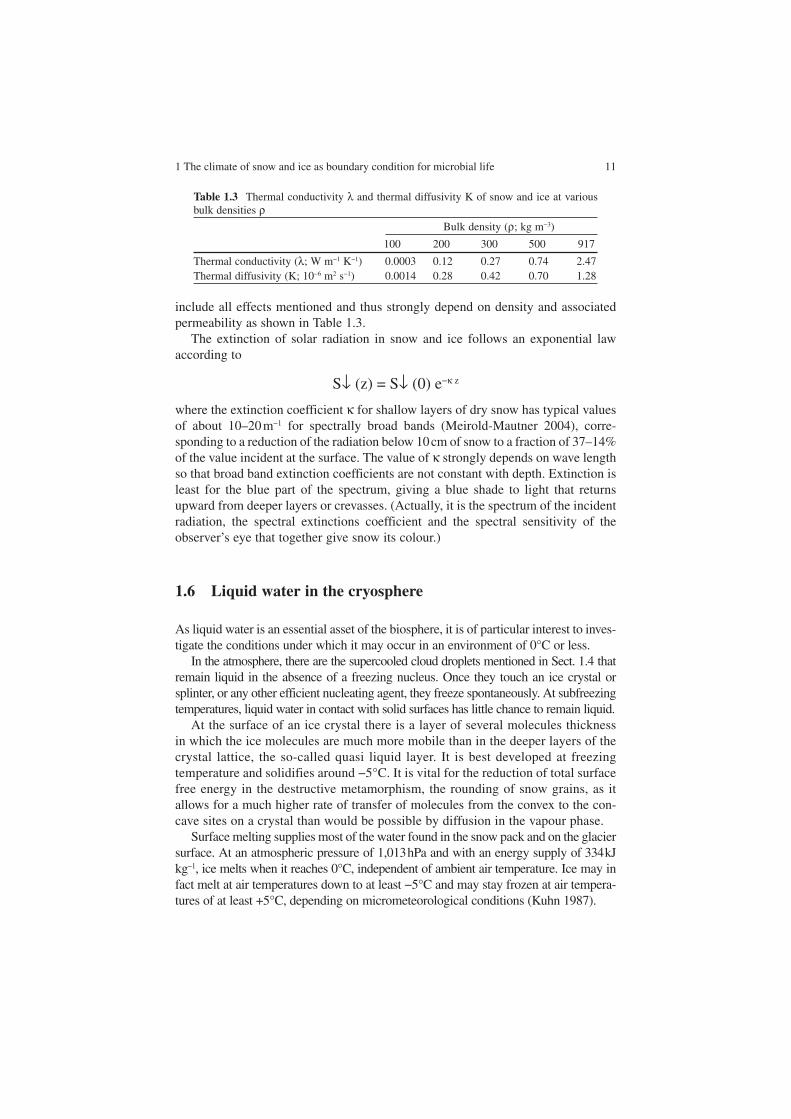
include all effects mentioned and thus strongly depend on density and associated permeability as shown in Table 1.3.
The extinction of solar radiation in snow and ice follows an exponential law according to
S↓ (z) = S↓ (0) e−κ z
where the extinction coefficient κ for shallow layers of dry snow has typical values of about 10–20 m−1 for spectrally broad bands (Meirold-Mautner 2004), corre-sponding to a reduction of the radiation below 10 cm of snow to a fraction of 37–14% of the value incident at the surface. The value of κ strongly depends on wave length so that broad band extinction coefficients are not constant with depth. Extinction is least for the blue part of the spectrum, giving a blue shade to light that returns upward from deeper layers or crevasses. (Actually, it is the spectrum of the incident radiation, the spectral extinctions coefficient and the spectral sensitivity of the observer’s eye that together give snow its colour.)
1.6 Liquid water in the cryosphere
As liquid water is an essential asset of the biosphere, it is of particular interest to inves-tigate the conditions under which it may occur in an environment of 0°C or less.
In the atmosphere, there are the supercooled cloud droplets mentioned in Sect. 1.4 that remain liquid in the absence of a freezing nucleus. Once they touch an ice crystal or splinter, or any other efficient nucleating agent, they freeze spontaneously. At subfreezing temperatures, liquid water in contact with solid surfaces has little chance to remain liquid.
At the surface of an ice crystal there is a layer of several molecules thickness in which the ice molecules are much more mobile than in the deeper layers of the crystal lattice, the so-called quasi liquid layer. It is best developed at freezing temperature and solidifies around −5°C. It is vital for the reduction of total surface free energy in the destructive metamorphism, the rounding of snow grains, as it allows for a much higher rate of transfer of molecules from the convex to the con-cave sites on a crystal than would be possible by diffusion in the vapour phase.
Surface melting supplies most of the water found in the snow pack and on the glacier surface. At an atmospheric pressure of 1,013 hPa and with an energy supply of 334 kJ kg−1, ice melts when it reaches 0°C, independent of ambient air temperature. Ice may in fact melt at air temperatures down to at least −5°C and may stay frozen at air tempera-tures of at least +5°C, depending on micrometeorological conditions (Kuhn 1987).
Table 1.3 Thermal conductivity λ and thermal diffusivity K of snow and ice at various bulk densities ρ
Bulk density (ρ; kg m−3)
100 200 300 500 917
Thermal conductivity (λ; W m−1 K−1) 0.0003 0.12 0.27 0.74 2.47Thermal diffusivity (K; 10−6 m2 s−1) 0.0014 0.28 0.42 0.70 1.28
12 M. Kuhn
Proceeding downwards on a glacier that spans the thermal regime from cold at the top to temperate at the terminus, one first walks on the dry facies, where melting never occurs. This is followed by a zone where snow melts at the surface but melt water does not percolate through the entire annual layer, leaving a dry layer between layers of refrozen snow. Farther below, melt water percolates the entire annual layer and refreezes as superimposed ice on the impermeable surface of the ice body. This form of latent heat transport is the reason why most alpine glaciers below 3,400 m are temperate in spite of mean annual ambient air temperatures far below freezing.
Below that zone, melting and net ablation of glacier ice prevails. Melt water produced at the glacier surface penetrates the ice in cracks, crevasses and in the funnels of moulins and leaves it in a system of braided channels.
Surface melting may produce extended areas of water-soaked firn where algal growth is promoted and further enhances melting on account of its low albedo (Meirold-Mautner 2004). When the firn pore space is saturated with melt water, the surface layer may accelerate downwards as a slush flow or may stagnate and form supraglacial lakes. These lakes have a lower albedo than the surrounding ice, absorb solar radiation and heat from the surface and throughout. Thereby, they attain water temperatures above freezing which are associated with increasing den-sity up to 4°C. Where in contact with the underlying ice, their water stays at 0°C, which induces thermal downward convection of warmer, denser surface water and the positive feed back of enhanced melting.
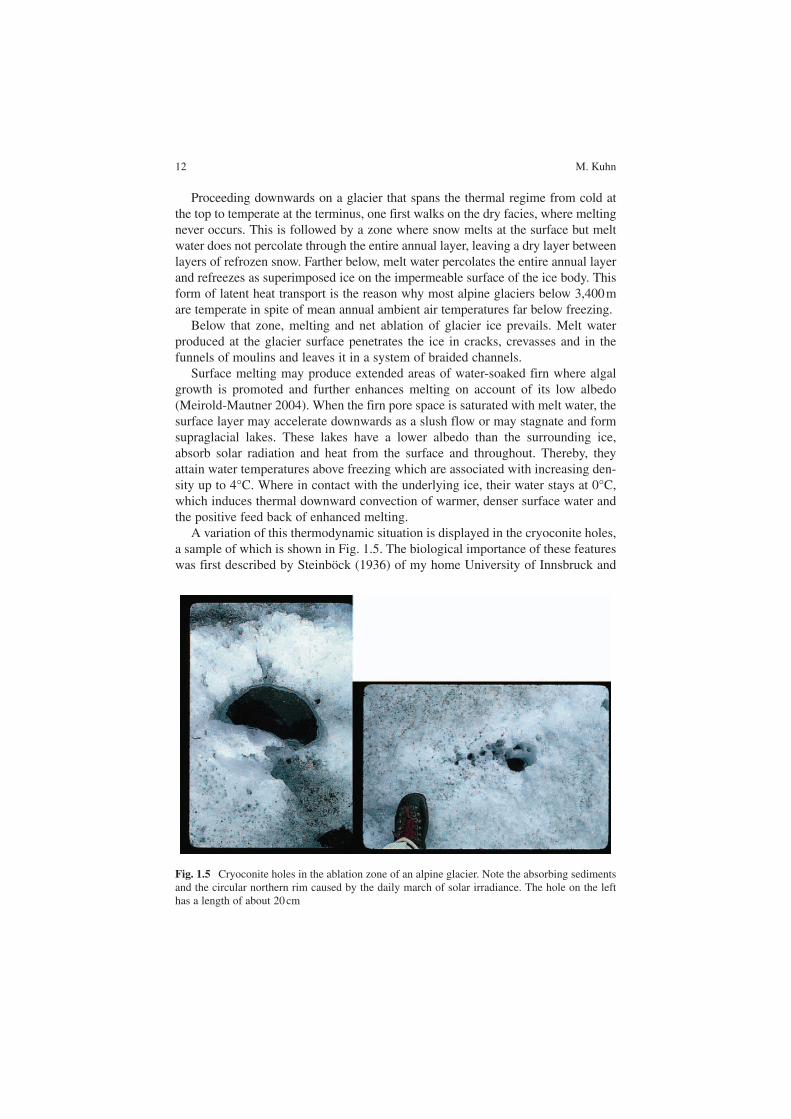
A variation of this thermodynamic situation is displayed in the cryoconite holes, a sample of which is shown in Fig. 1.5. The biological importance of these features was first described by Steinböck (1936) of my home University of Innsbruck and
Fig. 1.5 Cryoconite holes in the ablation zone of an alpine glacier. Note the absorbing sediments and the circular northern rim caused by the daily march of solar irradiance. The hole on the left has a length of about 20 cm
1 The climate of snow and ice as boundary condition for microbial life 13
has recently received revived interest (Margesin et al. 2002). When insoluble organic and inorganic particles move in the water film on top of a melting glacier, they may happen to concentrate and build a dark sediment that absorbs solar radia-tion at a high rate, heats up and melts down into the ice. The circular shape of the cryoconite hole in Fig. 1.5 reflects the daily circle of solar radiation and its melting power. A radially small plaque of cryoconite or a small stone will melt vertically downward in the top centimeters of the ice; larger bodies like the one displayed in Fig. 1.5 will have an oblique melt channel of decimeter depth. Absorption of solar radiation that heats the bottom sediments up to a temperature of 4°C creates stable layering in the cryoconite hole and thus promotes downward melting.
Yet another thermodynamic situation is seen in the lakes of the Antarctic Dry Valleys which have a permanent ice cover of 3–6 m thickness (McKay et al. 1985). Here, water is kept liquid under an ice cover that separates it from air of mean annual temperature of −20°C. This is accomplished by a minor contribution of geothermal heat and a major energy gain from seasonal, or ephemeral, lateral influx of melt water from the ice free surroundings (Lewis et al. 1998), comparable in a particular way to the maintenance of temperate conditions in alpine glaciers versus an ambient temperature below freezing.
At the base of glaciers or ice sheets, the load of ice exerts an overburden pressure of 1 bar (105 Pa) per 11 m of ice thickness. The increased pressure in turn reduces the melting point by 0.76 × 10⁻⁶ per Pa so that the pressure melting point below 4,000 m of ice is −2.8°C. These are conditions prevailing at a number of subglacial lakes in Antarctica (Siegert et al. 2001). Regardless of the extremely low surface temperatures of Antarctic ice, melting at the base of the ice sheet is powered by the geothermal heat flux which has a global average of 60 mW m−2, sufficient to melt 7 mm of ice per year, a value that applies to the base of shallow, temperate glaciers as well.
1.7 Hot spots in the ice
The differential absorption of solar radiation by dark rocks may create isolated spots of temperatures far above freezing. While cryoconite, sand or small stones absorb more solar radiation than ice or snow, heat up and melt down into the ice, large rocks absorb similar amounts of energy per unit surface area, but due to their thickness have smaller temperature gradients and less heat conduction downward. Their energy gain is thus used to raise their temperature and, under alpine summer conditions, this may result in rock surface temperatures in excess of +40°C. One rock of 2 m diameter, protruding 1 m above the surrounding snow surface at 3,000 m above sea level, was measured with an IR thermometer in early summer in the Austrian Alps. Its surface temperature rose to 42°C in the early afternoon on its southerly aspect, and to a similar temperature on its western side about 1 h later.
A profile of surface temperatures from the glacier tongue of Hintereisferner across the moraine was recorded in late May, with peak temperatures again exceeding
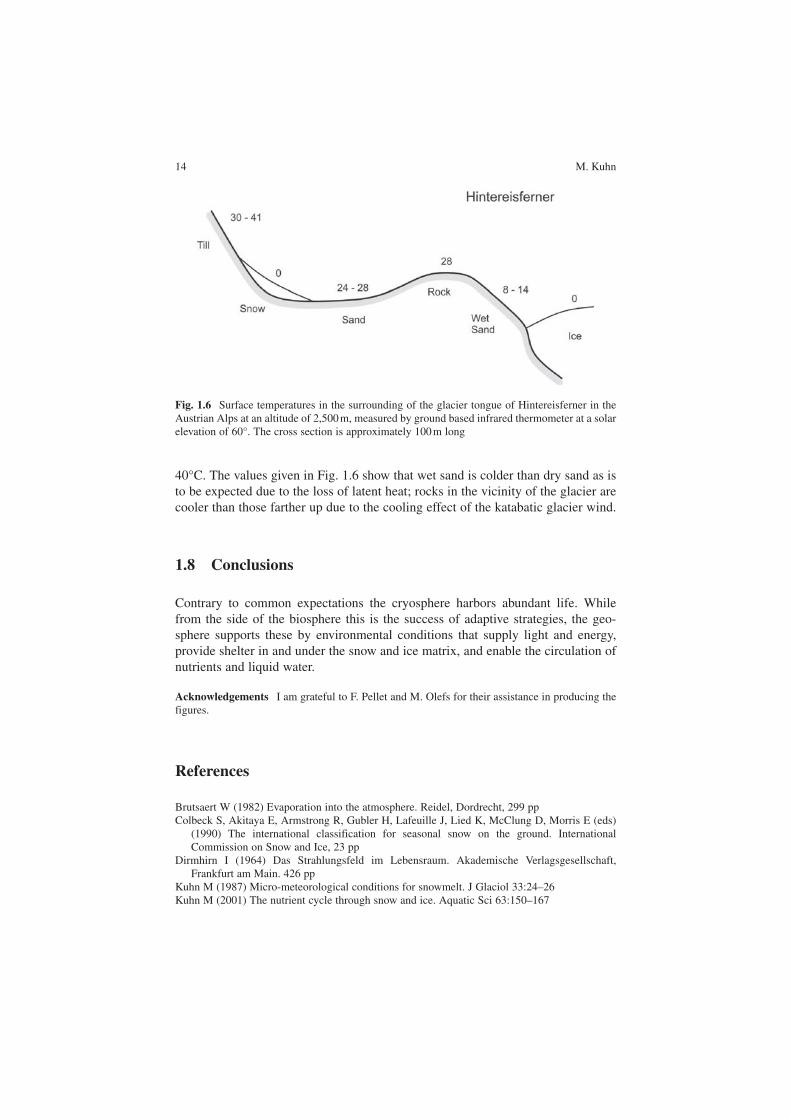
14 M. Kuhn
40°C. The values given in Fig. 1.6 show that wet sand is colder than dry sand as is to be expected due to the loss of latent heat; rocks in the vicinity of the glacier are cooler than those farther up due to the cooling effect of the katabatic glacier wind.
1.8 Conclusions
Contrary to common expectations the cryosphere harbors abundant life. While from the side of the biosphere this is the success of adaptive strategies, the geo-sphere supports these by environmental conditions that supply light and energy, provide shelter in and under the snow and ice matrix, and enable the circulation of nutrients and liquid water.
Acknowledgements I am grateful to F. Pellet and M. Olefs for their assistance in producing the figures.
References
Brutsaert W (1982) Evaporation into the atmosphere. Reidel, Dordrecht, 299 ppColbeck S, Akitaya E, Armstrong R, Gubler H, Lafeuille J, Lied K, McClung D, Morris E (eds)
(1990) The international classification for seasonal snow on the ground. International Commission on Snow and Ice, 23 pp
Dirmhirn I (1964) Das Strahlungsfeld im Lebensraum. Akademische Verlagsgesellschaft, Frankfurt am Main. 426 pp
Kuhn M (1987) Micro-meteorological conditions for snowmelt. J Glaciol 33:24–26Kuhn M (2001) The nutrient cycle through snow and ice. Aquatic Sci 63:150–167
Fig. 1.6 Surface temperatures in the surrounding of the glacier tongue of Hintereisferner in the Austrian Alps at an altitude of 2,500 m, measured by ground based infrared thermometer at a solar elevation of 60°. The cross section is approximately 100 m long
1 The climate of snow and ice as boundary condition for microbial life 15
Lewis K, Fountain A, Dana G (1998) Surface energy balance and meltwater production for a Dry Valley glacier, Taylor Valley, Antarctica. Ann Glaciol 27:603–609
Linke F, Baur F (1970) Meteorologisches Taschenbuch. Akademische Verlagsgesellschaft Geest & Portig, Leipzig, 712 pp
Margesin R, Zacke G, Schinner F (2002) Characterization of heterotrophic microorganisms in alpine glacier cryoconite. Arct Antarct Alp Res 34:88–93
McKay Ch, Clow G, Wharton R, Squyres S (1985) Thickness of ice on perennially frozen lakes. Nature 313:561–562
Meirold-Mautner I (2004) A physical snow-radiation model: measurements, model development and applications to the ecosystem snow. Doctoral thesis, Institute of Meteorology and Geophysics, University of Innsbruck, Austria, 134 pp
Orvig S (ed) (1970) Climates of the polar regions. World Survey of Climatology, vol 14. Elsevier, Orvig, 370 pp
Psenner R, Wille A, Priscu J, Felip M, Wagenbach D, Sattler B (2003) Extremophiles: ice ecosys-tems and biodiversity. In: Gerday C (ed) Knowledge for sustainable development. An insight into the Encyclopaedia of Life Support Systems, vol III, UNESCO Publishing - Eolss Publishers, Oxford, UK, pp 573–598 (updated 2007)
Siegert M, Ellis-Evans JC, Tranter M, Mayer C, Petit J-R, Salamatin A, Priscu J (2001) Physical, chemical and biological processes in Lake Vostok and other Antarctic subglacial lakes. Nature 414:603–609
Steinböck O (1936) Über Kryokonitlöcher und ihre biologische Bedeutung. Z Gletscherkd 24:1–21
Chapter 2Limits for Microbial Life at Subzero Temperatures
Corien Bakermans
2.1 Introduction
The limitations of terrestrial life are not well-defined or understood and have primarily been advanced through exploration and discovery of organisms living in “extreme” environments where life was not thought possible. Identifying the limits of life is hampered by our inability to define the essential nature of life, rather than just describing its properties (organization, energy use, growth, adaptation, response to stimuli, reproduction). Similarly, until the twentieth century, we could not define the essential nature of water (a molecule composed of two atoms of hydrogen and one atom of oxygen joined by covalent bonds), only its properties (colorless, solvent,liquid at specific temperatures and pressures). Additionally, when examining the limits of life, defining what is “alive” becomes more difficult. The metabolism of life is often separated into three classes: growth, maintenance, and survival (Morita 1997). Clearly an organism that is metabolizing actively enough to reproduce itself exhibits growth and is considered living. But what about organisms that are actively metabolizing but not reproducing? In this case, energy is consumed for repair and maintenance of cellular structures to preserve the integrity of the organism, but cannot sustain reproduction. Maintenance may also allow adaptation and evolution to changing conditions over very long time spans (other definitions of maintenance do not generally include evolution). Finally, organisms routinely survive conditions at which they cannot actively metabolize by forming completely inactive dormant
R. Margesin et al. (eds.) Psychrophiles: from Biodiversity to Biotechnology. 17© Springer-Verlag Berlin Heidelberg 2008
Corien BakermansCenter for Microbial Ecology, Michigan State University, East Lansing, MI 48824, USAe-mail: [email protected]
Contents2.1 Introduction ....................................................................................................................... 172.2 Physical chemical effects of low temperatures ................................................................. 18 2.2.1 Liquid water .......................................................................................................... 18 2.2.2 Reaction rates ........................................................................................................ 20 2.2.3 Molecular stability ................................................................................................ 212.3 Activity of microorganisms at subzero temperatures ....................................................... 222.4 Conclusions ....................................................................................................................... 25References .................................................................................................................................. 26
18 C. Bakermans
states (such as spores) or with very weak intermittent metabolism for the repair of accumulated damage.
This review is primarily interested in microorganisms that are actively metabolizing for growth or maintenance, not merely survival, at extreme low-temperature conditions. Microorganisms that actively live at subzero temperatures must evolve mechanisms to deal with the accompanying thermodynamic constraints. These constraints include the reduction of available liquid water accompanied by the formation of ice crystals, lower rates of catalysis and transport, decreased membrane fluidity, and stabilization of molecular structures (Cavicchioli et al. 2000). Most of these thermodynamic con-straints apply to all microorganisms at the lower limits of their growth temperature ranges; while the most severe constraints affect those microorganisms (psychrophiles) that grow at the lowest temperatures. Only recently have microbiologists begun to realize the potential for bacteria to actively survive, and even reproduce, at low tem-peratures (Graumann and Marahiel 1996; Russell and Hamamoto 1998; Deming 2002; Bowman 2004). Recent exploration and investigations of low-temperature environments are redefining the known limits of microbial activity and are fueled by new techniques and capabilities. This chapter reviews the physical chemical effects of low temperatures and the activity of microorganisms at subzero temperatures.
2.2 Physical chemical effects of low temperatures
The effects of temperature derive from its essential nature: the energy of motion of atoms. Temperature is a measure of the average energy of motion (vibration, rotation,or translation) of the atoms or molecules of a substance. Hence, cool molecules move, vibrate, and rotate less than hot molecules. Thermal energy promotes phase changes from solid to liquid to gas, diffusion of molecules within the gas or liquid phase, and conformation changes of enzymes and their substrates allowing chemical transformations to occur. As temperature decreases the available thermal energy (enthalpy) of a system decreases. The effects of temperature on liquid water, reaction rates, and molecular stability are discussed in the following sections.
2.2.1 Liquid water
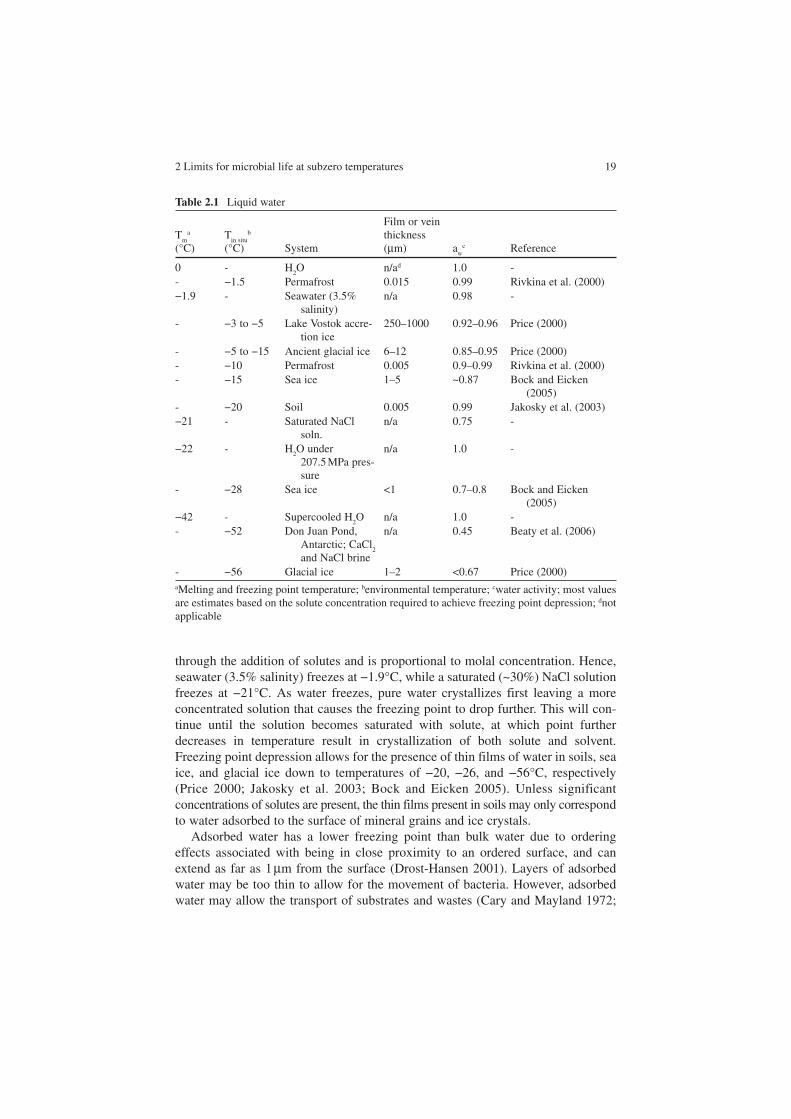
Liquid water is essential to life, yet water freezes at the relatively high temperature of 0°C. Without liquid water, there is no solvent system for enzymes, membranes, etc., to function in or for substrates to diffuse in. Ice crystals can also pierce cell membranes causing extensive damage. Liquid water can be maintained below 0°C by a variety of physical chemical processes, such as: freezing point depression, ordering effects, supercooling, and pressure (Table 2.1).
In environmental systems, freezing point depression is the dominant process for sustaining liquid water at subzero temperatures. Freezing point depression occurs
2 Limits for microbial life at subzero temperatures 19
through the addition of solutes and is proportional to molal concentration. Hence, seawater (3.5% salinity) freezes at −1.9°C, while a saturated (~30%) NaCl solution freezes at −21°C. As water freezes, pure water crystallizes first leaving a more concentrated solution that causes the freezing point to drop further. This will con-tinue until the solution becomes saturated with solute, at which point further decreases in temperature result in crystallization of both solute and solvent. Freezing point depression allows for the presence of thin films of water in soils, sea ice, and glacial ice down to temperatures of −20, −26, and −56°C, respectively (Price 2000; Jakosky et al. 2003; Bock and Eicken 2005). Unless significant concentrations of solutes are present, the thin films present in soils may only correspondto water adsorbed to the surface of mineral grains and ice crystals.
Adsorbed water has a lower freezing point than bulk water due to ordering effects associated with being in close proximity to an ordered surface, and can extend as far as 1 µm from the surface (Drost-Hansen 2001). Layers of adsorbed water may be too thin to allow for the movement of bacteria. However, adsorbed water may allow the transport of substrates and wastes (Cary and Mayland 1972;
Table 2.1 Liquid water
Tm
a
(°C)T
in situb
(°C) System
Film or vein thickness(µm) a
wc Reference
0 - H2O n/ad 1.0 -
- −1.5 Permafrost 0.015 0.99 Rivkina et al. (2000)−1.9 - Seawater (3.5%
salinity)n/a 0.98 -
- −3 to −5 Lake Vostok accre-tion ice
250–1000 0.92–0.96 Price (2000)
- −5 to −15 Ancient glacial ice 6–12 0.85–0.95 Price (2000)- −10 Permafrost 0.005 0.9–0.99 Rivkina et al. (2000)- −15 Sea ice 1–5 ~0.87 Bock and Eicken
(2005)- −20 Soil 0.005 0.99 Jakosky et al. (2003)−21 - Saturated NaCl
soln.n/a 0.75 -
−22 - H2O under 207.5 MPa pres-sure
n/a 1.0 -
- −28 Sea ice <1 0.7–0.8 Bock and Eicken (2005)
−42 - Supercooled H2O n/a 1.0 -
- −52 Don Juan Pond, Antarctic; CaCl
2
and NaCl brine
n/a 0.45 Beaty et al. (2006)
- −56 Glacial ice 1–2 <0.67 Price (2000)aMelting and freezing point temperature; benvironmental temperature; cwater activity; most values are estimates based on the solute concentration required to achieve freezing point depression; dnotapplicable


