37
Indonesia’s Largest, Fastest Growing, World Class Hospital Group PT Siloam International Hospitals Tbk

Indonesia’s Largest, Fastest Growing,
World Class Hospital Group
PT Siloam International Hospitals Tbk
Disclaimer
This presentation has been prepared by PT Siloam International Hospitals, Tbk (SILO ) and is circulated for the purpose of general
information only. It is not intended for any specific person or purpose and does not constitute a recommendation regarding the securities
of SILO. No warranty ( expressed or implied ) is made to the accuracy or completeness of the information. All opinions and estimations
included in this report constitute our judgment as of this date and are subject to change without prior notice. SILO disclaims any
responsibility or liability whatsoever arising which may be brought against or suffered by any person as a result of reliance upon the
whole or any part of the contents of this presentation and neither SILO nor any of its affiliated companies and their respective
employees and agents accept liability for any errors, omission, negligent or otherwise, in this presentation and any inaccuracy herein or
omission here from which might otherwise arise.
Forward – Looking Statements
The information communicated in this presentation contains certain statements that are or may be forward looking. These statements
typically contain words such as “will”, “expects” and “anticipates” and words of similar import. By their nature, forward looking statements
involve a number of risks and uncertainties that could cause actual events or results to differ materially from those described in this
presentation. Factors that could cause actual results to differ include, but are not limited to, economic, social, and political conditions in
Indonesia ; the state of the property industry in Indonesia; prevailing market conditions; increases in regulatory burdens in Indonesia,
including environmental regulation and compliance cost; fluctuations in foreign currency exchange rates; interest rate trends, cost of
capital and capital availability; the anticipated demand and selling prices for SILO developments and related capital expenditures and
investments; the cost of construction; availability of real estate property; competition from other companies and venues; shifts in
customer demands; changes in operation expenses, including employee wages, benefits, and training, governmental and public policy
changes; SILO’s ability to be and remain competitive; SILO’s financial condition, business strategy as well as the plans and objectives of
SILO’s management for future operations; generation of future receivables; and environmental compliance and remediation. Should one
or more of these uncertainties or risks, among others, materialize, actual results may vary materially from those estimated, anticipated
or projected. Specifically, but without limitation, capital costs could increase, projects could be delayed and anticipated improvements in
production, capacity or performance might not be fully realized. Although SILO believes that the expectations of its management as
reflected by such forward –looking statements are reasonable based on information currently available to us, no assurances can be
given that such expectations will prove to have been correct. You should not unduly rely on such statements. In any event, these
statements speak only as of the date hereof, and SILO undertakes no obligation to update or revise any of them, whether as a result of
new information, future events or otherwise.

Contents
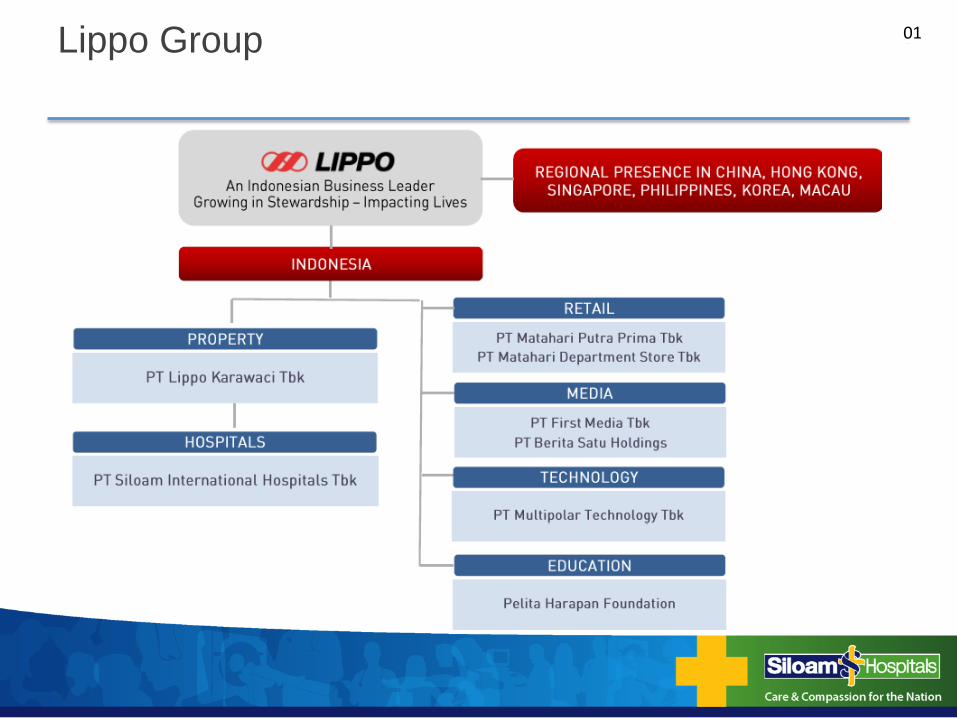
Lippo Group 01
Where We Are In Lippo Karawaci 02
Highly Experienced & Professional Management 03
The Vision 04
Nationwide Hospitals Network & Market Catchment 05
The Journey 06
The Landscape 07 - 09
The Strategy & Business Model 10 - 12
Premier Private Hospital Group 13 - 15
Operational & Financial Performance 16 - 25
Management Focus 26
Appendices 27 - 33
4
Lippo Group 01

5
Where We Are In Lippo Karawaci 02
6
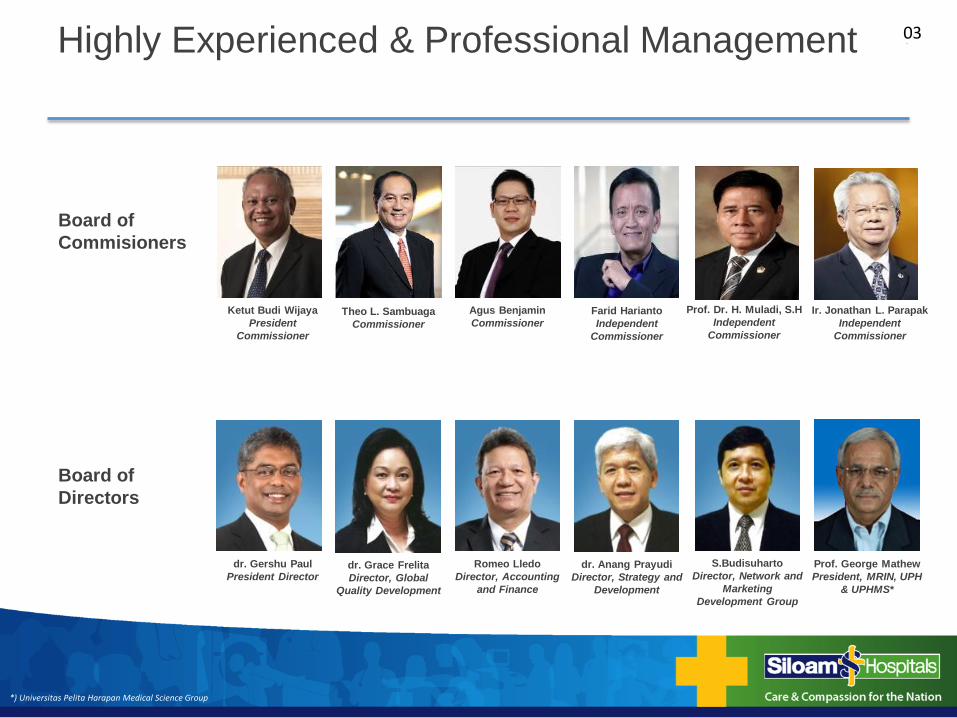
Highly Experienced & Professional Management
Board of
Directors
dr. Gershu Paul
President Director dr. Grace Frelita
Director, Global
Quality Development
Romeo Lledo
Director, Accounting
and Finance
Prof. George Mathew
President, MRIN, UPH
& UPHMS*
dr. Anang Prayudi
Director, Strategy and
Development
S.Budisuharto
Director, Network and
Marketing
Development Group
Board of
Commisioners
Ketut Budi Wijaya
President
Commissioner
Theo L. Sambuaga
Commissioner
Agus Benjamin
Commissioner
Ir. Jonathan L. Parapak
Independent
Commissioner
Farid Harianto
Independent
Commissioner
Prof. Dr. H. Muladi, S.H
Independent
Commissioner
03
*) Universitas Pelita Harapan Medical Science Group

7
Reach
Scale
International Quality
The Vision
Affordable and Accessible Healthcare
to all socio economic segments
Godly
Compassion
5 Year Vision… • Beds
3,000 to 10,000
• Patients per annum
1.5 million to 15 million
• Hospitals
14 to 40 hospitals
11 to over 25 cities
04
8
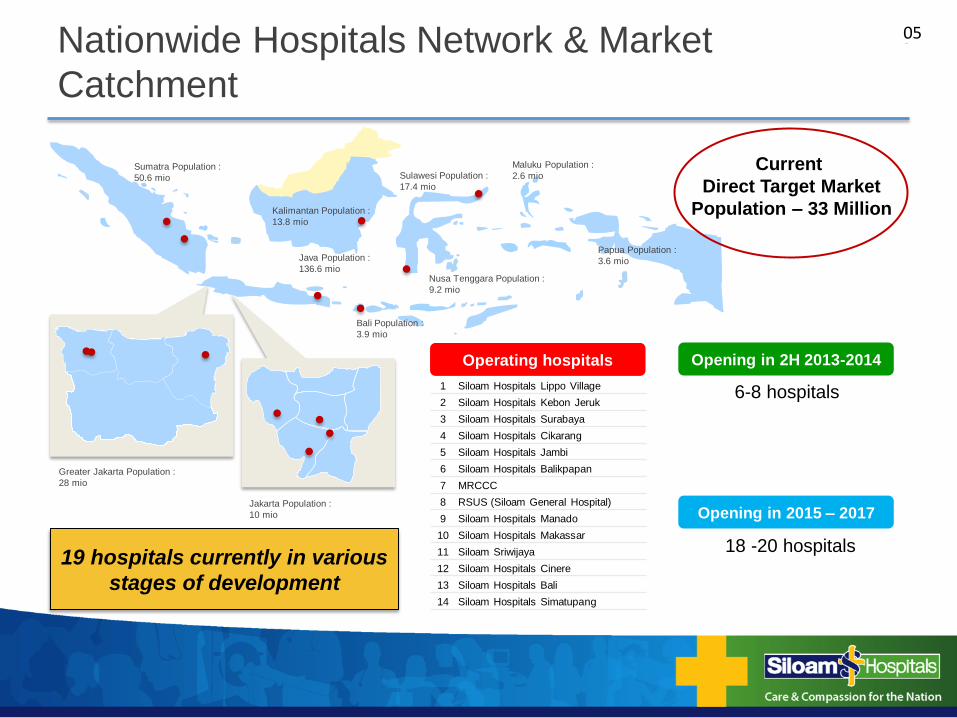
Nationwide Hospitals Network & Market
Catchment
05
1 Siloam Hospitals Lippo Village
2 Siloam Hospitals Kebon Jeruk
3 Siloam Hospitals Surabaya
4 Siloam Hospitals Cikarang
5 Siloam Hospitals Jambi
6 Siloam Hospitals Balikpapan
7 MRCCC
8 RSUS (Siloam General Hospital)
9 Siloam Hospitals Manado
10 Siloam Hospitals Makassar
11 Siloam Sriwijaya
12 Siloam Hospitals Cinere
13 Siloam Hospitals Bali
14 Siloam Hospitals Simatupang
Sumatra Population :
50.6 mio
Kalimantan Population :
13.8 mio
Java Population :
136.6 mio
Sulawesi Population :
17.4 mio
Papua Population :
3.6 mio
Bali Population :
3.9 mio
Nusa Tenggara Population :
9.2 mio
Maluku Population :
2.6 mio
Greater Jakarta Population :
28 mio
Jakarta Population :
10 mio Opening in 2015 – 2017
Operating hospitals Opening in 2H 2013-2014
18 -20 hospitals
6-8 hospitals
Current
Direct Target Market
Population – 33 Million
19 hospitals currently in various
stages of development
9
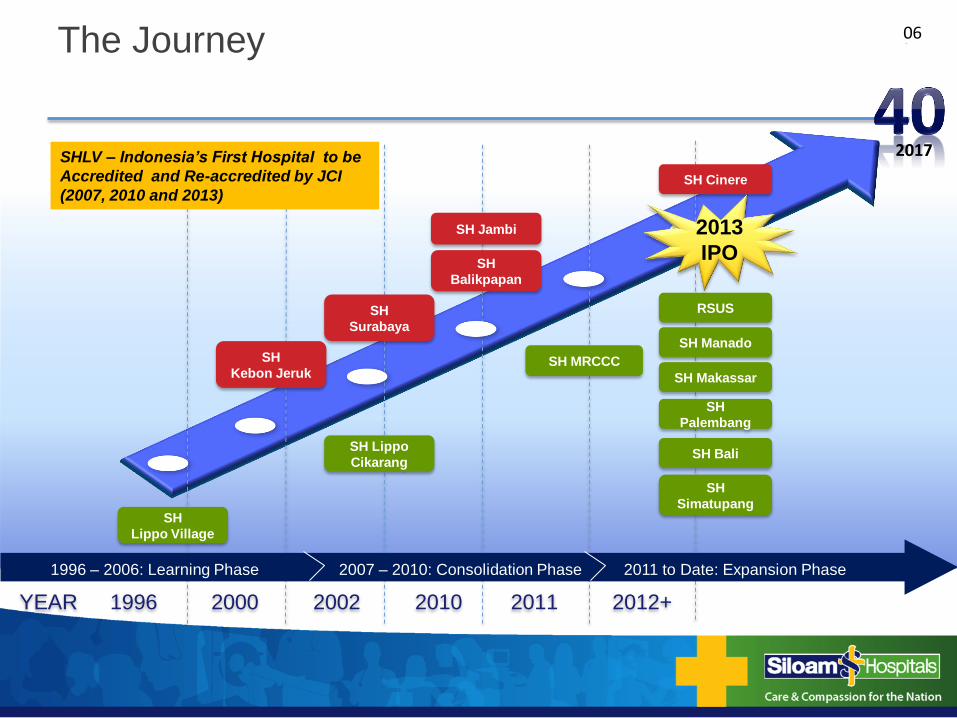
The Journey
YEAR 1996 2000 2002 2010 2011 2012+
SH MRCCC
SH Lippo
Cikarang
SH
Lippo Village
SH
Kebon Jeruk
SH
Balikpapan
SH Jambi
SH
Surabaya
1996 – 2006: Learning Phase 2007 – 2010: Consolidation Phase 2011 to Date: Expansion Phase
RSUS
SH Manado
SH Makassar
SH
Palembang
SH Bali
SHLV – Indonesia’s First Hospital to be
Accredited and Re-accredited by JCI
(2007, 2010 and 2013) SH Cinere
SH
Simatupang
06
2017
2013
IPO
10
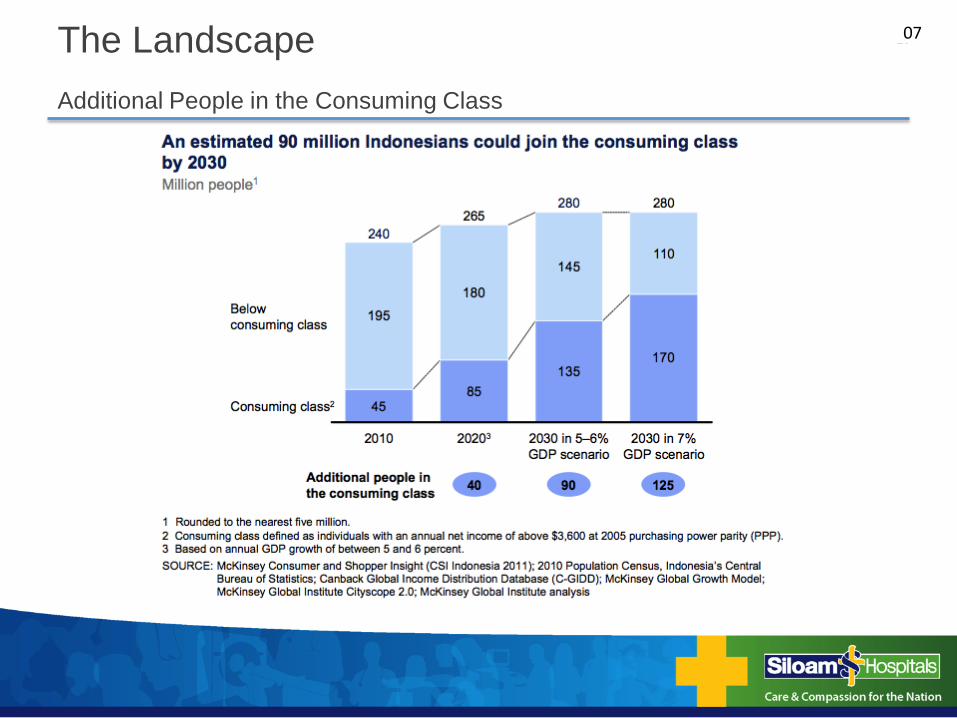
Additional People in the Consuming Class
The Landscape 07

11
Demography Profile
The Landscape
58% Coverage
Communicable Diseases
13%
Cardiovascular Diseases
31% Cancer
18%
Other Chronic Diseases
28%
Injuries 10%
Communicable Diseases
28%
Cardiovascular Diseases
30%
Cancer 13%
Other Chronic Diseases
20%
Injuries 9%
2008 2030
Relatively Young Population is Expected to Sustain in the Future
Changing Disease Pattern Morbidity Per Capita Healthcare Expenditure
2012 2018
USD 109 USD 237 Doubles in 6 years
Succeeding 20 Years
40%
Source: United Nations, Department of Economic and Social Affairs, Population Division (2011), Frost & Sullivan Estimates, Ministry of Health.
10.3 10.8 10.5 10.5 10.6 10.8 10.5 9.7 8.8 7.6 6.3 4.8 3.5 2.9 2.3 3.9
10.7 11.3 10.9 10.8 10.8 10.8 10.3 9.5 8.7 7.6 6.3 4.8 3.3 2.4 1.8 2.7
0-4
10-14
20-24
30-34
40-44
50-54
60-64
70-74
2012 Indonesian Population (mm) by Age and Gender
Female Male
• Life expectancy at birth is 68 years
• 50% of the population under 30 years
• Consistent population band for next 30 years
08

12
70,655 doctors v. Global: Shortage of 267,000 doctors(1)
v. OECD: Shortage of 718,086 doctors(1)
0.30 0.31
0.74
1.26
1.48
1.77
2.31
2.79
0.00
0.50
1.00
1.50
2.00
2.50
3.00
TH Indo India MY China SG US UK
0.97 1.02
1.63
2.01
2.16
2.84 2.84 2.95
0.00
0.50
1.00
1.50
2.00
2.50
3.00
3.50
Indo India MY TH SG UK US China
Severely Underserved Healthcare Markets
The Landscape
238,373 beds v. Global: Shortage of 229,491 beds (1) v. OECD: Shortage of 977,189 beds (1)
Doctors /1,000 population
OECD Average = 4.93
Beds /1,000 population
Note: (1) Calculated based on global average beds and doctors per 1,000 population ratios. (2) Latest available data for Thailand as of 2009. Source: Respective countries’ ministries of health, WHO, OECD.
OECD Average = 3.14
• Indonesia’s bed to population ratio way below global average
• Ample opportunity for private healthcare operators to fill the supply gap
• Doctor to population ratio also way below global average
• Ability to attract and retain doctors and specialists is a critical success factor for hospitals
Lack of Beds…
and Qualified Doctors…
(2) (2)
Global Average = 3.0
Global Average = 1.4
09

13
4 Pillar Foundation
The Strategy & Business Model
Siloam Hospitals’ four pillar foundation has been key to the success of our existing hospitals
and will serve as the basis for replicating this success at our expansion hospitals…
1
Emergency
Excellence in
Emergency Services
500-911
2
Technology
3
Telemedicine
4
Doctors
State-of-the-Art
Medical Equipment
and Systems
Digital Telemedicine
“Hub and Spoke”
Siloam Doctor
Partnership and
Development
Program
4 Pillar Foundation
10

14
Clinical Service Delivery
The Strategy & Business Model
• Primary clinics for corporate clients
• Public-Private-Partnership (PPP) model - Siloam Puskesmas (Public Health
Clinic)
• RSUS – First general hospital using public sector model
– Additional demand from patients under governmental insurance and social
schemes
– Gateway to Indonesia’s “Universal Healthcare Coverage” and Government
Health Insurance Programs
• Specialist access for
primary healthcare
demand
• Public-Private-
Partnership
• High standard and
accessible medical
care through focus
on clinical
governance and
affordable price
points
• Access to
Centres of
Excellence
through hub and
spoke system
and Tele-
medicine
3
2
1
Siloam’s
Integrated Healthcare
Delivery Model
Primary
Secondary
Tertiary
Research and Education • Integrated platform with UPHMS and other partnerships
• Medical students training at RSUS, SHLV, and SHKJ
• Integrated Centres of Excellence: Neuroscience, Cardiology, Cancer, Orthopedic, Urology,
Fertility
• Hub and Spoke strategy and extensive coverage of specialised services via Digital Tele-Medicine
• Pioneering investments in Indonesia’s healthcare sector
– Comprehensive Cancer Centre opened in 2011
– Indonesia’s first Gamma Knife installed in 2012
• Best in class and highly accessible healthcare services platform
through:
– Rapid expansion of hospital network across Indonesia
– Attracting and retaining the best doctors with strong focus on
doctors’ welfare (SDPDP)
– Equip hospitals with State-of-the-Art facilities such as 128 slice
CT Scan and 1.5T MRI
One-stop continuum of care at primary, secondary, tertiary and quaternary levels
Quaternary
11

15
UPHMS (UPH Medical Sciences)
The Strategy & Business Model
Centre of Excellence and
Global Reputation
• Alignment – across
teaching and service
delivery
• Affiliate with agencies
such as
ACORN/NUS/SGH/UOM
• Leading edge research
• Best practice Models
• Remote Access Diagnosis (RAD)
and Remote Access Clinical
Management (RACM)
• Telemedicine
• Centres of Clinical Excellence/
Accreditation
• Teaching Hospital paradigm
• Future workforce
• Systems based curriculum
converged with PBL
• Best practice replication
• Clinical placement
• Foundation for Innovation
• Overseas training –
Singapore/Australia/USA/China
UPHMS (UPH Medical Sciences)
·
Education Research
Clinical
12

16
Our Hospitals (Mature and Developing)
Premier Private Hospital Group
TANGERANG (West of Jakarta)
SILOAM HOSPITALS LIPPO VILLAGE
WEST JAKARTA
SILOAM HOSPITALS KEBON JERUK
EAST JAVA
SILOAM HOSPITALS SURABAYA
BEKASI (East of Jakarta)
SILOAM HOSPITALS CIKARANG
JCIA 322 Bed Capacity
228 GP and Specialists
455 Nurses
Centre of Excellence : Neurosience &
Heart Centre
279 Bed Capacity
213 GP and Specialists
325 Nurses
Centre of Excellence : Urology &
Orthopaedic
182 Bed Capacity
80 GP and Specialists
272 Nurses
Centre of Excellence : Fertility Centre
110 Bed Capacity
134 GP and Specialists
158 Nurses
Centre of Excellence : Occupational Health
EAST SUMATERA
SOUTH JAKARTA
SILOAM HOSPITALS JAMBI
MRCCC SILOAM SEMANGGI
331 Bed Capacity
155 GP and Specialists
255 Nurses
Centre of Excellence : Cancer Centre
106 Bed Capacity
57 GP and Specialists
135 Nurses
EAST KALIMANTAN
SILOAM HOSPITALS BALIKPAPAN
228 Bed Capacity
80 GP and Specialists
186 Nurses
83% Ownership
79.6% Ownership
13

17
SOUTH JAKARTA
SILOAM HOSPITALS TB SIMATUPANG
269 Bed Capacity
70 GP and Specialists
41 Nurses
Centre of Excellence : Emergency,
cardiology, oncology &
neuroscience
New Hospitals in 2012 to 2013
Premier Private Hospital Group
TANGERANG (West of Jakarta)
SILOAM GENERAL HOSPITAL (RSUS)
733 Bed Capacity
20 GP and Specialists
143 Nurses
NORTH SULAWESI
SILOAM HOSPITALS MANADO
231 Bed Capacity
76 GP and Specialists
188 Nurses
Centre of Excellence : Emergency
SOUTH SULAWESI
SILOAM HOSPITALS MAKASSAR
360 Bed Capacity
77 GP and Specialists
140Nurses
Centre of Excellence : Cardiology &
Emergency
BALI
SILOAM HOSPITALS BALI
281 Bed Capacity
82 GP and Specialists
133 Nurses
Centre of Excellence : Emergency,
medical tourism, orthopaedics &
cardiology
DEPOK (South of Jakarta)
SILOAM HOSPITALS CINERE
21 Bed Capacity
11 GP and Specialists
51 Nurses
Centre of Excellence: Cardiology
SOUTH SUMATERA
SILOAM HOSPITALS PALEMBANG
347 Bed Capacity
86 GP and Specialists
168 Nurses
14

18
Hospitals under Construction
Premier Private Hospital Group
NORTH SUMATERA
SILOAM HOSPITALS MEDAN
EAST NUSA TENGGARA
SILOAM HOSPITALS KUPANG
WEST JAVA
SILOAM HOSPITALS BANDUNG
CENTRAL JAVA
SILOAM HOSPITALS SEMARANG
EAST JAVA
SILOAM HOSPITALS SURABAYA
EXTENSION
There are currently 19 sites under
various stages of development
15

Operational & Financial
Performance For The 9 Months Ended September 30, 2013
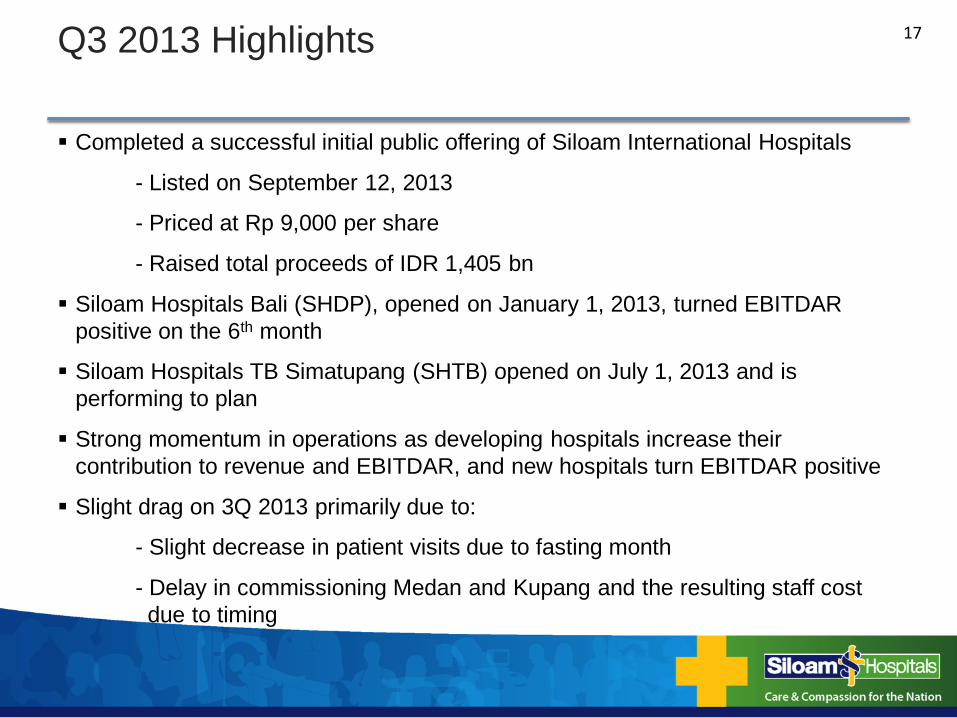
Completed a successful initial public offering of Siloam International Hospitals
- Listed on September 12, 2013
- Priced at Rp 9,000 per share
- Raised total proceeds of IDR 1,405 bn
Siloam Hospitals Bali (SHDP), opened on January 1, 2013, turned EBITDAR
positive on the 6th month
Siloam Hospitals TB Simatupang (SHTB) opened on July 1, 2013 and is
performing to plan
Strong momentum in operations as developing hospitals increase their
contribution to revenue and EBITDAR, and new hospitals turn EBITDAR positive
Slight drag on 3Q 2013 primarily due to:
- Slight decrease in patient visits due to fasting month
- Delay in commissioning Medan and Kupang and the resulting staff cost
due to timing
Q3 2013 Highlights 17
21
4 Mature 3 Developing RSUS 4 New 2012 2 New 2013
-
100,000
200,000
300,000
400,000
500,000
600,000
9M2012 9M2013
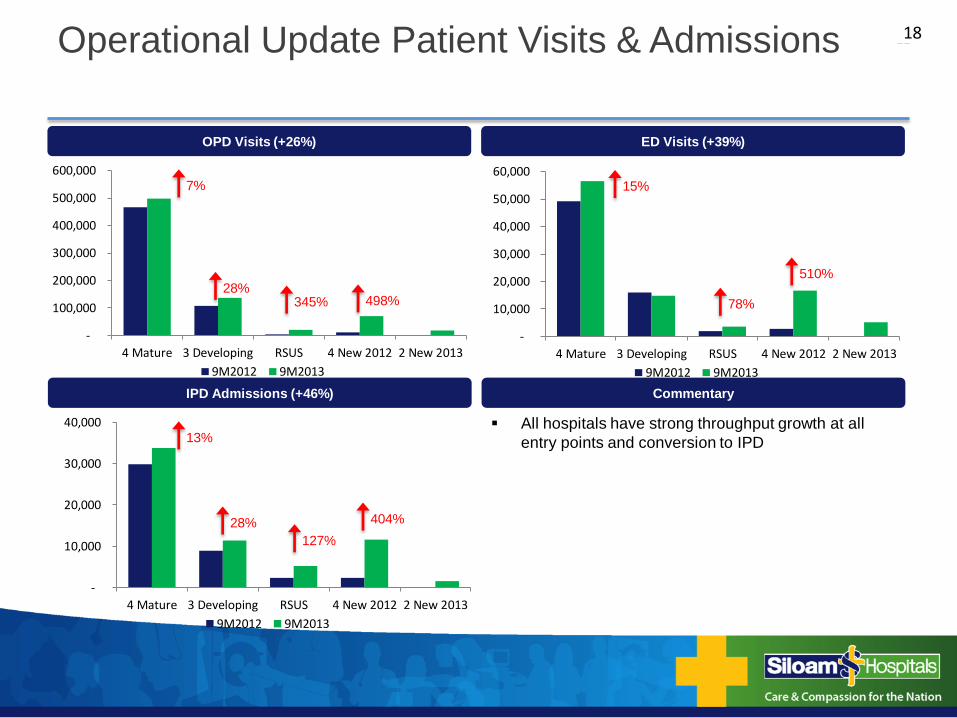
ED Visits (+39%) OPD Visits (+26%)
7%
28% 345% 498%
4 Mature 3 Developing RSUS 4 New 2012 2 New 2013
-
10,000
20,000
30,000
40,000
50,000
60,000
9M2012 9M2013
15%
78%
510%
4 Mature 3 Developing RSUS 4 New 2012 2 New 2013
-
10,000
20,000
30,000
40,000
9M2012 9M2013
13%
28%
127%
404%
Commentary IPD Admissions (+46%)
Operational Update Patient Visits & Admissions
All hospitals have strong throughput growth at all
entry points and conversion to IPD
18

22
Siloam is the clear leader and fastest growing private hospital group in Indonesia serving all segments of the population
Strong Financial Performance
737 890
1,030
1,259
1,788 1,830
2008 2009 2010 2011 2012 9M2013
102 114
140 155
221
201
2008 2009 2010 2011 2012 9M2013
Total Revenue EBITDA ( In Rp Bn ) ( In Rp Bn )
+21%
+16%
+22%
+42%
+12%
+23%
+10%
+43%
19
Notes: *) Audited figures for 9 months ended September 30, 2013 **) EBITDA refers to income before depreciation, provisions for post-employment benefits, allowance for impairment in value, corporate income taxes and other expense and/or income (consisting primarily of financing income and others-net).
*
*

23
Gross Operating Revenue 1,829.8 1,263.2 44.9%
Service Charge 493.4 367.9 34.1%
Net Operating Revenue 1,336.4 895.4 49.3%
Material Cost 594.3 419.8 41.6%
Gross Margin 742.1 475.5 56.0%
Operating Expenses 483.2 284.3 70.0%
EBITDAR 258.8 191.2 35.3%
% to GOR 14.1% 15.1%
Rent 24.5 11.9 105.1%
HO Expenses 33.1 22.9 44.4%
EBITDA 201.3 156.4 28.7%
% to GOR 11.0% 12.4%
9M2012 ∆%Description 9M2013
Q3 Results
Revenue & EBITDA Analyses 20
New Hospitals 2013
- SHDP, opened on January 1, 2013, performing as planned. Hit positive EBITDAR on the 6 th month.
- SHTB, opened on July 1, 2013, performing within plan.
New Hospitals 2012
- SHMK and SHPL are generating EBITDAR of 10% to GOR in Q3, exceeding expectations.
Commentary
(i) In IDR Bn
Notes: (i) Represents rental expenses for the land and buldings, Siloam is leasing from FREIT, PT Lippo Karawaci Tbk and other party. PT Lippo Karawaci started charging rent for
the land and buildings of 9 hospitals on May 1, 2013. (see note 34 of the audited financial statement as of and for the periods ended September 30, 2012 and 2013) (ii) EBITDA refers to income before depreciation, provisions for post-employment benefits, allowance for impairment in value, corporate income taxes and other expense
and/or income (consisting primarily of financing income and others-net).
(i)
(ii)

24
76%
61%
20%
21%
13%
9M2012 9M2013
4 Mature 3 Developing RSUS 4 New 2012 2 New 2013
EBITDAR Contribution and Growth by Classification Revenue Contribution and Growth by Classification
Commentary
(Rp bn) (Rp bn)
+ 16.6% + 50.3%
+ 452.6% + 304.4%
93% 88%
8%
12%
4%
9M2012 9M2013
4 Mature 3 Developing RSUS 4 New 2012 2 New 2013
+ 28.2% + 91.6.0%
+ 8,390.0% + 52.8%
Significant Growth in GOR (44.9%) and EBITDAR (35.3%).
Developing and new hospitals category will continue to grow over 50% as these hospitals ramp-up their operations
to mature level.
Mature hospitals will continue to have annual growth ranging from 15% to 20%.
Q3 Results
Revenue & EBITDAR Growth
Note: EBITDAR refers to income before rent, HO expenses, depreciation, provisions for post-employment benefits, allowance for impairment in value, corporate income taxes and other expense and/or income (consisting primarily of financing income and others-net).
21

25
Revenue Contribution 9M2013
Commentary
(Rp bn) SHLC, 6% SHBP, 5%
SHMK, 4%
SHMN, 4%
SHPL, 3%
SHJB, 3%
SHDP, 3%
RSUS, 2% SHCN, 2%
SHTB, 0%
SHLV, 27%
SHKJ, 18%
MRCCC, 13%
SHSB, 10%
EBITDAR Contribution 9M2013
(Rp bn) SHLC, 7% SHBP, 5%
SHMK, 3%
SHMN, -1% SHPL, 1% SHJB, 0%
SHDP, -1% RSUS, -2% SHCN, 0% SHTB, -1%
SHLV, 45%
SHKJ, 21%
MRCCC, 6%
SHSB, 15%
Q3 Results
Revenue & EBITDAR Contribution by Hospital
Currently, the 4 mature hospitals (SHLV, SHKJ, SHSB and SHLC) contribute 61% and 88% to the consolidated
Revenue and EBITDAR of SIH, respectively.
As the hospitals ramp-up their operations to mature level, their contribution to total revenue and EBITDAR will
significantly change going forward.
22
Note: EBITDAR refers to income before rent, HO expenses, depreciation, provisions for post-employment benefits, allowance for impairment in value, corporate income taxes and other expense and/or income (consisting primarily of financing income and others-net).

26
Assets 12M2012 Assets 9M2013
Commentary
(Rp bn) (Rp bn)
Property and Equipment,
1,198 Cash & Cash Equivalent,
978
A/R, 253
Inventories, 80
Others, 170
Property and Equipment,
865
Cash & Cash Equivalent,
169
A/R, 187
Inventories, 75
Others, 290
Rp 2,680 Billion Rp 1,586 Billion
As of September 30, 2013 and December 31, 2012
Balance Sheet - Assets
Increase in cash and cash equivalent from Rp 169bn to Rp 978bn (5.8x) was primarily due to the proceeds of the
IPO in September 2013.
Increase in property and equipment from Rp 865bn in 2012 to Rp 1,198bn in 2013 was primarily due to the
investments in new hospitals in October 2012 to September 2013.
23

27
Liabilities + Equity 12M2012 Liabilities + Equity 9M2013
Commentary
(Rp bn) (Rp bn) Current Liabilities,
388
Non Current Liabilities,
700
Equity, 1,593
Rp 2,680 Billion
Non Current Liabilities,
1,074
Current Liabilities,
268
Equity, 245
Rp 1,586 Billion
As of September 30, 2013 and December 31, 2012
Balance Sheet – Liabilities + Equity
Increase in equity from 12M2012 to 9M2013 was primarily due to the IPO offering in September 2013 and
accumulated net profit of the period ended.
Decrease in non-current liabilities was due to the partial payment to parent company from the proceeds of the IPO.
24

Q4 has historically been the strongest performing quarter and we expect a similar
trend this year
All hospitals continue to perform within plan, and SHTB is expected to hit
EBITDAR positive by early 2014
Construction of Medan and Kupang hospitals is underway and are expected to
open and commence operations early 2014
Drivers for Q4 2013 and Looking Ahead to 2014 25

29
i. Dynamic plug and play hospital models to respond to market needs as well
as market changes.
ii. Execute a clear strategy to drive business focus and stewardship
accountabilities.
iii. Focus on partnering with doctors and clinical staff to help us on our journey
iv. Achieve seamless service by optimizing our people, process and
technology capacity and capability.
v. Customize marketing and promotion to maximize use of our service capacity
and capability and achieve our vision.
vi. Fulfill the demand side through Public Private Partnership (PPP).
vii. Drive economies of scale in healthcare through Managed Care schemes.
viii. Continue building Clinical Excellence in Indonesia.
Management Focus 26

Appendices
31
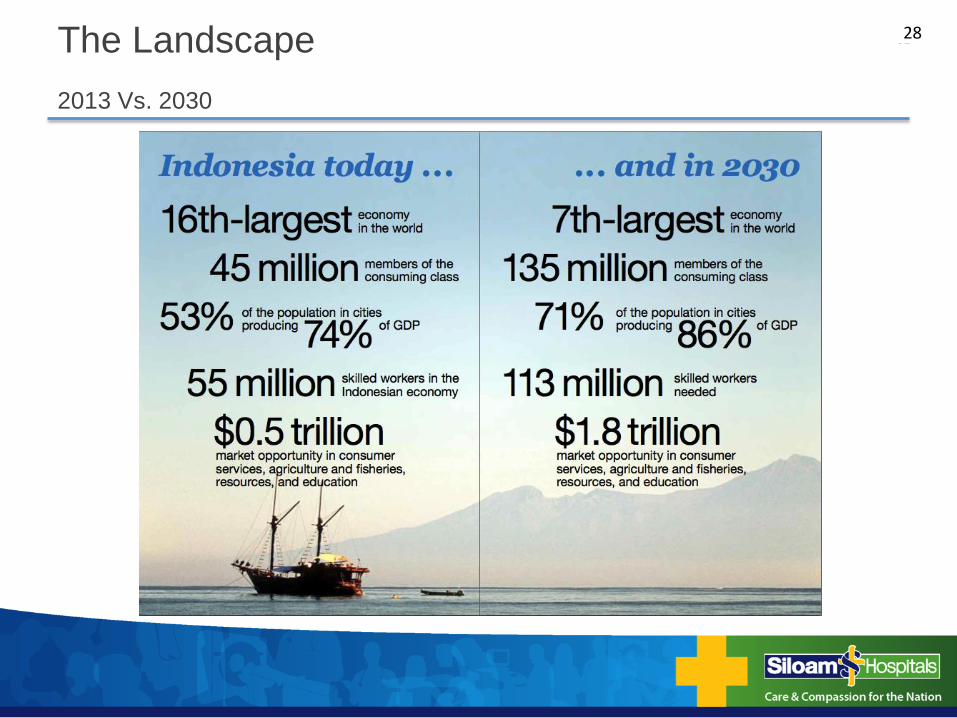
2013 Vs. 2030
The Landscape 28

32
Impressive Performance over the Past Decade
The Landscape 29

33
Population and Urbanization
The Landscape
A large population base with emerging middles class and rising affluence
Large and
Growing
Population
Base…
Experiencing
Rapid
Urbanization
Resulting in
Increasing
Spending
Expenditure
…
30
34
9.5%
8.1%
6.9%
5.0% 4.9%
4.1%
3.1% 2.6%
0%
1%
2%
3%
4%
5%
6%
7%
8%
9%
10%
China India Indo MY TH SG UK US
15.1%
12.9% 12.8%
10.0%
7.3%
6.0%
4.4% 4.3%
0%
2%
4%
6%
8%
10%
12%
14%
16%
Indo China India MY TH SG US UK
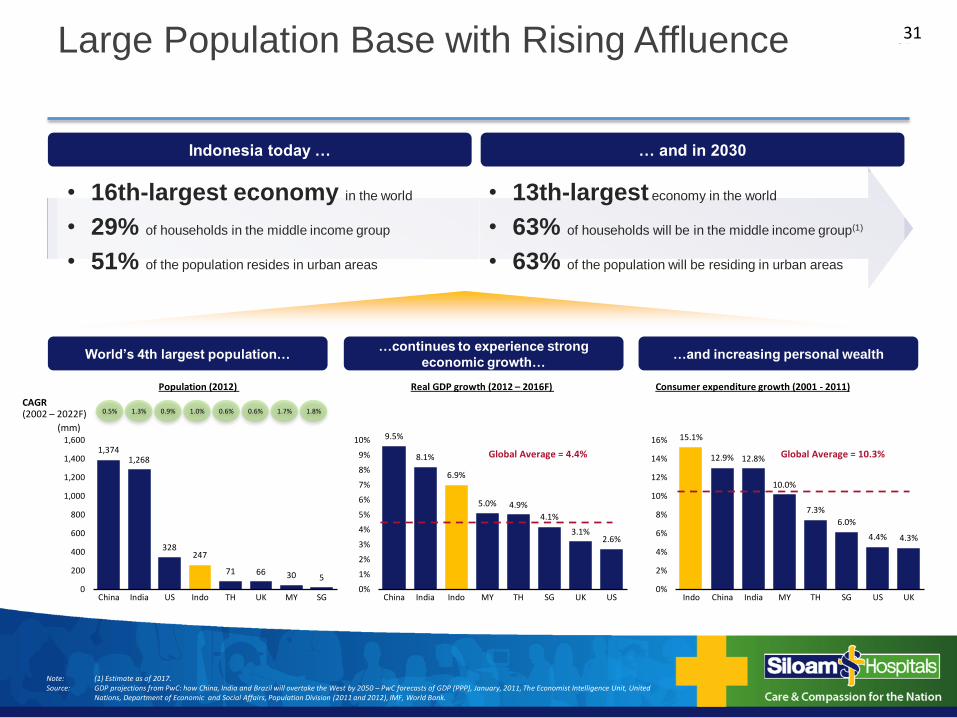
Large Population Base with Rising Affluence
(mm)
Consumer expenditure growth (2001 - 2011) Real GDP growth (2012 – 2016F)
0.5% 1.3% 0.9% 1.0% 0.6% 0.6% 1.7% CAGR (2002 – 2022F)
Population (2012)
Note: (1) Estimate as of 2017. Source: GDP projections from PwC: how China, India and Brazil will overtake the West by 2050 – PwC forecasts of GDP (PPP), January, 2011, The Economist Intelligence Unit, United
Nations, Department of Economic and Social Affairs, Population Division (2011 and 2012), IMF, World Bank.
• 16th-largest economy in the world
• 29% of households in the middle income group
• 51% of the population resides in urban areas
• 13th-largest economy in the world
• 63% of households will be in the middle income group(1)
• 63% of the population will be residing in urban areas
Global Average = 4.4% Global Average = 10.3%
Indonesia today … … and in 2030
World’s 4th largest population… …continues to experience strong
economic growth… …and increasing personal wealth
1.8%
1,374 1,268
328 247
71 66 30 5
0
200
400
600
800
1,000
1,200
1,400
1,600
China India US Indo TH UK MY SG
31

35
63% Coverage
Healthcare Reforms and Universal Insurance
Coverage to Add Further Demand
Source: Center for Health Financing and Health Security (Insurance) (PPJK, MOH), WHO, Frost & Sullivan estimates
Indonesia healthcare reform program highlights
Government implementation of healthcare reform
platform to provide universal coverage
Insurance schemes established to enhance healthcare
accessibility:
Jamkesmas: public health insurance scheme that
serves the “poor” and “near poor”, forming the key
building block of universal coverage
JPK Jamsostek: life insurance scheme that has
health as an optional feature
Askes: health insurance for civil servants
Existing insurance schemes permit enrollees to seek
treatment in private hospitals
Government funds effectively channeled through
these schemes to the private sector
Private hospitals required to dedicate percentage of
beds to lower-income individuals
Healthcare coverage
2012 = 148 Million 2019 Target = 263 Million
100% Coverage
Total Healthcare Expenditure
Flow of public funding to private healthcare providers creates tremendous growth opporutnities for the private sector
2012 – 2018 CAGR: 16.8%
checked
2012 = 3.1% of GDP 2018F = 4.4% of GDP
US$59 Bn US$27 Bn
32
36
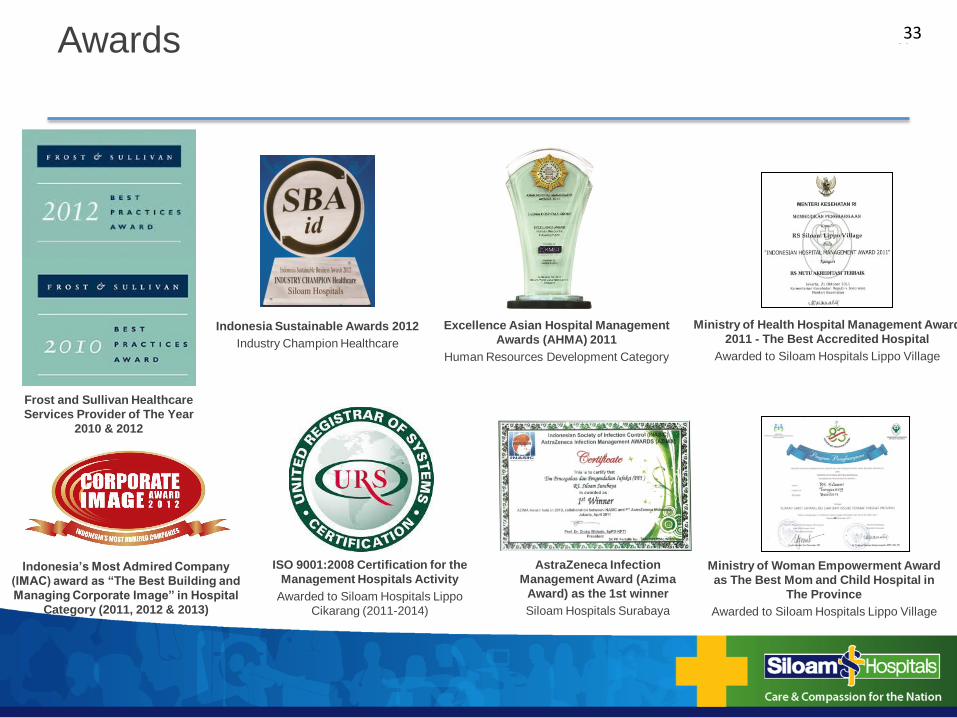
Excellence Asian Hospital Management
Awards (AHMA) 2011
Human Resources Development Category
Frost and Sullivan Healthcare
Services Provider of The Year
2010 & 2012
Ministry of Woman Empowerment Award
as The Best Mom and Child Hospital in
The Province
Awarded to Siloam Hospitals Lippo Village
Ministry of Health Hospital Management Award
2011 - The Best Accredited Hospital
Awarded to Siloam Hospitals Lippo Village
ISO 9001:2008 Certification for the
Management Hospitals Activity
Awarded to Siloam Hospitals Lippo
Cikarang (2011-2014)
AstraZeneca Infection
Management Award (Azima
Award) as the 1st winner
Siloam Hospitals Surabaya
Indonesia’s Most Admired Company
(IMAC) award as “The Best Building and
Managing Corporate Image” in Hospital
Category (2011, 2012 & 2013)
Indonesia Sustainable Awards 2012
Industry Champion Healthcare
Awards 33

37
Investor Relation
e-mail : [email protected]
Address:
Siloam Hospital Lippo Village 5th floor – Head Office
Jalan Siloam No.6
Lippo Village
Tangerang 15811
Indonesia
Telp : +62 21 25668000
Fax : +62 21 5460075
Website : www.siloamhospitals.com


