20
PTT Global Chemical Public Company Limited Management Discussion and Analysis 1Q/2015 (Translation)
| Date post: | 20-Apr-2018 |
| Category: |
Documents |
| Upload: | duongkhanh |
| View: | 221 times |
| Download: | 5 times |

PTT Global Chemical Public Company Limited
Management Discussion and Analysis 1Q/2015
(Translation)

(Translation)
Management Discussion and Analysis 1Q/2015 Page |1
Executive Summary
In 1Q/2015, PTT Global Chemicals Public Company Limited (“the Company”) reported net profit of Baht 5,631 million (Baht 1.25 earnings per share), decreased 11% from Baht 6,320 million (Baht 1.40 earnings per share) in 1Q/2014, and increased 218% from a loss of Baht 4,780 million (Loss of Baht 1.06 earnings per share) in 4Q/2014.
Table 1 : Performance Summary
(Unit: Million Baht) 1Q/2014
(Restated)** 4Q/2014
(Restated)** 1Q/2015 YoY
% + /(-) QoQ
% + /(-) Sales Revenue 141,455 121,085 99,251 -30% -18% EBITDA 10,931 272 10,473 -4% 3750% EBITDA Margin (%) 8% 0% 11% 3% 10% Net Profit 6,320 (4,780) 5,631 -11% 218% EPS (Baht/Share) 1.40 (1.06) 1.25 -11% 218% Adjusted EBITDA* 11,498 13,948 11,606 1% -17% Adjusted EBITDA Margin (%) 8% 12% 12% 4% 0% Note: * Adjusted EBITDA refers to EBITDA excluding impact of inventory value (excludes Inventory gain/(loss) and NRV) ** Restated 1Q/2014 and 4Q/2014 Income Statements from the implementation of new accounting standards (Pack 5)
In 1Q/2015 the Dubai crude oil averaged at 51.89 USD/bbl, decreased from 1Q/2014 at 104.46 USD/bbl
and 4Q/2014 at 74.40 USD/bbl which caused petrochmical product price to also decrease. HDPE price in 1Q/2015 averaged at 1,188 USD/ton, decreased from 1Q/2014 at 1,554 USD/ton and 4Q/2014 at 1,448 USD/ton. However, although prices of crude oil and polymers declined from prior year but with the Company’s intention to continue to improve its operations, closely monitor market situation, and optimize the production, the Company is able to report 1Q/2015 performance with slight drop from 1Q/2014 but improvement from 4Q/2014.
Table 2 : Adjusted EBITDA Margin % Adj. EBITDA Margin
1Q/2014 (Restated)
4Q/2014 (Restated)
1Q/2015
Business Unit : Refinery 3 6 6 Aromatics 3 1 13 Olefins and
Derivatives 24 25 19
Green 8 2 6 HVS 3 6 12 Average 8 12 12

Management Discussion and Analysis 1Q/2015 Page |2
The performance of major business group is as follows:
In 1Q/2015 the Company’s refinery operated at its full capacity with utilization rate of 102%, increased from 1Q/2014 and 4Q/2014 of 101%. Overall petroleum product spread over Dubai crude increased in 1Q/2015 especially the spraed of fuel oil over Dubai crude. This resulted in market GRM of CDU of 7.97 USD/bbl in 1Q/2015, increased from 5.52 USD/bbl in 1Q/2014 and 6.30 USD/bbl in 4Q/2014. However, as Dubai crude price continually decreased in 1Q/2015, the Company recorded a stock loss of Baht 2,434 million and an NRV gain of Baht 1,519 million. Refinery business recorded net stock loss and NRV gain of Baht 915 million or 1.5 USD/bbl.
Aromatics business unit in 1Q/2015 had utilization rate (BTX utilization rate) of 89%, decreased from 1Q/2014 of 91% but increased from 4Q/2014 of 63% while product prices decreased from the oversupply situation. As a result, the Company reported aromatics product margin or P2F margin in 1Q/2015 of 219 USD/ton, 32% increase from 1Q/2014 and 34% increase from 4Q/2014 eventhough market spread between aromatics product and condensate decreased. This was due to the decrease in price of condensate which was also used as fuel and had loss in the system, hence, lower cost to aromatic
operations. The condensate price decreased 51% from 1Q/2014 and 29% from 4Q/2014. In addition, the condensate price which the Company was able to source from market was lower than the market reference and resulted in a wider actual spread. However, in 1Q/2015, the Company reported a stock loss in aromatics business of Baht 1,878 million from the decreased of feedstock and product price and reported an NRV gain of Baht 1,431 million. Therefore, the net stock loss and NRV gain was Baht 447 million.
In 1Q/2015, the utilization rate of olefins plants averaged at 96%, up from 77% in 1Q/2014 and down 101% from 4Q/2014. However, the performance of olefins and derivatives business decreased, this was mainly due from the decrease in polyethylene price. In 1Q/2015, HDPE price averaged at 1,188 USD/ton decreased 24% from 1Q/2014 and decreased 18% from 4Q/2014. As a result, the olefins and derivatives business reported adjusted EBITDA of Baht 5,556 million, 26% decrease from 1Q/2014 and 40% decrease from 4Q/2014. The adjusted EBITDA margin of this business unit also declined to 19% in 1Q/2015.
Changes in accounting standards
Federation of Accounting Professions has announced five new and revised accounting standards relating to financial reporting (Pack 5) which will be effective on January 1, 2015. The changes in accounting standards which have material effect on the Company’s financial statements comprise of “TFRS 11 Joint Arrangements”. TFRS 11 has changed the recognition method for Joint Venture from proportionate consolidation to equity method. This change resulted in the reduction of revenue and expenses, and the increment of share of profit from investments. Therefore, this change will not effect to net profit of the Company as a whole. The Joint Venture entities that comply with TFRS 11 and need to apply change are TEX, EMERY, ESC and NatureWorks
Another accounting standard adopted with material impact on the Company’s financial
statements is “TFRS 10 Consolidated Financial Statement”. TFRS 10 introduces additional control criteria in consolidated financial statement using De Facto Control criteria. This has resulted in PTTGC being in control of its mother company, PTT and will be consolidated into PTT’s financial statement. This has resulted in an adjustment of fair value derived from the previous business combination under common control of PTT especially the fair value recorded from the amalgamation of PTTCH and PTTGC. As a result the asset and depreciation and amortization from the amalgamation recorded in the Company will decline. The 1Q/2014 and 4Q/2014 financial statement has been restated to the same standard for comparison purpose.

Management Discussion and Analysis 1Q/2015 Page |3
Summary of events that had significant impact on financial statements in 1Q/2015
On April 1, 2015 the Company held General Meeting of Shareholders year 2015 at Bangkok Convention Center. In the meeting, the Compnay’s shareholder has approved the dividend payment for the year 2014 operating performance of Baht 2.37 per share, totaling approximately Baht 10,686 million, or 71% of the net profit of consolidated financial statements, of which Baht 1.37 per share or 50% of the net profit of first half 2014 consolidated financial statements was paid as an interim dividend. The final dividend payment was Baht 1.00 per share or 170% of the net profit of second half 2014 consolidated financial statements
The Company has rescheduled the shutdown of Olefins Plant I-4/1 from previously scheduled in August 2015 to March 29, 2015 to clean up Quench Oil Tower which was expected to take approximately 21 days as planned. Due to the reschedule of Olefins Plant I-4/1, the By-product Value Added unit which uses by-product from Olefins Plant I-4/1 as feedstock, needed to be rescheduled to the same period. The olefins I-4/1 has resumed its operation since April 13, 2015 with a total shutdown only 16 days.

Management Discussion and Analysis 1Q/2015 Page |4
Market Overview
Petroleum Market Overview
Table 3 : Crude Prices & Petroleum Product Spreads
Unit : USD/bbl 1Q/2014 4Q/2014 1Q/2015 YoY
% + /(-) QoQ
% + /(-) Dubai Crude Oil 104.46 74.40 51.89 -50% -30% Jet-Dubai 17.01 17.71 17.08 0% -4% Diesel-Dubai 17.80 15.99 16.29 -8% 2% Fuel Oil-Dubai -8.51 -5.62 -1.86 78% 67% Gasoline-Dubai 14.56 13.44 15.35 5% 14%
Dubai crude oil prices in 1Q/2015 moved within the range of 42.0 to 59.5 USD/bbl and averaged at 51.89 USD/bbl. At the beginning of the quarter Dubai crude oil price continued to fall from last period, down to the lowest level of 42.0 USD/bbl in mid-January. This was due to the oversupply of crude oil from Shale Oil production in the USA that has increased significantly while OPEC crude oil production rate remained unchanged. The US Energy Information Administration (EIA) reported US crude oil inventory rose to its highest level in 80 years. For the rest of the quarter, the crude oil price gradually rose which was a result of the shut down of several rigs. Baker Hughes reported that number of oil rigs worldwide fell 261 units, left only 3,309 rigs in operations world wide whch was resulted from low crude oil level leading to unprofitable situation of some high-cost operation rigs. In addition, the geopolitics in Libya, after the armed assault on the al-Mabrook oilfield in Libya sent crude oil prices to rise. However, by the end of the quarter, there were some concerns on the possibility of Iran to increase its crude oil export volume as the sanctions against its nuclear program by the major powerful countries in the west would end. Moreover, there was a news on Libya’s plans to increase export crude oil volume to more than 1.2. MBD from its port to the east of the country.
In refinery market, the overall product spread between petroleum products and Dubai crude price in 1Q/2015 increased as Dubai crude oil pirce decreased in greater degree than petroleum
products. The spread of gasoline over Dubai crude oil price averaged at 15.35 USD/bbl, rose 1.91 USD/bbl from previous quarter due to an increase in gasoline demand as its overall retail price dropped. Moreover, it was also caused by the tight supply of gasoline from an emergency shutdown of Exxon refinery in the US and the seasonal turnaround of refineries at the end of 1Q/2015. The spread of diesel over Duabai curde oil price averaged at 16.29 USD/bbl, increased 0.30 USD/bbl from previous quarter from the extremely cold weather in mid February in Northeast of the USA and resulted in an increase of demand for heating. On the other hand, the spread of jet fuel over Dubai crude oil price averaged at 17.08 USD/bbl, decreased 0.63 USD/bbl from previous quarter due to the decrease in demand after New Year travelling season was over. In addition, the demand for jet fuel/kerosine as a heating source in the japan also decreased as winder season in Japan ended in the quarter. The spread of fuel oil over Dubai crude oil price averaged at -1.86 USD/bbl, 0.37 USD/bbl decrease from previous quarter due to the extremely cold weather in North America and Europe and resulted in a difficulty in exporting fuel oil to Asian countries who are the main importers of the product. In addition, as crude oil price decreased, many crude carriers were rented as crude oil storage tanks. As a result, the supply of crude carriers was tight, and it became more costly and unprofitbale to carry crude to Asia which resulted in a decrease in imports of fuel oil to Asia and a wider spread for fuel oil.
Management Discussion and Analysis 1Q/2015 Page |5
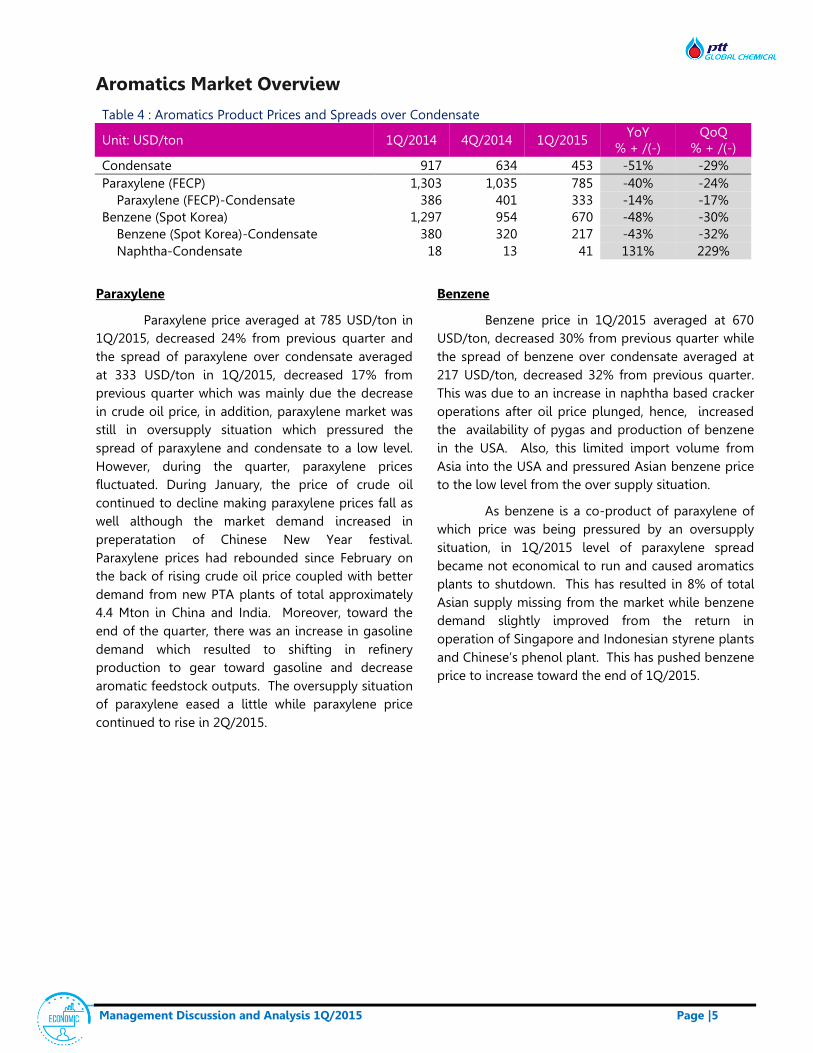
Aromatics Market Overview
Table 4 : Aromatics Product Prices and Spreads over Condensate
Unit: USD/ton 1Q/2014 4Q/2014 1Q/2015 YoY
% + /(-) QoQ
% + /(-) Condensate 917 634 453 -51% -29% Paraxylene (FECP) 1,303 1,035 785 -40% -24% Paraxylene (FECP)-Condensate 386 401 333 -14% -17% Benzene (Spot Korea) 1,297 954 670 -48% -30% Benzene (Spot Korea)-Condensate 380 320 217 -43% -32% Naphtha-Condensate 18 13 41 131% 229%
Paraxylene
Paraxylene price averaged at 785 USD/ton in 1Q/2015, decreased 24% from previous quarter and the spread of paraxylene over condensate averaged at 333 USD/ton in 1Q/2015, decreased 17% from previous quarter which was mainly due the decrease in crude oil price, in addition, paraxylene market was still in oversupply situation which pressured the spread of paraxylene and condensate to a low level. However, during the quarter, paraxylene prices fluctuated. During January, the price of crude oil continued to decline making paraxylene prices fall as well although the market demand increased in preperatation of Chinese New Year festival. Paraxylene prices had rebounded since February on the back of rising crude oil price coupled with better demand from new PTA plants of total approximately 4.4 Mton in China and India. Moreover, toward the end of the quarter, there was an increase in gasoline demand which resulted to shifting in refinery production to gear toward gasoline and decrease aromatic feedstock outputs. The oversupply situation of paraxylene eased a little while paraxylene price continued to rise in 2Q/2015.
Benzene
Benzene price in 1Q/2015 averaged at 670 USD/ton, decreased 30% from previous quarter while the spread of benzene over condensate averaged at 217 USD/ton, decreased 32% from previous quarter. This was due to an increase in naphtha based cracker operations after oil price plunged, hence, increased the availability of pygas and production of benzene in the USA. Also, this limited import volume from Asia into the USA and pressured Asian benzene price to the low level from the over supply situation.
As benzene is a co-product of paraxylene of which price was being pressured by an oversupply situation, in 1Q/2015 level of paraxylene spread became not economical to run and caused aromatics plants to shutdown. This has resulted in 8% of total Asian supply missing from the market while benzene demand slightly improved from the return in operation of Singapore and Indonesian styrene plants and Chinese’s phenol plant. This has pushed benzene price to increase toward the end of 1Q/2015.

Management Discussion and Analysis 1Q/2015 Page |6
Olefins and Olefins Derivatives Market Overview
Table 5 : Prices and Spreads of Olefins and Olefins derivatives
Unit : USD/ton 1Q/2014 4Q/2014 1Q/2015 YoY
% + /(-) QoQ
% + /(-) Naphtha (MOPJ) 935 647 494 -47% -24% Ethylene (SEA) 1,441 1,214 1,026 -29% -15% HDPE 1,554 1,448 1,188 -24% -18% HDPE-Naphtha 620 802 694 12% -13% LLDPE 1,560 1,431 1,181 -24% -18% LLDEP- Naphtha 625 785 687 10% -12% LDPE 1,639 1,440 1,192 -27% -17% LDPE- Naphtha 705 793 698 -1% -12% MEG (ACP) 1,182 1,035 903 -24% -13% MEG-0.65 Ethylene 245 246 236 -4% -4%
Ethylene price in 1Q/2015 averaged at 1,026 USD/ton decreased 15% from previous quarter mainly due to the decrease in crude oil price which has bottomed in January. From February onward, ethylene price increased following the increase of crude price. In addition, the supply of ethylene decreased from planned and unplanned shutdowns of olefins plants especially at the end of the quarter which was entering into seasonal shutdown until May. This had resulted in an increase in ethylene price during the end of the quarter.
In 1Q/2015, polymer price decreased from previous quarter which was also due from the decrease in crude oil price. HDPE price averaged at 1,188 USD/ton decreased 18%, LLDPE price averaged at 1,181 USD/ton decreased 18%, LDPE price averaged at 1,192 USD/ton decreased 17%. During the quarter while crude price declined, polymer
buyers changed their purchase behavior to buy in smaller lots but more frequently. Toward second half of the quarter, polymer prices increased supported by the shutdown of many polymer plants following shutdown of olefins plants, rise of crude oil price while polymer buyers started to restock their inventories. In addition a decline in imported volume from the Middle East into China due to emergency shutdown of 3 polymer plants in Saudi Arabia also supported the gradual rise in polymer prices.
The MEG prices in 1Q/2015 averaged at 903 USD/ton dropped 24% from 1Q/2014 and dropped 13% from previous quarter due mainly to high inventory of MEG in China while the demamd softened. As a consequence, the spread of MEG over 0.65 ethylene declined 4% from 1Q/2014 as well as from 4Q/2014.

Management Discussion and Analysis 1Q/2015 Page |7
Performance Analysis by Buisness Unit
Refinery Business Unit Table 6 : Refinery Intake
1Q/2014 4Q/2014 1Q/2015 YoY
% + /(-) QoQ
% + /(-) Crude (Mbbl) 13.18 13.48 13.31 1% -1% (KBD) 146.47 146.57 147.84 1% 1% Condensate Residue & Others (Mbbl) 4.72 4.79 5.43 15% 13% (KBD) 52.46 52.06 60.29 15% 16% Total Intake (Mbbl) 17.90 18.27 18.73 5% 3% (KBD) 198.93 198.62 208.13 5% 5% CDU Utilization Rate 101% 101% 102%
The performance of refinery business unit in 1Q/2015 improved when compared to 1Q/2014 and 4Q/2014. In 1Q/2015 the Company’s refinery had CDU utilization rate of 102%, increased from 1Q/2014 and 4Q/2014 at 101%. Total refinery intake was at 208 KBD in 1Q/2015, increased in the same manner. However, petrocleum product sales volume decreased slightly from 1Q/2014 and 4% from 4Q/2014. This was due to the Company managed inventory level in 4Q/2014 by pushing petroleum products into the market and as a result higher volume of product sales than usual.
Table 7 : Petroleum Sales Volume
Product 1Q/2014 4Q/2014 1Q/2015 YoY QoQ
'000 barrels
% '000
barrels %
'000 barrels
% % + /(-) % + /(-)
Naphtha 1,251 7% 1,221 7% 1,351 8% 8% 11% Reformate 1,446 9% 1,520 9% 1,351 8% -7% -11% Jet/Kerosine 2,135 13% 2,625 15% 2,839 17% 33% 8% Diesel 8,687 52% 7,725 45% 7,632 46% -12% -1% Fuel Oil 2,261 14% 2,440 14% 1,923 12% -15% -21% Others 905 5% 1,608 9% 1,440 9% 59% -10%
Total 16,684 100% 17,139 100% 16,535 100% -1% -4%
Refinery product crack spread increased in 1Q/2014 especially that of fuel oil over Dubai crude oil which jumped significantly. This was due to tight fuel oil supply in Asia from the extreme cold weather in the USA and Europe and resulted in a difficulty in exporting fuel oil to Asia and also the tight supply of crude carrier as crude carriers were rented to use as crude storage tanks in low crude oil situation.
Acccording to the sales volume and product spread mentioned, in 1Q/2015, the Company reported CDU GRM of 7.97 USD/bbl, 44% increase from CDU GRM of 1Q/2014 at 5.52 USD/bbl and 27% increase from 4Q/2014 at 6.30 USD/bbl. Moreover, the decline in crude price in 2015 also resulted in the decline in value of fuel and loss.

Management Discussion and Analysis 1Q/2015 Page |8
Table 7 : Gross Refinery Margin
Unit: USD/bbl 1Q/2014
(Restated) 4Q/2014
(Restated) 1Q/2015 YoY
% + /(-) QoQ
% + /(-) Market GRM 4.48 4.91 5.98 34% 22% CDU GRM 5.52 6.30 7.97 44% 27% CRS GRM 2.85 2.57 2.58 -9% 0% Hedging Gain/(Loss) 0.33 2.08 -0.31 -194% -115% Stock Gain/(Loss) Net NRV -0.69 -14.68 -1.50 -118% 90%
Accounting GRM 4.12 -7.69 4.17 1% 154%
In 1Q/2015 the Company reported loss from commodity hedging of Baht 188 million or -0.31 USD/bbl while in 1Q/2014 and 4Q/2014 the Company reported gain from commodity hedging of 0.33 USD/bbl and 2.08 USD/bbl respectively. This was due to the petroleum product spread over Duabai crude price in 1Q/2015 improved more than expected. The stock loss of 1Q/2015 was at Baht 2,434 million from the decline of crude oil price while profit from NRV gain of Baht 1,519 million from an increase in crude oil price in the end of the quarter. The Company reported the net loss of stock loss and NRV gain of Baht 915 million or 1.50 USD/bbl. The accounting GRM of the refinery was at 4.17 USD/bbl, increased from 1Q/2014 of 4.12 USD/bbl and increased from 4Q/2014 of -7.69 USD/bbl.

Management Discussion and Analysis 1Q/2015 Page |9
Aromatics Business Unit Table 9 : Aromatics Intake and Productions
1Q/2014 4Q/2014 1Q/2015 YoY
% + /(-) QoQ
% + /(-) Condensate ('000 tons) 1,284 947 1,219 -5% 29% Others ('000 tons) 233 172 226 -3% 32% Total Intake ('000 tons) 1,517 1,119 1,446 -5% 29% BTX Production ('000 tons) 523 367 512 -2% 39% BTX Utilization Rate 91% 63% 89% * Aromatics capacity 2.259 Mton/year
In 1Q/2015 the performance of aromatics business unit improved from 1Q/2014 and 4Q/2014 due from the aromatics utilization rate (BTX Utilization) in which 1Q/2015 averaged at 89%, down from 91% in the 1Q/2014 but up 63% from the 4Q/2014. In 1Q/2015, feedstock totaled to 1.45 Mtons, down 5% from the 1Q/2014 and up 29% from 4Q/2014. This was due to maintenance shutdown of aromatics 1 plant for 42 days in 4Q/2014. The sales volume for BTX product decreased from 1Q/2014 and increase from 4Q/2014 following the utilization rate. However, in the 1Q/2015 sales volume of other by-products decreased significantly, mainly due to the reoptimization of LPG. To maximize its value, the Company used more LPG as fuel and sent to olefins plants as feedstock instead of selling out to external customers.
Table 10 : Aromatics Sales Volume
Product 1Q/2014 4Q/2014 1Q/2015 YoY QoQ
'000 tons
% '000 tons
% '000 tons
% % + /(-) % + /(-)
Benzene (BZ) 156 19% 115 17% 140 20% -10% 22% Cyclohexane 40 5% 24 4% 38 5% -7% 55% Paraxylene (PX) 294 36% 213 32% 304 43% 3% 43% Other BTX Products 15 2% 8 1% 15 2% -2% 78%
Total BTX Products 505 63% 360 54% 497 70% -2% 38% Naphtha and Raffinate 201 25% 236 35% 196 28% -3% -17% Other By-Products 100 12% 72 11% 15 2% -85% -79%
Total 806 100% 668 100% 707 100% 0% 0%
The overall product spread between aromatics products and condensate in 1Q/2015 declined. The spread between paraxylene and condensate averaged at 333 USD/ton in 1Q/2015, 14% decrease from 1Q/2014 and 17% decrease from previous quarter. The spread between benzene and condensate averaged at 217 USD/ton in 1Q/2015, dropped 43% from the 1Q/2014 and down 32% from the previous quarter. However, although the spread of aromatic product and condensate declined but the overall performance of aromatics business improved.
The Company reported aromatics product margin or P2F margin in 1Q/2015 of 219 USD/ton, 32% increase from 1Q/2014 and 34% increase from 4Q/2014 eventhough market spread between aromatics product and condenstate decreased. This was due to the decrease in price of condensate which was also used as fuel and loss in the system, hence, lower cost to aromatic operations. The condensate price decreased 51% from 1Q/2014 and 29% from 4Q/2014. In addition, condensate price of which the Company was able to source from market was lower than the market reference and resulted in a wider actual spread.

Management Discussion and Analysis 1Q/2015 Page |10
Table 11 : Aromatics market P2F
Unit: USD/ton 1Q/2014
(Restated) 4Q/2014
(Restated) 1Q/2015
YoY % + /(-)
QoQ % + /(-)
Market P2F 166 164 219 32% 34% NRV -12.8 -114.0 88.2 N/A N/A Hedging Gain/(Loss) 0.0 -0.4 0.0 N/A N/A Stock Gain/(Loss) 4.9 -284.2 -115.9 N/A N/A Accounting P2F 158 -235 191 21% 182%
In 1Q/2015, the Company reported a stock loss in aromatics business of Baht 1,878 million or 115.9 USD/ton from the decreased of feedstock and product price and reported a NRV gain of Baht 1,431 million or 88.2 USD/ton. Therefore, the net stock loss and NRV gain was Baht 447 million and accounting P2F of 191 USD/ton, 21% increased from 1Q/2014 and 184% increased from previous quarter.

Management Discussion and Analysis 1Q/2015 Page |11
Olefins and Olefins derivatives Business Unit
1Q/2015 performance of olefins and olefins derivatives business unit soften due to weaken polymer price. HDPE price in 1Q/2015 averaged at 1,188 USD/ton, 24% decreased from 1Q/2014 and 18% decreased from 4Q/2014. The decrease in polymer prices resulted in weaker adjusted EBITDA of this business unit to Baht 5,556 million, 26% decreased from 1Q/2014 and 40% decreased from 4Q/2014. In 1Q/2015, this business unit had adjusted EBITDA margin of 19%. Details as follows:
Table 12 : Adjusted EBITDA of Olefins and Olefins derivatives
Unit: MB 1Q/2014
(Restated) 4Q/2014
(Restated) 1Q/2015
YoY % + /(-)
QoQ % + /(-)
Adj. EBITDA 7,528 9,201 5,556 -26% -40% Adj. EBITDA Margin 24% 25% 19% -5% -5%
Olefins Business Unit The utilization rate of the Company’s olefins plants in this quarter averaged at 96%, increased from
1Q/2014 of 77% due to the maintenance shutdown of olefins I-1 plant for 37 day and the maintenance shutdown of olefins I-4/1 plant for 23 days. 1Q/2015 utilization rate decreased from 4Q/2014 due to the flow of gas feedstock in 1Q/2015 declined and resulted in lower utilization rate. The feedstock portion of the olefins plants consisted of 85% gas, 7% naphtha, and 8% NGL.
In 1Q/2015, olefins sales volume to external customer was at 196 Kton, 45% increased from 1Q/2014 but 13% decreased from 4Q/2014 in accordance to the utilization rate. Ethylene price in 1Q/2015 averaged at 1,026 USD/ton, 29% decreased from 1Q/2014 and 15% decreased from 4Q/2014. As a result the sales revenue of olefins increased 5% from 1Q/2014 and decreased 23% from 4Q/2014.
Table 13 : Sales volume and utilization rate of Olefins and Olefins derivatives
1Q/2014 4Q/2014 1Q/2015 YoY QoQ
Sales Volume
'000 tons
Utilization Rate
Sales Volume
'000 tons
Utilization Rate
Sales Volume
'000 tons
Utilization Rate
% + /(-) % + /(-)
Olefins * 134 77% 224 101% 196 96% 45% -13% HDPE 202 93% 243 115% 219 109% 8% -10% LLDPE 98 99% 120 105% 108 110% 10% -10% LDPE 72 115% 83 106% 80 99% 11% -4%
Total PE 373 99% 446 111% 407 107% 9% -9% MEG 71 65% 107 104% 102 108% 45% -4% Note: * Sales Volume of Olefins is external volume.

Management Discussion and Analysis 1Q/2015 Page |12
Polymer Business Unit Performance: HDPE
In 1Q/2015 the utilization rate of 3 HDPE plants averaged at 109%, incrased from 1Q/2014 at 93% and decreased from 4Q/2014 at 115%. However in 1Q/2015 the HDPE I-1 plant had maintenance shutdown for 10 day from March 22 – April 4.
The performance of HDPE in 1Q/2015 decreased due to the decrease in sales volume. 1Q/2015 sales volume was at 219 Kton, 8% increase from 1Q/2014 while HDPE price decreased 24%, resulted in 15% decrease in sales revenue from 1Q/2014. When compared with 4Q/2014, sales volume decreased 10% while price decreased 18% and resulted in 28% decrease in sales revenue.
Performance: LLDPE
The utilization rate of LLDPE in 1Q/2015 was at 110%, increased from 1Q/2014 of 99% and increased from 4Q/2014 of 105%. In 1Q/2015 sales volume was at 108 Kton, 10% increase from 1Q/2014 while price decreased 24%, so sales revenue decreased 15%. When compared with 4Q/2014, sales volume decreased 10% while price decreased 18% and resulted in 24% decrease in sales revenue.
Performance: LDPE
The utilization rate of LDPE was at 99%, decreased from 1Q/2014 of 115% and decreased from 4Q/2014 of 106%. However in 1Q/2015 the LDPE plant had maintenance shutdown for 10 day from March 1-10, while 1Q/2014 and 4Q/2014 the LDPE plant was able to run at its full capacity.
The sales volume in 1Q/2015 was at 80 Kton, 11% increase from 1Q/2014 while LPDE price decreased 27%, resulted in a decrease in sales reveue of 20%. When compared with 4Q/2014, sales volume decreased 4% while price decreased 17% and resulted in 23% decrease in sales revenue.
Ethylene Oxide Business Unit
The utilization rate of MEG was at 108%, increased from 1Q/2014 at 65% and increased from 4Q/2014 at 104%.
The performance of ethylene oxide business unit in 1Q/2014 improved from 1Q/2014 from improved sales volume from 102 Kton in 1Q/2015, increased 45% from 1Q/2014 as there was a maintenance shutdown in 1Q/2014. The sales revenue of ethylene oxide business unit increased 18%. When compared with 4Q/2014, the sales volume of MEG decreased 4% while MEG price decreased 13%, as a result, revenue of ethylene oxide group decreased 11%.

Management Discussion and Analysis 1Q/2015 Page |13
Operating Performance
1Q/2014
(Restated)** 4Q/2014
(Restated)** 1Q/2015 YoY QoQ
MB % MB % MB % MB % MB %
Sales Revenue 141,455 100 121,085 100 99,251 100 (42,204) -30% (21,834) -18%
Feedstock Cost (117,581) (83) (95,350) (79) (75,721) (76) (41,860) -36% (19,629) -21%
Product to Feed Margin 23,874 17 25,735 21 23,530 24 (344) -1% (2,205) -9%
1 Variable Cost (7,062) (5) (7,358) (6) (6,809) (7) (253) -4% (549) -7%
2 Fixed Cost (4,075) (3) (4,039) (3) (3,514) (4) (561) -14% (525) -13%
3 Stock Gain/(Loss) & NRV (567) (0) (13,676) (11) (1,133) (1) (566) -100% 12,543 92%
4 Gain/(Loss) Commodity
Hedging 184 0 1,229 1 (188) (0) (372) -202% (1,417) -115%
5 Other Income 990 1 1,659 1 926 1 (64) -6% (733) -44%
6 SG&A (2,413) (2) (3,278) (3) (2,339) (2) (74) -3% (939) -29%
EBITDA 10,931 8 272 0 10,473 11 (458) -4% 10,201 3750%
7 Depreciation &
Amortization (3,857) (3) (4,040) (3) (3,979) (4) 122 3% (61) -2%
EBIT 7,074 5 (3,768) (3) 6,494 7 (580) -8% 10,262 272%
Finance Cost (1,176) (1) (1,117) (1) (1,076) (1) (100) -9% (41) -4%
8 FX Gain/(Loss) 617 0 (451) (0) 526 1 (91) -15% 977 217%
9 Shares of profit/(loss) from
investments 36 0 (312) (0) 237 0 201 558% 549 176%
10 Income Tax Expense (402) (0) 923 1 (499) (1) 97 24% 1,422 154%
Net Profit 6,149 4 (4,725) (4) 5,682 6 (467) -8% 10,407 220%
Profit/(loss) attributable to:
Owners of the Company 6,320 4 (4,780) (4) 5,631 6 (689) -11% 10,411 218%
Non-controlling interests (171) (0) 55 0 51 0 222 130% (4) -7%
Adjusted EBITDA * 11,498 8 13,948 12 11,606 12 108 1% (2,342) -17% Note: * Adjusted EBITDA refers to EBITDA excluding impact of inventory value (excludes Inventory gain/(loss) and NRV)
** Restated 1Q/2014 and 4Q/2014 Income Statements from the implementation of new accounting standards (Pack 5)

Management Discussion and Analysis 1Q/2015 Page |14
Performance Comparison
(1) Variable Cost
Variable cost decreased by Baht 253 million or 4% from 1Q/2014, resulting from 9% decrease in average unit cost of all products while overall production volume increase by 7%. Variable cost per unit of almost all business reduced from the same period of last year. As for Refinery business, there had been more captive use for LPG to optimize benefit. Moreover, variable cost of Olefins business in 1Q/2014 was higher than normal due to plant shutdown. Therefore, the use of stream increased at the startup period.
Comparing to previous quarter, variable cost decreased by Baht 549 million or 7%, resulting from 13% decrease in average unit cost of all products whereas overall production volume increase by 7%. Variable cost per unit of almost all businesses decreased especially for Refinery business that enhanced LPG captive use as previously mentioned.
(2) Fixed Cost
In 1Q/2015, fixed cost decreased by Baht 561 million or 14% from 1Q/2014. The main reason was from Baht 375 million increase in maintenance cost as a result of 2 Olefins plants shutdown during 1Q/2014 that caused maintenance cost too high in that quarter. Furthermore, fixed cost of Vencorex decreased by Baht 164 million from the appreciation of Baht against Euro (Based on average sales BOT in 1Q/2015 at Baht 36.78 per Euro against 1Q/2014 at Baht 44.74 per Euro).
In comparison to last period, fixed cost reduced by Baht 525 million or 13%, primarily due to lower maintenance cost of Baht 163 million from the shutdown of Aromatics plant in 4Q/2014, resulting in a relatively high maintenance cost in such quarter. Additionally, fixed cost of Vencorex decreased by Baht 140 million from the appreciation of Baht against Euro (Based on average sales BOT in 1Q/2015 at Baht 36.78 per Euro against 4Q/2014 at Baht 40.86 per Euro). Besides, service cost of maintenance engineering & safety business decreased by Baht 200 million, in line with a decrease in service income which was recognized as other income.
(3) Stock Gain/(Loss) & NRV
Stock Loss and NRV in 1Q/2015 were reported at Baht 1,133 million, of which Stock Loss was Baht 4,312 million, and NRV Gain was Baht 3,179 million.
The Stock Loss of Baht 4,312 million in 1Q/2015 comprised of Stock Loss from Refinery and Aromatics of Baht 2,434 million and Baht 1,878 million, respectively. The factor was crude oil price that sharply dropped during 4Q/2014 and subsequently led to high weighted average inventory cost at the end of year 2014. Together with the continuing decline of crude oil price towards 1Q/2015, the Company, therefore, had to realized Stock Loss.
NRV Gain of Baht 3,179 million in 1Q/2015 was from Refinery business of Baht 1,519 million and Aromatics business of Baht 1,431 million. The remaining of Baht 229 million was from other business. As crude and product price declined in the beginning of 1Q/2015, therefore, the Company reserved NRV loss at year end 2014. However, crude and product price has rebounded after end of 1Q/2015, this resulted in a reversal of that provision for decline in value thereof.
Previously, the company had total Stock Loss and NRV of Baht 567 million in 1Q/2014 and Baht 13,676 million in 4Q/2014.
(4) Gain/(Loss) Commodity Hedging
In order to manage risk, the Company has done Crack Spread Hedging and Fuel Loss Hedging with the main reason to maintain profit level. In 1Q/2015, the Company reported loss from Commodity Hedging of Baht 188 million due to the actual spread for petroleum products was higher than the spread that the company had sold in advance. Previously, the Company had gain from Commodity Hedging of Baht 184 million in 1Q/2014 and Baht 1,229 million in 4Q/2014.

Management Discussion and Analysis 1Q/2015 Page |15
(5) Other Income
Other income decreased by Baht 64 million or 6%, mainly due to, in 1Q/2014, the Company received insurance compensation for oil spill of Baht 40 million, but there was no such item in this quarter. Moreover, export tax credit reduced by Baht 23 million due to the average selling price per unit of polymer products dropped, and consequently dragged total export value down. Therefore, export tax credit which was calculated on export value dropped accordingly.
Comparing to 4Q/2014, other income decreased by Baht 495 million or 35% primarily due to 1) insurance compensation, which mainly come from oil spill case, decreased by Baht 233 million 2) export tax credit that is calculated from export value decreased by Baht 37 million 3) service income of international business decreased by Baht 51 million as a result of Baht appreciation and 4) service income from maintenance engineering & safety business decreased by Baht 150 according to the progress of completion of the construction and maintenance. The majority of projects have been completed within previous quarter, thus, no revenue recognition from these projects in the current period. Also, current projects in line are mainly for debottlenecking and optimization of existing assets of the Company in order to enhance the production efficiency. Therefore, such income was eliminated and not recognized as revenue from services for the Group as a whole.
(6) SG&A
In 1Q/2015, SG&A expenses decreased by Baht 74 million or 3% from 1Q/2014, mainly due to a decrease in expenditure for investment projects under study amounting to Baht 161 million. However, staff cost increased approximately Baht 70 million from annual salary adjustment. Besides, in 1Q/2015, the Company recorded expense to support the establishment of PTT Group Science and Technology Institution in Rayong by Baht 29 million.
In comparison to previous quarter, SG&A expenses decreased by Baht 939 million or 29%, primarily due to the reduction of the cost of
establishing PTT Group Science and Technology Institution in Rayong around Baht 362 million. In addition, according to sharply fall of oil price since 4Q/2014 onward, the Company has launched the policy to reduce unnecessary expenses, together with the appreciation of Baht, so SG&A expenses decreased significantly from previous quarter. Nonetheless, personnel expenses increased by Baht 68 million due to annual salary adjustment.
(7) Gain/(Loss) from Foreign Exchange
In 1Q/2015, the Company reported gain from foreign exchange of Baht 526 million resulted from Baht appreciation by Bath 0.41 per USD or 1% (Based on average sales BOT, end of 1Q/2015 at Baht 32.70 per USD against year end 2014 at Baht 33.11 per USD). As at March 31, 2015, the Company had loan in foreign currencies of USD 1,443 million. Previously, the Company reported gain from foreign exchange of Baht 617 million in 1Q/2014 and Baht 451 million in 4Q/2014.
(8) Share of Profit/(Loss) from Investments
In 1Q/2015, the Company realized total share of profit from investments of Baht 237 million, increased by Baht 201 million from 1Q/2014 and increased by Baht 549 million from 4Q/2014. In overall, the performance of almost all associates and joint ventures improved such as Emery, TEX, ITT, GPSC, PTTPM and VNT, etc.
(9) Income Tax Expense
In 1Q/2015, the Company reported income tax expense totaling to Baht 499 million, an increase of Baht 97 million or 24% from 1Q/2014 (Effective tax rate: ETR increased from 6% in 1Q/2014 to 8% in 1Q/2015). The major reason was a decrease in performance of tax previllege business, especially for Olefins and Derivative business. Moreover, performance of non-tax privilege business such as Refinery and Aromatics had improved from 1Q/2014, as a result, income tax expense increased from the same period of last year. However, in 4Q/2014, the Company reported net loss from Stock Loss due to the dramatic drop of crude price in December 2014, so there had been reversal of previously recorded income tax expense.
Management Discussion and Analysis 1Q/2015 Page |16
Statement of Financial Position
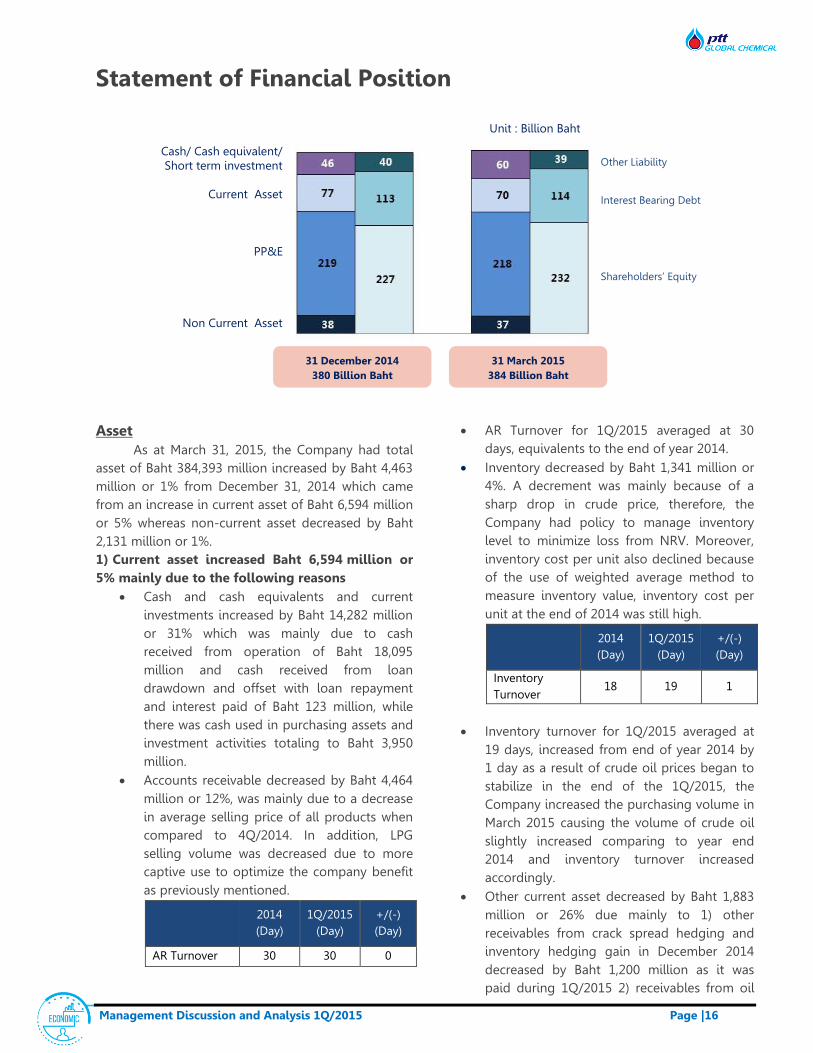
Asset As at March 31, 2015, the Company had total
asset of Baht 384,393 million increased by Baht 4,463 million or 1% from December 31, 2014 which came from an increase in current asset of Baht 6,594 million or 5% whereas non-current asset decreased by Baht 2,131 million or 1%. 1) Current asset increased Baht 6,594 million or 5% mainly due to the following reasons
Cash and cash equivalents and current investments increased by Baht 14,282 million or 31% which was mainly due to cash received from operation of Baht 18,095 million and cash received from loan drawdown and offset with loan repayment and interest paid of Baht 123 million, while there was cash used in purchasing assets and investment activities totaling to Baht 3,950 million.
Accounts receivable decreased by Baht 4,464 million or 12%, was mainly due to a decrease in average selling price of all products when compared to 4Q/2014. In addition, LPG selling volume was decreased due to more captive use to optimize the company benefit as previously mentioned.
2014 (Day)
1Q/2015 (Day)
+/(-) (Day)
AR Turnover 30 30 0
AR Turnover for 1Q/2015 averaged at 30 days, equivalents to the end of year 2014.
Inventory decreased by Baht 1,341 million or 4%. A decrement was mainly because of a sharp drop in crude price, therefore, the Company had policy to manage inventory level to minimize loss from NRV. Moreover, inventory cost per unit also declined because of the use of weighted average method to measure inventory value, inventory cost per unit at the end of 2014 was still high.
2014 (Day)
1Q/2015 (Day)
+/(-) (Day)
Inventory Turnover
18 19 1
Inventory turnover for 1Q/2015 averaged at
19 days, increased from end of year 2014 by 1 day as a result of crude oil prices began to stabilize in the end of the 1Q/2015, the Company increased the purchasing volume in March 2015 causing the volume of crude oil slightly increased comparing to year end 2014 and inventory turnover increased accordingly.
Other current asset decreased by Baht 1,883 million or 26% due mainly to 1) other receivables from crack spread hedging and inventory hedging gain in December 2014 decreased by Baht 1,200 million as it was paid during 1Q/2015 2) receivables from oil
Cash/ Cash equivalent/ Short term investment
Current Asset
PP&E
Non Current Asset
Other Liability Interest Bearing Debt Shareholders’ Equity
31 December 2014 380 Billion Baht
31 March 2015 384 Billion Baht
Unit : Billion Baht
Management Discussion and Analysis 1Q/2015 Page |17
fund decreased by Baht 357 million, as a result of energy reform regarding LPG price. According to National Energy Policy Council (NEPC) notice no. 15/2015, the Company now has to make a contribution to oil fund instead of getting subsidy. At the end of 2014, the Company had outstanding receivables from oil fuel fund which was paid during 1Q/2015 3) Deferred VAT decreased by Baht 231 million due to year end 2014 had more purchase amount that has not yet been invoiced more than 1Q/2015.
2) Non-current asset decreased by Baht 2,131 million or 1% which was mainly due to:
Property, plant and equipment decreased by Baht 1,362 million or 1%. This was from an increase in assets cost by Baht 2,755 million, net off the depreciation recognized in the period by Baht 3,342 million. The increment in assets cost was mainly from additional assets and construction-in-progress from on-going projects such as Phenol II, TOCGC improvement, and Aromatics II Debottlenecking projects. In addition, there was an increase in plant turnaround recognized as asset during the period. On top of that, appreciation of Baht had reduced the value of assets of international entities by Baht 775 million.
Other non-current asset decreased by Baht 769 million or 2% mainly from a decrease of investment in associates by Baht 324 million. As almost all are investment in foreign entities, appreciation of Baht reduced the investment value. As well as investment, stronger in Baht reduced all assets value of international business when translating into Baht.
Liability As at March 31, 2015, the Company had total liability of Baht 152,680 million, decreased by Baht 313 million or 0.2% from December 31, 2014 which resulted from a decrease in current liability of Baht 480 million whereas non-current liability increased by Baht 167 million. 1) Current liability decreased Baht 480 million or 1% from the following reasons:
Bank overdraft and short-term loans from financial institutions decreased by Baht 529 million or 67%. This was mainly due to Vencorex decreased the amount of AR
factoring sold to financial institutions as Vencorex had better performance and better working capital from the reduction of product and raw material price. In addition, the stronger of Euro against Baht led to the decrease of liability amount in Baht.
Accounts payable increased by Baht 1,380 million or 6%. This was mainly due to lower purchase volume in December 2014 in order to control the inventory level during the situation of crude oil price volatility. However, this quarter, crude price was more stable than end of last year, therefore, purchase volume increased and accounts payable increased accordingly.
Other accounts payable decreased Baht 1,679 million or 21% as a result of a decrease in accrued bonus of Baht 416 million, a decrease in accrued interest of Baht 248 million, a decrease in accrued excise tax of Baht 220 million, from the payment during the period. Moreover, there had been the repayment of other payables for investment projects according to completion by Baht 90 million. In addition, there was the payment of input tax by Baht 134 million.
Payables to contractors decreased by Baht 766 million or 31% from payment during the period according to time schedule.
Current portion of long term loan increased by Baht 997 million or 4% due mainly from the reclassification of long term loan to current portion around 3,264 million, off-set with loan repayment during the period around Baht 2,240 million.
2) Non-current liability increased by Baht 167 million or 0.3% which was mainly due to:
Long-term loan increased by Baht 298 million or 0.3%. This was mainly due to additional loan drawn down during the period totaling to Baht 3,950 million, off set with the reclassification of long term loan and long term debenture to current portion at the amount of Baht 3,264 million. However, the stronger of 0.41 Baht/USD resulted to the decrease in USD loan by Baht 400 million.

Management Discussion and Analysis 1Q/2015 Page |18
Shareholder’s Equity As of March 31, 2015, the Company reported total shareholders’ of Baht 231,713 million, increased by Baht 4,776 million or 2% from December 31, 2014. This included an increase in the Company’s portion of Baht 4,678 million and an increase in non-controlling interest portion of Baht 98 million.
The Company’s portion increased by Baht 4,678 million or 2% arose from the Company’s net profit in 3M/2015 of Baht 5,631 million, off set with loss in the foreign currency translation differences for
international operations and loss from financial derivative valuation to reduce risk of cash flow for Baht 953 million.
Non-controlling interest’s portion incerased by Baht 98 million or 5% from the profit during the period by Baht 51 million. Moreover, there was a recognition of an increase in non-controlling interest portion of Vencorex by Baht 113 million. However, there was loss from foreign currency translation of Baht 66 million.
Statement of Cash Flows
For statement of cash flows for 3 months ended March 31, 2015, the Company had net cash from operating activities of Baht 18,095 million, net cash used in investment activities of Baht 17,825 million which was mainly from investment in on-going projects such as Phenol II, Aromatics II Debottlenecking and TOCGC improvement projects, etc. In addition, the Company had net cash received from financing activities of Baht 184 million from loan drawn down off-set with loan repayment and interest paid. Adding up together with beginning cash and cash equivalents and effect of exchange rate changes on balances held in foreign currencies of Baht 13,759 million, the Company had cash and cash equivalents at the end of 1Q/2015 of Baht 14,213 million. Including current investments, the Company reported cash and cash equivalents and current investments totaled to Baht 60,070 million.

Management Discussion and Analysis 1Q/2015 Page |19
Key Financial Ratios
Financial Ratios 1Q/2014
(Restated) 4Q/2014
(Restated) 1Q/2015
Current Ratio (Times) 2.03 2.19 2.33
EBITDA to sales revenue (%) 9.77% 6.21% 6.64%
Net Profits to sales revenues (%) 5.12% 2.79% 2.89%
Return on total assets (%) 8.49% 5.05% 4.91%
Return on equity (%) 12.14% 6.86% 6.40%
Interest Bearing Debt to equity (Times) 0.48 0.50 0.49
Net interest bearing debt to equity (Times) 0.29 0.30 0.23
Net interest bearing debt to EBITDA (Times) 1.30 1.97 1.59
Note:
Current ratio = Current assets divided by current liabilities
EBITDA to sales revenue = EBITDA divided by sales revenue (for the last 4 quarters)
Net profit on sale revenue = Net profit divided by sales revenue (for the last 4 quarters)
Return on total assets = Net profit (for the last 4 quarters) divided by average total assets
Return on equity = Net profit (for the last 4 quarters) divided by average total shareholder’s equity
Interest Bearing Debt to Shareholders’ Equity
= Interest Bearing Debt divided by shareholder’s equity
Net Interest Bearing Debt to Shareholders’ Equity
= Interest Bearing Debt net from cash and cash equivalent and current investments divided by shareholder’s equity
Net Interest Bearing Debt to EBITDA = Interest Bearing Debt net from cash and cash equivalent and current investments divided by EBITDA (for the last 4 quarters)


