351
Government of Canada Gouvernement du Canada Prepared by the Receiver General for Canada Public Accounts of Canada Volume I Summary Report and Consolidated Financial Statements

Governmentof Canada
Gouvernementdu Canada
Prepared by the Receiver General for Canada
Public Accounts of Canada
Volume I
Summary Report and Consolidated Financial Statements

© Minister of Public Services and Procurement 2016
This document is available in alternative formats
on the Receiver General for Canada website at
www.tpsgc-pwgsc.gc.ca/recgen/cpc-pac/index-eng.html
Also available in PDF format from the
Government of Canada Publications
www.publications.gc.ca
P51-1E-PDF
ISSN 1483-8575
Cette publication est également disponible en français
Errata
Subsequent to the tabling of the Public Accounts of Canada, corrections were made in Volume I, Section 6, Public sector pensions, page 6.36. The revised information is highlighted.

To His Excellency The Right Honourable David Johnston, C.C., C.M.M., C.O.M., C.D., Governor General and Commander-in-Chief of Canada May it please your Excellency:
I have the honour to present to Your Excellency the Public Accounts of Canada for the year ended March 31, 2016.
All of which is respectfully submitted.
Scott Brison, P.C., M.P. President of the Treasury Board
Ottawa, October 24, 2016
To The Honourable Scott Brison, P.C., M.P. President of the Treasury Board Sir:
In accordance with the provisions of section 64(1) of the Financial Administration Act, I have the honour to transmit herewith the Public Accounts of Canada for the year ended March 31, 2016, to be laid by you before the House of Commons.
Respectfully submitted,
Judy M. Foote, P.C., M.P. Receiver General for Canada
Ottawa, October 24, 2016
To The Honourable Judy M. Foote, P.C., M.P. Receiver General for Canada Madam:
I have the honour to submit the Public Accounts of Canada for the year ended March 31, 2016.
Under section 64(1) of the Financial Administration Act, the Public Accounts of Canada for each fiscal year shall be prepared by the Receiver General and shall be laid before the House of Commons by the President of the Treasury Board on or before the thirty-first day of December next following the end of that year, or if the House of Commons is not then sitting, within the first fifteen days next thereafter that the House of Commons is sitting.
This annual report is presented in three volumes:
Volume I — The consolidated financial statements of Canada on which the Auditor General has expressed an opinion and provided his observations; a discussion and analysis of the consolidated financial statements and a ten-year comparison of financial information; analyses of revenues and expenses, and of asset and liability accounts; and various other statements;
Volume II — Details of the financial operations of the Government, segregated by ministry; and
Volume III — Additional information and analyses
Respectfully submitted,
Marie Lemay Deputy Receiver General for Canada
Ottawa, October 24, 2016

This page has been intentionally left blank.

Volume I
2015–2016
Public Accounts of Canada
Table of contents
Section
Introduction 1. Financial statements discussion and analysis 2. Consolidated financial statements of the Government
of Canada and report and observations of the Auditor General of Canada
3. Revenues, expenses and accumulated deficit 4. Consolidated accounts 5. Accounts payable and accrued liabilities 6. Interest-bearing debt 7. Cash and accounts receivable 8. Foreign exchange accounts 9. Loans, investments and advances 10. Non-financial assets 11. Contractual obligations and contingent liabilities 12. Index
Introduction to the Public Accounts of Canada
Nature of the Public Accounts of Canada
The Public Accounts of Canada is the report of the Government of Canada prepared annually by the Receiver General, as required by section 64 of the Financial Administration Act. It covers the fiscal year of the Government, which ends on March 31.
The information contained in the report originates from two sources of data:
the summarized financial transactions presented in the accounts of Canada, maintained by the Receiver General; and
the detailed records, maintained by departments and agencies.
Each department and agency is responsible for reconciling its accounts to the control accounts of the Receiver General, and for maintaining detailed records of the transactions in their accounts.
The report covers the financial transactions of the Government during the year. In certain cases, parliamentary authority to undertake transactions was provided by legislation approved in earlier years.
Format of the Public Accounts of Canada
The Public Accounts of Canada is produced in three volumes:
Volume I presents the audited consolidated financial statements of the Government, as well as additional financial information and analyses;
Volume II presents the financial operations of the Government, segregated by ministry; and
Volume III presents supplementary information and analyses.

Section 1
2015–2016
Public Accounts of Canada
Financial statements discussion and analysis Table of contents Page
Financial statements discussion and analysis .................................. 1.2 Introduction.................................................................................. 1.2
2015–2016 financial highlights ................................................ 1.2Discussion and analysis ............................................................... 1.3
Economic developments .......................................................... 1.3The budgetary balance ............................................................. 1.4Revenues................................................................................... 1.5Expenses ................................................................................... 1.7Comparison of actual results to budget projections................. 1.10Accumulated deficit ................................................................. 1.11Cash flow.................................................................................. 1.21Risks and uncertainties............................................................. 1.21
Ten-year comparative financial information ................................... 1.22 Consolidated Statement of Operations and
Accumulated Deficit—detailed ................................................ 1.22 Consolidated Statement of Financial Position—detailed............ 1.23Consolidated Statement of Change in Net Debt—detailed......... 1.24Consolidated Statement of Cash Flow—detailed ........................ 1.25Consolidated Statement of Non-Budgetary Transactions
and of Non-Financial Assets—detailed ................................... 1.26 Consolidated Statement of Foreign Exchange, Unmatured Debt
and Cash Transactions—detailed ............................................. 1.27 Glossary of terms ............................................................................. 1.28
Note to reader
An overview of the financial operations of the Government of Canada is provided in the Annual Financial Report prepared by the Department of Finance. This Report also includes condensed consolidated financial statements.
Accompanying this Report are historical fiscal reference tables and related fiscal indicators for the federal government and the provinces.
The Annual Financial Report is available on the web at www.fin.gc.ca/purl/afr-eng.asp.
Public Accounts of Canada, 2015–2016
1 . 2 Financial statements discussion and analysis
Financial statements discussion and analysis
Introduction
The Public Accounts of Canada is a major accountability report of the Government of Canada. This section, together with the other sections in this volume and in Volumes II and III of the Public Accounts of Canada, provides detailed supplementary information in respect of matters reported in the audited consolidated financial statements in Section 2 of this volume. Supplementary discussion and analysis of the Government’s financial results can be found in the Annual Financial Report of the Government of Canada—Fiscal Year 2015–2016, available on the Department of Finance Canada’s website.
The consolidated financial statements have been prepared under the joint direction of the Minister of Finance, the President of the Treasury Board and the Receiver General for Canada. Responsibility for the integrity and objectivity of the consolidated financial statements rests with the Government. A glossary of terms used in this financial statements discussion and analysis is provided at the end of this section.
2015–2016 financial highlights
– The Government posted a budgetary deficit of $1.0 billion for the fiscal year ended March 31, 2016, compared to a budgetary surplus of $1.9 billion in 2014–2015.
– Revenues increased by $13.1 billion, or 4.6 per cent, from 2014–2015, largely reflecting growth in income tax revenues and other taxes and duties. Program expenses increased by $17.0 billion, or 6.7 per cent, reflecting increases in major transfers to persons and other levels of government and other program expenses. Public debt charges were down $1.0 billion, or 3.8 per cent, due to a lower average effective interest rate on the stock of interest-bearing debt.
– The accumulated deficit (the difference between total liabilities and total assets) stood at $616.0 billion at March 31, 2016. The accumulated deficit-to-GDP (gross domestic product) ratio was 31.1 per cent, up slightly from the previous year.
– As reported by the International Monetary Fund (IMF), Canada’s total government net debt-to-GDP ratio, which includes the net debt of the federal, provincial/territorial and local governments, as well as the net assets held in the Canada Pension Plan and Quebec Pension Plan, stood at 26.7 per cent in 2015. This is the lowest level among Group of Seven (G7) countries, which the IMF expects will record an average net debt of 83.0 per cent of GDP for the same year.
Public Accounts of Canada, 2015–2016
Financial statements discussion and analysis 1 . 3
Discussion and analysis
Economic developments1
The performance of the world economy was disappointing in 2015, as global growth slowed to its weakest pace since the 2008–2009 Great Recession. Slowing economic activity in emerging markets weighed on global demand and maintained downward pressure on commodity prices, particularly oil prices. In the first quarter of 2016, momentum in the global economy remained weak, dampened by an ongoing slowdown in China, while the price of crude oil reached its lowest level since 2002 and volatility spiked in financial markets.
For Canada, as a producer and net exporter of crude oil, persistent weak global demand and low oil prices throughout 2015 and early in 2016 had negative implications for the economy. In particular, the oil and gas sector is estimated to have cut capital spending by between 30 and 40 per cent in 2015 to consolidate profit margins, in addition to significant personnel reductions made during the year. In the non-energy sector, economic activity grew at a fairly strong pace in 2015, although at a slower pace than in 2014. Overall, real GDP growth in Canada declined from 2.5 per cent in 2014 to 1.1 per cent in 2015, the slowest pace since the Great Recession.
At the same time, nominal GDP, the broadest measure of the tax base, grew by just 0.5 per cent in 2015, the slowest growth since 1981 excluding the Great Recession2. This reflected the additional impact of lower oil prices on Canada’s terms of trade—the prices of Canadian exports relative to Canadian imports. Both real and nominal GDP growth in 2015 were significantly lower than anticipated in Budget 2015.
In response to weak economic conditions, short- and long-term interest rates remained at historically low levels in 2015. The Bank of Canada cut its target for the overnight rate twice in 2015, from 1.0 per cent to 0.75 per cent in January and to 0.5 per cent in July. As a result, interest rates for 2015 came in slightly below Budget 2015 projections.
The unemployment rate was 6.9 per cent in both 2014 and 2015. In line with slower GDP growth and job creation, the unemployment rate for 2015 came in slightly higher than expected at the time of Budget 2015.
Reflecting lower commodity prices, consumer price index (CPI) inflation slowed from 1.9 per cent in 2014 to 1.1 per cent in 2015. While the 2015 CPI inflation rate was below the mid-point of the Bank of Canada’s target range, it was slightly higher than projected in Budget 2015. ___________________________________________________________________________________
1 This section incorporates data available up to and including August 23, 2016. 2 Or since the availability of published Canadian Income and Expenditure Accounts data.
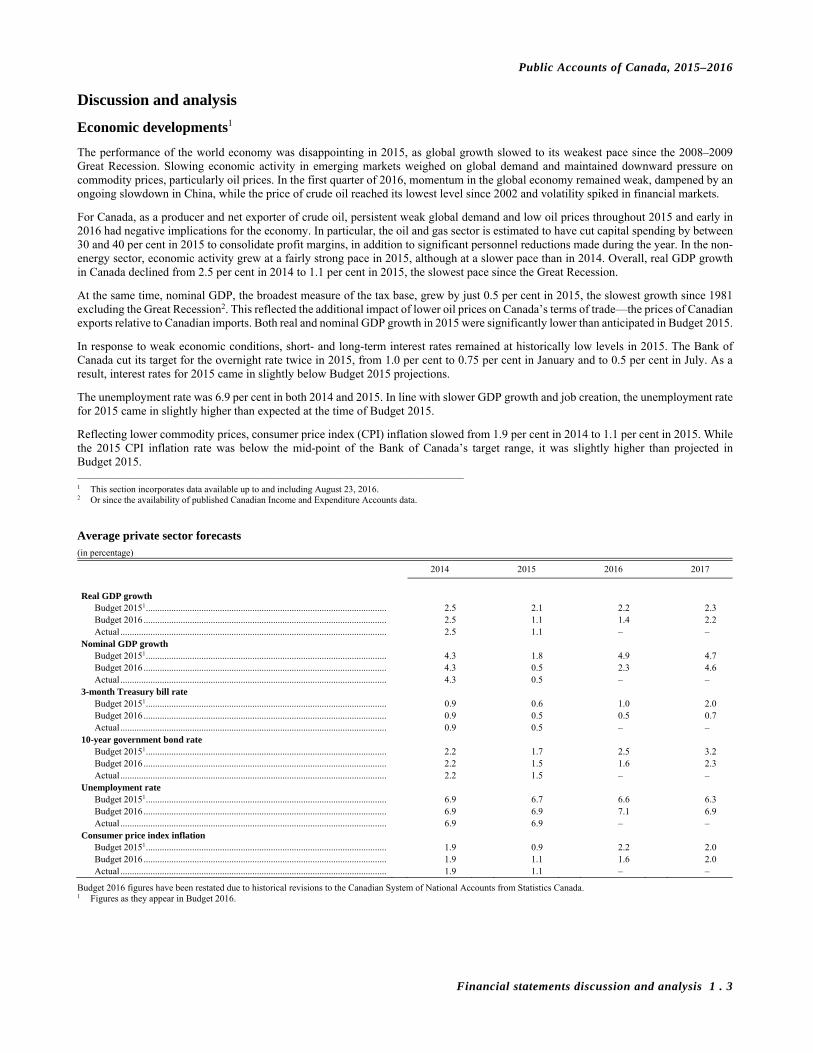
Average private sector forecasts (in percentage)
2014 2015 2016 2017
Real GDP growth
Budget 20151 ........................................................................................................ 2.5 2.1 2.2 2.3 Budget 2016 ......................................................................................................... 2.5 1.1 1.4 2.2 Actual ................................................................................................................... 2.5 1.1 – –
Nominal GDP growth Budget 20151 ........................................................................................................ 4.3 1.8 4.9 4.7 Budget 2016 ......................................................................................................... 4.3 0.5 2.3 4.6 Actual ................................................................................................................... 4.3 0.5 – –
3-month Treasury bill rate Budget 20151 ........................................................................................................ 0.9 0.6 1.0 2.0 Budget 2016 ......................................................................................................... 0.9 0.5 0.5 0.7 Actual ................................................................................................................... 0.9 0.5 – –
10-year government bond rate Budget 20151 ........................................................................................................ 2.2 1.7 2.5 3.2 Budget 2016 ......................................................................................................... 2.2 1.5 1.6 2.3 Actual ................................................................................................................... 2.2 1.5 – –
Unemployment rate Budget 20151 ........................................................................................................ 6.9 6.7 6.6 6.3 Budget 2016 ......................................................................................................... 6.9 6.9 7.1 6.9 Actual ................................................................................................................... 6.9 6.9 – –
Consumer price index inflation Budget 20151 ........................................................................................................ 1.9 0.9 2.2 2.0 Budget 2016 ......................................................................................................... 1.9 1.1 1.6 2.0 Actual ................................................................................................................... 1.9 1.1 – –
Budget 2016 figures have been restated due to historical revisions to the Canadian System of National Accounts from Statistics Canada. 1 Figures as they appear in Budget 2016.

Public Accounts of Canada, 2015–2016
1 . 4 Financial statements discussion and analysis
The budgetary balance
The Government posted a budgetary deficit of $1.0 billion in 2015–2016, compared to a surplus of $1.9 billion in 2014–2015.
The following graph shows the Government’s budgetary balance since 1991–1992. To enhance the comparability of results over time and across jurisdictions, the budgetary balance and its components are presented as a percentage of GDP. In 2015–2016, the budgetary deficit was 0.0 per cent of GDP, compared to a surplus of 0.1 per cent of GDP a year earlier.
Revenues were up $13.1 billion, or 4.6 per cent, from the prior year, largely reflecting increases in income tax revenues and other taxes and duties.
Expenses were up $16.0 billion, or 5.7 per cent, from the prior year. Program expenses increased by $17.0 billion, reflecting increases in major transfers to persons and other levels of government and other program expenses. Public debt charges decreased by $1.0 billion, or 3.8 per cent, from the prior year, reflecting a lower average effective interest rate on the stock of interest-bearing debt.
2015–2016 financial highlights (in millions of dollars)
2015–2016 2014–2015
Consolidated Statement of Operations
Revenues ......................................................................................................................................................................................... 295,453 282,346 Expenses
Program expenses ...................................................................................................................................................................... 270,845 253,841 Public debt charges ................................................................................................................................................................... 25,595 26,594
Total expenses ........................................................................................................................................................................... 296,440 280,435
Annual (deficit) surplus ................................................................................................................................................................. (987) 1,911
Percentage of GDP ......................................................................................................................................................................... 0.0% 0.1%
Consolidated Statement of Financial Position
Liabilities Interest-bearing debt.................................................................................................................................................................. 931,721 899,986 Other .......................................................................................................................................................................................... 127,853 123,631
Total liabilities .......................................................................................................................................................................... 1,059,574 1,023,617
Financial assets ............................................................................................................................................................................... 365,823 336,658
Net debt ........................................................................................................................................................................................... 693,751 686,959
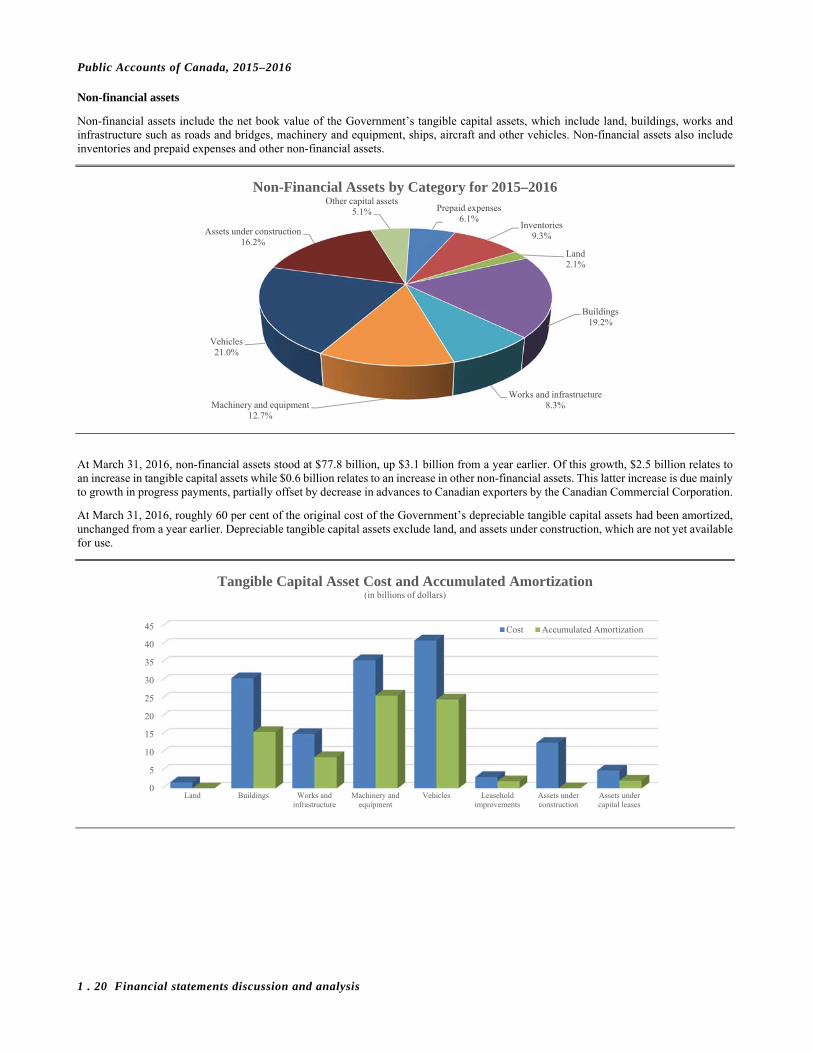
Non-financial assets ........................................................................................................................................................................ 77,765 74,629
Accumulated deficit ....................................................................................................................................................................... 615,986 612,330
Percentage of GDP ......................................................................................................................................................................... 31.1% 31.0%
-6
-5
-4
-3
-2
-1
0
1
2
1991
–199
2
1992
–199
3
1993
–199
4
1994
–199
5
1995
–199
6
1996
–199
7
1997
–199
8
1998
–199
9
1999
–200
0
2000
–200
1
2001
–200
2
2002
–200
3
2003
–200
4
2004
–200
5
2005
–200
6
2006
–200
7
2007
–200
8
2008
–200
9
2009
–201
0
2010
–201
1
2011
–201
2
2012
–201
3
2013
–201
4
2014
–201
5
2015
–201
6
Annual Surplus/Deficit(percentage of GDP)
Public Accounts of Canada, 2015–2016
Financial statements discussion and analysis 1 . 5
Revenues
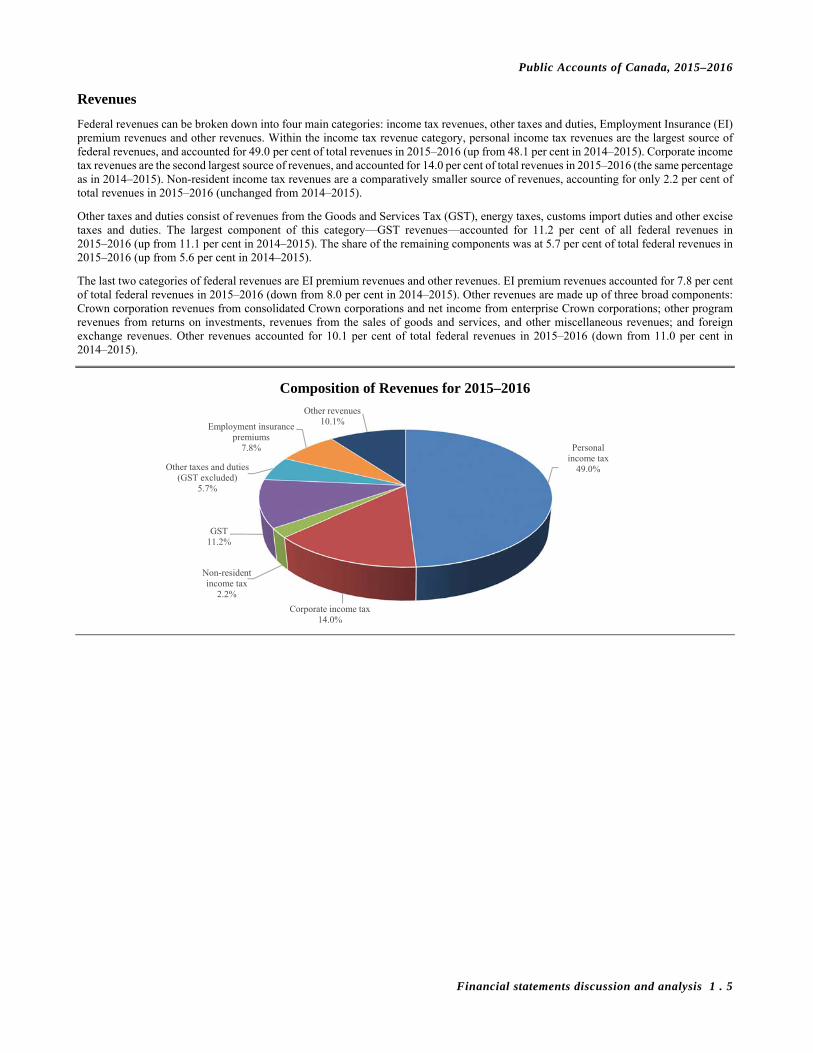
Federal revenues can be broken down into four main categories: income tax revenues, other taxes and duties, Employment Insurance (EI) premium revenues and other revenues. Within the income tax revenue category, personal income tax revenues are the largest source of federal revenues, and accounted for 49.0 per cent of total revenues in 2015–2016 (up from 48.1 per cent in 2014–2015). Corporate income tax revenues are the second largest source of revenues, and accounted for 14.0 per cent of total revenues in 2015–2016 (the same percentage as in 2014–2015). Non-resident income tax revenues are a comparatively smaller source of revenues, accounting for only 2.2 per cent of total revenues in 2015–2016 (unchanged from 2014–2015).
Other taxes and duties consist of revenues from the Goods and Services Tax (GST), energy taxes, customs import duties and other excise taxes and duties. The largest component of this category—GST revenues—accounted for 11.2 per cent of all federal revenues in 2015–2016 (up from 11.1 per cent in 2014–2015). The share of the remaining components was at 5.7 per cent of total federal revenues in 2015–2016 (up from 5.6 per cent in 2014–2015).
The last two categories of federal revenues are EI premium revenues and other revenues. EI premium revenues accounted for 7.8 per cent of total federal revenues in 2015–2016 (down from 8.0 per cent in 2014–2015). Other revenues are made up of three broad components: Crown corporation revenues from consolidated Crown corporations and net income from enterprise Crown corporations; other program revenues from returns on investments, revenues from the sales of goods and services, and other miscellaneous revenues; and foreign exchange revenues. Other revenues accounted for 10.1 per cent of total federal revenues in 2015–2016 (down from 11.0 per cent in 2014–2015).
Personal income tax
49.0%
Corporate income tax14.0%
Non-resident income tax
2.2%
GST11.2%
Other taxes and duties (GST excluded)
5.7%
Employment insurance premiums
7.8%
Other revenues10.1%
Composition of Revenues for 2015–2016
Public Accounts of Canada, 2015–2016
1 . 6 Financial statements discussion and analysis
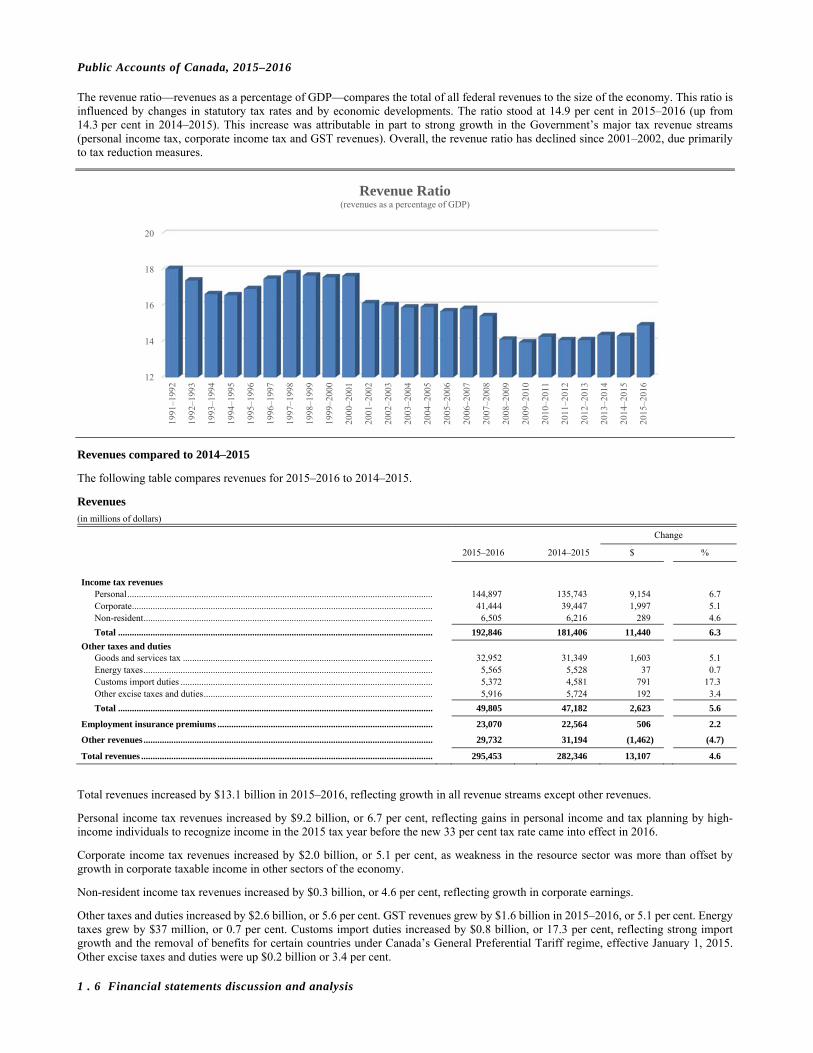
The revenue ratio—revenues as a percentage of GDP—compares the total of all federal revenues to the size of the economy. This ratio is influenced by changes in statutory tax rates and by economic developments. The ratio stood at 14.9 per cent in 2015–2016 (up from 14.3 per cent in 2014–2015). This increase was attributable in part to strong growth in the Government’s major tax revenue streams (personal income tax, corporate income tax and GST revenues). Overall, the revenue ratio has declined since 2001–2002, due primarily to tax reduction measures.
Revenues compared to 2014–2015
The following table compares revenues for 2015–2016 to 2014–2015.
Revenues (in millions of dollars)
Change
2015–2016 2014–2015 $ %
Income tax revenues
Personal .................................................................................................................................... 144,897 135,743 9,154 6.7 Corporate .................................................................................................................................. 41,444 39,447 1,997 5.1 Non-resident ............................................................................................................................. 6,505 6,216 289 4.6
Total ........................................................................................................................................ 192,846 181,406 11,440 6.3
Other taxes and duties Goods and services tax ............................................................................................................ 32,952 31,349 1,603 5.1 Energy taxes ............................................................................................................................. 5,565 5,528 37 0.7 Customs import duties ............................................................................................................. 5,372 4,581 791 17.3 Other excise taxes and duties ................................................................................................... 5,916 5,724 192 3.4
Total ........................................................................................................................................ 49,805 47,182 2,623 5.6
Employment insurance premiums ............................................................................................. 23,070 22,564 506 2.2
Other revenues ............................................................................................................................. 29,732 31,194 (1,462) (4.7)
Total revenues .............................................................................................................................. 295,453 282,346 13,107 4.6
Total revenues increased by $13.1 billion in 2015–2016, reflecting growth in all revenue streams except other revenues.
Personal income tax revenues increased by $9.2 billion, or 6.7 per cent, reflecting gains in personal income and tax planning by high-income individuals to recognize income in the 2015 tax year before the new 33 per cent tax rate came into effect in 2016.
Corporate income tax revenues increased by $2.0 billion, or 5.1 per cent, as weakness in the resource sector was more than offset by growth in corporate taxable income in other sectors of the economy.
Non-resident income tax revenues increased by $0.3 billion, or 4.6 per cent, reflecting growth in corporate earnings.
Other taxes and duties increased by $2.6 billion, or 5.6 per cent. GST revenues grew by $1.6 billion in 2015–2016, or 5.1 per cent. Energy taxes grew by $37 million, or 0.7 per cent. Customs import duties increased by $0.8 billion, or 17.3 per cent, reflecting strong import growth and the removal of benefits for certain countries under Canada’s General Preferential Tariff regime, effective January 1, 2015. Other excise taxes and duties were up $0.2 billion or 3.4 per cent.
12
14
16
18
20
1991
–199
2
1992
–199
3
1993
–199
4
1994
–199
5
1995
–199
6
1996
–199
7
1997
–199
8
1998
–199
9
1999
–200
0
2000
–200
1
2001
–200
2
2002
–200
3
2003
–200
4
2004
–200
5
2005
–200
6
2006
–200
7
2007
–200
8
2008
–200
9
2009
–201
0
2010
–201
1
2011
–201
2
2012
–201
3
2013
–201
4
2014
–201
5
2015
–201
6
Revenue Ratio(revenues as a percentage of GDP)
Public Accounts of Canada, 2015–2016
Financial statements discussion and analysis 1 . 7
EI premium revenues increased by $0.5 billion, or 2.2 per cent, reflecting growth in insurable earnings.
Other revenues decreased by $1.5 billion, or 4.7 per cent, in 2015–2016, due in large part to lower Crown corporation revenues, including decreases in the net income of Canada Mortgage and Housing Corporation (CMHC), Export Development Canada and Farm Credit Canada, which reflect, in part, the fact that revenues in the previous year were elevated due to one-time events (e.g., gains on the sale of investments within CMHC’s mortgage loan insurance investment portfolio). These decreases more than offset the $2.1-billion gain recorded in 2015–2016 on the sale of the Government’s remaining holdings of General Motors common shares.
Expenses
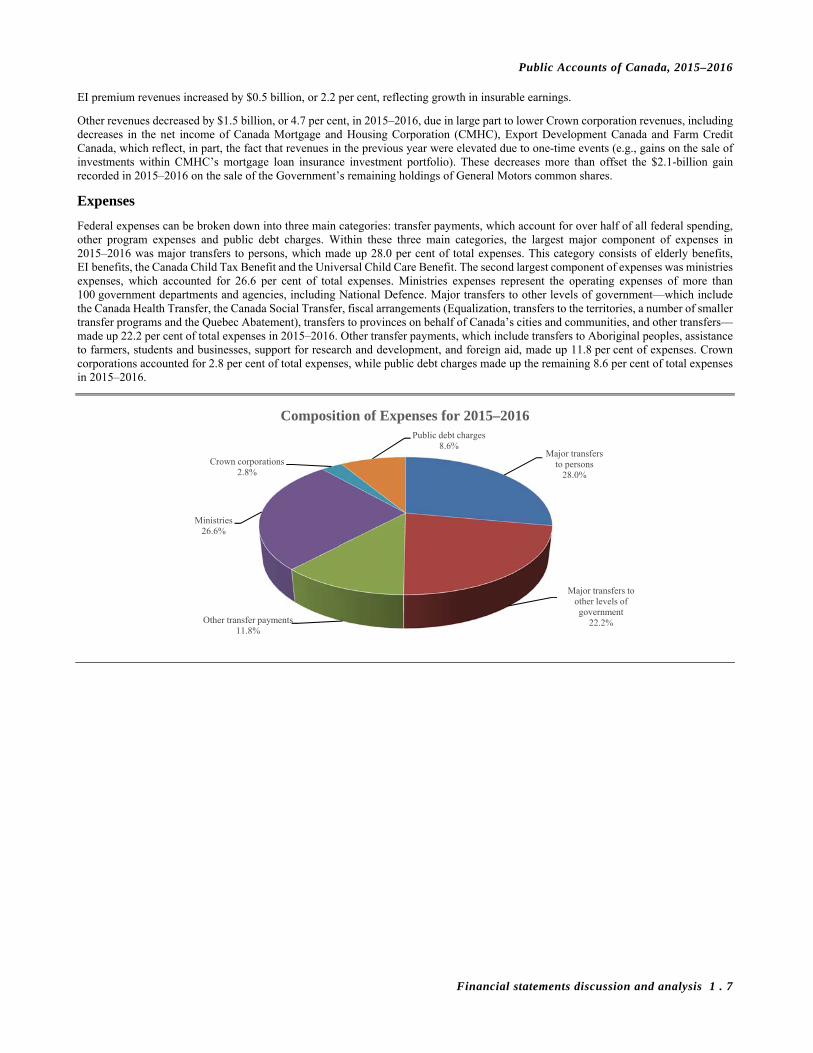
Federal expenses can be broken down into three main categories: transfer payments, which account for over half of all federal spending, other program expenses and public debt charges. Within these three main categories, the largest major component of expenses in 2015–2016 was major transfers to persons, which made up 28.0 per cent of total expenses. This category consists of elderly benefits, EI benefits, the Canada Child Tax Benefit and the Universal Child Care Benefit. The second largest component of expenses was ministries expenses, which accounted for 26.6 per cent of total expenses. Ministries expenses represent the operating expenses of more than 100 government departments and agencies, including National Defence. Major transfers to other levels of government—which include the Canada Health Transfer, the Canada Social Transfer, fiscal arrangements (Equalization, transfers to the territories, a number of smaller transfer programs and the Quebec Abatement), transfers to provinces on behalf of Canada’s cities and communities, and other transfers—made up 22.2 per cent of total expenses in 2015–2016. Other transfer payments, which include transfers to Aboriginal peoples, assistance to farmers, students and businesses, support for research and development, and foreign aid, made up 11.8 per cent of expenses. Crown corporations accounted for 2.8 per cent of total expenses, while public debt charges made up the remaining 8.6 per cent of total expenses in 2015–2016.
Major transfers to persons
28.0%
Major transfers to other levels of government
22.2%Other transfer payments11.8%
Ministries26.6%
Crown corporations2.8%
Public debt charges8.6%
Composition of Expenses for 2015–2016

Public Accounts of Canada, 2015–2016
1 . 8 Financial statements discussion and analysis
There has been a large shift in the composition of total expenses since the early 1990s. Public debt charges were the largest component for most of the 1990s, given the large and increasing stock of interest-bearing debt and high average effective interest rates on that stock of debt. Since reaching a high of nearly 30 per cent of total expenses in 1996–1997, the share of public debt charges in total expenses has fallen by more than two-thirds.
The interest ratio (public debt charges as a percentage of revenues) has been decreasing in recent years, falling from a peak of 37.6 per cent in 1990–1991 to 9.4 per cent in 2014–2015. The ratio continued to fall in 2015–2016, reaching 8.7 per cent. This means that, in 2015–2016, the Government spent approximately 9 cents of every revenue dollar on interest on public debt.
0
10
20
30
40
50
1991
–199
2
1992
–199
3
1993
–199
4
1994
–199
5
1995
–199
6
1996
–199
7
1997
–199
8
1998
–199
9
1999
–200
0
2000
–200
1
2001
–200
2
2002
–200
3
2003
–200
4
2004
–200
5
2005
–200
6
2006
–200
7
2007
–200
8
2008
–200
9
2009
–201
0
2010
–201
1
2011
–201
2
2012
–201
3
2013
–201
4
2014
–201
5
2015
–201
6
Public Debt Charges(public debt charges as a percentage of total expenses)
0
10
20
30
40
50
1991
–199
2
1992
–199
3
1993
–199
4
1994
–199
5
1995
–199
6
1996
–199
7
1997
–199
8
1998
–199
9
1999
–200
0
2000
–200
1
2001
–200
2
2002
–200
3
2003
–200
4
2004
–200
5
2005
–200
6
2006
–200
7
2007
–200
8
2008
–200
9
2009
–201
0
2010
–201
1
2011
–201
2
2012
–201
3
2013
–201
4
2014
–201
5
2015
–201
6
Interest Ratio(public debt charges as a percentage of revenues)
Public Accounts of Canada, 2015–2016
Financial statements discussion and analysis 1 . 9
Expenses compared to 2014–2015
Total expenses amounted to $296.4 billion in 2015–2016, up $16.0 billion, or 5.7 per cent, from 2014–2015.
The following table compares total expenses for 2015–2016 to 2014–2015.
Expenses (in millions of dollars)
Change
2015–2016 2014–2015 $ %
Transfer payments
Major transfers to persons Elderly benefits1 ............................................................................................................... 45,461 44,103 1,358 3.1 Employment insurance benefits ....................................................................................... 19,419 18,052 1,367 7.6 Children's benefits ............................................................................................................ 18,025 14,303 3,722 26.0
Total ................................................................................................................................. 82,905 76,458 6,447 8.4
Major transfers to other levels of government Federal transfer support for health and other social programs ........................................ 46,984 44,696 2,288 5.1 Fiscal arrangements and other transfers ........................................................................... 18,866 18,413 453 2.5
Total ................................................................................................................................. 65,850 63,109 2,741 4.3
Other transfer payments ......................................................................................................... 34,874 35,126 (252) (0.7)
Total transfer payments ...................................................................................................... 183,629 174,693 8,936 5.1
Other program expenses Crown corporations ................................................................................................................ 8,358 7,590 768 10.1 Ministries ............................................................................................................................... 78,858 71,558 7,300 10.2
Total other program expenses ............................................................................................ 87,216 79,148 8,068 10.2
Program expenses ...................................................................................................................... 270,845 253,841 17,004 6.7
Public debt charges .................................................................................................................... 25,595 26,594 (999) (3.8)
Total expenses ............................................................................................................................ 296,440 280,435 16,005 5.7
1 Elderly benefits consist of old age security benefits, guaranteed income supplement and spouse’s allowance.
Major transfers to persons increased by $6.4 billion in 2015–2016, reflecting increases in elderly, children’s and EI benefits. Elderly benefits increased by $1.4 billion, or 3.1 per cent, reflecting growth in the elderly population and changes in consumer prices, to which benefits are fully indexed. EI benefits increased by $1.4 billion in 2015–2016, reflecting higher average regular benefits due to a worsening in labour market conditions.
Children’s benefits, which consisted of the Canada Child Tax Benefit and the Universal Child Care Benefit, increased by $3.7 billion, or 26.0 per cent, due mainly to the expansion and enhancement of the Universal Child Care Benefit in 2015.
Major transfers to other levels of government increased by $2.7 billion in 2015–2016, primarily reflecting legislated growth in the Canada Health Transfer, the Canada Social Transfer, Equalization transfers and transfers to the territories.
Other transfer payments decreased by $0.3 billion, or 0.7 per cent, in 2015–2016.
Other program expenses increased from $79.1 billion in 2014–2015 to $87.2 billion in 2015–2016, up $8.1 billion, or 10.2 per cent. Within other program expenses, Crown corporation expenses increased by $0.8 billion, or 10.1 per cent, due in large part to an increase in commercial trading transactions of the Canadian Commercial Corporation. Ministries expenses increased by $7.3 billion, or 10.2 per cent, to $78.9 billion. This increase is largely attributable to a $5.5-billion increase in pension and other future benefit costs, including the impact of amendments to veterans future benefits, based on the Government’s latest actuarial valuations, as well as an increase in operating expenses of National Defence and a one-time expense recorded in 2015-2016 related to the write-down of taxes receivable.
Public debt charges decreased by $1.0 billion, or 3.8 per cent, reflecting a lower average effective interest rate on the stock of interest-bearing debt.

Public Accounts of Canada, 2015–2016
1 . 10 Financial statements discussion and analysis
Comparison of actual results to budget projections
Comparison to March 2016 budget plan
The $1.0-billion deficit recorded in 2015–2016 represents a $4.5-billion improvement over the $5.4-billion deficit projected in the March 2016 budget. Revenues were $4.2 billion (1.5 per cent) higher than expected, primarily reflecting better-than-expected personal and corporate income tax revenues.
Program expenses and public debt charges were each $0.1 billion lower than forecast.
Comparison of 2015–2016 outcomes to March 2016 budget (in millions of dollars)
Projection Actual Difference
Revenues .............................................................................................................................................................................. 291,208 295,453 4,245
Expenses Program expenses .......................................................................................................................................................... 270,933 270,845 (88) Public debt charges ........................................................................................................................................................ 25,713 25,595 (118)
Total expenses ................................................................................................................................................................ 296,646 296,440 (206)
Annual deficit ..................................................................................................................................................................... (5,438) (987) 4,451
Comparison to April 2015 budget plan
The 2015–2016 budgetary deficit of $1.0 billion represents a $2.4 billion deterioration relative to the $1.4-billion surplus projected for 2015–2016 in the April 2015 budget. This deterioration is due to higher-than-forecast expenses exceeding higher-than-forecast revenues.
Revenues were $5.2 billion, or 1.8 per cent, higher than forecast in the April 2015 budget, primarily reflecting stronger-than-expected growth in income tax revenues and other taxes and duties. These gains were partially offset by other revenues which were $2.0 billion lower than projected.
Total expenses were $7.5 billion higher than projected in the April 2015 budget, with program expenses $7.6 billion higher than forecast and public debt charges $0.1 billion lower than forecast.
Major transfers to persons were $0.9 billion higher than forecast, largely due to higher-than-expected EI benefits, reflecting a worsening in labour market conditions.
Major transfers to other levels of government were $0.4 billion higher than forecast, largely reflecting advance fiscal stabilization payments to the provinces of Alberta and Newfoundland and Labrador made in 2015–2016 that were not anticipated at the time of Budget 2015.
Direct program expenses, which are comprised of other transfer payments, Crown corporation expenses and ministries expenses, were $6.3 billion higher than projected in the April 2015 budget. Higher-than-expected direct program expenses were largely due to higher ministries expenses, in particular pension and other future benefit costs, reflecting financial support for veterans announced in Budget 2016, as well as a reduction in the long-term interest rates used for valuing pension and other future benefits, which caused more of the costs to be recognized in the near term rather than the future.
Public debt charges in 2015–2016 were $0.1 billion lower than forecast in the April 2015 budget, largely reflecting a lower-than-expected average effective interest rate on the stock of interest-bearing debt.

Public Accounts of Canada, 2015–2016
Financial statements discussion and analysis 1 . 11
Comparison of 2015–2016 outcomes to April 2015 budget (in millions of dollars)
Budget Actual Difference
Revenues
Income tax revenues ...................................................................................................................................................... 186,396 192,846 6,450 Other taxes and duties .................................................................................................................................................... 49,023 49,805 782 Employment insurance premiums ................................................................................................................................. 23,125 23,070 (55) Other revenues ............................................................................................................................................................... 31,742 29,732 (2,010)
Total revenues .................................................................................................................................................................... 290,286 295,453 5,167
Expenses
Program expenses Major transfers to persons ........................................................................................................................................ 82,012 82,905 893 Major transfers to other levels of government ......................................................................................................... 65,436 65,850 414 Other transfer payments ........................................................................................................................................... 33,987 34,874 887 Other program expenses ........................................................................................................................................... 81,777 87,216 5,439
Total program expenses .............................................................................................................................................. 263,212 270,845 7,633
Public debt charges ...................................................................................................................................................... 25,704 25,595 (109)
Total expenses .................................................................................................................................................................... 288,916 296,440 7,524
Annual surplus (deficit)..................................................................................................................................................... 1,370 (987) (2,357)
Accumulated deficit
The accumulated deficit is the difference between the Government’s total liabilities and total assets. The annual change in the accumulated deficit represents the annual budgetary balance plus other comprehensive income or loss. Other comprehensive income or loss is comprised of certain unrealized gains and losses on financial instruments and certain actuarial gains and losses related to pensions and other employee future benefits reported by enterprise Crown corporations and other government business enterprises. Based on the recommendations of the Public Sector Accounting Board, other comprehensive income or loss is not included in the Government’s annual budgetary balance, but is instead recorded directly to the Government’s Consolidated Statement of Accumulated Deficit and Consolidated Statement of Change in Net Debt.
Accumulated deficit (in millions of dollars)
2015–2016 2014–2015 Difference
Accumulated deficit at beginning of year ........................................................................................................................ 612,330 611,881 449 Annual deficit (surplus) ....................................................................................................................................................... 987 (1,911) 2,898 Other comprehensive loss .................................................................................................................................................... 2,669 2,360 309
Accumulated deficit at end of year .................................................................................................................................. 615,986 612,330 3,656
Public Accounts of Canada, 2015–2016
1 . 12 Financial statements discussion and analysis
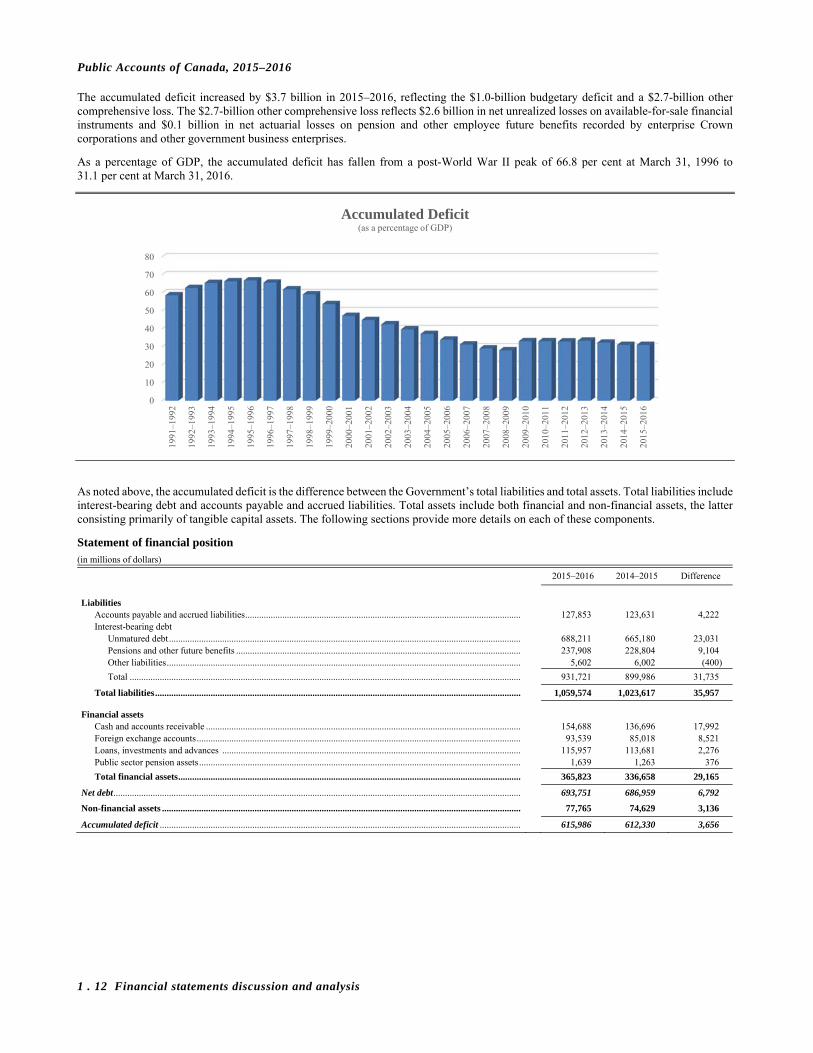
The accumulated deficit increased by $3.7 billion in 2015–2016, reflecting the $1.0-billion budgetary deficit and a $2.7-billion other comprehensive loss. The $2.7-billion other comprehensive loss reflects $2.6 billion in net unrealized losses on available-for-sale financial instruments and $0.1 billion in net actuarial losses on pension and other employee future benefits recorded by enterprise Crown corporations and other government business enterprises.
As a percentage of GDP, the accumulated deficit has fallen from a post-World War II peak of 66.8 per cent at March 31, 1996 to 31.1 per cent at March 31, 2016.
As noted above, the accumulated deficit is the difference between the Government’s total liabilities and total assets. Total liabilities include interest-bearing debt and accounts payable and accrued liabilities. Total assets include both financial and non-financial assets, the latter consisting primarily of tangible capital assets. The following sections provide more details on each of these components.
Statement of financial position (in millions of dollars)
2015–2016 2014–2015 Difference
Liabilities
Accounts payable and accrued liabilities ....................................................................................................................... 127,853 123,631 4,222 Interest-bearing debt
Unmatured debt ........................................................................................................................................................ 688,211 665,180 23,031 Pensions and other future benefits ........................................................................................................................... 237,908 228,804 9,104 Other liabilities ......................................................................................................................................................... 5,602 6,002 (400)
Total ......................................................................................................................................................................... 931,721 899,986 31,735
Total liabilities .............................................................................................................................................................. 1,059,574 1,023,617 35,957
Financial assets Cash and accounts receivable ........................................................................................................................................ 154,688 136,696 17,992 Foreign exchange accounts ............................................................................................................................................ 93,539 85,018 8,521 Loans, investments and advances ................................................................................................................................. 115,957 113,681 2,276 Public sector pension assets ........................................................................................................................................... 1,639 1,263 376
Total financial assets .................................................................................................................................................... 365,823 336,658 29,165
Net debt ................................................................................................................................................................................ 693,751 686,959 6,792
Non-financial assets ........................................................................................................................................................... 77,765 74,629 3,136
Accumulated deficit ............................................................................................................................................................ 615,986 612,330 3,656
0
10
20
30
40
50
60
70
80
1991
–199
2
1992
–199
3
1993
–199
4
1994
–199
5
1995
–199
6
1996
–199
7
1997
–199
8
1998
–199
9
1999
–200
0
2000
–200
1
2001
–200
2
2002
–200
3
2003
–200
4
2004
–200
5
2005
–200
6
2006
–200
7
2007
–200
8
2008
–200
9
2009
–201
0
2010
–201
1
2011
–201
2
2012
–201
3
2013
–201
4
2014
–201
5
2015
–201
6
Accumulated Deficit(as a percentage of GDP)

Public Accounts of Canada, 2015–2016
Financial statements discussion and analysis 1 . 13
Interest-bearing debt
Interest-bearing debt includes unmatured debt, or debt issued on the credit markets, pension and other future benefit liabilities, and other liabilities. Unmatured debt, which includes fixed-coupon marketable bonds, Real Return Bonds, treasury bills, retail debt (Canada Savings Bonds and Canada Premium Bonds), foreign-currency-denominated debt, and obligations related to capital leases, amounted to 73.8 per cent of interest-bearing debt at March 31, 2016. Pension and other future benefit liabilities include obligations for: public sector pensions sponsored by the Government; disability and associated benefits available to war veterans, current and retired members of the Canadian Forces and the Royal Canadian Mounted Police, their survivors and dependants; health care and dental benefits available to retired employees and their dependants; accumulated sick leave entitlements; severance benefits; workers’ compensation benefits; and other future benefits sponsored by some consolidated Crown corporations and other entities. Liabilities for public sector pensions made up 16.4 per cent of interest-bearing debt and other employee and veteran future benefits accounted for an additional 9.2 per cent of interest-bearing debt. The remaining 0.6 per cent of interest-bearing debt represents other interest-bearing liabilities of the Government, which include deposit and trust accounts and other specified purpose accounts.
The share of total interest-bearing debt represented by unmatured debt had been declining since the mid-1990s, as the Government was able to retire some of this debt. This trend reversed in 2008–2009 due to the increase in financial requirements stemming from the recession and stimulus measures introduced to mitigate its impacts, as well as an increase in borrowings under the consolidated borrowing framework introduced in 2008. Under the consolidated borrowing framework, the Government finances all of the borrowing needs of Canada Mortgage and Housing Corporation, the Business Development Bank of Canada and Farm Credit Canada through direct lending in order to reduce overall borrowing costs and improve the liquidity of the government securities market.
At March 31, 2016, interest-bearing debt totalled $931.7 billion, up $31.7 billion from March 31, 2015. Within interest-bearing debt, unmatured debt increased by $23.0 billion, liabilities for pensions decreased by $0.4 billion, liabilities for other employee and veteran future benefits increased by $9.5 billion, and other liabilities decreased by $0.4 billion.
The $23.0-billion increase in unmatured debt largely reflects a $20.2-billion increase in market debt, mainly in marketable bonds and treasury bills, required to meet the financial needs of the Government. The remaining increase was due in large part to a $1.7-billion increase in the value of cross-currency swaps due to exchange rate movements and a $0.8-billion increase in unamortized discounts and premiums on market debt.
The Bank of Canada and the Department of Finance Canada manage the Government’s unmatured debt and associated risks. The fundamental objective of the debt management strategy is to provide stable, low-cost funding to meet the Government’s financial obligations and liquidity needs. Details on the Government’s debt management objectives and principles are tabled annually in Parliament through the Department of Finance Canada’s Debt Management Strategy.
Marketable bonds (Canadian currency)
54.1%Treasury bills14.8%
Other unmatured
debt4.9%
Pensions16.4%
Other future benefits9.2%
Other liabilities0.6%
Interest-Bearing Debt by Category for 2015–2016
Public Accounts of Canada, 2015–2016
1 . 14 Financial statements discussion and analysis
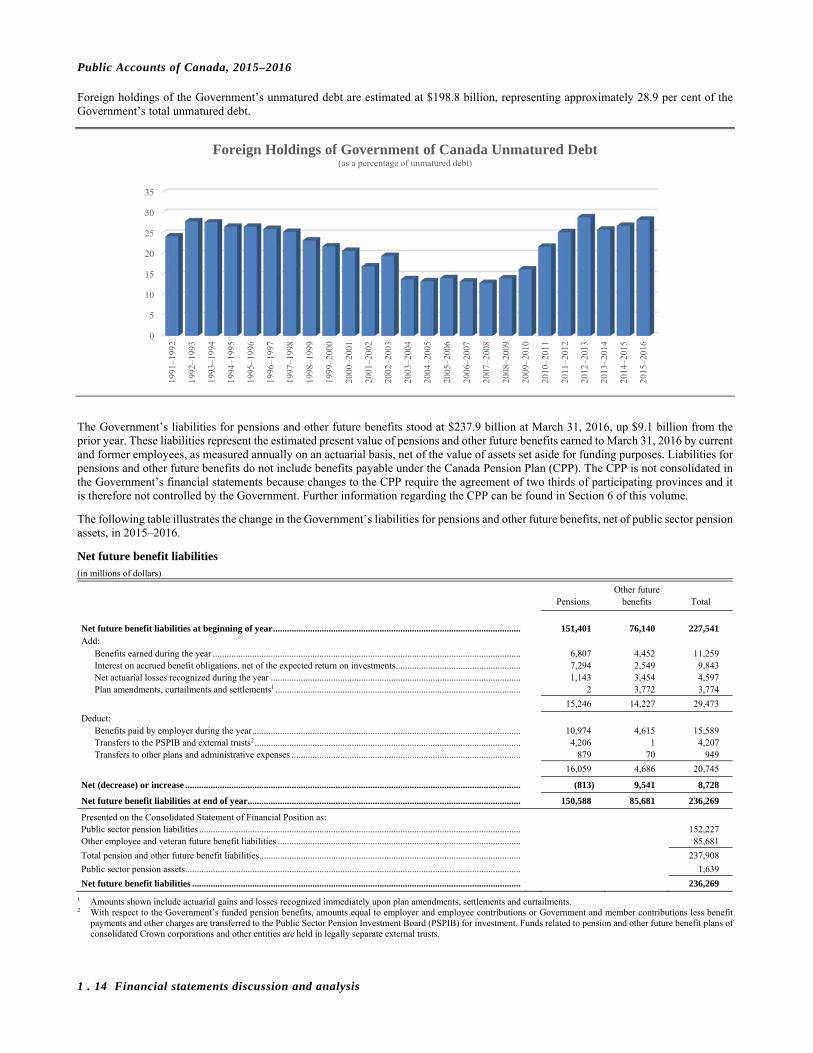
Foreign holdings of the Government’s unmatured debt are estimated at $198.8 billion, representing approximately 28.9 per cent of the Government’s total unmatured debt.
The Government’s liabilities for pensions and other future benefits stood at $237.9 billion at March 31, 2016, up $9.1 billion from the prior year. These liabilities represent the estimated present value of pensions and other future benefits earned to March 31, 2016 by current and former employees, as measured annually on an actuarial basis, net of the value of assets set aside for funding purposes. Liabilities for pensions and other future benefits do not include benefits payable under the Canada Pension Plan (CPP). The CPP is not consolidated in the Government’s financial statements because changes to the CPP require the agreement of two thirds of participating provinces and it is therefore not controlled by the Government. Further information regarding the CPP can be found in Section 6 of this volume.
The following table illustrates the change in the Government’s liabilities for pensions and other future benefits, net of public sector pension assets, in 2015–2016.
Net future benefit liabilities (in millions of dollars)
Other future Pensions benefits Total
Net future benefit liabilities at beginning of year ........................................................................................................... 151,401 76,140 227,541 Add:
Benefits earned during the year ..................................................................................................................................... 6,807 4,452 11,259 Interest on accrued benefit obligations, net of the expected return on investments ...................................................... 7,294 2,549 9,843 Net actuarial losses recognized during the year ............................................................................................................ 1,143 3,454 4,597 Plan amendments, curtailments and settlements1 .......................................................................................................... 2 3,772 3,774
15,246 14,227 29,473
Deduct: Benefits paid by employer during the year .................................................................................................................... 10,974 4,615 15,589 Transfers to the PSPIB and external trusts2 ................................................................................................................... 4,206 1 4,207 Transfers to other plans and administrative expenses ................................................................................................... 879 70 949
16,059 4,686 20,745
Net (decrease) or increase ................................................................................................................................................. (813) 9,541 8,728
Net future benefit liabilities at end of year ...................................................................................................................... 150,588 85,681 236,269
Presented on the Consolidated Statement of Financial Position as: Public sector pension liabilities ........................................................................................................................................... 152,227 Other employee and veteran future benefit liabilities ......................................................................................................... 85,681
Total pension and other future benefit liabilities ................................................................................................................. 237,908
Public sector pension assets ................................................................................................................................................. 1,639
Net future benefit liabilities .............................................................................................................................................. 236,269
1 Amounts shown include actuarial gains and losses recognized immediately upon plan amendments, settlements and curtailments. 2 With respect to the Government’s funded pension benefits, amounts equal to employer and employee contributions or Government and member contributions less benefit
payments and other charges are transferred to the Public Sector Pension Investment Board (PSPIB) for investment. Funds related to pension and other future benefit plans of consolidated Crown corporations and other entities are held in legally separate external trusts.
0
5
10
15
20
25
30
35
1991
–199
2
1992
–199
3
1993
–199
4
1994
–199
5
1995
–199
6
1996
–199
7
1997
–199
8
1998
–199
9
1999
–200
0
2000
–200
1
2001
–200
2
2002
–200
3
2003
–200
4
2004
–200
5
2005
–200
6
2006
–200
7
2007
–200
8
2008
–200
9
2009
–201
0
2010
–201
1
2011
–201
2
2012
–201
3
2013
–201
4
2014
–201
5
2015
–201
6
Foreign Holdings of Government of Canada Unmatured Debt(as a percentage of unmatured debt)

Public Accounts of Canada, 2015–2016
Financial statements discussion and analysis 1 . 15
The increase in net liabilities for pensions and other future benefits in 2015–2016 reflects the addition of $11.3 billion in future benefits earned by employees and members during the year as well as $9.8 billion in net interest charges on the liabilities. Accounting standards require that liabilities due a long time into the future be recorded at their estimated present, or discounted, value. For the Government’s funded pension benefits, which relate to post-March 2000 service that falls within Income Tax Act limits under its three main pension plans―the public service, Canadian Forces–Regular Force, and Royal Canadian Mounted Police pension plans―as well as benefits under the Canadian Forces–Reserve Force pension plan, the discount rate is based on the streamed expected rates of return on invested funds. For benefits related to pre-April 2000 service and post-March service that falls above Income Tax Act limits under these main plans, as well as benefits under several smaller plans sponsored by the Government, which are unfunded, the discount rate is based on the streamed weighted average of long-term bond rates. For the Government’s other future benefit plans, the discount rate reflects the expected long-term bond rate. For consolidated Crown corporations’ and other entities’ future benefit plans, the discount rates are based on a variety of methodologies. Interest is recorded on the accrued obligations for pensions and other future benefits each year, net of the expected return on investments associated with funded benefits, to reflect the passage of time as the liabilities are one year closer to settlement. Net interest expense is recorded as part of public debt charges while benefit expense is recorded as part of ministries expenses on the Consolidated Statement of Operations and Accumulated Deficit. Benefit and interest expenses related to consolidated Crown corporations’ and other entities’ future benefit plans are recorded as part of Crown corporations expense.
Liabilities for pensions and other future benefits increased by an additional $4.6 billion in 2015–2016 due to the amortization of actuarial gains and losses. Actuarial gains and losses represent year-over-year increases or decreases in the estimated value of pension and other future benefit obligations and the value of related assets due to changes in actuarial assumptions or actual experience different from that previously estimated. Actuarial assumptions include future inflation, interest rates, return on investments, general wage increases, workforce composition, retirement rates and mortality rates. Under Canadian public sector accounting standards, which are set independently by the Public Sector Accounting Board, actuarial gains and losses are not recognized in the liabilities immediately but instead are amortized over the expected average remaining service life of plan contributors, or for some benefits, the average remaining life expectancy of the benefit recipients, which represents periods ranging from 4 to 23 years, according to the plan in question. As of March 31, 2016, net unamortized losses amounted to $45.8 billion. These losses will be reflected over time in the liabilities and recorded as part of ministries expenses or Crown corporation expenses, as applicable.
The Government also recorded a $3.8-billion increase in liabilities for pensions and other future benefits to reflect the net impact of plan amendments, curtailments and settlements during the year. The largest of these amendments relates to improvements made to and the expansion of eligibility for certain benefits under the Government’s veterans future benefit plans.
These increases were offset in part by reductions in the liabilities for benefits paid during the year ($15.6 billion) and for net transfers to the Public Sector Pension Investment Board and funds held in external trusts for investment ($4.2 billion).
Further details on public sector pensions and other employee and veteran future benefits are contained in Section 6 of this volume.
Interest-bearing debt stood at 47.0 per cent of GDP in 2015–2016 (up from 45.6 per cent in 2014–2015). This ratio is down over 27 percentage points from its high of 74.4 per cent in 1995–1996.
30
40
50
60
70
80
1991
-199
2
1992
–199
3
1993
–199
4
1994
–199
5
1995
–199
6
1996
–199
7
1997
–199
8
1998
–199
9
1999
–200
0
2000
–200
1
2001
–200
2
2002
–200
3
2003
–200
4
2004
–200
5
2005
–200
6
2006
–200
7
2007
–200
8
2008
–200
9
2009
–201
0
2010
–201
1
2011
–201
2
2012
–201
3
2013
–201
4
2014
–201
5
2015
–201
6
Interest-Bearing Debt(as a percentage of GDP)

Public Accounts of Canada, 2015–2016
1 . 16 Financial statements discussion and analysis
The average effective interest rate on the Government’s interest-bearing debt in 2015–2016 was 2.8 per cent (down from 3.0 per cent in 2014–2015). The average effective interest rate on unmatured debt in 2015–2016 was 2.3 per cent, while the average effective interest rate on pension and other liabilities was 4.3 per cent. The average effective interest rate was higher on pension and other liabilities than on unmatured debt because the Government’s unfunded pension liabilities are primarily credited with interest at rates that are calculated as though the amounts in the plans were invested in a notional portfolio of Government of Canada 20-year bonds held to maturity, whereas unmatured debt includes both short- and long-term securities.
Accounts payable and accrued liabilities
The following chart shows accounts payable and accrued liabilities by category for 2015–2016.
0
2
4
6
8
10
12
14
1991
-199
2
1992
–199
3
1993
–199
4
1994
–199
5
1995
–199
6
1996
–199
7
1997
–199
8
1998
–199
9
1999
–200
0
2000
–200
1
2001
–200
2
2002
–200
3
2003
–200
4
2004
–200
5
2005
–200
6
2006
–200
7
2007
–200
8
2008
–200
9
2009
–201
0
2010
–201
1
2011
–201
2
2012
–201
3
2013
–201
4
2014
–201
5
2015
–201
6
Average Effective Interest Rate on Interest-Bearing Debt(in percentage)
Interest-bearing debt Unmatured debt Pension and other liabilities
Other accounts payable and accrued liabilities
36.0%
Amounts payable to taxpayers
42.0%
Deferred revenues7.8%
Environmental liabilities10.4%
Interest and matured debt3.8%
Accounts Payable and Accrued Liabilities by Category for 2015–2016
Public Accounts of Canada, 2015–2016
Financial statements discussion and analysis 1 . 17
The Government’s accounts payable and accrued liabilities consist of amounts payable to taxpayers based on assessments and estimates of refunds owing for tax assessments not completed by year end; environmental liabilities, which include estimated costs related to the remediation of contaminated sites and the future restoration of certain tangible capital assets; deferred revenue; interest due and matured debt, as well as accrued interest at year end; and other accounts payable and accrued liabilities. Other accounts payable and accrued liabilities include items such as accrued salaries and benefits, amounts payable to provinces, territories and Aboriginal governments for taxes collected and administered on their behalf in accordance with tax collection agreements, and amounts owing at year end pursuant to contractual arrangements or for work performed or goods received.
At March 31, 2016, accounts payable and accrued liabilities totalled $127.9 billion, up $4.2 billion from March 31, 2015. This increase is mainly due to growth in other accounts payable and accrued liabilities, environmental liabilities and deferred revenue, partially offset by decreases in amounts payable to taxpayers.
Other accounts payable and accrued liabilities increased by $5.2 billion in 2015–2016. Within this component, accrued salaries and benefits increased by $0.9 billion. Liabilities under provincial, territorial and Aboriginal tax agreements increased by $2.8 billion in 2015–2016 due to settlements of prior years’ tax assessments and timing differences. Accounts payable of consolidated Crown corporations increased by $1.5 billion, largely relating to growth in progress payments from foreign customers received by the Canadian Commercial Corporation.
Deferred revenue increased by $0.8 billion in 2015–2016, largely reflecting proceeds received from spectrum licence auctions during the year, partially offset by a $0.7-billion decrease in advances from foreign customers received by the Canadian Commercial Corporation.
Environmental liabilities increased by $1.0 billion in 2015–2016, primarily reflecting an increase in estimated future costs related to the remediation of contaminated sites.
Amounts payable to taxpayers decreased by $2.5 billion in 2015–2016, from $56.2 billion at March 31, 2015 to $53.7 billion at March 31, 2016.
Liabilities for interest and matured debt decreased by $0.3 billion from the prior year, reflecting lower interest rates.
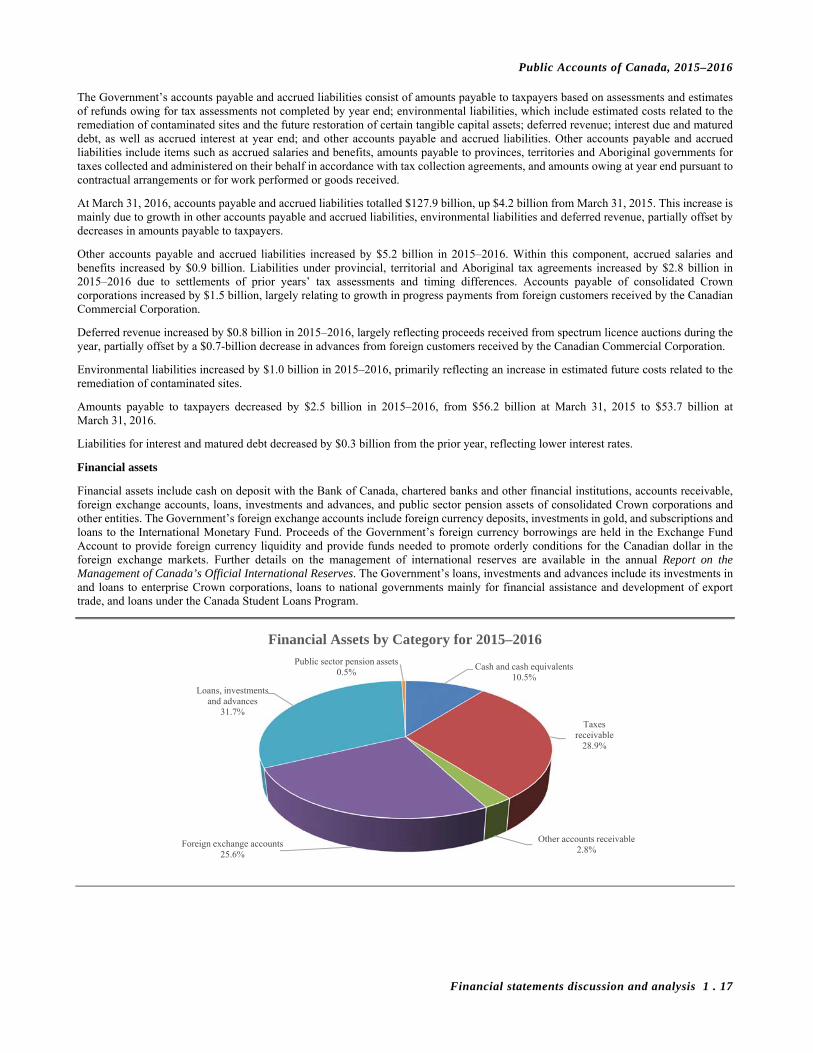
Financial assets
Financial assets include cash on deposit with the Bank of Canada, chartered banks and other financial institutions, accounts receivable, foreign exchange accounts, loans, investments and advances, and public sector pension assets of consolidated Crown corporations and other entities. The Government’s foreign exchange accounts include foreign currency deposits, investments in gold, and subscriptions and loans to the International Monetary Fund. Proceeds of the Government’s foreign currency borrowings are held in the Exchange Fund Account to provide foreign currency liquidity and provide funds needed to promote orderly conditions for the Canadian dollar in the foreign exchange markets. Further details on the management of international reserves are available in the annual Report on the Management of Canada’s Official International Reserves. The Government’s loans, investments and advances include its investments in and loans to enterprise Crown corporations, loans to national governments mainly for financial assistance and development of export trade, and loans under the Canada Student Loans Program.
Cash and cash equivalents10.5%
Taxes receivable
28.9%
Other accounts receivable2.8%
Foreign exchange accounts25.6%
Loans, investments and advances
31.7%
Public sector pension assets0.5%
Financial Assets by Category for 2015–2016
Public Accounts of Canada, 2015–2016
1 . 18 Financial statements discussion and analysis
At March 31, 2016, financial assets amounted to $365.8 billion, up $29.2 billion from March 31, 2015. The increase in financial assets reflects increases in cash and accounts receivable, foreign exchange accounts, and loans, investments and advances.
At March 31, 2016, cash and accounts receivable totalled $154.7 billion, up $18.0 billion from March 31, 2015. Within this component, cash and cash equivalents increased by $3.6 billion. Included in the March 31, 2016 balance of cash and cash equivalents is $20 billion which has been designated as a deposit held with respect to prudential liquidity management. The Government’s overall liquidity is maintained at a level sufficient to cover at least one month of net projected cash flows, including coupon payments and debt refinancing needs. Taxes receivable increased by $7.3 billion during 2015–2016 to $105.8 billion while other accounts receivable increased by $7.1 billion due mainly to collateral posted by the Government under new International Swaps and Derivatives Association agreements.
Foreign exchange accounts increased by $8.5 billion in 2015–2016, totalling $93.5 billion at March 31, 2016. The increase in foreign exchange accounts is due mainly to growth in foreign exchange reserves held in the Exchange Fund Account, primarily reflecting $4.6 billion in net additional advances to the Account during the year and $2.6 billion in foreign exchange gains. Under the Government’s prudential liquidity plan, liquid foreign exchange reserves will continue to rise sufficiently to maintain their level at or above 3 per cent of GDP.
Loans, investments and advances in enterprise Crown corporations and other government business enterprises increased by $1.7 billion in 2015–2016. Net loans and advances increased by $2.1 billion due to an increase in loans to Crown corporations under the consolidated borrowing framework. Investments in enterprise Crown corporations and other government business enterprises decreased by $0.3 billion, as the $7.3 billion in net profits recorded by these entities during 2015–2016 was more than offset by $2.7 billion in other comprehensive losses and $5.0 billion in dividends paid to the Government and other equity transactions.
Other loans, investments and advances increased by $0.5 billion in 2015–2016, and public sector pension assets increased by $0.4 billion.
Since the accumulated deficit reached its post-World War II peak of 66.8 per cent of GDP at March 31, 1996, financial assets have increased by $273.2 billion, mainly reflecting higher levels of cash and cash equivalents and accounts receivable (up $102.1 billion), an increase in the foreign exchange accounts (up $74.5 billion), and an increase in loans, investments and advances (up $94.9 billion). The increase in cash and cash equivalents and accounts receivable is largely attributable to growth in taxes receivable, broadly in line with the growth in the applicable tax bases. The increase in the foreign exchange accounts reflects a decision by the Government in the late 1990s and more recently in the 2011–2012 Debt Management Strategy to increase liquidity in these accounts. The increase in loans, investments and advances is attributable to several factors including the accumulation of net profits from enterprise Crown corporations, the Government taking over the financing of the Canada Student Loans Program from the chartered banks in 2000, and the issuance of direct loans to Crown corporations under the Government’s consolidated borrowing framework implemented in 2008.
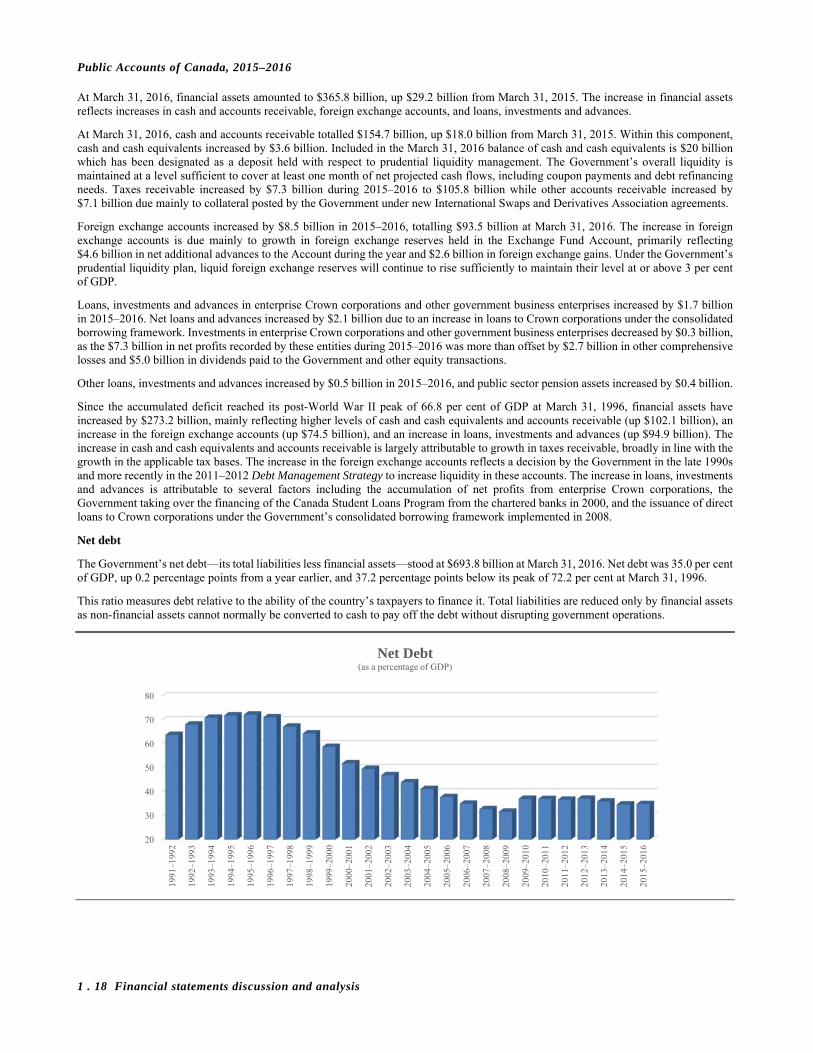
Net debt
The Government’s net debt—its total liabilities less financial assets—stood at $693.8 billion at March 31, 2016. Net debt was 35.0 per cent of GDP, up 0.2 percentage points from a year earlier, and 37.2 percentage points below its peak of 72.2 per cent at March 31, 1996.
This ratio measures debt relative to the ability of the country’s taxpayers to finance it. Total liabilities are reduced only by financial assets as non-financial assets cannot normally be converted to cash to pay off the debt without disrupting government operations.
20
30
40
50
60
70
80
1991
–199
2
1992
–199
3
1993
–199
4
1994
–199
5
1995
–199
6
1996
–199
7
1997
–199
8
1998
–199
9
1999
–200
0
2000
–200
1
2001
–200
2
2002
–200
3
2003
–200
4
2004
–200
5
2005
–200
6
2006
–200
7
2007
–200
8
2008
–200
9
2009
–201
0
2010
–201
1
2011
–201
2
2012
–201
3
2013
–201
4
2014
–201
5
2015
–201
6Net Debt
(as a percentage of GDP)

Public Accounts of Canada, 2015–2016
Financial statements discussion and analysis 1 . 19
Canada has the lowest total government net debt burden among G7 countries
* Weighted by GDP converted to U.S. dollars at average market exchange rates. Source: IMF, Fiscal Monitor (April 2016).
Canada’s total government net debt-to-GDP ratio stood at 26.7 per cent in 2015, according to the IMF. This is the lowest level among G7 countries, which the IMF estimates will record an average net debt of 83.0 per cent of GDP in that same year.
International comparisons of net debt are made on a total government, National Accounts basis, which for Canada includes the net debt of federal, provincial/territorial and local governments, as well as the net assets held in the Canada Pension Plan and Quebec Pension Plan.
0
20
40
60
80
100
120
140
Canada Germany United States UnitedKingdom
France Italy Japan G7 average*
G7 Total Government Net Debt, 2015(as a percentage of GDP)
Public Accounts of Canada, 2015–2016
1 . 20 Financial statements discussion and analysis
Non-financial assets
Non-financial assets include the net book value of the Government’s tangible capital assets, which include land, buildings, works and infrastructure such as roads and bridges, machinery and equipment, ships, aircraft and other vehicles. Non-financial assets also include inventories and prepaid expenses and other non-financial assets.
At March 31, 2016, non-financial assets stood at $77.8 billion, up $3.1 billion from a year earlier. Of this growth, $2.5 billion relates to an increase in tangible capital assets while $0.6 billion relates to an increase in other non-financial assets. This latter increase is due mainly to growth in progress payments, partially offset by decrease in advances to Canadian exporters by the Canadian Commercial Corporation.
At March 31, 2016, roughly 60 per cent of the original cost of the Government’s depreciable tangible capital assets had been amortized, unchanged from a year earlier. Depreciable tangible capital assets exclude land, and assets under construction, which are not yet available for use.
Prepaid expenses6.1%
Inventories9.3%
Land2.1%
Buildings19.2%
Works and infrastructure8.3%Machinery and equipment
12.7%
Vehicles21.0%
Assets under construction16.2%
Other capital assets5.1%
Non-Financial Assets by Category for 2015–2016
0
5
10
15
20
25
30
35
40
45
Land Buildings Works andinfrastructure
Machinery andequipment
Vehicles Leaseholdimprovements
Assets underconstruction
Assets undercapital leases
Tangible Capital Asset Cost and Accumulated Amortization(in billions of dollars)
Cost Accumulated Amortization
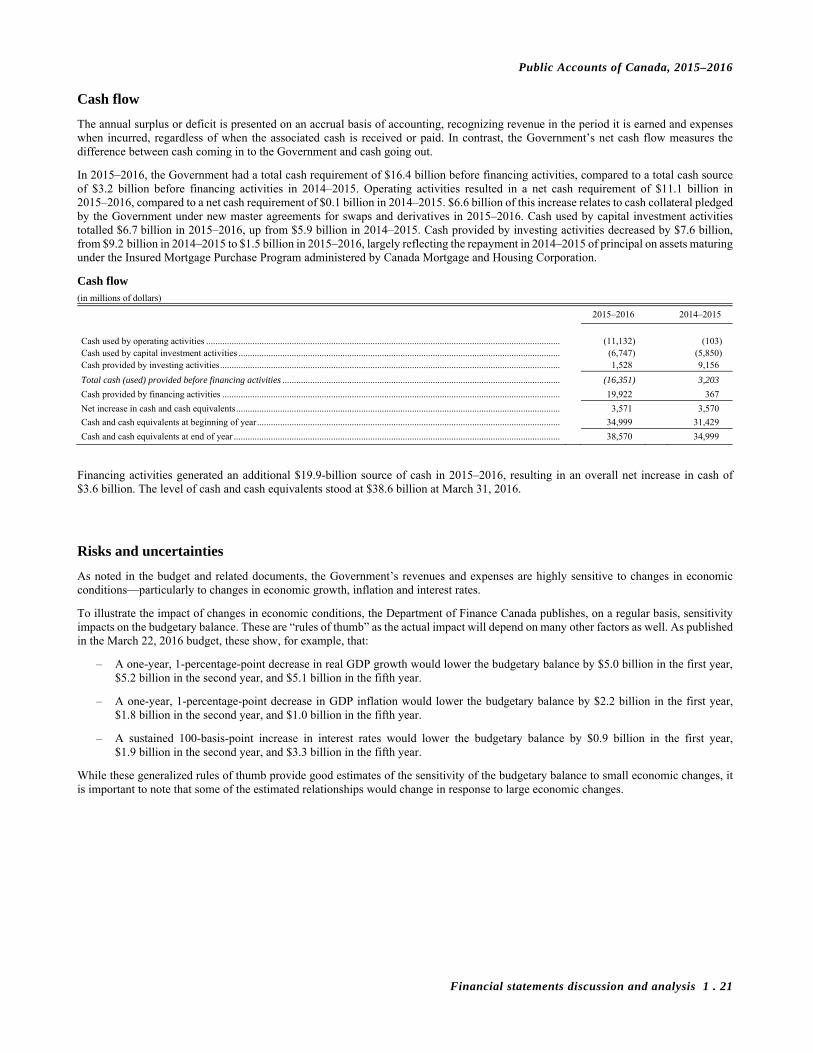
Public Accounts of Canada, 2015–2016
Financial statements discussion and analysis 1 . 21
Cash flow
The annual surplus or deficit is presented on an accrual basis of accounting, recognizing revenue in the period it is earned and expenses when incurred, regardless of when the associated cash is received or paid. In contrast, the Government’s net cash flow measures the difference between cash coming in to the Government and cash going out.
In 2015–2016, the Government had a total cash requirement of $16.4 billion before financing activities, compared to a total cash source of $3.2 billion before financing activities in 2014–2015. Operating activities resulted in a net cash requirement of $11.1 billion in 2015–2016, compared to a net cash requirement of $0.1 billion in 2014–2015. $6.6 billion of this increase relates to cash collateral pledged by the Government under new master agreements for swaps and derivatives in 2015–2016. Cash used by capital investment activities totalled $6.7 billion in 2015–2016, up from $5.9 billion in 2014–2015. Cash provided by investing activities decreased by $7.6 billion, from $9.2 billion in 2014–2015 to $1.5 billion in 2015–2016, largely reflecting the repayment in 2014–2015 of principal on assets maturing under the Insured Mortgage Purchase Program administered by Canada Mortgage and Housing Corporation.
Cash flow (in millions of dollars)
2015–2016 2014–2015
Cash used by operating activities ......................................................................................................................................................... (11,132) (103) Cash used by capital investment activities ........................................................................................................................................... (6,747) (5,850) Cash provided by investing activities ................................................................................................................................................... 1,528 9,156
Total cash (used) provided before financing activities ........................................................................................................................ (16,351) 3,203
Cash provided by financing activities .................................................................................................................................................. 19,922 367
Net increase in cash and cash equivalents ............................................................................................................................................ 3,571 3,570
Cash and cash equivalents at beginning of year ................................................................................................................................... 34,999 31,429
Cash and cash equivalents at end of year ............................................................................................................................................. 38,570 34,999
Financing activities generated an additional $19.9-billion source of cash in 2015–2016, resulting in an overall net increase in cash of $3.6 billion. The level of cash and cash equivalents stood at $38.6 billion at March 31, 2016.
Risks and uncertainties
As noted in the budget and related documents, the Government’s revenues and expenses are highly sensitive to changes in economic conditions—particularly to changes in economic growth, inflation and interest rates.
To illustrate the impact of changes in economic conditions, the Department of Finance Canada publishes, on a regular basis, sensitivity impacts on the budgetary balance. These are “rules of thumb” as the actual impact will depend on many other factors as well. As published in the March 22, 2016 budget, these show, for example, that:
– A one-year, 1-percentage-point decrease in real GDP growth would lower the budgetary balance by $5.0 billion in the first year, $5.2 billion in the second year, and $5.1 billion in the fifth year.
– A one-year, 1-percentage-point decrease in GDP inflation would lower the budgetary balance by $2.2 billion in the first year, $1.8 billion in the second year, and $1.0 billion in the fifth year.
– A sustained 100-basis-point increase in interest rates would lower the budgetary balance by $0.9 billion in the first year, $1.9 billion in the second year, and $3.3 billion in the fifth year.
While these generalized rules of thumb provide good estimates of the sensitivity of the budgetary balance to small economic changes, it is important to note that some of the estimated relationships would change in response to large economic changes.
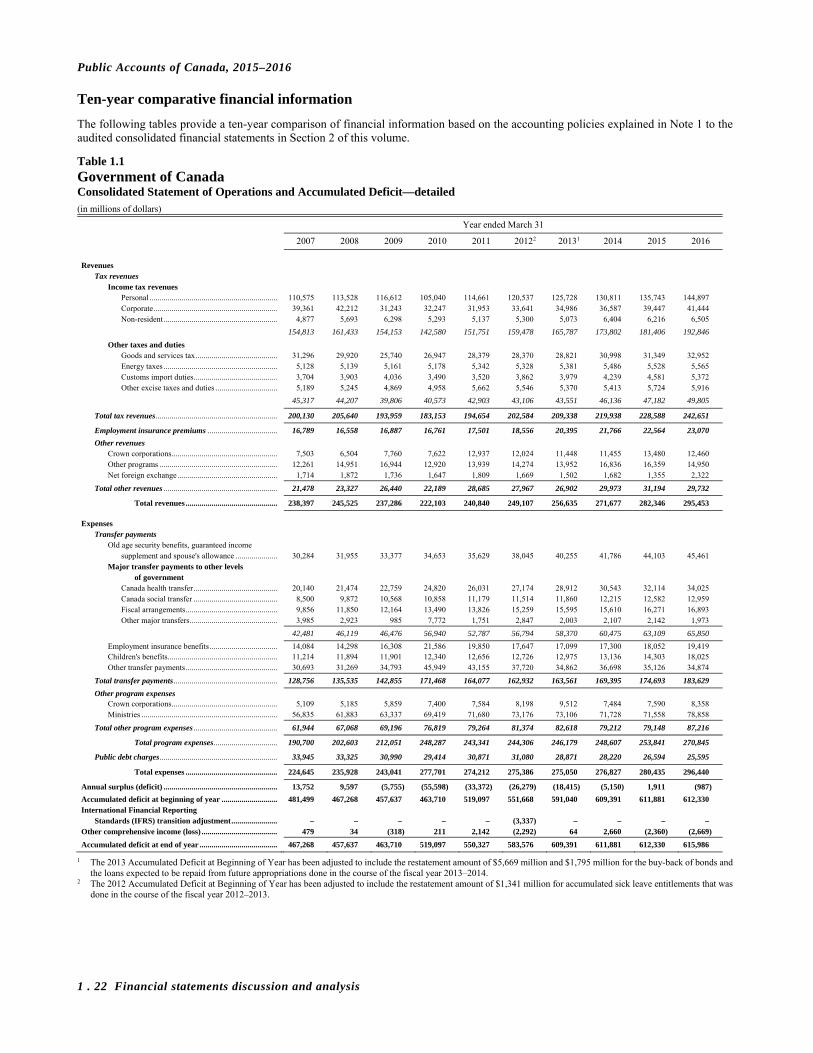
Public Accounts of Canada, 2015–2016
1 . 22 Financial statements discussion and analysis
Ten-year comparative financial information
The following tables provide a ten-year comparison of financial information based on the accounting policies explained in Note 1 to the audited consolidated financial statements in Section 2 of this volume.
Table 1.1 Government of Canada Consolidated Statement of Operations and Accumulated Deficit—detailed (in millions of dollars)
Year ended March 31
2007 2008 2009 2010 2011 20122 20131 2014 2015 2016
Revenues
Tax revenues Income tax revenues
Personal ................................................................ 110,575 113,528 116,612 105,040 114,661 120,537 125,728 130,811 135,743 144,897 Corporate .............................................................. 39,361 42,212 31,243 32,247 31,953 33,641 34,986 36,587 39,447 41,444 Non-resident ......................................................... 4,877 5,693 6,298 5,293 5,137 5,300 5,073 6,404 6,216 6,505
154,813 161,433 154,153 142,580 151,751 159,478 165,787 173,802 181,406 192,846
Other taxes and duties Goods and services tax ......................................... 31,296 29,920 25,740 26,947 28,379 28,370 28,821 30,998 31,349 32,952 Energy taxes ......................................................... 5,128 5,139 5,161 5,178 5,342 5,328 5,381 5,486 5,528 5,565 Customs import duties .......................................... 3,704 3,903 4,036 3,490 3,520 3,862 3,979 4,239 4,581 5,372 Other excise taxes and duties ............................... 5,189 5,245 4,869 4,958 5,662 5,546 5,370 5,413 5,724 5,916
45,317 44,207 39,806 40,573 42,903 43,106 43,551 46,136 47,182 49,805
Total tax revenues ............................................................. 200,130 205,640 193,959 183,153 194,654 202,584 209,338 219,938 228,588 242,651
Employment insurance premiums ................................... 16,789 16,558 16,887 16,761 17,501 18,556 20,395 21,766 22,564 23,070
Other revenues Crown corporations ..................................................... 7,503 6,504 7,760 7,622 12,937 12,024 11,448 11,455 13,480 12,460 Other programs ........................................................... 12,261 14,951 16,944 12,920 13,939 14,274 13,952 16,836 16,359 14,950 Net foreign exchange .................................................. 1,714 1,872 1,736 1,647 1,809 1,669 1,502 1,682 1,355 2,322
Total other revenues ......................................................... 21,478 23,327 26,440 22,189 28,685 27,967 26,902 29,973 31,194 29,732
Total revenues .............................................. 238,397 245,525 237,286 222,103 240,840 249,107 256,635 271,677 282,346 295,453
Expenses
Transfer payments Old age security benefits, guaranteed income
supplement and spouse's allowance ..................... 30,284 31,955 33,377 34,653 35,629 38,045 40,255 41,786 44,103 45,461 Major transfer payments to other levels
of government Canada health transfer .......................................... 20,140 21,474 22,759 24,820 26,031 27,174 28,912 30,543 32,114 34,025 Canada social transfer .......................................... 8,500 9,872 10,568 10,858 11,179 11,514 11,860 12,215 12,582 12,959 Fiscal arrangements .............................................. 9,856 11,850 12,164 13,490 13,826 15,259 15,595 15,610 16,271 16,893 Other major transfers ............................................ 3,985 2,923 985 7,772 1,751 2,847 2,003 2,107 2,142 1,973
42,481 46,119 46,476 56,940 52,787 56,794 58,370 60,475 63,109 65,850
Employment insurance benefits .................................. 14,084 14,298 16,308 21,586 19,850 17,647 17,099 17,300 18,052 19,419 Children's benefits ....................................................... 11,214 11,894 11,901 12,340 12,656 12,726 12,975 13,136 14,303 18,025 Other transfer payments .............................................. 30,693 31,269 34,793 45,949 43,155 37,720 34,862 36,698 35,126 34,874
Total transfer payments .................................................... 128,756 135,535 142,855 171,468 164,077 162,932 163,561 169,395 174,693 183,629
Other program expenses Crown corporations ..................................................... 5,109 5,185 5,859 7,400 7,584 8,198 9,512 7,484 7,590 8,358 Ministries .................................................................... 56,835 61,883 63,337 69,419 71,680 73,176 73,106 71,728 71,558 78,858
Total other program expenses .......................................... 61,944 67,068 69,196 76,819 79,264 81,374 82,618 79,212 79,148 87,216
Total program expenses ................................ 190,700 202,603 212,051 248,287 243,341 244,306 246,179 248,607 253,841 270,845
Public debt charges ........................................................... 33,945 33,325 30,990 29,414 30,871 31,080 28,871 28,220 26,594 25,595
Total expenses .............................................. 224,645 235,928 243,041 277,701 274,212 275,386 275,050 276,827 280,435 296,440
Annual surplus (deficit) ......................................................... 13,752 9,597 (5,755) (55,598) (33,372) (26,279) (18,415) (5,150) 1,911 (987)
Accumulated deficit at beginning of year ............................ 481,499 467,268 457,637 463,710 519,097 551,668 591,040 609,391 611,881 612,330 International Financial Reporting
Standards (IFRS) transition adjustment ....................... – – – – – (3,337) – – – – Other comprehensive income (loss) ...................................... 479 34 (318) 211 2,142 (2,292) 64 2,660 (2,360) (2,669)
Accumulated deficit at end of year ....................................... 467,268 457,637 463,710 519,097 550,327 583,576 609,391 611,881 612,330 615,986
1 The 2013 Accumulated Deficit at Beginning of Year has been adjusted to include the restatement amount of $5,669 million and $1,795 million for the buy-back of bonds and the loans expected to be repaid from future appropriations done in the course of the fiscal year 2013–2014.
2 The 2012 Accumulated Deficit at Beginning of Year has been adjusted to include the restatement amount of $1,341 million for accumulated sick leave entitlements that was done in the course of the fiscal year 2012–2013.
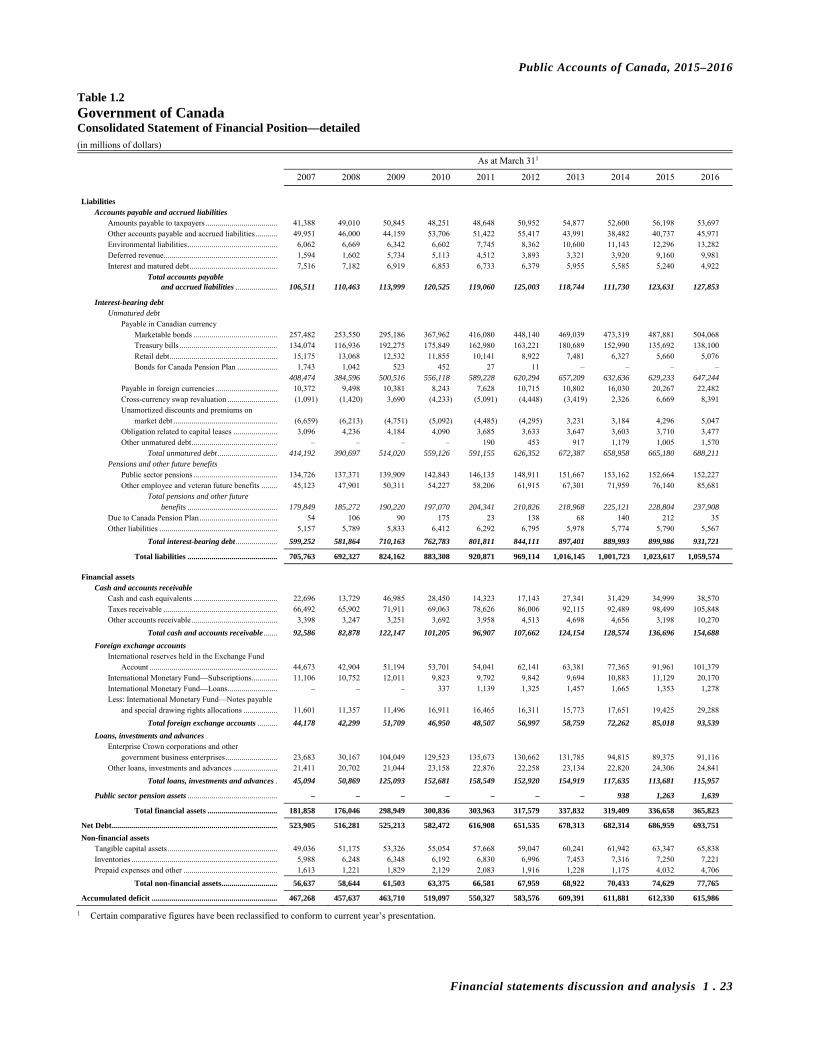
Public Accounts of Canada, 2015–2016
Financial statements discussion and analysis 1 . 23
Table 1.2 Government of Canada Consolidated Statement of Financial Position—detailed (in millions of dollars)
As at March 311
2007 2008 2009 2010 2011 2012 2013 2014 2015 2016
Liabilities
Accounts payable and accrued liabilities Amounts payable to taxpayers .................................... 41,388 49,010 50,845 48,251 48,648 50,952 54,877 52,600 56,198 53,697 Other accounts payable and accrued liabilities ........... 49,951 46,000 44,159 53,706 51,422 55,417 43,991 38,482 40,737 45,971 Environmental liabilities ............................................. 6,062 6,669 6,342 6,602 7,745 8,362 10,600 11,143 12,296 13,282 Deferred revenue ......................................................... 1,594 1,602 5,734 5,113 4,512 3,893 3,321 3,920 9,160 9,981 Interest and matured debt ............................................ 7,516 7,182 6,919 6,853 6,733 6,379 5,955 5,585 5,240 4,922
Total accounts payable and accrued liabilities ..................... 106,511 110,463 113,999 120,525 119,060 125,003 118,744 111,730 123,631 127,853
Interest-bearing debt Unmatured debt
Payable in Canadian currency Marketable bonds .......................................... 257,482 253,550 295,186 367,962 416,080 448,140 469,039 473,319 487,881 504,068 Treasury bills ................................................. 134,074 116,936 192,275 175,849 162,980 163,221 180,689 152,990 135,692 138,100 Retail debt ...................................................... 15,175 13,068 12,532 11,855 10,141 8,922 7,481 6,327 5,660 5,076 Bonds for Canada Pension Plan .................... 1,743 1,042 523 452 27 11 – – – –
408,474 384,596 500,516 556,118 589,228 620,294 657,209 632,636 629,233 647,244 Payable in foreign currencies ............................... 10,372 9,498 10,381 8,243 7,628 10,715 10,802 16,030 20,267 22,482 Cross-currency swap revaluation ......................... (1,091) (1,420) 3,690 (4,233) (5,091) (4,448) (3,419) 2,326 6,669 8,391 Unamortized discounts and premiums on
market debt .................................................... (6,659) (6,213) (4,751) (5,092) (4,485) (4,295) 3,231 3,184 4,296 5,047 Obligation related to capital leases ...................... 3,096 4,236 4,184 4,090 3,685 3,633 3,647 3,603 3,710 3,477 Other unmatured debt ........................................... – – – – 190 453 917 1,179 1,005 1,570
Total unmatured debt .............................. 414,192 390,697 514,020 559,126 591,155 626,352 672,387 658,958 665,180 688,211 Pensions and other future benefits
Public sector pensions .......................................... 134,726 137,371 139,909 142,843 146,135 148,911 151,667 153,162 152,664 152,227 Other employee and veteran future benefits ........ 45,123 47,901 50,311 54,227 58,206 61,915 67,301 71,959 76,140 85,681
Total pensions and other future benefits ............................................. 179,849 185,272 190,220 197,070 204,341 210,826 218,968 225,121 228,804 237,908
Due to Canada Pension Plan ....................................... 54 106 90 175 23 138 68 140 212 35 Other liabilities ........................................................... 5,157 5,789 5,833 6,412 6,292 6,795 5,978 5,774 5,790 5,567
Total interest-bearing debt ..................... 599,252 581,864 710,163 762,783 801,811 844,111 897,401 889,993 899,986 931,721
Total liabilities ............................................. 705,763 692,327 824,162 883,308 920,871 969,114 1,016,145 1,001,723 1,023,617 1,059,574
Financial assets
Cash and accounts receivable Cash and cash equivalents .......................................... 22,696 13,729 46,985 28,450 14,323 17,143 27,341 31,429 34,999 38,570 Taxes receivable ......................................................... 66,492 65,902 71,911 69,063 78,626 86,006 92,115 92,489 98,499 105,848 Other accounts receivable ........................................... 3,398 3,247 3,251 3,692 3,958 4,513 4,698 4,656 3,198 10,270
Total cash and accounts receivable ....... 92,586 82,878 122,147 101,205 96,907 107,662 124,154 128,574 136,696 154,688
Foreign exchange accounts International reserves held in the Exchange Fund
Account ................................................................ 44,673 42,904 51,194 53,701 54,041 62,141 63,381 77,365 91,961 101,379 International Monetary Fund—Subscriptions............. 11,106 10,752 12,011 9,823 9,792 9,842 9,694 10,883 11,129 20,170 International Monetary Fund—Loans......................... – – – 337 1,139 1,325 1,457 1,665 1,353 1,278 Less: International Monetary Fund—Notes payable
and special drawing rights allocations ................. 11,601 11,357 11,496 16,911 16,465 16,311 15,773 17,651 19,425 29,288
Total foreign exchange accounts .......... 44,178 42,299 51,709 46,950 48,507 56,997 58,759 72,262 85,018 93,539
Loans, investments and advances Enterprise Crown corporations and other
government business enterprises .......................... 23,683 30,167 104,049 129,523 135,673 130,662 131,785 94,815 89,375 91,116 Other loans, investments and advances ...................... 21,411 20,702 21,044 23,158 22,876 22,258 23,134 22,820 24,306 24,841
Total loans, investments and advances . 45,094 50,869 125,093 152,681 158,549 152,920 154,919 117,635 113,681 115,957
Public sector pension assets ............................................. – – – – – – – 938 1,263 1,639
Total financial assets ................................... 181,858 176,046 298,949 300,836 303,963 317,579 337,832 319,409 336,658 365,823
Net Debt ................................................................................... 523,905 516,281 525,213 582,472 616,908 651,535 678,313 682,314 686,959 693,751
Non-financial assets Tangible capital assets ....................................................... 49,036 51,175 53,326 55,054 57,668 59,047 60,241 61,942 63,347 65,838 Inventories ......................................................................... 5,988 6,248 6,348 6,192 6,830 6,996 7,453 7,316 7,250 7,221 Prepaid expenses and other ............................................... 1,613 1,221 1,829 2,129 2,083 1,916 1,228 1,175 4,032 4,706
Total non-financial assets ............................ 56,637 58,644 61,503 63,375 66,581 67,959 68,922 70,433 74,629 77,765
Accumulated deficit ............................................................... 467,268 457,637 463,710 519,097 550,327 583,576 609,391 611,881 612,330 615,986
1 Certain comparative figures have been reclassified to conform to current year’s presentation.
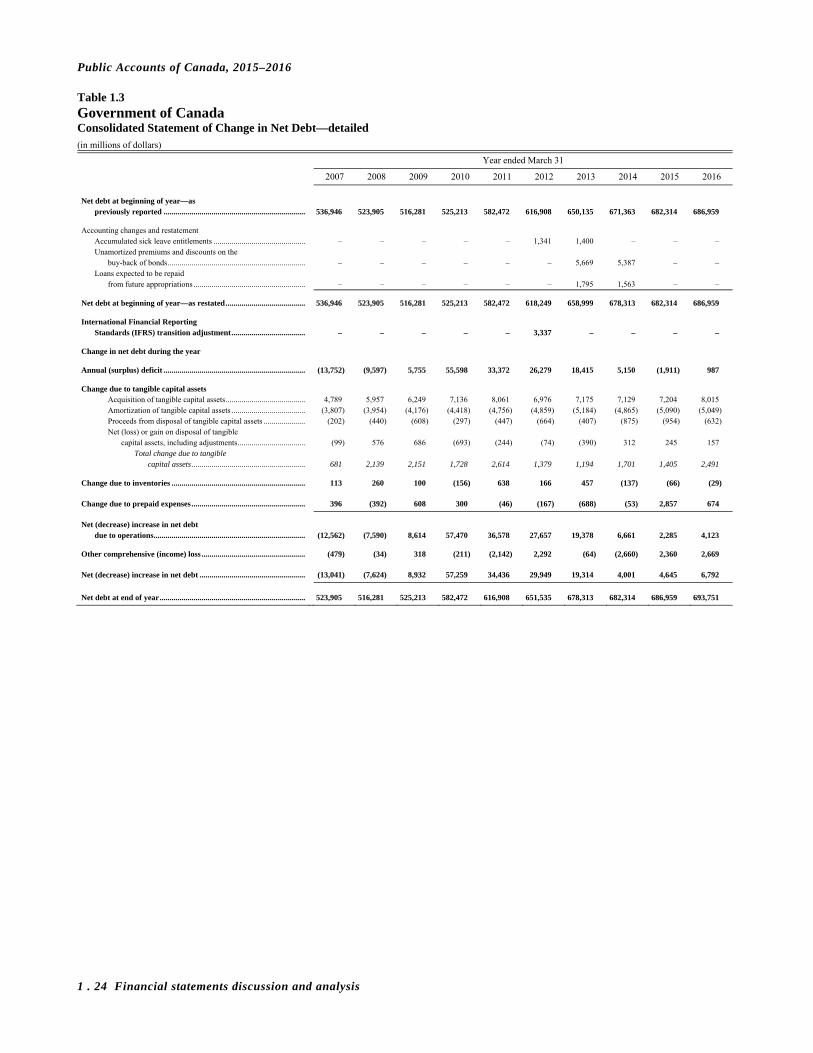
Public Accounts of Canada, 2015–2016
1 . 24 Financial statements discussion and analysis
Table 1.3 Government of Canada Consolidated Statement of Change in Net Debt—detailed (in millions of dollars)
Year ended March 31
2007 2008 2009 2010 2011 2012 2013 2014 2015 2016
Net debt at beginning of year—as
previously reported ....................................................................... 536,946 523,905 516,281 525,213 582,472 616,908 650,135 671,363 682,314 686,959 Accounting changes and restatement
Accumulated sick leave entitlements .............................................. – – – – – 1,341 1,400 – – – Unamortized premiums and discounts on the
buy-back of bonds ..................................................................... – – – – – – 5,669 5,387 – – Loans expected to be repaid
from future appropriations ........................................................ – – – – – – 1,795 1,563 – –
Net debt at beginning of year—as restated ........................................ 536,946 523,905 516,281 525,213 582,472 618,249 658,999 678,313 682,314 686,959
International Financial Reporting Standards (IFRS) transition adjustment ..................................... – – – – – 3,337 – – – –
Change in net debt during the year Annual (surplus) deficit ....................................................................... (13,752) (9,597) 5,755 55,598 33,372 26,279 18,415 5,150 (1,911) 987 Change due to tangible capital assets
Acquisition of tangible capital assets ........................................ 4,789 5,957 6,249 7,136 8,061 6,976 7,175 7,129 7,204 8,015 Amortization of tangible capital assets ..................................... (3,807) (3,954) (4,176) (4,418) (4,756) (4,859) (5,184) (4,865) (5,090) (5,049) Proceeds from disposal of tangible capital assets ..................... (202) (440) (608) (297) (447) (664) (407) (875) (954) (632) Net (loss) or gain on disposal of tangible
capital assets, including adjustments .................................. (99) 576 686 (693) (244) (74) (390) 312 245 157 Total change due to tangible
capital assets ......................................................... 681 2,139 2,151 1,728 2,614 1,379 1,194 1,701 1,405 2,491 Change due to inventories ................................................................... 113 260 100 (156) 638 166 457 (137) (66) (29) Change due to prepaid expenses ......................................................... 396 (392) 608 300 (46) (167) (688) (53) 2,857 674
Net (decrease) increase in net debt
due to operations ............................................................................ (12,562) (7,590) 8,614 57,470 36,578 27,657 19,378 6,661 2,285 4,123 Other comprehensive (income) loss .................................................... (479) (34) 318 (211) (2,142) 2,292 (64) (2,660) 2,360 2,669 Net (decrease) increase in net debt ..................................................... (13,041) (7,624) 8,932 57,259 34,436 29,949 19,314 4,001 4,645 6,792
Net debt at end of year ......................................................................... 523,905 516,281 525,213 582,472 616,908 651,535 678,313 682,314 686,959 693,751

Public Accounts of Canada, 2015–2016
Financial statements discussion and analysis 1 . 25
Table 1.4 Government of Canada Consolidated Statement of Cash Flow—detailed (in millions of dollars)
Year ended March 31
2007 2008 2009 2010 2011 2012 2013 2014 2015 2016
Operating activities Annual surplus (deficit) ....................................................................... 13,752 9,597 (5,755) (55,598) (33,372) (26,279) (18,415) (5,150) 1,911 (987)
Non-cash items Share of annual profit in enterprise Crown
corporations and other government business enterprises ..................................................... (5,336) (4,256) (4,773) (2,306) (6,992) (5,350) (4,995) (5,945) (8,365) (7,316)
Amortization of tangible capital assets .............................. 3,807 3,954 4,176 4,418 4,756 4,859 5,184 4,865 5,090 5,049 Net loss (gain) on disposal of tangible capital
assets, including adjustments ....................................... 99 (576) (686) 693 244 74 390 (312) (245) (157) Cross-currency swap revaluation ....................................... 1,668 (329) 5,110 (7,923) (858) 643 1,029 5,745 4,343 1,722
Change in taxes receivable........................................................ (7,379) 590 (6,009) 2,848 (9,563) (7,380) (6,109) (374) (6,010) (7,349) Change in pensions and other future benefits ........................... 5,418 5,423 4,948 6,850 7,271 5,144 8,142 5,215 3,358 8,728 Change in foreign exchange accounts....................................... (3,351) 1,879 (9,410) 4,759 (1,557) (8,490) (1,762) (13,503) (12,756) (8,521) Change in accounts payable and accrued liabilities .................. 5,079 3,952 3,536 6,526 (1,465) 5,943 (6,259) (7,014) 11,901 4,222 Change in cash collateral pledged to counterparties ................. – – – – – – – – – (6,557) Net change in other accounts .................................................... (1,667) 1,797 2,752 2,281 (129) 1,844 1,175 1,953 670 34
Cash provided (used) by operating activities ...................................................................... 12,090 22,031 (6,111) (37,452) (41,665) (28,992) (21,620) (14,520) (103) (11,132)
Capital investment activities
Acquisition of tangible capital assets .............................................. (4,789) (5,957) (6,249) (7,136) (8,061) (6,976) (7,175) (7,129) (6,804) (7,379) Proceeds from disposal of tangible capital assets ............................ 202 440 608 297 447 664 407 875 954 632
Cash used by capital investment activities ...................................................................... (4,587) (5,517) (5,641) (6,839) (7,614) (6,312) (6,768) (6,254) (5,850) (6,747)
Investing activities
Enterprise Crown corporations and other government business enterprises
Equity transactions .................................................................... 2,602 2,436 1,495 (3,226) 2,818 2,684 1,445 5,165 3,514 4,975 Issuance of loans and advances................................................. (3,713) (5,052) (132,057) (119,755) (76,579) (63,389) (65,183) (70,328) (79,905) (54,542) Repayment of loans and advances ............................................ 3,894 435 60,688 99,921 76,677 65,286 66,156 110,259 88,168 52,699
Issuance of other loans, investments and advances ......................... (16,969) (6,571) (6,910) (21,174) (5,858) (7,679) (5,533) (5,525) (8,124) (7,749) Repayment of other loans, investments and advances .................... 16,475 6,883 5,041 16,620 5,814 6,858 4,221 4,418 5,503 6,145
Cash provided (used) by investing activities ...................................................................... 2,289 (1,869) (71,743) (27,614) 2,872 3,760 1,106 43,989 9,156 1,528
Total cash generated (used) before financing activities ......................................................................... 9,792 14,645 (83,495) (71,905) (46,407) (31,544) (27,282) 23,215 3,203 (16,351)
Financing activities Issuance of Canadian currency borrowings ..................................... 369,354 343,755 531,668 554,892 553,464 567,707 579,456 512,009 468,021 452,850 Repayment of Canadian currency borrowings ................................ (373,886) (366,493) (415,801) (499,383) (520,569) (536,430) (542,063) (536,364) (471,891) (435,143) Issuance of foreign currency borrowings ........................................ 11,586 11,099 24,500 22,212 8,195 12,743 7,782 12,011 16,961 26,817 Repayment of foreign currency borrowings .................................... (15,299) (11,973) (23,616) (24,351) (8,810) (9,656) (7,695) (6,783) (12,724) (24,602)
Cash (used) provided by financing activities ...................................................................... (8,245) (23,612) 116,751 53,370 32,280 34,364 37,480 (19,127) 367 19,922
Net increase (decrease) in cash and cash equivalents ....................... 1,547 (8,967) 33,256 (18,535) (14,127) 2,820 10,198 4,088 3,570 3,571
Cash and cash equivalents at beginning of year ................................ 21,149 22,696 13,729 46,985 28,450 14,323 17,143 27,341 31,429 34,999
Cash and cash equivalents at end of year .......................................... 22,696 13,729 46,985 28,450 14,323 17,143 27,341 31,429 34,999 38,570

Public Accounts of Canada, 2015–2016
1 . 26 Financial statements discussion and analysis
Table 1.5 Government of Canada Consolidated Statement of Non-Budgetary Transactions and of Non-Financial Assets—detailed (in millions of dollars)
Year ended March 31
2007 2008 2009 2010 2011 2012 2013 2014 2015 2016
Loans, investments and advances
Enterprise Crown corporations and other government business enterprises
Loans and advances Canada Mortgage and Housing Corporation ...................... 148 258 (57,470) (10,399) 2,693 2,974 3,472 41,951 10,465 177 Business Development Bank of Canada ............................ – (1,000) (6,284) (4,961) (978) 662 (653) (1,106) (1,356) (1,266) Farm Credit Canada ........................................................... – (3,840) (7,610) (4,481) (1,627) (1,768) (1,848) (855) (662) (747) Other ................................................................................... 33 (35) (5) 7 10 29 2 (59) (185) (7)
181 (4,617) (71,369) (19,834) 98 1,897 973 39,931 8,262 (1,843) Investments
Share of annual profit ......................................................... (5,336) (4,256) (4,773) (2,306) (6,992) (5,350) (4,995) (5,945) (8,365) (7,316) Other comprehensive (income) loss ................................... (479) (34) 318 (211) (2,142) 2,292 (64) (2,660) 2,360 2,669 Dividends ........................................................................... 2,604 2,436 2,095 1,391 2,818 2,028 1,445 5,215 2,341 4,002 Capital ................................................................................ (3) – (600) (4,617) – 656 – (50) 1,030 973 Transition adjustment and other ......................................... – – – – – 3,337 – – 143 –
(3,214) (1,854) (2,960) (5,743) (6,316) 2,963 (3,614) (3,440) (2,491) 328
Total .......................................................................................... (3,033) (6,471) (74,329) (25,577) (6,218) 4,860 (2,641) 36,491 5,771 (1,515) Less:
Loans expected to be repaid from future appropriations .............................................................. 66 32 (473) (103) (64) (119) (1,519) (480) 353 221
Unamortized discounts and premiums ............................... – (19) 26 – (4) (32) – 1 (22) 5
Total .......................................................................................... (3,099) (6,484) (73,882) (25,474) (6,150) 5,011 (1,122) 36,970 5,440 (1,741) Other loans, investments and advances
Portfolio investments ................................................................ – – 6 2 – 12 5 – 10 5 National governments, including developing
countries ............................................................................. 80 143 (182) 235 69 40 18 (7) (606) 22 International organizations ....................................................... (491) (321) (905) (454) (826) (704) (885) (900) (1,039) (972) Provincial and territorial governments ..................................... 285 899 217 590 257 (849) 803 849 765 693 Other loans, investments and advances .................................... (367) (410) (1,005) (4,926) 456 680 (1,254) (1,049) (1,751) (1,352)
Total .......................................................................................... (493) 311 (1,869) (4,553) (44) (821) (1,313) (1,107) (2,621) (1,604) Less: allowance for valuation ................................................... (387) (398) (1,527) (2,440) (326) (1,439) (436) (1,421) (1,135) (1,069)
Total .......................................................................................... (106) 709 (342) (2,113) 282 618 (877) 314 (1,486) (535)
Total loans, investments and advances .................... (3,205) (5,775) (74,224) (27,587) (5,868) 5,629 (1,999) 37,284 3,954 (2,276)
Pensions and other future benefits
Public sector pensions ..................................................................... 3,664 2,645 2,538 2,934 3,292 2,776 2,757 557 (823) (813) Other employee and veteran future benefits .................................... 1,754 2,778 2,410 3,916 3,979 3,707 5,386 4,658 4,181 9,541
Total pensions and other future
benefits ................................................................. 5,418 5,423 4,948 6,850 7,271 6,483 8,143 5,215 3,358 8,728
Other liabilities
Due to Canada Pension Plan ............................................................ (97) 52 (16) 85 (152) 115 (70) 72 72 (177) Other liabilities ................................................................................ (185) 632 44 579 (120) 503 (817) (204) 16 (223)
Total other liabilities ................................................. (282) 684 28 664 (272) 618 (887) (132) 88 (400)
Non-financial assets
Tangible capital assets ..................................................................... (681) (2,139) (2,152) (1,728) (2,614) (1,379) (1,194) (1,701) (1,405) (2,491) Inventories ....................................................................................... (113) (260) (100) 156 (638) (166) (458) 137 66 29 Prepaid expenses and other ............................................................. (396) 392 (608) (300) 46 167 688 53 (2,857) (674)
Total non-financial assets .......................................... (1,190) (2,007) (2,860) (1,872) (3,206) (1,378) (964) (1,511) (4,196) (3,136)
Other transactions
Taxes receivable .............................................................................. (7,379) 590 (6,009) 2,848 (9,563) (7,380) (6,109) (374) (6,010) (7,349) Other accounts receivable ................................................................ (817) 151 (3) (441) (266) (555) (185) 42 1,458 (7,072) Provincial, Territorial and Aboriginal
Tax Agreements Account ......................................................... 410 (1,311) (168) 1,438 241 2,688 (7,130) (1,584) 951 2,780 Amounts payable to taxpayers ......................................................... 2,986 7,622 1,835 (2,594) 397 2,304 3,925 (2,277) 3,598 (2,501) Other liabilities ................................................................................ 1,683 (2,359) 1,869 7,682 (2,103) 951 (3,054) (3,153) 7,352 3,942
Total other transactions ............................................ (3,117) 4,693 (2,476) 8,933 (11,294) (1,992) (12,553) (7,346) 7,349 (10,200)
Total non-budgetary transactions and
non-financial assets ....................................................................... (2,376) 3,018 (74,584) (13,012) (13,369) 9,360 (8,260) 33,510 10,553 (7,284)

Public Accounts of Canada, 2015–2016
Financial statements discussion and analysis 1 . 27
Table 1.6 Government of Canada Consolidated Statement of Foreign Exchange, Unmatured Debt and Cash Transactions—detailed (in millions of dollars)
Year ended March 31
2007 2008 2009 2010 2011 2012 2013 2014 2015 2016
Foreign exchange accounts
International reserves held in the Exchange Fund Account ..................................................................................... (3,737) 1,769 (8,290) (2,507) (340) (8,100) (1,240) (13,984) (14,596) (9,418)
International Monetary Fund—Subscriptions ................................. (433) 354 (1,259) 2,188 31 (50) 148 (1,189) (246) (9,041) International Monetary Fund—Loans ............................................. – – – (337) (802) (186) (132) (208) 312 75
(4,170) 2,123 (9,549) (656) (1,111) (8,336) (1,224) (15,381) (14,530) (18,384) Less: International Monetary Fund
Special drawing rights allocations ............................................ (48) 43 (154) (7,766) 30 (48) 139 (1,118) (231) (493) Notes payable ............................................................................ (771) 201 14 2,351 416 202 398 (760) (1,543) (9,370)
(819) 244 (140) (5,415) 446 154 537 (1,878) (1,774) (9,863)
Total foreign exchange accounts .............................. (3,351) 1,879 (9,409) 4,759 (1,557) (8,490) (1,761) (13,503) (12,756) (8,521)
Unmatured debt
Payable in Canadian currency Marketable bonds ...................................................................... (3,652) (3,932) 41,636 72,776 48,118 32,060 20,899 4,280 14,562 16,187 Treasury bills ............................................................................ 2,477 (17,138) 75,339 (16,426) (12,869) 241 17,468 (27,699) (17,298) 2,408 Retail debt ................................................................................. (2,167) (2,107) (537) (677) (1,714) (1,219) (1,441) (1,154) (667) (584) Bonds for Canada Pension Plan ................................................ (1,359) (700) (519) (71) (425) (16) (11) – – –
(4,701) (23,877) 115,919 55,602 33,110 31,066 36,915 (24,573) (3,403) 18,011 Payable in foreign currencies .......................................................... (3,713) (875) 883 (2,138) (615) 3,087 87 5,228 4,237 2,215 Cross-currency swap revaluation .................................................... 1,167 (329) 5,110 (7,923) (858) 643 1,029 5,745 4,343 1,722 Unamortized discounts and premiums on
market debt ............................................................................... 121 446 1,462 (341) 607 190 7,526 (47) 1,112 751 Obligation related to capital leases .................................................. 169 1,140 (51) (94) (405) (52) 13 (44) 107 (233) Other unmatured debt ...................................................................... – – – – 190 263 464 262 (174) 565
Total unmatured debt ............................................... (6,957) (23,495) 123,323 45,106 32,029 35,197 46,034 (13,429) 6,222 23,031
Cash and cash equivalents at end of year
In Canadian currency ....................................................................... 22,701 13,733 46,989 28,124 13,902 16,493 27,130 31,415 34,716 36,022 In foreign currencies ........................................................................ (5) (4) (4) 326 421 650 211 14 283 2,548
Total cash and cash equivalents ............................... 22,696 13,729 46,985 28,450 14,323 17,143 27,341 31,429 34,999 38,570

Public Accounts of Canada, 2015–2016
1 . 28 Financial statements discussion and analysis
Glossary of terms
The following terms are used in this section and throughout the consolidated financial statements in Section 2 of this volume. The definitions are taken from the following primary sources:
– TERMIUM at www.btb.termiumplus.gc.ca
– The CPA Canada Public Sector Accounting Handbook
– Glossary of frequently-used terms, Finance Canada
Accounts of Canada The centralized record of the financial transactions of the Government of Canada, maintained by the Receiver General. The accounts of Canada summarize revenues, expenses, assets and liabilities transactions.
Accrued benefit obligation The value of future benefits attributed to services rendered by employees and former employees to the accounting date.
Accumulated deficit The accumulated net total of all past federal deficits and surpluses since Confederation plus accumulated other comprehensive income. The accumulated deficit is also equal to total liabilities less total assets – both financial and non-financial.
Actuarial valuation for accounting purposes An assessment of the financial status of a benefit plan. It consists of the valuation of assets held to discharge the benefit liability and calculation of the actuarial present value of benefits to be paid under the plan. The valuation measures the obligations and attributes the costs of the benefits to the period; it also determines any gains or losses since the last valuation.
Allowance Estimated potential losses on the realization of government financial claims or estimated financial obligations that would not otherwise be recorded in the financial statements.
Appropriation Any authority of Parliament to pay money out of the Consolidated Revenue Fund.
Capital lease A lease that, from the point of view of the lessee, transfers substantially all the benefits and risks incident to ownership of property to the lessee.
Consolidated Revenue Fund The aggregate of all public moneys that are on deposit at the credit of the Receiver General for Canada.
Consumer Price Index (CPI) A measure of price changes produced by Statistics Canada on a monthly basis. The CPI measures the retail prices of a “shopping basket” of about 300 goods and services including food, housing, transportation, clothing and recreation. The index is “weighted”, meaning that it gives greater importance to price changes for some products than others – more to housing, for example, than to entertainment – in an effort to reflect typical spending patterns. Increases in the CPI are also referred to as increases in the cost of living.
Contingent liability A potential debt which may become an actual financial obligation if certain events occur or fail to occur.
Contractual obligation A written obligation to outside organizations or individuals as a result of a contract.
Deficit The amount by which government expenses exceed revenue in any given year.
Defined benefit pension plan A plan that specifies either the benefits to be received by employees after retirement or the method for determining those benefits.
Enterprise Crown corporation A corporation which is not dependent on parliamentary appropriations and whose principal activity and source of revenues are the sale of goods or services to outside parties. An enterprise Crown corporation is ultimately accountable to Parliament, through a minister of the Crown, for the conduct of its affairs.
Financial assets An asset on hand at the end of the accounting period, which could provide resources to discharge existing liabilities or finance future operations. Financial assets include cash and assets that are convertible into cash and are not intended for consumption in the normal course of activities.

Public Accounts of Canada, 2015–2016
Financial statements discussion and analysis 1 . 29
Full accrual accounting The method of recording transactions by which revenues and expenses are reflected in the determination of results for the period in which they are considered to have been earned and incurred, respectively, whether or not such transactions have been settled finally by the receipt or payment of cash or its equivalent.
G7 (Group of Seven) The G7 consists of the world’s seven largest industrial market economies: the United States, Japan, Germany, France, Great Britain, Italy and Canada. The leaders of these countries meet annually to discuss political and economic issues of mutual concern. In addition, G7 finance ministers meet several times a year to discuss economic policy. Their work is supported by regular, functional meetings of officials, including the G7 Finance Deputies.
Gross domestic product (GDP) The total value of all goods and services produced within Canada during a given year. It is a measure of the income generated by production within Canada. Also referred to as annual economic output or, more simply, output. To avoid counting the same output more than once, GDP includes only final goods and services – not those that are used to make another product. GDP would not include the wheat used to make bread, but would include the bread itself.
Net book value of tangible capital assets The cost of tangible capital assets less both accumulated amortization and the amount of any write-downs.
Net debt The total liabilities of the government less its financial assets.
Non-financial assets An asset on hand at the end of the accounting period, which could not normally be converted to cash to pay off the debt, without disrupting government operations.
Operating lease A lease in which the lessor retains substantially all the benefits and risks of ownership.
Other comprehensive income Other comprehensive income holds any unrealized gains and losses resulting from the change in market value on assets that are classified as available-for-sale, derivative instruments used in hedging activities or actuarial gains and losses on pensions and other employee future benefits.
Public money All money belonging to Canada received or collected by the Receiver General or any other public officer in his official capacity or any person authorized to receive or collect such money.
Real return bonds These Government of Canada bonds pay semi-annual interest based upon a real interest rate. Unlike standard fixed-coupon marketable bonds, interest payments on real return bonds are adjusted for changes in the consumer price index.
Retail debt Canada Savings Bonds and Canada Premium Bonds.
Surplus The amount by which government revenue exceeds expenses in any given year.
Swap An agreement that exchanges one type of return or financial instrument for another (e.g. a fixed for a floating rate of interest).
Tangible capital asset A non-financial asset having physical substance that: (a) is held for use in the production or supply of goods and services; (b) has a useful economic life extending beyond an accounting period; and (c) has been acquired to be used on a continuing basis.
Transfer payments A transfer of money from a government to an individual, an organization or another government for which the government making the transfer does not: (a) receive any goods or services directly in return as would occur in a purchase/sales transaction; (b) expect to be repaid in the future, as would be expected in a loan; or (c) expect a financial return, as would be expected in an investment.

This page has been intentionally left blank.

Section 2
2015–2016
Public Accounts of Canada
Consolidated financial statements of the Government of Canada and report and observations of the Auditor General of Canada Table of contents Page
Preface ............................................................................................. 2.2 Statement of responsibility .............................................................. 2.3 Auditor General of Canada
Independent Auditor’s Report ..................................................... 2.4Consolidated financial statements of the Government of Canada
Consolidated Statement of Operations and Accumulated Deficit .......................................................... 2.5
Consolidated Statement of Financial Position ............................. 2.6Consolidated Statement of Change in Net Debt .......................... 2.7Consolidated Statement of Cash Flow ......................................... 2.8Notes to the consolidated financial statements of the
Government of Canada ............................................................. 2.9 Supplementary information
Observations of the Auditor General of Canada ......................... 2.42

Public Accounts of Canada, 2015–2016
2 . 2 Consolidated financial statements of the Government of Canada
Preface to the Consolidated Financial Statements
of the Government of Canada
The fundamental purpose of these consolidated financial statements is to provide information to Parliament, and thus to the public, to facilitate an understanding and evaluation of the full nature and extent of the financial affairs and resources for which the Government is responsible. These consolidated financial statements reflect the financial position of the Government at the reporting date, as well as its results of operations, accumulated deficit, change in net debt and cash flow for the year then ended.
The two fundamental concepts underlying the Government’s accounting system are found in the Constitution Acts: first, that all duties and revenues received, other than those reserved to the provinces, “shall form One Consolidated Revenue Fund” (CRF); second, that the balance of the CRF, after certain prior charges, “shall be appropriated by the Parliament of Canada”.
The right of Canada to raise taxes and revenues is contained in the Constitution Acts, and is given specific form in various Acts passed by Parliament. Revenues can be raised and moneys can be spent or borrowed by the Government only with the authority of Parliament. All receipts of money by departments and agencies must be deposited into the CRF. All disbursements from the CRF for spending on operations, for loans, investments and advances, and for the redemption of matured debt, must be authorized by Parliament, through annual appropriation acts and other statutes.
Wholly-owned Crown corporations that are agents of Her Majesty may only borrow as authorized by Acts of Parliament. Such Acts usually place a ceiling on the amount of borrowings that can be outstanding at any one time. Non-agent Crown corporations and other government business enterprises can borrow without specific parliamentary authority, although such borrowings are sometimes guaranteed by the Government with the authority of Parliament.
The consolidated financial statements of the Government of Canada consist of four statements and accompanying notes.
The first is the Consolidated Statement of Operations and Accumulated Deficit, which presents the Government’s revenues, expenses, deficit or surplus, and other comprehensive loss or income for the year, and the net accumulation of the annual surpluses and deficits since Confederation.
The second is the Consolidated Statement of Financial Position, which discloses the Government’s cash balance and investments, amounts owing to and by the Government at the end of the year, and the Government’s non-financial assets such as its tangible capital assets and inventories. It also presents both the accumulated deficit of the Government and its net debt which is the difference between the Government’s total liabilities and its financial assets.
The third is the Consolidated Statement of Change in Net Debt, which explains the difference between the Government’s annual deficit or surplus and the change in the net debt for the year. It reports the extent to which revenues recognized in the year were sufficient, or not sufficient, to offset expenditures, as opposed to the expenses recognized in the annual deficit or surplus.
The fourth is the Consolidated Statement of Cash Flow, which provides information on the Government’s cash provided by or used for operating, capital investment, investing and financing activities.
Other sections in this volume together with Volume II and Volume III of the Public Accounts of Canada, provide more detailed supplementary information in respect of matters reported in the consolidated financial statements. The Independent Auditor’s Report on the consolidated financial statements does not extend to this supplementary information.

Public Accounts of Canada, 2015–2016
Consolidated financial statements of the Government of Canada 2 . 3
Statement of Responsibility These consolidated financial statements are prepared by the Government of Canada in accordance with the accounting policies set out in Note 1 to the consolidated financial statements, which are based on Canadian public sector accounting standards, and on a basis consistent with that of the preceding year.
Responsibility for the integrity and objectivity of these consolidated financial statements rests with the Government. These consolidated financial statements are prepared under the joint direction of the President of the Treasury Board, the Minister of Finance, and the Receiver General for Canada in compliance with governing legislation. These consolidated financial statements are prepared on a full accrual basis of accounting. The information included in these consolidated financial statements is based on the Government’s best estimates and judgement, with due consideration given to materiality.
To fulfill its accounting and reporting responsibilities, the Government maintains systems of financial management and internal control which give due consideration to costs, benefits and risks. These systems are designed to provide reasonable assurance that transactions are properly authorized by Parliament, are executed in accordance with prescribed regulations, and are properly recorded so as to maintain accountability of public money and safeguard the assets and properties of Canada under Government administration. The Receiver General for Canada maintains the accounts of Canada, a centralized summary record of the Government’s financial transactions. Additional information is obtained as required, from departments, agencies, Crown corporations, other government business enterprises, and other entities to meet accounting and reporting requirements.
The Government presents these consolidated financial statements to the Auditor General of Canada, who audits them and provides an independent audit opinion to the House of Commons. The duties of the Auditor General of Canada in that respect are contained in Section 6 of the Auditor General Act.
Annually, the consolidated financial statements are tabled in the House of Commons as part of the Public Accounts of Canada, and are referred to the Standing Committee on Public Accounts, which reports to Parliament on the results of its examination together with any recommendations it may have with respect to the consolidated financial statements and accompanying independent audit opinion.
On behalf of the Government of Canada.
Yaprak Baltacıoğlu Secretary of the Treasury Board of Canada
Paul Rochon Deputy Minister of Finance
Marie Lemay Deputy Receiver General for Canada
Bill Matthews, CPA, CA Comptroller General of Canada
September 6, 2016

Public Accounts of Canada, 2015–2016
2 . 4 Consolidated financial statements of the Government of Canada
Independent Auditor’s Report
To the House of Commons
Report on the Consolidated Financial Statements I have audited the accompanying consolidated financial statements of the Government of Canada, which comprise the consolidated statement of financial position as at 31 March 2016, and the consolidated statement of operations and accumulated deficit, consolidated statement of change in net debt and consolidated statement of cash flow for the year then ended, and a summary of significant accounting policies and other explanatory information.
The Government’s Responsibility for the Consolidated Financial Statements The Government is responsible for the preparation and fair presentation of these consolidated financial statements in accordance with the stated accounting policies of the Government of Canada set out in Note 1 to the consolidated financial statements, which are based on Canadian public sector accounting standards, and for such internal control as the Government determines is necessary to enable the preparation of consolidated financial statements that are free from material misstatement, whether due to fraud or error.
Auditor’s Responsibility My responsibility is to express an opinion on these consolidated financial statements based on my audit. I conducted my audit in accordance with Canadian generally accepted auditing standards. Those standards require that I comply with ethical requirements and plan and perform the audit to obtain reasonable assurance about whether the consolidated financial statements are free from material misstatement.
An audit involves performing procedures to obtain audit evidence about the amounts and disclosures in the consolidated financial statements. The procedures selected depend on the auditor’s judgment, including the assessment of the risks of material misstatement of the consolidated financial statements, whether due to fraud or error. In making those risk assessments, the auditor considers internal control relevant to the Government’s preparation and fair presentation of the consolidated financial statements in order to design audit procedures that are appropriate in the circumstances, but not for the purpose of expressing an opinion on the effectiveness of the Government’s internal control. An audit also includes evaluating the appropriateness of accounting policies used and the reasonableness of accounting estimates made by the Government, as well as evaluating the overall presentation of the consolidated financial statements.
I believe that the audit evidence I have obtained is sufficient and appropriate to provide a basis for my audit opinion.
Opinion In my opinion, the consolidated financial statements present fairly, in all material respects, the financial position of the Government of Canada as at 31 March 2016, and the results of its operations, changes in its net debt, and its cash flows for the year then ended in accordance with the stated accounting policies of the Government of Canada set out in Note 1 to the consolidated financial statements, which conform with Canadian public sector accounting standards.
Report on Other Legal and Regulatory Requirements As required by Section 6 of the Auditor General Act, I report that, in my opinion, the stated accounting policies of the Government of Canada have been applied on a basis consistent with that of the preceding year.
Michael Ferguson, CPA, CA FCPA, FCA (New Brunswick) Auditor General of Canada 6 September 2016 Ottawa, Canada

Public Accounts of Canada, 2015–2016
Consolidated financial statements of the Government of Canada 2 . 5
Government of Canada
Consolidated Statement of Operations and Accumulated Deficit for the year ended March 31, 2016 (in millions of dollars)
2016 2015
Budget Actual Actual
(Note 3) Revenues (Note 19)
Tax revenues Income tax revenues
Personal ......................................................................................................................................................... 143,355 144,897 135,743 Corporate ....................................................................................................................................................... 36,846 41,444 39,447 Non-resident .................................................................................................................................................. 6,195 6,505 6,216
Total income tax revenues ................................................................................................................ 186,396 192,846 181,406
Other taxes and duties Goods and services tax .................................................................................................................................. 32,734 32,952 31,349 Energy taxes .................................................................................................................................................. 5,607 5,565 5,528 Customs import duties ................................................................................................................................... 4,887 5,372 4,581 Other excise taxes and duties ........................................................................................................................ 5,795 5,916 5,724
Total other taxes and duties .............................................................................................................. 49,023 49,805 47,182
Total tax revenues ............................................................................................................ 235,419 242,651 228,588
Employment insurance premiums ........................................................................................................................... 23,125 23,070 22,564
Other revenues Crown corporations ....................................................................................................................................... 13,111 12,460 13,480 Other programs .............................................................................................................................................. 16,580 14,950 16,359 Net foreign exchange ..................................................................................................................................... 2,051 2,322 1,355
Total other revenues ........................................................................................................ 31,742 29,732 31,194
Total revenues ........................................................................................................................................ 290,286 295,453 282,346
Expenses (Note 4 and Note 19)
Transfer payments Old age security benefits, guaranteed income
supplement and spouse's allowance ........................................................................................................ 45,678 45,461 44,103 Major transfer payments to other levels of government ............................................................................... 65,436 65,850 63,109 Employment insurance benefits .................................................................................................................... 18,375 19,419 18,052 Children's benefits ......................................................................................................................................... 17,959 18,025 14,303 Other transfer payments ................................................................................................................................ 33,987 34,874 35,126
Total transfer payments .................................................................................................................... 181,435 183,629 174,693
Other program expenses Crown corporations ....................................................................................................................................... 8,329 8,358 7,590 Ministries ....................................................................................................................................................... 73,448 78,858 71,558
Total other program expenses .......................................................................................................... 81,777 87,216 79,148
Total program expenses ................................................................................................... 263,212 270,845 253,841
Public debt charges .................................................................................................................................................. 25,704 25,595 26,594
Total expenses ........................................................................................................................................ 288,916 296,440 280,435
Annual (deficit) surplus ............................................................................................................................................... 1,370 (987) 1,911
Accumulated deficit at beginning of year ................................................................................................................... 612,330 612,330 611,881
Other comprehensive loss (Note 5 and Note 13) ........................................................................................................ (2,366) (2,669) (2,360)
Accumulated deficit at end of year (Note 5) ............................................................................................................... 613,326 615,986 612,330
The accompanying notes are an integral part of these consolidated statements. Details can be found in other sections (unaudited) of this volume.
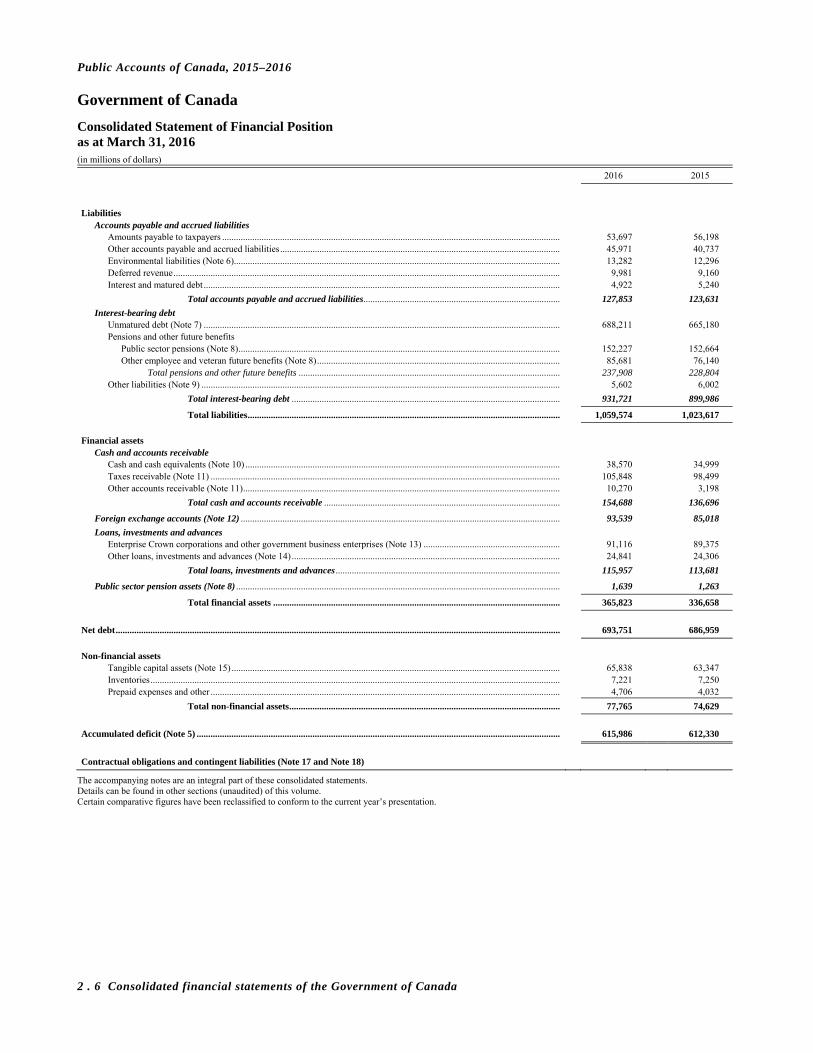
Public Accounts of Canada, 2015–2016
2 . 6 Consolidated financial statements of the Government of Canada
Government of Canada
Consolidated Statement of Financial Position as at March 31, 2016 (in millions of dollars)
2016 2015
Liabilities
Accounts payable and accrued liabilities Amounts payable to taxpayers .................................................................................................................................................. 53,697 56,198 Other accounts payable and accrued liabilities ......................................................................................................................... 45,971 40,737 Environmental liabilities (Note 6)............................................................................................................................................. 13,282 12,296 Deferred revenue ....................................................................................................................................................................... 9,981 9,160 Interest and matured debt .......................................................................................................................................................... 4,922 5,240
Total accounts payable and accrued liabilities ..................................................................................... 127,853 123,631
Interest-bearing debt Unmatured debt (Note 7) .......................................................................................................................................................... 688,211 665,180 Pensions and other future benefits
Public sector pensions (Note 8) ........................................................................................................................................... 152,227 152,664 Other employee and veteran future benefits (Note 8) ......................................................................................................... 85,681 76,140
Total pensions and other future benefits ................................................................................................................. 237,908 228,804 Other liabilities (Note 9) ........................................................................................................................................................... 5,602 6,002
Total interest-bearing debt .................................................................................................................... 931,721 899,986
Total liabilities ....................................................................................................................................... 1,059,574 1,023,617
Financial assets
Cash and accounts receivable Cash and cash equivalents (Note 10) ........................................................................................................................................ 38,570 34,999 Taxes receivable (Note 11) ....................................................................................................................................................... 105,848 98,499 Other accounts receivable (Note 11) ......................................................................................................................................... 10,270 3,198
Total cash and accounts receivable ...................................................................................................... 154,688 136,696
Foreign exchange accounts (Note 12) .......................................................................................................................................... 93,539 85,018
Loans, investments and advances Enterprise Crown corporations and other government business enterprises (Note 13) ........................................................... 91,116 89,375 Other loans, investments and advances (Note 14) .................................................................................................................... 24,841 24,306
Total loans, investments and advances ................................................................................................. 115,957 113,681
Public sector pension assets (Note 8) ............................................................................................................................................ 1,639 1,263
Total financial assets ............................................................................................................................ 365,823 336,658
Net debt ................................................................................................................................................................................................ 693,751 686,959
Non-financial assets
Tangible capital assets (Note 15) .............................................................................................................................................. 65,838 63,347 Inventories ................................................................................................................................................................................. 7,221 7,250 Prepaid expenses and other ....................................................................................................................................................... 4,706 4,032
Total non-financial assets ..................................................................................................................... 77,765 74,629
Accumulated deficit (Note 5) ............................................................................................................................................................. 615,986 612,330
Contractual obligations and contingent liabilities (Note 17 and Note 18)
The accompanying notes are an integral part of these consolidated statements. Details can be found in other sections (unaudited) of this volume. Certain comparative figures have been reclassified to conform to the current year’s presentation.

Public Accounts of Canada, 2015–2016
Consolidated financial statements of the Government of Canada 2 . 7
Government of Canada
Consolidated Statement of Change in Net Debt for the year ended March 31, 2016 (in millions of dollars)
2016 2015
Budget Actual Actual
(Note 3)
Net debt at beginning of year ...................................................................................................................................... 686,959 686,959 682,314
Change in net debt during the year
Annual deficit (surplus) .......................................................................................................................................... (1,370) 987 (1,911)
Changes due to tangible capital assets
Acquisition of tangible capital assets .................................................................................................................. 8,541 8,015 7,204 Amortization of tangible capital assets ............................................................................................................... (5,702) (5,049) (5,090) Proceeds from disposal of tangible capital assets .............................................................................................. (400) (632) (954) Net gain on disposal of tangible capital assets, including adjustments .............................................................. – 157 245
Total change due to tangible capital assets ........................................................................................... 2,439 2,491 1,405
Change due to inventories ...................................................................................................................................... – (29) (66)
Change due to prepaid expenses and other .......................................................................................................... – 674 2,857
Net increase in net debt due to operations ................................................................................................................. 1,069 4,123 2,285
Other comprehensive loss (Note 5 and Note 13) ........................................................................................................ 2,366 2,669 2,360
Net increase in net debt ................................................................................................................................................ 3,435 6,792 4,645
Net debt at end of year ................................................................................................................................................. 690,394 693,751 686,959
The accompanying notes are an integral part of these consolidated statements. Details can be found in other sections (unaudited) of this volume.

Public Accounts of Canada, 2015–2016
2 . 8 Consolidated financial statements of the Government of Canada
Government of Canada
Consolidated Statement of Cash Flow for the year ended March 31, 2016 (in millions of dollars)
2016 2015
Operating activities
Annual (deficit) surplus ..................................................................................................................................................................... (987) 1,911
Non-cash items Share of annual profit in enterprise Crown corporations and other government business enterprises .................................... (7,316) (8,365) Amortization of tangible capital assets ..................................................................................................................................... 5,049 5,090 Net gain on disposal of tangible capital assets, including adjustments .................................................................................... (157) (245) Cross-currency swap revaluation .............................................................................................................................................. 1,722 4,343
Change in taxes receivable ............................................................................................................................................................. (7,349) (6,010) Change in pensions and other future benefits ................................................................................................................................. 8,728 3,358 Change in foreign exchange accounts ............................................................................................................................................ (8,521) (12,756) Change in accounts payable and accrued liabilities ....................................................................................................................... 4,222 11,901 Change in cash collateral pledged to counterparties ...................................................................................................................... (6,557) – Net change in other accounts .......................................................................................................................................................... 34 670
Cash used by operating activities ................................................................................................................................. (11,132) (103)
Capital investment activities
Acquisition of tangible capital assets ............................................................................................................................................. (7,379) (6,804) Proceeds from disposal of tangible capital assets ........................................................................................................................... 632 954
Cash used by capital investment activities ................................................................................................................... (6,747) (5,850)
Investing activities
Enterprise Crown corporations and other government business enterprises Equity transactions .................................................................................................................................................................... 4,975 3,514 Issuance of loans and advances ................................................................................................................................................. (54,542) (79,905) Repayment of loans and advances ............................................................................................................................................ 52,699 88,168
Issuance of other loans, investments and advances ........................................................................................................................ (7,749) (8,124) Repayment of other loans, investments and advances ................................................................................................................... 6,145 5,503
Cash provided by investing activities ........................................................................................................................... 1,528 9,156
Financing activities
Issuance of Canadian currency borrowings .................................................................................................................................... 452,850 468,021 Repayment of Canadian currency borrowings ............................................................................................................................... (435,143) (471,891) Issuance of foreign currency borrowings ....................................................................................................................................... 26,817 16,961 Repayment of foreign currency borrowings ................................................................................................................................... (24,602) (12,724)
Cash provided by financing activities .......................................................................................................................... 19,922 367
Net increase in cash and cash equivalents ........................................................................................................................................ 3,571 3,570
Cash and cash equivalents at beginning of year ................................................................................................................................ 34,999 31,429
Cash and cash equivalents at end of year (Note 10) .......................................................................................................................... 38,570 34,999
Supplementary information
Cash used for interest ...................................................................................................................................................................... 14,337 15,152
The accompanying notes are an integral part of these consolidated statements. Details can be found in other sections (unaudited) of this volume.
Public Accounts of Canada, 2015–2016
Consolidated financial statements of the Government of Canada 2 . 9
Notes to the consolidated financial statements of the Government of Canada
1. Summary of significant accounting policies
Reporting entity
The reporting entity of the Government of Canada includes all of the government organizations which comprise the legal entity of the Government as well as other government organizations, including Crown corporations, which are separate legal entities but are controlled by the Government. For financial reporting purposes, control is defined as the power to govern the financial and operating policies of an organization with benefits from the organization’s activities being expected, or the risk of loss being assumed by the Government. All organizations defined as departments and as Crown corporations in the Financial Administration Act are included in the reporting entity. Other organizations not listed in the Financial Administration Act may also meet the definition of control and they are included in the Government’s reporting entity if their revenues, expenses, assets or liabilities are significant.
The financial activities of all of these entities, except for enterprise Crown corporations and other government business enterprises, are consolidated in these financial statements on a line-by-line and uniform basis of accounting after eliminating significant inter-governmental balances and transactions. Enterprise Crown corporations and other government business enterprises, which are not dependent on the Government for financing their activities, are recorded under the modified equity method.
The Canada Pension Plan (CPP), which includes the assets of CPP under the administration of the Canada Pension Plan Investment Board, is excluded from the reporting entity because changes to CPP require the agreement of two thirds of participating provinces and it is therefore not controlled by the Government.
Basis of accounting
These consolidated financial statements are prepared using the Government’s accounting policies stated below, which are based on Canadian public sector accounting standards. The presentation and results using the stated accounting policies do not result in any significant differences from Canadian public sector accounting standards.
Revenues
Tax revenues are recognized in the period in which the taxable event occurs and when they are authorized by legislation or the ability to assess and collect the tax has been provided through legislative convention.
Tax revenues are measured from amounts assessed/reassessed and from estimates of amounts not yet assessed/reassessed based on cash received that relates to the fiscal year ended March 31. Annual revenues also include adjustments between the estimated revenues of previous years and actual amounts, as well as revenues from reassessments relating to prior years. Revenues do not include estimates of unreported taxes, or the impact of future reassessments that cannot yet be reliably determined.
Tax expenditures that reduce taxes paid or payable are considered tax concessions and are netted against the applicable tax revenue. Tax expenditures that provide a financial benefit through the tax system, and are not related to the relief of taxes paid or payable, are shown as other transfer payments and are not netted against tax revenue.
Tax revenues that were not collected at year end and refunds that were not yet disbursed are reported respectively as taxes receivable and amounts payable to taxpayers on the Consolidated Statement of Financial Position. These amounts also include other receivables and payables for amounts collected through the tax system such as provincial and territorial taxes, Employment Insurance premiums and Canada Pension Plan contributions.
Tax collected on behalf of the provincial/territorial governments is not included in tax revenues. It is recorded as payable to the provincial/territorial governments included within Other Accounts Payable and Accrued Liabilities and distributed by the Department of Finance in accordance with associated agreements.
Public Accounts of Canada, 2015–2016
2 . 10 Consolidated financial statements of the Government of Canada
The following policies are applied for specific revenue streams:
Income tax revenue is recognized when the taxpayer has earned the income subject to the tax.
Domestic goods and services tax (GST) revenue is recognized at the time of the sale of goods or the provision of services. These revenues are reported net of input tax credits, GST rebates, and the GST quarterly tax credits. The GST quarterly tax credit for low-income individuals and families is recorded in the period to which it relates.
Customs duties and goods and services tax revenue on imports are recognized when goods are authorized to enter Canada.
Excise tax revenue is recognized when a taxpayer sells goods taxable under the Excise Tax Act.
Excise duties revenue is recognized when the taxpayer manufactures goods taxable under the Excise Act and the Excise Act, 2001.
Employment Insurance premiums are recognized as revenue in the period the insurable earnings are earned.
Other revenues are recognized in the period to which they relate.
Spectrum licence fees are recognized as revenue on a straight-line basis over the term of the licence. Deferred revenue consists of spectrum licence fees and other amounts received in advance for the delivery of goods and rendering of services that will be recognized as revenue in a subsequent fiscal year as it is earned.
Expenses
The Government has three major types of expenses: transfer payments, other program expenses and public debt charges.
Transfer payments are recorded as expenses when the recipients have met all the eligibility criteria and the transfers are authorized by March 31. In the case of transfers which do not form part of an existing program, the transfers are considered to be authorized when the Government announces a decision to make a non-recurring transfer, provided the enabling legislation or authorization for payment receives parliamentary approval prior to the completion of the consolidated financial statements.
Other program expenses are generally recorded when goods are received or services are rendered and include expenses related to personnel, professional and special services, repair and maintenance, utilities, materials and supplies, as well as amortization of tangible capital assets. Provisions to reflect changes in the value of assets or liabilities, such as provisions for bad debts, loans, investments and advances and inventory obsolescence, as well as utilization of inventories and prepaid expenses and other are also included in other program expenses. Public sector pensions and other employee and veteran future benefits, which comprise a portion of personnel expenses, are recorded as employees render services using the projected benefit method prorated on service, except for: veteran future benefits and workers’ compensation where benefits are accrued on an event driven basis; accumulated sick leave entitlements where benefits are recognized using an accrued benefit method; and plan amendments related to past services, curtailments and settlements where costs are recorded when approved or paid.
Public debt charges are recorded when incurred and include interest, servicing costs, costs of issuing new borrowings, amortization of premiums and discounts on market debt including amounts arising on the extinguishment of debt, as well as interest on public sector pensions and other employee and veteran future benefits.
Cash and cash equivalents
Cash consists of public moneys on deposit and cash in transit less outstanding cheques and warrants. Cash equivalents consist mainly of term deposits usually not exceeding 31 days.
Public Accounts of Canada, 2015–2016
Consolidated financial statements of the Government of Canada 2 . 11
Foreign exchange accounts
Short-term deposits, marketable securities and special drawing rights held in the foreign exchange accounts are recorded at cost. Marketable securities are adjusted for amortization of purchase discounts and premiums. Purchases and sales of securities are recorded at the settlement date. Transaction costs are expensed as incurred for all classes of financial instruments.
Investment income earned with respect to foreign exchange accounts as well as write-downs to reflect other than temporary impairment in the fair value of securities are included in net foreign exchange revenues on the Consolidated Statement of Operations and Accumulated Deficit. Canada’s subscriptions to the capital of the International Monetary Fund and loans to the International Monetary Fund are recorded at cost.
Loans, investments and advances
Investments in enterprise Crown corporations and other government business enterprises, which include the net assets and liabilities of enterprise Crown corporations and other government business enterprises, are recorded under the modified equity method whereby the cost of the Government’s equity is reduced by dividends received and adjusted to include the annual profits and losses of these corporations, after elimination of unrealized inter-organizational gains and losses. All of these corporations follow International Financial Reporting Standards (IFRS). Under the modified equity method, the corporations’ accounts are not adjusted to the Government’s basis of accounting and other comprehensive income or loss of enterprise Crown corporations and other government business enterprises is recorded directly to the Government’s accumulated deficit and net debt.
Some enterprise Crown corporations provide loans to borrowers outside the reporting entity of the Government. Some of these loans will be repaid through future appropriations of the Government under various subsidy programs which provide funds directly related to the repayment of the loan. For these loans receivable, a valuation allowance for the amount expected to be repaid from future appropriations is recorded to reduce their carrying value to an amount that approximates the amount to be recovered from sources outside the reporting entity of the Government. The valuation allowance is based upon the amount qualified borrowers are expected to receive under various Government subsidy programs and the percentage of the subsidy expected to be applied to the outstanding loan balance.
Other loans, investments and advances are initially recorded at cost and are adjusted to reflect the concessionary terms of loans made on a long-term, low interest or interest-free basis.
When necessary, an allowance for valuation is recorded to reduce the carrying value of other loans, investments and advances to amounts that approximate their net recoverable value. The allowance for valuation for other loans, investments and advances, reflects the possibility of losses associated with potential default on these exposures. The determination of the valuation allowance considers the credit risk of borrowers, collateral provided as well as previous repayment history. When they are determined to be uncollectible, other loans, investments and advances are written off. Subsequent recoveries are recorded as revenue when received.
Public Accounts of Canada, 2015–2016
2 . 12 Consolidated financial statements of the Government of Canada
Non-financial assets
The costs of acquiring land, buildings, equipment and other capital property are capitalized as tangible capital assets and, except for land, are amortized to expense over the estimated useful lives of the assets, as described in Note 15. For certain tangible capital assets where the costs are not readily available, such as older buildings, estimated current costs have been extrapolated retrospectively in a systematic and rational manner to approximate original costs. Assets acquired under capital leases are recorded at the present value of the minimum lease payments using the appropriate discount rate, which is generally the lower of the interest rate implicit in the lease and government’s rate of incremental borrowing at the inception of the lease. These assets are amortized over the lease term or the estimated useful life of the asset in accordance with the asset type. The corresponding lease obligations are recorded under unmatured debt on the Consolidated Statement of Financial Position. When conditions indicate that a tangible capital asset no longer contributes to the government’s ability to provide goods and services, or that the value of future economic benefits associated with the tangible capital asset is less than its net book value, the cost of the tangible capital asset is reduced to reflect the decline in the asset’s value.
Tangible capital assets do not include immovable assets located on reserves as defined in the Indian Act; works of art, museum collections and Crown land to which no acquisition cost is attributable; and intangible assets. In addition, acquisitions of works of art and museum collections consisting mainly of paintings, sculptures, drawings, prints, photographs, monuments, films and videos are expensed in the fiscal year in which they are acquired.
Inventories are valued at cost and are comprised of spare parts and supplies held for future program delivery and are not primarily intended for resale. Inventories that no longer have service potential are valued at the lower of cost or net realizable value. Items for which the costs are not readily available are valued using management’s best estimate of original cost, based on available information.
Non-financial assets are not taken into consideration when determining the net debt of the Government, but rather are deducted from the net debt to determine the accumulated deficit.
Unmatured debt
Unmatured debt consists of market debt, cross currency swap revaluations, the obligation related to capital leases and other unmatured debt. Market debt is recorded at face value and is adjusted by discounts and premiums which are amortized on a straight-line basis over the term to maturity of the respective debt instrument. The corresponding amortization is recorded in public debt charges. When a marketable bond is exchanged or repurchased, and the transaction results in an extinguishment of the debt, the difference between the carrying amount of the debt instrument and the net consideration paid is recognized as a gain or loss in the Consolidated Statement of Operations and Accumulated Deficit, and the debt instrument is derecognized. An extinguishment occurs on the repurchase of bonds, or when there is an exchange of bonds with an existing bond holder and the terms of the original debt and the replacement debt are substantially different. Exchanged bonds are considered to have substantially different terms when the discounted present value of the cash flows under the new terms, including any amounts paid on the exchange, and discounted using the average effective interest rate of the original debt, is at least 10 per cent different from the discounted present value of the remaining cash flows of the original debt. If an exchange of bonds with an existing bond holder does not result in an extinguishment, the carrying amount of the debt is adjusted for any amounts paid on the exchange, and the unamortized premiums or discounts relating to the original debt and arising on the exchange transaction are amortized over the remaining term to maturity of the replacement debt on a straight-line basis. The Government’s holdings of its own securities, if any, are deducted from market debt to report the liability to external parties. As the Government does not specifically borrow on behalf of enterprise Crown corporations, there is no netting of outstanding market debt and loans to these corporations.
Cross currency swap revaluations consist of unrealized gains or losses due to fluctuations in the foreign exchange value of the cross currency swaps entered into by the Government.
The obligation related to capital leases represents the present values of the remaining minimum lease payments under capital lease agreements.

Public Accounts of Canada, 2015–2016
Consolidated financial statements of the Government of Canada 2 . 13
Public sector pensions and other employee and veteran future benefits
Public sector pensions and other employee and veteran future benefits are measured on an actuarial basis. The actuarial valuations estimate the current value of benefits earned and use various actuarial assumptions in the process. When actual experience of the plans varies from estimates or when actuarial assumptions change, actuarial gains or losses arise. Due to their tentative nature and because further adjustments will likely be required in the future, actuarial gains and losses are not recognized immediately but rather over the expected average remaining service life (EARSL) of the employees, which varies across plans, or the average remaining life expectancy (ARLE) of the benefit recipients under wartime veteran plans. Recognition of actuarial gains and losses commences in the year following the effective date of the related actuarial valuations. In addition, an unrecognized net actuarial loss is recognized immediately upon a plan amendment, up to a maximum of the related decrease in the accrued benefit obligation; similarly, an unrecognized net actuarial gain is recognized immediately, up to a maximum of the related increase in the accrued benefit obligation. The unrecognized net actuarial loss or gain, relating to the obligation that is curtailed or settled, is recognized immediately upon a plan curtailment or settlement.
Investments held by the Public Sector Pension Investment Board (PSPIB) are valued at market-related value, a five-year smoothed value. Under this method, the expected return on investments is recorded immediately while the difference between the expected and the actual return on investments is recorded over a five-year period through actuarial gains and losses. The market-related value of investments is adjusted, if necessary, to ensure that it does not fall outside a limit of plus or minus 10 per cent of the market value of investments at year end; any difference is recorded immediately through actuarial gains and losses.
Contributions receivable from employees for past service buyback elections are discounted to approximate their fair value.
Contingent liabilities
Contingent liabilities, including the allowance for guarantees, are potential liabilities which may become actual liabilities when one or more future events occur or fail to occur. If the future event is likely to occur or fail to occur, and a reasonable estimate of the loss can be made, an estimated liability is accrued as part of other accounts payable and accrued liabilities and an expense recorded to other program expenses. If the likelihood is not determinable or an amount cannot be reasonably estimated, the contingency is disclosed in the notes to the consolidated financial statements.
For guarantees, an allowance is recorded when it is determined that a loss is likely and the amount of the allowance is estimated taking into consideration the nature of the guarantee, loss experience and current conditions. The allowance is reviewed on an ongoing basis and changes in the allowance are recorded as expenses in the year they become known.
Environmental liabilities
Environmental liabilities consist of estimated costs related to the remediation of contaminated sites as well as estimated costs related to obligations associated with the retirement of tangible capital assets and other environmental liabilities.
A liability for remediation of contaminated sites is recognized when all of the following criteria are satisfied: an environmental standard exists, contamination exceeds the environmental standard, the Government is directly responsible or accepts responsibility, it is expected that future economic benefits will be given up and a reasonable estimate of the amount can be made. The liability reflects the Government’s best estimate of the amount required to remediate the sites to the current minimum standard for its use prior to contamination. When the future cash flows required to settle or otherwise extinguish a liability are estimable, predictable and expected to occur over extended future periods, a present value technique is used. The discount rate applied is taken from the Government’s Consolidated Revenue Fund monthly lending rates for periods of one year and over which is based on the Government’s cost of borrowing. The discount rates used are based on the term rate associated with the estimated number of years to complete remediation. For remediation costs with estimated future cash flows spanning more than 25 years, the 25-year Consolidated Revenue Fund lending rate is used as the discount rate.
A liability for an asset retirement obligation is recognized when all of the following criteria are satisfied: there is an agreement, contract, legislation, or a constructive or equitable obligation that obligates the Government to incur retirement costs in relation to a tangible capital asset, the past event or transaction giving rise to the retirement liability has occurred, it is expected that future economic benefits will be given up and a reasonable estimate of the amount can be made. These costs are normally capitalized and amortized over the asset’s estimated useful life based on the Government’s best estimates of the cost to retire the tangible asset. If the related asset is fully amortized, the related cost is expensed. The liability reflects the present value of estimated future cash flows required to retire the assets where amounts can be reasonably estimated and is expected to be settled as the related sites, facilities or assets are removed from service.
A liability for unexploded explosive ordnance (UXO) affected legacy sites is recognized when there is an appropriate basis for measurement and a reasonable estimate can be made. These liabilities are present obligations arising from past transactions or events, the settlement of which is expected to result in the future sacrifice of economic benefits.
The recorded environmental liabilities are adjusted each year, as required, for present value adjustments, inflation, new obligations, changes in management estimates and actual costs incurred.
If the likelihood of the Government’s responsibility is not determinable, a contingent liability is disclosed in the notes to the consolidated statements. If measurement uncertainty exists it is also disclosed in the notes to the consolidated statements.

Public Accounts of Canada, 2015–2016
2 . 14 Consolidated financial statements of the Government of Canada
Foreign currency translation
Transactions involving foreign currencies are translated into Canadian dollar equivalents using rates in effect at the time of the transactions. Monetary assets and liabilities denominated in foreign currencies are translated using rates at March 31. Gains and losses resulting from foreign currency translation are reported on the Consolidated Statement of Operations and Accumulated Deficit according to the activities to which they relate. Net gains and losses relating to the foreign exchange accounts, foreign debt, swap and foreign exchange forward agreement revaluations are presented with investment revenues from foreign exchange accounts under net foreign exchange revenues. Net gains and losses relating to loans, investments and advances are presented with the return on investments from these loans, investments and advances under other program revenues. Net gains and losses relating to transfer payments are reported in the transfer payment expenses under other transfer payments. Net gains and losses relating to departmental sale or purchase of goods or services in foreign currency are reported in ministries expenses under other program expenses.
Measurement uncertainty
The preparation of consolidated financial statements requires the Government to make estimates and assumptions that affect the reported and disclosed amounts of assets, liabilities, revenues and expenses in the consolidated financial statements and accompanying notes at March 31. The estimates are based on facts and circumstances, historical experience, general economic conditions and reflect the Government’s best estimate of the related amount at the end of the reporting period. Estimates and underlying assumptions are reviewed annually at March 31. Revisions to accounting estimates are recognized in the period in which estimates are revised if revisions affect only that period or in the period of revision and future periods if revisions affect both current and future periods.
A material measurement uncertainty exists when it is reasonably possible that a material variance could occur in the reported or disclosed amount in the near term. Near term is defined as a period of time not to exceed one year from March 31. The Government has determined that a material measurement uncertainty exists with respect to the reported amounts for public sector pensions and other employee and veteran future benefits. Measurement uncertainty due to estimates and assumptions also exists in the accrual of tax revenues, the related amounts receivable and payable, and the allowance for doubtful accounts; and environmental liabilities. It is reasonably possible that the Government’s reassessments of these estimates and assumptions could require a material change in reported amounts or disclosures in the consolidated financial statements.
Obligations for public sector pensions and other employee and veteran future benefits are actuarially determined and the actual experience may differ significantly from the assumptions used in the calculation of the plans’ accrued benefits. At March 31, 2016, net future benefit liabilities of $236,269 million ($227,541 million in 2015) in regards to obligations for public sector pensions and other employee and veteran future benefits are recorded in the financial statements. The significant actuarial assumptions used in measuring the benefit obligations as well as a sensitivity analysis of the impact on the consolidated financial statements of changes in the most significant assumptions are found in Note 8.
Tax revenues, the related amounts receivable and payable and the allowance for doubtful accounts are subject to measurement uncertainty due to the use of estimates of amounts not yet assessed/reassessed based on cash received. Key assumptions used in estimating tax revenues are that tax instalments, historical information on refund rates, payments received on filing tax returns, and amounts receivable assessed are good indicators of tax revenue earned to March 31 that has not yet been assessed. The estimates are subject to back-testing and are refined as required. The key assumption used to estimate the general allowance for doubtful accounts is historical collection information as described in Note 11. The methodologies used to determine the estimates were applied consistently with those of the previous year.
Environmental liabilities are subject to measurement uncertainty as discussed in Note 6 due to the evolving technologies used in the remediation of contaminated sites, the use of discounted present value of future estimated costs, and the fact that not all sites have had a complete assessment of the extent and nature of remediation. Changes to underlying assumptions, the timing of the expenditures, the technology employed, or revisions to environmental standards could result in significant changes to the environmental liabilities recorded.
Other comprehensive income or loss
Other comprehensive income or loss, resulting from the accounting of enterprise Crown corporations and other government business enterprises under the modified equity method, is excluded from the calculation of the Government’s annual deficit and is recorded directly to the Government’s accumulated deficit and net debt.
2. Comparative information
Certain comparative figures have been reclassified to conform to the current year’s presentation.

Public Accounts of Canada, 2015–2016
Consolidated financial statements of the Government of Canada 2 . 15
3. Spending and borrowing authorities
(a) Spending authorities
The authority of Parliament is required before moneys can be spent by the Government. Approvals are given in the form of annually approved limits through appropriation acts or through legislation in the form of statutory spending authority for specific purposes. When Parliament is dissolved for the purposes of a general election, section 30 of the Financial Administration Act authorizes the Governor General, under certain conditions, to issue a special warrant authorizing the Government to withdraw funds from the Consolidated Revenue Fund. During fiscal year 2015–2016, with the dissolution of Parliament on August 4, 2015, there were no requirements to issue special warrants to support expenditures.
The Government uses the full accrual method of accounting to prepare its Budget and present its current consolidated financial statements. However, the spending authorities voted by Parliament remain on an expenditure basis, which uses only a partial accrual method of accounting. During the year, expenditures were made under the authorities indicated in the following table:
(in millions of dollars)
2016 2015
Annual spending limits voted by Parliament ....................................................................................................................................... 95,358 93,955
Expenditures permitted under other legislation .................................................................................................................................... 158,135 148,614
Total budgetary expenditures authorized ............................................................................................................................................. 253,493 242,569
Less: amounts available for use in subsequent years and amounts that have lapsed ........................................................................... 12,094 11,428
Total net expenditures .......................................................................................................................................................................... 241,399 231,141
Effect of consolidation and full accrual accounting ............................................................................................................................. 55,041 49,294
Total expenses ...................................................................................................................................................................................... 296,440 280,435
The use of budgetary expenditure authorities reported in the preceding table differs from the total expenses reported in the Consolidated Statement of Operations and Accumulated Deficit. The difference is due to various factors. Spending authorities are presented on a partial accrual basis, while the Consolidated Statement of Operations and Accumulated Deficit is prepared on a full accrual basis. The transactions of consolidated specified purpose accounts and of certain Crown corporations or other controlled entities are consolidated in the financial statements but are not included in the budgetary expenditure authorities available for use. Transfer payments to organizations within the Government reporting entity are recorded against a budgetary expenditure authority in the year they are disbursed to the organization, but they are recorded as a consolidated expense only when they are disbursed to the ultimate recipient outside of the Government reporting entity. Provisions for valuation of assets and liabilities are also not included in spending authorities.
In addition to the authorities for budgetary expenditures, non-budgetary spending of $206,895 million ($245,788 million in 2015) was authorized for loans, investments and advances. A net amount of $55,446 million ($71,551 million in 2015) was used, an amount of $71 million ($33 million in 2015) lapsed and an amount of $151,378 million ($174,204 million in 2015) is available for use in subsequent years.
Details about the source and disposition of authorities (unaudited) and the details of ministerial expenditures are provided in Volume II of the Public Accounts of Canada.
(b) Over-expenditure of spending authorities
There were no over-expenditures of spending authorities in 2015–2016.
(c) Borrowing authorities
The Government may borrow only on the authority of Parliament which is contained in Part IV of the Financial Administration Act. Section 43.1 of the Financial Administration Act empowers the Governor in Council to authorize the Minister of Finance to borrow money on behalf of Her Majesty in right of Canada. In 2016, the Governor in Council specified $270,000 million ($270,000 million in 2015) to be the maximum aggregate amount of principal that may be borrowed during the fiscal year. The maximum aggregate amount of principal is the sum of i) the maximum stock of treasury bills anticipated to be outstanding during the year, ii) the total value of refinanced and anticipated new issuances of marketable bonds and retail debt and iii) an amount to facilitate intra-year management of the debt and foreign exchange accounts. During the year, $237,867 million ($244,913 million in 2015) of the borrowing authority was used.

Public Accounts of Canada, 2015–2016
2 . 16 Consolidated financial statements of the Government of Canada
(d) Source of budget amounts
The budget amounts included in the Consolidated Statement of Operations and Accumulated Deficit and the Consolidated Statement of Change in Net Debt are derived from the amounts that were budgeted for 2015–2016 in the April 2015 Budget Plan (Budget 2015).
Since actual opening balances of the accumulated deficit and net debt were not available at the time of preparation of Budget 2015, the corresponding amounts in the budget column have been adjusted to the actual closing balances of the previous year.
4. Expenses
Expenses in the Consolidated Statement of Operations and Accumulated Deficit include:
(a) Major transfer payments to other levels of government
(in millions of dollars)
2016 2015
Canada health transfer .......................................................................................................................................................................... 34,025 32,114 Canada social transfer ........................................................................................................................................................................... 12,959 12,582 Fiscal arrangements ............................................................................................................................................................................. 16,893 16,271 Other major transfers ............................................................................................................................................................................ 1,973 2,142
Total major transfer payments to other levels of government ............................................................................................................. 65,850 63,109
Details can be found in Section 3 (unaudited) of this volume and in Section 1 (unaudited) of Volume II of the Public Accounts of Canada.
Other transfer payments
Other transfer payments totalling $34,874 million ($35,126 million in 2015) include various amounts paid through federal programs to stabilize market prices for commodities, to develop new technologies, to conduct research, provide international development assistance, support health care and infrastructure of First Nations and Inuit communities, support social housing and families and to promote educational and cultural activities. Also included are expenses of other consolidated entities and other miscellaneous payments. The various types of transfer payments are being delivered by departments according to their departmental legislative mandates. Details can be found in Table 3.6 of Section 3 (unaudited) of this volume.
(c) Public debt charges
(in millions of dollars)
2016 2015
Public debt charges related to unmatured debt
Interest on unmatured debt ............................................................................................................................................................. 13,203 13,614 Amortization of discounts on Canada and Treasury bills............................................................................................................... 871 1,420 Amortization of premiums and discounts on all other debts .......................................................................................................... 1,503 841 Cross currency swap revaluation .................................................................................................................................................... (487) (542) Servicing costs and costs of issuing new borrowings..................................................................................................................... 11 19 Capital lease obligations ................................................................................................................................................................. 209 209 Other unmatured debt ..................................................................................................................................................................... 83 60
Total ................................................................................................................................................................................................ 15,393 15,621
Interest expense related to pensions and other future benefits ............................................................................................................. 9,995 10,748 Other liabilities ..................................................................................................................................................................................... 207 225
Total public debt charges ...................................................................................................................................................................... 25,595 26,594
Details can be found in Section 3 (unaudited) of this volume.
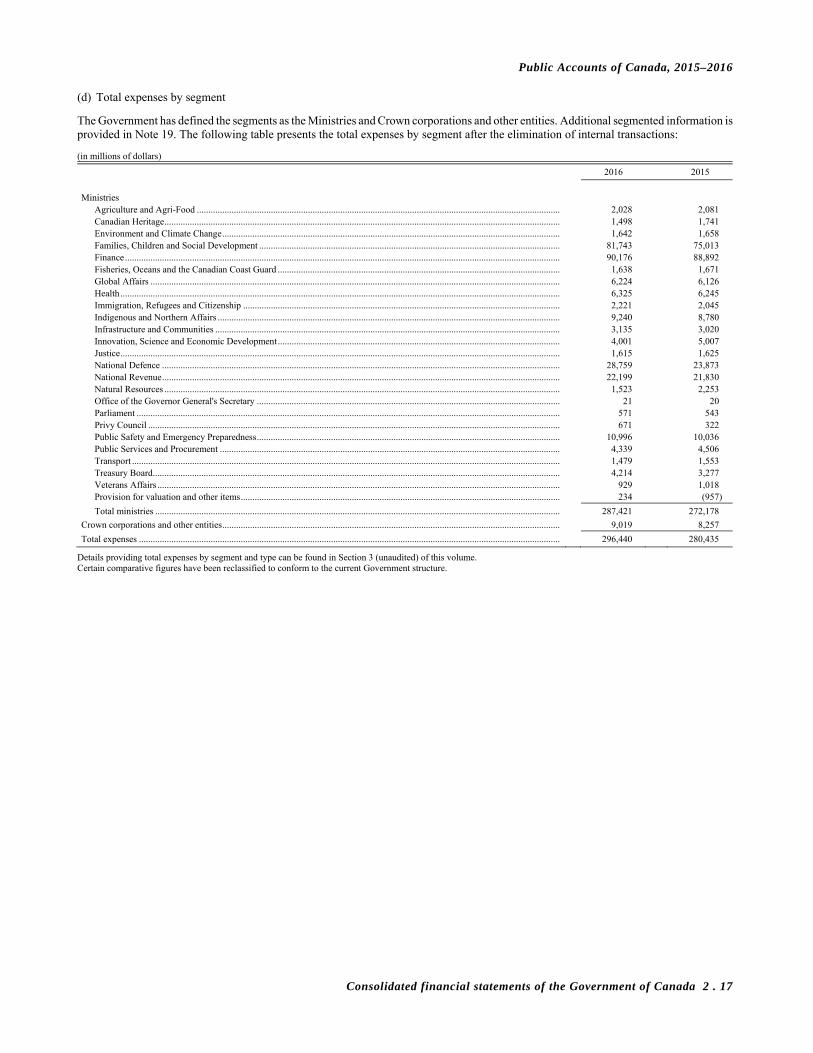
Public Accounts of Canada, 2015–2016
Consolidated financial statements of the Government of Canada 2 . 17
(d) Total expenses by segment
The Government has defined the segments as the Ministries and Crown corporations and other entities. Additional segmented information is provided in Note 19. The following table presents the total expenses by segment after the elimination of internal transactions:
(in millions of dollars)
2016 2015
Ministries
Agriculture and Agri-Food ............................................................................................................................................................. 2,028 2,081 Canadian Heritage ........................................................................................................................................................................... 1,498 1,741 Environment and Climate Change .................................................................................................................................................. 1,642 1,658 Families, Children and Social Development .................................................................................................................................. 81,743 75,013 Finance ............................................................................................................................................................................................ 90,176 88,892 Fisheries, Oceans and the Canadian Coast Guard .......................................................................................................................... 1,638 1,671 Global Affairs ................................................................................................................................................................................. 6,224 6,126 Health .............................................................................................................................................................................................. 6,325 6,245 Immigration, Refugees and Citizenship ......................................................................................................................................... 2,221 2,045 Indigenous and Northern Affairs .................................................................................................................................................... 9,240 8,780 Infrastructure and Communities ..................................................................................................................................................... 3,135 3,020 Innovation, Science and Economic Development .......................................................................................................................... 4,001 5,007 Justice .............................................................................................................................................................................................. 1,615 1,625 National Defence ............................................................................................................................................................................ 28,759 23,873 National Revenue ............................................................................................................................................................................ 22,199 21,830 Natural Resources ........................................................................................................................................................................... 1,523 2,253 Office of the Governor General's Secretary ................................................................................................................................... 21 20 Parliament ....................................................................................................................................................................................... 571 543 Privy Council .................................................................................................................................................................................. 671 322 Public Safety and Emergency Preparedness ................................................................................................................................... 10,996 10,036 Public Services and Procurement ................................................................................................................................................... 4,339 4,506 Transport ......................................................................................................................................................................................... 1,479 1,553 Treasury Board................................................................................................................................................................................ 4,214 3,277 Veterans Affairs .............................................................................................................................................................................. 929 1,018 Provision for valuation and other items .......................................................................................................................................... 234 (957)
Total ministries ............................................................................................................................................................................... 287,421 272,178
Crown corporations and other entities .................................................................................................................................................. 9,019 8,257
Total expenses ...................................................................................................................................................................................... 296,440 280,435
Details providing total expenses by segment and type can be found in Section 3 (unaudited) of this volume. Certain comparative figures have been reclassified to conform to the current Government structure.
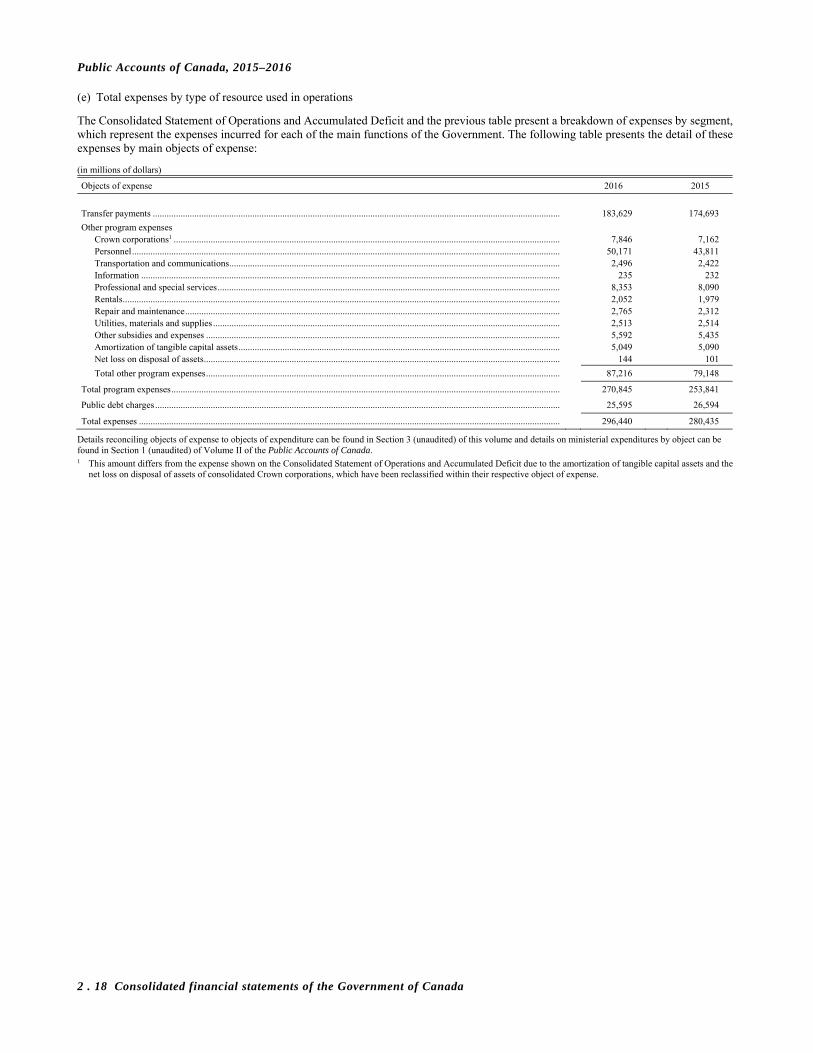
Public Accounts of Canada, 2015–2016
2 . 18 Consolidated financial statements of the Government of Canada
(e) Total expenses by type of resource used in operations
The Consolidated Statement of Operations and Accumulated Deficit and the previous table present a breakdown of expenses by segment, which represent the expenses incurred for each of the main functions of the Government. The following table presents the detail of these expenses by main objects of expense:
(in millions of dollars)
Objects of expense 2016 2015
Transfer payments ................................................................................................................................................................................ 183,629 174,693
Other program expenses Crown corporations1 ....................................................................................................................................................................... 7,846 7,162 Personnel ......................................................................................................................................................................................... 50,171 43,811 Transportation and communications ............................................................................................................................................... 2,496 2,422 Information ..................................................................................................................................................................................... 235 232 Professional and special services .................................................................................................................................................... 8,353 8,090 Rentals ............................................................................................................................................................................................. 2,052 1,979 Repair and maintenance .................................................................................................................................................................. 2,765 2,312 Utilities, materials and supplies ...................................................................................................................................................... 2,513 2,514 Other subsidies and expenses ......................................................................................................................................................... 5,592 5,435 Amortization of tangible capital assets ........................................................................................................................................... 5,049 5,090 Net loss on disposal of assets .......................................................................................................................................................... 144 101
Total other program expenses ......................................................................................................................................................... 87,216 79,148
Total program expenses ........................................................................................................................................................................ 270,845 253,841
Public debt charges ............................................................................................................................................................................... 25,595 26,594
Total expenses ...................................................................................................................................................................................... 296,440 280,435
Details reconciling objects of expense to objects of expenditure can be found in Section 3 (unaudited) of this volume and details on ministerial expenditures by object can be found in Section 1 (unaudited) of Volume II of the Public Accounts of Canada. 1 This amount differs from the expense shown on the Consolidated Statement of Operations and Accumulated Deficit due to the amortization of tangible capital assets and the
net loss on disposal of assets of consolidated Crown corporations, which have been reclassified within their respective object of expense.
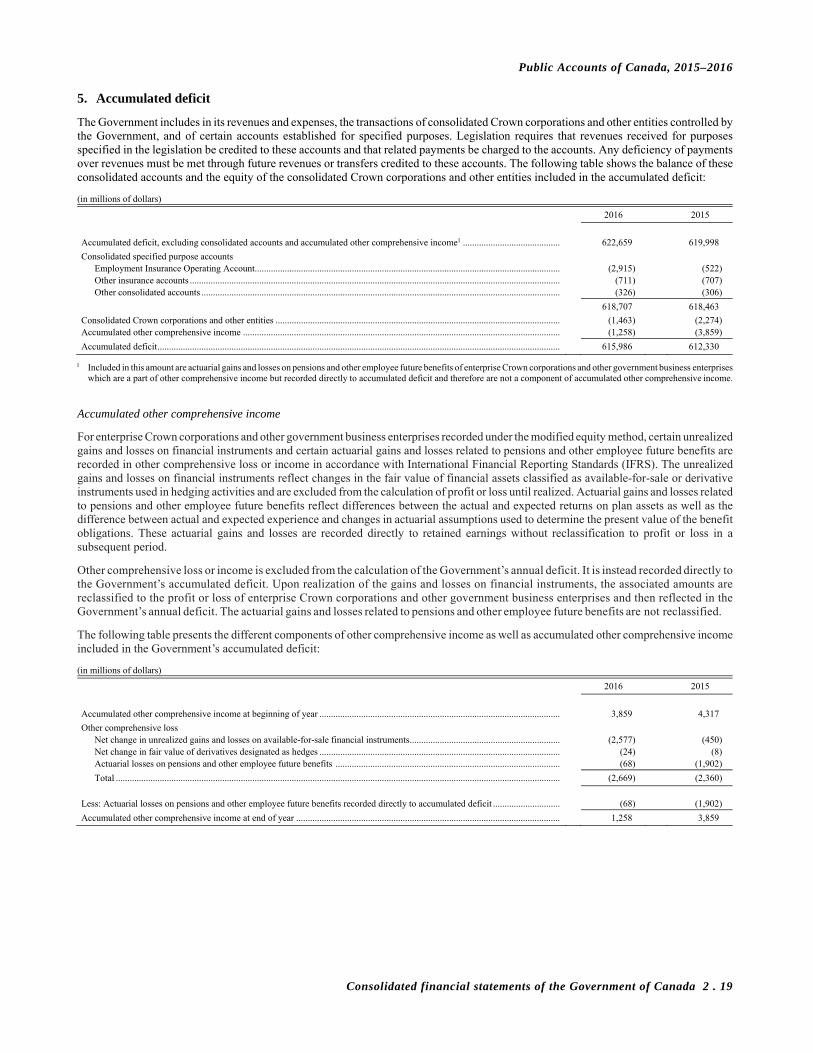
Public Accounts of Canada, 2015–2016
Consolidated financial statements of the Government of Canada 2 . 19
5. Accumulated deficit
The Government includes in its revenues and expenses, the transactions of consolidated Crown corporations and other entities controlled by the Government, and of certain accounts established for specified purposes. Legislation requires that revenues received for purposes specified in the legislation be credited to these accounts and that related payments be charged to the accounts. Any deficiency of payments over revenues must be met through future revenues or transfers credited to these accounts. The following table shows the balance of these consolidated accounts and the equity of the consolidated Crown corporations and other entities included in the accumulated deficit:
(in millions of dollars)
2016 2015
Accumulated deficit, excluding consolidated accounts and accumulated other comprehensive income1 .......................................... 622,659 619,998
Consolidated specified purpose accounts Employment Insurance Operating Account.................................................................................................................................... (2,915) (522) Other insurance accounts ................................................................................................................................................................ (711) (707) Other consolidated accounts ........................................................................................................................................................... (326) (306)
618,707 618,463
Consolidated Crown corporations and other entities ........................................................................................................................... (1,463) (2,274) Accumulated other comprehensive income ......................................................................................................................................... (1,258) (3,859)
Accumulated deficit .............................................................................................................................................................................. 615,986 612,330
1 Included in this amount are actuarial gains and losses on pensions and other employee future benefits of enterprise Crown corporations and other government business enterprises which are a part of other comprehensive income but recorded directly to accumulated deficit and therefore are not a component of accumulated other comprehensive income.
Accumulated other comprehensive income
For enterprise Crown corporations and other government business enterprises recorded under the modified equity method, certain unrealized gains and losses on financial instruments and certain actuarial gains and losses related to pensions and other employee future benefits are recorded in other comprehensive loss or income in accordance with International Financial Reporting Standards (IFRS). The unrealized gains and losses on financial instruments reflect changes in the fair value of financial assets classified as available-for-sale or derivative instruments used in hedging activities and are excluded from the calculation of profit or loss until realized. Actuarial gains and losses related to pensions and other employee future benefits reflect differences between the actual and expected returns on plan assets as well as the difference between actual and expected experience and changes in actuarial assumptions used to determine the present value of the benefit obligations. These actuarial gains and losses are recorded directly to retained earnings without reclassification to profit or loss in a subsequent period.
Other comprehensive loss or income is excluded from the calculation of the Government’s annual deficit. It is instead recorded directly to the Government’s accumulated deficit. Upon realization of the gains and losses on financial instruments, the associated amounts are reclassified to the profit or loss of enterprise Crown corporations and other government business enterprises and then reflected in the Government’s annual deficit. The actuarial gains and losses related to pensions and other employee future benefits are not reclassified.
The following table presents the different components of other comprehensive income as well as accumulated other comprehensive income included in the Government’s accumulated deficit:
(in millions of dollars)
2016 2015
Accumulated other comprehensive income at beginning of year ........................................................................................................ 3,859 4,317
Other comprehensive loss Net change in unrealized gains and losses on available-for-sale financial instruments ................................................................. (2,577) (450) Net change in fair value of derivatives designated as hedges ........................................................................................................ (24) (8) Actuarial losses on pensions and other employee future benefits ................................................................................................. (68) (1,902)
Total ................................................................................................................................................................................................ (2,669) (2,360)
Less: Actuarial losses on pensions and other employee future benefits recorded directly to accumulated deficit ............................. (68) (1,902)
Accumulated other comprehensive income at end of year .................................................................................................................. 1,258 3,859

Public Accounts of Canada, 2015–2016
2 . 20 Consolidated financial statements of the Government of Canada
6. Environmental liabilities
(a) Remediation of contaminated sites
The Government has developed a “Federal Approach to Contaminated Sites” which incorporates a risk-based approach to the management of contaminated sites. Under this approach the Government has inventoried the contaminated sites on federal lands that have been identified, allowing them to be classified, managed and recorded in a consistent manner. This systematic approach aids in the identification of the high risk sites in order to allocate limited resources to those sites which pose the highest risk to the environment and human health.
The Government has identified approximately 7,900 sites (8,600 sites in 2015) where contamination may exist and assessment, remediation and monitoring may be required. Of these, the Government has identified approximately 2,400 sites (2,400 sites in 2015), where action is possible and for which a gross liability of $5,954 million ($5,810 million in 2015) has been recorded. This liability estimate has been determined based on site assessments performed by scientific/engineering contractors. In 2016, a statistical model was developed to estimate the liability for a group of unassessed sites based on a projection of the number of sites that will proceed to remediation and applying current and historical costs. As a result, there are 4,300 unassessed sites where a liability estimate of $320 million has been recorded prospectively in 2016. These two estimates combined, totalling $6,274 million ($5,810 million in 2015), represents the Government’s best estimate of the costs required to remediate sites to the current minimum standard for its use prior to contamination, based on information available on March 31.
For the remaining 1,200 sites, no liability for remediation has been recognized. Some of these sites are at various stages of testing and evaluation and if remediation is required, liabilities will be reported as soon as a reasonable estimate can be determined. For other sites, the Government does not expect to give up any future economic benefits (there is likely no significant environmental impact or human health threats). These sites will be re-examined and a liability for remediation will be recognized if future economic benefits will be given up.
The following table presents the total estimated amounts of these liabilities by nature and source, the associated expected recoveries and the total undiscounted future expenditures as at March 31, 2016 and March 31, 2015. When the liability estimate is based on a future cash requirement, the Consolidated Revenue Fund lending rate applicable to loans with similar terms to maturity has been used to discount the estimated future expenditures. March 2016 rates range from 0.62 per cent for 2 year term to 2.13 per cent for a 25 or greater year term.
(in millions of dollars)
2016 2015
Estimated Estimated Number total Number total of Estimated undiscounted Estimated of Estimated undiscounted Estimated sites liability expenditures recoveries sites liability expenditures recoveries
Former mineral exploration sites1........................... 111 3,160 5,954 31 131 3,083 5,048 17 Radioactive material2 .............................................. 5 1,116 1,298 – 5 1,016 1,049 – Military and former military sites3 ......................... 288 574 594 – 177 559 581 – Fuel related practices4 ............................................. 1,203 385 393 – 645 358 366 – Marine facilities/aquatic sites5 ................................ 3,294 290 301 – 819 278 291 – Landfill/waste sites6 ................................................ 938 359 370 – 375 211 220 – Other7 ...................................................................... 900 390 393 – 261 305 309 –
Total ........................................................................ 6,739 6,274 9,303 31 2,413 5,810 7,864 17
1 Contamination associated with former mine activities, e.g. heavy metals, petroleum hydrocarbons, etc. Sites often have multiple sources of contamination. 2 Contamination associated with former nuclear operations, e.g. low-level radioactive waste, radioactive isotopes. 3 Contamination associated with the operations of military and former military sites where activities such as fuel handling and storage activities, waste sites, metals/PCB-based
paint used on buildings resulted in former or accidental contamination, e.g. petroleum hydrocarbons, PCBs, heavy metals. Sites often have multiple sources of contamination. 4 Contamination primarily associated with fuel storage and handling, e.g., accidental spills related to fuel storage tanks or former fuel handling practices, e.g. petroleum
hydrocarbons, polyaromatic hydrocarbons and BTEX (benzene, toluene, ethylbenzene and xylenes). 5 Contamination associated with the operations of marine assets, e.g., port facilities, harbours, navigation systems, light stations, hydrometric stations, where activities such as
fuel storage/handling, use of metal based paint on light stations resulted in former or accidental contamination, e.g. metals, petroleum hydrocarbons, polyaromatic hydrocarbons and other organic contaminants. Sites often have multiple sources of contamination.
6 Contamination associated with former landfill/waste site or leaching from materials deposited in the landfill/waste site, e.g. metals, petroleum hydrocarbons, BTEX, other organic contaminants, etc.
7 Contamination from other sources, e.g. use of pesticides, herbicides, fertilizers at agricultural sites; use of PCBs, firefighting training areas, firing ranges and training facilities, the operations of assets such as airports, railways and roads where activities such as, fuel storage/handling, waste sites, and chemical storage areas resulted in former or accidental contamination, e.g. metals, petroleum hydrocarbons, polyaromatic hydrocarbons, BTEX and other organic contaminants.
Also during the year 1,200 sites (1,200 sites in 2015) were closed as they were either remediated or assessed to confirm that they no longer meet all the criteria required to record a liability for contaminated sites.

Public Accounts of Canada, 2015–2016
Consolidated financial statements of the Government of Canada 2 . 21
Asset retirement obligations
The asset retirement obligation is $6,767 million ($6,502 million in 2015) of which Atomic Energy of Canada Ltd. has recorded $6,763 million ($6,487 million in 2015) for nuclear facility decommissioning. In 2016, an amount of $233 million ($107 million in 2015) for the revisions in estimate and timing of expenditures was recorded. Also, an amount of $251 million ($250 million in 2015) was recognized to account for the unwinding of discount and the effect of change in discount rate and an amount of $219 million ($200 million in 2015) was recorded to settle the liabilities.
(c) Other environmental liabilities
The Government has identified approximately 893 UXO (918 in 2015) suspected sites for which clearance action may be necessary. Of these sites, 61 (57 in 2015) are confirmed UXO affected sites. Based on the Government’s best estimates, a liability of $272 million ($1.3 million in 2015) has been recorded for clearance action on 10 (5 in 2015) of the confirmed UXO sites. Remediation has been done on 14 of the sites and they will be closed in the next fiscal year. The remaining 869 suspect sites are currently in the assessment stage and a reasonable estimate cannot yet be determined. Of these sites, the obligation for clearance action is likely for 61 sites, indeterminable for 667 sites and unlikely for 141 sites.
The Government’s ongoing efforts to assess contaminated sites, asset retirement obligations and UXO affected sites may result in additional environmental liabilities.
7. Unmatured debt
Unmatured debt includes: (in millions of dollars)
2016 2015
Market debt Payable in Canadian currency......................................................................................................................................................... 647,244 629,233 Payable in foreign currencies .......................................................................................................................................................... 22,482 20,267
Total .......................................................................................................................................................................................... 669,726 649,500
Unamortized discounts and premiums on market debt ........................................................................................................................ 5,047 4,296
Market debt including unamortized discounts and premiums ............................................................................................................. 674,773 653,796
Cross currency swap revaluations ........................................................................................................................................................ 8,391 6,669 Obligation related to capital leases ....................................................................................................................................................... 3,477 3,710 Other unmatured debt ........................................................................................................................................................................... 1,570 1,005
Total unmatured debt ............................................................................................................................................................................ 688,211 665,180
Unamortized discounts result from Treasury bills and Canada bills which are issued at a discount in lieu of interest. Discounts or premiums also result from the Government’s bond buyback program and from issuance of market debt when the face value of the instrument issued differs from the proceeds received. The unamortized portion represents the amount of premium and discount that has not yet been recorded to public debt charges.
At March 31, 2016, the fair value of market debt including unamortized discounts and premiums is $742,648 million ($731,609 million in 2015). For marketable bonds denominated in Canadian dollars and foreign currencies, treasury bills issued in Canadian dollars, Canada bills and medium-term notes issued in US dollars and Euros, fair values are established using market quotes or the discounted cash flow calculated using year-end market interest and exchange rates.
The Government has entered into individual cross-currency swap contracts with various counterparties. Terms and conditions associated with these outstanding contracts are established using International Swaps and Derivatives Association (ISDA) master agreements, which are in place with each counterparty. Cross-currency swaps are used primarily to fund foreign-denominated asset levels in the foreign exchange accounts.
Included in Cross-currency swap revaluations is $757 million ($1,029 million at March 31, 2015) related to individual cross-currency swap contracts that have a net foreign-exchange asset value to the Government upon revaluation and $9,148 million ($7,698 million at March 31, 2015) relating to individual cross-currency swap contracts that have a net foreign-exchange liability value, resulting in an overall cross-currency swap net liability revaluation of $8,391 million ($6,669 million at March 31, 2015).
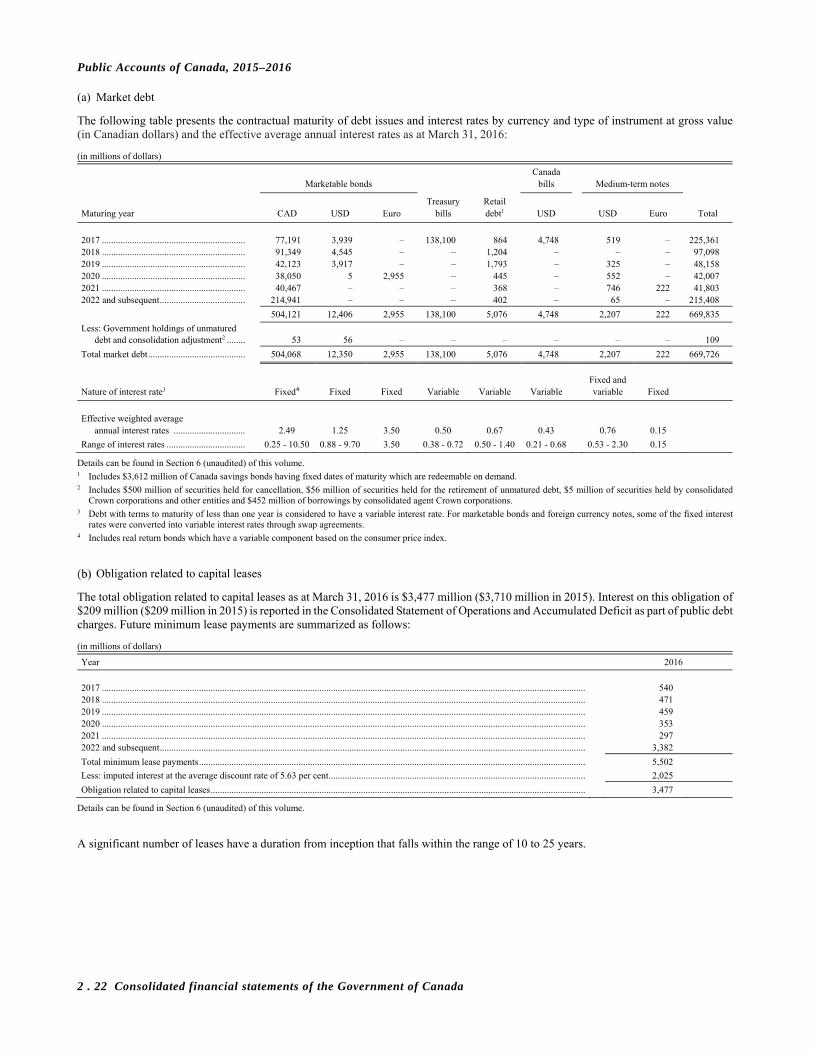
Public Accounts of Canada, 2015–2016
2 . 22 Consolidated financial statements of the Government of Canada
(a) Market debt
The following table presents the contractual maturity of debt issues and interest rates by currency and type of instrument at gross value (in Canadian dollars) and the effective average annual interest rates as at March 31, 2016:
(in millions of dollars)
Canada Marketable bonds bills Medium-term notes
Treasury Retail Maturing year CAD USD Euro bills debt1 USD USD Euro Total
2017 .............................................................. 77,191 3,939 – 138,100 864 4,748 519 – 225,361 2018 .............................................................. 91,349 4,545 – – 1,204 – – – 97,098 2019 .............................................................. 42,123 3,917 – – 1,793 – 325 – 48,158 2020 .............................................................. 38,050 5 2,955 – 445 – 552 – 42,007 2021 .............................................................. 40,467 – – – 368 – 746 222 41,803 2022 and subsequent ..................................... 214,941 – – – 402 – 65 – 215,408
504,121 12,406 2,955 138,100 5,076 4,748 2,207 222 669,835
Less: Government holdings of unmatured debt and consolidation adjustment2 ........ 53 56 – – – – – – 109
Total market debt .......................................... 504,068 12,350 2,955 138,100 5,076 4,748 2,207 222 669,726
Fixed and Nature of interest rate3 Fixed⁴ Fixed Fixed Variable Variable Variable variable Fixed
Effective weighted average
annual interest rates ............................... 2.49 1.25 3.50 0.50 0.67 0.43 0.76 0.15
Range of interest rates .................................. 0.25 - 10.50 0.88 - 9.70 3.50 0.38 - 0.72 0.50 - 1.40 0.21 - 0.68 0.53 - 2.30 0.15
Details can be found in Section 6 (unaudited) of this volume. 1 Includes $3,612 million of Canada savings bonds having fixed dates of maturity which are redeemable on demand. 2 Includes $500 million of securities held for cancellation, $56 million of securities held for the retirement of unmatured debt, $5 million of securities held by consolidated
Crown corporations and other entities and $452 million of borrowings by consolidated agent Crown corporations. 3 Debt with terms to maturity of less than one year is considered to have a variable interest rate. For marketable bonds and foreign currency notes, some of the fixed interest
rates were converted into variable interest rates through swap agreements. 4 Includes real return bonds which have a variable component based on the consumer price index.
Obligation related to capital leases
The total obligation related to capital leases as at March 31, 2016 is $3,477 million ($3,710 million in 2015). Interest on this obligation of $209 million ($209 million in 2015) is reported in the Consolidated Statement of Operations and Accumulated Deficit as part of public debt charges. Future minimum lease payments are summarized as follows:
(in millions of dollars)
Year 2016
2017 ................................................................................................................................................................................................................. 540 2018 ................................................................................................................................................................................................................. 471 2019 ................................................................................................................................................................................................................. 459 2020 ................................................................................................................................................................................................................. 353 2021 ................................................................................................................................................................................................................. 297 2022 and subsequent ........................................................................................................................................................................................ 3,382
Total minimum lease payments ....................................................................................................................................................................... 5,502
Less: imputed interest at the average discount rate of 5.63 per cent ............................................................................................................... 2,025
Obligation related to capital leases .................................................................................................................................................................. 3,477
Details can be found in Section 6 (unaudited) of this volume.
A significant number of leases have a duration from inception that falls within the range of 10 to 25 years.
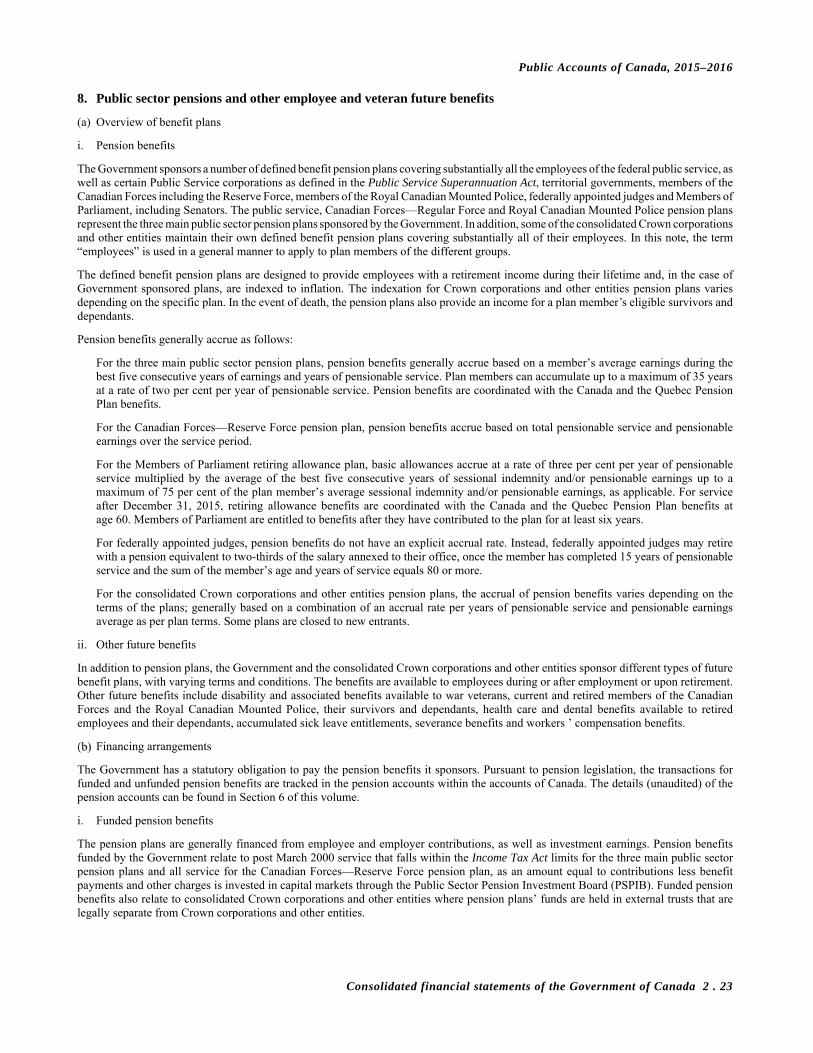
Public Accounts of Canada, 2015–2016
Consolidated financial statements of the Government of Canada 2 . 23
8. Public sector pensions and other employee and veteran future benefits
(a) Overview of benefit plans
i. Pension benefits
The Government sponsors a number of defined benefit pension plans covering substantially all the employees of the federal public service, as well as certain Public Service corporations as defined in the Public Service Superannuation Act, territorial governments, members of the Canadian Forces including the Reserve Force, members of the Royal Canadian Mounted Police, federally appointed judges and Members of Parliament, including Senators. The public service, Canadian Forces—Regular Force and Royal Canadian Mounted Police pension plans represent the three main public sector pension plans sponsored by the Government. In addition, some of the consolidated Crown corporations and other entities maintain their own defined benefit pension plans covering substantially all of their employees. In this note, the term “employees” is used in a general manner to apply to plan members of the different groups.
The defined benefit pension plans are designed to provide employees with a retirement income during their lifetime and, in the case of Government sponsored plans, are indexed to inflation. The indexation for Crown corporations and other entities pension plans varies depending on the specific plan. In the event of death, the pension plans also provide an income for a plan member’s eligible survivors and dependants.
Pension benefits generally accrue as follows:
For the three main public sector pension plans, pension benefits generally accrue based on a member’s average earnings during the best five consecutive years of earnings and years of pensionable service. Plan members can accumulate up to a maximum of 35 years at a rate of two per cent per year of pensionable service. Pension benefits are coordinated with the Canada and the Quebec Pension Plan benefits.
For the Canadian Forces—Reserve Force pension plan, pension benefits accrue based on total pensionable service and pensionable earnings over the service period.
For the Members of Parliament retiring allowance plan, basic allowances accrue at a rate of three per cent per year of pensionable service multiplied by the average of the best five consecutive years of sessional indemnity and/or pensionable earnings up to a maximum of 75 per cent of the plan member’s average sessional indemnity and/or pensionable earnings, as applicable. For service after December 31, 2015, retiring allowance benefits are coordinated with the Canada and the Quebec Pension Plan benefits at age 60. Members of Parliament are entitled to benefits after they have contributed to the plan for at least six years.
For federally appointed judges, pension benefits do not have an explicit accrual rate. Instead, federally appointed judges may retire with a pension equivalent to two-thirds of the salary annexed to their office, once the member has completed 15 years of pensionable service and the sum of the member’s age and years of service equals 80 or more.
For the consolidated Crown corporations and other entities pension plans, the accrual of pension benefits varies depending on the terms of the plans; generally based on a combination of an accrual rate per years of pensionable service and pensionable earnings average as per plan terms. Some plans are closed to new entrants.
ii. Other future benefits
In addition to pension plans, the Government and the consolidated Crown corporations and other entities sponsor different types of future benefit plans, with varying terms and conditions. The benefits are available to employees during or after employment or upon retirement. Other future benefits include disability and associated benefits available to war veterans, current and retired members of the Canadian Forces and the Royal Canadian Mounted Police, their survivors and dependants, health care and dental benefits available to retired employees and their dependants, accumulated sick leave entitlements, severance benefits and workers ’ compensation benefits.
Financing arrangements
The Government has a statutory obligation to pay the pension benefits it sponsors. Pursuant to pension legislation, the transactions for funded and unfunded pension benefits are tracked in the pension accounts within the accounts of Canada. The details (unaudited) of the pension accounts can be found in Section 6 of this volume.
i. Funded pension benefits
The pension plans are generally financed from employee and employer contributions, as well as investment earnings. Pension benefits funded by the Government relate to post March 2000 service that falls within the Income Tax Act limits for the three main public sector pension plans and all service for the Canadian Forces—Reserve Force pension plan, as an amount equal to contributions less benefit payments and other charges is invested in capital markets through the Public Sector Pension Investment Board (PSPIB). Funded pension benefits also relate to consolidated Crown corporations and other entities where pension plans’ funds are held in external trusts that are legally separate from Crown corporations and other entities.
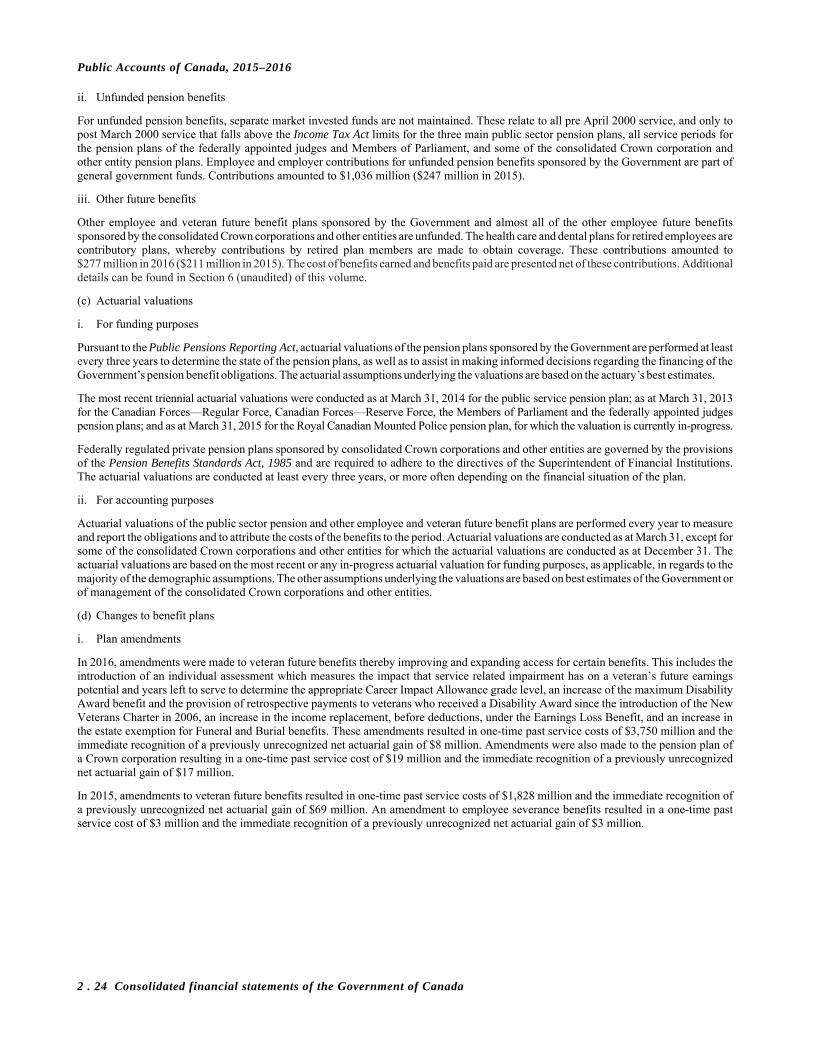
Public Accounts of Canada, 2015–2016
2 . 24 Consolidated financial statements of the Government of Canada
ii. Unfunded pension benefits
For unfunded pension benefits, separate market invested funds are not maintained. These relate to all pre April 2000 service, and only to post March 2000 service that falls above the Income Tax Act limits for the three main public sector pension plans, all service periods for the pension plans of the federally appointed judges and Members of Parliament, and some of the consolidated Crown corporation and other entity pension plans. Employee and employer contributions for unfunded pension benefits sponsored by the Government are part of general government funds. Contributions amounted to $1,036 million ($247 million in 2015).
iii. Other future benefits
Other employee and veteran future benefit plans sponsored by the Government and almost all of the other employee future benefits sponsored by the consolidated Crown corporations and other entities are unfunded. The health care and dental plans for retired employees are contributory plans, whereby contributions by retired plan members are made to obtain coverage. These contributions amounted to $277 million in 2016 ($211 million in 2015). The cost of benefits earned and benefits paid are presented net of these contributions. Additional details can be found in Section 6 (unaudited) of this volume.
(c) Actuarial valuations
i. For funding purposes
Pursuant to the Public Pensions Reporting Act, actuarial valuations of the pension plans sponsored by the Government are performed at least every three years to determine the state of the pension plans, as well as to assist in making informed decisions regarding the financing of the Government’s pension benefit obligations. The actuarial assumptions underlying the valuations are based on the actuary’s best estimates.
The most recent triennial actuarial valuations were conducted as at March 31, 2014 for the public service pension plan; as at March 31, 2013 for the Canadian Forces—Regular Force, Canadian Forces—Reserve Force, the Members of Parliament and the federally appointed judges pension plans; and as at March 31, 2015 for the Royal Canadian Mounted Police pension plan, for which the valuation is currently in-progress.
Federally regulated private pension plans sponsored by consolidated Crown corporations and other entities are governed by the provisions of the Pension Benefits Standards Act, 1985 and are required to adhere to the directives of the Superintendent of Financial Institutions. The actuarial valuations are conducted at least every three years, or more often depending on the financial situation of the plan.
ii. For accounting purposes
Actuarial valuations of the public sector pension and other employee and veteran future benefit plans are performed every year to measure and report the obligations and to attribute the costs of the benefits to the period. Actuarial valuations are conducted as at March 31, except for some of the consolidated Crown corporations and other entities for which the actuarial valuations are conducted as at December 31. The actuarial valuations are based on the most recent or any in-progress actuarial valuation for funding purposes, as applicable, in regards to the majority of the demographic assumptions. The other assumptions underlying the valuations are based on best estimates of the Government or of management of the consolidated Crown corporations and other entities.
(d) Changes to benefit plans
i. Plan amendments
In 2016, amendments were made to veteran future benefits thereby improving and expanding access for certain benefits. This includes the introduction of an individual assessment which measures the impact that service related impairment has on a veteran’s future earnings potential and years left to serve to determine the appropriate Career Impact Allowance grade level, an increase of the maximum Disability Award benefit and the provision of retrospective payments to veterans who received a Disability Award since the introduction of the New Veterans Charter in 2006, an increase in the income replacement, before deductions, under the Earnings Loss Benefit, and an increase in the estate exemption for Funeral and Burial benefits. These amendments resulted in one-time past service costs of $3,750 million and the immediate recognition of a previously unrecognized net actuarial gain of $8 million. Amendments were also made to the pension plan of a Crown corporation resulting in a one-time past service cost of $19 million and the immediate recognition of a previously unrecognized net actuarial gain of $17 million.
In 2015, amendments to veteran future benefits resulted in one-time past service costs of $1,828 million and the immediate recognition of a previously unrecognized net actuarial gain of $69 million. An amendment to employee severance benefits resulted in a one-time past service cost of $3 million and the immediate recognition of a previously unrecognized net actuarial gain of $3 million.

Public Accounts of Canada, 2015–2016
Consolidated financial statements of the Government of Canada 2 . 25
ii. Plan curtailments
Beginning in 2011, the accumulation of severance benefits for voluntary departures ceased for certain employee groups. Employees subject to these changes are being given the option to be paid the full or partial value of benefits earned to date or collect the full or remaining value of benefits upon departure from the public service. The curtailments this year resulted in the immediate recognition of a previously unrecognized net actuarial loss of $2 million (one-time past service cost reduction of $3 million and immediate recognition of a previously unrecognized net actuarial gain of $37 million in 2015), representing the portion related to the obligation for employees subject to the curtailments.
In 2015, former employees of Atomic Energy of Canada Limited (CANDU Reactor Division) ceased to be employed in the public service and became employed by SNC-Lavalin Group Inc. The impact of this curtailment was a one-time past service cost of $51 million and the immediate recognition of a previously unrecognized net actuarial gain of $6 million.
iii. Plan settlements
In 2016, payments of $63 million ($643 million in 2015) were made to employees affected by the curtailments of severance benefits who opted to cash out the full or partial value of their accumulated benefits. The settlements resulted in the immediate recognition of a previously unrecognized net actuarial loss of $28 million (one-time past service cost reduction of $49 million and immediate recognition of a previously unrecognized net actuarial gain of $101 million in 2015), representing the portion related to the obligation for employees subject to the settlements.
(e) Net future benefit liabilities
The accrued benefit obligations in respect of public sector pension and other employee and veteran future benefit plans are presented net of pension assets and unrecognized net actuarial gain or loss, as well as contributions and benefits paid by some of the consolidated Crown corporations and other entities after their measurement date of December 31 up to March 31, in the Consolidated Statement of Financial Position. The details are as follows:
i. Accrued benefit obligations
The changes in the accrued benefit obligations during the year were as follows:
(in millions of dollars)
2016 2015
Pension benefits Pension benefits
Other Other future future Funded Unfunded Total benefits Funded Unfunded Total benefits
Accrued benefit obligations at beginning of year ........................... 109,375 163,088 272,463 106,263 97,912 156,452 254,364 82,170
Benefits earned........................................................................... 6,510 297 6,807 4,452 6,332 270 6,602 2,844 Interest on average accrued benefit obligations ........................ 4,781 7,412 12,193 2,549 4,963 7,597 12,560 2,857 Benefits paid .............................................................................. (2,623) (8,813) (11,436) (4,617) (2,282) (8,613) (10,895) (5,062) Administrative expenses ............................................................ (87) (104) (191) (70) (81) (105) (186) (66) Net transfers to other plans ........................................................ (575) (106) (681) – (559) (114) (673) – Plan amendments ....................................................................... 19 – 19 3,750 – – – 1,831 Plan curtailments ........................................................................ – – – – (40) (11) (51) (3) Plan settlements ......................................................................... – – – – – – – (49) Actuarial losses .......................................................................... 661 3,891 4,552 8,363 3,130 7,612 10,742 21,741
Accrued benefit obligations at end of year ...................................... 118,061 165,665 283,726 120,690 109,375 163,088 272,463 106,263
Details can be found in Section 6 (unaudited) of this volume.

Public Accounts of Canada, 2015–2016
2 . 26 Consolidated financial statements of the Government of Canada
ii. Pension assets
Pension assets include investments held by the PSPIB that are valued at market-related value; consolidated Crown corporations and other entities’ investments, the majority of which are valued at fair value; and contributions receivable from employees for past service buyback elections.
The changes in pension assets during the year were as follows:
(in millions of dollars)
2016 2015
Funded Other Funded Other pension future pension future benefits benefits benefits benefits
Investments at beginning of year ............................................................................................................. 110,760 3 92,913 5
Expected return on average value of investments ............................................................................. 4,899 – 4,764 – Contributions
Employees .................................................................................................................................... 2,718 – 2,553 – Public Service corporations, territorial governments and Crown
corporations and other entities ............................................................................................... 360 1 420 1 Government .................................................................................................................................. 3,860 – 4,161 –
Benefits paid, transfers and others ..................................................................................................... (3,183) (2) (2,736) (3) Actuarial gains ................................................................................................................................... 2,278 – 8,685 –
Investments at end of year ....................................................................................................................... 121,692 2 110,760 3
Contributions receivable from employees for past service ..................................................................... 601 – 587 –
Total pension assets at end of year .......................................................................................................... 122,293 2 111,347 3
Details can be found in Section 6 (unaudited) of this volume.
No actuarial gain ($2,778 million in 2015) was incorporated in the market-related value of the investments to adjust for the limit of plus or minus 10 per cent in the difference between the market-related value and the market value of the investments at the end of the year.
At March 31, 2016, the market value of the investments is $126,561 million ($122,023 million in 2015). The actual rate of return of investments calculated on a time-weighted basis was 1.1 per cent (14.9 per cent in 2015) during the year.
iii. Net future benefit liabilities
A reconciliation of the accrued benefit obligations to the amounts of net future benefit liabilities follows:
(in millions of dollars)
2016 2015
Pension benefits Pension benefits
Other Other future future Funded Unfunded Total benefits Funded Unfunded Total benefits
Accrued benefit obligations ............................................................ 118,061 165,665 283,726 120,690 109,375 163,088 272,463 106,263 Less: Pension assets ......................................................................... 122,293 – 122,293 2 111,347 – 111,347 3
Subtotal ...................................................................................... (4,232) 165,665 161,433 120,688 (1,972) 163,088 161,116 106,260
Plus: Unrecognized net actuarial gain (less loss) ............................ 7,752 (18,557) (10,805) (35,005) 6,475 (16,147) (9,672) (30,118) Less: Contributions after measurement date up to March 31 .......... 40 – 40 – 43 – 43 – Less: Benefits paid after measurement date up to March 31 .......... – – – 2 – – – 2
Net future benefit liabilities ............................................................. 3,480 147,108 150,588 85,681 4,460 146,941 151,401 76,140
The net future benefit liabilities were recognized and presented in the Consolidated Statement of Financial Position as follows:
Public sector pension liabilities ....................................................... 5,119 147,108 152,227 – 5,723 146,941 152,664 – Other employee and veteran future benefit liabilities ..................... – – – 85,681 – – – 76,140
Total pensions and other future benefit liabilities ..................... 5,119 147,108 152,227 85,681 5,723 146,941 152,664 76,140
Less: Public sector pension assets ................................................... 1,639 – 1,639 – 1,263 – 1,263 –
Net future benefit liabilities ............................................................. 3,480 147,108 150,588 85,681 4,460 146,941 151,401 76,140
Details can be found in Section 6 (unaudited) of this volume.

Public Accounts of Canada, 2015–2016
Consolidated financial statements of the Government of Canada 2 . 27
(f) Future benefit and interest expenses
The cost of public sector pension and other employee and veteran future benefit plans is comprised of benefit and interest expenses. Benefit expense of $16,648 million ($11,164 million in 2015) and interest expense of $9,843 million ($10,653 million in 2015) are included in the Consolidated Statement of Operations and Accumulated Deficit. More specifically, a benefit expense of $16,688 million ($11,144 million in 2015) is included in ministries expenses, an interest expense of $9,995 million ($10,748 million in 2015) is included in public debt charges and a balance of $192 million in benefit and interest expenses is included as a reduction ($75 million reduction in 2015) in Crown corporations’ expenses. The components of the benefit and interest expenses are as follows:
(in millions of dollars)
2016 2015
Pension benefits Pension benefits
Other Other future future Funded Unfunded Total benefits Funded Unfunded Total benefits
Benefit expense
Benefits earned, net of employee contributions ...................... 3,586 239 3,825 4,452 3,561 211 3,772 2,844 Actuarial (gains) losses recognized during the year ................ (338) 1,481 1,143 3,454 98 901 999 2,037 Plan amendments ..................................................................... 19 – 19 3,750 – – – 1,831 Plan curtailments ...................................................................... – – – – (40) (11) (51) (3) Plan settlements ....................................................................... – – – – – – – (49) Actuarial (gains) losses recognized following plan
amendments, curtailments and settlements ....................... (17) – (17) 22 (6) – (6) (210)
Total .............................................................................. 3,250 1,720 4,970 11,678 3,613 1,101 4,714 6,450
Interest expense
Interest on average accrued benefit obligations ...................... 4,781 7,412 12,193 2,549 4,963 7,597 12,560 2,857 Expected return on average market-related value of
investments ........................................................................ (4,899) – (4,899) – (4,764) – (4,764) –
Total .............................................................................. (118) 7,412 7,294 2,549 199 7,597 7,796 2,857
Details can be found in Section 6 (unaudited) of this volume.
(g) Actuarial assumptions
The assumptions used in the actuarial valuations for accounting purposes are based on the Government’s or the consolidated Crown corporations and other entities management’s best estimates of expected long-term experience and short-term forecasts, as well as the majority of the demographic assumptions underlying the most recent or any in-progress actuarial valuations for funding purposes. The assumptions include estimates of future inflation, interest rates, returns on investments, general wage increases, workforce composition, retirement rates and mortality rates.
The discount rates used to measure the present value of the accrued benefit obligations, as well as the costs of benefits earned, plan amendments, plan curtailments, plan settlements and the interest expense, for public sector pensions and other employee and veteran future benefits sponsored by the Government are as follows:
for funded pension benefits, the streamed expected rates of return on invested funds;
for unfunded pension benefits, the streamed weighted average of Government of Canada long-term bond rates; and
for other future benefits, the expected Government of Canada long-term bond rate at the valuation date.
The streamed weighted average of Government of Canada long-term bond rates is a calculated 20-year weighted moving average of Government of Canada long-term bond rates projected over time. The streamed rates take into account historical Government of Canada long-term bond rates and, over time, reflect expected Government of Canada long-term bond rates.
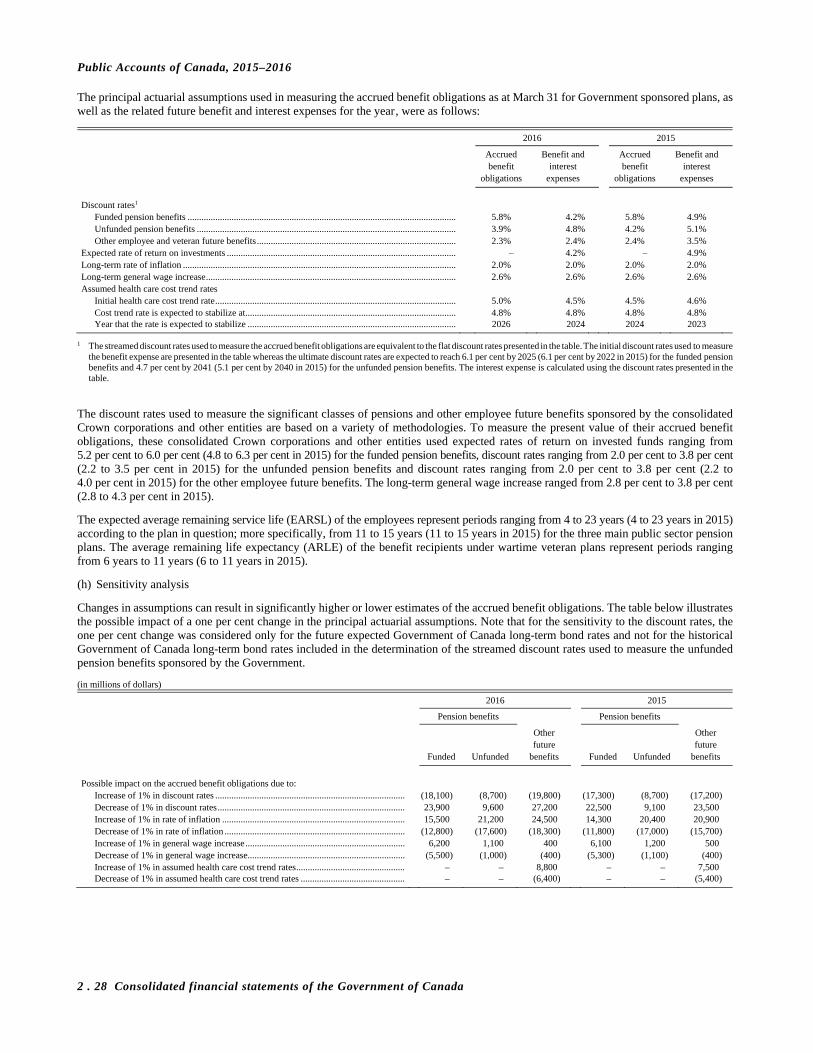
Public Accounts of Canada, 2015–2016
2 . 28 Consolidated financial statements of the Government of Canada
The principal actuarial assumptions used in measuring the accrued benefit obligations as at March 31 for Government sponsored plans, as well as the related future benefit and interest expenses for the year , were as follows:
2016 2015
Accrued Benefit and Accrued Benefit and benefit interest benefit interest obligations expenses obligations expenses
Discount rates1
Funded pension benefits .................................................................................................................... 5.8% 4.2% 5.8% 4.9% Unfunded pension benefits ................................................................................................................ 3.9% 4.8% 4.2% 5.1% Other employee and veteran future benefits ...................................................................................... 2.3% 2.4% 2.4% 3.5%
Expected rate of return on investments ................................................................................................... – 4.2% – 4.9% Long-term rate of inflation ...................................................................................................................... 2.0% 2.0% 2.0% 2.0% Long-term general wage increase ............................................................................................................ 2.6% 2.6% 2.6% 2.6% Assumed health care cost trend rates
Initial health care cost trend rate ........................................................................................................ 5.0% 4.5% 4.5% 4.6% Cost trend rate is expected to stabilize at ........................................................................................... 4.8% 4.8% 4.8% 4.8% Year that the rate is expected to stabilize .......................................................................................... 2026 2024 2024 2023
1 The streamed discount rates used to measure the accrued benefit obligations are equivalent to the flat discount rates presented in the table. The initial discount rates used to measure the benefit expense are presented in the table whereas the ultimate discount rates are expected to reach 6.1 per cent by 2025 (6.1 per cent by 2022 in 2015) for the funded pension benefits and 4.7 per cent by 2041 (5.1 per cent by 2040 in 2015) for the unfunded pension benefits. The interest expense is calculated using the discount rates presented in the table.
The discount rates used to measure the significant classes of pensions and other employee future benefits sponsored by the consolidated Crown corporations and other entities are based on a variety of methodologies. To measure the present value of their accrued benefit obligations, these consolidated Crown corporations and other entities used expected rates of return on invested funds ranging from 5.2 per cent to 6.0 per cent (4.8 to 6.3 per cent in 2015) for the funded pension benefits, discount rates ranging from 2.0 per cent to 3.8 per cent (2.2 to 3.5 per cent in 2015) for the unfunded pension benefits and discount rates ranging from 2.0 per cent to 3.8 per cent (2.2 to 4.0 per cent in 2015) for the other employee future benefits. The long-term general wage increase ranged from 2.8 per cent to 3.8 per cent (2.8 to 4.3 per cent in 2015).
The expected average remaining service life (EARSL) of the employees represent periods ranging from 4 to 23 years (4 to 23 years in 2015) according to the plan in question; more specifically, from 11 to 15 years (11 to 15 years in 2015) for the three main public sector pension plans. The average remaining life expectancy (ARLE) of the benefit recipients under wartime veteran plans represent periods ranging from 6 years to 11 years (6 to 11 years in 2015).
(h) Sensitivity analysis
Changes in assumptions can result in significantly higher or lower estimates of the accrued benefit obligations. The table below illustrates the possible impact of a one per cent change in the principal actuarial assumptions. Note that for the sensitivity to the discount rates, the one per cent change was considered only for the future expected Government of Canada long-term bond rates and not for the historical Government of Canada long-term bond rates included in the determination of the streamed discount rates used to measure the unfunded pension benefits sponsored by the Government.
(in millions of dollars)
2016 2015
Pension benefits Pension benefits
Other Other future future Funded Unfunded benefits Funded Unfunded benefits
Possible impact on the accrued benefit obligations due to:
Increase of 1% in discount rates .................................................................................. (18,100) (8,700) (19,800) (17,300) (8,700) (17,200) Decrease of 1% in discount rates ................................................................................. 23,900 9,600 27,200 22,500 9,100 23,500 Increase of 1% in rate of inflation ............................................................................... 15,500 21,200 24,500 14,300 20,400 20,900 Decrease of 1% in rate of inflation .............................................................................. (12,800) (17,600) (18,300) (11,800) (17,000) (15,700) Increase of 1% in general wage increase ..................................................................... 6,200 1,100 400 6,100 1,200 500 Decrease of 1% in general wage increase.................................................................... (5,500) (1,000) (400) (5,300) (1,100) (400) Increase of 1% in assumed health care cost trend rates ............................................... – – 8,800 – – 7,500 Decrease of 1% in assumed health care cost trend rates ............................................. – – (6,400) – – (5,400)
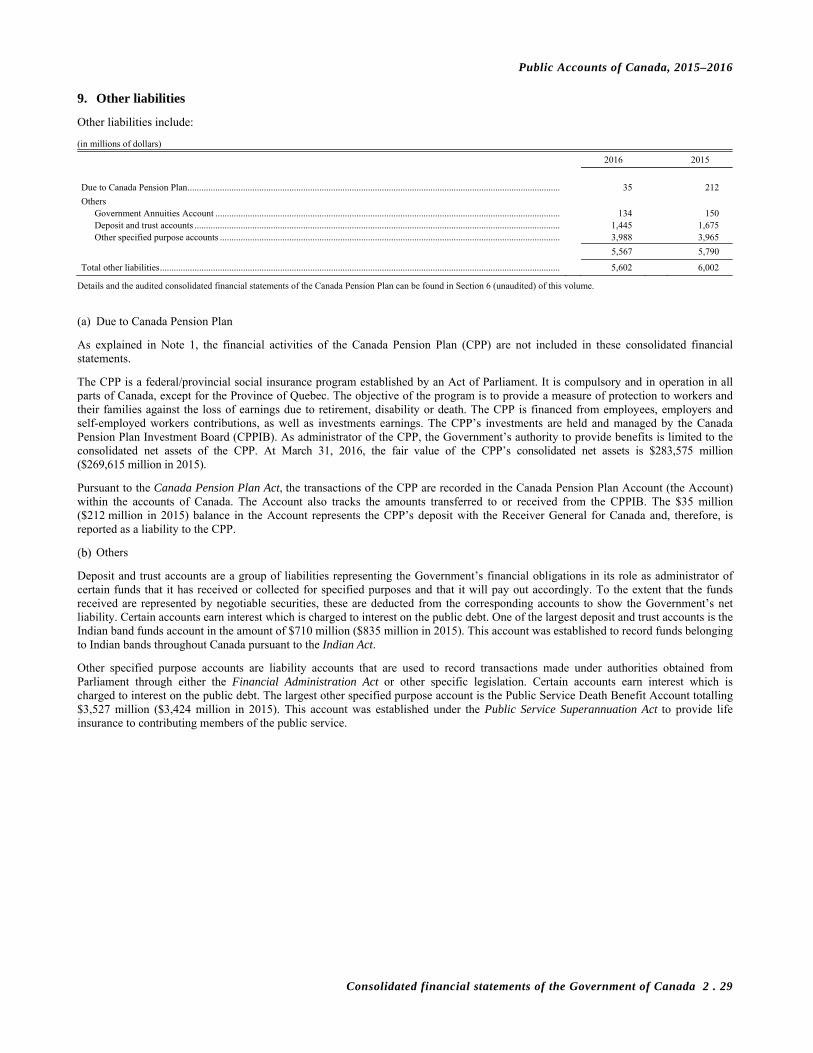
Public Accounts of Canada, 2015–2016
Consolidated financial statements of the Government of Canada 2 . 29
9. Other liabilities
Other liabilities include:
(in millions of dollars)
2016 2015
Due to Canada Pension Plan ................................................................................................................................................................. 35 212
Others Government Annuities Account ..................................................................................................................................................... 134 150 Deposit and trust accounts .............................................................................................................................................................. 1,445 1,675 Other specified purpose accounts ................................................................................................................................................... 3,988 3,965
5,567 5,790
Total other liabilities ............................................................................................................................................................................. 5,602 6,002
Details and the audited consolidated financial statements of the Canada Pension Plan can be found in Section 6 (unaudited) of this volume.
(a) Due to Canada Pension Plan
As explained in Note 1, the financial activities of the Canada Pension Plan (CPP) are not included in these consolidated financial statements.
The CPP is a federal/provincial social insurance program established by an Act of Parliament. It is compulsory and in operation in all parts of Canada, except for the Province of Quebec. The objective of the program is to provide a measure of protection to workers and their families against the loss of earnings due to retirement, disability or death. The CPP is financed from employees, employers and self-employed workers contributions, as well as investments earnings. The CPP’s investments are held and managed by the Canada Pension Plan Investment Board (CPPIB). As administrator of the CPP, the Government’s authority to provide benefits is limited to the consolidated net assets of the CPP. At March 31, 2016, the fair value of the CPP’s consolidated net assets is $283,575 million ($269,615 million in 2015).
Pursuant to the Canada Pension Plan Act, the transactions of the CPP are recorded in the Canada Pension Plan Account (the Account) within the accounts of Canada. The Account also tracks the amounts transferred to or received from the CPPIB. The $35 million ($212 million in 2015) balance in the Account represents the CPP’s deposit with the Receiver General for Canada and, therefore, is reported as a liability to the CPP.
Others
Deposit and trust accounts are a group of liabilities representing the Government’s financial obligations in its role as administrator of certain funds that it has received or collected for specified purposes and that it will pay out accordingly. To the extent that the funds received are represented by negotiable securities, these are deducted from the corresponding accounts to show the Government’s net liability. Certain accounts earn interest which is charged to interest on the public debt. One of the largest deposit and trust accounts is the Indian band funds account in the amount of $710 million ($835 million in 2015). This account was established to record funds belonging to Indian bands throughout Canada pursuant to the Indian Act.
Other specified purpose accounts are liability accounts that are used to record transactions made under authorities obtained from Parliament through either the Financial Administration Act or other specific legislation. Certain accounts earn interest which is charged to interest on the public debt. The largest other specified purpose account is the Public Service Death Benefit Account totalling $3,527 million ($3,424 million in 2015). This account was established under the Public Service Superannuation Act to provide life insurance to contributing members of the public service.

Public Accounts of Canada, 2015–2016
2 . 30 Consolidated financial statements of the Government of Canada
10. Cash and cash equivalents
Cash and cash equivalents are as follows:
(in millions of dollars)
2016 2015
Cash1 ..................................................................................................................................................................................................... 32,335 28,845 Cash equivalents ................................................................................................................................................................................... 6,235 6,154
Total cash and cash equivalents ........................................................................................................................................................... 38,570 34,999
Details can be found in Section 7 (unaudited) of this volume. 1 Included in cash is $20,000 million ($20,000 million in 2015) which has been designated as a deposit held at the Bank of Canada with respect to prudential liquidity
management undertaken by the Government.
11. Taxes and other accounts receivable
Taxes receivable represent tax revenues that were assessed by year end as well as amounts receivable due to the accrual of tax revenues as at March 31. These accrued receivables are not due until the next fiscal year. They also include other receivables for amounts collectible through the tax system such as provincial and territorial taxes, Employment Insurance premiums and Canada Pension Plan contributions.
The Government has established an allowance for doubtful accounts of $14,330 million ($13,138 million in 2015) and has recorded a bad debt expense of $3,833 million ($3,910 million in 2015). The allowance for doubtful accounts is management’s best estimate of the collectability of amounts that have been assessed, including the related interest and penalties, but not yet paid. The allowance for doubtful accounts has two components. A general allowance is calculated based on the age and type of tax accounts using rates based on historical collection experience. A specific allowance is calculated based on an annual review of all accounts over $10 million. The allowance for doubtful accounts is adjusted every year through a provision for doubtful accounts and is reduced by amounts written off as uncollectible during the year. The annual provision is reported as a bad debt expense which is charged against other program expenses. The details of the taxes receivable and allowance for doubtful accounts are as follows:
(in millions of dollars)
2016 2015
Total Allowance Total Allowance taxes for doubtful taxes for doubtful receivable accounts Net receivable accounts Net
Income taxes receivable
Individuals ....................................................................................... 60,869 6,997 53,872 55,150 6,660 48,490 Employers ....................................................................................... 19,569 1,135 18,434 17,652 1,052 16,600 Corporations .................................................................................... 18,184 2,529 15,655 16,964 2,282 14,682 Non-residents .................................................................................. 1,511 132 1,379 1,462 138 1,324
Goods and services tax receivable ........................................................ 17,959 2,962 14,997 18,248 2,785 15,463 Customs duties receivable .................................................................... 268 103 165 266 24 242 Excise taxes and duties receivable ....................................................... 1,818 472 1,346 1,895 197 1,698
Total ...................................................................................................... 120,178 14,330 105,848 111,637 13,138 98,499
Details can be found in Section 7 (unaudited) of this volume.
Other accounts receivable represent billed or accrued financial claims arising from amounts owed to the Government at year end, and cash collateral pledged to counterparties.
Billed or accrued financial claims arising from amounts owed to the Government total $6,304 million ($5,418 million in 2015) and are presented net of an allowance for doubtful accounts of $2,591 million ($2,220 million in 2015). Further details can be found in Section 7 (unaudited) of this volume.
Cash collateral pledged to counterparties of $6,557 million (nil in 2015) represents collateral support under International Swaps and Derivatives Association (ISDA) master agreements in respect of outstanding cross-currency swap arrangements. Further details can be found in Note 16.

Public Accounts of Canada, 2015–2016
Consolidated financial statements of the Government of Canada 2 . 31
12. Foreign exchange accounts
Foreign exchange accounts represent financial claims and obligations of the Government as a result of Canada’s foreign exchange operations.
The Government holds certain investments in its Exchange Fund Account to provide general liquidity and to promote orderly conditions in the foreign exchange market for the Canadian dollar. As at March 31, 2016, the fair value of the marketable securities held in the Exchange Fund Account is $87,347 million ($84,241 million in 2015), established using market quotes or other available market information. Further details on these investments are provided in the unaudited financial statements of the Exchange Fund Account in Section 8 of this volume.
Subscriptions and loans to the International Monetary Fund (IMF) and special drawing rights allocations are denominated in special drawing rights (SDR). The SDR serves as the unit of account for the IMF and its value is based on a basket of key international currencies (US dollar, Euro, Japanese yen and British pound sterling). Canada participates in two multi-lateral lending arrangements with the IMF along with a group of other member countries. Collectively, maximum direct lending under the multi-lateral arrangements is limited to no more than the equivalent of SDR 4,767 million ($8,722 million) at March 31, 2016.
The following table presents the balances of the foreign exchange accounts:
(in millions of dollars)
2016 2015
International reserves held in the Exchange Fund Account
Cash and cash equivalents US dollar ................................................................................................................................................................................... 5,303 441 Euro ........................................................................................................................................................................................... 304 189 British pound sterling ................................................................................................................................................................ 114 48 Japanese yen .............................................................................................................................................................................. 181 17
Total ............................................................................................................................................................................... 5,902 695
Marketable securities US dollar ................................................................................................................................................................................... 56,638 60,558 Euro ........................................................................................................................................................................................... 20,162 17,685 British pound sterling ................................................................................................................................................................ 7,534 2,405 Japanese yen .............................................................................................................................................................................. 712 794
Total ............................................................................................................................................................................... 85,046 81,442
Special drawing rights .................................................................................................................................................................... 10,431 9,818 Gold ................................................................................................................................................................................................. – 6
Total international reserves held in the Exchange Fund Account ........................................................................................................ 101,379 91,961
International Monetary Fund Subscriptions ................................................................................................................................................................................... 20,170 11,129 Loans .............................................................................................................................................................................................. 1,278 1,353
Total ...................................................................................................................................................................................................... 122,827 104,443
Less: International Monetary Fund
Special drawing rights allocations ............................................................................................................................................ 10,956 10,463 Notes payable ............................................................................................................................................................................ 18,332 8,962
Total ............................................................................................................................................................................... 29,288 19,425
Total foreign exchange accounts .......................................................................................................................................................... 93,539 85,018
Details can be found in Section 8 (unaudited) of this volume.

Public Accounts of Canada, 2015–2016
2 . 32 Consolidated financial statements of the Government of Canada
13. Crown corporations and other entities
Parent Crown corporations are included in the reporting entity of the Government. There are also a number of not-for-profit organizations and other government business enterprises that meet the definition of control for financial reporting purposes and are included in the reporting entity of the Government.
(a) Consolidated Crown corporations and other entities
Some Crown corporations and not-for-profit organizations rely on the Government for most of their financing and their financial activities are consolidated in these financial statements. The major consolidated Crown corporations are Atomic Energy of Canada Limited, Canadian Air Transport Security Authority, Canadian Broadcasting Corporation, Canadian Commercial Corporation and VIA Rail Canada Inc. The major consolidated not-for-profit organizations are the Canada Foundation for Innovation and the Canada Foundation for Sustainable Development Technology. Detailed information on these consolidated entities is included in Section 4 (unaudited) of this volume.
Enterprise Crown corporations and other government business enterprises
The remaining Crown corporations are government business enterprises able to raise substantial portions of their revenues through commercial business activity and are therefore considered self-sustaining. These Crown corporations are referred to as enterprise Crown corporations. The major enterprise Crown corporations include the Bank of Canada, Canada Mortgage and Housing Corporation, Canada Post Corporation and Export Development Canada.
In addition, there are a number of self-sustaining government business enterprises that are not Crown corporations but which are controlled by the Government. These are referred to as other government business enterprises and include various Canada Port Authorities. Investments in enterprise Crown corporations and other government business enterprises are recorded under the modified equity method.
The following table presents the Government’s recorded loans, investments and advances in significant enterprise Crown corporations and other government business enterprises:
(in millions of dollars)
2016 2015
Investments
Canada Mortgage and Housing Corporation .................................................................................................................................. 19,939 18,733 Export Development Canada .......................................................................................................................................................... 8,889 8,527 Farm Credit Canada ........................................................................................................................................................................ 5,354 4,855 Business Development Bank of Canada ......................................................................................................................................... 5,323 4,745 Canada Port Authorities .................................................................................................................................................................. 2,710 2,521 Canada Deposit Insurance Corporation .......................................................................................................................................... 2,116 1,801 Canada Development Investment Corporation ............................................................................................................................... 461 3,880 Canada Post Corporation ................................................................................................................................................................ (2,157) (2,277) Other ............................................................................................................................................................................................... 845 1,023
Total investments ...................................................................................................................................................................... 43,480 43,808
Loans and advances
Farm Credit Canada ........................................................................................................................................................................ 23,438 22,691 Business Development Bank of Canada ......................................................................................................................................... 16,942 15,676 Canada Mortgage and Housing Corporation .................................................................................................................................. 10,531 10,708 Other ............................................................................................................................................................................................... 340 333
Total loans and advances .......................................................................................................................................................... 51,251 49,408
Less:
Loans expected to be repaid from future appropriations ................................................................................................................ 3,571 3,792 Unamortized discounts and premiums ............................................................................................................................................ 44 49
3,615 3,841
Total loans, investments and advances to enterprise Crown corporations and other government business enterprises ..................... 91,116 89,375
Details can be found in Section 9 (unaudited) of this volume.
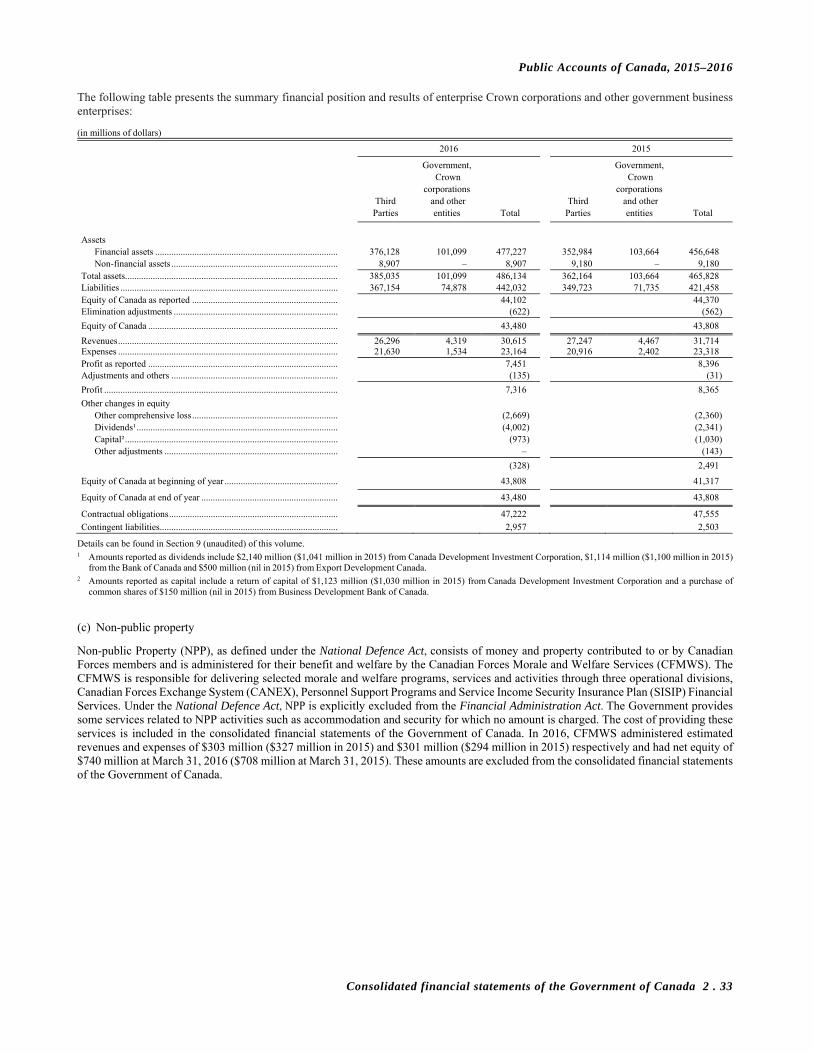
Public Accounts of Canada, 2015–2016
Consolidated financial statements of the Government of Canada 2 . 33
The following table presents the summary financial position and results of enterprise Crown corporations and other government business enterprises:
(in millions of dollars)
2016 2015
Government, Government, Crown Crown corporations corporations Third and other Third and other Parties entities Total Parties entities Total
Assets
Financial assets ............................................................................... 376,128 101,099 477,227 352,984 103,664 456,648 Non-financial assets ........................................................................ 8,907 – 8,907 9,180 – 9,180
Total assets............................................................................................ 385,035 101,099 486,134 362,164 103,664 465,828 Liabilities .............................................................................................. 367,154 74,878 442,032 349,723 71,735 421,458 Equity of Canada as reported ............................................................... 44,102 44,370 Elimination adjustments ....................................................................... (622) (562)
Equity of Canada .................................................................................. 43,480 43,808
Revenues ............................................................................................... 26,296 4,319 30,615 27,247 4,467 31,714Expenses ............................................................................................... 21,630 1,534 23,164 20,916 2,402 23,318 Profit as reported .................................................................................. 7,451 8,396 Adjustments and others ........................................................................ (135) (31)
Profit ..................................................................................................... 7,316 8,365
Other changes in equity Other comprehensive loss ............................................................... (2,669) (2,360) Dividends¹ ....................................................................................... (4,002) (2,341) Capital² ............................................................................................ (973) (1,030) Other adjustments ........................................................................... – (143)
(328) 2,491
Equity of Canada at beginning of year ................................................. 43,808 41,317
Equity of Canada at end of year ........................................................... 43,480 43,808
Contractual obligations ......................................................................... 47,222 47,555
Contingent liabilities ............................................................................. 2,957 2,503
Details can be found in Section 9 (unaudited) of this volume. 1 Amounts reported as dividends include $2,140 million ($1,041 million in 2015) from Canada Development Investment Corporation, $1,114 million ($1,100 million in 2015)
from the Bank of Canada and $500 million (nil in 2015) from Export Development Canada. 2 Amounts reported as capital include a return of capital of $1,123 million ($1,030 million in 2015) from Canada Development Investment Corporation and a purchase of
common shares of $150 million (nil in 2015) from Business Development Bank of Canada.
(c) Non-public property
Non-public Property (NPP), as defined under the National Defence Act, consists of money and property contributed to or by Canadian Forces members and is administered for their benefit and welfare by the Canadian Forces Morale and Welfare Services (CFMWS). The CFMWS is responsible for delivering selected morale and welfare programs, services and activities through three operational divisions, Canadian Forces Exchange System (CANEX), Personnel Support Programs and Service Income Security Insurance Plan (SISIP) Financial Services. Under the National Defence Act, NPP is explicitly excluded from the Financial Administration Act. The Government provides some services related to NPP activities such as accommodation and security for which no amount is charged. The cost of providing these services is included in the consolidated financial statements of the Government of Canada. In 2016, CFMWS administered estimated revenues and expenses of $303 million ($327 million in 2015) and $301 million ($294 million in 2015) respectively and had net equity of $740 million at March 31, 2016 ($708 million at March 31, 2015). These amounts are excluded from the consolidated financial statements of the Government of Canada.

Public Accounts of Canada, 2015–2016
2 . 34 Consolidated financial statements of the Government of Canada
14. Other loans, investments and advances
The following table presents a summary of the balances of other loans, investments and advances by category:
(in millions of dollars)
2016 2015
National governments, including developing countries and international organizations
National governments including developing countries .................................................................................................................. 966 988 International organizations ............................................................................................................................................................. 21,161 20,189
Total .......................................................................................................................................................................................... 22,127 21,177
Other loans, investments and advances
Provincial and territorial governments ........................................................................................................................................... 419 1,112 Other loans, investments and advances .......................................................................................................................................... 29,671 28,324
Total .......................................................................................................................................................................................... 30,090 29,436
Total ...................................................................................................................................................................................................... 52,217 50,613 Less: allowance for valuation ............................................................................................................................................................... 27,376 26,307
Total other loans, investments and advances ....................................................................................................................................... 24,841 24,306
Details can be found in Section 9 (unaudited) of this volume.
The following table presents a summary of the balances of other loans, investments and advances by currency:
(in millions of dollars)
2016 2015
Loans, investments Foreign Loans, investments Loans, investments and advances in exchange and advances in and advances in base currency rate CAD CAD
Canadian dollar ............................................................................................... 46,756 46,756 45,253 US dollar ......................................................................................................... 3,978 1.29870 5,166 5,222 Special drawing rights ................................................................................... 149 1.82963 273 119 Various other currencies ................................................................................. 22 19
Total ................................................................................................................ 52,217 50,613
Loans to national governments consist mainly of loans for financial assistance totalling $400 million ($400 million in 2015), international development assistance to developing countries totalling $155 million ($164 million in 2015), and development of export trade totalling $411 million ($424 million in 2015) which are administered by Export Development Canada. Certain loans are non-interest bearing and others bear interest at rates varying from 0.1 per cent to 10.3 per cent. These loans are repayable over 1 to 30 years, with final instalments due in 2045.
Loans, investments and advances to international organizations include subscriptions to the share capital of international banks totalling $13,191 million ($12,654 million in 2015) as well as loans and advances to associations and other international organizations totalling $7,970 million ($7,536 million in 2015). These subscriptions are composed of both paid-in and callable capital. They do not provide a return on investment but are repayable on termination of the organization or withdrawal from it. Most loans and advances to international organizations are made to banks and associations that use these funds to make loans to developing countries at significant concessionary terms.
Loans to provinces and territories include loans made under relief acts and other legislation. Loans totalling $416 million ($789 million in 2015) are non-interest bearing and will be repaid by reducing transfer payments over 1 to 10 years.
Other loans, investments and advances include loans under the Canada Student Loans Program, loans for the development of export trade administered by Export Development Canada, unconditionally repayable contributions, and other investments in bonds, market funds and fixed income securities. Loans under the Canada Student Loans Program of $18,235 million ($17,519 million in 2015) are provided interest-free to full-time students and afterward bear interest at either a variable prime rate plus 2.5 per cent or a fixed prime rate plus 5.0 per cent. The repayment period is generally 10 years. Loans for the development of export trade of $2,667 million ($2,772 million in 2015) are either non-interest bearing or bear interest at rates varying from 1.0 per cent to 9.0 per cent. Collateral of $291 million ($259 million in 2015) is held on these loans and they are repayable over 1 to 7 years with final instalments due in 2022. At March 31, 2016, unconditionally repayable contributions were $3,431 million ($2,280 million in 2015) and other investments were $2,651 million ($2,991 million in 2015).
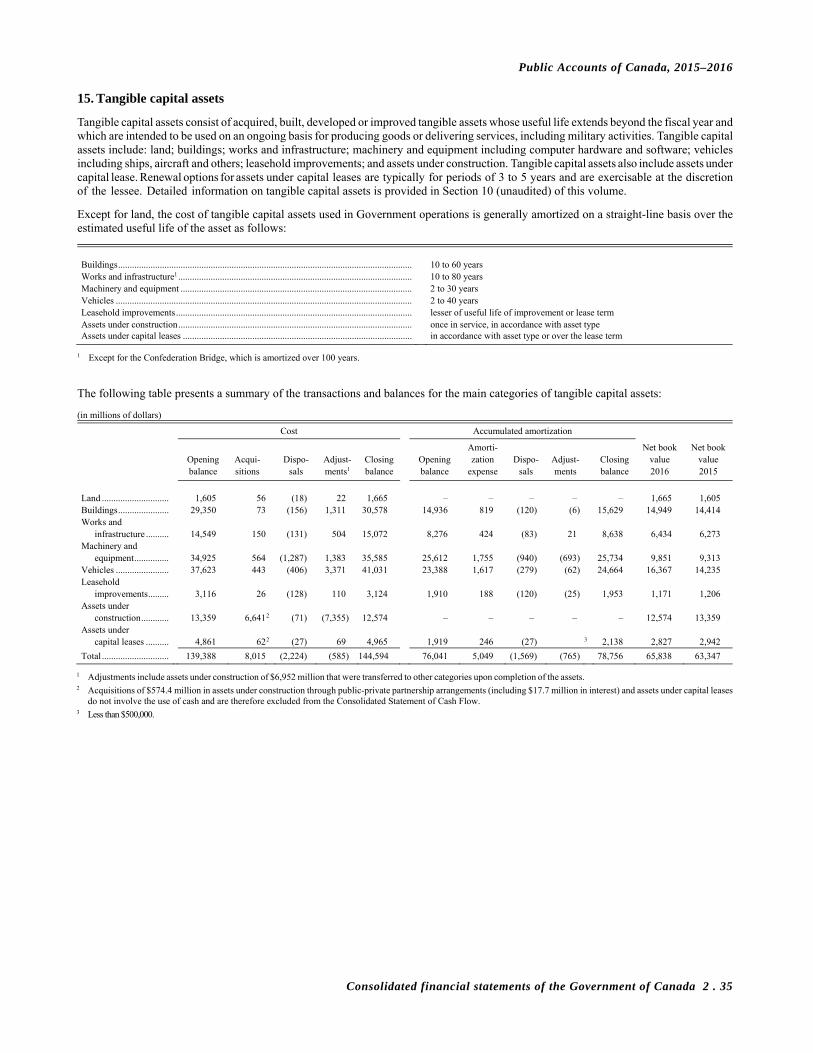
Public Accounts of Canada, 2015–2016
Consolidated financial statements of the Government of Canada 2 . 35
15. Tangible capital assets
Tangible capital assets consist of acquired, built, developed or improved tangible assets whose useful life extends beyond the fiscal year and which are intended to be used on an ongoing basis for producing goods or delivering services, including military activities. Tangible capital assets include: land; buildings; works and infrastructure; machinery and equipment including computer hardware and software; vehicles including ships, aircraft and others; leasehold improvements; and assets under construction. Tangible capital assets also include assets under capital lease. Renewal options for assets under capital leases are typically for periods of 3 to 5 years and are exercisable at the discretion of the lessee. Detailed information on tangible capital assets is provided in Section 10 (unaudited) of this volume.
Except for land, the cost of tangible capital assets used in Government operations is generally amortized on a straight-line basis over the estimated useful life of the asset as follows:
Buildings ............................................................................................................................... 10 to 60 years Works and infrastructure1 ..................................................................................................... 10 to 80 years Machinery and equipment .................................................................................................... 2 to 30 years Vehicles ................................................................................................................................ 2 to 40 years Leasehold improvements ...................................................................................................... lesser of useful life of improvement or lease term Assets under construction ..................................................................................................... once in service, in accordance with asset type Assets under capital leases ................................................................................................... in accordance with asset type or over the lease term
1 Except for the Confederation Bridge, which is amortized over 100 years.
The following table presents a summary of the transactions and balances for the main categories of tangible capital assets:
(in millions of dollars)
Cost Accumulated amortization
Amorti- Net book Net book Opening Acqui- Dispo- Adjust- Closing Opening zation Dispo- Adjust- Closing value value balance sitions sals ments1 balance balance expense sals ments balance 2016 2015
Land ............................. 1,605 56 (18) 22 1,665 – – – – – 1,665 1,605 Buildings ...................... 29,350 73 (156) 1,311 30,578 14,936 819 (120) (6) 15,629 14,949 14,414 Works and
infrastructure .......... 14,549 150 (131) 504 15,072 8,276 424 (83) 21 8,638 6,434 6,273 Machinery and
equipment ............... 34,925 564 (1,287) 1,383 35,585 25,612 1,755 (940) (693) 25,734 9,851 9,313 Vehicles ....................... 37,623 443 (406) 3,371 41,031 23,388 1,617 (279) (62) 24,664 16,367 14,235 Leasehold
improvements ......... 3,116 26 (128) 110 3,124 1,910 188 (120) (25) 1,953 1,171 1,206 Assets under
construction ............ 13,359 6,641 2 (71) (7,355) 12,574 – – – – – 12,574 13,359 Assets under
capital leases .......... 4,861 62 2 (27) 69 4,965 1,919 246 (27) 3 2,138 2,827 2,942
Total ............................. 139,388 8,015 (2,224) (585) 144,594 76,041 5,049 (1,569) (765) 78,756 65,838 63,347
1 Adjustments include assets under construction of $6,952 million that were transferred to other categories upon completion of the assets. 2 Acquisitions of $574.4 million in assets under construction through public-private partnership arrangements (including $17.7 million in interest) and assets under capital leases
do not involve the use of cash and are therefore excluded from the Consolidated Statement of Cash Flow. 3 Less than $500,000.
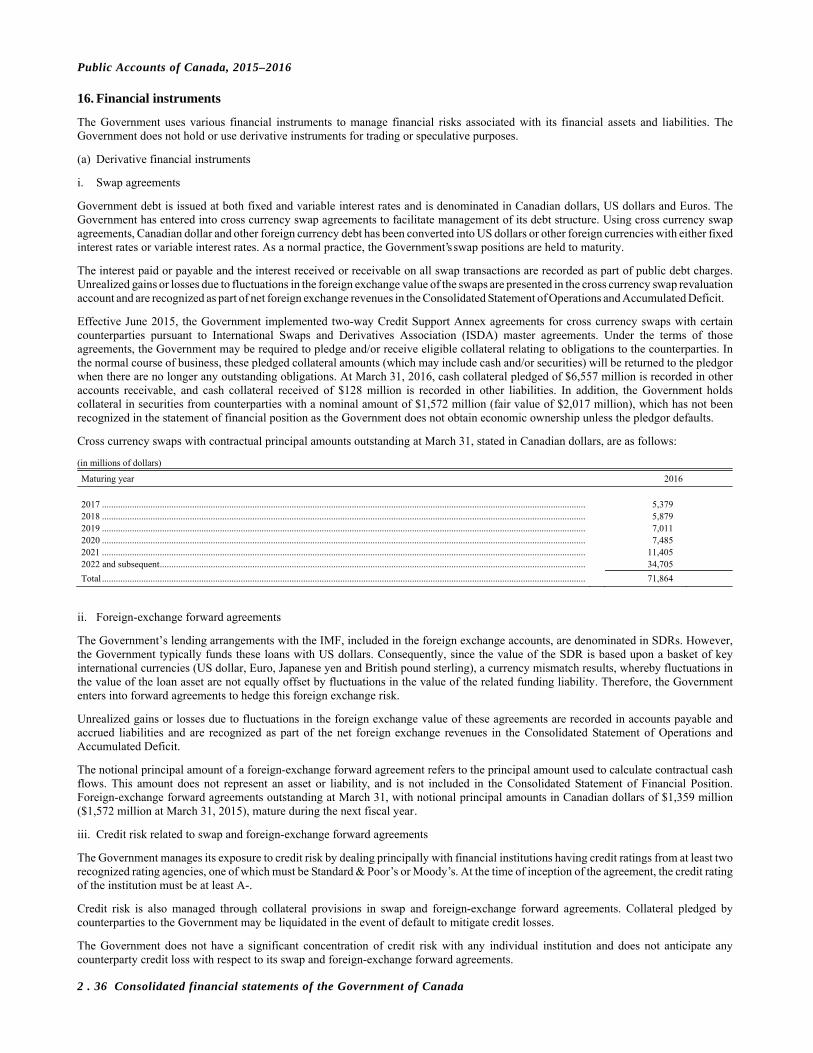
Public Accounts of Canada, 2015–2016
2 . 36 Consolidated financial statements of the Government of Canada
16. Financial instruments
The Government uses various financial instruments to manage financial risks associated with its financial assets and liabilities. The Government does not hold or use derivative instruments for trading or speculative purposes.
(a) Derivative financial instruments
i. Swap agreements
Government debt is issued at both fixed and variable interest rates and is denominated in Canadian dollars, US dollars and Euros. The Government has entered into cross currency swap agreements to facilitate management of its debt structure. Using cross currency swap agreements, Canadian dollar and other foreign currency debt has been converted into US dollars or other foreign currencies with either fixed interest rates or variable interest rates. As a normal practice, the Government’s swap positions are held to maturity.
The interest paid or payable and the interest received or receivable on all swap transactions are recorded as part of public debt charges. Unrealized gains or losses due to fluctuations in the foreign exchange value of the swaps are presented in the cross currency swap revaluation account and are recognized as part of net foreign exchange revenues in the Consolidated Statement of Operations and Accumulated Deficit.
Effective June 2015, the Government implemented two-way Credit Support Annex agreements for cross currency swaps with certain counterparties pursuant to International Swaps and Derivatives Association (ISDA) master agreements. Under the terms of those agreements, the Government may be required to pledge and/or receive eligible collateral relating to obligations to the counterparties. In the normal course of business, these pledged collateral amounts (which may include cash and/or securities) will be returned to the pledgor when there are no longer any outstanding obligations. At March 31, 2016, cash collateral pledged of $6,557 million is recorded in other accounts receivable, and cash collateral received of $128 million is recorded in other liabilities. In addition, the Government holds collateral in securities from counterparties with a nominal amount of $1,572 million (fair value of $2,017 million), which has not been recognized in the statement of financial position as the Government does not obtain economic ownership unless the pledgor defaults.
Cross currency swaps with contractual principal amounts outstanding at March 31, stated in Canadian dollars, are as follows:
(in millions of dollars)
Maturing year 2016
2017 ................................................................................................................................................................................................................. 5,379 2018 ................................................................................................................................................................................................................. 5,879 2019 ................................................................................................................................................................................................................. 7,011 2020 ................................................................................................................................................................................................................. 7,485 2021 ................................................................................................................................................................................................................. 11,405 2022 and subsequent ........................................................................................................................................................................................ 34,705
Total ................................................................................................................................................................................................................. 71,864
ii. Foreign-exchange forward agreements
The Government’s lending arrangements with the IMF, included in the foreign exchange accounts, are denominated in SDRs. However, the Government typically funds these loans with US dollars. Consequently, since the value of the SDR is based upon a basket of key international currencies (US dollar, Euro, Japanese yen and British pound sterling), a currency mismatch results, whereby fluctuations in the value of the loan asset are not equally offset by fluctuations in the value of the related funding liability. Therefore, the Government enters into forward agreements to hedge this foreign exchange risk.
Unrealized gains or losses due to fluctuations in the foreign exchange value of these agreements are recorded in accounts payable and accrued liabilities and are recognized as part of the net foreign exchange revenues in the Consolidated Statement of Operations and Accumulated Deficit.
The notional principal amount of a foreign-exchange forward agreement refers to the principal amount used to calculate contractual cash flows. This amount does not represent an asset or liability, and is not included in the Consolidated Statement of Financial Position. Foreign-exchange forward agreements outstanding at March 31, with notional principal amounts in Canadian dollars of $1,359 million ($1,572 million at March 31, 2015), mature during the next fiscal year.
iii. Credit risk related to swap and foreign-exchange forward agreements
The Government manages its exposure to credit risk by dealing principally with financial institutions having credit ratings from at least two recognized rating agencies, one of which must be Standard & Poor’s or Moody’s. At the time of inception of the agreement, the credit rating of the institution must be at least A-.
Credit risk is also managed through collateral provisions in swap and foreign-exchange forward agreements. Collateral pledged by counterparties to the Government may be liquidated in the event of default to mitigate credit losses.
The Government does not have a significant concentration of credit risk with any individual institution and does not anticipate any counterparty credit loss with respect to its swap and foreign-exchange forward agreements.
Public Accounts of Canada, 2015–2016
Consolidated financial statements of the Government of Canada 2 . 37
The following table presents the contractual or notional principal amounts of the swap and foreign-exchange forward agreements organized by credit ratings based on published Standard & Poor’s credit ratings and stand-alone credit profiles at year end:
(in millions of dollars)
Credit ratings 2016 2015
A+ ......................................................................................................................................................................................................... 21,854 17,774 A............................................................................................................................................................................................................ 18,980 14,040 A- .......................................................................................................................................................................................................... 29,786 26,518 BBB+ .................................................................................................................................................................................................... – 4,765 BBB ...................................................................................................................................................................................................... 2,603 1,566
Total ...................................................................................................................................................................................................... 73,223 64,663
Managing foreign currency risk and sensitivity analysis to foreign currency exposures
Interest rate and foreign currency risks are managed using a strategy of matching the duration and the currency of the foreign exchange accounts assets and the related foreign currency borrowings of the Government. At March 31, 2016, assets within the foreign exchange accounts and their related foreign currency borrowings substantially offset each other on a market value basis. Accordingly, the impact of price changes affecting these assets and the liabilities funding these assets naturally offset each other, resulting in no significant impact to the Government’s net debt.
Assets related to the IMF are only partially matched by related foreign currency borrowings as they are denominated in SDRs, however, foreign-exchange risks relating to loans to the IMF have been managed through entering into various foreign-exchange forward agreements.
The majority of the government foreign currency assets and related liabilities are held in four currency portfolios: the US dollar, the Euro, the British pound sterling and the Japanese yen. At March 31, 2016, a one per cent appreciation in the Canadian dollar as compared to the US dollar, the Euro, the British pound sterling and the Japanese yen would result in a foreign exchange loss of $2 million due to the exposure of the US dollar portfolio, a foreign exchange loss of $2 million due to the exposure of the Euro portfolio and a foreign exchange gain of $2 million due to the exposure of the British pound sterling. There is no significant exposure related to the Japanese yen portfolio.
The net foreign exchange gain included in net foreign exchange revenues, other program revenues and other program expenses on the Consolidated Statement of Operations and Accumulated Deficit amounts to $269 million (net foreign exchange gain of $452 million in 2015).
(c) Fair value information
The carrying values of other accounts payable and accrued liabilities, interest and matured debt, cash and cash equivalents, other accounts receivable and other loans, investments and advances are assumed to approximate their fair values due to their short-term to maturity or allowances recorded to reduce their carrying values to amounts that approximate their estimated realizable values.
The following table presents the fair value of derivative financial instruments with contractual or notional principal amounts outstanding at March 31:
(in millions of dollars)
2016 2015
Principal Fair Principal Fair amount value amount value
Cross currency swaps .............................................................................................................................. 71,864 (7,196) 63,091 (5,756) Foreign-exchange forward agreements ................................................................................................... 1,359 (47) 1,572 128
Total ......................................................................................................................................................... 73,223 (7,243) 64,663 (5,628)
Fair values of the swap and foreign-exchange forward agreements are the estimated amount that the Government would receive or pay, based on market factors, if the agreements were terminated on March 31. They are established by discounting the expected cash flows of the swap and foreign-exchange forward agreements, calculated from the contractual or notional principal amounts, using year-end market interest and exchange rates. A positive (negative) fair value indicates that the Government would receive (make) a payment if the agreements were terminated on March 31.
Public Accounts of Canada, 2015–2016
2 . 38 Consolidated financial statements of the Government of Canada
17. Contractual obligations
The nature of government activities results in large multi-year contracts and agreements, including international treaties, protocols and agreements of various size and importance. Any financial obligations resulting from these are recorded as a liability when the terms of these contracts or agreements for the acquisition of goods and services or the provision of transfer payments are met. Major contractual obligations that will generate expenditures in future years and that can be reasonably estimated are summarized as follows:
(in millions of dollars)
Transfer payment Capital assets Operating International Minimum payments to be made in: agreements and purchases leases organizations¹ Total
2017 ......................................................................................................................... 15,794 9,458 374 1,847 27,473 2018 ......................................................................................................................... 9,173 8,358 354 758 18,643 2019 ......................................................................................................................... 6,043 9,338 331 552 16,264 2020 ......................................................................................................................... 4,406 9,303 287 356 14,352 2021 ......................................................................................................................... 2,086 6,445 258 101 8,890 2022 and subsequent ................................................................................................ 1,666 16,704 1,237 1,116 20,723
Total ......................................................................................................................... 39,168 59,606 2,841 4,730 106,345
1 Includes transfer payments, undisbursed loans and advances to international organizations as well as loans for the development of export trade (administered by Export Development Canada), if any, which Canada has agreed to disburse in the future. Future paid-in share capital commitments made by Canada for future purchases of non-budgetary share capital in international organizations are also included.
18. Contingent liabilities
Contingent liabilities arise in the normal course of operations and their ultimate disposition is unknown. They are grouped into contingent liabilities related to: guarantees provided by the Government, international organizations, claims and pending and threatened litigation, and insurance programs of agent enterprise Crown corporations.
(a) Guarantees provided by the Government
At March 31, 2016, the principal amount outstanding for guarantees provided by the Government amount to $490,557 million ($442,904 million in 2015) for which an allowance of $312 million ($317 million in 2015) has been recorded under the Other Accounts Payable and Accrued Liabilities in the Consolidated Statement of Financial Position. The authorized limit, where applicable, is established at $357,360 million ($356,950 million in 2015) for an amount of $224,095 million ($188,901 million in 2015) of guarantees provided by the Government. The amount of guarantees with no authorized limit is established at $266,462 million ($254,003 million in 2015). Guarantees provided by the Government include guarantees on the borrowings of enterprise Crown corporations and other government business enterprises, loan guarantees, insurance programs managed by the Government, and other explicit guarantees. Of the total amount guaranteed, $266,434 million ($253,049 million in 2015) relates to guarantees on the borrowings of agent enterprise Crown corporations for which no authorized limit has been set and no allowance (nil in 2015) has been recorded.
International organizations
The Government has callable share capital in certain international organizations that could require payments to those agencies. As at March 31, 2016, callable share capital amounts to $31,041 million ($30,601 million in 2015).
(c) Claims and pending and threatened litigation
There are thousands of claims and pending and threatened litigation cases outstanding against the Government. These claims include items with pleading amounts and items where an amount is not specified. While the total amount claimed in these actions is significant, their outcomes are not determinable. The Government has recorded an allowance for claims and litigation where it is likely that there will be a future payment and a reasonable estimate of the loss can be made, it has been recorded under the Accounts Payable and Accrued Liabilities in the Consolidated Statement of Financial Position. Claims and litigation for which the outcome is not determinable and for which an amount has not been accrued, are estimated at approximately $8,679 million ($8,304 million in 2015) which is based on management’s best estimate determined on a case by case basis. Certain large and significant claims are described below:
Comprehensive land claims: Comprehensive land claims arise in areas of the country where Aboriginal rights and title have not been resolved by treaty or by other legal means. There are currently 76 (80 in 2015) comprehensive land claims under negotiation, accepted for negotiation or under review. A liability of $5,158 million ($4,840 million in 2015) is estimated for claims that have progressed to a point where quantification is possible. This estimate includes projections based on historical rates and costs of settlement for similar claims.
Specific claims: Specific claims deal with the past grievances of First Nations related to Canada’s obligations under historic treaties or the way it managed First Nations’ funds or other assets. The Government of Canada will pursue a settlement agreement with the First Nation when a claim demonstrates an outstanding lawful obligation. There are currently 503 (456 in 2015) specific claims under negotiation, accepted for negotiation or under review. A liability of $4,531 million ($3,458 million in 2015) is estimated for claims that have progressed to a point where quantification is possible. This estimate includes projections based on historical rates and costs of settlement for similar claims.

Public Accounts of Canada, 2015–2016
Consolidated financial statements of the Government of Canada 2 . 39
Assessed taxes under objection or appeal: Contingent liabilities include previously assessed taxes where amounts are under objection or are being appealed to the Tax Court of Canada, the Federal Court of Canada, or the Supreme Court of Canada. As of March 31, 2016, $21,915 million ($22,987 million for 2015) was under objection at the Government level and $7,035 million ($5,450 million for 2015) was being appealed to the courts. The Government has recorded, in the amounts payable to taxpayers or in reduction of the amounts receivable from taxpayers, as applicable, the estimated amount of objections or appeals that are considered likely to be lost and that can be reasonably estimated.
(d) Insurance programs of agent enterprise Crown corporations
Four agent enterprise Crown corporations operate insurance programs for the Government. In the event that the corporations have insufficient funds, the Government will have to provide financing. The Canada Deposit Insurance Corporation operates the Deposit Insurance Fund which provides basic protection coverage to depositors for up to $100,000 deposited with each member bank, trust or loan company; the Canada Mortgage and Housing Corporation operates the Mortgage Insurance Fund which provides insurance for mortgage lending on Canadian housing by private institutions and the Mortgage-Backed Securities Guarantee Fund which guarantees the timely payment of the principal and interest for investors of securities based on the National Housing Act through the Mortgage-Backed Securities program and the bonds issued by the Canada Housing Trust through the Canada Mortgage Bond program; Export Development Canada provides export and foreign investment insurance to help with export trade; and Farm Credit Canada sells group creditor life and accident insurance to its customers through a program administered by a major insurance provider. At March 31, 2016, total insurance in force amounts to $1,672,619 million ($1,671,666 million in 2015). The Government expects that all four corporations will cover the cost of both current claims and possible future claims.
Further details on contingent liabilities can be found in Section 11 (unaudited) of this volume.

Public Accounts of Canada, 2015–2016
2 . 40 Consolidated financial statements of the Government of Canada
19. Segmented information
The Government segmented information is based on the ministry structure, which groups the activities of departments and agencies for which a Minister is responsible, and the Crown corporations and other entities as described in Note 13. The five main ministries are reported separately and the others are grouped together with the provision for valuation and other items. The presentation by segment is based on the same accounting policies as those described in the Summary of significant accounting policies in Note 1. Inter-segment transfers are measured at the exchange amount. The following tables present the segmented information by Ministry and Crown corporations and other entities before the elimination of internal transactions that are eliminated in the Adjustments column before arriving at the total for the year ended March 31:
(in millions of dollars)
2016
Families, Public Crown Children Safety and corporations and Social National National Emergency Other and other Adjust- Development Finance Defence Revenue Preparedness ministries entities ments1 Total
Revenues
Tax revenues Income tax revenues .......................... – – – 192,846 – – – – 192,846 Other taxes and duties ....................... – – – 19,218 30,587 – – – 49,805
Total tax revenues ....................... – – – 212,064 30,587 – – – 242,651
Employment insurance premiums ......... 23,491 – – – – – – (421) 23,070
Other revenues
Crown corporations ........................... – – – – – – 16,945 (4,485) 12,460 Other programs .................................. 2,667 722 576 4,912 2,336 10,727 549 (7,539) 14,950 Net foreign exchange ........................ – 2,322 – – – – – – 2,322
Total other revenues ................... 2,667 3,044 576 4,912 2,336 10,727 17,494 (12,024) 29,732
Total revenues .............................................. 26,158 3,044 576 216,976 32,923 10,727 17,494 (12,445) 295,453
Expenses
Transfer payments Old age security benefits,
guaranteed income supplement and spouse's allowance ............... 45,461 – – – – – – – 45,461
Major transfer payments to other levels of government .................. – 63,877 – – – 1,973 – – 65,850
Employment insurance benefits ........ 19,419 – – – – – – – 19,419 Children's benefits ............................. 7,516 – – 10,509 – – – – 18,025 Other transfer payments .................... 6,465 512 152 3,701 620 23,115 486 (177) 34,874
Total transfer payments .............. 78,861 64,389 152 14,210 620 25,088 486 (177) 183,629
Other program expenses
Crown corporations ........................... – – – – – – 8,589 (231) 8,358 Ministries ........................................... 4,584 501 28,826 8,251 10,622 37,796 312 (12,034) 78,858
Total other program expenses .... 4,584 501 28,826 8,251 10,622 37,796 8,901 (12,265) 87,216
Total program expenses ............. 83,445 64,890 28,978 22,461 11,242 62,884 9,387 (12,442) 270,845
Public debt charges ................................ – 25,306 88 – 1 203 – (3) 25,595
Total expenses .............................................. 83,445 90,196 29,066 22,461 11,243 63,087 9,387 (12,445) 296,440
Details providing total expenses by segment and type can be found in Section 3 (unaudited) of this volume. Certain comparative figures have been reclassified to conform to the current Government structure. 1 Represents consolidation adjustments to eliminate internal transactions.

Public Accounts of Canada, 2015–2016
Consolidated financial statements of the Government of Canada 2 . 41
(in millions of dollars)
2015
Families, Public Crown Children Safety and corporations and Social National National Emergency Other and other Adjust- Development Finance Defence Revenue Preparedness ministries entities ments¹ Total
Revenues
Tax revenues Income tax revenues .......................... – – – 181,406 – – – – 181,406 Other taxes and duties ....................... – – – 18,137 29,045 – – – 47,182
Total tax revenues ....................... – – – 199,543 29,045 – – – 228,588
Employment insurance premiums ......... 22,962 – – – – – – (398) 22,564
Other revenues
Crown corporations ........................... – – – – – – 17,730 (4,250) 13,480 Other programs .................................. 2,636 885 630 5,061 2,244 11,578 519 (7,194) 16,359 Net foreign exchange ........................ – 1,355 – – – – – – 1,355
Total other revenues ................... 2,636 2,240 630 5,061 2,244 11,578 18,249 (11,444) 31,194
Total revenues .............................................. 25,598 2,240 630 204,604 31,289 11,578 18,249 (11,842) 282,346
Expenses
Transfer payments Old age security benefits,
guaranteed income supplement and spouse's allowance ............... 44,103 – – – – – – – 44,103
Major transfer payments to other levels of government .................. – 61,136 – – – 1,973 – – 63,109
Employment insurance benefits ........ 18,052 – – – – – – – 18,052 Children's benefits ............................. 3,931 – – 10,372 – – – – 14,303 Other transfer payments .................... 6,292 920 136 3,350 204 23,905 487 (168) 35,126
Total transfer payments .............. 72,378 62,056 136 13,722 204 25,878 487 (168) 174,693
Other program expenses
Crown corporations ........................... – – – – – – 7,951 (361) 7,590 Ministries ........................................... 4,306 726 23,837 8,372 10,077 35,264 284 (11,308) 71,558
Total other program expenses .... 4,306 726 23,837 8,372 10,077 35,264 8,235 (11,669) 79,148
Total program expenses ............. 76,684 62,782 23,973 22,094 10,281 61,142 8,722 (11,837) 253,841
Public debt charges ................................ – 26,330 68 – 1 200 – (5) 26,594
Total expenses .............................................. 76,684 89,112 24,041 22,094 10,282 61,342 8,722 (11,842) 280,435
Details providing total expenses by segment and type can be found in Section 3 (unaudited) of this volume. Certain comparative figures have been reclassified to conform to the current Government structure. 1 Represents consolidation adjustments to eliminate internal transactions.
Public Accounts of Canada, 2015–2016
2 . 42 Consolidated financial statements of the Government of Canada
Observations of the Auditor General of Canada on the Consolidated Financial Statements of the Government of Canada
For the Year Ended 31 March 2016
Our opinion provides assurance that the Government of Canada is properly reporting its overall financial performance to Parliament and to Canadians. Reporting the Government’s financial results requires significant effort by public servants. Staff in individual departments and central agencies work together to prepare the Government’s consolidated financial statements. For the 18th consecutive year, we have expressed an unmodified audit opinion on the consolidated financial statements, and we thank those involved for their assistance and for the cooperation extended to my Office during the audit.
The purpose of these observations is to comment on matters that we would like to bring to Parliament’s attention.
Transformation of Pay Administration
The Government is transforming the administration of the pay of Public Service employees. As part of this multi-year initiative, it has consolidated some of its pay services in one location and replaced its 40-year old pay system. In 2012, the Government began the four year process of consolidating the work of compensation advisors from various departments to a new pay centre in Miramichi. By the end of April 2016, the administration of payroll had been transferred for about 200,000 of the Government’s employees, with almost half of these transfers occurring during the fiscal year that ended on 31 March 2016. In addition, in February 2016, the Government implemented a new pay system, Phoenix, across 34 departments (120,000 employees), and in April 2016 for the remaining 67 departments (170,000 employees).
As part of our annual audit of the consolidated financial statements, we test pay and benefits, which together represent one of the Government’s largest expenses. This year, we found payment errors, however, because the transformation initiative was only partially implemented before the end of the fiscal year, the impact of these errors was not material to the consolidated financial statements. We have concluded that the payroll expense and related accruals are presented fairly in the Government’s 2015–2016 consolidated financial statements. The errors we noted were overpayments and underpayments of portions of employee pay attributable to input errors and to delays in processing changes in employees’ work arrangements, such as eligibility for a bilingualism bonus and changes in shift-work hours. We also noted instances in which several entries were required to adjust employee pay.
A project of this size and complexity usually comes with challenges and during our audit we found several areas of concern related to the transformation of pay administration. We found that between March 2015 and March 2016, the number of outstanding pay action requests increased proportionally more than the increase in the number of employees’ pay accounts processed at the pay centre. Moreover, we noted that this backlog grew significantly between March and July 2016, after the transition to Phoenix. The Government is projecting that the current backlog will not be fully resolved until more than half way through the 2016–2017 fiscal year. In our view, the extent of errors and delays in processing corrections to employee pay and other pay actions that we identified in our audit is not acceptable given the direct effect on employees. We have not yet assessed the implications on next year’s financial statement audit. However, we encourage the Government to continue its efforts and quickly address the identified weaknesses in pay administration, in order to pay employees the right amount, on time.
In addition to our annual audit of the Government’s 2016–2017 consolidated financial statements, and the follow up on these Observations, we have also decided to undertake a performance audit of the Transformation of Pay Administration Initiative. We are currently planning the scope of that audit.

Public Accounts of Canada, 2015–2016
Consolidated financial statements of the Government of Canada 2 . 43
Management estimates—selecting discount rates
The establishment of reasonable estimates has a direct effect on the quality of the financial information used for decision making. The consolidated financial statements are a source of this information for Parliament and Canadians. Financial Statements are useful to assess the ability of the Government to meet financial obligations and its capacity to maintain current services and to finance new programs. Note 1—Summary of significant accounting policies in the consolidated financial statements provides more information about the sources of measurement uncertainty.
For 2016, we determined that the Government’s significant estimates and underlying assumptions are within the reasonable range permitted by the Public Sector Accounting Standards. The discount rate selected by management is an important assumption for many estimates. Discount rates are used in establishing the values of several liabilities, especially long-term ones and can have a significant impact on the valuation of these liabilities. In our view, certain rates determined by the Government to value significant long-term liabilities are at the higher end of the acceptable range, when compared with market trends. Using a higher discount rate yields a lower estimate for long-term liabilities.
We support the Government’s ongoing project to update the methodology used to determine discount rates. Within the requirements of the Public Sector Accounting Standards, we recommend that the Government consider industry practices in both the public and private sectors, emerging changes in standards and trends in the Canadian financial market. There should also be consistency, when relevant, in the methods and data used to develop other assumptions that the Government makes in the preparation of the consolidated financial statements. As the Government finalizes this project, it should validate its estimates by comparing with actual experience, and adjust as needed.
National Defence—Inventory
National Defence’s inventory is important to the consolidated financial statements because it is valued at $6.2 billion and represents 86 per cent of the Government’s total inventory.
We have been reporting on National Defence’s challenges in properly recording and valuing inventory for 13 years, since the Government of Canada first recorded inventory in its consolidated financial statements. Last year, we noted the Department’s progress with inventory quantity issues and recommended that the Department place more attention on pricing and obsolescence issues. Again this year, we found that National Defence’s inventories were overstated by hundreds of millions of dollars.
National Defence’s inventory has characteristics that make it harder to resolve its accounting problems. There are hundreds of thousands of types of inventory items. National Defence has undertaken various manual exercises to try to improve its accounting, but the sheer volume means that the progress of these manual activities is slow in relation to the volume of inventory that the Department must review.
Issues identified during our audits over the years are caused by a combination of quantity errors, failure to write-off obsolete items, pricing errors, and misclassification between inventory and asset-pooled items.
Quantity. The Department has expanded its counts of inventory over recent years. Inventory is counted through a cyclical, risk-based approach. We continue to find some quantity errors, but the magnitude, in recent years, is not as significant as previously found.
Obsolescence. One of the causes of obsolescence errors is situations in which the Department has removed a fleet or type of equipment from service but has not removed the related inventory from its records. A best practice would be to review all inventory items annually and remove those that are no longer needed or used. However inventory volumes make such reviews lengthy. We found obsolescence errors again this year.
Pricing. Inventory includes parts for the Department’s various fleets and equipment that can be decades old. Given the age of many of these items, records are not always available to support values. Moreover, given the volume of purchases each year, input errors can occur. We continue to find pricing errors in inventory.
Classification. Asset-Pooled Items are major spare parts used to repair or maintain fleets and equipment. It can be difficult to differentiate between Asset-Pooled Items and inventory. Proper identification matters because Asset-Pooled Items and inventory have different accounting treatments. Again this year, we found classification errors in this area which contributed to the overstatement of the Department’s inventory.
Example—Sensitivity to the discount rate of accrued benefit obligations of unfunded pensions
The estimated amount of accrued benefit obligations is very sensitive to changes in the discount rate. For example, in 2016, as indicated in Note 8—Public sector pensions and other employee and veteran future benefits in the consolidated financial statements, the discount rate used in measuring the accrued benefit obligations of the unfunded pension benefits sponsored by the Government was set at 3.9 per cent. A decrease of 1 per cent in the discount rate would have increased the obligations by $9,600 million.

Public Accounts of Canada, 2015–2016
2 . 44 Consolidated financial statements of the Government of Canada
This year, National Defence developed and implemented a new and automated methodology to analyze inventory pricing and obsolescence. As a result, the Department recorded an allowance, which reduced the recorded value of inventory by $131 million. This approach is innovative but, in our view, the issues are still not fully resolved. National Defence should continue to refine its analysis and methodology to further improve the allowance calculation.
National Defence is making some progress. Still, the Department must continue its efforts to ensure that inventory is properly recorded in the consolidated financial statements. In June 2016, the House of Commons’ Standing Committee on Public Accounts recommended that by 30 September 2016 National Defence report back to the Committee with an action plan to record and value its inventory properly.
Liability for contaminated sites
As at 31 March 2016, the Government has a total financial liability of about $6.3 billion for the estimated costs to remediate contaminated sites. Unless appropriately mitigated, contaminated sites can pose a hazard to human health and the environment, and their remediation could entail significant financial costs for the federal government.
Last year, we recommended that the Government develop better processes to refine the accounting estimates and record the liabilities associated with contaminated sites at earlier stages of investigation. To address our recommendation, the Government developed a model to estimate liabilities for sites that are at an earlier stage of investigation. Using historical data for similar sites, the model is designed to predict how many sites that have no liability within a particular class will progress to remediation and what the projected remediation and monitoring costs could be for that class. We found that the model used the data appropriately and performed its calculations accurately. We are satisfied that the Government has addressed last year’s recommendation.

Section 3
2015–2016
Public Accounts of Canada
Revenues, expenses and accumulated deficit Table of contents Page
Revenues .......................................................................................... 3.3 Accounting for revenues.............................................................. 3.3Tax revenues ................................................................................ 3.4Employment insurance premiums ............................................... 3.5Other revenues ............................................................................. 3.6Return on investments ................................................................. 3.7
Expenses .......................................................................................... 3.8 Accounting for expenses .............................................................. 3.8 Expenses by segment ................................................................... 3.10Government’s cost of operations ................................................. 3.10Expenses by object....................................................................... 3.13Expenditures under statutory authorities ..................................... 3.14

This page has been intentionally left blank.

Public Accounts of Canada, 2015–2016
Revenues, expenses and accumulated deficit 3 . 3
Revenues, expenses and accumulated deficit
This section provides information on the revenues, expenses and accumulated deficit of the Government as summarized in Table 3.1.
A narrative description is provided for certain accounts reported in some tables. Such descriptions follow the same presentation order as their respective tables.
Table 3.1 Revenues, expenses and accumulated deficit (in millions of dollars)
2015–2016 2014–2015
Revenues
Tax revenues, Table 3.2 .................................................................................................................................................................. 242,651 228,588 Employment insurance premiums .................................................................................................................................................. 23,070 22,564 Other revenues, Table 3.4 ............................................................................................................................................................... 29,732 31,194
Total revenues .............................................................................................................................................................. 295,453 282,346
Expenses
Transfer payments ........................................................................................................................................................................... 183,629 174,693 Other program expenses ................................................................................................................................................................. 87,216 79,148
Total program expenses ........................................................................................................................................................... 270,845 253,841
Public debt charges, Table 3.8 ........................................................................................................................................................ 25,595 26,594
Total expenses, Table 3.6 ............................................................................................................................................ 296,440 280,435
Annual (deficit) surplus ..................................................................................................................................................................... (987) 1,911
Accumulated deficit at beginning of year ......................................................................................................................................... 612,330 611,881
Other comprehensive loss ................................................................................................................................................................. (2,669) (2,360)
Accumulated deficit at end of year ................................................................................................................................................... 615,986 612,330
Revenues
Revenues consist of all tax and other amounts which enter into the calculation of the annual surplus or deficit of the Government.
Accounting for revenues
The Government reports all revenues on an accrual basis.
Tax revenues are recognized in the period in which the taxable event occurs and when they are authorized by legislation or the ability to assess and collect the tax has been provided through legislative convention. They are reported net of refunds and are exclusive of amounts collected on behalf of provinces and territories.
Tax revenues are measured from amounts assessed/reassessed and from estimates of amounts not yet assessed/reassessed based on cash received that relates to the fiscal year ended March 31. Annual revenues also include adjustments between the estimated revenues of previous years and actual amounts, as well as revenues from reassessments relating to prior years. Revenues do not include estimates of unreported taxes, or the impact of future reassessments that cannot yet be reliably determined.
Tax expenditures that reduce taxes paid or payable are considered tax concessions and are netted against applicable tax revenue. Tax expenditures that provide a financial benefit through the tax system and are not related to the relief of taxes paid or payable are shown as other transfer payment expenses and are not netted against tax revenue.
Income tax revenue is recognized when the taxpayer has earned the income subject to tax.
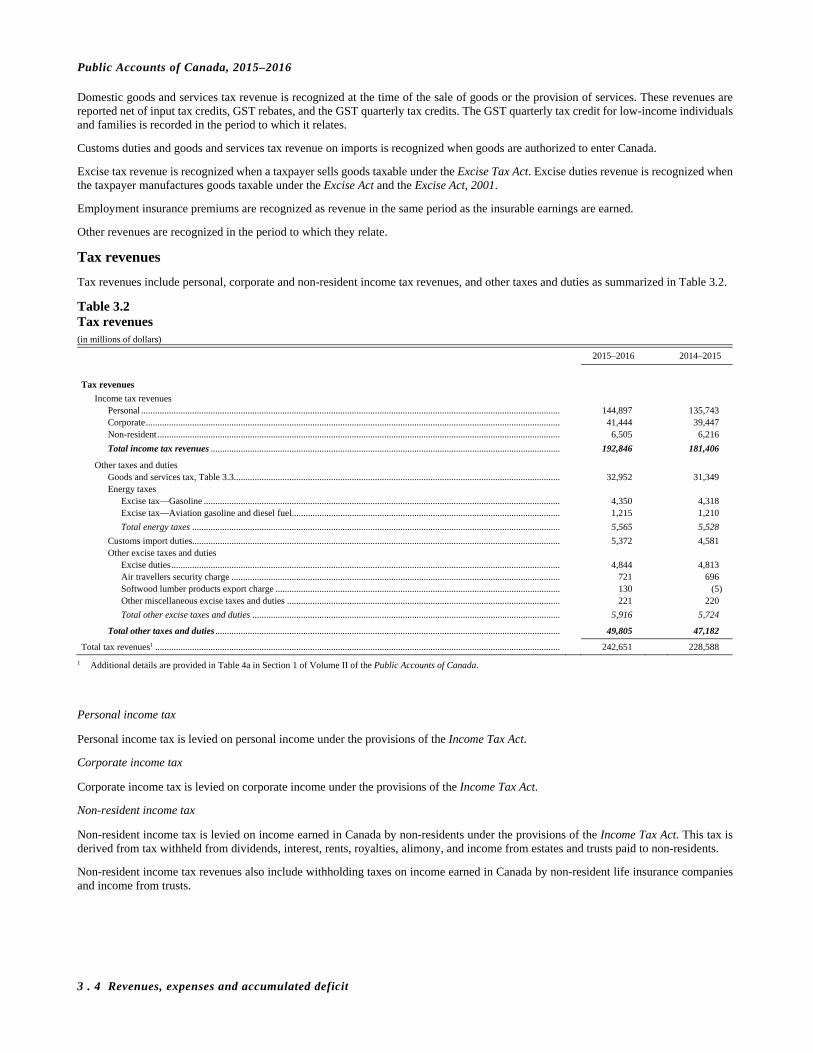
Public Accounts of Canada, 2015–2016
3 . 4 Revenues, expenses and accumulated deficit
Domestic goods and services tax revenue is recognized at the time of the sale of goods or the provision of services. These revenues are reported net of input tax credits, GST rebates, and the GST quarterly tax credits. The GST quarterly tax credit for low-income individuals and families is recorded in the period to which it relates.
Customs duties and goods and services tax revenue on imports is recognized when goods are authorized to enter Canada.
Excise tax revenue is recognized when a taxpayer sells goods taxable under the Excise Tax Act. Excise duties revenue is recognized when the taxpayer manufactures goods taxable under the Excise Act and the Excise Act, 2001.
Employment insurance premiums are recognized as revenue in the same period as the insurable earnings are earned.
Other revenues are recognized in the period to which they relate.
Tax revenues
Tax revenues include personal, corporate and non-resident income tax revenues, and other taxes and duties as summarized in Table 3.2.
Table 3.2 Tax revenues (in millions of dollars)
2015–2016 2014–2015
Tax revenues
Income tax revenues Personal ..................................................................................................................................................................................... 144,897 135,743 Corporate ................................................................................................................................................................................... 41,444 39,447 Non-resident .............................................................................................................................................................................. 6,505 6,216
Total income tax revenues ....................................................................................................................................................... 192,846 181,406
Other taxes and duties Goods and services tax, Table 3.3............................................................................................................................................. 32,952 31,349 Energy taxes
Excise tax—Gasoline .......................................................................................................................................................... 4,350 4,318 Excise tax—Aviation gasoline and diesel fuel.................................................................................................................... 1,215 1,210
Total energy taxes ............................................................................................................................................................... 5,565 5,528
Customs import duties............................................................................................................................................................... 5,372 4,581 Other excise taxes and duties
Excise duties ........................................................................................................................................................................ 4,844 4,813 Air travellers security charge .............................................................................................................................................. 721 696 Softwood lumber products export charge ........................................................................................................................... 130 (5) Other miscellaneous excise taxes and duties ...................................................................................................................... 221 220
Total other excise taxes and duties ..................................................................................................................................... 5,916 5,724
Total other taxes and duties ..................................................................................................................................................... 49,805 47,182
Total tax revenues1 ............................................................................................................................................................................... 242,651 228,588
1 Additional details are provided in Table 4a in Section 1 of Volume II of the Public Accounts of Canada.
Personal income tax
Personal income tax is levied on personal income under the provisions of the Income Tax Act.
Corporate income tax
Corporate income tax is levied on corporate income under the provisions of the Income Tax Act.
Non-resident income tax
Non-resident income tax is levied on income earned in Canada by non-residents under the provisions of the Income Tax Act. This tax is derived from tax withheld from dividends, interest, rents, royalties, alimony, and income from estates and trusts paid to non-residents.
Non-resident income tax revenues also include withholding taxes on income earned in Canada by non-resident life insurance companies and income from trusts.
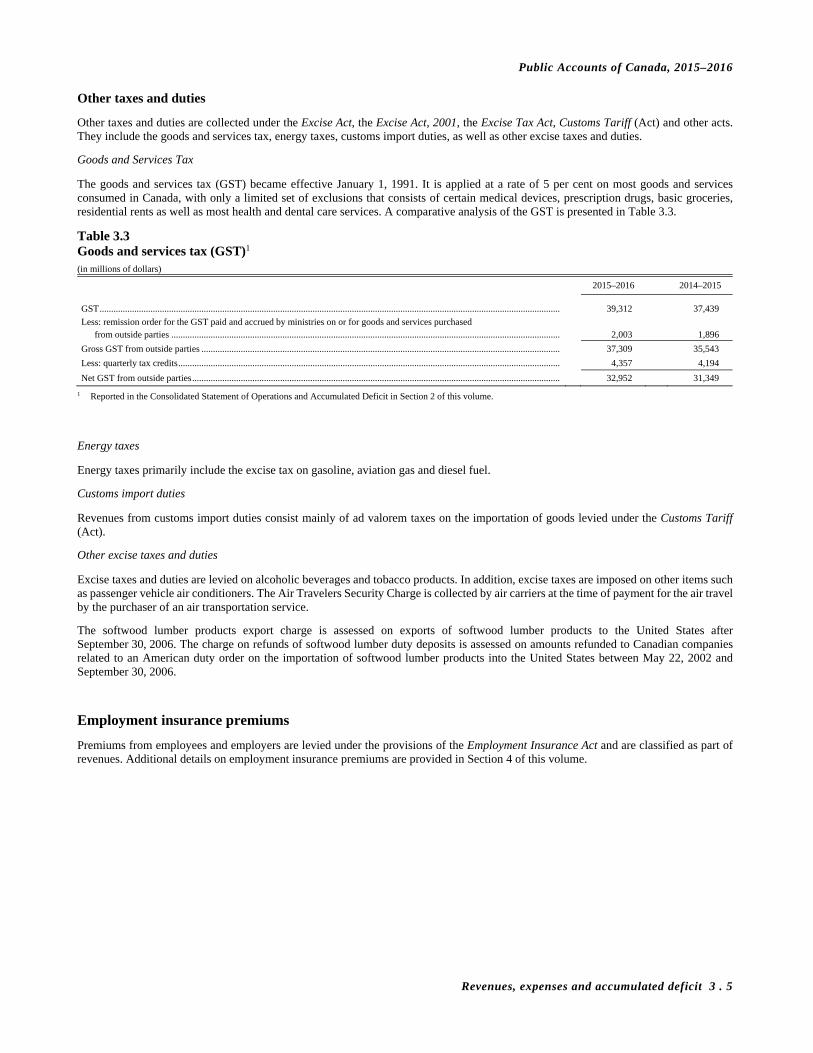
Public Accounts of Canada, 2015–2016
Revenues, expenses and accumulated deficit 3 . 5
Other taxes and duties
Other taxes and duties are collected under the Excise Act, the Excise Act, 2001, the Excise Tax Act, Customs Tariff (Act) and other acts. They include the goods and services tax, energy taxes, customs import duties, as well as other excise taxes and duties.
Goods and Services Tax
The goods and services tax (GST) became effective January 1, 1991. It is applied at a rate of 5 per cent on most goods and services consumed in Canada, with only a limited set of exclusions that consists of certain medical devices, prescription drugs, basic groceries, residential rents as well as most health and dental care services. A comparative analysis of the GST is presented in Table 3.3.
Table 3.3 Goods and services tax (GST)1 (in millions of dollars)
2015–2016 2014–2015
GST ....................................................................................................................................................................................................... 39,312 37,439
Less: remission order for the GST paid and accrued by ministries on or for goods and services purchased from outside parties ........................................................................................................................................................................ 2,003 1,896
Gross GST from outside parties ........................................................................................................................................................... 37,309 35,543
Less: quarterly tax credits ..................................................................................................................................................................... 4,357 4,194
Net GST from outside parties ............................................................................................................................................................... 32,952 31,349
1 Reported in the Consolidated Statement of Operations and Accumulated Deficit in Section 2 of this volume.
Energy taxes
Energy taxes primarily include the excise tax on gasoline, aviation gas and diesel fuel.
Customs import duties
Revenues from customs import duties consist mainly of ad valorem taxes on the importation of goods levied under the Customs Tariff (Act).
Other excise taxes and duties
Excise taxes and duties are levied on alcoholic beverages and tobacco products. In addition, excise taxes are imposed on other items such as passenger vehicle air conditioners. The Air Travelers Security Charge is collected by air carriers at the time of payment for the air travel by the purchaser of an air transportation service.
The softwood lumber products export charge is assessed on exports of softwood lumber products to the United States after September 30, 2006. The charge on refunds of softwood lumber duty deposits is assessed on amounts refunded to Canadian companies related to an American duty order on the importation of softwood lumber products into the United States between May 22, 2002 and September 30, 2006.
Employment insurance premiums
Premiums from employees and employers are levied under the provisions of the Employment Insurance Act and are classified as part of revenues. Additional details on employment insurance premiums are provided in Section 4 of this volume.

Public Accounts of Canada, 2015–2016
3 . 6 Revenues, expenses and accumulated deficit
Other revenues
Other revenues include revenues from Crown corporations, other program revenues and net foreign exchange revenues.
Table 3.4 Other revenues (in millions of dollars)
2015–2016 2014–2015
Other revenues
Crown corporations Consolidated Crown corporations ............................................................................................................................................. 4,544 4,174 Enterprise Crown corporations and other government business enterprises
Share of annual profit .......................................................................................................................................................... 7,316 8,365 Interest and other ................................................................................................................................................................. 600 941
Total Crown corporations ......................................................................................................................................................... 12,460 13,480
Other programs Return on investments, Table 3.5 .............................................................................................................................................. 1,081 1,927 Sales of goods and services
Rights and privileges ........................................................................................................................................................... 2,520 2,873 Lease and use of public property ......................................................................................................................................... 655 634 Services of a regulatory nature ............................................................................................................................................ 1,446 1,360 Services of a non-regulatory nature .................................................................................................................................... 3,494 3,290 Sales of goods and information products ............................................................................................................................ 219 225 Other fees and charges ........................................................................................................................................................ 671 568
Total sales of goods and services ........................................................................................................................................ 9,005 8,950
Miscellaneous Interest and penalties ........................................................................................................................................................... 4,364 4,538 Other .................................................................................................................................................................................... 500 944
Total other programs ................................................................................................................................................................ 14,950 16,359
Net foreign exchange Exchange Fund Account ........................................................................................................................................................... 2,186 840 International Monetary Fund .................................................................................................................................................... 133 495 Other .......................................................................................................................................................................................... 3 20
Total .......................................................................................................................................................................................... 2,322 1,355
Total other revenues1 ............................................................................................................................................................................ 29,732 31,194
1 Additional details are provided in Table 4a in Section 1 of Volume II of the Public Accounts of Canada.
Crown corporations
Crown corporation revenues include revenues earned from third parties by consolidated Crown corporations, interest earned on loans to enterprise Crown corporations and other government business enterprises as well as the government’s share of the accumulated profits or losses of enterprise Crown corporations and other government business enterprises.
Other programs
Other program revenues include sales of goods and services, return on investments, and miscellaneous revenues. Details are reported by individual ministry in Volume II of the Public Accounts of Canada.
Net foreign exchange
Net foreign exchange revenues include the revenues from investments held in the Exchange Fund Account and the International Monetary Fund, as well as the net gains or losses resulting from the translation of these investments to Canadian dollars at March 31. Net foreign exchange revenues also include the net gains or losses resulting from foreign debt and currency swap revaluations.
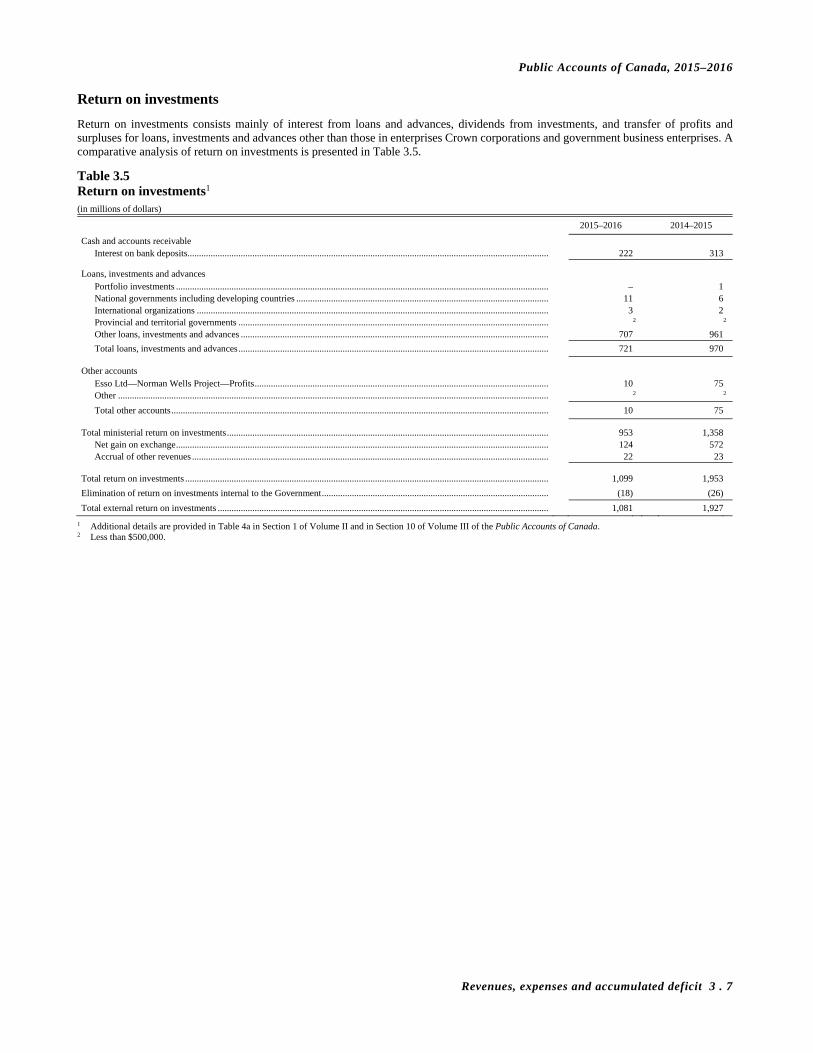
Public Accounts of Canada, 2015–2016
Revenues, expenses and accumulated deficit 3 . 7
Return on investments
Return on investments consists mainly of interest from loans and advances, dividends from investments, and transfer of profits and surpluses for loans, investments and advances other than those in enterprises Crown corporations and government business enterprises. A comparative analysis of return on investments is presented in Table 3.5.
Table 3.5 Return on investments1 (in millions of dollars)
2015–2016 2014–2015
Cash and accounts receivable Interest on bank deposits............................................................................................................................................................ 222 313
Loans, investments and advances Portfolio investments ................................................................................................................................................................. – 1 National governments including developing countries ............................................................................................................. 11 6 International organizations ........................................................................................................................................................ 3 2Provincial and territorial governments ...................................................................................................................................... 2 2
Other loans, investments and advances ..................................................................................................................................... 707 961
Total loans, investments and advances ...................................................................................................................................... 721 970
Other accounts Esso Ltd—Norman Wells Project—Profits ............................................................................................................................... 10 75 Other .......................................................................................................................................................................................... 2 2
Total other accounts ................................................................................................................................................................... 10 75
Total ministerial return on investments ........................................................................................................................................... 953 1,358 Net gain on exchange ................................................................................................................................................................. 124 572 Accrual of other revenues .......................................................................................................................................................... 22 23
Total return on investments ............................................................................................................................................................. 1,099 1,953
Elimination of return on investments internal to the Government .................................................................................................. (18) (26)
Total external return on investments ............................................................................................................................................... 1,081 1,927
1 Additional details are provided in Table 4a in Section 1 of Volume II and in Section 10 of Volume III of the Public Accounts of Canada. 2 Less than $500,000.

Public Accounts of Canada, 2015–2016
3 . 8 Revenues, expenses and accumulated deficit
Expenses
Expenses consist of all charges which enter into the calculation of the annual deficit or surplus of the Government.
Accounting for expenses
The Government reports all expenses on an accrual basis.
Expenses for Government operations are recorded when goods are received or services are rendered. Transfer payments are recorded as expenses when the recipients have met all the eligibility criteria and the transfers are authorized by the consolidated financial statements date. In the case of transfers that do not form part of an existing program, they are considered to be authorized when the Government announces a decision to make a non-recurring transfer, provided the enabling legislation or authorization for payment receives parliamentary approval prior to the completion of the consolidated financial statements. Public debt charges are recorded when incurred and include interest, servicing costs, costs of issuing new borrowings, amortization of premiums and discounts on market debt, as well as interest on public sector pensions and other employee and veteran future benefits.
Table 3.6 External expenses by segment and by type (in millions of dollars)
Major transfer payments1 Other transfer payments
2015–2016 2014–2015 2015–2016 2014–2015
Ministries
Agriculture and Agri-Food ......................................................................................... – – 1,289 1,290 Canadian Heritage ....................................................................................................... – – 1,056 1,286 Environment and Climate Change .............................................................................. – – 135 116 Families, Children and Social Development .............................................................. 72,396 66,086 6,465 6,292 Finance ........................................................................................................................ 63,877 61,136 512 920 Fisheries, Oceans and the Canadian Coast Guard ...................................................... – – 94 90 Global Affairs ............................................................................................................. – – 4,367 4,039 Health .......................................................................................................................... – – 2,985 2,932 Immigration, Refugees and Citizenship ..................................................................... – – 1,083 984 Indigenous and Northern Affairs ................................................................................ – – 7,832 7,576 Infrastructure and Communities ................................................................................. 1,973 1,973 1,098 983 Innovation, Science and Economic Development ...................................................... – – 1,650 2,644 Justice .......................................................................................................................... – – 340 345 National Defence ........................................................................................................ – – 152 136 National Revenue ........................................................................................................ 10,509 10,372 3,701 3,350 Natural Resources ....................................................................................................... – – 577 1,184 Office of the Governor General's Secretary ............................................................... – – – – Parliament ................................................................................................................... – – 1 1 Privy Council .............................................................................................................. – – 105 9 Public Safety and Emergency Preparedness ............................................................... – – 620 204 Public Services and Procurement ............................................................................... – – – – Transport ..................................................................................................................... – – 529 593 Treasury Board............................................................................................................ – – – – Veterans Affairs .......................................................................................................... – – 18 18 Provision for valuation and other items ...................................................................... – – (221) (353)
Total ministries ................................................................................................................. 148,755 139,567 34,388 34,639
Crown corporations and other entities .............................................................................. – – 486 487
Total expenses2 ................................................................................................................. 148,755 139,567 34,874 35,126
Certain comparative figures have been reclassified to conform to the current year’s presentation. 1 Includes transfer payments of $45,461 million ($44,103 million in 2015) for the Old Age security benefits, the guaranteed income supplement and the spouse’s allowance;
$65,850 million ($63,109 million in 2015) to other levels of government; $19,419 million ($18,052 million in 2015) for the Employment insurance benefits and $18,025 million ($14,303 million in 2015) for the Children’s benefits. Additional information is provided in Table 3.7 of this section.
2 Additional information is provided in Table 2a in Section 1 of Volume II of the Public Accounts of Canada.
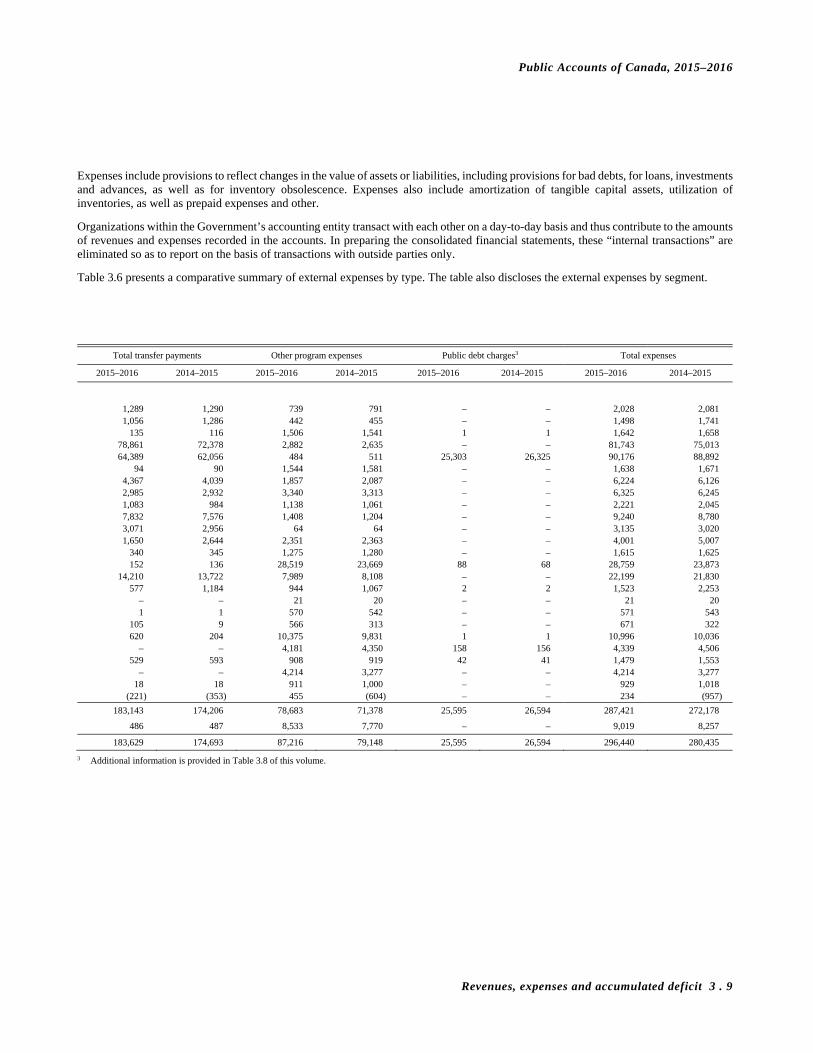
Public Accounts of Canada, 2015–2016
Revenues, expenses and accumulated deficit 3 . 9
Expenses include provisions to reflect changes in the value of assets or liabilities, including provisions for bad debts, for loans, investments and advances, as well as for inventory obsolescence. Expenses also include amortization of tangible capital assets, utilization of inventories, as well as prepaid expenses and other.
Organizations within the Government’s accounting entity transact with each other on a day-to-day basis and thus contribute to the amounts of revenues and expenses recorded in the accounts. In preparing the consolidated financial statements, these “internal transactions” are eliminated so as to report on the basis of transactions with outside parties only.
Table 3.6 presents a comparative summary of external expenses by type. The table also discloses the external expenses by segment.
Total transfer payments Other program expenses Public debt charges3 Total expenses
2015–2016 2014–2015 2015–2016 2014–2015 2015–2016 2014–2015 2015–2016 2014–2015
1,289 1,290 739 791 – – 2,028 2,081 1,056 1,286 442 455 – – 1,498 1,741
135 116 1,506 1,541 1 1 1,642 1,658 78,861 72,378 2,882 2,635 – – 81,743 75,013 64,389 62,056 484 511 25,303 26,325 90,176 88,892
94 90 1,544 1,581 – – 1,638 1,671 4,367 4,039 1,857 2,087 – – 6,224 6,126 2,985 2,932 3,340 3,313 – – 6,325 6,245 1,083 984 1,138 1,061 – – 2,221 2,045 7,832 7,576 1,408 1,204 – – 9,240 8,780 3,071 2,956 64 64 – – 3,135 3,020 1,650 2,644 2,351 2,363 – – 4,001 5,007
340 345 1,275 1,280 – – 1,615 1,625 152 136 28,519 23,669 88 68 28,759 23,873
14,210 13,722 7,989 8,108 – – 22,199 21,830 577 1,184 944 1,067 2 2 1,523 2,253
– – 21 20 – – 21 20 1 1 570 542 – – 571 543
105 9 566 313 – – 671 322 620 204 10,375 9,831 1 1 10,996 10,036
– – 4,181 4,350 158 156 4,339 4,506 529 593 908 919 42 41 1,479 1,553
– – 4,214 3,277 – – 4,214 3,277 18 18 911 1,000 – – 929 1,018
(221) (353) 455 (604) – – 234 (957)
183,143 174,206 78,683 71,378 25,595 26,594 287,421 272,178
486 487 8,533 7,770 – – 9,019 8,257
183,629 174,693 87,216 79,148 25,595 26,594 296,440 280,435
3 Additional information is provided in Table 3.8 of this volume.

Public Accounts of Canada, 2015–2016
3 . 10 Revenues, expenses and accumulated deficit
Expenses by segment
The Government’s segmented information, which is based on the ministerial portfolio structure, groups together departments and agencies’ activities for which a Minister is responsible as well as those of the Crown corporations and other entities as described in Note 13 to the consolidated financial statements in Section 2 of this volume.
Government’s cost of operations
Government’s cost of operations consists of three major types: transfer payments, other program expenses and public debt charges.
Transfer payments
The major transfer payments include payments to persons and payments to provinces and territories.
Payments to persons include payments for income support or income supplement. Assistance is based on age, family status, income, and employment criteria.
Payments to provinces and territories are made under the following programs:
– The fiscal arrangements are unconditional fiscal transfer payments to lower income provinces including subsidies under the Constitution Acts; and
– The Canada health transfer and the Canada social transfer are the major means for providing the federal share of social programs administered by the provinces.
The other transfer payments include various subsidies paid through federal programs to stabilize market prices for commodities, to develop new technologies, to conduct research, to establish new jobs through support for training and to promote educational and cultural activities. Also included are expenses of other consolidated entities and other miscellaneous payments.
Other program expenses
This category covers the costs associated with programs directly delivered by the federal government such as national defence, food inspection, the Coast Guard, the federal court system, the operation of health facilities for natives and veterans, and the national parks system. It also includes the expenses of consolidated Crown corporations and other entities incurred with third parties.
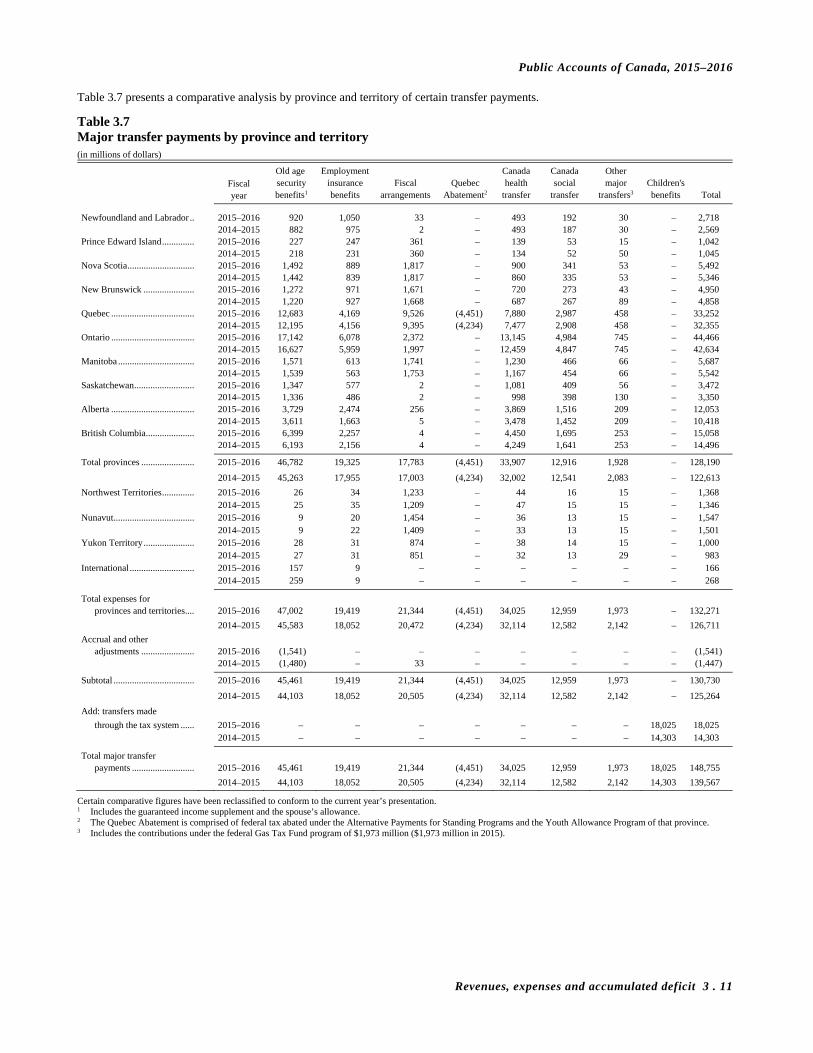
Public Accounts of Canada, 2015–2016
Revenues, expenses and accumulated deficit 3 . 11
Table 3.7 presents a comparative analysis by province and territory of certain transfer payments.
Table 3.7 Major transfer payments by province and territory (in millions of dollars)
Old age Employment Canada Canada Other Fiscal security insurance Fiscal Quebec health social major Children's year benefits1 benefits arrangements Abatement2 transfer transfer transfers3 benefits Total
Newfoundland and Labrador .. 2015–2016 920 1,050 33 – 493 192 30 – 2,718 2014–2015 882 975 2 – 493 187 30 – 2,569 Prince Edward Island .............. 2015–2016 227 247 361 – 139 53 15 – 1,042 2014–2015 218 231 360 – 134 52 50 – 1,045 Nova Scotia ............................. 2015–2016 1,492 889 1,817 – 900 341 53 – 5,492 2014–2015 1,442 839 1,817 – 860 335 53 – 5,346 New Brunswick ...................... 2015–2016 1,272 971 1,671 – 720 273 43 – 4,950 2014–2015 1,220 927 1,668 – 687 267 89 – 4,858 Quebec .................................... 2015–2016 12,683 4,169 9,526 (4,451) 7,880 2,987 458 – 33,252 2014–2015 12,195 4,156 9,395 (4,234) 7,477 2,908 458 – 32,355 Ontario .................................... 2015–2016 17,142 6,078 2,372 – 13,145 4,984 745 – 44,466 2014–2015 16,627 5,959 1,997 – 12,459 4,847 745 – 42,634 Manitoba ................................. 2015–2016 1,571 613 1,741 – 1,230 466 66 – 5,687 2014–2015 1,539 563 1,753 – 1,167 454 66 – 5,542 Saskatchewan .......................... 2015–2016 1,347 577 2 – 1,081 409 56 – 3,472 2014–2015 1,336 486 2 – 998 398 130 – 3,350 Alberta .................................... 2015–2016 3,729 2,474 256 – 3,869 1,516 209 – 12,053 2014–2015 3,611 1,663 5 – 3,478 1,452 209 – 10,418 British Columbia ..................... 2015–2016 6,399 2,257 4 – 4,450 1,695 253 – 15,058 2014–2015 6,193 2,156 4 – 4,249 1,641 253 – 14,496
Total provinces ....................... 2015–2016 46,782 19,325 17,783 (4,451) 33,907 12,916 1,928 – 128,190
2014–2015 45,263 17,955 17,003 (4,234) 32,002 12,541 2,083 – 122,613
Northwest Territories .............. 2015–2016 26 34 1,233 – 44 16 15 – 1,368 2014–2015 25 35 1,209 – 47 15 15 – 1,346 Nunavut ................................... 2015–2016 9 20 1,454 – 36 13 15 – 1,547 2014–2015 9 22 1,409 – 33 13 15 – 1,501 Yukon Territory ...................... 2015–2016 28 31 874 – 38 14 15 – 1,000 2014–2015 27 31 851 – 32 13 29 – 983 International ............................ 2015–2016 157 9 – – – – – – 166 2014–2015 259 9 – – – – – – 268
Total expenses for
provinces and territories .... 2015–2016 47,002 19,419 21,344 (4,451) 34,025 12,959 1,973 – 132,271
2014–2015 45,583 18,052 20,472 (4,234) 32,114 12,582 2,142 – 126,711
Accrual and other adjustments ....................... 2015–2016 (1,541) – – – – – – – (1,541)
2014–2015 (1,480) – 33 – – – – – (1,447)
Subtotal ................................... 2015–2016 45,461 19,419 21,344 (4,451) 34,025 12,959 1,973 – 130,730
2014–2015 44,103 18,052 20,505 (4,234) 32,114 12,582 2,142 – 125,264
Add: transfers made
through the tax system ...... 2015–2016 – – – – – – – 18,025 18,025 2014–2015 – – – – – – – 14,303 14,303
Total major transfer
payments ........................... 2015–2016 45,461 19,419 21,344 (4,451) 34,025 12,959 1,973 18,025 148,755
2014–2015 44,103 18,052 20,505 (4,234) 32,114 12,582 2,142 14,303 139,567
Certain comparative figures have been reclassified to conform to the current year’s presentation. 1 Includes the guaranteed income supplement and the spouse’s allowance. 2 The Quebec Abatement is comprised of federal tax abated under the Alternative Payments for Standing Programs and the Youth Allowance Program of that province. 3 Includes the contributions under the federal Gas Tax Fund program of $1,973 million ($1,973 million in 2015).

Public Accounts of Canada, 2015–2016
3 . 12 Revenues, expenses and accumulated deficit
Public debt charges
Public debt charges include the interest on unmatured debt and on pensions, other future benefits and other liabilities, the amortization of premiums and discounts on unmatured debt, and the servicing costs and the costs of issuing new borrowings.
A comparative summary of public debt charges is presented in Table 3.8. The table also discloses the reconciling items between total public debt charges as reported in the ministerial section of the Department of Finance in Section 6 of Volume II of the Public Accounts of Canada and the total expenses of the public debt indicated in Table 3.6. The reconciling items include the interest expenses on capital leases as well as accrual and other adjustments.
Table 3.8 Public debt charges1 (in millions of dollars)
2015–2016 2014–2015
Unmatured debt
Interest on: Marketable bonds ...................................................................................................................................................................... 13,160 13,562 Retail debt ................................................................................................................................................................................. 34 47 Medium-term notes ................................................................................................................................................................... 9 5
13,203 13,614 Amortization of discounts on Canada and Treasury bills
Treasury bills ............................................................................................................................................................................. 861 1,418 Canada bills ............................................................................................................................................................................... 10 2
871 1,420 Amortization of premiums and discounts on all other debts
Marketable bonds ...................................................................................................................................................................... 632 405 Foreign bonds ............................................................................................................................................................................ 6 – Real return bonds ...................................................................................................................................................................... (106) – Consumer price index adjustments on real return bonds .......................................................................................................... 971 436
1,503 841 Cross-currency swap revaluation .................................................................................................................................................... (487) (542) Servicing costs and costs of issuing new borrowings..................................................................................................................... 11 19 Capital lease obligations ................................................................................................................................................................. 209 209 Other unmatured debt ..................................................................................................................................................................... 83 60
Total public debt charges related to unmatured debt ........................................................................................................................... 15,393 15,621
Pensions and other future benefits Interest on:
Public sector pensions—Superannuation accounts ................................................................................................................... 7,333 7,906 Less: allowance for pension adjustments .................................................................................................................................. 122 (4)
7,455 7,902 Other employee and veteran future benefits
Public Service Health Care Plan and Pensioners' Dental Service Plan .............................................................................. 729 777 Severance and other benefits ............................................................................................................................................... 80 93 Accumulated sick leave entitlements .................................................................................................................................. 39 48 Worker's compensation ....................................................................................................................................................... 32 39 Veterans' disability and other future benefits ...................................................................................................................... 1,442 1,656 Royal Canadian Mounted Police disability and other future benefits ................................................................................ 218 233
2,540 2,846
Total public debt charges related to pensions and other future benefits .............................................................................................. 9,995 10,748
Other liabilities Canada Pension Plan ....................................................................................................................................................................... 2 3 Government Annuities Account ..................................................................................................................................................... 9 11 Deposit and trust accounts .............................................................................................................................................................. 19 25 Other specified purpose accounts ................................................................................................................................................... 171 179 Other liabilities................................................................................................................................................................................ 6 7
Total public debt charges related to other liabilities ............................................................................................................................ 207 225
Consolidated specified purpose accounts Interest ............................................................................................................................................................................................. 3 5
Total public debt charges related to consolidated specified purpose accounts .................................................................................... 3 5
Total public debt charges before consolidation adjustments .............................................................................................................. 25,598 26,599
Less: consolidation adjustments ........................................................................................................................................................... 3 5
Total public debt charges1 2 .................................................................................................................................................................. 25,595 26,594
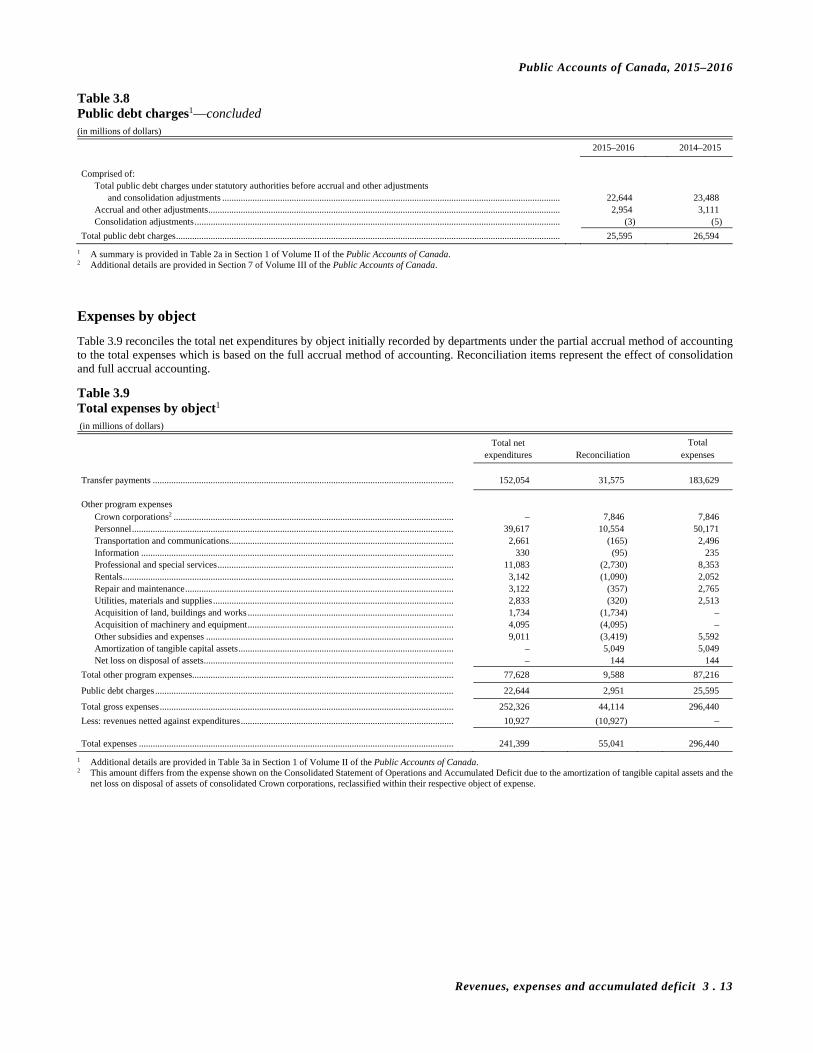
Public Accounts of Canada, 2015–2016
Revenues, expenses and accumulated deficit 3 . 13
Table 3.8 Public debt charges1—concluded (in millions of dollars)
2015–2016 2014–2015
Comprised of:
Total public debt charges under statutory authorities before accrual and other adjustments and consolidation adjustments .................................................................................................................................................. 22,644 23,488
Accrual and other adjustments ........................................................................................................................................................ 2,954 3,111 Consolidation adjustments .............................................................................................................................................................. (3) (5)
Total public debt charges ...................................................................................................................................................................... 25,595 26,594
1 A summary is provided in Table 2a in Section 1 of Volume II of the Public Accounts of Canada. 2 Additional details are provided in Section 7 of Volume III of the Public Accounts of Canada.
Expenses by object
Table 3.9 reconciles the total net expenditures by object initially recorded by departments under the partial accrual method of accounting to the total expenses which is based on the full accrual method of accounting. Reconciliation items represent the effect of consolidation and full accrual accounting.
Table 3.9 Total expenses by object1 (in millions of dollars)
Total net Total expenditures Reconciliation expenses
Transfer payments .................................................................................................................................. 152,054 31,575 183,629
Other program expenses Crown corporations2 ......................................................................................................................... – 7,846 7,846 Personnel ........................................................................................................................................... 39,617 10,554 50,171 Transportation and communications ................................................................................................. 2,661 (165) 2,496 Information ....................................................................................................................................... 330 (95) 235 Professional and special services ...................................................................................................... 11,083 (2,730) 8,353 Rentals ............................................................................................................................................... 3,142 (1,090) 2,052 Repair and maintenance .................................................................................................................... 3,122 (357) 2,765 Utilities, materials and supplies ........................................................................................................ 2,833 (320) 2,513 Acquisition of land, buildings and works ......................................................................................... 1,734 (1,734) – Acquisition of machinery and equipment ......................................................................................... 4,095 (4,095) – Other subsidies and expenses ........................................................................................................... 9,011 (3,419) 5,592 Amortization of tangible capital assets ............................................................................................. – 5,049 5,049 Net loss on disposal of assets ............................................................................................................ – 144 144
Total other program expenses................................................................................................................. 77,628 9,588 87,216
Public debt charges ................................................................................................................................. 22,644 2,951 25,595
Total gross expenses ............................................................................................................................... 252,326 44,114 296,440
Less: revenues netted against expenditures ............................................................................................ 10,927 (10,927) –
Total expenses ........................................................................................................................................ 241,399 55,041 296,440
1 Additional details are provided in Table 3a in Section 1 of Volume II of the Public Accounts of Canada. 2 This amount differs from the expense shown on the Consolidated Statement of Operations and Accumulated Deficit due to the amortization of tangible capital assets and the
net loss on disposal of assets of consolidated Crown corporations, reclassified within their respective object of expense.
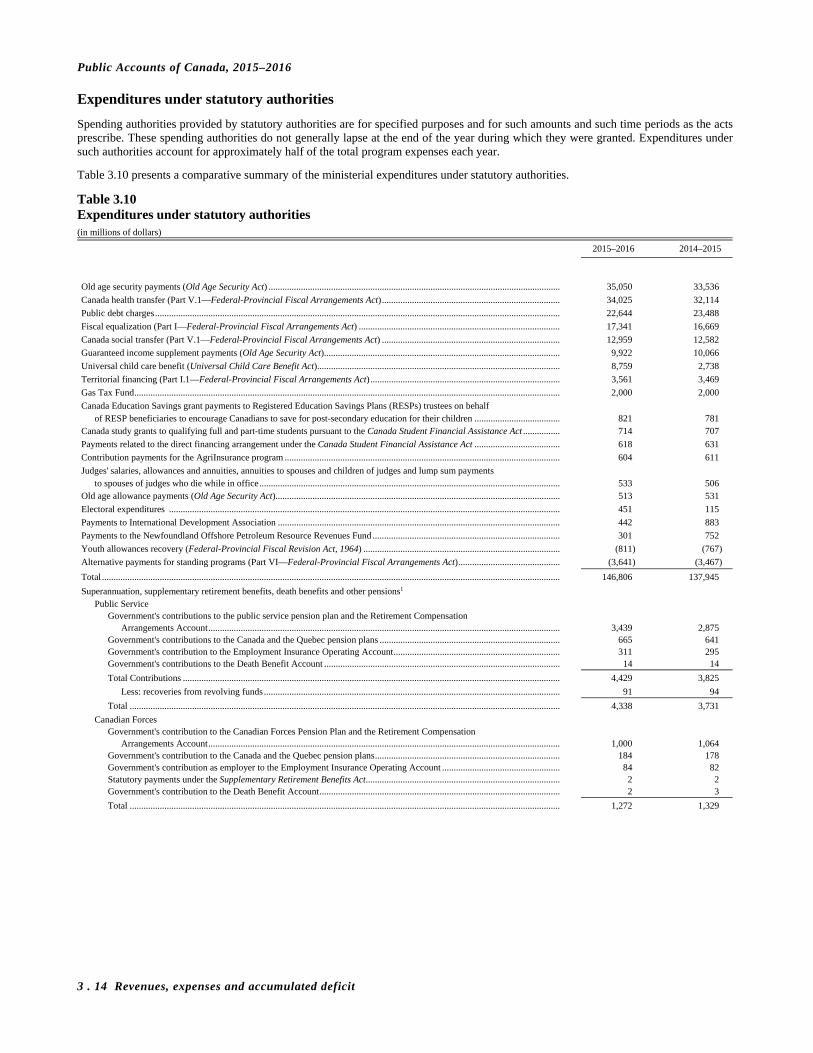
Public Accounts of Canada, 2015–2016
3 . 14 Revenues, expenses and accumulated deficit
Expenditures under statutory authorities
Spending authorities provided by statutory authorities are for specified purposes and for such amounts and such time periods as the acts prescribe. These spending authorities do not generally lapse at the end of the year during which they were granted. Expenditures under such authorities account for approximately half of the total program expenses each year.
Table 3.10 presents a comparative summary of the ministerial expenditures under statutory authorities.
Table 3.10 Expenditures under statutory authorities (in millions of dollars)
2015–2016 2014–2015
Old age security payments (Old Age Security Act) .............................................................................................................................. 35,050 33,536
Canada health transfer (Part V.1—Federal-Provincial Fiscal Arrangements Act) ............................................................................. 34,025 32,114
Public debt charges ............................................................................................................................................................................... 22,644 23,488
Fiscal equalization (Part I—Federal-Provincial Fiscal Arrangements Act) ....................................................................................... 17,341 16,669
Canada social transfer (Part V.1—Federal-Provincial Fiscal Arrangements Act) ............................................................................. 12,959 12,582
Guaranteed income supplement payments (Old Age Security Act)...................................................................................................... 9,922 10,066
Universal child care benefit (Universal Child Care Benefit Act)......................................................................................................... 8,759 2,738
Territorial financing (Part I.1—Federal-Provincial Fiscal Arrangements Act) .................................................................................. 3,561 3,469
Gas Tax Fund ........................................................................................................................................................................................ 2,000 2,000
Canada Education Savings grant payments to Registered Education Savings Plans (RESPs) trustees on behalf of RESP beneficiaries to encourage Canadians to save for post-secondary education for their children ..................................... 821 781
Canada study grants to qualifying full and part-time students pursuant to the Canada Student Financial Assistance Act ................ 714 707
Payments related to the direct financing arrangement under the Canada Student Financial Assistance Act ..................................... 618 631
Contribution payments for the AgriInsurance program ....................................................................................................................... 604 611
Judges' salaries, allowances and annuities, annuities to spouses and children of judges and lump sum payments to spouses of judges who die while in office .................................................................................................................................. 533 506
Old age allowance payments (Old Age Security Act)........................................................................................................................... 513 531
Electoral expenditures ......................................................................................................................................................................... 451 115
Payments to International Development Association .......................................................................................................................... 442 883
Payments to the Newfoundland Offshore Petroleum Resource Revenues Fund ................................................................................. 301 752
Youth allowances recovery (Federal-Provincial Fiscal Revision Act, 1964) ..................................................................................... (811) (767)
Alternative payments for standing programs (Part VI—Federal-Provincial Fiscal Arrangements Act) ............................................ (3,641) (3,467)
Total ...................................................................................................................................................................................................... 146,806 137,945
Superannuation, supplementary retirement benefits, death benefits and other pensions1 Public Service
Government's contributions to the public service pension plan and the Retirement Compensation Arrangements Account ........................................................................................................................................................ 3,439 2,875
Government's contributions to the Canada and the Quebec pension plans .............................................................................. 665 641 Government's contribution to the Employment Insurance Operating Account ........................................................................ 311 295 Government's contributions to the Death Benefit Account ...................................................................................................... 14 14
Total Contributions ................................................................................................................................................................... 4,429 3,825
Less: recoveries from revolving funds ................................................................................................................................ 91 94
Total .......................................................................................................................................................................................... 4,338 3,731
Canadian Forces Government's contribution to the Canadian Forces Pension Plan and the Retirement Compensation
Arrangements Account ........................................................................................................................................................ 1,000 1,064 Government's contribution to the Canada and the Quebec pension plans ................................................................................ 184 178 Government's contribution as employer to the Employment Insurance Operating Account ................................................... 84 82 Statutory payments under the Supplementary Retirement Benefits Act.................................................................................... 2 2 Government's contribution to the Death Benefit Account ........................................................................................................ 2 3
Total .......................................................................................................................................................................................... 1,272 1,329

Public Accounts of Canada, 2015–2016
Revenues, expenses and accumulated deficit 3 . 15
Table 3.10 Expenditures under statutory authorities—concluded (in millions of dollars)
2015–2016 2014–2015
Royal Canadian Mounted Police Government's contribution to the Royal Canadian Mounted Police Pension Plan and the Retirement
Compensation Arrangements Account................................................................................................................................ 353 361 Government's contribution to the Canada and the Quebec pension plans ................................................................................ 59 55 Government's contribution as employer to the Employment Insurance Operating Account ................................................... 27 21 Statutory payments under the Supplementary Retirement Benefits Act.................................................................................... 8 8
Total .......................................................................................................................................................................................... 447 445
Shared Services Canada Government's contribution to the Canada and the Quebec pension plans ................................................................................ 3 4 Government's contribution to the Employment Insurance Operation Account, the Royal Canadian Mounted Police
Pension Plan and the Retirement Compensation Arrangements Account ......................................................................... 1 1
Total .......................................................................................................................................................................................... 4 5
All other statutory expenditures ...................................................................................................................................................... 3,363 3,525
Total ministerial expenditures under statutory authorities2 .................................................................................................................. 156,230 146,980
Certain comparative figures have been reclassified to conform to the current year’s presentation. 1 Details related to other pension accounts, such as the Members of Parliament Retiring Allowances Account, are not included. 2 Additional information on the ministerial expenditures under statutory authorities are provided in Table 7 in Section 1 of Volume II of the Public Accounts of Canada.

This page has been intentionally left blank.
Section 4
2015–2016
Public Accounts of Canada
Consolidated accounts Table of contents Page
Consolidated Crown corporations and other entities ...................... 4.3 Summary financial statements of consolidated Crown
corporations and other entities ................................................. 4.3Borrowing by consolidated agent Crown corporations............... 4.8Contingent liabilities of consolidated Crown corporations
and other entities ...................................................................... 4.8Financial assistance under budgetary appropriations to
consolidated Crown corporations ............................................. 4.9Consolidated specified purpose accounts ........................................ 4.10
Insurance accounts ....................................................................... 4.12Other consolidated specified purpose accounts ........................... 4.14Endowment principal ................................................................... 4.15
Supplementary statement Employment Insurance Operating Account ................................ 4.16

This page has been intentionally left blank.

Public Accounts of Canada, 2015–2016
Consolidated accounts 4 . 3
Consolidated Crown corporations and other entities
This section provides all related information on consolidated Crown corporations and other entities. Consolidated entities are those which rely on Government funding as their principal source of revenue and are controlled by the Government.
Consolidation involves the combination of the accounts of these corporations and other entities on a line-by-line and uniform basis of accounting and elimination of inter-organizational balances and transactions. Consequently, the corporations and other entities’ accounts must be adjusted to the Government’s basis of accounting. All corporations and other entities follow either Canadian Public Sector Accounting Standards or International Financial Reporting Standards. The financial information reported by all of the consolidated Crown corporations and other entities in the following summary tables have been prepared and reported based upon Canadian Public Sector Accounting Standards.
Summary financial statements of consolidated Crown corporations and other entities
The following tables display details of the assets, liabilities, revenues and expenses of the consolidated Crown corporations and other entities.
For those corporations and other entities having year ends other than March 31, the data are based on unaudited interim financial statements which have been prepared on a basis consistent with the most recent audited financial statements.
Tables 4.1 and 4.2 summarize the financial transactions and results of operations as reported by the consolidated Crown corporations and other entities.
Financial assets include cash and cash equivalents, receivables, loans and investments. Financial assets are segregated between third parties and Government, Crown corporations and other entities. The financial assets reported under Government, Crown corporations and other entities represent receivables, loans and investments between related parties. Non-financial assets represent the unexpensed portion of capital assets, such as buildings, machinery and equipment in use or under construction, as well as inventories, prepayments and other items of expenditure which will be expensed as these assets are used. Liabilities include payables, borrowings and other obligations. Liabilities are segregated between third parties and Government, Crown corporations and other entities. Borrowings from third parties represent long-term debts payable of the corporations and other entities. Other third party liabilities are amounts due for purchases, pensions and other employee future benefits, various accruals, capital leases and like items. The liabilities reported under Government, Crown corporations and other entities represent payables and borrowings between related parties.
Revenues are segregated between third parties and Government, Crown corporations and other entities. Government, Crown corporations and other entities’ revenues are broken down further to identify revenues arising from normal operations and financial assistance received or receivable from the Government in respect of the current year’s operations. Expenses are segregated between third parties and Government, Crown corporations and other entities. Equity transactions other than current year’s net income or loss are segregated between equity adjustments and other, remeasurement gains and losses and equity transactions with the Government. Equity adjustments and other include prior period adjustments and other miscellaneous items recorded by the corporations and other entities. Remeasurement gains and losses comprise certain unrealized gains and losses on financial instruments that are recognized in the Statement of Remeasurement Gains and Losses, but excluded from the annual surplus (deficit). Upon realization, these gains and losses are included in the annual surplus (deficit). Equity transactions with the Government include dividends declared or transfers of profits to the Government, as well as capital transactions with the Government. The line “Conversion to the Government accounting basis for consolidation purposes” represents the adjustments required to bring the corporations and other entities’ accounting policies in line with those of the Government.
These tables present financial information on consolidated parent Crown corporations and other entities, as well as financial information on wholly-owned subsidiaries that are considered “deemed parent Crown corporations” and thus consolidated directly in the consolidated financial statements of the Government and excluded from the consolidated financial statements of their parent Crown corporations. The quarterly Inventory of Government of Canada Organizations includes a complete list of all parent Crown corporations, wholly-owned subsidiaries, other subsidiaries and associates.
Consolidated Crown corporations are also categorized as being either agents or non-agents of the Crown. Agency status may be expressly stated in the incorporating legislation or conferred under the provisions of the Government Corporations Operation Act. In accordance with section 54 of the Financial Administration Act, the payment of all money borrowed by consolidated agent Crown corporations and interest thereon is a charge on and payable out of the Consolidated Revenue Fund. Table 4.3 summarizes such borrowings for the consolidated corporations and the changes for the year ended March 31, 2016. Contingent liabilities of consolidated corporations and other entities are presented in Table 4.4.
A summary of financial assistance under budgetary appropriations to consolidated Crown corporations for the year ended March 31, 2016 is provided in Table 4.5. Differences in figures reported in Table 4.2 and those reported in Table 4.5 result from the use of different accounting policies and from items in transit.

Public Accounts of Canada, 2015–2016
4 . 4 Consolidated accounts
Table 4.1 Financial position of consolidated Crown corporations and other entities Assets, liabilities and equity as at March 31, 2016 (in thousands of dollars)
Assets
Financial
Government, Third Crown corporations Total Consolidated Crown corporations and other entities parties and other entities Non-financial assets
Crown corporations1
Atomic Energy of Canada Limited .................................................................. 230,665 29,878 726,127 986,670 Canada Council for the Arts ............................................................................ 333,947 328 26,917 361,192 Canada Development Investment Corporation
PPP Canada Inc .......................................................................................... 1,421,719 597 1,080 1,423,396 Canadian Air Transport Security Authority .................................................... 93,509 84,426 377,569 555,504 Canadian Broadcasting Corporation ................................................................ 1,310,576 206 1,179,862 2,490,644 Canadian Commercial Corporation ................................................................. 215,394 501 3,599,873 3,815,768 Canadian Dairy Commission ........................................................................... 4,881 – 100,867 105,748 Canadian Museum for Human Rights ............................................................. 13,240 275 328,860 342,375 Canadian Museum of History .......................................................................... 76,676 12,240 244,095 333,011 Canadian Museum of Immigration at Pier 21 ................................................. 10,842 135 19,989 30,966 Canadian Museum of Nature ........................................................................... 9,738 527 189,907 200,172 Canadian Race Relations Foundation .............................................................. 26,279 2,157 56 28,492 Canadian Tourism Commission ...................................................................... 26,887 1,144 3,842 31,873 Defence Construction (1951) Limited ............................................................. 40,713 15,966 4,448 61,127 Federal Bridge Corporation Limited, The ....................................................... 42,590 4,921 341,235 388,746 International Development Research Centre ................................................... 77,182 841 11,268 89,291 Jacques Cartier and Champlain Bridges Inc. ................................................... 85,134 15,228 502,853 603,215 Marine Atlantic Inc. ......................................................................................... 148,210 13,000 426,604 587,814 National Arts Centre Corporation .................................................................... 24,028 14 59,470 83,512 National Capital Commission .......................................................................... 177,887 5,361 613,059 796,307 National Gallery of Canada ............................................................................. 23,880 656 80,740 105,276 National Museum of Science and Technology ................................................ 38,693 1,685 72,905 113,283 Standards Council of Canada ........................................................................... 6,931 710 3,631 11,272 Telefilm Canada ............................................................................................... 7,259 57,152 4,715 69,126 VIA Rail Canada Inc. ....................................................................................... 454,357 9,914 954,445 1,418,716 Windsor-Detroit Bridge Authority .................................................................. 80,253 – 67,012 147,265
Total—Crown corporations ................................................................................... 4,981,470 257,862 9,941,429 15,180,761
Conversion to the Government accounting basis for consolidation purposes ...... (129,430) – (47,761) (177,191)
Net Crown corporations on the Government accounting basis ............................. 4,852,040 257,862 9,893,668 15,003,570
Other entities2 Canada Foundation for Innovation .................................................................. 378,575 169,049 3,987 551,611 Canada Foundation for Sustainable Development Technology ...................... 14,521 – 1,293 15,814 First Nations Market Housing Fund ................................................................ 306,420 40,159 67 346,646 St. Lawrence Seaway Management Corporation ............................................ 121,033 32,638 23,637 177,308
Capital Fund Trust ...................................................................................... 2,176 19,264 – 21,440 Employee Termination Benefits Trust Fund .............................................. 1,735 225 – 1,960
Total—Other entities ............................................................................................. 824,460 261,335 28,984 1,114,779
Conversion to the Government accounting basis for consolidation purposes ...... (402) (428) – (830)
Net other entities on the Government accounting basis ........................................ 824,058 260,907 28,984 1,113,949
Total ....................................................................................................................... 5,676,098 518,769 9,922,652 16,117,519
1 All Crown corporations listed at the margin in this table are parent Crown corporations. 2 These entities, which are not Crown corporations or agents of the Crown, are considered other consolidated entities.

Public Accounts of Canada, 2015–2016
Consolidated accounts 4 . 5
Liabilities
Third parties
Government, Accumulated Equity Total Crown corporations Total profits Contributed Capital of liabilities
Borrowings Other and other entities liabilities (losses) surplus stock Canada and equity
– 8,043,175 748,249 8,791,424 (7,992,907) 173,153 15,000 (7,804,754) 986,670 – 80,108 339 80,447 280,745 – – 280,745 361,192
– 2,854 1,415,253 1,418,107 5,289 – – 5,289 1,423,396 – 118,678 603 119,281 436,223 – – 436,223 555,504
361,427 613,743 22 975,192 1,515,452 – – 1,515,452 2,490,644 – 3,786,884 215 3,787,099 18,669 10,000 – 28,669 3,815,768
2,261 53,272 50,215 105,748 – – – – 105,748 – 180,157 161,738 341,895 480 – – 480 342,375 – 24,840 239,511 264,351 68,660 – – 68,660 333,011 – 8,618 19,872 28,490 2,476 – – 2,476 30,966 – 36,559 171,502 208,061 (7,889) – – (7,889) 200,172 – 351 78 429 28,063 – – 28,063 28,492 – 11,999 107 12,106 19,767 – – 19,767 31,873 – 33,716 745 34,461 26,666 – – 26,666 61,127
88,312 30,483 31,148 149,943 238,803 – – 238,803 388,746 – 59,162 12,290 71,452 17,839 – – 17,839 89,291 – 141,796 – 141,796 461,419 – – 461,419 603,215 – 101,299 2,626 103,925 483,889 – – 483,889 587,814 – 15,131 69,707 84,838 (1,326) – – (1,326) 83,512 – 140,858 7,343 148,201 648,106 – – 648,106 796,307 – 7,946 88,136 96,082 9,194 – – 9,194 105,276 – 8,578 91,432 100,010 13,273 – – 13,273 113,283 – 5,930 3 5,933 5,339 – – 5,339 11,272 – 42,866 152 43,018 26,108 – – 26,108 69,126 – 206,430 916,317 1,122,747 286,669 – 9,300 295,969 1,418,716 – 28,944 – 28,944 118,321 – – 118,321 147,265
452,000 13,784,377 4,027,603 18,263,980 (3,290,672) 183,153 24,300 (3,083,219) 15,180,761
– (30,706) (3,757,397) (3,788,103) 3,818,365 (183,153) (24,300) 3,610,912 (177,191)
452,000 13,753,671 270,206 14,475,877 527,693 – – 527,693 15,003,570
– 1,000 550,611 551,611 – – – – 551,611 – 1,019 14,795 15,814 – – – – 15,814 – 44,012 302,634 346,646 – – – – 346,646 – 111,649 9,778 121,427 55,881 – – 55,881 177,308 – 2 21,438 21,440 – – – – 21,440 – 2 1,958 1,960 – – – – 1,960
– 157,684 901,214 1,058,898 55,881 – – 55,881 1,114,779
– – (879,979) (879,979) 879,149 – – 879,149 (830)
– 157,684 21,235 178,919 935,030 – – 935,030 1,113,949
452,000 13,911,355 291,441 14,654,796 1,462,723 – – 1,462,723 16,117,519
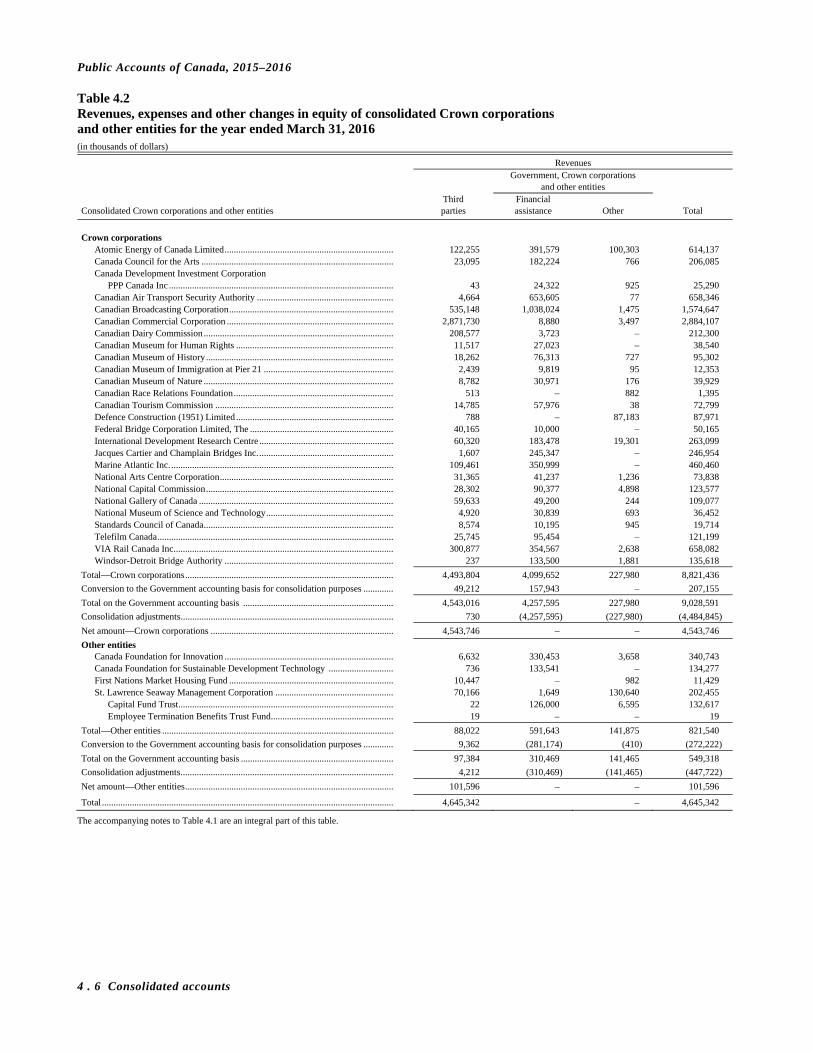
Public Accounts of Canada, 2015–2016
4 . 6 Consolidated accounts
Table 4.2 Revenues, expenses and other changes in equity of consolidated Crown corporations and other entities for the year ended March 31, 2016 (in thousands of dollars)
Revenues Government, Crown corporations and other entities Third Financial Consolidated Crown corporations and other entities parties assistance Other Total
Crown corporations
Atomic Energy of Canada Limited ......................................................................... 122,255 391,579 100,303 614,137 Canada Council for the Arts ................................................................................... 23,095 182,224 766 206,085 Canada Development Investment Corporation
PPP Canada Inc ................................................................................................. 43 24,322 925 25,290 Canadian Air Transport Security Authority ........................................................... 4,664 653,605 77 658,346 Canadian Broadcasting Corporation ....................................................................... 535,148 1,038,024 1,475 1,574,647 Canadian Commercial Corporation ........................................................................ 2,871,730 8,880 3,497 2,884,107 Canadian Dairy Commission .................................................................................. 208,577 3,723 – 212,300 Canadian Museum for Human Rights .................................................................... 11,517 27,023 – 38,540 Canadian Museum of History ................................................................................. 18,262 76,313 727 95,302 Canadian Museum of Immigration at Pier 21 ........................................................ 2,439 9,819 95 12,353 Canadian Museum of Nature .................................................................................. 8,782 30,971 176 39,929 Canadian Race Relations Foundation ..................................................................... 513 – 882 1,395 Canadian Tourism Commission ............................................................................. 14,785 57,976 38 72,799 Defence Construction (1951) Limited .................................................................... 788 – 87,183 87,971 Federal Bridge Corporation Limited, The .............................................................. 40,165 10,000 – 50,165 International Development Research Centre .......................................................... 60,320 183,478 19,301 263,099 Jacques Cartier and Champlain Bridges Inc. .......................................................... 1,607 245,347 – 246,954 Marine Atlantic Inc. ................................................................................................ 109,461 350,999 – 460,460 National Arts Centre Corporation ........................................................................... 31,365 41,237 1,236 73,838 National Capital Commission ................................................................................. 28,302 90,377 4,898 123,577 National Gallery of Canada .................................................................................... 59,633 49,200 244 109,077 National Museum of Science and Technology ....................................................... 4,920 30,839 693 36,452 Standards Council of Canada .................................................................................. 8,574 10,195 945 19,714 Telefilm Canada ...................................................................................................... 25,745 95,454 – 121,199 VIA Rail Canada Inc. .............................................................................................. 300,877 354,567 2,638 658,082 Windsor-Detroit Bridge Authority ......................................................................... 237 133,500 1,881 135,618
Total—Crown corporations .......................................................................................... 4,493,804 4,099,652 227,980 8,821,436
Conversion to the Government accounting basis for consolidation purposes ............. 49,212 157,943 – 207,155
Total on the Government accounting basis ................................................................. 4,543,016 4,257,595 227,980 9,028,591
Consolidation adjustments ............................................................................................ 730 (4,257,595) (227,980) (4,484,845)
Net amount—Crown corporations ............................................................................... 4,543,746 – – 4,543,746
Other entities Canada Foundation for Innovation ......................................................................... 6,632 330,453 3,658 340,743 Canada Foundation for Sustainable Development Technology ............................ 736 133,541 – 134,277 First Nations Market Housing Fund ....................................................................... 10,447 – 982 11,429 St. Lawrence Seaway Management Corporation ................................................... 70,166 1,649 130,640 202,455
Capital Fund Trust ............................................................................................. 22 126,000 6,595 132,617 Employee Termination Benefits Trust Fund ..................................................... 19 – – 19
Total—Other entities .................................................................................................... 88,022 591,643 141,875 821,540
Conversion to the Government accounting basis for consolidation purposes ............. 9,362 (281,174) (410) (272,222)
Total on the Government accounting basis .................................................................. 97,384 310,469 141,465 549,318
Consolidation adjustments ............................................................................................ 4,212 (310,469) (141,465) (447,722)
Net amount—Other entities .......................................................................................... 101,596 – – 101,596
Total .............................................................................................................................. 4,645,342 – 4,645,342
The accompanying notes to Table 4.1 are an integral part of this table.
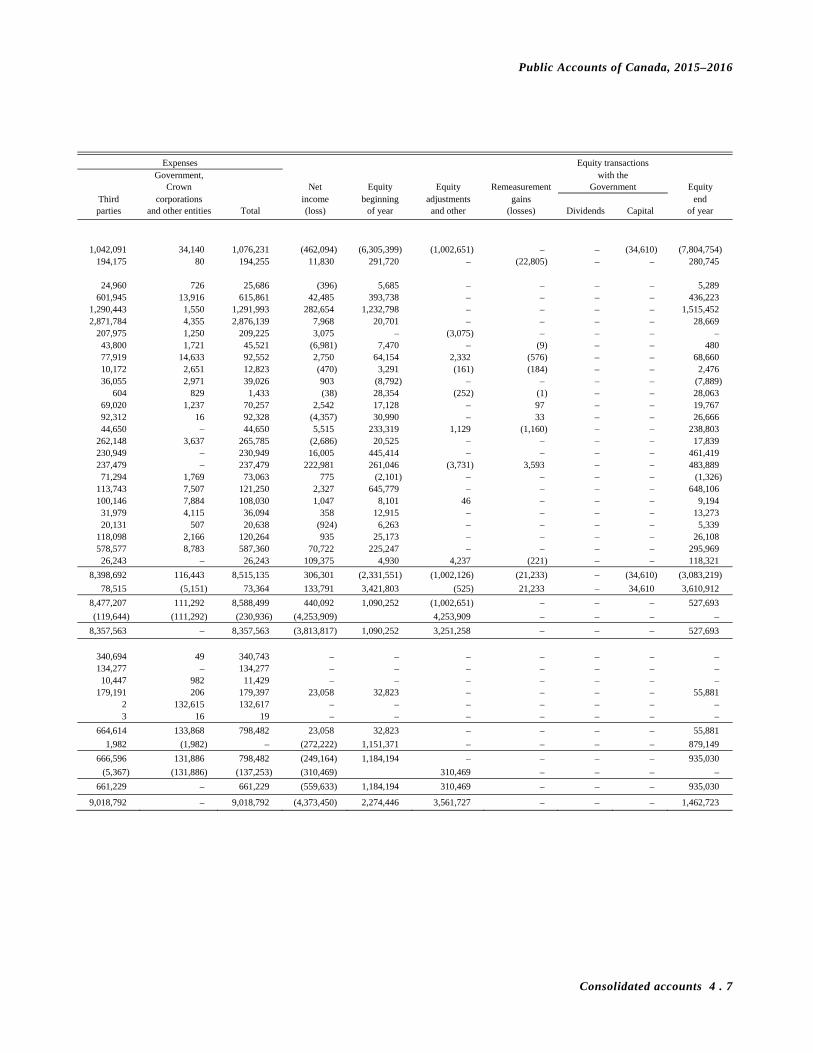
Public Accounts of Canada, 2015–2016
Consolidated accounts 4 . 7
Expenses Equity transactions Government, with the
Crown Net Equity Equity Remeasurement Government Equity Third corporations income beginning adjustments gains end parties and other entities Total (loss) of year and other (losses) Dividends Capital of year
1,042,091 34,140 1,076,231 (462,094) (6,305,399) (1,002,651) – – (34,610) (7,804,754) 194,175 80 194,255 11,830 291,720 – (22,805) – – 280,745
24,960 726 25,686 (396) 5,685 – – – – 5,289
601,945 13,916 615,861 42,485 393,738 – – – – 436,223 1,290,443 1,550 1,291,993 282,654 1,232,798 – – – – 1,515,452 2,871,784 4,355 2,876,139 7,968 20,701 – – – – 28,669
207,975 1,250 209,225 3,075 – (3,075) – – – – 43,800 1,721 45,521 (6,981) 7,470 – (9) – – 480 77,919 14,633 92,552 2,750 64,154 2,332 (576) – – 68,660 10,172 2,651 12,823 (470) 3,291 (161) (184) – – 2,476 36,055 2,971 39,026 903 (8,792) – – – – (7,889)
604 829 1,433 (38) 28,354 (252) (1) – – 28,063 69,020 1,237 70,257 2,542 17,128 – 97 – – 19,767 92,312 16 92,328 (4,357) 30,990 – 33 – – 26,666 44,650 – 44,650 5,515 233,319 1,129 (1,160) – – 238,803
262,148 3,637 265,785 (2,686) 20,525 – – – – 17,839 230,949 – 230,949 16,005 445,414 – – – – 461,419 237,479 – 237,479 222,981 261,046 (3,731) 3,593 – – 483,889 71,294 1,769 73,063 775 (2,101) – – – – (1,326)
113,743 7,507 121,250 2,327 645,779 – – – – 648,106 100,146 7,884 108,030 1,047 8,101 46 – – – 9,194 31,979 4,115 36,094 358 12,915 – – – – 13,273 20,131 507 20,638 (924) 6,263 – – – – 5,339
118,098 2,166 120,264 935 25,173 – – – – 26,108 578,577 8,783 587,360 70,722 225,247 – – – – 295,969 26,243 – 26,243 109,375 4,930 4,237 (221) – – 118,321
8,398,692 116,443 8,515,135 306,301 (2,331,551) (1,002,126) (21,233) – (34,610) (3,083,219)
78,515 (5,151) 73,364 133,791 3,421,803 (525) 21,233 – 34,610 3,610,912
8,477,207 111,292 8,588,499 440,092 1,090,252 (1,002,651) – – – 527,693
(119,644) (111,292) (230,936) (4,253,909) 4,253,909 – – – –
8,357,563 – 8,357,563 (3,813,817) 1,090,252 3,251,258 – – – 527,693
340,694 49 340,743 – – – – – – – 134,277 – 134,277 – – – – – – – 10,447 982 11,429 – – – – – – –
179,191 206 179,397 23,058 32,823 – – – – 55,881 2 132,615 132,617 – – – – – – – 3 16 19 – – – – – – –
664,614 133,868 798,482 23,058 32,823 – – – – 55,881
1,982 (1,982) – (272,222) 1,151,371 – – – – 879,149
666,596 131,886 798,482 (249,164) 1,184,194 – – – – 935,030
(5,367) (131,886) (137,253) (310,469) 310,469 – – – –
661,229 – 661,229 (559,633) 1,184,194 310,469 – – – 935,030
9,018,792 – 9,018,792 (4,373,450) 2,274,446 3,561,727 – – – 1,462,723
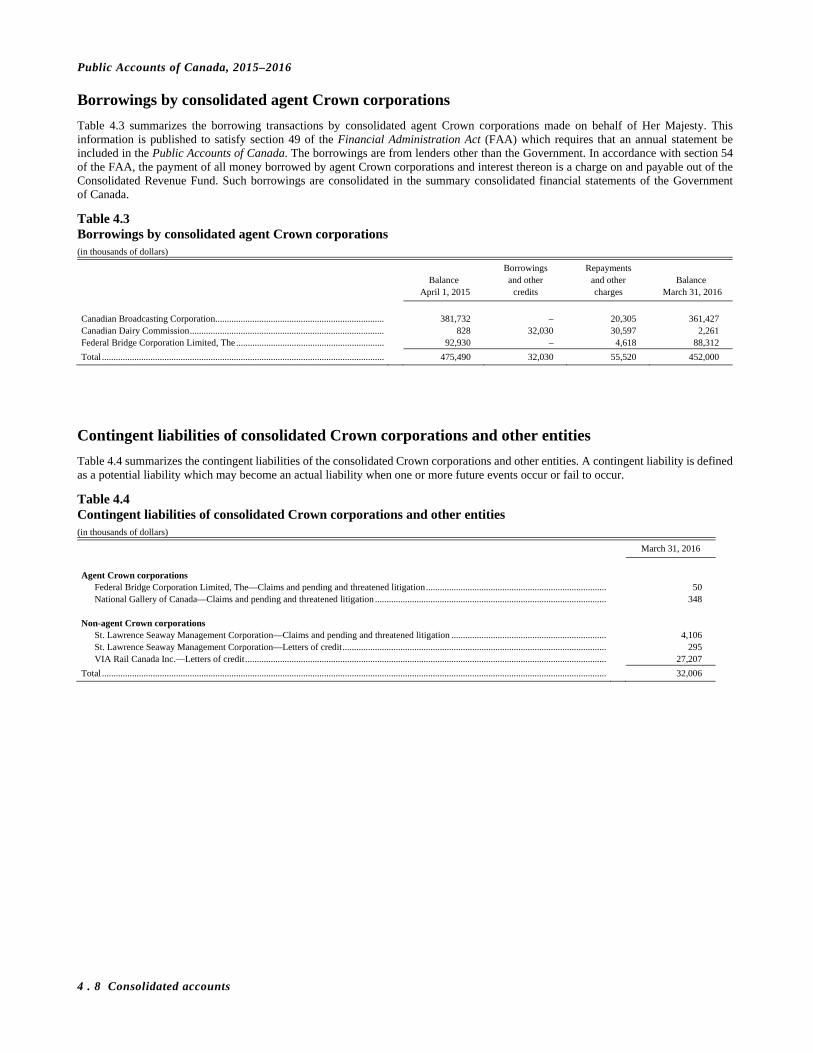
Public Accounts of Canada, 2015–2016
4 . 8 Consolidated accounts
Borrowings by consolidated agent Crown corporations
Table 4.3 summarizes the borrowing transactions by consolidated agent Crown corporations made on behalf of Her Majesty. This information is published to satisfy section 49 of the Financial Administration Act (FAA) which requires that an annual statement be included in the Public Accounts of Canada. The borrowings are from lenders other than the Government. In accordance with section 54 of the FAA, the payment of all money borrowed by agent Crown corporations and interest thereon is a charge on and payable out of the Consolidated Revenue Fund. Such borrowings are consolidated in the summary consolidated financial statements of the Government of Canada.
Table 4.3 Borrowings by consolidated agent Crown corporations (in thousands of dollars)
Borrowings Repayments Balance and other and other Balance April 1, 2015 credits charges March 31, 2016
Canadian Broadcasting Corporation......................................................................... 381,732 – 20,305 361,427 Canadian Dairy Commission .................................................................................... 828 32,030 30,597 2,261 Federal Bridge Corporation Limited, The ................................................................ 92,930 – 4,618 88,312
Total .......................................................................................................................... 475,490 32,030 55,520 452,000
Contingent liabilities of consolidated Crown corporations and other entities
Table 4.4 summarizes the contingent liabilities of the consolidated Crown corporations and other entities. A contingent liability is defined as a potential liability which may become an actual liability when one or more future events occur or fail to occur.
Table 4.4 Contingent liabilities of consolidated Crown corporations and other entities (in thousands of dollars)
March 31, 2016
Agent Crown corporations
Federal Bridge Corporation Limited, The—Claims and pending and threatened litigation .............................................................................. 50 National Gallery of Canada—Claims and pending and threatened litigation .................................................................................................... 348
Non-agent Crown corporations
St. Lawrence Seaway Management Corporation—Claims and pending and threatened litigation ................................................................... 4,106 St. Lawrence Seaway Management Corporation—Letters of credit .................................................................................................................. 295 VIA Rail Canada Inc.—Letters of credit ............................................................................................................................................................ 27,207
Total .......................................................................................................................................................................................................................... 32,006
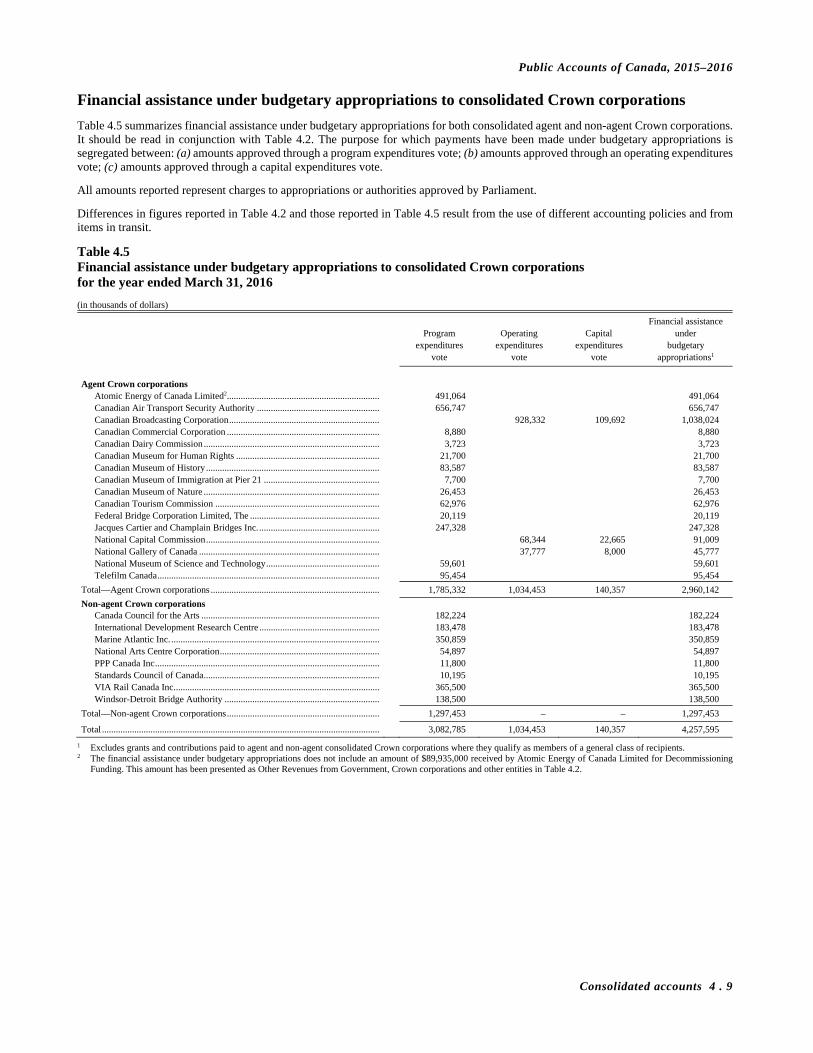
Public Accounts of Canada, 2015–2016
Consolidated accounts 4 . 9
Financial assistance under budgetary appropriations to consolidated Crown corporations
Table 4.5 summarizes financial assistance under budgetary appropriations for both consolidated agent and non-agent Crown corporations. It should be read in conjunction with Table 4.2. The purpose for which payments have been made under budgetary appropriations is segregated between: (a) amounts approved through a program expenditures vote; (b) amounts approved through an operating expenditures vote; (c) amounts approved through a capital expenditures vote.
All amounts reported represent charges to appropriations or authorities approved by Parliament.
Differences in figures reported in Table 4.2 and those reported in Table 4.5 result from the use of different accounting policies and from items in transit.
Table 4.5 Financial assistance under budgetary appropriations to consolidated Crown corporations for the year ended March 31, 2016
(in thousands of dollars)
Financial assistance Program Operating Capital under expenditures expenditures expenditures budgetary vote vote vote appropriations1
Agent Crown corporations
Atomic Energy of Canada Limited2.................................................................. 491,064 491,064 Canadian Air Transport Security Authority ..................................................... 656,747 656,747 Canadian Broadcasting Corporation ................................................................. 928,332 109,692 1,038,024 Canadian Commercial Corporation .................................................................. 8,880 8,880 Canadian Dairy Commission ............................................................................ 3,723 3,723 Canadian Museum for Human Rights .............................................................. 21,700 21,700 Canadian Museum of History ........................................................................... 83,587 83,587 Canadian Museum of Immigration at Pier 21 .................................................. 7,700 7,700 Canadian Museum of Nature ............................................................................ 26,453 26,453 Canadian Tourism Commission ....................................................................... 62,976 62,976 Federal Bridge Corporation Limited, The ........................................................ 20,119 20,119 Jacques Cartier and Champlain Bridges Inc. .................................................... 247,328 247,328 National Capital Commission ........................................................................... 68,344 22,665 91,009 National Gallery of Canada .............................................................................. 37,777 8,000 45,777 National Museum of Science and Technology ................................................. 59,601 59,601 Telefilm Canada ................................................................................................ 95,454 95,454
Total—Agent Crown corporations ......................................................................... 1,785,332 1,034,453 140,357 2,960,142
Non-agent Crown corporations Canada Council for the Arts ............................................................................. 182,224 182,224 International Development Research Centre .................................................... 183,478 183,478 Marine Atlantic Inc. .......................................................................................... 350,859 350,859 National Arts Centre Corporation ..................................................................... 54,897 54,897 PPP Canada Inc ................................................................................................. 11,800 11,800 Standards Council of Canada ............................................................................ 10,195 10,195 VIA Rail Canada Inc. ........................................................................................ 365,500 365,500 Windsor-Detroit Bridge Authority ................................................................... 138,500 138,500
Total—Non-agent Crown corporations .................................................................. 1,297,453 – – 1,297,453
Total ........................................................................................................................ 3,082,785 1,034,453 140,357 4,257,595
1 Excludes grants and contributions paid to agent and non-agent consolidated Crown corporations where they qualify as members of a general class of recipients. 2 The financial assistance under budgetary appropriations does not include an amount of $89,935,000 received by Atomic Energy of Canada Limited for Decommissioning
Funding. This amount has been presented as Other Revenues from Government, Crown corporations and other entities in Table 4.2.

Public Accounts of Canada, 2015–2016
4 . 10 Consolidated accounts
Consolidated specified purpose accounts
Consolidated specified purpose accounts are particular categories of revenues and expenses whereby legislation requires that revenues received for purposes specified in the legislation be credited to these accounts and that related payments be charged to the accounts. They are principally used where the activities are similar in nature to departmental activities and the transactions do not represent future liabilities to third parties but in essence constitute Government revenues and expenses.
The transactions of these accounts are reported with revenues and expenses, in order to provide a more comprehensive reporting of the Government’s operating results.
Further, enabling legislation requires that the transactions in each of these accounts be accounted for separately. Table 4.6 presents a summary of the balances and transactions of these accounts, in the manner required by legislation. A narrative description is provided for accounts reported in Table 4.6. Such descriptions follow the same presentation order as their respective tables.
The financial statements of the Employment Insurance Operating Account, together with the Independent Auditor’s Report thereon, are presented at the end of this section.
Table 4.6 Consolidated specified purpose accounts (in dollars)
Revenues and other credits Expenses and other debits
External Internal External Internal April 1, 2015 transactions transactions transactions transactions March 31, 2016
Insurance accounts
Agriculture and Agri-Food Crop Reinsurance Fund .......................................... 571,590,655 1,374,595 – – – 572,965,250 Less: Interest-bearing loans ................................... 277,514,751 – – – – 277,514,751
294,075,904 1,374,595 – – – 295,450,499 Agricultural Commodities Stabilization
Accounts ........................................................... 646,510 – – – – 646,510 294,722,414 1,374,595 – – – 296,097,009
Families, Children and Social Development Employment and Social Development
Employment Insurance Operating Account, Table 4.7 ..................................................... 521,706,229 23,165,039,112 421,071,942 19,725,643,347 1,467,244,991 2,914,928,945
Finance Investors' Indemnity Account ................................ 45,303 – – – – 45,303
Health Health Insurance Supplementary Account ............. 28,386 – – – – 28,386
Natural Resources Canadian Nuclear Safety Commission
Nuclear Liability Reinsurance Account ........... 3,621,756 197,489 – – – 3,819,245 Transport
Ship-Source Oil Pollution Fund ............................. 409,760,129 1,005 3,009,550 1,272,635 209,862 411,288,187
Total insurance accounts ................................................... 1,229,884,217 23,166,612,201 424,081,492 19,726,915,982 1,467,454,853 3,626,207,075

Public Accounts of Canada, 2015–2016
Consolidated accounts 4 . 11
Table 4.6 Consolidated specified purpose accounts—concluded (in dollars)
Revenues and other credits Expenses and other debits
External Internal External Internal April 1, 2015 transactions transactions transactions transactions March 31, 2016
Other consolidated specified purpose accounts
Canadian Heritage National Battlefields Commission
Trust Fund ........................................................ 784,493 8,500 2,971 473 19,796 775,695 Environment and Climate Change
Environment Court award deposits
Other than Environmental Damages Fund . 465,395 40,009 – 70,870 – 434,534 Environmental Damages Fund ......................... 9,887,757 3,064,452 346,223 868,924 – 12,429,508
Parks Canada Agency New Parks and Historic Sites Account ............ 15,082,760 399,932 1,625,000 1,459,859 929,573 14,718,260
25,435,912 3,504,393 1,971,223 2,399,653 929,573 27,582,302 Finance
Canadian Commercial Bank and Northland Bank Holdback Account ................. 246,223,464 – – – – 246,223,464
Fisheries, Oceans and the Canadian Coast Guard Fisheries and Oceans
Supplementary Fines Account Species at Risk Act ...................................... 35,000 – – – – 35,000
Supplementary Fish Fines Account.................. 1,676,530 47,650 – 112,069 – 1,612,111 1,711,530 47,650 – 112,069 – 1,647,111
Indigenous and Northern Affairs Indian Affairs and Northern Development
Cleanup costs for environmental damage caused by Bowater ...................................... 2,126,165 – – 28,325 – 2,097,840
Environmental Studies Research Fund ............ 1,322,590 – 1,109,787 – 1,322,590 1,109,787 3,448,755 – 1,109,787 28,325 1,322,590 3,207,627
Natural Resources Environmental Studies Research Fund .................. 3,534,505 3,398,930 – 1,962,983 1,723,639 3,246,813
Public Services and Procurement Public Works and Government Services
Seized Property Proceeds Account .................. 18,969,222 32,686,144 – 14,145,455 – 37,509,911 Transport
Fines for the transportation of dangerous goods ............................................... 514,074 – – – – 514,074
Total other consolidated specified purpose accounts ........ 300,621,955 39,645,617 3,083,981 18,648,958 3,995,598 320,706,997
Endowment principal
Environment and Climate Change Parks Canada Agency
Mackenzie King Trust Account ....................... 225,000 – – – – 225,000 Health
Canadian Institutes of Health Research Endowments for Health Research .................... 140,267 – – – – 140,267
Innovation, Science and Economic development National Research Council of Canada
H.L. Holmes Fund ............................................ 5,005,889 63,866 – – – 5,069,755 W.G. Schneider Fund ....................................... 30,000 – – – – 30,000
Social Sciences and Humanities Research Council
Queen's Fellowship Fund ................................. 250,000 – – – – 250,000 5,285,889 63,866 – – – 5,349,755
Total endowment principal ................................................ 5,651,156 63,866 – – – 5,715,022
Total .................................................................................. 1,536,157,328 23,206,321,684 427,165,473 19,745,564,940 1,471,450,451 3,952,629,094

Public Accounts of Canada, 2015–2016
4 . 12 Consolidated accounts
Insurance accounts
For the following Insurance Accounts, revenues and other credits from outside parties totalled $23,167 million ($22,628 million in 2015) while expenses and other debits to outside parties totalled $19,727 million ($18,289 million in 2015) and are reported as expenses in the Consolidated Statement of Operations and Accumulated Deficit.
Revenues and other credits of $424 million ($404 million in 2015) and expenses and other debits of $1,467 million ($1,471 million in 2015) internal to the operations of the Government, have been eliminated in order to present transactions with outside parties.
Crop Reinsurance Fund
This Fund, continued in the accounts of Canada pursuant to subsection 13(1) of the Farm Income Protection Act, provides insurance to participating provinces for deficits they might incur in their agriculture insurance funds. The Crop Reinsurance Fund currently operates under the authority of the Farm Income Protection Act.
The revenues of the Fund come from a percentage of total premiums collected by provinces for the purpose of insurance of agricultural production. Both the amount of revenue collected and expenditures from the Crop Reinsurance Fund paid to provinces are subject to the terms of reinsurance agreements. When there are insufficient revenues in the Crop Reinsurance Fund to make payments, the Minister of Finance may authorize an advance of additional funds to cover these obligations. These advances are recovered from future revenues. Currently, the interest rate earned on surpluses in the Crop Reinsurance Fund and the interest rate charged to advances to the Fund have been set by the Department of Finance at zero per cent.
Agricultural Commodities Stabilization Accounts
The purpose of these accounts was to reduce income loss to producers from market risks through stabilizing prices. Premiums were shared equally by the Government of Canada, the governments of participating provinces and participating producers.
These accounts are continued in the accounts of Canada pursuant to subsection 16(2) of the Farm Income Protection Act. Current activities are limited to collection of accounts receivable. The Agricultural Stabilization Act, under which the commodity accounts formerly operated, has been repealed and replaced by the Farm Income Protection Act effective April 1, 1991.
Employment Insurance Operating Account
The Canada Employment Insurance Commission (the Commission), a departmental corporation named in Schedule II to the Financial Administration Act, administers the Employment Insurance Act (the Act). The Commission is co-managed by the Government, workers and employers. The objective of the Act is to provide short-term financial relief and other assistance to eligible workers. The financial transactions relating to this objective are reported through the Employment Insurance Operating Account.
The Employment Insurance Operating Account (the Account) was established in the accounts of Canada by the Act. All amounts received under the Act are deposited in the Consolidated Revenue Fund and credited to the Account. The benefits and the costs of administration of the Act are paid out to the Consolidated Revenue Fund and charged to the Account.
Employee premium rate for each $100 of insurable earnings was $1.88 from January 1, 2015 to December 31, 2015 for employees without a Provincial Parental Insurance Plan and $1.54 for the others. From January 1, 2016 to March 31, 2016, the rate was $1.88 for employees without a Provincial Parental Insurance Plan and $1.52 for the others.
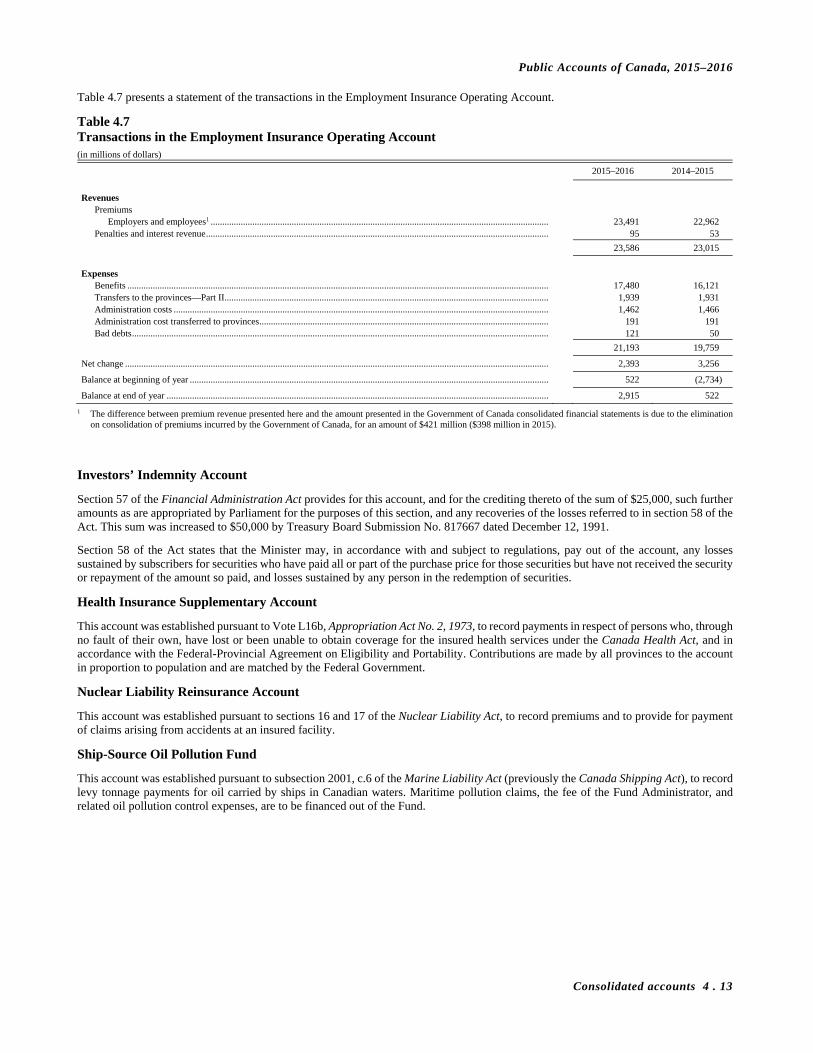
Public Accounts of Canada, 2015–2016
Consolidated accounts 4 . 13
Table 4.7 presents a statement of the transactions in the Employment Insurance Operating Account.
Table 4.7 Transactions in the Employment Insurance Operating Account (in millions of dollars)
2015–2016 2014–2015
Revenues
Premiums Employers and employees1 .................................................................................................................................................. 23,491 22,962
Penalties and interest revenue .................................................................................................................................................... 95 53
23,586 23,015
Expenses
Benefits ...................................................................................................................................................................................... 17,480 16,121 Transfers to the provinces—Part II ............................................................................................................................................ 1,939 1,931 Administration costs .................................................................................................................................................................. 1,462 1,466 Administration cost transferred to provinces ............................................................................................................................. 191 191 Bad debts .................................................................................................................................................................................... 121 50
21,193 19,759
Net change ....................................................................................................................................................................................... 2,393 3,256
Balance at beginning of year ........................................................................................................................................................... 522 (2,734)
Balance at end of year ..................................................................................................................................................................... 2,915 522
1 The difference between premium revenue presented here and the amount presented in the Government of Canada consolidated financial statements is due to the elimination on consolidation of premiums incurred by the Government of Canada, for an amount of $421 million ($398 million in 2015).
Investors’ Indemnity Account
Section 57 of the Financial Administration Act provides for this account, and for the crediting thereto of the sum of $25,000, such further amounts as are appropriated by Parliament for the purposes of this section, and any recoveries of the losses referred to in section 58 of the Act. This sum was increased to $50,000 by Treasury Board Submission No. 817667 dated December 12, 1991.
Section 58 of the Act states that the Minister may, in accordance with and subject to regulations, pay out of the account, any losses sustained by subscribers for securities who have paid all or part of the purchase price for those securities but have not received the security or repayment of the amount so paid, and losses sustained by any person in the redemption of securities.
Health Insurance Supplementary Account
This account was established pursuant to Vote L16b, Appropriation Act No. 2, 1973, to record payments in respect of persons who, through no fault of their own, have lost or been unable to obtain coverage for the insured health services under the Canada Health Act, and in accordance with the Federal-Provincial Agreement on Eligibility and Portability. Contributions are made by all provinces to the account in proportion to population and are matched by the Federal Government.
Nuclear Liability Reinsurance Account
This account was established pursuant to sections 16 and 17 of the Nuclear Liability Act, to record premiums and to provide for payment of claims arising from accidents at an insured facility.
Ship-Source Oil Pollution Fund
This account was established pursuant to subsection 2001, c.6 of the Marine Liability Act (previously the Canada Shipping Act), to record levy tonnage payments for oil carried by ships in Canadian waters. Maritime pollution claims, the fee of the Fund Administrator, and related oil pollution control expenses, are to be financed out of the Fund.
Public Accounts of Canada, 2015–2016
4 . 14 Consolidated accounts
Other consolidated specified purpose accounts
For the following other consolidated specified purpose accounts, revenues and other credits from outside parties of $40 million ($41 million in 2015) are reported while expenses and other debits to outside parties of $19 million ($54 million in 2015) are reported in the Consolidated Statement of Operations and Accumulated Deficit.
Revenues and other credits of $3 million ($2 million in 2015), and expenses and other debits of $4 million ($4 million in 2015) internal to the operations of the Government, have been eliminated in order to present transactions with outside parties.
Trust Fund
This account was established at the creation of the National Battlefields Commission for the purpose of acquiring various properties for the development of the park. The funds are received by way of private contributions, from municipal corporations, provincial governments and others, and deposited for the purposes of the Commission, as prescribed for in its incorporation Act. Following the land acquisitions of the Commission, funds remained in the account and increased over a period of years as a result of interest earned, while the Commission was listed in Schedule C of the Financial Administration Act, prior to September 1, 1984.
Court Award Deposits—Other than Environmental Damages Fund
This account was established for the management of court orders/awards or other financial compensation to Environment Canada that are not under the legal authority of the Environmental Damages Fund.
Environmental Damages Fund
This account was established for the management of court orders/awards or other financial compensation to Environment Canada for damages to the environment.
New Parks and Historic Sites Account
This account was established pursuant to the Parks Canada Agency Act to record payments to be used to acquire lands or property required to establish any national park, national historic site or other protected heritage area that has not yet attained full operation status, and to make any related contributions.
Canadian Commercial Bank and Northland Bank Holdback Account
This account was established to record the amount held from the recovery of monies received from the winding up of Canadian Commercial Bank and Northland Bank.
During the fiscal year, no claims have been received for potential payments from the holdback.
Supplementary Fines Account—Species at Risk Act
The account was established to record the deposit of funds received from persons declared guilty of offences under the Species at Risk Act, under paragraph 105(h) of the Act.
Supplementary Fish Fines Account
The account was established to record the deposit of funds received from persons declared guilty of offences under the Fisheries Act, under paragraph 79(2)(f) of the Act.
Cleanup costs for environmental damage caused by Bowater
This account was established pursuant to a decision of the Commercial Division of the Superior Court in the Province of Quebec. The balance in the account is to be used to finance the remediation of environmental damage caused by Bowater Canadian Forest Products Inc. relative to a land lease issued by the Department of Indian Affairs and Northern Development.
Environmental Studies Research Fund—Indian Affairs and Northern Development
This account was established pursuant to subsection 76(1) of the Canada Petroleum Resources Act. The purpose of the Fund is to finance environmental and social studies pertaining to the manner in which, and the terms and conditions under which, exploration development and production activities on frontier lands, authorized under this act or any other act of Parliament, should be conducted.
Environmental Studies Research Fund—Natural Resources
This account was established pursuant to subsection 76(1) of the Canada Petroleum Resources Act. The purpose of the Fund is to finance environmental and social studies pertaining to the manner in which, and the terms and conditions under which, exploration development and production activities on frontier lands, authorized under this act or any other act of Parliament, should be conducted.
Public Accounts of Canada, 2015–2016
Consolidated accounts 4 . 15
Seized Property Proceeds Account
This account was established, pursuant to section 13 of the Seized Property Management Act, to record the net proceeds received from the disposition of seized and forfeited properties to Her Majesty or fines imposed and also funds received from the government of foreign states pursuant to agreements for the purpose of the Act. The Act also provides that the following be charged to the Account: operating expenses incurred in carrying out the purpose of the Act, amounts paid as a result of claims and repayments of advances from the Minister of Finance, interest on drawdown from Seized Property Working Capital Account and distribution of the proceeds to the relevant jurisdictions and the Consolidated Revenue Fund.
Fines for the transportation of dangerous goods
This account was established, pursuant to the Transportation of Dangerous Goods Act, 1992 and related regulations, to record fines levied by courts.
Endowment principal
For the following endowment principal accounts, revenues and other credits from outside parties of $64,000 ($126,000 in 2015) are reported in the Consolidated Statement of Operations and Accumulated Deficit.
Mackenzie King Trust Account
The late The Right Hon W L Mackenzie King bequeathed Laurier House, Ottawa, and the sum of $225,000, to the Government of Canada. The amount of $225,000 was credited to the account and earns interest, in accordance with the terms of section 3 of the Laurier House Act. The interest is to be used to assist in the maintenance of the Laurier House, which is to be preserved as a place of historic interest, and also to provide accommodation for study and research.
Endowments for Health Research
This account was established by section 29 of the Canadian Institutes of Health Research Act to record various endowments received from donors for the purpose of health research. The interest received is used for the payment of research grants.
H.L. Holmes Fund
This account was established, pursuant to paragraph 5(1)(f) of the National Research Council Act, to record the residue of the estate of H.L. Holmes. Up to two thirds of the yearly net income from the fund shall be used to finance the H.L. Holmes Award on an annual basis. These awards will provide the opportunity to post-doctoral students to study at world famous graduate schools or research institutes under outstanding research persons.
W.G. Schneider Fund
This account was established pursuant to paragraph 5(1)(f) of the National Research Council Act, to record the residue of the estate of W.G. Schneider. The yearly net income from the fund shall be used to finance the Schneider Medal. This award recognizes employees who have made outstanding contributions to the National Research Council.
Queen’s Fellowship Fund
This fund is an endowment of $250,000 that was established by Vote 45a, Appropriation Act No. 5, 1973-74. The interest earned is used for the payment of fellowships to graduate students in certain fields of Canadian studies.
Public Accounts of Canada, 2015–2016
4 . 16 Consolidated accounts
Supplementary statement
Employment Insurance Operating Account
Management’s responsibility for financial statements
The financial statements of the Employment Insurance Operating Account are prepared in accordance with Canadian public sector accounting standards by the management of Employment and Social Development Canada (ESDC). Management is responsible for the integrity and objectivity of the information in the financial statements, including the amounts which must, of necessity, be based on best estimates and judgement. The significant accounting policies are identified in Note 2 to the financial statements.
To fulfill its accounting and reporting responsibilities, management has developed and maintains books of account, financial and management controls, information systems and management practices. These systems are designed to provide reasonable assurance that financial information is reliable, that assets are safeguarded and that transactions are properly authorized and recorded in accordance with the Employment Insurance Act and regulations, as well as the Financial Administration Act and regulations.
The Auditor General of Canada, the external auditor of the Employment Insurance Operating Account, conducts an independent audit of the financial statements in accordance with Canadian generally accepted auditing standards and provides a report to the Minister of Employment, Workforce Development and Labour.
The financial statements of the Employment Insurance Operating Account are an integral part of the Public Accounts of Canada, which are tabled in the House of Commons and are referred to the Standing Committee on Public Accounts for examination purposes.
Louise Levonian Chairperson of the Canada
Employment Insurance Commission
Alain P. Séguin, MBA, CPA, CGA Chief Financial Officer
Employment and Social Development Canada
Gatineau, Canada September 1, 2016
Public Accounts of Canada, 2015–2016
Consolidated accounts 4 . 17
Employment Insurance Operating Account—continued
Independent Auditor’s Report
To the Minister of Employment, Workforce Development and Labour
I have audited the accompanying financial statements of the Employment Insurance Operating Account, which comprise the statement of financial position as at 31 March 2016, and the statement of operations and accumulated surplus, statement of change in net financial assets and statement of cash flow for the year then ended, and a summary of significant accounting policies and other explanatory information.
Management’s responsibility for the financial statements
Management is responsible for the preparation and fair presentation of these financial statements in accordance with Canadian public sector accounting standards, and for such internal control as management determines is necessary to enable the preparation of financial statements that are free from material misstatement, whether due to fraud or error.
Auditor’s responsibility
My responsibility is to express an opinion on these financial statements based on my audit. I conducted my audit in accordance with Canadian generally accepted auditing standards. Those standards require that I comply with ethical requirements and plan and perform the audit to obtain reasonable assurance about whether the financial statements are free from material misstatement.
An audit involves performing procedures to obtain audit evidence about the amounts and disclosures in the financial statements. The procedures selected depend on the auditor’s judgment, including the assessment of the risks of material misstatement of the financial statements, whether due to fraud or error. In making those risk assessments, the auditor considers internal control relevant to the entity’s preparation and fair presentation of the financial statements in order to design audit procedures that are appropriate in the circumstances, but not for the purpose of expressing an opinion on the effectiveness of the entity’s internal control. An audit also includes evaluating the appropriateness of accounting policies used and the reasonableness of accounting estimates made by management, as well as evaluating the overall presentation of the financial statements.
I believe that the audit evidence I have obtained is sufficient and appropriate to provide a basis for my audit opinion.
Opinion
In my opinion, the financial statements present fairly, in all material respects, the financial position of the Employment Insurance Operating Account as at 31 March 2016, and the results of its operations, changes in its net financial assets, and its cash flows for the year then ended in accordance with Canadian public sector accounting standards.
Vicki Clement, CPA, CA Principal for the Auditor General of Canada
1 September 2016 Ottawa, Canada

Public Accounts of Canada, 2015–2016
4 . 18 Consolidated accounts
Employment Insurance Operating Account—continued
Statement of financial position as at March 31 (in thousands of dollars)
2016 2015
Financial assets
Balance of the account with Receiver General for Canada ............................................................................................................. 924,112 – Premiums receivable ........................................................................................................................................................................ 1,994,721 1,823,656 Due from claimants (Note 3) ........................................................................................................................................................... 746,636 712,477
3,665,469 2,536,133
Liabilities Balance of the account with Receiver General for Canada ............................................................................................................. – 1,401,786 Benefits payable ............................................................................................................................................................................... 676,547 536,613 Amounts payable (Note 4) ............................................................................................................................................................... 73,993 76,028
750,540 2,014,427
Net financial assets and accumulated surplus .................................................................................................................................. 2,914,929 521,706
Contractual obligations (Note 11) Contingent liabilities (Note 12) The accompanying notes and schedules are an integral part of these financial statements.
Approved by:
Louise Levonian
Chairperson of the Canada Employment Insurance Commission
Alain P. Séguin, MBA, CPA, CGA
Chief Financial Officer Employment and Social Development Canada

Public Accounts of Canada, 2015–2016
Consolidated accounts 4 . 19
Employment Insurance Operating Account—continued
Statement of operations and accumulated surplus for the year ended March 31 (in thousands of dollars)
2016 2016 2015
Budget (Note 6) Actual Actual Revenues
Premiums (Note 7) ........................................................................................................................ 23,795,000 23,491,100 22,962,274 Penalties (Note 3) .......................................................................................................................... 45,000 57,220 39,666 Interest on overdue accounts receivable (Note 3) ........................................................................ 28,000 37,791 12,786
23,868,000 23,586,111 23,014,726
Expenses Benefits and support measures (Schedule I)
Income benefits (Note 8) ......................................................................................................... 16,313,000 17,632,921 16,235,790 Transfers to provinces and territories related to Labour
Market Development Agreements .................................................................................... 1,950,000 1,938,683 1,930,727 Support measures .................................................................................................................... 124,000 111,660 116,096 Benefits repayments from higher income claimants ............................................................... (233,000) (264,639) (230,430)
Administration costs (Note 9) ....................................................................................................... 1,605,000 1,653,336 1,657,055 Bad debts ....................................................................................................................................... 25,000 120,927 50,051
19,784,000 21,192,888 19,759,289
Net surplus for the year ...................................................................................................................... 4,084,000 2,393,223 3,255,437
Accumulated surplus (deficit) at the beginning of the year ............................................................... 521,706 521,706 (2,733,731)
Accumulated surplus at the end of the year ................................................................................... 4,605,706 2,914,929 521,706
The accompanying notes and schedules are an integral part of these financial statements.
Statement of change in net financial assets for the year ended March 31 (in thousands of dollars)
2016 2016 2015
Budget (Note 6) Actual Actual Net surplus for the year.................................................................................................................... 4,084,000 2,393,223 3,255,437 Net financial assets (net debt) at beginning of year ....................................................................... 521,706 521,706 (2,733,731)
Net financial assets at end of year ................................................................................................... 4,605,706 2,914,929 521,706
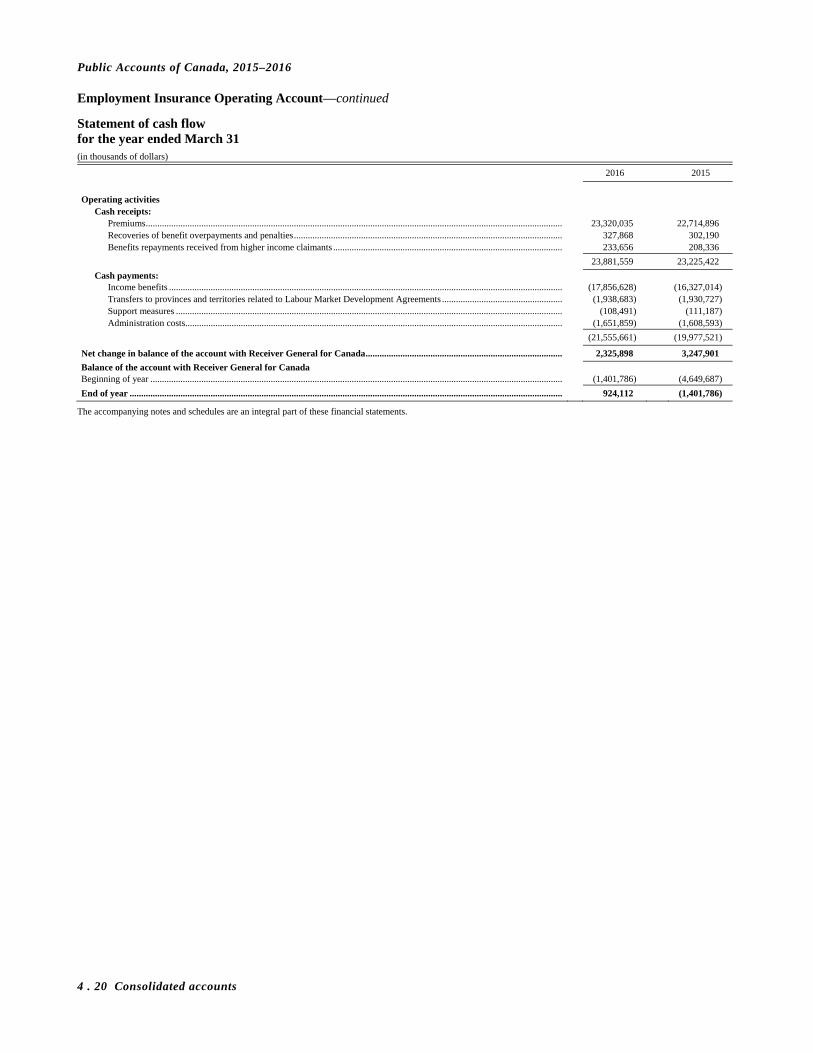
Public Accounts of Canada, 2015–2016
4 . 20 Consolidated accounts
Employment Insurance Operating Account—continued
Statement of cash flow for the year ended March 31 (in thousands of dollars)
2016 2015
Operating activities
Cash receipts: Premiums .................................................................................................................................................................................... 23,320,035 22,714,896 Recoveries of benefit overpayments and penalties .................................................................................................................... 327,868 302,190 Benefits repayments received from higher income claimants ................................................................................................... 233,656 208,336
23,881,559 23,225,422
Cash payments: Income benefits .......................................................................................................................................................................... (17,856,628) (16,327,014) Transfers to provinces and territories related to Labour Market Development Agreements .................................................... (1,938,683) (1,930,727) Support measures ....................................................................................................................................................................... (108,491) (111,187) Administration costs................................................................................................................................................................... (1,651,859) (1,608,593)
(21,555,661) (19,977,521)
Net change in balance of the account with Receiver General for Canada ..................................................................................... 2,325,898 3,247,901
Balance of the account with Receiver General for Canada Beginning of year .................................................................................................................................................................................. (1,401,786) (4,649,687)
End of year ........................................................................................................................................................................................... 924,112 (1,401,786)
The accompanying notes and schedules are an integral part of these financial statements.
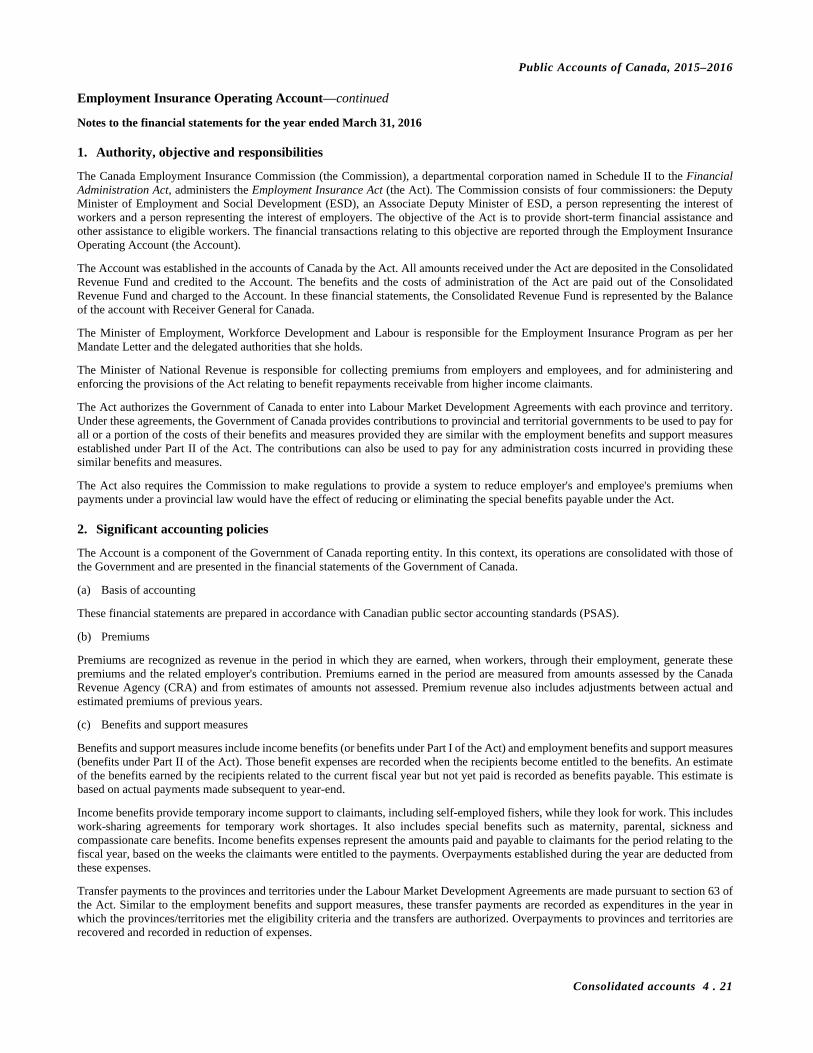
Public Accounts of Canada, 2015–2016
Consolidated accounts 4 . 21
Employment Insurance Operating Account—continued
Notes to the financial statements for the year ended March 31, 2016
1. Authority, objective and responsibilities
The Canada Employment Insurance Commission (the Commission), a departmental corporation named in Schedule II to the Financial Administration Act, administers the Employment Insurance Act (the Act). The Commission consists of four commissioners: the Deputy Minister of Employment and Social Development (ESD), an Associate Deputy Minister of ESD, a person representing the interest of workers and a person representing the interest of employers. The objective of the Act is to provide short-term financial assistance and other assistance to eligible workers. The financial transactions relating to this objective are reported through the Employment Insurance Operating Account (the Account).
The Account was established in the accounts of Canada by the Act. All amounts received under the Act are deposited in the Consolidated Revenue Fund and credited to the Account. The benefits and the costs of administration of the Act are paid out of the Consolidated Revenue Fund and charged to the Account. In these financial statements, the Consolidated Revenue Fund is represented by the Balance of the account with Receiver General for Canada.
The Minister of Employment, Workforce Development and Labour is responsible for the Employment Insurance Program as per her Mandate Letter and the delegated authorities that she holds.
The Minister of National Revenue is responsible for collecting premiums from employers and employees, and for administering and enforcing the provisions of the Act relating to benefit repayments receivable from higher income claimants.
The Act authorizes the Government of Canada to enter into Labour Market Development Agreements with each province and territory. Under these agreements, the Government of Canada provides contributions to provincial and territorial governments to be used to pay for all or a portion of the costs of their benefits and measures provided they are similar with the employment benefits and support measures established under Part II of the Act. The contributions can also be used to pay for any administration costs incurred in providing these similar benefits and measures.
The Act also requires the Commission to make regulations to provide a system to reduce employer's and employee's premiums when payments under a provincial law would have the effect of reducing or eliminating the special benefits payable under the Act.
2. Significant accounting policies
The Account is a component of the Government of Canada reporting entity. In this context, its operations are consolidated with those of the Government and are presented in the financial statements of the Government of Canada.
(a) Basis of accounting
These financial statements are prepared in accordance with Canadian public sector accounting standards (PSAS).
(b) Premiums
Premiums are recognized as revenue in the period in which they are earned, when workers, through their employment, generate these premiums and the related employer's contribution. Premiums earned in the period are measured from amounts assessed by the Canada Revenue Agency (CRA) and from estimates of amounts not assessed. Premium revenue also includes adjustments between actual and estimated premiums of previous years.
(c) Benefits and support measures
Benefits and support measures include income benefits (or benefits under Part I of the Act) and employment benefits and support measures (benefits under Part II of the Act). Those benefit expenses are recorded when the recipients become entitled to the benefits. An estimate of the benefits earned by the recipients related to the current fiscal year but not yet paid is recorded as benefits payable. This estimate is based on actual payments made subsequent to year-end.
Income benefits provide temporary income support to claimants, including self-employed fishers, while they look for work. This includes work-sharing agreements for temporary work shortages. It also includes special benefits such as maternity, parental, sickness and compassionate care benefits. Income benefits expenses represent the amounts paid and payable to claimants for the period relating to the fiscal year, based on the weeks the claimants were entitled to the payments. Overpayments established during the year are deducted from these expenses.
Transfer payments to the provinces and territories under the Labour Market Development Agreements are made pursuant to section 63 of the Act. Similar to the employment benefits and support measures, these transfer payments are recorded as expenditures in the year in which the provinces/territories met the eligibility criteria and the transfers are authorized. Overpayments to provinces and territories are recovered and recorded in reduction of expenses.
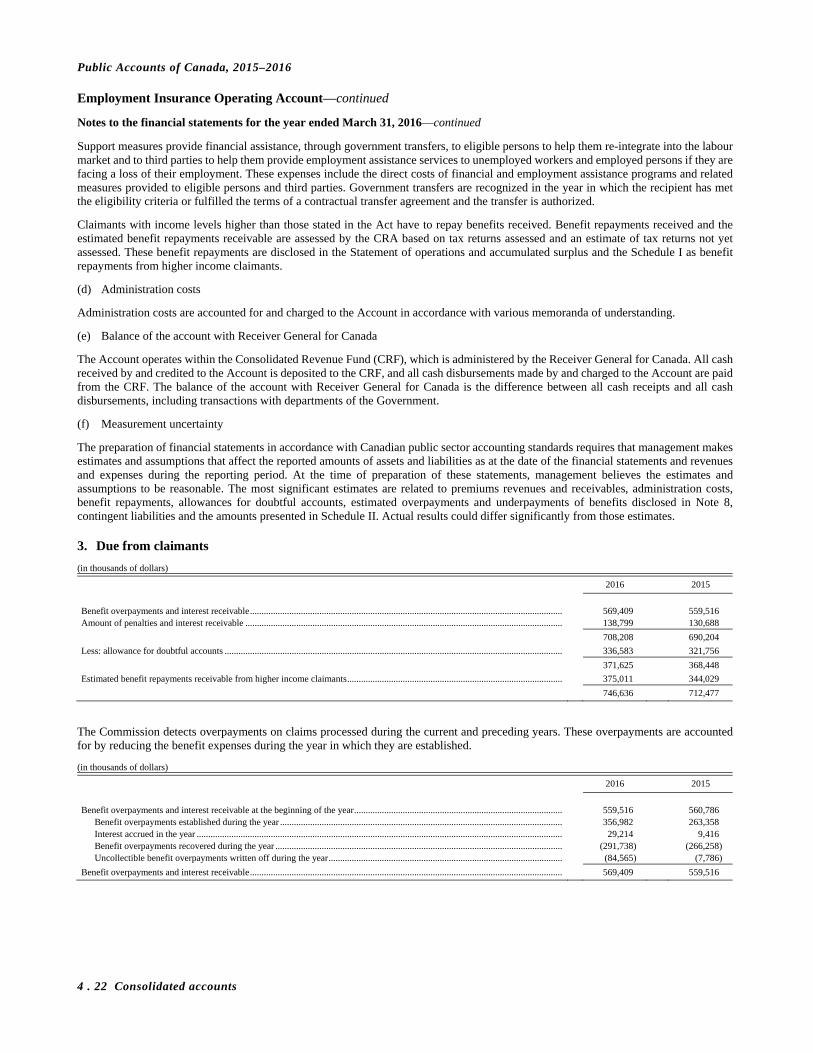
Public Accounts of Canada, 2015–2016
4 . 22 Consolidated accounts
Employment Insurance Operating Account—continued
Notes to the financial statements for the year ended March 31, 2016—continued
Support measures provide financial assistance, through government transfers, to eligible persons to help them re-integrate into the labour market and to third parties to help them provide employment assistance services to unemployed workers and employed persons if they are facing a loss of their employment. These expenses include the direct costs of financial and employment assistance programs and related measures provided to eligible persons and third parties. Government transfers are recognized in the year in which the recipient has met the eligibility criteria or fulfilled the terms of a contractual transfer agreement and the transfer is authorized.
Claimants with income levels higher than those stated in the Act have to repay benefits received. Benefit repayments received and the estimated benefit repayments receivable are assessed by the CRA based on tax returns assessed and an estimate of tax returns not yet assessed. These benefit repayments are disclosed in the Statement of operations and accumulated surplus and the Schedule I as benefit repayments from higher income claimants.
(d) Administration costs
Administration costs are accounted for and charged to the Account in accordance with various memoranda of understanding.
(e) Balance of the account with Receiver General for Canada
The Account operates within the Consolidated Revenue Fund (CRF), which is administered by the Receiver General for Canada. All cash received by and credited to the Account is deposited to the CRF, and all cash disbursements made by and charged to the Account are paid from the CRF. The balance of the account with Receiver General for Canada is the difference between all cash receipts and all cash disbursements, including transactions with departments of the Government.
(f) Measurement uncertainty
The preparation of financial statements in accordance with Canadian public sector accounting standards requires that management makes estimates and assumptions that affect the reported amounts of assets and liabilities as at the date of the financial statements and revenues and expenses during the reporting period. At the time of preparation of these statements, management believes the estimates and assumptions to be reasonable. The most significant estimates are related to premiums revenues and receivables, administration costs, benefit repayments, allowances for doubtful accounts, estimated overpayments and underpayments of benefits disclosed in Note 8, contingent liabilities and the amounts presented in Schedule II. Actual results could differ significantly from those estimates.
3. Due from claimants
(in thousands of dollars)
2016 2015
Benefit overpayments and interest receivable ....................................................................................................................................... 569,409 559,516 Amount of penalties and interest receivable ......................................................................................................................................... 138,799 130,688
708,208 690,204
Less: allowance for doubtful accounts .................................................................................................................................................. 336,583 321,756
371,625 368,448
Estimated benefit repayments receivable from higher income claimants ............................................................................................. 375,011 344,029
746,636 712,477
The Commission detects overpayments on claims processed during the current and preceding years. These overpayments are accounted for by reducing the benefit expenses during the year in which they are established.
(in thousands of dollars)
2016 2015
Benefit overpayments and interest receivable at the beginning of the year .......................................................................................... 559,516 560,786
Benefit overpayments established during the year .......................................................................................................................... 356,982 263,358 Interest accrued in the year .............................................................................................................................................................. 29,214 9,416 Benefit overpayments recovered during the year ............................................................................................................................ (291,738) (266,258) Uncollectible benefit overpayments written off during the year ..................................................................................................... (84,565) (7,786)
Benefit overpayments and interest receivable ....................................................................................................................................... 569,409 559,516
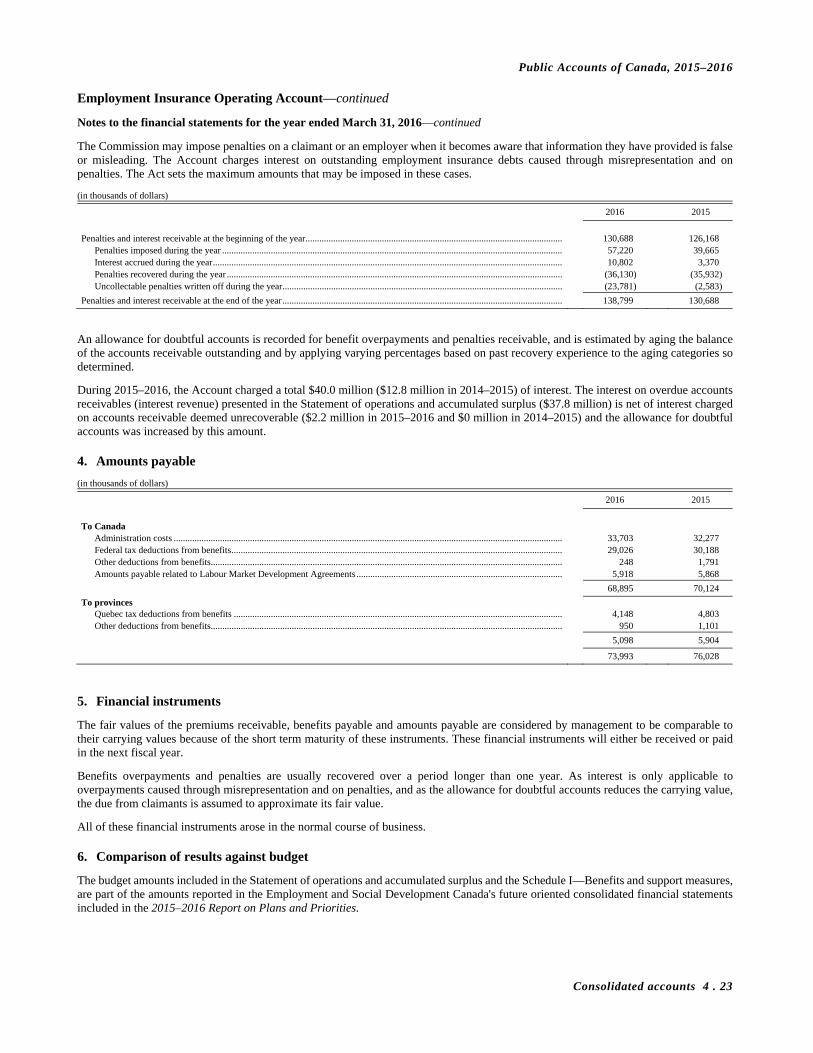
Public Accounts of Canada, 2015–2016
Consolidated accounts 4 . 23
Employment Insurance Operating Account—continued
Notes to the financial statements for the year ended March 31, 2016—continued
The Commission may impose penalties on a claimant or an employer when it becomes aware that information they have provided is false or misleading. The Account charges interest on outstanding employment insurance debts caused through misrepresentation and on penalties. The Act sets the maximum amounts that may be imposed in these cases.
(in thousands of dollars)
2016 2015
Penalties and interest receivable at the beginning of the year ............................................................................................................... 130,688 126,168
Penalties imposed during the year ................................................................................................................................................... 57,220 39,665 Interest accrued during the year ....................................................................................................................................................... 10,802 3,370 Penalties recovered during the year ................................................................................................................................................. (36,130) (35,932) Uncollectable penalties written off during the year ......................................................................................................................... (23,781) (2,583)
Penalties and interest receivable at the end of the year ......................................................................................................................... 138,799 130,688
An allowance for doubtful accounts is recorded for benefit overpayments and penalties receivable, and is estimated by aging the balance of the accounts receivable outstanding and by applying varying percentages based on past recovery experience to the aging categories so determined.
During 2015–2016, the Account charged a total $40.0 million ($12.8 million in 2014–2015) of interest. The interest on overdue accounts receivables (interest revenue) presented in the Statement of operations and accumulated surplus ($37.8 million) is net of interest charged on accounts receivable deemed unrecoverable ($2.2 million in 2015–2016 and $0 million in 2014–2015) and the allowance for doubtful accounts was increased by this amount.
4. Amounts payable
(in thousands of dollars)
2016 2015
To Canada
Administration costs ........................................................................................................................................................................ 33,703 32,277 Federal tax deductions from benefits ............................................................................................................................................... 29,026 30,188 Other deductions from benefits........................................................................................................................................................ 248 1,791 Amounts payable related to Labour Market Development Agreements ......................................................................................... 5,918 5,868
68,895 70,124
To provinces Quebec tax deductions from benefits .............................................................................................................................................. 4,148 4,803 Other deductions from benefits........................................................................................................................................................ 950 1,101
5,098 5,904
73,993 76,028
5. Financial instruments
The fair values of the premiums receivable, benefits payable and amounts payable are considered by management to be comparable to their carrying values because of the short term maturity of these instruments. These financial instruments will either be received or paid in the next fiscal year.
Benefits overpayments and penalties are usually recovered over a period longer than one year. As interest is only applicable to overpayments caused through misrepresentation and on penalties, and as the allowance for doubtful accounts reduces the carrying value, the due from claimants is assumed to approximate its fair value.
All of these financial instruments arose in the normal course of business.
6. Comparison of results against budget
The budget amounts included in the Statement of operations and accumulated surplus and the Schedule I—Benefits and support measures, are part of the amounts reported in the Employment and Social Development Canada's future oriented consolidated financial statements included in the 2015–2016 Report on Plans and Priorities.

Public Accounts of Canada, 2015–2016
4 . 24 Consolidated accounts
Employment Insurance Operating Account—continued
Notes to the financial statements for the year ended March 31, 2016—continued
7. Premiums
Premiums for the fiscal year are measured by the Canada Revenue Agency (CRA) based on amounts assessed and reassessed at the time of preparation of its financial statements and an estimate of premiums earned in the period but not yet assessed or reassessed.
Premiums revenue includes an estimate of premiums earned in the fiscal year but not yet assessed or reassessed at the time of preparation of the financial statements. Fiscal year 2015–2016 includes $8,224 million in forecasted premium revenues for the 3-month period from January to March 2016 ($8,120 million in 2015), or approximately 34.55 per cent (34.59 per cent in 2015) of the total forecast premium revenues of $23,805 million for calendar year 2016 ($23,472 million for 2015), net of reductions and refunds. This estimate is based on the forecasted total insurable earnings of $584,844 million in calendar year 2016 ($567,785 million in 2015). The total insurable earnings forecasts are mainly dependent upon the projected growth in both employment (0.71 per cent in 2016 and 0.74 per cent in 2015) and average wages (1.68 per cent in 2016 and 2.58 per cent in 2015).
A variation in these assumptions would have an impact on the total insurable earnings forecasted and consequently, forecasted premium revenues. The sensitivity analysis below was determined based on changes to the respective assumptions while holding all other assumptions constant:
Forecast premium revenues
Variable Variation January-March 2016
Employment growth ............................................................................................................................................ +/- 0.1% +/- 8 million Average wages ..................................................................................................................................................... +/- 0.1% +/- 3 million
Actual premium revenue for calendar years 2015 and 2016 will only be known once the CRA has processed all employer declarations of premiums for these years. An adjustment for the difference between actual and estimated premiums will be recorded in the fiscal year in which the actual assessment or reassessment results are known. The difference between estimated and actual premium revenues for calendar year 2014, as known at the time of the preparation of the financial statements and included in these financial statements, is an increase in revenues of $99 million ($28 million decrease for calendar year 2013 in 2014–2015 financial statements).
For the following calendar years, premium rates for each $100 of insurable earnings were set under section 66 of the Act at:
(in dollars)
2016 2015 2014
Residents of provinces without a provincial plan
For employees ............................................................................................................................................................... 1.88 1.88 1.88 For employers (calculated at 1.4 times the employee rate) .......................................................................................... 2.63 2.63 2.63
Residents of provinces with a provincial plan
For employees ............................................................................................................................................................... 1.52 1.54 1.53 For employers (calculated at 1.4 times the employee rate) .......................................................................................... 2.13 2.16 2.14
The annual maximum insurable earnings for 2016 is $50,800 ($49,500 in 2015 and $48,600 in 2014).
8. Estimated overpayments and underpayments of benefits
Given the large volume of claims and the need for prompt service, the Commission applies a risk-based approach to its control procedures. The verification of claims is conducted both prior to and after claimants have begun to receive benefits, using a combination of up-front and automated control measures and post-payment verification activities.
In order to measure the accuracy of benefit payments, the Commission has a program in place which establishes an annual payment accuracy rate and estimates, through statistical extrapolation, the most likely value of incorrect benefit payouts. For benefits paid during the twelve months ended March 31, 2016, these undetected overpayments and underpayments are estimated to be $864 million and $232 million respectively ($624 million and $145 million in 2014–2015). The annual payment accuracy rate (which is comprised of three error sources: claimant, employer and administrative) and estimated value of errors are used by the Commission to assess the quality of decisions and the need, if any, to improve its systems and practices of processing claims.
The overpayments established during the year, as indicated in Note 3, are not directly linked to the above noted estimated overpayments and underpayments of benefits for the same period.
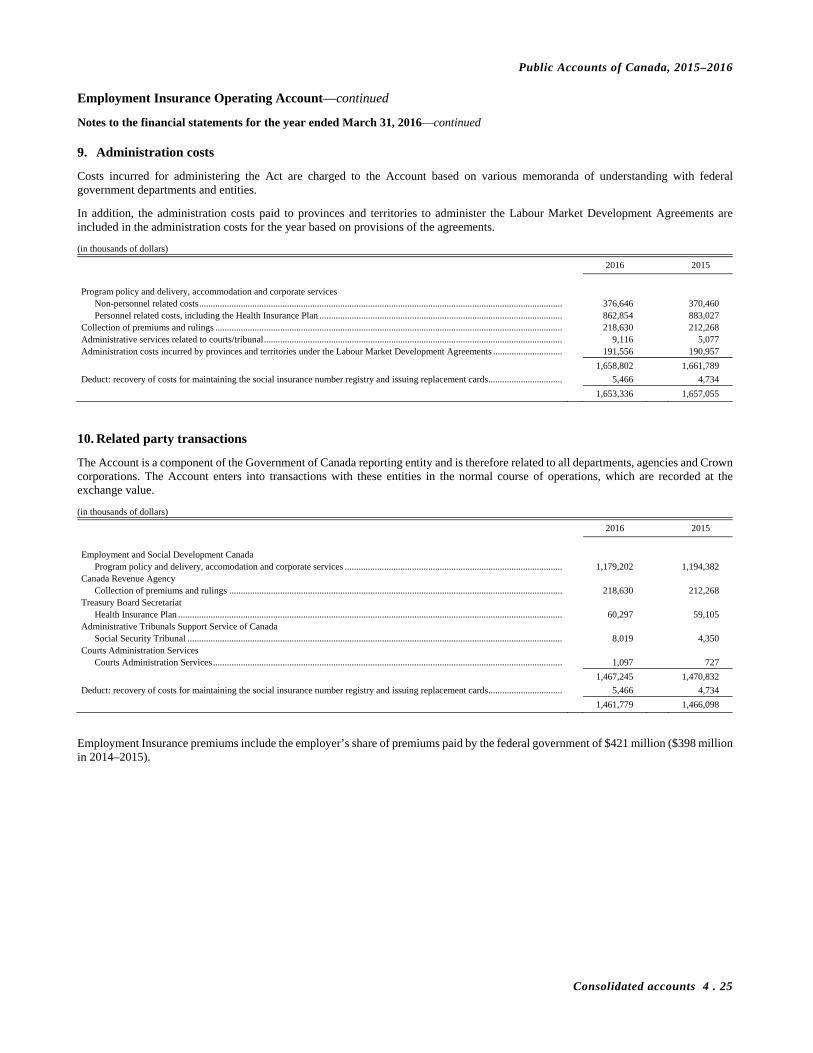
Public Accounts of Canada, 2015–2016
Consolidated accounts 4 . 25
Employment Insurance Operating Account—continued
Notes to the financial statements for the year ended March 31, 2016—continued
9. Administration costs
Costs incurred for administering the Act are charged to the Account based on various memoranda of understanding with federal government departments and entities.
In addition, the administration costs paid to provinces and territories to administer the Labour Market Development Agreements are included in the administration costs for the year based on provisions of the agreements.
(in thousands of dollars)
2016 2015
Program policy and delivery, accommodation and corporate services
Non-personnel related costs ............................................................................................................................................................. 376,646 370,460 Personnel related costs, including the Health Insurance Plan ......................................................................................................... 862,854 883,027
Collection of premiums and rulings ...................................................................................................................................................... 218,630 212,268 Administrative services related to courts/tribunal ................................................................................................................................. 9,116 5,077 Administration costs incurred by provinces and territories under the Labour Market Development Agreements .............................. 191,556 190,957
1,658,802 1,661,789
Deduct: recovery of costs for maintaining the social insurance number registry and issuing replacement cards ................................ 5,466 4,734
1,653,336 1,657,055
10. Related party transactions
The Account is a component of the Government of Canada reporting entity and is therefore related to all departments, agencies and Crown corporations. The Account enters into transactions with these entities in the normal course of operations, which are recorded at the exchange value.
(in thousands of dollars)
2016 2015
Employment and Social Development Canada
Program policy and delivery, accomodation and corporate services .............................................................................................. 1,179,202 1,194,382 Canada Revenue Agency
Collection of premiums and rulings ................................................................................................................................................ 218,630 212,268 Treasury Board Secretariat
Health Insurance Plan ...................................................................................................................................................................... 60,297 59,105 Administrative Tribunals Support Service of Canada
Social Security Tribunal .................................................................................................................................................................. 8,019 4,350 Courts Administration Services
Courts Administration Services ....................................................................................................................................................... 1,097 727
1,467,245 1,470,832
Deduct: recovery of costs for maintaining the social insurance number registry and issuing replacement cards ................................ 5,466 4,734
1,461,779 1,466,098
Employment Insurance premiums include the employer’s share of premiums paid by the federal government of $421 million ($398 million in 2014–2015).

Public Accounts of Canada, 2015–2016
4 . 26 Consolidated accounts
Employment Insurance Operating Account—continued
Notes to the financial statements for the year ended March 31, 2016—concluded
11. Contractual obligations
The nature of the Account activities can result in some large multi-year agreements whereby the Account will be obligated to make future payments in order to carry out its transfer payment programs. Significant contractual obligations that can be reasonably estimated are summarized as follows:
(in thousands of dollars)
2021 and 2017 2018 2019 2020 thereafter Total
Labour Market Development Agreements ....................................... 2,266,745 – – – – 2,266,745 Other transfer payments .................................................................... 105,904 416 – – – 106,320
Total ................................................................................................. 2,372,649 416 – – – 2,373,065
Labour Market Development Agreements (LMDA) with eight of the provinces and territories require a two year notice for cancellation of the agreements. The obligations for 2018 cannot be reasonably estimated.
On April 14, 2016, supplementary funding of $125 million for 2016–2017 for the LMDAs has been approved. The amount is included in the above figure.
12. Contingent liabilities
In the normal course of the operations of the Account, numerous appeals against or by the Commission are presently outstanding. The outcome of these appeals is not presently determinable. Any claims resulting from the resolution of these appeals will be accounted for as an expense in the period in which the claim will be determinable. However, in the opinion of management, the result of these appeals should not have a significant impact on the operations of the Account.
In 2011–2012, a class action was filed with the Federal Court seeking damages of $450 million plus interest. The representative plaintiff alleges that she was improperly denied sickness benefits for an illness, injury or disability suffered while on parental leave, despite an amendment in 2002 to the Employment Insurance Act. The proceeding has been certified as a class action. The outcome of this claim is not determinable at this time.
13. Subsequent event
The Budget Implementation Act 2016, No.1, received Royal Assent on June 22, 2016. This Act amends the Employment Insurance Act to, among other things:
(a) increase, until July 8, 2017, the maximum number of weeks for which benefits may be paid to eligible claimants in selected regions;
(b) eliminate the category of claimants who are new entrants and re-entrants; and
(c) reduce to one week the length of the waiting period during which claimants are not entitled to benefits.
These new measures will result in additional income benefit expenses starting in fiscal year 2016–2017. These additional future expenses, which cannot be reasonably estimated, will be recorded in the financial statements when the recipients will become entitled to the benefits.
14. Comparative information
Certain comparative figures have been reclassified to conform to the current year's presentation.

Public Accounts of Canada, 2015–2016
Consolidated accounts 4 . 27
Employment Insurance Operating Account—continued
Schedule I—Benefits and support measures for the year ended March 31 (in thousands of dollars)
2016 2016 2015
Budget (Note 6) Actual Actual Part I—Income benefits
Regular .......................................................................................................................................... 10,792,000 12,058,162 10,885,655 Fishing ........................................................................................................................................... 266,000 287,070 276,198 Work-sharing ................................................................................................................................ 25,000 40,366 18,128
11,083,000 12,385,598 11,179,981
Special benefits Parental ......................................................................................................................................... 2,644,000 2,611,676 2,549,601 Sickness ......................................................................................................................................... 1,408,000 1,444,042 1,357,369 Maternity ....................................................................................................................................... 1,134,000 1,124,182 1,090,629 Adoption ....................................................................................................................................... – 21,452 21,159 Compassionate care ...................................................................................................................... 13,000 17,736 12,729 Self-employment ........................................................................................................................... 10,000 9,164 9,054 Parents of critically-ill children .................................................................................................... 21,000 19,071 15,268
5,230,000 5,247,323 5,055,809
Income benefits total ........................................................................................................................ 16,313,000 17,632,921 16,235,790
Less: benefit repayments from higher income claimants ................................................................... 233,000 264,639 230,430
Part I total ......................................................................................................................................... 16,080,000 17,368,282 16,005,360
Part II—Employment benefits and support measures Employment benefits
Transfer payments to provinces and territories related to Labour Market Development Agreements ......................................................................... 1,950,000 1,938,683 1,930,727
Support measures Labour market partnerships .......................................................................................................... 110,286 112,657 Research and innovation ............................................................................................................... 1,374 3,439
124,000 111,660 116,096
Part II total ........................................................................................................................................ 2,074,000 2,050,343 2,046,823
Total Benefits and support measures ............................................................................................. 18,154,000 19,418,625 18,052,183
Benefit rates—Income benefits
The rates for income benefits are set on a calendar year basis. The maximum rate is $537 per week for the period from January to December 2016, and $524 per week for January to December 2015 ($514 per week for 2014). Benefits are paid at the lesser of 55 per cent of average insurable earnings and the maximum rate. For claimants who are in a low-income family with children, the rate may be increased up to the lessor of 80 per cent of average insurable earnings and the maximum rate.

Public Accounts of Canada, 2015–2016
4 . 28 Consolidated accounts
Employment Insurance Operating Account—concluded
Schedule II—Statement of operations and accumulated surplus (deficit) for the period of January 1st to December 31st (in thousands of dollars)
2015 2014
Revenues
Premiums ......................................................................................................................................................................................... 23,296,333 22,800,907 Penalties ........................................................................................................................................................................................... 43,634 38,971 Interest on overdue accounts receivable .......................................................................................................................................... 10,838 25,062
23,350,805 22,864,940
Expenses Income benefits ................................................................................................................................................................................ 17,190,213 15,879,753 Transfers to provinces and territories related to Labour Market Development Agreements .......................................................... 1,938,870 1,929,977 Support measures ............................................................................................................................................................................. 111,612 109,633 Benefits repayments from higher income claimants ....................................................................................................................... (248,126) (226,652) Administration costs ........................................................................................................................................................................ 1,654,314 1,663,134 Bad debts .......................................................................................................................................................................................... 103,131 41,637
20,750,014 19,397,482
Net surplus for the period ...................................................................................................................................................................... 2,600,791 3,467,458
Accumulated deficit at the beginning of the period .............................................................................................................................. (1,734,022) (5,201,480)
Accumulated surplus (deficit) at the end of the period .................................................................................................................... 866,769 (1,734,022)
The estimates provided in this Schedule for calendar year 2015, which is prepared in accordance with Canadian public sector accounting standards, are used by the Government of Canada to establish the Employment Insurance premium rate for the following calendar year. The mechanism for setting the Employment Insurance premium rate is designed to ensure that revenues and expenditures break even over time.

Section 5
2015–2016
Public Accounts of Canada
Accounts payable and accrued liabilities Table of contents Page
Other accounts payable and accrued liabilities ............................... 5.3 Deferred revenues ............................................................................ 5.6 Amounts payable to taxpayers ........................................................ 5.10 Environmental liabilities ................................................................. 5.11 Interest and matured debt ................................................................ 5.13
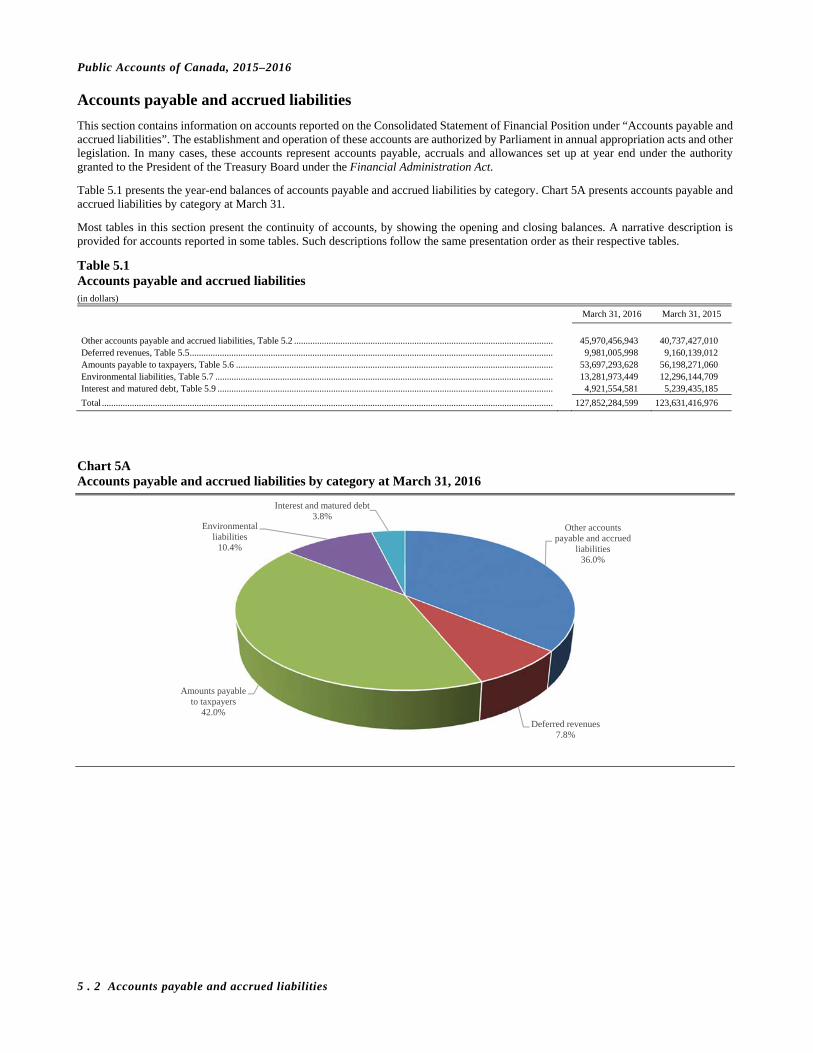
Public Accounts of Canada, 2015–2016
5 . 2 Accounts payable and accrued liabilities
Accounts payable and accrued liabilities
This section contains information on accounts reported on the Consolidated Statement of Financial Position under “Accounts payable and accrued liabilities”. The establishment and operation of these accounts are authorized by Parliament in annual appropriation acts and other legislation. In many cases, these accounts represent accounts payable, accruals and allowances set up at year end under the authority granted to the President of the Treasury Board under the Financial Administration Act.
Table 5.1 presents the year-end balances of accounts payable and accrued liabilities by category. Chart 5A presents accounts payable and accrued liabilities by category at March 31.
Most tables in this section present the continuity of accounts, by showing the opening and closing balances. A narrative description is provided for accounts reported in some tables. Such descriptions follow the same presentation order as their respective tables.
Table 5.1 Accounts payable and accrued liabilities (in dollars)
March 31, 2016 March 31, 2015
Other accounts payable and accrued liabilities, Table 5.2 ................................................................................................................ 45,970,456,943 40,737,427,010 Deferred revenues, Table 5.5 ............................................................................................................................................................. 9,981,005,998 9,160,139,012 Amounts payable to taxpayers, Table 5.6 ......................................................................................................................................... 53,697,293,628 56,198,271,060 Environmental liabilities, Table 5.7 .................................................................................................................................................. 13,281,973,449 12,296,144,709 Interest and matured debt, Table 5.9 ................................................................................................................................................. 4,921,554,581 5,239,435,185
Total ................................................................................................................................................................................................... 127,852,284,599 123,631,416,976
Chart 5A Accounts payable and accrued liabilities by category at March 31, 2016
Other accounts payable and accrued
liabilities36.0%
Deferred revenues7.8%
Amounts payable to taxpayers
42.0%
Environmental liabilities
10.4%
Interest and matured debt3.8%
Public Accounts of Canada, 2015–2016
Accounts payable and accrued liabilities 5 . 3
Other accounts payable and accrued liabilities
Other accounts payable and accrued liabilities includes accounts payable, accrued salaries and benefits, notes payable to international organizations, the provincial, territorial and Aboriginal tax agreements account, miscellaneous paylist deductions and other accounts.
Table 5.2 presents a summary of the balances for the accounts in this category of accounts payable and accrued liabilities.
Table 5.2 Other accounts payable and accrued liabilities (in dollars)
March 31, 2016 March 31, 2015
Accounts payable ............................................................................................................................................................................... 31,273,862,741 31,224,159,839
Add: consolidation adjustment1 .................................................................................................................................................. 4,752,783,403 3,204,458,020 36,026,646,144 34,428,617,859 Accrued salaries and benefits ............................................................................................................................................................ 4,558,674,474 3,653,603,294 Notes payable to international organizations, Table 5.3 ................................................................................................................... 35,312,954 34,440,123 Provincial, Territorial and Aboriginal Tax Agreements Account, Table 5.4 .................................................................................... 4,326,846,356 1,546,959,912 Miscellaneous paylist deductions ...................................................................................................................................................... 73,005,759 142,683,677 Allowance for guarantees .................................................................................................................................................................. 311,507,982 317,111,364 Other .................................................................................................................................................................................................. 638,463,274 614,010,782
Total ................................................................................................................................................................................................... 45,970,456,943 40,737,427,010
1 Additional information on the consolidated Crown corporations and other entities is provided in Section 4 of this volume.
Accounts payable
This account records amounts owing at year end pursuant to contractual arrangements, or for work performed, goods received, or services rendered, accrued amounts to be paid from appropriations and statutory authorities, and accrued financial obligations of consolidated Crown corporations and other entities.
Accrued salaries and benefits
This account records salaries and wages owing at year end, amounts owing for earned and unpaid annual vacation leave and compensation time, and other accrued amounts relating to unpaid or retro-active salaries.
Notes payable to international organizations
Share capital subscriptions, loans and advances are made to international organizations using cash, notes payable, or both, that are later presented for encashment according to terms of agreements. These demand notes are non-interest bearing and are non-negotiable. The subscriptions, loans and advances are recorded as assets and details are reported in Table 9.13 in Section 9 of this volume.
Table 5.3 presents the balances and transactions for the notes payable.
Table 5.3 Notes payable to international organizations (in dollars)
Receipts and Payments and other credits other charges
Note Note April 1, 2015 issuances Revaluation1 encashment Revaluation1 March 31, 2016
Finance
International Bank for Reconstruction and Development (World Bank) ............................................ 30,376,706 769,850 – – – 31,146,556
Multilateral Investment Guarantee Agency .......................... 4,063,417 – 102,981 – – 4,166,398
Total ............................................................................................ 34,440,123 769,850 102,981 – – 35,312,954
1 Notes denominated in foreign currencies are translated into Canadian dollars at the year-end closing rates of exchange.
Public Accounts of Canada, 2015–2016
5 . 4 Accounts payable and accrued liabilities
Provincial, Territorial and Aboriginal Tax Agreements Account
This account records taxes administered by the Government of Canada on behalf of provinces, territories, and Aboriginal governments, in accordance with agreements entered into by the Minister of Finance pursuant to the Federal-Provincial Fiscal Arrangements Act and, in the case of First Nations Goods and Services Tax, pursuant to the First Nations Goods and Services Tax Act.
The Government of Canada, as represented by the Minister of Finance, has entered into agreements with all provinces and territories (except Quebec) to collect and administer personal income tax, and with all provinces and territories (except Quebec and Alberta) to collect and administer corporate tax, and to pay amounts assessed in respect thereof in accordance with the agreements.
Agreements have also been entered into with certain Aboriginal governments, to collect First Nations Personal Income Tax as well as First Nations Sales Tax levied on motive fuels, tobacco, and alcohol and First Nations Goods and Services Tax levied on the same range of goods and services as the federal goods and services tax, and to make payments to the respective governments in accordance with the agreements.
This account also records transactions relating to agreements that the Government of Canada has entered into with the provinces of Ontario, New Brunswick, Nova Scotia, Newfoundland and Labrador and Prince Edward Island regarding the Harmonized Sales Tax, and payments made to those provinces in accordance with the Comprehensive Integrated Tax Coordination Agreements between the Government of Canada and the provinces. Effective April 1, 2013, the province of British Columbia returned to the provincial sales tax regime.
The Public Accounts of Canada reports information on an April to March fiscal year basis, while tax information is generally calculated on a calendar year basis. Transactions related to several tax years can occur during a given fiscal year. For example, during a given fiscal year, payments are made, based on estimates, in respect of two calendar years (April to December and January to March). During this period, it is also necessary to make payments or adjustments related to tax revenues, rebates and credits for previous calendar years. Table 5.4 presents the accumulated balances and the net position of the revenues and the payments made to the provinces and territories for personal income and corporate taxes as well as for First Nations Sales Tax, First Nations Goods and Services Tax, First Nations Personal Income Tax and Harmonized Sales Tax.
Table 5.4 Provincial, Territorial and Aboriginal Tax Agreements Account (in dollars)
Receipts and Payments and April 1, 2015 other credits other charges March 31, 2016
Total personal income tax administered by Canada Revenue Agency .............. 3,054,297,998 66,481,950,229 69,536,248,227
Less: payments to provinces, territories and Aboriginal governments Newfoundland and Labrador .................................................................. 1,308,475,400 1,308,475,400 Prince Edward Island .............................................................................. 330,559,320 330,559,320 Nova Scotia ............................................................................................. 2,540,212,453 2,540,212,453 New Brunswick ....................................................................................... 1,654,456,714 1,654,456,714 Ontario ..................................................................................................... 33,983,131,256 33,983,131,256 Manitoba.................................................................................................. 3,100,847,846 3,100,847,846 Saskatchewan .......................................................................................... 2,620,607,012 2,620,607,012 Alberta ..................................................................................................... 11,398,171,238 11,398,171,238 British Columbia ..................................................................................... 8,275,212,600 8,275,212,600 Yukon ...................................................................................................... 61,607,104 61,607,104 Northwest Territories .............................................................................. 82,729,512 82,729,512 Nunavut ................................................................................................... 30,559,156 30,559,156 Aboriginal governments .......................................................................... 24,679,902 24,679,902
65,411,249,513 65,411,249,513
Total personal income tax on hand ................................................................. 3,054,297,998 66,481,950,229 65,411,249,513 4,124,998,714

Public Accounts of Canada, 2015–2016
Accounts payable and accrued liabilities 5 . 5
Table 5.4 Provincial, Territorial and Aboriginal Tax Agreements Account—concluded (in dollars)
Receipts and Payments and April 1, 2015 other credits other charges March 31, 2016
Total corporate income tax administered by Canada Revenue Agency ............ 1,093,799,752 16,549,387,076 17,643,186,828
Less: payments to provinces and territories Newfoundland and Labrador .................................................................. 319,686,478 319,686,478 Prince Edward Island .............................................................................. 52,391,494 52,391,494 Nova Scotia ............................................................................................. 369,215,171 369,215,171 New Brunswick ....................................................................................... 225,785,586 225,785,586 Ontario ..................................................................................................... 9,183,133,415 9,183,133,415 Quebec ..................................................................................................... 54,075,109 54,075,109 Manitoba.................................................................................................. 492,811,494 492,811,494 Saskatchewan .......................................................................................... 864,744,510 864,744,510 Alberta ..................................................................................................... 76,980,885 76,980,885 British Columbia ..................................................................................... 2,182,387,441 2,182,387,441 Yukon ...................................................................................................... 11,543,043 11,543,043 Northwest Territories .............................................................................. 48,883,117 48,883,117 Nunavut ................................................................................................... 18,568,978 18,568,978
13,900,206,721 13,900,206,721
Total corporate income tax on hand ............................................................... 1,093,799,752 16,549,387,076 13,900,206,721 3,742,980,107
Total harmonized sales tax administered by Canada Revenue Agency ............. (2,601,137,838) 26,160,756,972 23,559,619,134 Less: payments to provinces and territories
Newfoundland and Labrador .................................................................. 968,091,461 968,091,461 Prince Edward Island .............................................................................. 243,857,616 243,857,616 Nova Scotia ............................................................................................. 1,988,045,494 1,988,045,494 New Brunswick ....................................................................................... 1,234,978,101 1,234,978,101 Ontario ..................................................................................................... 22,720,391,076 22,720,391,076 British Columbia1 .................................................................................... (54,612,149) (54,612,149)
27,100,751,599 27,100,751,599
Total harmonized sales tax on hand ............................................................... (2,601,137,838) 26,160,756,972 27,100,751,599 (3,541,132,465)
Total First Nations sales tax administered by Canada Revenue Agency ........... 6,952,187 – 6,952,187 Less: payments to Aboriginal governments ................................................. – 6,952,187 6,952,187
Total First Nations sales tax on hand ............................................................. – 6,952,187 6,952,187 –
Total First Nations goods and services sales tax administered by Canada Revenue Agency ............................................. – 17,765,233 – 17,765,233
Less: payments to Aboriginal governments ................................................. – 17,765,233 17,765,233
Total First Nations goods and services sales tax on hand ............................. – 17,765,233 17,765,233 –
Total .................................................................................................................... 1,546,959,912 109,216,811,697 106,436,925,253 4,326,846,356
1 A negative number under the column “Payments and other charges” represents the net recovery of amounts during the year.
Miscellaneous paylist deductions
Deductions from the salaries and wages of certain employees are credited to this account pending transmittal to related outside organizations.
Allowance for guarantees
This category of accounts payable and accrued liabilities includes the allowance for guarantees provided by the Government. An allowance is recorded for guarantees when it is likely that a payment will be made in the future to honour a guarantee and when the amount of the loss can be reasonably estimated. As at March 31, 2016, the allowance for guarantees is $312 million ($317 million in 2015).
Additional information relating to guarantees can be found in Note 18—Guarantees in Section 2 and in Table 11.5 in Section 11 of this volume. In addition, Table 9.6 in Section 9 includes details on the borrowings of agent and non-agent enterprise Crown corporations and other government business enterprises. In accordance with section 54 of the Financial Administration Act, the payment of all money borrowed by agent enterprise Crown corporations, and interest thereon, is a charge on and payable out of the Consolidated Revenue Fund. Such borrowings therefore constitute unconditional obligations of the Government. In contrast, borrowings of non-agent enterprise Crown corporations and other government business enterprises may, at times, be guaranteed by the Government.
Other
Miscellaneous accounts payable and accrued liabilities such as provincial sales tax collected on sales are recorded in this account.

Public Accounts of Canada, 2015–2016
5 . 6 Accounts payable and accrued liabilities
Deferred revenues
This account records revenues received before the end of the current fiscal year for which the goods or services are to be delivered or rendered in a subsequent fiscal year. It includes licence fees received for which access to the radio spectrum is being provided in subsequent years. The major deferred revenues of $50 million or more are reported individually. It also presents separately revenues received which have been recorded in a specified purpose account.
Table 5.5 presents the balances and transactions of deferred revenues.
Table 5.5 Deferred revenues (in dollars)
Receipts and Payments and April 1, 2015 other credits other charges March 31, 2016
Deferred revenues
Immigration, Refugees and Citizenship Citizenship and Immigration
Service fees for immigration and citizenship ............................................ 193,702,903 650,027,882 621,498,364 222,232,421 Innovation, Science and Economic Development
Industry Canadian Intellectual Property Office Revolving Fund ............................ 73,442,245 145,533,248 152,826,910 66,148,583 Spectrum licence fees ................................................................................ 7,352,437,390 2,721,517,409 1,140,705,098 8,933,249,701
7,425,879,635 2,867,050,657 1,293,532,008 8,999,398,284 Other deferred revenues ........................................................................................ 280,458,251 356,262,349 411,986,150 224,734,450 Consolidated Crown corporations
Canadian Commercial Corporation Advances from foreign customers ............................................................. 1,225,509,000 188,076,000 915,988,000 497,597,000
Total ........................................................................................................................... 9,125,549,789 4,061,416,888 3,243,004,522 9,943,962,155
Other deferred revenues—Specified purpose accounts Donation and bequest accounts
Agriculture and Agri-Food Shared-cost agreements—Research .......................................................... 11,604,644 10,782,353 6,305,589 16,081,408
Canadian Heritage Library and Archives of Canada
Special Operating Account .................................................................. 657,384 – 566,123 91,261 Environment and Climate Change
Environment Endangered species—Donations ......................................................... 4,925 1,394 – 6,319 Miscellaneous projects deposits .......................................................... 7,939,813 5,898,195 6,728,131 7,109,877
7,944,738 5,899,589 6,728,131 7,116,196 Parks Canada Agency
Pacific Rim Mitigation Fund ............................................................... 1,125,000 – 1,125,000 – 9,069,738 5,899,589 7,853,131 7,116,196
Families, Children and Social Development Employment and Social Development
Canadian Centre for Occupational Health and Safety Donations ....................................................................................... 110,902 2,250 – 113,152
Fisheries, Oceans and the Canadian Coast Guard Fisheries and Oceans
Restricted donations ............................................................................ 2,620 – – 2,620 Health
Canadian Institutes of Health Research Donations for research ......................................................................... 6,509,163 6,560,983 7,810,130 5,260,016
Innovation, Science and Economic Development Industry
Deposits from non-government organizations .................................... 3,803,226 1,973,813 2,415,730 3,361,309 Prime Minister's Awards ..................................................................... 101,680 – 75,000 26,680
3,904,906 1,973,813 2,490,730 3,387,989 Canadian Space Agency
RADARSAT-2 .................................................................................... 9,374 – – 9,374 RADARSAT-2—Data satellite ........................................................... 82,561 1,664,503 1,747,064 –
91,935 1,664,503 1,747,064 9,374 Social Sciences and Humanities Research Council
Trust Fund ............................................................................................ 391,249 1,094 10,000 382,343 4,388,090 3,639,410 4,247,794 3,779,706 National Defence
Corporate sponsorships and donations ...................................................... 40,444 117,467 103,760 54,151
Public Accounts of Canada, 2015–2016
Accounts payable and accrued liabilities 5 . 7
Table 5.5 Deferred revenues—concluded (in dollars)
Receipts and Payments and April 1, 2015 other credits other charges March 31, 2016
Public Safety and Emergency Preparedness
Royal Canadian Mounted Police Civil Remedies Grant Program ........................................................... – 122,900 113,036 9,864 Mounted Police Foundation ................................................................ 236,036 212,368 22,552 425,852 Royal Canadian Mounted Police Pipe Band (NCR) ........................... 7,163 – – 7,163 Sponsorship Agreement—Contributions ............................................ 168,653 – – 168,653
411,852 335,268 135,588 611,532 Office of the Governor General's Secretary
Cost sharing collaborate agreement .......................................................... 1,500 47,220 47,510 1,210 Donations—Rideau Hall ........................................................................... 111,827 – 16,226 95,601
113,327 47,220 63,736 96,811 Transport
Shared-cost agreements—Transportation research and development ...... 1,254,512 792,642 1,335,661 711,493 Veterans Affairs
Restricted donations Canadian Memorial ............................................................................. 800 – – 800 Visitor Education Centre, Vimy Memorial ......................................... 290,000 2,710,000 – 3,000,000 Wounded Warrior Fund ....................................................................... 4,237 – 3,388 849
295,037 2,710,000 3,388 3,001,649
Total—Donation and bequest accounts ...................................................................... 34,457,713 30,887,182 28,424,900 36,919,995
Endowment interest accounts Environment and Climate Change
Parks Canada Agency Laurier House—Interest (Mackenzie King Trust Account) ................ – 4,163 4,163 –
Health Canadian Institutes of Health Research
Endowments for health research ......................................................... 11,126 663 – 11,789 Innovation, Science and Economic Development
National Research Council of Canada H.L. Holmes Fund ............................................................................... – 109,099 109,099 –
Social Sciences and Humanities Research Council Queen's Fellowship Fund .................................................................... 120,384 1,675 10,000 112,059
120,384 110,774 119,099 112,059
Total—Endowment interest accounts ......................................................................... 131,510 115,600 123,262 123,848
Total—Other deferred revenues—Specified purpose accounts ................................. 34,589,223 31,002,782 28,548,162 37,043,843
Total—Deferred revenues .......................................................................................... 9,160,139,012 4,092,419,670 3,271,552,684 9,981,005,998
Service fees for immigration and citizenship
This account was established to record fees, rights and privileges derived from the Citizenship Act and Regulations and the Immigration and Refugee Protection Act and Regulations. Fees are deferred until the application is deemed processed, while rights and privileges are deferred until they are granted.
Canadian Intellectual Property Office Revolving Fund
This account was established to record funds reserved from sources such as patents, trademarks examination and registration fees which are recognized as revenue in subsequent years.
Spectrum licence fees
This account was established to record: (a) funds received from spectrum auctions, which are recognized as revenues over the period of the licences; and (b) funds received from Spectrum Licence Fees that are received in the latter part of the fiscal year, but which are applicable to the following fiscal year.

Public Accounts of Canada, 2015–2016
5 . 8 Accounts payable and accrued liabilities
Advances from foreign customers
This account records advances from foreign customers representing a down payment made at the outset of the contract before any work has been performed.
Shared-cost agreements—Research
This account was established to record amounts deposited by external parties for shared-cost projects, and any related future provincial program payments to be made on a province’s behalf by Agriculture and Agri-Food Canada as part of a related project. Funds are disbursed on behalf of depositors as specific projects are undertaken.
Special Operating Account
This account was established, pursuant to section 18 of the Library and Archives of Canada Act, to record funds received for the purposes of the Library and Archives of Canada, by way of gifts. Amounts required for the purposes of the Act may be paid out of this account, or out of funds appropriated by Parliament for such purposes.
Endangered species—Donations
This account was established to record donations, gifts or bequests received from individuals and organizations to finance various studies related to endangered species.
Miscellaneous projects deposits
This account was established to record contributions received from organizations and individuals, for the advancement of research work and clean-up efforts.
Pacific Rim Mitigation Fund
This account was established to record funds received for the protection of lands within the Pacific Rim National Park Reserve of Canada. Funds so received are used to monitor community use impacts, carry out related research and implement required mitigation measures.
Donations
This account was established, pursuant to subsection 6(3) of the Canadian Centre for Occupational Health and Safety Act, to record funds, securities or other property received by way of gift, bequest or otherwise, and to disburse such donations at the discretion of the Centre.
Restricted donations—Fisheries and Oceans
This account was established to record directed donations to be used for research, development, management and promotion of fisheries and oceans related issues.
Donations for research
This account was established, pursuant to section 29 of the Canadian Institutes of Health Research Act, to record donations and contributions received from organizations and individuals for biomedical research.
Deposits from non-government organizations
This account was established to record amounts deposited by customers to be used for payments of services provided by the department.
Prime Minister’s Awards
This account was established to record amounts deposited by external parties to be used in support of the Prime Minister’s Awards for teaching excellence.
RADARSAT-2
This account was established to record funds received for the configuration and layout of relocated “MacDonald, Dettwiler and Associates” personnel.
RADARSAT-2—Data satellite
This account was established to record funds received from “MacDonald, Dettwiler and Associates” for the reception, archiving, cataloging and satellite acquisition services.
Public Accounts of Canada, 2015–2016
Accounts payable and accrued liabilities 5 . 9
Trust Fund—Social Sciences and Humanities Research Council
This account was established to record funds available for social sciences and humanities research activities. The account is also used to record receipts of private donations for the purpose of special projects.
Corporate sponsorships and donations
This account was established by the Department of National Defence to administer funds received from various private companies, not for profit corporations, associations, other levels of government, or individuals for the purpose of holding events, conducting operations and constructing capital assets consistent with the Department’s mandate but not funded from its appropriations.
Civil Remedies Grant Program
This account was established to record grants received under the authority of the Ontario Civil Remedies Act and the British Columbia Civil Forfeiture Act. These grants are used to support the prevention of unlawful activities that result in victimization and requirements for police specialized equipment and training.
Mounted Police Foundation
This account was established to record funds received from the Mounted Police Foundation which will be used to cover expenses related to community policing, educational, promotional and public relations projects throughout Canada.
Royal Canadian Mounted Police Pipe Band (National Capital Region)
This account was established to administer sponsorship funds to support the Royal Canadian Mounted Police Pipe Band.
Sponsorship agreement—Contributions
This account was established to record funds contributed to the Royal Canadian Mounted Police pursuant to sponsorship agreements for use in community policing programs.
Cost sharing collaborate agreement
This account was established to record amounts deposited by external parties for shared-cost projects.
Donations—Rideau Hall
This account was established to record gifts, donations or bequests to Rideau Hall from private organizations and individuals to fund specific initiatives.
Shared-cost agreements—Transportation research and development
This account was established to record, on a temporary basis; (a) funds received from cost-sharing agreements intended to strengthen and improve the safety, security and efficiency of the Canadian transportation system; and (b) funds received from private sector and provincial governments to directly support the departmental strategic objectives.
Restricted donations—Canadian Memorial
This account was established to record directed donations for the purpose of management and maintenance of the Canadian Memorial in Green Park, London, United Kingdom.
Restricted donations—Visitor Education Centre, Vimy Memorial
This account was established to record directed donations for the purpose of providing assistance to the construction of a visitor education centre at the Canadian National Vimy Memorial.
Restricted donations—Wounded Warrior Fund
This account was established to record directed donations for the purpose of providing assistance to support the pilot project designed to assist disenfranchised Veterans in crisis.
Laurier House—Interest (Mackenzie King Trust Account)
The late The Right Hon W. L. Mackenzie King bequeathed Laurier House, Ottawa, and the sum of $225,000, to the Government of Canada. The amount of $225,000 was credited to the account and earns interest, in accordance with the terms of section 3 of the Laurier House Act. The interest is to be used to assist in the maintenance of the Laurier House, which is to be preserved as a place of historic interest, and also to provide accommodation for study and research.

Public Accounts of Canada, 2015–2016
5 . 10 Accounts payable and accrued liabilities
Endowments for health research
This account was established by section 29 of the Canadian Institutes of Health Research Act, to record various endowments received from donors for the purpose of health research. The interest received is used for the payment of research grants.
H.L. Holmes Fund
This account was established, pursuant to paragraph 5(1)(f) of the National Research Council Act, to record the residue of the estate of H.L. Holmes. Up to two thirds of the yearly net income from the fund shall be used to finance the H.L. Holmes Award on an annual basis. These awards will provide the opportunity to post-doctoral students to study at world famous graduate schools or research institutes under outstanding research persons.
Queen’s Fellowship Fund
This fund is an endowment of $250,000 that was established by Vote 45a, Appropriation Act No. 5, 1973-74. The interest earned is used for the payment of fellowships to graduate students in certain fields of Canadian studies.
Amounts payable to taxpayers
Amounts payable to taxpayers are based on assessments as well as estimates of refunds owing for assessments not completed by year end.
Table 5.6 presents a summary of the balances for the different tax revenue streams.
Table 5.6 Amounts payable to taxpayers (in dollars)
March 31, 2016 March 31, 2015
Personal and non-resident income tax ............................................................................................................................................... 34,585,461,543 35,867,570,481 Corporate income tax ......................................................................................................................................................................... 8,293,710,337 9,327,020,173 Goods and services tax ...................................................................................................................................................................... 10,755,233,354 10,904,113,838 Customs and excise ........................................................................................................................................................................... 62,888,394 99,566,568
Total ................................................................................................................................................................................................... 53,697,293,628 56,198,271,060
Personal and non-resident income tax
This account records tax refunds payable to individual taxpayers as well as amounts payable to employers and other withholders of personal income tax. This account also includes any interest owing on the balances.
Corporate income tax
This account records tax refunds payable and any interest owing to corporate taxpayers.
Goods and services tax
This account records refunds, rebates and any interest owing related to the goods and services tax.
Customs and excise
This account records refunds of customs import duties, excise taxes and duties, energy taxes and any interest owing on the balances.
Public Accounts of Canada, 2015–2016
Accounts payable and accrued liabilities 5 . 11
Environmental liabilities
Environmental liabilities consist of estimated costs related to the remediation of contaminated sites, estimated costs related to obligations associated with the retirement of tangible capital assets and other environmental liabilities.
Contaminated sites
A liability for remediation of contaminated sites is recognized when all of the following criteria are satisfied: an environmental standard exists, contamination exceeds the environmental standard, the Government is directly responsible or accepts responsibility, it is expected that future economic benefits will be given up and a reasonable estimate of the amount can be made. The liability reflects the Government’s best estimate of the amount required to remediate the sites to the current minimum standard for its use prior to contamination. When the future cash flows required to settle or otherwise extinguish a liability are estimable, predictable and expected to occur over extended future periods, a present value technique is used. The discount rate applied is taken from the Government’s Consolidated Revenue Fund monthly lending rates for periods of one year and over which is based on the Government’s cost of borrowing. The discount rates used are based on the term rate associated with the estimated number of years to complete remediation. For remediation costs with estimated future cash flows spanning more than 25 years, the 25-year Consolidated Revenue Fund lending rate is used as the discount rate.
The Government has identified approximately 7,900 sites (8,600 sites in 2015) where contamination may exist and assessment, remediation and monitoring may be required. Of these, the Government has identified approximately 2,400 sites (2,400 sites in 2015), where action is possible and for which a gross liability of $5,954 million ($5,810 million in 2015) has been recorded. This liability estimate has been determined based on site assessments performed by scientific/engineering contractors. In 2016, a statistical model was developed to estimate the liability for a group of unassessed sites based on a projection of the number of sites that will proceed to remediation and applying current and historical costs. As a result, there are 4,300 unassessed sites where a liability estimate of $320 million has been recorded prospectively in 2016. These two estimates combined, totalling $6,274 million ($5,810 million in 2015), represents the Government’s best estimate of the costs required to remediate sites to the current minimum standard for its use prior to contamination, based on information available at the financial statement date.
Asset retirement obligations
A liability for an asset retirement obligation is recognized when all of the following criteria are satisfied: there is an agreement, contract, legislation, or a constructive or equitable obligation that obligates the Government to incur retirement costs in relation to a tangible capital asset, the past event or transaction giving rise to the retirement liability has occurred, it is expected that future economic benefits will be given up and a reasonable estimate of the amount can be made. These costs are normally capitalized and amortized over the asset’s estimated useful life based on the Government’s best estimates of the cost to retire the tangible asset. If the related asset is fully amortized, the related cost is expensed. The liability reflects the present value of estimated future cash flows required to retire the assets where amounts can be reasonably estimated and is expected to be settled as the related sites, facilities or assets are removed from service.
The asset retirement obligation is $6,767 million ($6,502 million in 2015) of which Atomic Energy of Canada Ltd. has recorded $6,763 million ($6,487 million in 2015) for nuclear facility decommissioning. In 2016, an amount of $233 million ($107 million in 2015) for the revisions in estimate and timing of expenditures was recorded. Also, an amount of $251 million ($250 million in 2015) was recognized to account for the unwinding of discount and the effect of change in discount rate and an amount of $ 219 million ($200 million in 2015) was recorded to settle the liabilities.
Other environmental liabilities
A liability for unexploded explosive ordnance (UXO) affected legacy sites is recognized when there is an appropriate basis for measurement and a reasonable estimate can be made. These liabilities are present obligations arising from past transactions or events, the settlement of which is expected to result in the future sacrifice of economic benefits.
The recorded environmental liabilities are adjusted each year, as required, for present value adjustments, inflation, new obligations, changes in estimates and actual costs incurred.
If the likelihood of the Government’s responsibility is not determinable, a contingent liability is disclosed in the notes to the consolidated statements. If measurement uncertainty exists it is also disclosed in the notes to the consolidated statements.
The Government has identified approximately 893 UXO (918 in 2015) suspected sites for which clearance action may be necessary. Of these sites, 61 (57 in 2015) are confirmed UXO affected sites. Based on the Government’s best estimates, a liability of $272 million ($1.3 million in 2015) has been recorded for clearance action on 10 (5 in 2015) of the confirmed UXO sites. Remediation has been done on 14 of the sites and they will be closed in the next fiscal year. The remaining 869 suspect sites are currently in the assessment stage and a reasonable estimate cannot yet be determined. Of these sites, the obligation for clearance action is likely for 61 sites, indeterminable for 667 sites and unlikely for 141 sites.
The Government’s ongoing efforts to assess contaminated sites, asset retirement obligations and UXO affected sites may result in additional environmental liabilities.

Public Accounts of Canada, 2015–2016
5 . 12 Accounts payable and accrued liabilities
Table 5.7 presents the liability balances of the custodian departments and Crown corporations for remediation liabilities for contaminated sites, asset retirement obligations and other environmental liabilities.
Table 5.7 Environmental liabilities (in dollars)
March 31, 2016 March 31, 2015
Remediation liabilities for contaminated sites
Departments and agencies Agriculture and Agri-Food ..................................................................................................................................................... 4,836,741 2,422,353 Canada Border Services Agency ............................................................................................................................................ 1,183,764 2,479,624 Correctional Service of Canada ............................................................................................................................................. 1,708,685 2,017,213 Environment ........................................................................................................................................................................... 141,417,724 122,609,100 Fisheries and Oceans .............................................................................................................................................................. 108,219,424 104,558,273 Foreign Affairs, Trade and Development .............................................................................................................................. 15,000 – Health ..................................................................................................................................................................................... 172,705 167,497 Indian Affairs and Northern Development ............................................................................................................................ 3,795,691,347 3,017,667,968 National Defence .................................................................................................................................................................... 519,370,599 425,387,988 National Research Council of Canada ................................................................................................................................... 240,832 170,421 Natural Resources .................................................................................................................................................................. 4,614,482 988,830,523 Parks Canada Agency ............................................................................................................................................................ 37,236,526 24,171,903 Public Works and Government Services ............................................................................................................................... 258,591,282 314,549,713 Royal Canadian Mounted Police............................................................................................................................................ 6,419,203 2,874,887 Transport ................................................................................................................................................................................ 188,399,845 146,573,661 Miscellaneous adjustment ...................................................................................................................................................... – 580,000,000
5,068,118,159 5,734,481,124 Consolidated Crown corporations and other entities
Atomic Energy of Canada Limited ........................................................................................................................................ 1,109,493,000 – Canadian Broadcasting Corporation ...................................................................................................................................... 343,000 377,000 Marine Atlantic Inc ................................................................................................................................................................ 377,000 431,000 National Capital Commission ................................................................................................................................................ 50,345,000 43,850,000 The Federal Bridge Corporation Limited .............................................................................................................................. 1,420,000 – The Jacques-Cartier and Champlain Bridges Incorporated ................................................................................................... 43,170,000 31,100,000 VIA Rail Canada Inc. ............................................................................................................................................................. 300,000 200,000
1,205,448,000 75,958,000
Gross remediation liability for contaminated sites ...................................................................................................................... 6,273,566,159 5,810,439,124
Less expected recoveries—Indian Affairs and Northern Development ............................................................................... 30,681,572 17,321,495
Net remediation liability of contaminated sites ........................................................................................................................... 6,242,884,587 5,793,117,629
Asset retirement obligations Departments and agencies ........................................................................................................................................................... 577,920 566,494 Consolidated Crown corporations and other entities
Atomic Energy of Canada Limited (nuclear facility decommissioning) ............................................................................... 6,763,423,000 6,487,228,000 Others ..................................................................................................................................................................................... 3,015,000 13,920,000
6,766,438,000 6,501,148,000
Total asset retirement obligations ................................................................................................................................................ 6,767,015,920 6,501,714,494
Other environmental liabilities Departments and agencies
National Defence (unexploded explosive ordnance affected sites) ....................................................................................... 272,072,942 1,312,586
Total environmental liabilities ........................................................................................................................................................... 13,281,973,449 12,296,144,709
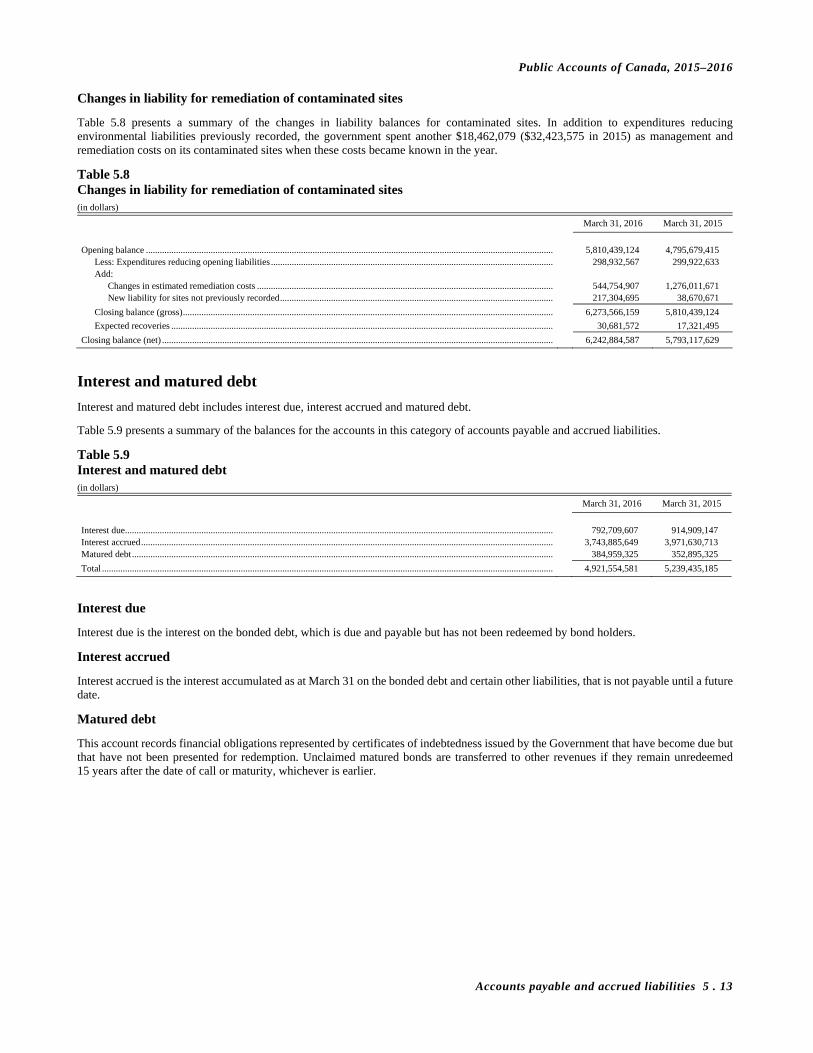
Public Accounts of Canada, 2015–2016
Accounts payable and accrued liabilities 5 . 13
Changes in liability for remediation of contaminated sites
Table 5.8 presents a summary of the changes in liability balances for contaminated sites. In addition to expenditures reducing environmental liabilities previously recorded, the government spent another $18,462,079 ($32,423,575 in 2015) as management and remediation costs on its contaminated sites when these costs became known in the year.
Table 5.8 Changes in liability for remediation of contaminated sites (in dollars)
March 31, 2016 March 31, 2015
Opening balance ................................................................................................................................................................................ 5,810,439,124 4,795,679,415
Less: Expenditures reducing opening liabilities .......................................................................................................................... 298,932,567 299,922,633 Add:
Changes in estimated remediation costs ................................................................................................................................ 544,754,907 1,276,011,671 New liability for sites not previously recorded ...................................................................................................................... 217,304,695 38,670,671
Closing balance (gross) ................................................................................................................................................................ 6,273,566,159 5,810,439,124
Expected recoveries ..................................................................................................................................................................... 30,681,572 17,321,495
Closing balance (net) ......................................................................................................................................................................... 6,242,884,587 5,793,117,629
Interest and matured debt
Interest and matured debt includes interest due, interest accrued and matured debt.
Table 5.9 presents a summary of the balances for the accounts in this category of accounts payable and accrued liabilities.
Table 5.9 Interest and matured debt (in dollars)
March 31, 2016 March 31, 2015
Interest due ......................................................................................................................................................................................... 792,709,607 914,909,147 Interest accrued .................................................................................................................................................................................. 3,743,885,649 3,971,630,713 Matured debt ...................................................................................................................................................................................... 384,959,325 352,895,325
Total ................................................................................................................................................................................................... 4,921,554,581 5,239,435,185
Interest due
Interest due is the interest on the bonded debt, which is due and payable but has not been redeemed by bond holders.
Interest accrued
Interest accrued is the interest accumulated as at March 31 on the bonded debt and certain other liabilities, that is not payable until a future date.
Matured debt
This account records financial obligations represented by certificates of indebtedness issued by the Government that have become due but that have not been presented for redemption. Unclaimed matured bonds are transferred to other revenues if they remain unredeemed 15 years after the date of call or maturity, whichever is earlier.

This page has been intentionally left blank.
Section 6
2015–2016
Public Accounts of Canada
Interest-bearing debt Table of contents Page Unmatured debt
Marketable bonds ......................................................................... 6.3 Treasury bills................................................................................ 6.5 Retail debt .................................................................................... 6.6 Canada bills .................................................................................. 6.7 Medium-term notes ...................................................................... 6.7 Unamortized discounts and premiums on market debt ............... 6.8 Cross-currency swap revaluation ................................................. 6.8 Interest rates ................................................................................. 6.9 Maturity of Government debt ...................................................... 6.10 Statement of all borrowing transactions on behalf
of Her Majesty .......................................................................... 6.10 Obligation related to capital leases .............................................. 6.11
Pensions and other future benefits Public sector pensions .................................................................. 6.18 Other employee and veteran future benefits ................................ 6.37
Other liabilities Canada Pension Plan .................................................................... 6.39 Government Annuities Account .................................................. 6.40 Deposit and trust accounts ........................................................... 6.41 Other specified purpose accounts ................................................ 6.48
Supplementary statements Canada Pension Plan .................................................................... 6.59 Government Annuities Account .................................................. 6.83 Royal Canadian Mounted Police (Dependants)
Pension Fund ............................................................................ 6.90

Public Accounts of Canada, 2015–2016
6 . 2 Interest-bearing debt
Interest-bearing debt This section contains information on the interest-bearing debt of the Government. Interest-bearing debt includes the unmatured debt and pensions, other future benefits and other liabilities.
Some tables in this section present the continuity of accounts, by showing the opening and closing balances, as well as receipts and other credits, and payments and other charges.
Table 6.1 presents the transactions and year-end balances of interest-bearing debt. Chart 6A presents interest-bearing debt by category for the current fiscal year.
The financial statements of the Canada Pension Plan, the Government Annuities Account and the Royal Canadian Mounted Police (Dependants) Pension Fund, together with the Independent Auditor’s Reports thereon, are presented at the end of this section.
A narrative description is provided for accounts reported in some tables. Such descriptions follow the same presentation order as their respective tables.
Table 6.1 Interest-bearing debt (in dollars)
Receipts and Payments and April 1, 2015 other credits other charges March 31, 2016
Unmatured debt1
Payable in Canadian currency Marketable bonds, Table 6.2 ................................................................. 487,881,385,000 93,474,530,500 77,288,201,000 504,067,714,500 Treasury bills, Table 6.3 ....................................................................... 135,691,690,000 357,500,000,000 355,091,690,000 138,100,000,000 Retail debt, Table 6.4 ............................................................................ 5,659,734,773 1,876,054,521 2,459,736,148 5,076,053,146
629,232,809,773 452,850,585,021 434,839,627,148 647,243,767,646 Payable in foreign currencies
Marketable bonds, Table 6.2 ................................................................. 14,754,356,126 554,272,154 3,078,215 15,305,550,065 Canada bills, Table 6.5 .......................................................................... 3,788,566,525 25,557,491,161 24,598,654,641 4,747,403,045 Medium-term notes, Table 6.6 .............................................................. 1,724,145,000 705,300,000 – 2,429,445,000
20,267,067,651 26,817,063,315 24,601,732,856 22,482,398,110
Total—Market Debt .................................................................................... 649,499,877,424 479,667,648,336 459,441,360,004 669,726,165,756
Unamortized discounts and premiums on market debt, Table 6.7 ............. 4,295,595,310 2,231,037,011 1,479,803,188 5,046,829,133
Total—Market Debt including unamortized discounts and premiums ...... 653,795,472,734 481,898,685,347 460,921,163,192 674,772,994,889
Cross-currency swap revaluation ................................................................ 6,669,558,394 – (1,721,833,921) 8,391,392,315 Obligation related to capital leases, Table 6.12 .......................................... 3,709,577,586 60,433,238 293,129,169 3,476,881,655 Other unmatured debt ................................................................................. 1,004,815,733 574,432,084 9,405,908 1,569,841,909
Total—Unmatured debt .................................................................................... 665,179,424,447 482,533,550,669 459,501,864,348 688,211,110,768
Pensions, other future benefits and other liabilities Public sector pensions, Table 6.15 ............................................................. 152,664,206,404 17,340,863,453 17,778,004,429 152,227,065,428 Other employee and veteran future benefits, Table 6.28 ............................ 76,140,483,000 14,237,268,000 4,696,440,000 85,681,311,000 Other liabilities
Due to Canada Pension Plan, Table 6.29 .............................................. 212,059,870 74,740,072,278 74,917,403,413 34,728,735 Government Annuities Account............................................................ 149,598,084 9,849,652 25,627,645 133,820,091 Deposit and trust accounts, Table 6.30 ................................................. 1,674,525,011 894,329,922 1,124,183,636 1,444,671,297 Other specified purpose accounts, Table 6.33 ...................................... 3,965,275,386 2,462,170,111 2,438,831,480 3,988,614,017
6,001,458,351 78,106,421,963 78,506,046,174 5,601,834,140
Total—Pensions, other future benefits and other liabilities ............................. 234,806,147,755 109,684,553,416 100,980,490,603 243,510,210,568
Total .................................................................................................................. 899,985,572,202 592,218,104,085 560,482,354,951 931,721,321,336
1 This table includes unmatured debt issued by the Government of Canada. Borrowings of agent enterprise Crown corporations which are unconditional obligations of the Government, but not included in unmatured debt, can be found in Table 6.11.
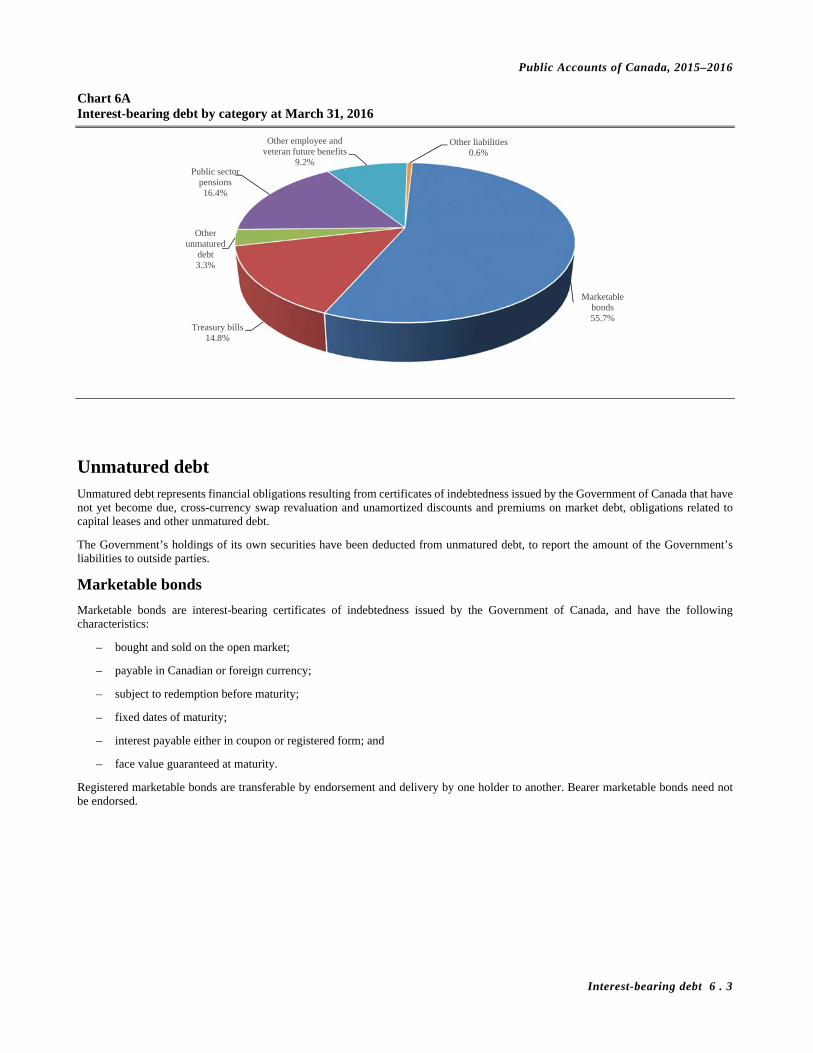
Public Accounts of Canada, 2015–2016
Interest-bearing debt 6 . 3
Chart 6A Interest-bearing debt by category at March 31, 2016
Unmatured debt Unmatured debt represents financial obligations resulting from certificates of indebtedness issued by the Government of Canada that have not yet become due, cross-currency swap revaluation and unamortized discounts and premiums on market debt, obligations related to capital leases and other unmatured debt.
The Government’s holdings of its own securities have been deducted from unmatured debt, to report the amount of the Government’s liabilities to outside parties.
Marketable bonds
Marketable bonds are interest-bearing certificates of indebtedness issued by the Government of Canada, and have the following characteristics:
– bought and sold on the open market;
– payable in Canadian or foreign currency;
– subject to redemption before maturity;
– fixed dates of maturity;
– interest payable either in coupon or registered form; and
– face value guaranteed at maturity.
Registered marketable bonds are transferable by endorsement and delivery by one holder to another. Bearer marketable bonds need not be endorsed.
Marketable bonds55.7%
Treasury bills14.8%
Other unmatured
debt3.3%
Public sector pensions16.4%
Other employee and veteran future benefits
9.2%
Other liabilities0.6%
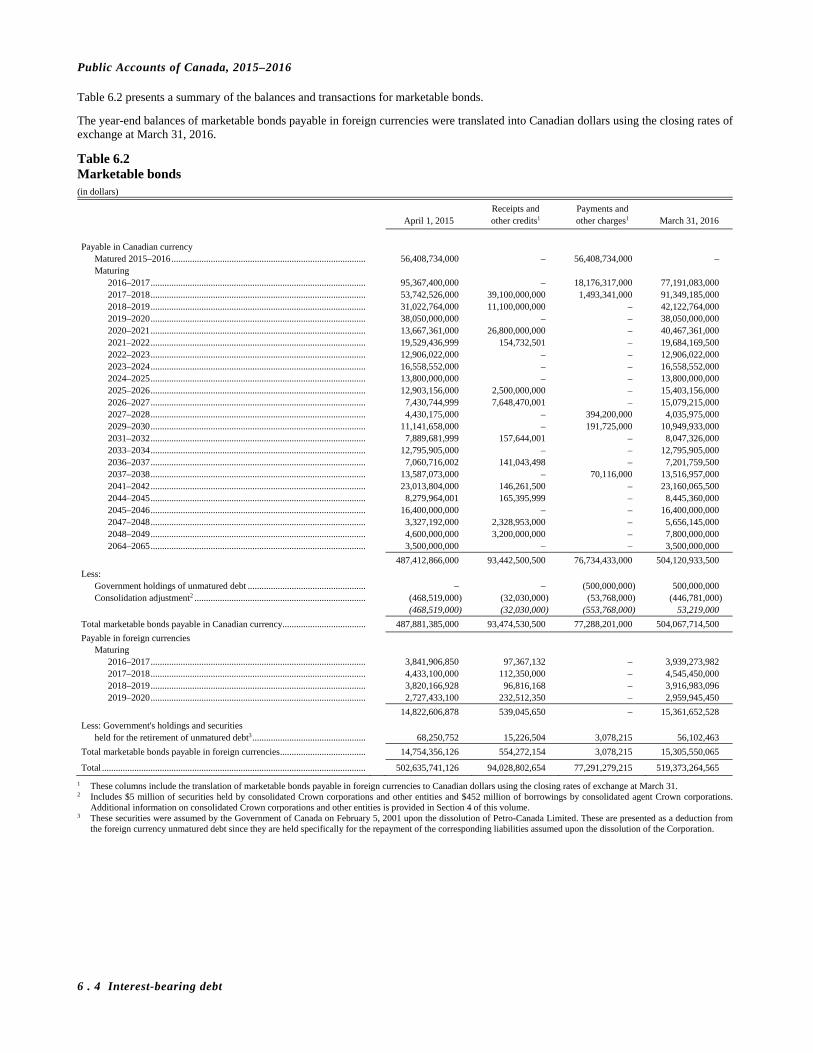
Public Accounts of Canada, 2015–2016
6 . 4 Interest-bearing debt
Table 6.2 presents a summary of the balances and transactions for marketable bonds.
The year-end balances of marketable bonds payable in foreign currencies were translated into Canadian dollars using the closing rates of exchange at March 31, 2016.
Table 6.2 Marketable bonds (in dollars)
Receipts and Payments and April 1, 2015 other credits1 other charges1 March 31, 2016
Payable in Canadian currency
Matured 2015–2016 .................................................................................... 56,408,734,000 – 56,408,734,000 – Maturing
2016–2017 ............................................................................................. 95,367,400,000 – 18,176,317,000 77,191,083,000 2017–2018 ............................................................................................. 53,742,526,000 39,100,000,000 1,493,341,000 91,349,185,000 2018–2019 ............................................................................................. 31,022,764,000 11,100,000,000 – 42,122,764,000 2019–2020 ............................................................................................. 38,050,000,000 – – 38,050,000,000 2020–2021 ............................................................................................. 13,667,361,000 26,800,000,000 – 40,467,361,000 2021–2022 ............................................................................................. 19,529,436,999 154,732,501 – 19,684,169,500 2022–2023 ............................................................................................. 12,906,022,000 – – 12,906,022,000 2023–2024 ............................................................................................. 16,558,552,000 – – 16,558,552,000 2024–2025 ............................................................................................. 13,800,000,000 – – 13,800,000,000 2025–2026 ............................................................................................. 12,903,156,000 2,500,000,000 – 15,403,156,000 2026–2027 ............................................................................................. 7,430,744,999 7,648,470,001 – 15,079,215,000 2027–2028 ............................................................................................. 4,430,175,000 – 394,200,000 4,035,975,000 2029–2030 ............................................................................................. 11,141,658,000 – 191,725,000 10,949,933,000 2031–2032 ............................................................................................. 7,889,681,999 157,644,001 – 8,047,326,000 2033–2034 ............................................................................................. 12,795,905,000 – – 12,795,905,000 2036–2037 ............................................................................................. 7,060,716,002 141,043,498 – 7,201,759,500 2037–2038 ............................................................................................. 13,587,073,000 – 70,116,000 13,516,957,000 2041–2042 ............................................................................................. 23,013,804,000 146,261,500 – 23,160,065,500 2044–2045 ............................................................................................. 8,279,964,001 165,395,999 – 8,445,360,000 2045–2046 ............................................................................................. 16,400,000,000 – – 16,400,000,000 2047–2048 ............................................................................................. 3,327,192,000 2,328,953,000 – 5,656,145,000 2048–2049 ............................................................................................. 4,600,000,000 3,200,000,000 – 7,800,000,000 2064–2065 ............................................................................................. 3,500,000,000 – – 3,500,000,000
487,412,866,000 93,442,500,500 76,734,433,000 504,120,933,500
Less: Government holdings of unmatured debt ................................................... – – (500,000,000) 500,000,000 Consolidation adjustment2 .......................................................................... (468,519,000) (32,030,000) (53,768,000) (446,781,000)
(468,519,000) (32,030,000) (553,768,000) 53,219,000
Total marketable bonds payable in Canadian currency.................................... 487,881,385,000 93,474,530,500 77,288,201,000 504,067,714,500
Payable in foreign currencies Maturing
2016–2017 ............................................................................................. 3,841,906,850 97,367,132 – 3,939,273,982 2017–2018 ............................................................................................. 4,433,100,000 112,350,000 – 4,545,450,000 2018–2019 ............................................................................................. 3,820,166,928 96,816,168 – 3,916,983,096 2019–2020 ............................................................................................. 2,727,433,100 232,512,350 – 2,959,945,450
14,822,606,878 539,045,650 – 15,361,652,528
Less: Government's holdings and securities held for the retirement of unmatured debt3 ................................................. 68,250,752 15,226,504 3,078,215 56,102,463
Total marketable bonds payable in foreign currencies ..................................... 14,754,356,126 554,272,154 3,078,215 15,305,550,065
Total .................................................................................................................. 502,635,741,126 94,028,802,654 77,291,279,215 519,373,264,565
1 These columns include the translation of marketable bonds payable in foreign currencies to Canadian dollars using the closing rates of exchange at March 31. 2 Includes $5 million of securities held by consolidated Crown corporations and other entities and $452 million of borrowings by consolidated agent Crown corporations.
Additional information on consolidated Crown corporations and other entities is provided in Section 4 of this volume. 3 These securities were assumed by the Government of Canada on February 5, 2001 upon the dissolution of Petro-Canada Limited. These are presented as a deduction from
the foreign currency unmatured debt since they are held specifically for the repayment of the corresponding liabilities assumed upon the dissolution of the Corporation.
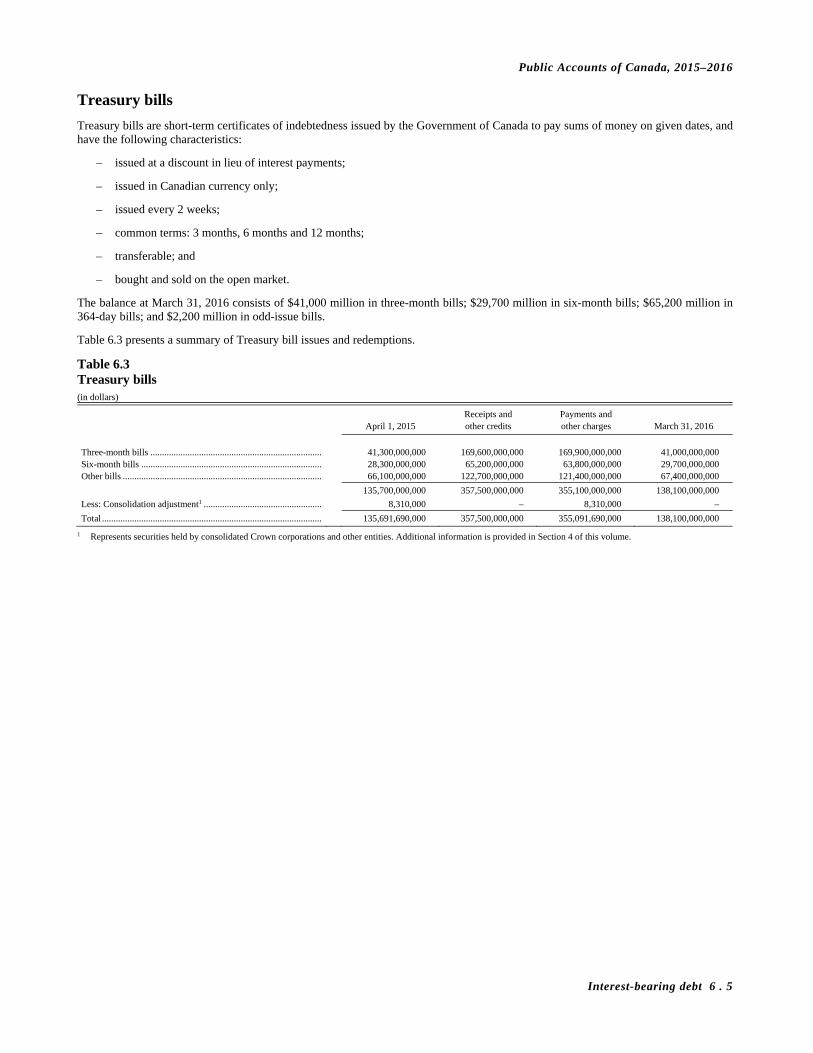
Public Accounts of Canada, 2015–2016
Interest-bearing debt 6 . 5
Treasury bills
Treasury bills are short-term certificates of indebtedness issued by the Government of Canada to pay sums of money on given dates, and have the following characteristics:
– issued at a discount in lieu of interest payments;
– issued in Canadian currency only;
– issued every 2 weeks;
– common terms: 3 months, 6 months and 12 months;
– transferable; and
– bought and sold on the open market.
The balance at March 31, 2016 consists of $41,000 million in three-month bills; $29,700 million in six-month bills; $65,200 million in 364-day bills; and $2,200 million in odd-issue bills.
Table 6.3 presents a summary of Treasury bill issues and redemptions.
Table 6.3 Treasury bills (in dollars)
Receipts and Payments and April 1, 2015 other credits other charges March 31, 2016
Three-month bills .......................................................................... 41,300,000,000 169,600,000,000 169,900,000,000 41,000,000,000 Six-month bills .............................................................................. 28,300,000,000 65,200,000,000 63,800,000,000 29,700,000,000 Other bills ...................................................................................... 66,100,000,000 122,700,000,000 121,400,000,000 67,400,000,000
135,700,000,000 357,500,000,000 355,100,000,000 138,100,000,000
Less: Consolidation adjustment1 ................................................... 8,310,000 – 8,310,000 –
Total ............................................................................................... 135,691,690,000 357,500,000,000 355,091,690,000 138,100,000,000
1 Represents securities held by consolidated Crown corporations and other entities. Additional information is provided in Section 4 of this volume.

Public Accounts of Canada, 2015–2016
6 . 6 Interest-bearing debt
Retail debt
Retail debt includes Canada savings bonds and Canada premium bonds which are interest-bearing certificates of indebtedness issued by the Government of Canada, and have the following characteristics:
– issued to Canadian residents;
– issued in Canadian currency only;
– registered in the name of the holder;
– fixed dates of maturity;
– not marketable;
– not subject to call before maturity;
– term to maturity of three years or more;
– Canada savings bonds are redeemable on demand by the holder, with accrued interest calculated to the end of the previous month (no interest is paid if redeemed during the first 3 months following the date of issue); and
– Canada premium bonds are redeemable in full or partially on any annual anniversary of the issue date and during the 30 days thereafter by the holder, with accrued interest if applicable.
Table 6.4 presents a summary of the balances and transactions for Canada savings bonds and Canada premium bonds.
Table 6.4 Retail debt (in dollars)
Receipts and Payments and April 1, 2015 other credits other charges March 31, 2016
Canada savings bonds (CSB)
Matured 2015–20161 ................................................................ 589,068,860 – 589,068,860 – Maturing
2016–20172 ......................................................................... 876,224,920 – 261,016,646 615,208,274 2017–20183 ......................................................................... 1,020,548,479 805,243,944 813,034,433 1,012,757,990 2018–20194 ......................................................................... 559,157,118 953,038,146 251,119,968 1,261,075,296 2019–20205 ......................................................................... 261,858,705 – 37,489,075 224,369,630 2020–20216 ......................................................................... 272,056,204 – 43,620,708 228,435,496 2021–2022 .......................................................................... 331,015,491 – 61,130,441 269,885,050
3,909,929,777 1,758,282,090 2,056,480,131 3,611,731,736 Canada premium bonds (CPB)
Matured 2015–2016 ................................................................. 312,921,110 – 312,921,110 – Maturing
2016–2017 .......................................................................... 264,224,401 – 15,428,333 248,796,068 2017–2018 .......................................................................... 203,197,228 2,100 12,381,098 190,818,230 2018–20194 ......................................................................... 433,085,017 117,770,331 18,919,518 531,935,830 2019–20205 ......................................................................... 243,347,237 – 22,475,314 220,871,923 2020–20216 ......................................................................... 149,755,468 – 10,236,568 139,518,900 2021–2022 .......................................................................... 143,274,535 – 10,894,076 132,380,459
1,749,804,996 117,772,431 403,256,017 1,464,321,410
Total ............................................................................................... 5,659,734,773 1,876,054,521 2,459,736,148 5,076,053,146
1 Ten years maturity extension to CSB Series 48 until November 1, 2015. 2 Ten years maturity extension to CSB Series 49 until November 1, 2016. 3 Ten years maturity extension to CSB Series 50 and 52 until November 1, 2017. 4 Ten years maturity extension to CSB Series 51, 54, 55, 56, 57, 58 and CPB Series 3, 4, 5, 6, 7. 5 Ten years maturity extension to CSB Series 59, 60, 61, 62, 63, 64 and CPB Series 8, 9, 10, 11, 12, 13. 6 Ten years maturity extension to CSB Series 65 and CPB Series 14.
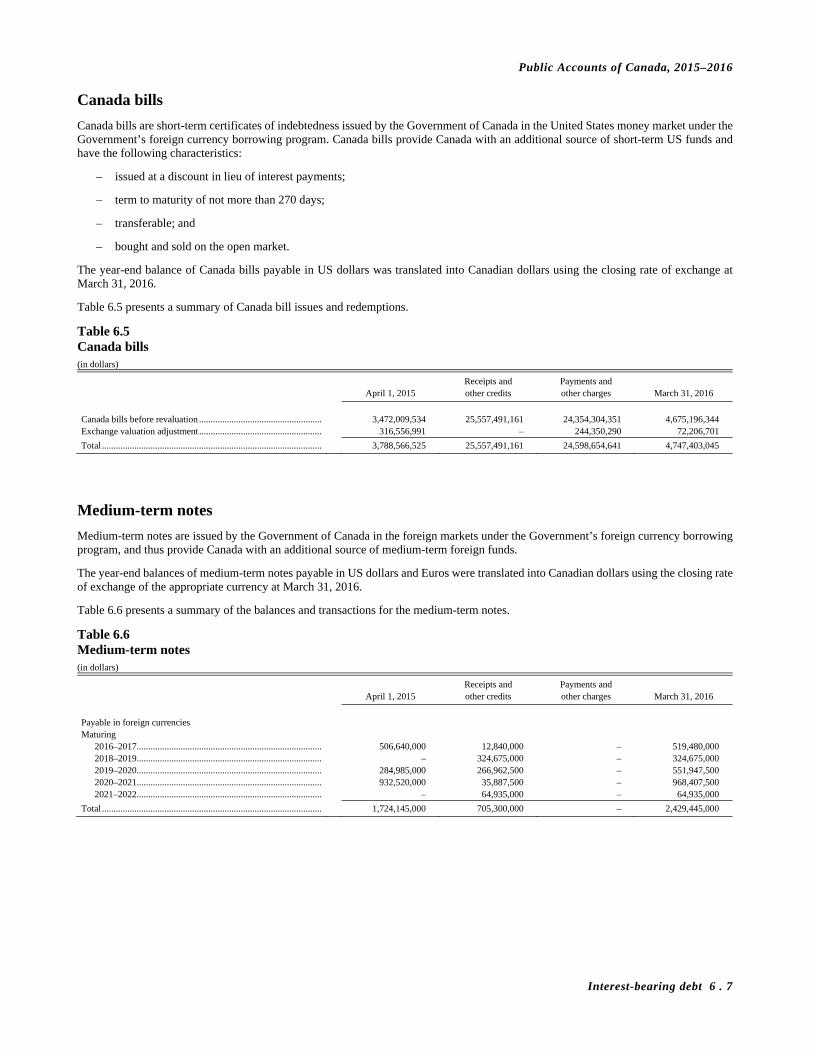
Public Accounts of Canada, 2015–2016
Interest-bearing debt 6 . 7
Canada bills
Canada bills are short-term certificates of indebtedness issued by the Government of Canada in the United States money market under the Government’s foreign currency borrowing program. Canada bills provide Canada with an additional source of short-term US funds and have the following characteristics:
– issued at a discount in lieu of interest payments;
– term to maturity of not more than 270 days;
– transferable; and
– bought and sold on the open market.
The year-end balance of Canada bills payable in US dollars was translated into Canadian dollars using the closing rate of exchange at March 31, 2016.
Table 6.5 presents a summary of Canada bill issues and redemptions.
Table 6.5 Canada bills (in dollars)
Receipts and Payments and April 1, 2015 other credits other charges March 31, 2016
Canada bills before revaluation ..................................................... 3,472,009,534 25,557,491,161 24,354,304,351 4,675,196,344 Exchange valuation adjustment ..................................................... 316,556,991 – 244,350,290 72,206,701
Total ............................................................................................... 3,788,566,525 25,557,491,161 24,598,654,641 4,747,403,045
Medium-term notes
Medium-term notes are issued by the Government of Canada in the foreign markets under the Government’s foreign currency borrowing program, and thus provide Canada with an additional source of medium-term foreign funds.
The year-end balances of medium-term notes payable in US dollars and Euros were translated into Canadian dollars using the closing rate of exchange of the appropriate currency at March 31, 2016.
Table 6.6 presents a summary of the balances and transactions for the medium-term notes.
Table 6.6 Medium-term notes (in dollars)
Receipts and Payments and April 1, 2015 other credits other charges March 31, 2016
Payable in foreign currencies Maturing
2016–2017 ................................................................................ 506,640,000 12,840,000 – 519,480,000 2018–2019 ................................................................................ – 324,675,000 – 324,675,000 2019–2020 ................................................................................ 284,985,000 266,962,500 – 551,947,500 2020–2021 ................................................................................ 932,520,000 35,887,500 – 968,407,500 2021–2022 ................................................................................ – 64,935,000 – 64,935,000
Total ............................................................................................... 1,724,145,000 705,300,000 – 2,429,445,000

Public Accounts of Canada, 2015–2016
6 . 8 Interest-bearing debt
Unamortized discounts and premiums on market debt
The unamortized discounts and premiums on market debt have the following characteristics:
– unamortized discounts on Canada bills records the portion of the discounts on outstanding Canada bills which has not yet been charged to expenses. Discounts are amortized over the life of the bills;
– unamortized discounts on Treasury bills records the portion of the discounts on outstanding Treasury bills which has not yet been charged to expenses. Discounts are amortized over the life of the bills; and
– unamortized discounts and premiums on marketable bonds records the portion of the discounts and premiums on outstanding marketable bonds which has not yet been charged to expenses. Discounts and premiums are amortized over the life of the bonds.
Table 6.7 presents a summary of the balances and transactions for the unamortized discounts and premiums on market debt.
Table 6.7 Unamortized discounts and premiums on market debt (in dollars)
Receipts and Payments and April 1, 2015 other credits other charges March 31, 2016
Unamortized discounts on Canada bills ........................................................... (655,885) 9,825,138 12,407,856 (3,238,603) Unamortized discounts on Treasury bills ......................................................... (330,974,318) 861,165,644 736,356,615 (206,165,289) Unamortized discounts and premiums on marketable bonds ........................... 4,627,225,513 1,360,046,229 731,038,717 5,256,233,025
Total .................................................................................................................. 4,295,595,310 2,231,037,011 1,479,803,188 5,046,829,133
Cross-currency swap revaluation
This represents the unrealized gains or losses due to fluctuations in the foreign exchange value of the cross-currency swaps.

Public Accounts of Canada, 2015–2016
Interest-bearing debt 6 . 9
Interest rates
Table 6.8 sets out market debt as at March 31, for each of the years 2011–2012 to 2015–2016 inclusively, with the average rate of interest thereon. For purposes of comparison, market debt is classified as Marketable bonds, Treasury bills, Retail debt, Bonds for Canada Pension Plan, Canada bills and Medium-term notes.
Table 6.8 Market debt as at March 31, from 2012 to 2016, with the average rate of interest thereon (in millions of dollars)
Bonds for Total Marketable Treasury Retail Canada Pension Canada Medium-term market bonds bills debt Plan bills notes debt
Amount Average Amount Average Amount Average Amount Average Amount Average Amount Average Amount Average out- interest out- interest out- interest out- interest out- interest out- interest out- interest standing rate % standing rate % standing rate % standing rate % standing rate % standing rate % standing rate %
2016 ... 519,373 2.47 138,100 0.50 5,076 0.67 – – 4,748 0.43 2,429 0.67 669,726 2.03 2015 ... 502,635 2.70 135,692 0.81 5,660 0.71 – – 3,789 0.08 1,724 0.35 649,500 2.27 2014 ... 486,313 2.85 152,990 0.96 6,327 0.72 – – 2,290 0.08 746 0.46 648,666 2.37 2013 ... 477,738 3.03 180,689 1.03 7,481 0.76 – – 2,103 0.13 – – 668,011 2.45 2012 ... 456,784 3.30 163,221 0.99 8,922 0.81 11 9.37 2,071 0.07 – – 631,009 2.65
Note: The interest rate in effect at March 31 is used where various rates of interest are applicable.
Table 6.9 shows the average high and low yields of Treasury bills, at tender, together with the average yield on the latest issues for the years 2011–2012 to 2015–2016 inclusively.
Table 6.9 Treasury bills average yields at tender (in percentage)
Year ended March 31 High Low Last issue
Three-month bills
2016 .................................................................................................................................. 0.67 0.37 0.46 2015 .................................................................................................................................. 0.95 0.47 0.53 2014 .................................................................................................................................. 1.02 0.83 0.88 2013 .................................................................................................................................. 1.04 0.89 0.98 2012 .................................................................................................................................. 0.98 0.82 0.93
Six-month bills 2016 .................................................................................................................................. 0.69 0.37 0.51 2015 .................................................................................................................................. 0.98 0.45 0.54 2014 .................................................................................................................................. 1.06 0.87 0.91 2013 .................................................................................................................................. 1.12 0.94 1.01 2012 .................................................................................................................................. 1.14 0.88 1.02
364 days bills 2016 .................................................................................................................................. 0.72 0.38 0.54 2015 .................................................................................................................................. 1.02 0.43 0.53 2014 .................................................................................................................................. 1.13 0.94 0.96 2013 .................................................................................................................................. 1.26 0.96 1.04 2012 .................................................................................................................................. 1.47 0.85 1.10
Other bills 2016 .................................................................................................................................. 0.67 0.45 0.53 2015 .................................................................................................................................. 0.98 0.68 0.71 2014 .................................................................................................................................. 1.04 0.77 0.81 2013 .................................................................................................................................. 1.07 0.93 0.98 2012 .................................................................................................................................. 1.00 0.82 0.97

Public Accounts of Canada, 2015–2016
6 . 10 Interest-bearing debt
Maturity of Government debt
Table 6.10 presents total market debt arranged in order of maturity.
Table 6.10 Maturity of Government debt (in millions of dollars)
Total Marketable Treasury Retail Canada Medium-term market bonds bills debt bills notes debt
Average Average Average Average Average Average interest interest interest interest interest interest Amount rate % Amount rate % Amount rate % Amount rate % Amount rate % Amount rate %
2017 ............................................ 81,130 1.68 138,100 0.50 864 0.68 4,748 0.43 519 0.54 225,361 3.82 2018 ............................................ 95,895 1.29 – 1,204 0.63 – – 97,099 1.93 2019 ............................................ 46,040 1.85 – 1,793 0.67 – 325 0.53 48,158 2.98 2020 ............................................ 41,010 2.68 – 445 0.61 – 552 0.26 42,007 4.57 2021 ............................................ 40,467 1.78 – 368 0.84 – 968 0.44 41,803 5.10 2022–2026 .................................. 78,352 3.00 – 402 0.73 – 65 0.63 78,819 4.36 2027–2031 .................................. 30,065 4.61 – – – – 30,065 4.61 2032–2036 .................................. 20,843 5.07 – – – – 20,843 5.07 2037–2041 .................................. 20,719 4.30 – – – – 20,719 4.30 2042–2046 .................................. 48,005 3.08 – – – – 48,005 3.08 2047–2051 .................................. 13,456 2.12 – – – – 13,456 2.12 2062–2066 .................................. 3,500 2.75 – – – – 3,500 2.75
519,482 2.47 138,100 0.50 5,076 0.67 4,748 0.43 2,429 0.67 669,835 2.03
Less: Government's holdings and consolidation adjustment1 ............................ 109 – – – – 109
Total ............................................ 519,373 2.47 138,100 0.50 5,076 0.67 4,748 0.43 2,429 0.67 669,726 2.03
Note: This table includes unmatured debt issued by the Government of Canada. Borrowings of agent enterprise Crown corporations which are unconditional obligations of the Government, but not included in unmatured debt, can be found in Table 6.11. 1 Includes government’s holdings and securities held for the retirement of unmatured debt (Marketable bonds – $56 million with an average interest rate of 7.96 per cent) and
consolidation adjustments.
Statement of all borrowing transactions on behalf of Her Majesty
Table 6.11 presents information on the Government’s borrowing transactions. Included in this table are borrowings by the Government for general purposes and borrowings by agent enterprise Crown corporations. Borrowings by non-agent enterprise Crown corporations and other government business enterprises are not included because such borrowings are not on behalf of Her Majesty.
Table 6.11 Statement of all borrowing transactions on behalf of Her Majesty (in millions of dollars)
Issues/ April 1, 2015 Borrowings Retirements March 31, 2016
Market debt of the Government of Canada1 .................................................... 649,500 479,667 459,441 669,726 Cross-currency swap revaluation .................................................................... 6,669 – (1,722) 8,391 Unamortized discounts and premiums on market debt1 .................................. 4,296 2,231 1,480 5,047 Obligation related to capital leases1 ................................................................ 3,710 60 293 3,477 Other unmatured debt ...................................................................................... 1,005 574 9 1,570 665,180 482,532 459,501 688,211 Borrowings of enterprise Crown corporations designated
as agents of Her Majesty ............................................................................ 253,049 87,353 73,968 266,434
Total ................................................................................................................. 918,229 569,885 533,469 954,645
1 Details can be found in this section.
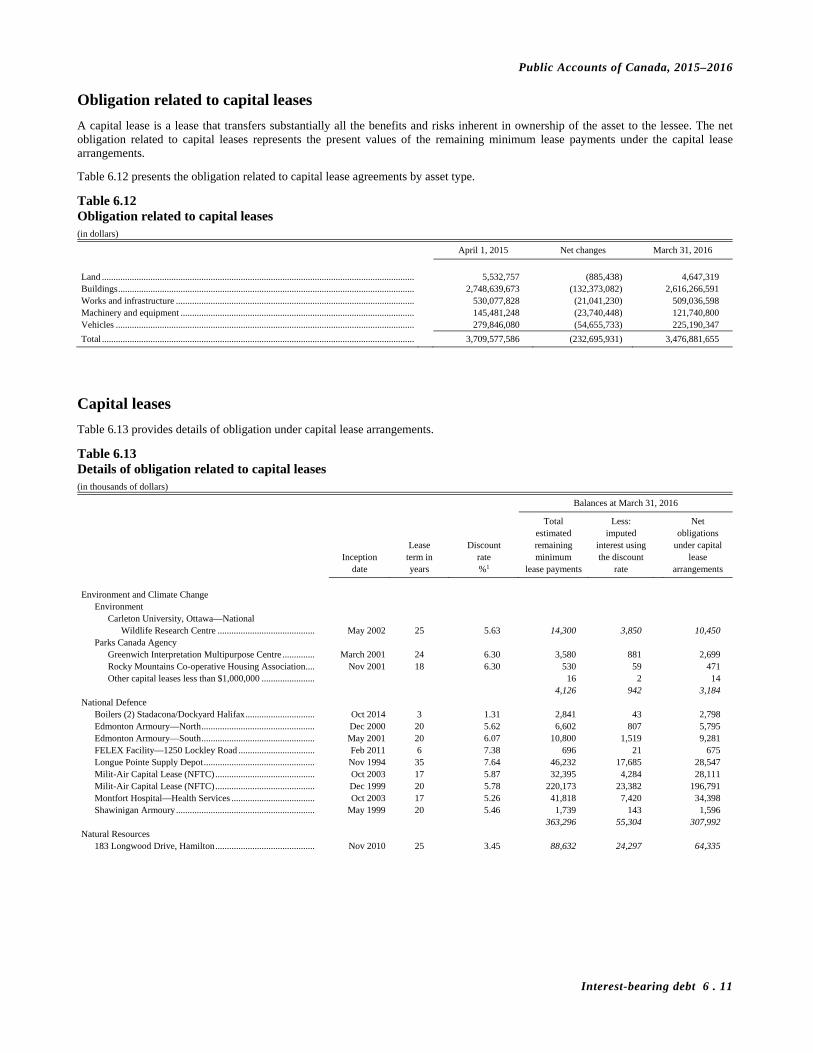
Public Accounts of Canada, 2015–2016
Interest-bearing debt 6 . 11
Obligation related to capital leases
A capital lease is a lease that transfers substantially all the benefits and risks inherent in ownership of the asset to the lessee. The net obligation related to capital leases represents the present values of the remaining minimum lease payments under the capital lease arrangements.
Table 6.12 presents the obligation related to capital lease agreements by asset type.
Table 6.12 Obligation related to capital leases (in dollars)
April 1, 2015 Net changes March 31, 2016
Land ....................................................................................................................................... 5,532,757 (885,438) 4,647,319 Buildings ................................................................................................................................ 2,748,639,673 (132,373,082) 2,616,266,591 Works and infrastructure ....................................................................................................... 530,077,828 (21,041,230) 509,036,598 Machinery and equipment ..................................................................................................... 145,481,248 (23,740,448) 121,740,800 Vehicles ................................................................................................................................. 279,846,080 (54,655,733) 225,190,347
Total ....................................................................................................................................... 3,709,577,586 (232,695,931) 3,476,881,655
Capital leases
Table 6.13 provides details of obligation under capital lease arrangements.
Table 6.13 Details of obligation related to capital leases (in thousands of dollars)
Balances at March 31, 2016
Total Less: Net estimated imputed obligations Lease Discount remaining interest using under capital Inception term in rate minimum the discount lease date years %1 lease payments rate arrangements
Environment and Climate Change
Environment Carleton University, Ottawa—National
Wildlife Research Centre .......................................... May 2002 25 5.63 14,300 3,850 10,450 Parks Canada Agency
Greenwich Interpretation Multipurpose Centre .............. March 2001 24 6.30 3,580 881 2,699 Rocky Mountains Co-operative Housing Association .... Nov 2001 18 6.30 530 59 471 Other capital leases less than $1,000,000 ....................... 16 2 14
4,126 942 3,184 National Defence
Boilers (2) Stadacona/Dockyard Halifax .............................. Oct 2014 3 1.31 2,841 43 2,798 Edmonton Armoury—North ................................................. Dec 2000 20 5.62 6,602 807 5,795 Edmonton Armoury—South ................................................. May 2001 20 6.07 10,800 1,519 9,281 FELEX Facility—1250 Lockley Road ................................. Feb 2011 6 7.38 696 21 675 Longue Pointe Supply Depot ................................................ Nov 1994 35 7.64 46,232 17,685 28,547 Milit-Air Capital Lease (NFTC) ........................................... Oct 2003 17 5.87 32,395 4,284 28,111 Milit-Air Capital Lease (NFTC) ........................................... Dec 1999 20 5.78 220,173 23,382 196,791 Montfort Hospital—Health Services .................................... Oct 2003 17 5.26 41,818 7,420 34,398 Shawinigan Armoury ............................................................ May 1999 20 5.46 1,739 143 1,596
363,296 55,304 307,992 Natural Resources
183 Longwood Drive, Hamilton ........................................... Nov 2010 25 3.45 88,632 24,297 64,335

Public Accounts of Canada, 2015–2016
6 . 12 Interest-bearing debt
Table 6.13 Details of obligation related to capital leases—continued (in thousands of dollars)
Balances at March 31, 2016
Total Less: Net estimated imputed obligations Lease Discount remaining interest using under capital Inception term in rate minimum the discount lease date years %1 lease payments rate arrangements
Public Safety and Emergency Preparedness
Royal Canadian Mounted Police Firing range, Chilliwack .................................................. Feb 2016 4 3.50 2,431 185 2,246 RCMP Detachment, Cornwall ......................................... Aug 2009 25 5.54 21,106 7,893 13,213 Other capital leases less than $1,000,000 ........................ 1,107 414 693
24,644 8,492 16,152 Public Services and Procurement
Public Works and Government Services 1 Arctic Road, Inuvik ....................................................... March 2008 10 10.73 343 36 307 110 O'Connor Street, Ottawa (Lease 1 of 6) .................... April 2009 10 5.70 1,734 144 1,590 110 O'Connor Street, Ottawa (Lease 2 of 6) .................... April 2009 10 5.43 1,701 135 1,566 110 O'Connor Street, Ottawa (Lease 3 of 6) .................... Dec 2009 10 5.43 3,465 329 3,136 110 O'Connor Street, Ottawa (Lease 4 of 6) .................... Dec 2009 10 5.43 2,569 244 2,325 110 O'Connor Street, Ottawa (Lease 5 of 6) .................... Dec 2009 10 5.43 1,342 128 1,214 110 O'Connor Street, Ottawa (Lease 6 of 6) .................... April 2010 10 4.37 759 59 700 1104 Ikaluktuutiak Drive, Iqaluit ..................................... Nov 2011 10 2.60 3,581 251 3,330 111 Lombard Avenue, Winnipeg ..................................... Nov 2014 20 2.69 21,494 4,593 16,901 1164 Devonshire Avenue, North Bay .............................. April 2011 10 3.67 975 85 890 117 Glencoe Drive, Mount Pearl ..................................... Aug 2009 10 3.57 1,253 73 1,180 1200 Commissioners Road East, London ........................ Dec 2012 10 9.02 2,514 633 1,881 12511 Vulcan Way, Richmond ........................................ July 2014 15 4.25 1,998 473 1,525 1300 Bath Road, Kingston ............................................... Feb 2012 10 2.20 722 45 677 1363 4th Avenue, Prince George ..................................... Dec 2010 10 6.84 816 119 697 139 Douglastown Boulevard, Miramichi ......................... Oct 2012 10 1.95 3,051 188 2,863 1431 Merivale Road, Ottawa ........................................... Oct 2007 10 8.22 788 49 739 144 Millennium Drive, Quispamsis ................................. Nov 2011 15 8.74 1,355 473 882 1484 Centennial Drive, Kingston..................................... Oct 2006 10 18.24 230 10 220 1550 d'Estimauville Avenue, Quebec .............................. Nov 2011 20 8.24 68,000 29,778 38,222 159 Cleopatra Drive, Ottawa ........................................... March 2011 10 1.33 2,758 90 2,668 1600 Star Top Road, Ottawa ............................................ July 2004 15 7.15 9,942 1,095 8,847 165 Edgecomb Drive, Charlottetown .............................. Aug 2012 15 8.65 1,733 631 1,102 1725 Woodward Drive, Ottawa (Lease 1 of 2) ................ Dec 2009 10 8.94 1,645 247 1,398 1725 Woodward Drive, Ottawa (Lease 2 of 2) ................ Dec 2009 10 8.55 1,520 219 1,301 179 3rd Avenue, Timmins ............................................... Feb 2010 10 8.69 2,932 446 2,486 180 Bass Pro Mills Drive, Vaughan ................................ Sept 2014 10 2.20 4,823 424 4,399 1801 Hollis and Duke, Halifax ........................................ Oct 2009 10 3.89 1,741 117 1,624 181 Queen Street, Ottawa ................................................ March 2004 20 10.65 29,668 9,808 19,860 1925 McCallum Road, Abbotsford .................................. Nov 2008 15 4.30 3,290 509 2,781 200 John Street West, Oshawa ......................................... Nov 2009 10 7.16 996 120 876 2030 Pie IX Boulevard, Montreal .................................... May 2015 10 3.83 2,305 361 1,944 215-219 George Street, Peterborough .............................. April 2012 10 4.48 1,051 136 915 22 de Varennes Street, Gatineau ...................................... Nov 2007 10 10.97 981 84 897 22 Eddy Street, Gatineau ................................................. May 2013 25 7.89 263,640 139,727 123,913 220 Fortin Street, Quebec ................................................ Dec 2007 10 15.65 393 49 344 2250 St-Olivier Street, Trois-Rivières ............................. Sept 2012 10 9.03 2,301 559 1,742 2455 Don Reid Drive, Ottawa .......................................... Dec 2009 15 7.71 2,674 728 1,946 2575 Sainte-Anne Boulevard, Quebec ............................. April 2015 20 10.32 41,826 23,522 18,304 2655 Lancaster Road, Ottawa (Lease 1 of 2) ................... Feb 2009 8 3.94 165 3 162 2655 Lancaster Road, Ottawa (Lease 2 of 2) ................... July 2009 8 4.66 145 3 142 269 Laurier Avenue, Ottawa ............................................ Sept 2005 15 4.18 25,802 2,279 23,523

Public Accounts of Canada, 2015–2016
Interest-bearing debt 6 . 13
Table 6.13 Details of obligation related to capital leases—continued (in thousands of dollars)
Balances at March 31, 2016
Total Less: Net estimated imputed obligations Lease Discount remaining interest using under capital Inception term in rate minimum the discount lease date years %1 lease payments rate arrangements
275 De Baets Street, Winnipeg ........................................ Feb 2007 10 17.42 233 18 215 295 Belliveau Avenue, Shediac ....................................... Jan 2007 15 7.93 2,243 452 1,791 3 Lower Malpeque Road, Charlottetown ......................... June 2008 10 4.19 306 14 292 30 Victoria Street, Gatineau ............................................. June 2013 25 7.89 264,615 140,543 124,072 301 Bishop Drive, Fredericton ......................................... Feb 2014 15 5.30 2,322 640 1,682 3020 Hawthorne Road, Ottawa ........................................ Dec 2012 15 2.27 6,636 811 5,825 3085 Glen Erin Drive, Mississauga (Lease 1 of 2) .......... Aug 2010 7 7.28 380 19 361 3085 Glen Erin Drive, Mississauga (Lease 2 of 2) .......... Nov 2010 10 5.74 1,320 162 1,158 325 Broadway Avenue, Winnipeg ................................... Jan 2008 10 10.37 2,435 217 2,218 3299 Industriel Boulevard, Sherbrooke ........................... Nov 2009 10 6.24 716 76 640 351 Saint-Joseph Boulevard, Gatineau (Lease 1 of 3) ..... Aug 2011 25 5.28 73,234 28,383 44,851 351 Saint-Joseph Boulevard, Gatineau (Lease 2 of 3) ..... Dec 2011 25 7.33 18,904 9,145 9,759 351 Saint-Joseph Boulevard, Gatineau (Lease 3 of 3) ..... Aug 2014 12 2.45 10,259 1,210 9,049 360 George Street North, Peterborough ........................... April 2012 10 8.70 1,360 303 1,057 3600 Lysander Lane, Richmond ...................................... March 2010 10 0.43 1,564 13 1,551 395 Terminal Avenue, Ottawa ......................................... Jan 2013 15 2.67 52,341 7,463 44,878 4110 Wellington Street, Verdun ...................................... June 2012 10 7.20 1,000 190 810 419 Kensington Avenue, Estevan .................................... Oct 2011 10 2.87 716 54 662 425 Bloor Street, Toronto ................................................ June 2014 10 2.39 2,076 192 1,884 444 5th Street, Shawinigan .............................................. Dec 2011 10 8.50 1,809 377 1,432 455 de la Carrière Boulevard, Gatineau ........................... Nov 2012 25 6.86 197,400 96,214 101,186 485 Bishop Drive, Fredericton ......................................... Dec 2011 15 6.16 1,217 327 890 4901-05 46th Street, Red Deer ......................................... Aug 2011 10 3.11 1,367 109 1,258 5019 52nd Street, Yellowknife ........................................ Feb 2011 10 2.54 1,030 62 968 5151 De la Savane Street, Montreal................................. June 2014 10 2.39 2,209 204 2,005 520 Exmouth Street, Sarnia ............................................. Dec 2006 10 4.08 357 5 352 522 Main Street, Shediac ................................................. April 2012 10 2.34 2,138 145 1,993 555 McAllister Drive, Saint John .................................... Nov 2007 10 8.16 1,010 66 944 559 College Street, Toronto ............................................. July 2012 10 2.24 1,976 127 1,849 635 8th Avenue South West, Calgary .............................. July 2009 10 3.55 3,558 202 3,356 6500 Trans-Canada Highway, Pointe-Claire ................... Sept 2012 10 1.95 798 48 750 6503 67th Street, Red Deer .............................................. Sept 2009 10 4.81 448 36 412 667 Notre-Dame Street, Repentigny ................................ April 2013 10 2.01 1,030 70 960 8 Colonnade Road, Ottawa .............................................. May 2007 10 5.91 315 11 304 8 Oakes Avenue, Kirkland Lake ...................................... April 2012 10 6.93 5,166 949 4,217 8 Queen Street East, Sault Ste Marie ............................... June 2010 10 4.95 1,217 119 1,098 81 Kingmingya Road, Inuvik ........................................... Jan 2011 10 7.35 726 115 611 81 Mulcaster Street, Barrie .............................................. Sept 2012 15 12.99 6,360 3,053 3,307 825-827 Fort Street, Victoria ........................................... Oct 2011 10 2.66 1,050 74 976 859 Main Street, Moncton ............................................... July 2008 10 5.49 436 27 409 90 Elgin Street, Ottawa .................................................... Nov 2014 25 7.23 460,744 239,934 220,810 933 Mivvik Street, Iqualuit (Lease 1 of 2) ....................... June 2013 10 2.19 3,720 280 3,440 933 Mivvik Street, Iqualuit (Lease 2 of 2) ....................... Sept 2013 10 2.72 2,654 253 2,401 985 McGill Place, Kamloops ........................................... June 2002 15 13.50 358 28 330 98-100 Racine Street East, Saguenay .............................. June 2011 9 5.36 886 110 776 Admiral Building, Ottawa ................................................ Aug 2009 15 11.51 1,484 546 938 Albion Executive Tower, Ottawa ..................................... Dec 2009 10 6.80 1,178 138 1,040 Anderson Building, Selkirk .............................................. Jan 2012 10 2.18 719 43 676 Barker House, Fredericton ............................................... April 2010 10 2.82 1,468 81 1,387 Bell Canada Place, Ottawa ............................................... May 2003 15 10.88 1,968 214 1,754 Broad Street Crossing, Regina (Lease 1 of 2) .................. May 2008 10 4.88 454 23 431 Broad Street Crossing, Regina (Lease 2 of 2) .................. May 2008 10 9.77 351 35 316
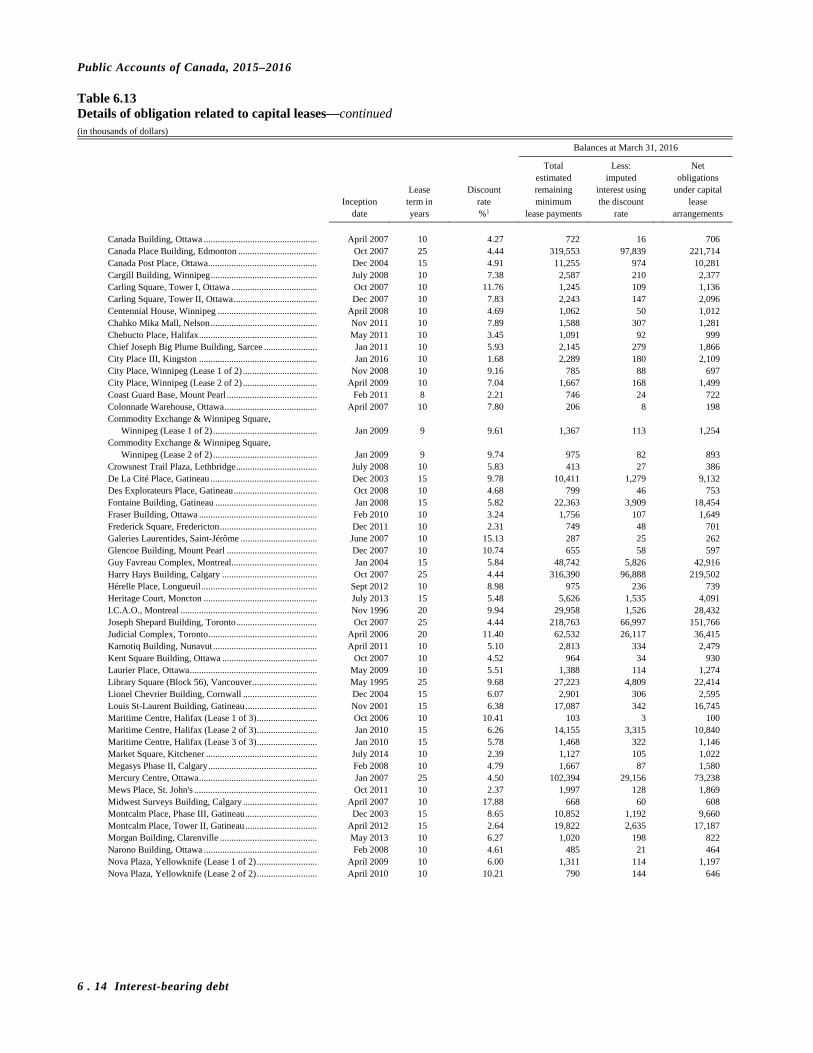
Public Accounts of Canada, 2015–2016
6 . 14 Interest-bearing debt
Table 6.13 Details of obligation related to capital leases—continued (in thousands of dollars)
Balances at March 31, 2016
Total Less: Net estimated imputed obligations Lease Discount remaining interest using under capital Inception term in rate minimum the discount lease date years %1 lease payments rate arrangements
Canada Building, Ottawa ................................................. April 2007 10 4.27 722 16 706 Canada Place Building, Edmonton .................................. Oct 2007 25 4.44 319,553 97,839 221,714 Canada Post Place, Ottawa ............................................... Dec 2004 15 4.91 11,255 974 10,281 Cargill Building, Winnipeg .............................................. July 2008 10 7.38 2,587 210 2,377 Carling Square, Tower I, Ottawa ..................................... Oct 2007 10 11.76 1,245 109 1,136 Carling Square, Tower II, Ottawa .................................... Dec 2007 10 7.83 2,243 147 2,096 Centennial House, Winnipeg ........................................... April 2008 10 4.69 1,062 50 1,012 Chahko Mika Mall, Nelson .............................................. Nov 2011 10 7.89 1,588 307 1,281 Chebucto Place, Halifax ................................................... May 2011 10 3.45 1,091 92 999 Chief Joseph Big Plume Building, Sarcee ....................... Jan 2011 10 5.93 2,145 279 1,866 City Place III, Kingston ................................................... Jan 2016 10 1.68 2,289 180 2,109 City Place, Winnipeg (Lease 1 of 2) ................................ Nov 2008 10 9.16 785 88 697 City Place, Winnipeg (Lease 2 of 2) ................................ April 2009 10 7.04 1,667 168 1,499 Coast Guard Base, Mount Pearl ....................................... Feb 2011 8 2.21 746 24 722 Colonnade Warehouse, Ottawa ........................................ April 2007 10 7.80 206 8 198 Commodity Exchange & Winnipeg Square,
Winnipeg (Lease 1 of 2) ............................................. Jan 2009 9 9.61 1,367 113 1,254 Commodity Exchange & Winnipeg Square,
Winnipeg (Lease 2 of 2) ............................................. Jan 2009 9 9.74 975 82 893 Crowsnest Trail Plaza, Lethbridge ................................... July 2008 10 5.83 413 27 386 De La Cité Place, Gatineau .............................................. Dec 2003 15 9.78 10,411 1,279 9,132 Des Explorateurs Place, Gatineau .................................... Oct 2008 10 4.68 799 46 753 Fontaine Building, Gatineau ............................................ Jan 2008 15 5.82 22,363 3,909 18,454 Fraser Building, Ottawa ................................................... Feb 2010 10 3.24 1,756 107 1,649 Frederick Square, Fredericton .......................................... Dec 2011 10 2.31 749 48 701 Galeries Laurentides, Saint-Jérôme ................................. June 2007 10 15.13 287 25 262 Glencoe Building, Mount Pearl ....................................... Dec 2007 10 10.74 655 58 597 Guy Favreau Complex, Montreal ..................................... Jan 2004 15 5.84 48,742 5,826 42,916 Harry Hays Building, Calgary ......................................... Oct 2007 25 4.44 316,390 96,888 219,502 Hérelle Place, Longueuil .................................................. Sept 2012 10 8.98 975 236 739 Heritage Court, Moncton ................................................. July 2013 15 5.48 5,626 1,535 4,091 I.C.A.O., Montreal ........................................................... Nov 1996 20 9.94 29,958 1,526 28,432 Joseph Shepard Building, Toronto ................................... Oct 2007 25 4.44 218,763 66,997 151,766 Judicial Complex, Toronto ............................................... April 2006 20 11.40 62,532 26,117 36,415 Kamotiq Building, Nunavut ............................................. April 2011 10 5.10 2,813 334 2,479 Kent Square Building, Ottawa ......................................... Oct 2007 10 4.52 964 34 930 Laurier Place, Ottawa ....................................................... May 2009 10 5.51 1,388 114 1,274 Library Square (Block 56), Vancouver ............................ May 1995 25 9.68 27,223 4,809 22,414 Lionel Chevrier Building, Cornwall ................................ Dec 2004 15 6.07 2,901 306 2,595 Louis St-Laurent Building, Gatineau ............................... Nov 2001 15 6.38 17,087 342 16,745 Maritime Centre, Halifax (Lease 1 of 3) .......................... Oct 2006 10 10.41 103 3 100 Maritime Centre, Halifax (Lease 2 of 3) .......................... Jan 2010 15 6.26 14,155 3,315 10,840 Maritime Centre, Halifax (Lease 3 of 3) .......................... Jan 2010 15 5.78 1,468 322 1,146 Market Square, Kitchener ................................................ July 2014 10 2.39 1,127 105 1,022 Megasys Phase II, Calgary ............................................... Feb 2008 10 4.79 1,667 87 1,580 Mercury Centre, Ottawa ................................................... Jan 2007 25 4.50 102,394 29,156 73,238 Mews Place, St. John's ..................................................... Oct 2011 10 2.37 1,997 128 1,869 Midwest Surveys Building, Calgary ................................ April 2007 10 17.88 668 60 608 Montcalm Place, Phase III, Gatineau ............................... Dec 2003 15 8.65 10,852 1,192 9,660 Montcalm Place, Tower II, Gatineau ............................... April 2012 15 2.64 19,822 2,635 17,187 Morgan Building, Clarenville .......................................... May 2013 10 6.27 1,020 198 822 Narono Building, Ottawa ................................................. Feb 2008 10 4.61 485 21 464 Nova Plaza, Yellowknife (Lease 1 of 2) .......................... April 2009 10 6.00 1,311 114 1,197 Nova Plaza, Yellowknife (Lease 2 of 2) .......................... April 2010 10 10.21 790 144 646

Public Accounts of Canada, 2015–2016
Interest-bearing debt 6 . 15
Table 6.13 Details of obligation related to capital leases—concluded (in thousands of dollars)
Balances at March 31, 2016
Total Less: Net estimated imputed obligations Lease Discount remaining interest using under capital Inception term in rate minimum the discount lease date years %1 lease payments rate arrangements
Parks Canada Building, Dartmouth ................................. July 2009 20 7.61 3,592 1,333 2,259 Queen Square, Dartmouth ................................................ Sept 2011 10 3.18 7,225 597 6,628 RCMP Building, Montreal ............................................... Oct 2007 25 4.44 54,986 16,888 38,098 Revenue Canada Building, Montreal ............................... Oct 2007 25 4.44 111,866 34,270 77,596 Roper Ridge Business Park, Edmonton ........................... Nov 2008 10 6.43 2,374 193 2,181 Rosdev de Ville, Gatineau ............................................... June 2007 10 4.58 4,314 121 4,193 Royal Centre, New Westminster (Lease 1 of 2) .............. Nov 2008 10 11.22 750 101 649 Royal Centre, New Westminster (Lease 2 of 2) .............. March 2011 9 5.96 663 81 582 Samuel-Holland Complex, Quebec.................................. July 2011 10 3.13 784 62 722 Sixty Queen Building, Ottawa (Lease 1 of 2) .................. July 2008 10 3.94 580 22 558 Sixty Queen Building, Ottawa (Lease 2 of 2) .................. May 2009 9 0.32 1,662 5 1,657 Sixty-Six Slater Building, Ottawa (Lease 1 of 2) ............ April 2009 10 4.95 1,836 133 1,703 Sixty-Six Slater Building, Ottawa (Lease 2 of 2) ............ Sept 2010 10 5.53 921 106 815 Skyline Complex, Ottawa ................................................ Oct 2007 25 4.44 247,489 75,889 171,600 Smith Building, St. John's ................................................ July 2009 10 7.08 1,529 167 1,362 Stock Exchange Tower, Montreal .................................... April 2012 10 3.36 990 95 895 The Baker Center Building, Edmonton ........................... Dec 2007 10 4.45 305 12 293 The Inuksugait Plaza, Iqaluit ........................................... Oct 2006 10 14.28 110 4 106 The New Two Seventy Building, Ottawa ........................ June 2007 10 4.58 1,367 38 1,329 Thomas D'Arcy McGee Building, Ottawa ....................... Oct 2007 25 4.44 192,979 59,066 133,913 Time Square Building, Ottawa......................................... Oct 2010 10 4.76 3,034 308 2,726 Trebla Building, Ottawa (Lease 1 of 2) ........................... April 2009 10 9.46 3,274 433 2,841 Trebla Building, Ottawa (Lease 2 of 2) ........................... April 2009 10 2.73 346 14 332 Trusco Building, Ottawa .................................................. Sept 2006 20 4.28 72,359 14,060 58,299 VAC Records Management Centre, Charlottetown ........ Nov 2007 15 13.43 2,171 735 1,436 Vanguard Building, Ottawa ............................................. Nov 2007 10 4.80 754 29 725 Vault Building, Lethbridge .............................................. April 2008 10 6.18 403 25 378 Waldron Building, Yellowknife ....................................... Aug 2007 10 12.22 339 28 311 Woodward's Abbott Building, Vancouver ....................... Jan 2010 15 5.35 4,107 840 3,267 Other capital leases less than $1,000,000 ........................ 49,250 9,825 39,425
3,725,821 1,317,141 2,408,680 Shared Services Canada
IBM—Consolidated Enterprise Servers .......................... Jan 2015 4 0.65 82,363 750 81,613 IBM—Power UNIX Server, Model 780 .......................... April 2014 2 1.25 151 2 151 Supercomputer Meteorological Service of Canada ......... Sept 2015 2 0.53 18,700 66 18,634
101,214 816 100,398 Transport
Confederation Bridge, Borden-Carleton ................................ May 1997 35 6.16 1,095,578 586,541 509,037 Other departments
Capital leases less than $1,000,000 ....................................... 711 39 672
5,418,322 1,997,422 3,420,900
Consolidated Crown corporations and other entities Canadian Broadcasting Corporation
7067 Chebucto Rd, Halifax .............................................. June 2015 7 2.10 7,386 – 7,386 Telesat .............................................................................. Feb 2001 17 6.80 22,055 1,384 20,671 29,441 1,384 28,057
Canadian Museum of Nature Natural Heritage Building, Gatineau ............................... Sept 1996 35 9.88 54,250 26,614 27,636
Defence Construction (1951) Limited Capital leases less than $1,000,000 .................................. 305 16 289
83,996 28,014 55,982
Total ............................................................................................. 5,502,318 2,025,436 3,476,882
1 For lessors and lessees, the financing rate of a lease agreement is subject to change over the term of lease. 2 Less than $500.

Public Accounts of Canada, 2015–2016
6 . 16 Interest-bearing debt
Minimum lease payments related to capital leases
Table 6.14 presents upcoming minimum leases payments for the next five years by department.
Table 6.14 Minimum lease payments related to capital leases (in thousands of dollars)
Payments due by March 31
2022 and 2017 2018 2019 2020 2021 subsequently Total
Environment and Climate Change
Environment Remaining payments ................. 1,300 1,300 1,300 1,300 1,300 7,800 14,300 Imputed interest ......................... 588 548 506 461 414 1,333 3,850
712 752 794 839 886 6,467 10,450 Parks Canada Agency
Remaining payments ................. 544 544 544 509 403 1,582 4,126 Imputed interest ......................... 189 166 141 115 93 238 942
355 378 403 394 310 1,344 3,184 National Defence
Remaining payments ....................... 83,636 83,959 81,886 49,837 14,249 49,729 363,296 Imputed interest .............................. 16,656 12,796 8,744 4,483 2,748 9,877 55,304
66,980 71,163 73,142 45,354 11,501 39,852 307,992 Natural Resources
Remaining payments ....................... 4,518 4,518 4,518 4,518 4,518 66,042 88,632 Imputed interest .............................. 2,183 2,101 2,016 1,929 1,838 14,230 24,297
2,335 2,417 2,502 2,589 2,680 51,812 64,335 Public Safety and Emergency
Preparedness Royal Canadian Mounted Police
Remaining payments ................. 1,746 1,746 1,746 1,747 1,476 16,183 24,644 Imputed interest ......................... 830 788 744 698 651 4,781 8,492
916 958 1,002 1,049 825 11,402 16,152 Public Services and Procurement
Public Works and Government Services
Remaining payments ................. 323,489 267,320 281,900 228,523 207,162 2,417,427 3,725,821 Imputed interest ......................... 132,159 121,462 112,407 104,035 97,513 749,565 1,317,141
191,330 145,858 169,493 124,488 109,649 1,667,862 2,408,680 Shared Services Canada
Remaining payments ................. 44,194 36,343 20,677 – – – 101,214 Imputed interest ......................... 507 253 56 – – – 816
43,687 36,090 20,621 – – – 100,398 Transport
Remaining payments ....................... 63,588 61,061 61,984 62,920 63,871 782,154 1,095,578 Imputed interest .............................. 41,589 38,060 37,936 37,777 37,584 393,595 586,541
21,999 23,001 24,048 25,143 26,287 388,559 509,037 Other departments
Remaining payments ....................... 330 228 87 33 33 – 711 Imputed interest .............................. 17 10 6 3 3 – 39
313 218 81 30 30 – 672
328,627 280,835 292,086 199,886 152,168 2,167,298 3,420,900

Public Accounts of Canada, 2015–2016
Interest-bearing debt 6 . 17
Table 6.14 Minimum lease payments related to capital leases—concluded (in thousands of dollars)
Payments due by March 31
2022 and 2017 2018 2019 2020 2021 subsequently Total
Consolidated Crown corporations and
other entities Canadian Broadcasting Corporation
Remaining payments .................. 12,574 10,568 555 567 580 4,597 29,441 Imputed interest .......................... 1,098 286 – – – – 1,384
11,476 10,282 555 567 580 4,597 28,057 Canadian Museum of Nature
Remaining payments .................. 3,500 3,500 3,500 3,500 3,500 36,750 54,250 Imputed interest .......................... 2,709 2,627 2,536 2,436 2,325 13,981 26,614
791 873 964 1,064 1,175 22,769 27,636 Defence Construction (1951)
Limited Remaining payments .................. 101 204 – – – – 305 Imputed interest .......................... 8 8 – – – – 16
93 196 – – – – 289 12,360 11,351 1,519 1,631 1,755 27,366 55,982
Total ....................................................... 340,987 292,186 293,605 201,517 153,923 2,194,664 3,476,882
Summary Remaining payments ........................ 539,520 471,291 458,697 353,454 297,092 3,382,264 5,502,318 Imputed interest ............................... 198,533 179,105 165,092 151,937 143,169 1,187,600 2,025,436
Net obligation ........................................ 340,987 292,186 293,605 201,517 153,923 2,194,664 3,476,882

Public Accounts of Canada, 2015–2016
6 . 18 Interest-bearing debt
Pensions and other future benefits
The obligations arising from public sector pensions and other employee and veteran future benefits, sponsored by the Government or some of the consolidated Crown corporations and other entities, are measured on an actuarial basis and are presented net of pension assets and unrecognized net actuarial gain or loss, as well as contributions and benefits paid by some of the consolidated Crown corporations and other entities after their measurement date of December 31 up to March 31.
Public sector pensions
The Government sponsors a number of defined benefit pension plans covering substantially all its employees, principally members of the federal public service, the Canadian Forces, including the Reserve Force, and the Royal Canadian Mounted Police, as well as employees of certain Public Service corporations and territorial governments. The Government also sponsors several other pension plans; the two most significant ones being for Members of Parliament and federally appointed judges. The Government has a statutory obligation to pay the pension benefits it sponsors.
The liabilities for public sector pensions sponsored by the Government are initially recorded through pension accounts, which are generally established pursuant to legislation. The pension accounts track transactions such as contributions, interest credits, benefit payments, transfers and administrative expenses. Any adjustments required under the Government’s accounting policies are then recorded through allowance for pension adjustment accounts. The allowance accounts reflect the differential between accrual and cash accounting recognized through the years. They also reflect the accumulated difference in interest calculations and consolidation adjustments related to refundable tax amounts remitted to or refunded from the Canada Revenue Agency.
The Government’s pension plans are generally financed from employer and employee contributions or from Government and member contributions. The contributions are either part of general funds or transferred to the Public Sector Pension Investment Board (PSPIB) for investment in capital markets. Since April 1, 2000, amounts equal to contributions less benefits and other payments related to the public service, Canadian Forces—Regular Force and Royal Canadian Mounted Police pension plans, and since 2007 for the Canadian Forces—Reserve Force pension plan, that fall within the Income Tax Act limits are transferred to the PSPIB. The goal of the PSPIB is to maximize returns on investments without undue risk of loss, while having regard to the requirements and financial obligations of each of the pension plans. The PSPIB, a Canadian Crown corporation established by the Public Sector Pension Investment Board Act, reports the results of the investments in an annual report tabled in Parliament. Contributions for all the other pension plans sponsored by the Government are part of general funds.
More information on the above mentioned plans can be found in the respective annual report on the administration of the plans tabled in Parliament.
In addition, some of the consolidated Crown corporations and other entities maintain their own defined benefit pension plans covering substantially all of their employees. The majority of the defined benefit pension plans are contributory plans. Employer and employee contributions are made in accordance with the provisions of the plans. Pension plans’ funds are held in external trusts that are legally separate from Crown corporations and other entities.
i. Pension plans
Public Service Pension Plan, Canadian Forces Pension Plan including the Reserve Force Pension Plan and Royal Canadian Mounted Police Pension Plan
The pension plans for the public service, Canadian Forces—Regular Force and the Royal Canadian Mounted Police provide for the payment of a lifetime pension and a temporary bridge benefit payable normally until age 65, the age at which members generally become eligible for the Canada Pension Plan (CPP) or Quebec Pension Plan (QPP). The annual lifetime pension is based on the average salary of five consecutive years of highest paid service and the years of pensionable service. For the Canadian Forces—Reserve Force pension plan, the annual lifetime pension is based on a percentage of indexed pensionable earnings with a temporary bridge benefit until members become eligible for the CPP or QPP. Pension benefits are indexed annually on January 1 to take into account the cost of living.

Public Accounts of Canada, 2015–2016
Interest-bearing debt 6 . 19
Pension benefits accrue at a rate of two per cent per year of pensionable service up to a maximum of 35 years, the exception being the benefits offered under the Canadian Forces—Reserve Force pension plan which accrue at a rate of 1.5 per cent up to a maximum of 35 years. Pension benefits are coordinated with those of the CPP or the QPP. Pension benefits for the public service pension plan members will accrue under either Group 1 for employees who were plan members prior to January 1, 2013, or Group 2 for employees joining the public service pension plan on or after that date. The normal retirement age for Group 1 members is 60. For Group 2 members, the normal retirement age is 65 and other age related thresholds were increased by 5 years.
The contribution rates for current service for all members of the public service will increase gradually to a 50:50 cost sharing ratio with the government by 2017. Public service Group 1, Canadian Forces—Regular Force and Royal Canadian Mounted Police members contribute at different rates than public service Group 2 members. These rates are as follows:
Public service Group 1, Canadian Forces—Regular Force and Royal Canadian Mounted Police pension plan members contributed:
– for the first nine months of the 2016 fiscal year, 8.2 per cent (7.5 per cent in 2015) of salary up to the Yearly Maximum Pensionable Earnings (YMPE) for the CPP or QPP and 10.4 per cent (9.8 per cent in 2015) of salary above the YMPE; and
– for the last three months of the 2016 fiscal year, 9.1 per cent (8.2 per cent in 2015) of salary up to the YMPE and 11 per cent (10.4 per cent in 2015) of salary above the YMPE.
Public service Group 2 pension plan members contributed:
– for the first nine months of the 2016 fiscal year, 7.1 per cent (6.6 per cent in 2015) of salary up to the YMPE for the CPP or QPP and 8.5 per cent (7.9 per cent in 2015) of salary above the YMPE; and
– for the last three months of the 2016 fiscal year, 7.9 per cent (7.1 per cent in 2015) of salary up to the YMPE and 9.4 per cent (8.5 per cent in 2015) of salary above the YMPE.
Contribution rates for Group 2 members were lower than for Group 1 members due to the lower cost of the benefits related to increasing the normal age of retirement from 60 to 65.
Members of the Canadian Forces—Reserve Force contribute 5.2 per cent on salary up to two thirds of the YMPE.
Employer contributions are made monthly to provide for the cost (net of employee contributions) of the benefits that have accrued in respect of that month at a rate determined by the President of the Treasury Board. For 2016, the employer contribution rates were about 1.2, 1.7 and 1.4 (1.4, 1.9 and 1.6 respectively in 2015) times the current year’s employee contribution for the plans under the Public Service Superannuation Act, the Canadian Forces Superannuation Act (Regular Force pension plan) and the Royal Canadian Mounted Police Superannuation Act, respectively. With respect to the Reserve Force pension plan, the employer contributions were reinstated in December 2014 and a one-time payment in arrears of $42 million was credited to the Reserve Force Pension Fund Account in 2015. For 2016, the employer contribution rate was about 1.9 (1.8 in 2015) times the current year’s employee contribution for the Reserve Force pension plan.
The superannuation accounts, which record the transactions that pertain to pre April 1, 2000 service, are credited with interest at rates that are based on the Government of Canada long-term bond rate. The average interest rate credited to the superannuation accounts was approximately 4.8 per cent (5.1 per cent in 2015).
The pension fund accounts, which record the transactions that pertain to service since April 1, 2000, are flow through accounts used to transfer funds to the PSPIB. The balance in the pension fund accounts at year-end represents the amounts awaiting transfer to the PSPIB.
The retirement compensation arrangements (RCA) accounts records transactions for those pension benefits above the pension limits set under the Income Tax Act. The RCA, Regulations No. 1 and No. 2 are registered with the Canada Revenue Agency and a transfer is made annually between these RCA regulations and the Canada Revenue Agency, either to remit a 50 per cent refundable tax in respect of the net contributions and interest credits or to receive a refund based on the net benefit payments.

Public Accounts of Canada, 2015–2016
6 . 20 Interest-bearing debt
Members of Parliament retiring allowances
Members of Parliament are eligible at a certain age to receive a basic allowance upon termination of membership and after having contributed to the plan for at least six years. Retirement age is set at 55 for pensionable service accrued before January 1, 2016 and at 65 for pensionable service accrued on or after January 1, 2016, with the option of reduced benefits for early retirement at age 55. The basic allowance accrues at a rate of 3 per cent per year of pensionable service for both Members of the House of Commons and for Senators. For service accrued before January 1, 2016, the accrual rate is multiplied by the average of the best five consecutive years of sessional indemnity up to a maximum of 75 per cent of the plan member’s average sessional indemnity. For service accrued after December 31, 2015, the accrual rate is multiplied by the average of the best five consecutive years of pensionable earnings up to a maximum of 75 per cent of the plan member’s average pensionable earnings. Basic allowances are indexed annually on January 1 to the cost of living once recipients reach age 60. Pensionable service accrued on or after January 1, 2016, under the Members of Parliament pension plan, is coordinated with the CPP or QPP at age 60.
The contribution rates will increase over time to bring the plan members’ share to 50 per cent by no later than January 1, 2017. For the 2016 fiscal year, plan members contributed at a rate of 10 per cent (9 per cent in 2015) of their salary for the first 9 months and a blended rate of approximately 15.8 per cent (a flat rate of 10 per cent in 2015) for the last three months.
The Government contributions are made monthly to provide for the cost (net of plan member contributions) of the benefits that have accrued in respect of that month at a rate determined by the President of the Treasury Board. The Government contributions, expressed as a multiple of plan member contributions, are on average as follows:
2016 2015
Members of Parliament
Retiring Allowances Account ............................................................................................................................................ 3.7 4.5 Compensation Arrangements Account ............................................................................................................................... 3.0 4.1
Contributions are credited to the appropriate pension account, either the Members of Parliament Retiring Allowances Account or the Members of Parliament Retirement Compensation Arrangements Account. The pension accounts are also credited with interest at a rate determined by the Chief Actuary of Canada. The average interest rate credited to the pension accounts in 2016 was approximately 4.1 per cent (3.4 per cent in 2015).
Pension plan for federally appointed judges
This plan provides fully indexed annuities to judges and to all eligible survivors providing they meet minimum age and service requirements. The full benefit amount is generally payable when the member has completed 15 years of pensionable service and the sum of the member’s age and years of service totals 80.
Judges appointed to the bench before February 17, 1975, make required contributions of 1.5 per cent of salary. All other judges contribute 7 per cent of salary.
Legislation does not require a specific pension account to be maintained to record the transactions pertaining to this plan. Therefore, except for the portion recorded in the Supplementary Retirement Benefit Account, the liability pertaining to this plan is recorded through an allowance account. During the year, benefits paid are recorded as expenditures against the statutory payment authority. The expense is adjusted at year-end through an allowance account, to bring the current year expense from cash to an accrual accounting basis, similar to that of the other pension plans. During the year, the benefit payments charged to the expenditure authority amounted to $143 million ($136 million in 2015). At March 31, 2016, the portion of the pension liability recorded through an allowance account for the judges’ pension plan amounted to $2,421 million ($2,314 million in 2015).
Consolidated Crown corporation and other entity pension plans
Pension benefits provided under consolidated Crown corporations and other entities defined benefit pension plans vary depending on the terms of the plans. Generally, they are based on a combination of an accrual rate per years of pensionable service and some type of pensionable earnings average. Some of the consolidated Crown corporations and other entities defined benefit pension plans are closed to new entrants.

Public Accounts of Canada, 2015–2016
Interest-bearing debt 6 . 21
ii. Actuarial valuations
As required under the Public Pensions Reporting Act, actuarial valuations of the pension plans sponsored by the Government are performed at least every three years for funding purposes. The actuarial valuations are performed by the Office of the Chief Actuary, submitted to the President of the Treasury Board, and tabled in Parliament.
The most recent date for the actuarial valuation of each pension plan sponsored by the Government is as follows:
Royal Canadian Mounted Police—March 31, 2015, valuation currently in progress;
Public Service—March 31, 2014;
Canadian Forces—Regular Force—March 31, 2013;
Canadian Forces—Reserve Force—March 31, 2013;
Members of Parliament—March 31, 2013; and
Federally appointed judges—March 31, 2013.
The actuarial valuations for the public service, Canadian Forces, Royal Canadian Mounted Police and Members of Parliament pension plans include the valuation of the Retirement Compensation Arrangements (RCA) component related to each plan.
Where applicable, the funding valuations provide the Government with recommendations for setting both employer and employee contribution rates, as well as any actuarial adjustment to amortize deficiencies or excesses. These actuarial adjustments are made in equal instalments over a period not exceeding 15 years commencing in the year in which the actuarial report is laid before Parliament.
To address deficiencies, an actuarial adjustment of $681 million (nil in 2015) was credited to the Public Service Superannuation Account, $340 million ($435 million in 2015) to the Public Service Pension Fund Account, $170 million ($170 million in 2015) to the Canadian Forces Pension Fund Account, $2 million ($2 million in 2015) to the Reserve Force Pension Fund Account, $12 million ($12 million in 2015) to the Royal Canadian Mounted Police Superannuation Account, $74 million ($74 million in 2015) to the Royal Canadian Mounted Police Pension Fund Account, $129 million ($8 million in 2015) to the Public Service Retirement Compensation Arrangements (RCA) Account No. 2, and $12 million (nil in 2015) to the Public Service Retirement Compensation Arrangements (RCA) Account No. 1. The actuarial adjustments recorded in pension fund accounts are transferred to the PSPIB for investment in capital markets. To address deficiencies, the consolidated Crown corporations and other entities made special funding payments of $59 million in 2016 ($60 million in 2015).
Table 6.15 presents a summary of the balances and transactions for public sector pension plan liabilities. In particular, receipts and other credits for the Government’s pension accounts consist of contributions from plan members, the Government of Canada, participating Public Service corporations and territorial governments, as well as transfers from other pension funds, actuarial adjustments to amortize deficiencies, refunds of refundable tax and interest. Payments and other charges for the Government’s pension accounts consist of annuity payments, minimum benefits, cash termination allowances (lump sum payments to employees suffering a disability), returns of contributions, pension division payments, transfer value payments, transfers to other funds, remittances of refundable tax, payments of administrative expenses, actuarial adjustments to amortize excesses, and transfers to PSPIB. Adjustments to the Government’s allowance accounts result from the differential with annual actuarial valuations performed for accounting purposes. These include differences between benefits earned and contributions and interest calculations, as well as from other adjustments required under the Government’s accounting policies such as recognition of actuarial gains and losses and consolidation adjustments related to refundable tax amounts.
Pension benefits funded by the Government relate to post March 2000 service that falls within the Income Tax Act limits for the three main public sector pension plans and all service for the Canadian Force—Reserve Force pension plan, as funds are invested in capital markets through the PSPIB. Funded pension benefits also relate to consolidated Crown corporations and other entities where pension plans’ funds are held in external trusts that are legally separate from Crown corporations and other entities. For unfunded pension plans, separate market invested funds are not maintained. These relate to all pre April 2000 service and only to post March 2000 service that falls above the Income Tax Act limits for the three main public sector pension plans, all service periods for the pension plans of the federally appointed judges and Members of Parliament, and some of the consolidated Crown corporation and other entity pension plans.

Public Accounts of Canada, 2015–2016
6 . 22 Interest-bearing debt
Table 6.15 Public sector pensions (in millions of dollars)
Receipts and Payments and April 1, 2015 other credits other charges March 31, 2016
Funded pension benefits Public Service Pension Fund Account, Table 6.18 ..................................................................... 402 4,768 4,815 355 Allowance for pension adjustments ............................................................................................. 3,585 206 558 3,233
Subtotal................................................................................................................................... 3,987 4,974 5,373 3,588 Canadian Forces Pension Fund Account, Table 6.20 .................................................................. 183 1,461 1,475 169 Allowance for pension adjustments ............................................................................................. 968 209 170 1,007
Subtotal................................................................................................................................... 1,151 1,670 1,645 1,176 Reserve Force Pension Fund Account, Table 6.21 ...................................................................... (2) 72 121 (51) Allowance for pension adjustments ............................................................................................. 277 – 106 171
Subtotal................................................................................................................................... 275 72 227 120 Royal Canadian Mounted Police Pension Fund Account, Table 6.23 ........................................ 7 540 532 15 Allowance for pension adjustments ............................................................................................. 303 5 88 220
Subtotal................................................................................................................................... 310 545 620 235
Total pension fund accounts ........................................................................................................ 590 6,841 6,943 488 Total allowance for pension adjustments .................................................................................... 5,133 420 922 4,631 Pension benefit liabilities related to funded plans sponsored by the Government ...................... 5,723 7,261 7,865 5,119 Pension benefit assets related to funded plans sponsored by consolidated
Crown corporations and other entities ................................................................................... (1,263) 105 481 (1,639)
Net pension benefit liabilities related to funded plans ...................................................................... 4,460 7,366 8,346 3,480
Unfunded pension benefits Public Service Superannuation Account, Table 6.17 .................................................................. 95,876 5,149 5,459 95,566 Allowance for pension adjustments ............................................................................................. (9,472) 866 706 (9,312)
Subtotal................................................................................................................................... 86,404 6,015 6,165 86,254 Canadian Forces Superannuation Account, Table 6.19 ............................................................... 46,119 2,145 2,569 45,695 Allowance for pension adjustments ............................................................................................. (4,922) 446 25 (4,501)
Subtotal................................................................................................................................... 41,197 2,591 2,594 41,194 Royal Canadian Mounted Police Superannuation Account, Table 6.22 ..................................... 13,197 626 668 13,155 Allowance for pension adjustments ............................................................................................. (1,291) 112 13 (1,192)
Subtotal................................................................................................................................... 11,906 738 681 11,963 Members of Parliament Retiring Allowances Account, Table 6.24 ............................................ 501 32 31 502 Allowance for pension adjustments ............................................................................................. (72) 6 12 (78)
Subtotal................................................................................................................................... 429 38 43 424 Members of Parliament Retirement Compensation Arrangements Account, Table 6.25 ........... 238 30 19 249 Allowance for pension adjustments ............................................................................................. 209 5 6 208
Subtotal................................................................................................................................... 447 35 25 457 Retirement Compensation Arrangements (RCA) Account, Table 6.26 ...................................... 2,220 385 209 2,396 Allowance for pension adjustments ............................................................................................. 1,736 133 172 1,697
Subtotal................................................................................................................................... 3,956 518 381 4,093 Supplementary Retirement Benefits Account (Judges), Table 6.27............................................ 206 9 – 215 Allowance for pension adjustments ............................................................................................. 2,314 125 18 2,421
Subtotal................................................................................................................................... 2,520 134 18 2,636 Supplementary Retirement Benefits Account (Others), Table 6.27 ............................................ – 1 – 1
Total superannuation accounts..................................................................................................... 158,357 8,377 8,955 157,779 Total allowance for pension adjustments .................................................................................... (11,498) 1,693 952 (10,757)
Pension benefit liabilities related to unfunded plans sponsored by the Government .................. 146,859 10,070 9,907 147,022 Pension benefit liabilities related to unfunded plans sponsored by consolidated
Crown corporations and other entities ................................................................................... 82 8 4 86
Pension benefit liabilities related to unfunded plans ......................................................................... 146,941 10,078 9,911 147,108
Net pension benefit liabilities ............................................................................................................ 151,401 17,444 18,257 150,588
The net pension benefit liabilities were recognized and presented in the Consolidated Statement of Financial Position as follows:
Public sector pension liabilities ......................................................................................................... 152,664 17,339 17,776 152,227
Public sector pension assets ............................................................................................................... (1,263) 105 481 (1,639)
Net pension benefit liabilities ............................................................................................................ 151,401 17,444 18,257 150,588

Public Accounts of Canada, 2015–2016
Interest-bearing debt 6 . 23
Table 6.16 presents a summary of transactions in public sector pensions that resulted in charges to expenses. Interest is calculated based on the accrued pension obligations under the various plans. The net interest expense represents interest of $7,333 million ($7,906 million in 2015) credited to the superannuation accounts in accordance with the pension legislation, a provision of $4,439 million ($4,240 million in 2015) and interest of $421 million ($414 million in 2015) on the consolidated Crown corporations and other entities’ obligations, shown net of $4,899 million ($4,764 million in 2015) in expected return on pension investments.
Table 6.16 Summary of transactions in public sector pensions that resulted in charges to expenditures (in millions of dollars)
2015–2016 2014–2015
Govern- ment contri- Net Actu- Less costs Actuarial butions bene- arial recorded in Plan losses Net Net and Adjust- fits adjust- previous amend- (gains) Pension interest Pension interest
other1 ment earned ments2 years3 ments recognized expense expense expense expense
Funded pension benefits
Public Service Pension Fund Account .................... 2,205 195 2,400 340 (340) – (218) 2,182 11 2,417 193
Canadian Forces Pension Fund Account .................... 757 52 809 170 (170) – 60 869 41 907 101
Reserve Force Pension Fund Account .................... 42 (26) 16 2 (2) – (18) (2) (4) (6) (3)
Royal Canadian Mounted Police Pension Fund Account .................... 270 5 275 74 (74) – (12) 263 (2) 297 18
Consolidated Crown corporations and other entities1 ..................... 92 (6) 86 59 (59) 19 (167) (62) (164) (2) (110)
Total funded pension benefits ...... 3,366 220 3,586 645 (645) 19 (355) 3,250 (118) 3,613 199

Public Accounts of Canada, 2015–2016
6 . 24 Interest-bearing debt
Table 6.16 Summary of transactions in public sector pensions that resulted in charges to expenditures—concluded (in millions of dollars)
2015–2016 2014–2015
Govern- ment contri- Net Actu- Less costs Actuarial butions bene- arial recorded in Plan losses Net Net and Adjust- fits adjust- previous amend- (gains) Pension interest Pension interest
other1 ment earned ments2 years3 ments recognized expense expense expense expense
Unfunded pension benefits
Public Service Superannuation Account4 .. 11 (25) (14) 681 (681) – 832 818 4,477 472 4,558
Canadian Forces Superannuation Account ... 3 (5) (2) – – – 446 444 2,119 294 2,185
Defence Services Pension Continuation Act1 .............. 3 – 3 – – – – 3 – 3 –
Royal Canadian Mounted Police Superannuation Account ............................. – (1) (1) 12 (12) – 106 105 619 70 634
Royal Canadian Mounted Police Continuation Act1 ... 10 – 10 – – – – 10 – 11 –
Members of Parliament Retiring Allowances Account ............................. 9 (3) 6 – – – 6 12 11 14 16
Members of Parliament Retirement Compensation Arrangements Account...... 15 (2) 13 – – – 4 17 6 20 8
Retirement Compensation Arrangements (RCA) Account ............................. 87 19 106 141 (141) – 27 133 107 65 99
Supplementary Retirement Benefits Account ............... 4 – 4 – – – – 4 1 4 –
Judges Act1 .............................. 143 (18) 125 – – – 57 182 69 157 93 Other (diplomatic services,
lieutenant governors, etc.)1 ................................... 2 – 2 – – – – 2 – 2 –
Consolidated Crown corporations and other entities ...................... – 2 2 – – – 3 5 3 3 4
Subtotal ......................................... 287 (33) 254 834 (834) – 1,481 1,735 7,412 1,115 7,597 Less: contributions from
the Judges' plan recorded to revenues .............................. (15) – (15) – – – – (15) – (14) –
Total unfunded pension benefits .. 272 (33) 239 834 (834) – 1,481 1,720 7,412 1,101 7,597
Total reported in the
Consolidated Statement of Operations and Accumulated Deficit ............... 3,638 187 3,825 1,479 (1,479) 19 1,126 4,970 7,294 4,714 7,796
1 “Other” includes consolidated Crown corporations and other entities’ contributions to their pension plans and statutory payments made to beneficiaries. 2 Represents actuarial adjustments to amortize deficiencies. 3 Represents the reversal of costs already recorded in the allowance for pension adjustments of previous years. 4 Includes payments under the Supplementary Retirement Benefits Act and various acts.
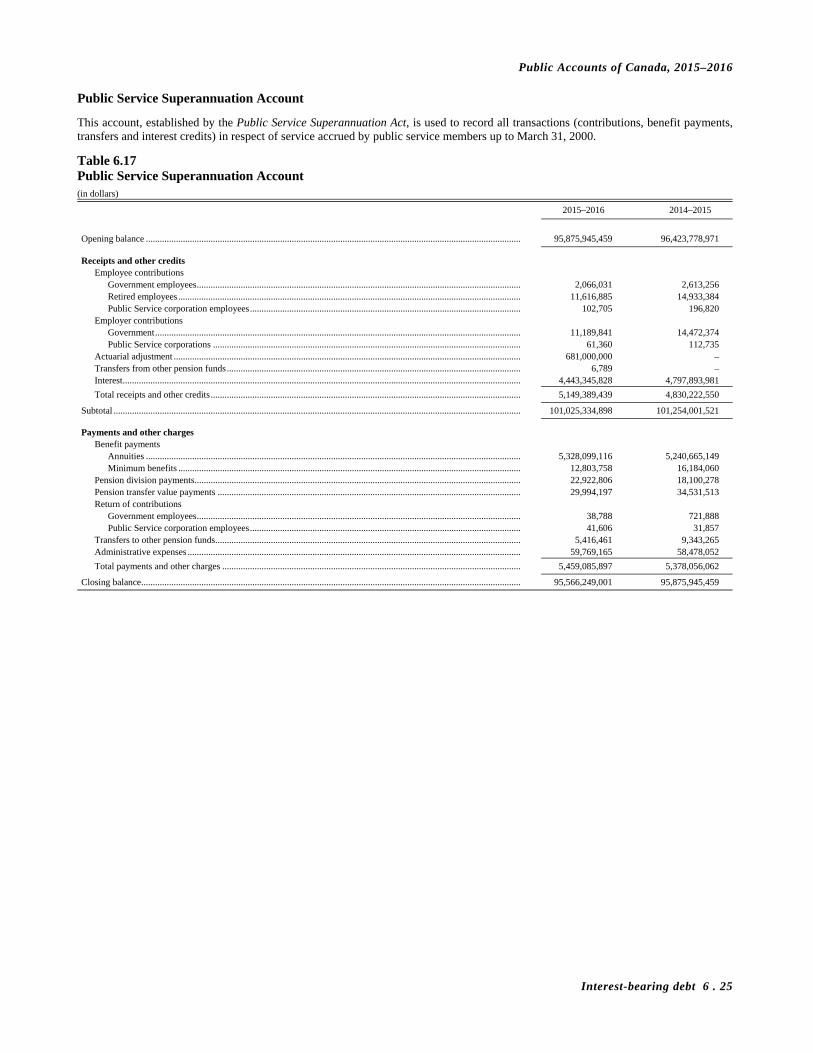
Public Accounts of Canada, 2015–2016
Interest-bearing debt 6 . 25
Public Service Superannuation Account
This account, established by the Public Service Superannuation Act, is used to record all transactions (contributions, benefit payments, transfers and interest credits) in respect of service accrued by public service members up to March 31, 2000.
Table 6.17 Public Service Superannuation Account (in dollars)
2015–2016 2014–2015
Opening balance .................................................................................................................................................................. 95,875,945,459 96,423,778,971
Receipts and other credits Employee contributions
Government employees ............................................................................................................................................ 2,066,031 2,613,256 Retired employees .................................................................................................................................................... 11,616,885 14,933,384 Public Service corporation employees ..................................................................................................................... 102,705 196,820
Employer contributions Government .............................................................................................................................................................. 11,189,841 14,472,374 Public Service corporations ..................................................................................................................................... 61,360 112,735
Actuarial adjustment ...................................................................................................................................................... 681,000,000 – Transfers from other pension funds ............................................................................................................................... 6,789 – Interest ............................................................................................................................................................................ 4,443,345,828 4,797,893,981
Total receipts and other credits ...................................................................................................................................... 5,149,389,439 4,830,222,550
Subtotal ................................................................................................................................................................................ 101,025,334,898 101,254,001,521
Payments and other charges Benefit payments
Annuities .................................................................................................................................................................. 5,328,099,116 5,240,665,149 Minimum benefits .................................................................................................................................................... 12,803,758 16,184,060
Pension division payments............................................................................................................................................. 22,922,806 18,100,278 Pension transfer value payments ................................................................................................................................... 29,994,197 34,531,513 Return of contributions
Government employees ............................................................................................................................................ 38,788 721,888 Public Service corporation employees ..................................................................................................................... 41,606 31,857
Transfers to other pension funds .................................................................................................................................... 5,416,461 9,343,265 Administrative expenses ................................................................................................................................................ 59,769,165 58,478,052
Total payments and other charges ................................................................................................................................. 5,459,085,897 5,378,056,062
Closing balance .................................................................................................................................................................... 95,566,249,001 95,875,945,459

Public Accounts of Canada, 2015–2016
6 . 26 Interest-bearing debt
Public Service Pension Fund Account
This account is used to record the transactions in respect of service accrued on or after April 1, 2000, under the Public Service Superannuation Act. An amount equal to contributions less benefits and other payments is transferred to the PSPIB for investment in capital markets. The closing balance in this account represents the net cash position prior to transfer to the PSPIB.
Table 6.18 Public Service Pension Fund Account (in dollars)
2015–2016 2014–2015
Opening balance .................................................................................................................................................................. 402,290,387 499,943,338
Receipts and other credits Employee contributions
Government employees ............................................................................................................................................ 1,773,737,501 1,667,207,395 Retired employees .................................................................................................................................................... 41,559,748 38,077,475 Public Service corporation employees ..................................................................................................................... 168,640,289 157,358,746
Employer contributions Government .............................................................................................................................................................. 2,205,355,883 2,342,382,010 Public Service corporations ..................................................................................................................................... 206,059,867 218,193,085
Actuarial adjustment ...................................................................................................................................................... 340,000,000 435,000,000 Transfers from other pension funds ............................................................................................................................... 33,350,235 29,619,344
Total receipts and other credits ...................................................................................................................................... 4,768,703,523 4,887,838,055
Payments and other charges Benefit payments
Annuities .................................................................................................................................................................. 1,558,724,353 1,343,904,637 Minimum benefits .................................................................................................................................................... 12,641,148 11,322,140
Pension division payments............................................................................................................................................. 30,273,474 26,204,917 Pension transfer value payments ................................................................................................................................... 316,963,114 279,072,403 Return of contributions
Government employees ............................................................................................................................................ 10,507,898 7,572,183 Public Service corporation employees ..................................................................................................................... 4,837,063 3,533,886
Transfers to other pension funds .................................................................................................................................... 47,446,792 52,019,965 Administrative expenses ................................................................................................................................................ 42,400,198 41,056,225
Total payments and other charges ................................................................................................................................. 2,023,794,040 1,764,686,356
Receipts and other credits less payments and other charges ............................................................................................... 2,744,909,483 3,123,151,699
Transfers to PSPIB .............................................................................................................................................................. 2,792,147,670 3,220,804,650
Closing balance .................................................................................................................................................................... 355,052,200 402,290,387
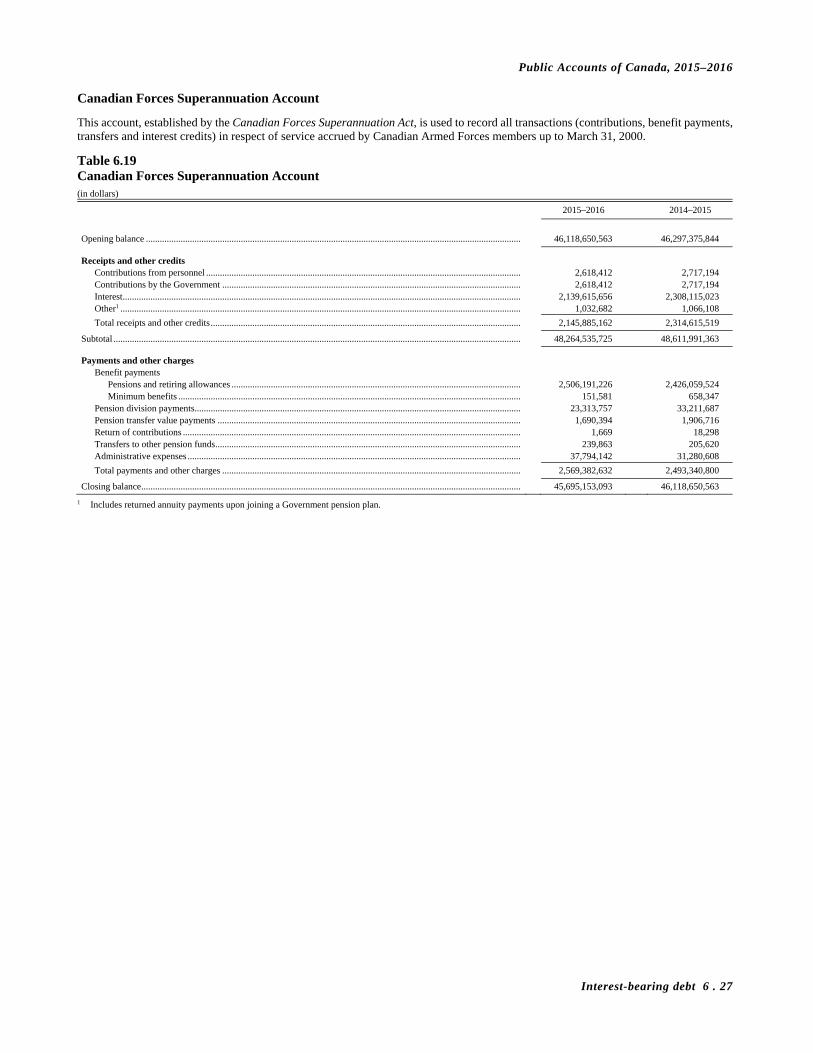
Public Accounts of Canada, 2015–2016
Interest-bearing debt 6 . 27
Canadian Forces Superannuation Account
This account, established by the Canadian Forces Superannuation Act, is used to record all transactions (contributions, benefit payments, transfers and interest credits) in respect of service accrued by Canadian Armed Forces members up to March 31, 2000.
Table 6.19 Canadian Forces Superannuation Account (in dollars)
2015–2016 2014–2015
Opening balance .................................................................................................................................................................. 46,118,650,563 46,297,375,844
Receipts and other credits Contributions from personnel ........................................................................................................................................ 2,618,412 2,717,194 Contributions by the Government ................................................................................................................................. 2,618,412 2,717,194 Interest ............................................................................................................................................................................ 2,139,615,656 2,308,115,023 Other1 ............................................................................................................................................................................. 1,032,682 1,066,108
Total receipts and other credits ...................................................................................................................................... 2,145,885,162 2,314,615,519
Subtotal ................................................................................................................................................................................ 48,264,535,725 48,611,991,363
Payments and other charges Benefit payments
Pensions and retiring allowances ............................................................................................................................. 2,506,191,226 2,426,059,524 Minimum benefits .................................................................................................................................................... 151,581 658,347
Pension division payments............................................................................................................................................. 23,313,757 33,211,687 Pension transfer value payments ................................................................................................................................... 1,690,394 1,906,716 Return of contributions .................................................................................................................................................. 1,669 18,298 Transfers to other pension funds .................................................................................................................................... 239,863 205,620 Administrative expenses ................................................................................................................................................ 37,794,142 31,280,608
Total payments and other charges ................................................................................................................................. 2,569,382,632 2,493,340,800
Closing balance .................................................................................................................................................................... 45,695,153,093 46,118,650,563
1 Includes returned annuity payments upon joining a Government pension plan.

Public Accounts of Canada, 2015–2016
6 . 28 Interest-bearing debt
Canadian Forces Pension Fund Account
This account is used to record the transactions in respect of service accrued on or after April 1, 2000, in accordance with Part I of the Canadian Forces Superannuation Act. An amount equal to contributions less benefits and other payments is transferred to the PSPIB for investment in capital markets. The closing balance in this account represents the net cash position prior to transfer to the PSPIB.
Table 6.20 Canadian Forces Pension Fund Account (in dollars)
2015–2016 2014–2015
Opening balance .................................................................................................................................................................. 183,465,777 263,355,393
Receipts and other credits Contributions from personnel ........................................................................................................................................ 450,157,686 423,930,301 Contributions by the Government ................................................................................................................................. 756,955,116 795,171,662 Actuarial adjustment ...................................................................................................................................................... 170,000,000 170,000,000 Transfers from other pension funds ............................................................................................................................... 83,887,837 48,449,248 Other1 ............................................................................................................................................................................. 390,497 14,476
Total receipts and other credits ...................................................................................................................................... 1,461,391,136 1,437,565,687
Payments and other charges Benefit payments
Pensions and retiring allowances ............................................................................................................................. 442,037,547 375,524,290 Minimum benefits .................................................................................................................................................... 634,061 1,236,235
Pension division payments............................................................................................................................................. 23,871,536 28,887,588 Pension transfer value payments ................................................................................................................................... 133,358,475 152,155,635 Return of contributions .................................................................................................................................................. 902,196 927,893 Transfers to other pension funds .................................................................................................................................... 1,310,261 505,487 Administrative expenses ................................................................................................................................................ 24,572,429 18,292,463
Total payments and other charges ................................................................................................................................. 626,686,505 577,529,591
Receipts and other credits less payments and other charges ............................................................................................... 834,704,631 860,036,096
Transfers to PSPIB .............................................................................................................................................................. 849,312,367 939,925,712
Closing balance .................................................................................................................................................................... 168,858,041 183,465,777
1 Includes unclaimed cheques and returned annuity payments upon joining a Government pension plan.
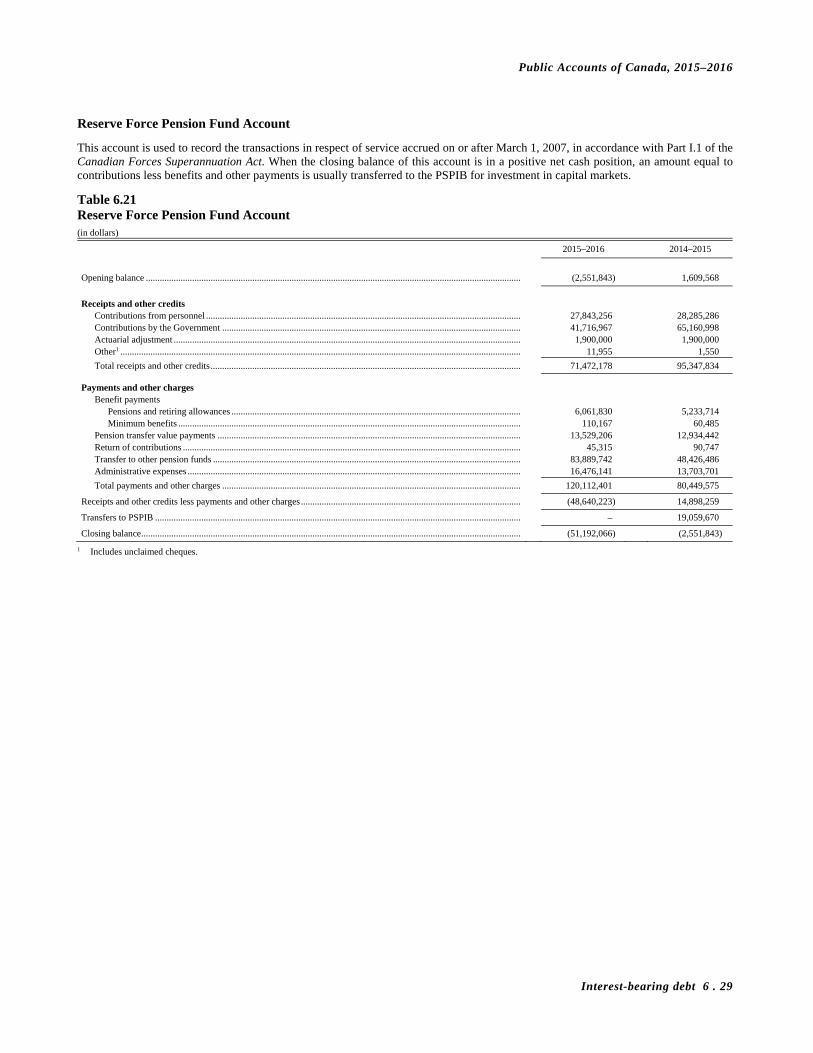
Public Accounts of Canada, 2015–2016
Interest-bearing debt 6 . 29
Reserve Force Pension Fund Account
This account is used to record the transactions in respect of service accrued on or after March 1, 2007, in accordance with Part I.1 of the Canadian Forces Superannuation Act. When the closing balance of this account is in a positive net cash position, an amount equal to contributions less benefits and other payments is usually transferred to the PSPIB for investment in capital markets.
Table 6.21 Reserve Force Pension Fund Account (in dollars)
2015–2016 2014–2015
Opening balance .................................................................................................................................................................. (2,551,843) 1,609,568
Receipts and other credits
Contributions from personnel ........................................................................................................................................ 27,843,256 28,285,286 Contributions by the Government ................................................................................................................................. 41,716,967 65,160,998 Actuarial adjustment ...................................................................................................................................................... 1,900,000 1,900,000 Other1 ............................................................................................................................................................................. 11,955 1,550
Total receipts and other credits ...................................................................................................................................... 71,472,178 95,347,834
Payments and other charges Benefit payments
Pensions and retiring allowances ............................................................................................................................. 6,061,830 5,233,714 Minimum benefits .................................................................................................................................................... 110,167 60,485
Pension transfer value payments ................................................................................................................................... 13,529,206 12,934,442 Return of contributions .................................................................................................................................................. 45,315 90,747 Transfer to other pension funds ..................................................................................................................................... 83,889,742 48,426,486 Administrative expenses ................................................................................................................................................ 16,476,141 13,703,701
Total payments and other charges ................................................................................................................................. 120,112,401 80,449,575
Receipts and other credits less payments and other charges ............................................................................................... (48,640,223) 14,898,259
Transfers to PSPIB .............................................................................................................................................................. – 19,059,670
Closing balance .................................................................................................................................................................... (51,192,066) (2,551,843)
1 Includes unclaimed cheques.
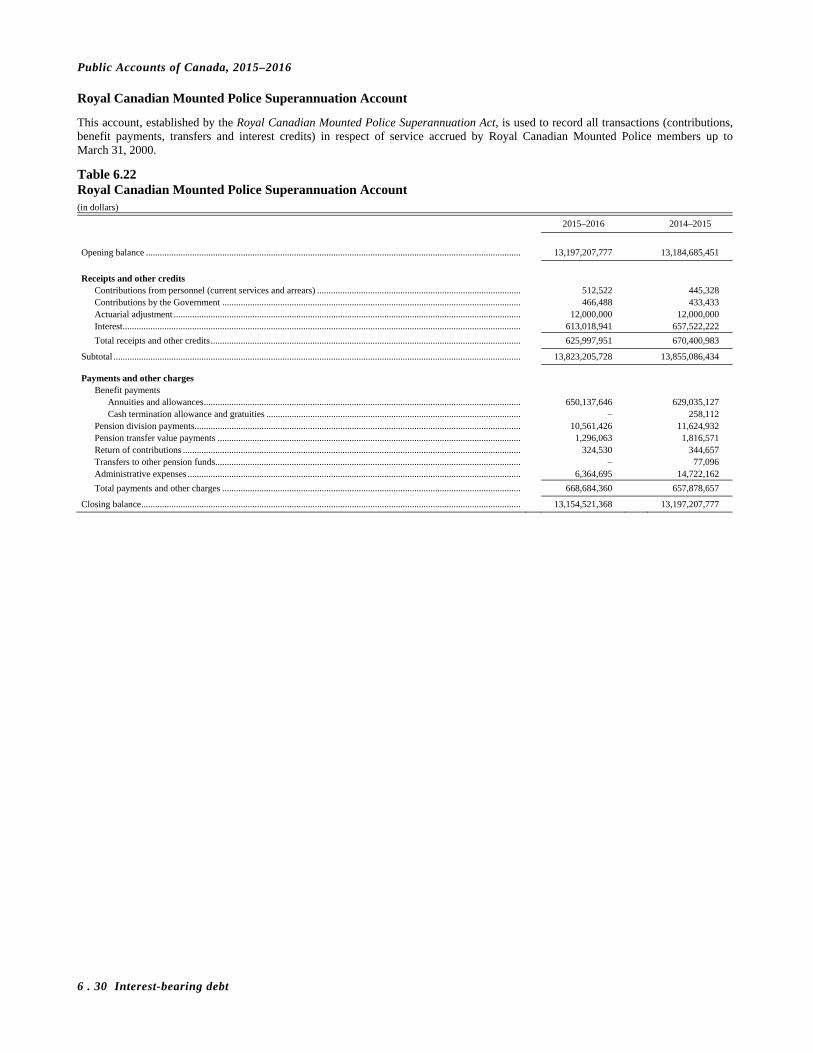
Public Accounts of Canada, 2015–2016
6 . 30 Interest-bearing debt
Royal Canadian Mounted Police Superannuation Account
This account, established by the Royal Canadian Mounted Police Superannuation Act, is used to record all transactions (contributions, benefit payments, transfers and interest credits) in respect of service accrued by Royal Canadian Mounted Police members up to March 31, 2000.
Table 6.22 Royal Canadian Mounted Police Superannuation Account (in dollars)
2015–2016 2014–2015
Opening balance .................................................................................................................................................................. 13,197,207,777 13,184,685,451
Receipts and other credits
Contributions from personnel (current services and arrears) ........................................................................................ 512,522 445,328 Contributions by the Government ................................................................................................................................. 466,488 433,433 Actuarial adjustment ...................................................................................................................................................... 12,000,000 12,000,000 Interest ............................................................................................................................................................................ 613,018,941 657,522,222
Total receipts and other credits ...................................................................................................................................... 625,997,951 670,400,983
Subtotal ................................................................................................................................................................................ 13,823,205,728 13,855,086,434
Payments and other charges Benefit payments
Annuities and allowances ......................................................................................................................................... 650,137,646 629,035,127 Cash termination allowance and gratuities .............................................................................................................. – 258,112
Pension division payments............................................................................................................................................. 10,561,426 11,624,932 Pension transfer value payments ................................................................................................................................... 1,296,063 1,816,571 Return of contributions .................................................................................................................................................. 324,530 344,657 Transfers to other pension funds .................................................................................................................................... – 77,096 Administrative expenses ................................................................................................................................................ 6,364,695 14,722,162
Total payments and other charges ................................................................................................................................. 668,684,360 657,878,657
Closing balance .................................................................................................................................................................... 13,154,521,368 13,197,207,777

Public Accounts of Canada, 2015–2016
Interest-bearing debt 6 . 31
Royal Canadian Mounted Police Pension Fund Account
This account is used to record the transactions in respect of service accrued on or after April 1, 2000, under the Royal Canadian Mounted Police Superannuation Act. An amount equal to contributions less benefits and other payments is transferred to the PSPIB for investment in capital markets. The closing balance in this account represents the net cash position prior to transfer to the PSPIB.
Table 6.23 Royal Canadian Mounted Police Pension Fund Account (in dollars)
2015–2016 2014–2015
Opening balance .................................................................................................................................................................. 6,467,393 10,962,617
Receipts and other credits
Contributions from personnel (current services and arrears) ........................................................................................ 187,351,388 169,627,163 Contributions by the Government ................................................................................................................................. 270,691,194 277,612,254 Actuarial adjustment ...................................................................................................................................................... 74,000,000 74,000,000 Transfers from other pension funds ............................................................................................................................... 8,723,354 11,864,616
Total receipts and other credits ...................................................................................................................................... 540,765,936 533,104,033
Payments and other charges Benefit payments
Annuities and allowances ......................................................................................................................................... 140,259,560 117,650,733 Minimum benefits .................................................................................................................................................... 133,539 212
Pension division payments............................................................................................................................................. 12,771,171 12,756,823 Pension transfer value payments ................................................................................................................................... 27,393,208 23,648,648 Return of contributions
Personnel .................................................................................................................................................................. 4,317 415,768 Interest ...................................................................................................................................................................... 355,247 1,500
Transfers to other pension funds .................................................................................................................................... 662,728 473,148 Administrative expenses ................................................................................................................................................ 3,835,137 8,209,554
Total payments and other charges ................................................................................................................................. 185,414,907 163,156,386
Receipts and other credits less payments and other charges ............................................................................................... 355,351,029 369,947,647
Transfers to PSPIB .............................................................................................................................................................. 346,478,737 374,442,871
Closing balance .................................................................................................................................................................... 15,339,685 6,467,393
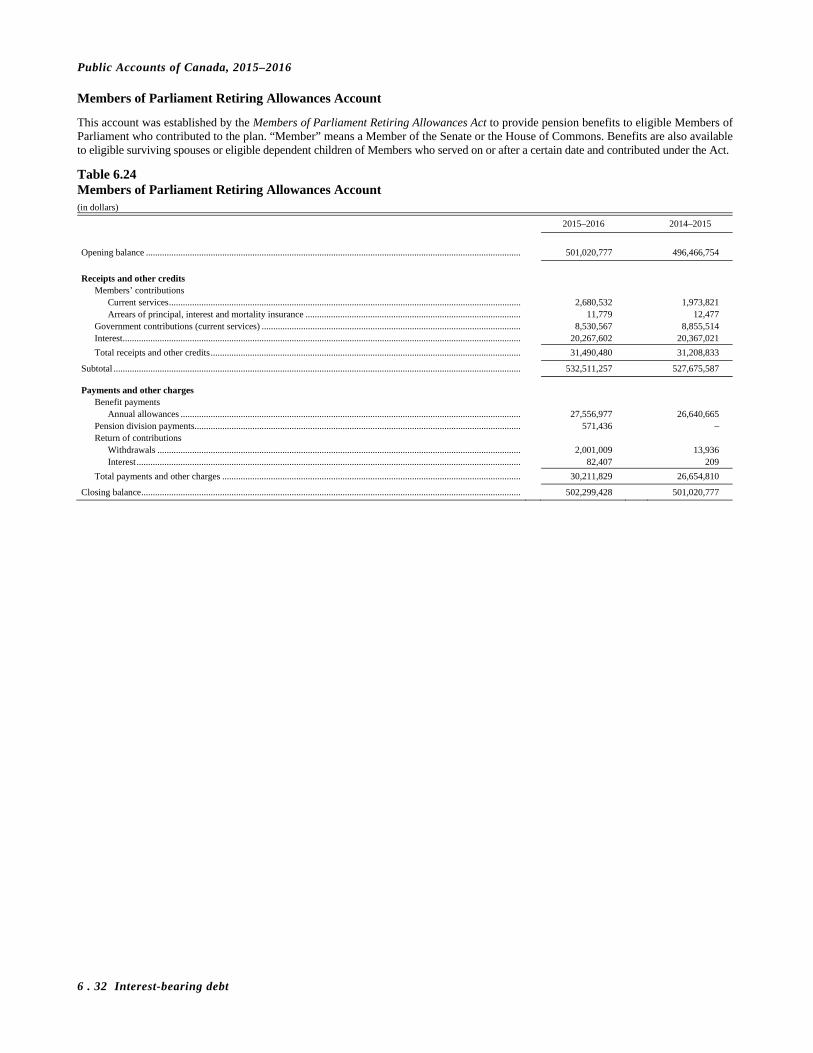
Public Accounts of Canada, 2015–2016
6 . 32 Interest-bearing debt
Members of Parliament Retiring Allowances Account
This account was established by the Members of Parliament Retiring Allowances Act to provide pension benefits to eligible Members of Parliament who contributed to the plan. “Member” means a Member of the Senate or the House of Commons. Benefits are also available to eligible surviving spouses or eligible dependent children of Members who served on or after a certain date and contributed under the Act.
Table 6.24 Members of Parliament Retiring Allowances Account (in dollars)
2015–2016 2014–2015
Opening balance .................................................................................................................................................................. 501,020,777 496,466,754
Receipts and other credits
Members’ contributions Current services ........................................................................................................................................................ 2,680,532 1,973,821 Arrears of principal, interest and mortality insurance ............................................................................................. 11,779 12,477
Government contributions (current services) ................................................................................................................ 8,530,567 8,855,514 Interest ............................................................................................................................................................................ 20,267,602 20,367,021
Total receipts and other credits ...................................................................................................................................... 31,490,480 31,208,833
Subtotal ................................................................................................................................................................................ 532,511,257 527,675,587
Payments and other charges Benefit payments
Annual allowances ................................................................................................................................................... 27,556,977 26,640,665 Pension division payments............................................................................................................................................. 571,436 – Return of contributions
Withdrawals ............................................................................................................................................................. 2,001,009 13,936 Interest ...................................................................................................................................................................... 82,407 209
Total payments and other charges ................................................................................................................................. 30,211,829 26,654,810
Closing balance .................................................................................................................................................................... 502,299,428 501,020,777
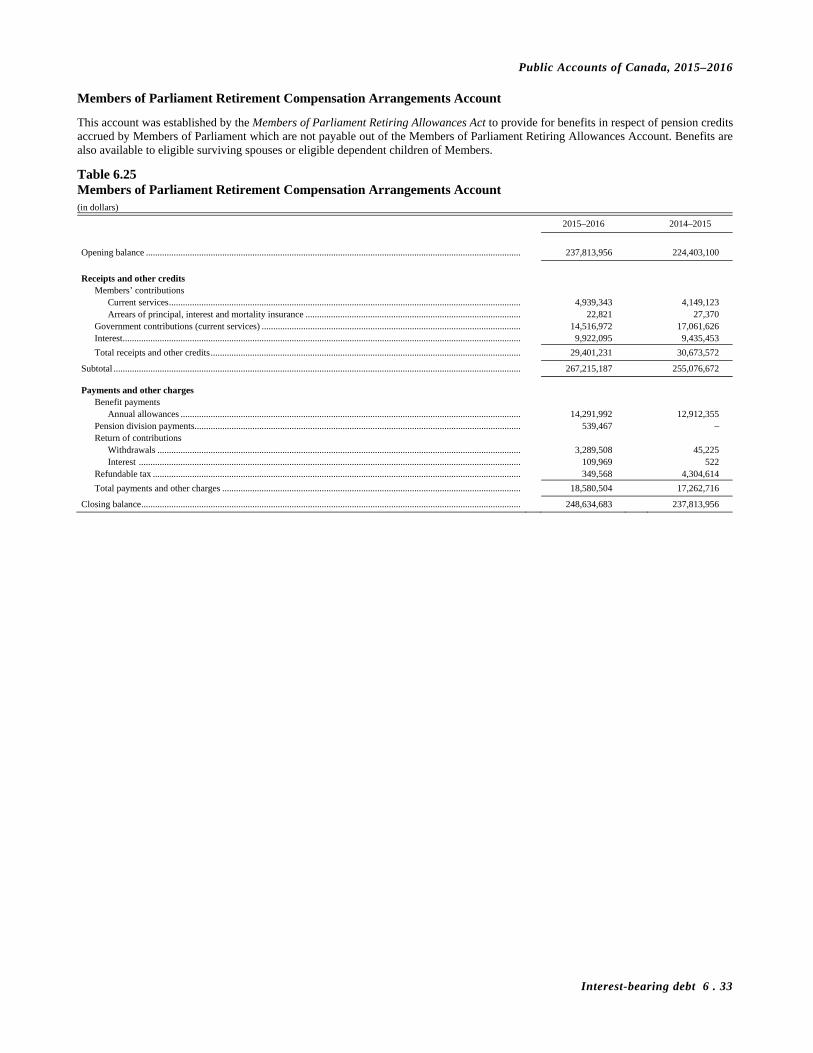
Public Accounts of Canada, 2015–2016
Interest-bearing debt 6 . 33
Members of Parliament Retirement Compensation Arrangements Account
This account was established by the Members of Parliament Retiring Allowances Act to provide for benefits in respect of pension credits accrued by Members of Parliament which are not payable out of the Members of Parliament Retiring Allowances Account. Benefits are also available to eligible surviving spouses or eligible dependent children of Members.
Table 6.25 Members of Parliament Retirement Compensation Arrangements Account (in dollars)
2015–2016 2014–2015
Opening balance .................................................................................................................................................................. 237,813,956 224,403,100
Receipts and other credits
Members’ contributions Current services ........................................................................................................................................................ 4,939,343 4,149,123 Arrears of principal, interest and mortality insurance ............................................................................................. 22,821 27,370
Government contributions (current services) ................................................................................................................ 14,516,972 17,061,626 Interest ............................................................................................................................................................................ 9,922,095 9,435,453
Total receipts and other credits ...................................................................................................................................... 29,401,231 30,673,572
Subtotal ................................................................................................................................................................................ 267,215,187 255,076,672
Payments and other charges Benefit payments
Annual allowances ................................................................................................................................................... 14,291,992 12,912,355 Pension division payments............................................................................................................................................. 539,467 – Return of contributions
Withdrawals ............................................................................................................................................................. 3,289,508 45,225 Interest ..................................................................................................................................................................... 109,969 522
Refundable tax ............................................................................................................................................................... 349,568 4,304,614
Total payments and other charges ................................................................................................................................. 18,580,504 17,262,716
Closing balance .................................................................................................................................................................... 248,634,683 237,813,956

Public Accounts of Canada, 2015–2016
6 . 34 Interest-bearing debt
Retirement Compensation Arrangements (RCA) Account
This account was established by the Special Retirement Arrangements Act to provide pension benefits for federal employees under retirement compensation arrangements.
The RCA Regulations, No. 1 (RCA No. 1) pays those pension benefits above the amount that may, in accordance with the Income Tax Act restrictions on registered pension plans, be paid under the Public Service Superannuation Act, the Canadian Forces Superannuation Act and the Royal Canadian Mounted Police Superannuation Act. The RCA No. 1 was created effective December 15, 1994.
The RCA Regulations, No. 2 (RCA No. 2) pays benefits to public service employees between the ages of 50 and 54, who were declared surplus as part of a three year Government downsizing initiative which ended on March 31, 1998. It pays the difference between an unreduced pension and the reduced pension for early retirement payable from the Public Service Superannuation Account. The RCA No. 2 was created effective April 1, 1995, and is funded entirely by the Government.
Table 6.26 Retirement Compensation Arrangements (RCA) Account (in dollars)
RCA No. 1 RCA No. 2
Royal Canadian Public Service Canadian Forces Mounted Police Public Service Total
2015–2016 2014–2015 2015–2016 2014–2015 2015–2016 2014–2015 2015–2016 2014–2015 2015–2016 2014–2015
Opening balance ...................... 1,104,326,126 1,040,164,699 373,530,812 351,185,693 33,159,245 32,475,115 708,848,795 729,836,159 2,219,864,978 2,153,661,666
Receipts and other credits Employee contributions
Government employees ............ 8,426,624 10,065,769 2,389,298 2,545,185 59,511 124,274 – – 10,875,433 12,735,228
Retired employees ...... 448,109 420,128 – – 592 1,885 – – 448,701 422,013 Public Service
corporation employees ............ 2,349,289 2,006,026 – – – – – – 2,349,289 2,006,026
Employer contributions Government ............... 60,783,610 75,678,400 26,464,154 28,844,798 290,768 628,765 – – 87,538,532 105,151,963 Public Service
corporations ......... 16,570,859 14,750,273 – – – – – – 16,570,859 14,750,273 Actuarial adjustment ......... 12,000,000 – – – – – 129,000,000 8,000,000 141,000,000 8,000,000 Transfers from other
pension funds ............. 1,560 696,131 – – – 905 – – 1,560 697,036 Refundable tax .................. – – – – – – 21,937,738 20,127,193 21,937,738 20,127,193 Interest .............................. 53,426,014 54,330,519 18,043,320 18,267,496 1,558,394 1,649,328 32,077,055 35,493,565 105,104,783 109,740,908 Other1 ................................ – – 1,691 – – – – – 1,691 –
154,006,065 157,947,246 46,898,463 49,657,479 1,909,265 2,405,157 183,014,793 63,620,758 385,828,586 273,630,640
1,258,332,191 1,198,111,945 420,429,275 400,843,172 35,068,510 34,880,272 891,863,588 793,456,917 2,605,693,564 2,427,292,306
Payments and other charges Benefit payments
Annuities .................... 35,959,883 30,744,211 6,151,861 5,314,519 1,018,178 907,151 84,806,709 84,608,122 127,936,631 121,574,003 Minimum benefits ...... 181,518 165,375 – 130,424 – – – – 181,518 295,799 Pension division
payments ............. 1,263,060 737,864 240,394 – 82,572 – – – 1,586,026 737,864 Pension transfer
value payments .......... 587,002 548,456 1,252,386 1,458,834 2,266 4,170 – – 1,841,654 2,011,460 Return of contributions
Government employees ............ 11,141 6,225 – – – 2,927 – – 11,141 9,152
Public Service corporation employees ............ 9,896 55,168 – – – – – – 9,896 55,168
Transfers to other pension funds ............. 174,463 267,634 967 – 1,847 3,445 – – 177,277 271,079
Refundable tax .................. 57,017,923 61,260,886 20,683,833 20,408,583 421,862 803,334 – – 78,123,618 82,472,803
95,204,886 93,785,819 28,329,441 27,312,360 1,526,725 1,721,027 84,806,709 84,608,122 209,867,761 207,427,328
Closing balance ....................... 1,163,127,305 1,104,326,126 392,099,834 373,530,812 33,541,785 33,159,245 807,056,879 708,848,795 2,395,825,803 2,219,864,978
1 Includes unclaimed cheques.

Public Accounts of Canada, 2015–2016
Interest-bearing debt 6 . 35
Supplementary Retirement Benefits Account
This account was established by the Supplementary Retirement Benefits Act to provide for pension benefit increases resulting from changes in the Consumer Price Index. The account continues to provide for increased pension benefits resulting from indexation for pensions of federally appointed judges, and recipients of pensions under various continuation acts and other related acts.
Table 6.27 Supplementary Retirement Benefits Account (in dollars)
Judges Others1 Total
2015–2016 2014–2015 2015–2016 2014–2015 2015–2016 2014–2015 Opening balance ............................... 206,383,198 196,642,456 688,982 651,476 207,072,180 197,293,932 Receipts and other credits
Employee contributions Government ........................... 3,576,318 3,393,911 49,217 31,265 3,625,535 3,425,176
Employer contributions Government ........................... 3,576,318 3,393,911 49,217 31,265 3,625,535 3,425,176
Interest ......................................... 1,553,166 2,952,920 5,595 10,509 1,558,761 2,963,429 Total receipts and other credits ... 8,705,802 9,740,742 104,029 73,039 8,809,831 9,813,781
Subtotal ............................................. 215,089,000 206,383,198 793,011 724,515 215,882,011 207,107,713
Payments and other charges Annuities ..................................... – – 25,819 35,533 25,819 35,533
Closing balance ................................. 215,089,000 206,383,198 767,192 688,982 215,856,192 207,072,180 1 Includes lieutenant governors and non-career diplomats.
Allowance for pension adjustments
This account records the accounting adjustments resulting from annual actuarial valuations of public sector pension plans sponsored by the Government.
Actuarial losses of $1,290 million ($1,076 million in 2015), due to plan experience and changes in actuarial assumptions, were recognized in this account and increased pension expenses for the year.
An amount of $1,420 million ($701 million in 2015) was recorded in this account to offset the amortization of deficiencies charged to the account during the year but already accounted for in previous year’s expenses or in actuarial gains and losses.
An amount of $191 million was credited ($82 million debited in 2015) to this account and increased (decreased in 2015) pension costs to adjust for the difference between the Government contributions and the net cost of benefits earned.
No amount ($51 million in 2015) was recorded in this account and pension costs were not adjusted (reduced in 2015) for a past servicecost reduction related to a curtailment.
An amount of $4,439 million ($4,240 million in 2015) was credited to this account to adjust for the difference between interest based on the accrued pension obligations and interest credited to the superannuation accounts. In addition, an amount of $4,317 million($4,244 million in 2015) was debited to this account to record the expected return on the pension investments.
As well, a consolidation adjustment of $56 million ($67 million in 2015) was credited to this account and debited against personal tax revenues to eliminate the effect of internal transactions resulting from tax amounts debited to the RCA accounts that were previously recorded as tax revenues.
The unrecognized net actuarial loss of $11,674 million ($11,164 million in 2015) will be recognized in this account and will affect expenses in future years.

Public Accounts of Canada, 2015–2016
6 . 36 Interest-bearing debt
As a result of annual actuarial valuations for accounting purposes, the accrued pension obligations of $276,119 million ($265,103 million in 2015) less the pension assets of $112,304 million ($101,357 million in 2015) were found to be $5,548 million ($4,799 million in 2015) higher than the balance of the pension fund accounts of $488 million ($590 million in 2015) and the superannuation accounts of $157,779 million ($158,357 million in 2015). The excess or shortfall is made up of the following:
(in millions of dollars)
Excess (shortfall)
2016 2015
Public Service Pension Plan Public Service Superannuation Account ........................................................................................................................................ (1,461) (123) Public Service Pension Fund .......................................................................................................................................................... 2,374 486 Retirement Compensation Arrangements ....................................................................................................................................... (1,691) (1,960)
Total allowance for Public Service Pension Plan ........................................................................................................................... (778) (1,597)
Canadian Forces Pension Plan Canadian Forces Superannuation Account ..................................................................................................................................... (716) 694 Canadian Forces Pension Fund ....................................................................................................................................................... (158) (648) Reserve Force Pension Fund........................................................................................................................................................... (78) (27) Retirement Compensation Arrangements ....................................................................................................................................... (314) (282)
Total allowance for Canadian Forces Pension Plan ....................................................................................................................... (1,266) (263)
Royal Canadian Mounted Police Pension Plan Royal Canadian Mounted Police Superannuation Account ........................................................................................................... (424) (38) Royal Canadian Mounted Police Pension Fund ............................................................................................................................. 95 11 Retirement Compensation Arrangements ....................................................................................................................................... (22) (16)
Total allowance for Canadian Mounted Police Pension Plan ........................................................................................................ (351) (43)
Members of Parliament Pension Plan Members of Parliament Retiring Allowances ................................................................................................................................ (5) 17 Retirement Compensation Arrangements ....................................................................................................................................... (259) (238)
Total allowance for Members of Parliament Pension Plan ............................................................................................................ (264) (221)
Pension plan for federally appointed judges ........................................................................................................................................ (2,889) (2,675)
Total ...................................................................................................................................................................................................... (5,548) (4,799)
REVISED SEPTEMBER 5, 2017

Public Accounts of Canada, 2015–2016
Interest-bearing debt 6 . 37
Other employee and veteran future benefits
The Government and the consolidated Crown corporations and other entities sponsor different types of future benefit plans with varying terms and conditions. The benefits are available to employees and former employees (including military or Royal Canadian Mounted Police members) during or after employment, or upon retirement. Some are considered retirement benefits, whereby benefits are expected to be provided after retirement to employees and their beneficiaries or dependants. Others are considered post-employment benefits, whereby benefits are expected to be paid after employment but before retirement. Benefits for veterans are paid to war veterans, as well as to Canadian Forces retired veterans and Canadian Forces still-serving members. Benefits for members of the Royal Canadian Mounted Police are paid to both current and former members. These are primarily post-employment benefits, but some benefits are also paid during employment to still-serving members. They include disability and associated benefits paid to veterans or Royal Canadian Mounted Police members, or to their beneficiaries and dependants.
The other major future benefits include health care and dental benefits available to retired employees and retired military and Royal Canadian Mounted Police members, accumulated sick leave entitlements and post-employment benefits such as workers’ compensation benefits and severance benefits that accumulate.
Table 6.28 presents the balance of these liabilities at year-end.
Table 6.28 Other employee and veteran future benefits (in millions of dollars)
Receipts and Payments and April 1, 2015 other credits other charges March 31, 2016
Veterans’ disability and other future benefits ................................................................................... 40,626 10,057 3,221 47,462
Royal Canadian Mounted Police disability and other future benefits ............................................... 4,781 1,050 181 5,650
Public Service Health Care Plan ........................................................................................................ 22,203 1,827 407 23,623
Pensioners’ Dental Services Plan ...................................................................................................... 3,175 357 90 3,442
Severance and other benefits ............................................................................................................. 2,341 328 384 2,285
Accumulated sick leave entitlements ................................................................................................ 1,560 311 254 1,617
Workers’ compensation ..................................................................................................................... 1,130 279 136 1,273
Consolidated Crown corporations and other entities ........................................................................ 324 28 23 329
Total ................................................................................................................................................... 76,140 14,237 4,696 85,681
All of the Government and almost all of the consolidated Crown corporations and other entities’ sponsored plans are unfunded. The health care and the dental plans are contributory plans. Contributions by retired plan members are made to the plans to obtain coverage. Therefore the liabilities and costs are shown net of members’ contributions. The accrued benefit obligations related to these plans is determined actuarially for accounting purposes. As at March 31, the recorded liabilities included the following components:
(in millions of dollars)
2016 2015
Accrued Other Unrecognized Benefits paid after Future Future benefit future benefit net actuarial measurement date benefit benefit obligations assets (loss) gain up to March 31 liabilities liabilities
Veterans’ disability and other future benefits ...................................... 69,217 – (21,755) – 47,462 40,626
Royal Canadian Mounted Police disability and other future benefits .. 10,360 – (4,710) – 5,650 4,781
Public Service Health Care Plan ........................................................... 29,690 – (6,067) – 23,623 22,203
Pensioners’ Dental Services Plan ......................................................... 4,749 – (1,307) – 3,442 3,175
Severance and other benefits ................................................................ 3,186 – (901) – 2,285 2,341
Accumulated sick leave entitlements ................................................... 1,732 – (115) – 1,617 1,560
Workers’ compensation ........................................................................ 1,424 – (151) – 1,273 1,130
Consolidated Crown corporations and other entities ........................... 332 (2) 1 (2) 329 324
Total ...................................................................................................... 120,690 (2) (35,005) (2) 85,681 76,140
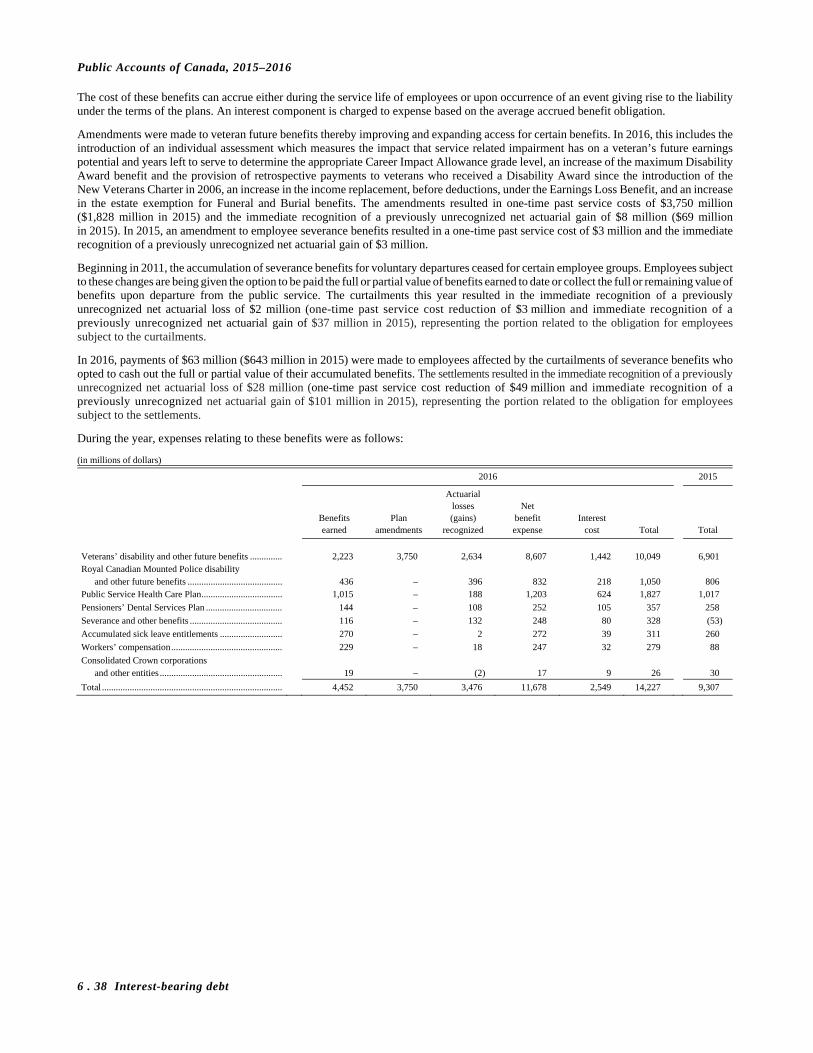
Public Accounts of Canada, 2015–2016
6 . 38 Interest-bearing debt
The cost of these benefits can accrue either during the service life of employees or upon occurrence of an event giving rise to the liability under the terms of the plans. An interest component is charged to expense based on the average accrued benefit obligation.
Amendments were made to veteran future benefits thereby improving and expanding access for certain benefits. In 2016, this includes the introduction of an individual assessment which measures the impact that service related impairment has on a veteran’s future earnings potential and years left to serve to determine the appropriate Career Impact Allowance grade level, an increase of the maximum Disability Award benefit and the provision of retrospective payments to veterans who received a Disability Award since the introduction of the New Veterans Charter in 2006, an increase in the income replacement, before deductions, under the Earnings Loss Benefit, and an increase in the estate exemption for Funeral and Burial benefits. The amendments resulted in one-time past service costs of $3,750 million ($1,828 million in 2015) and the immediate recognition of a previously unrecognized net actuarial gain of $8 million ($69 million in 2015). In 2015, an amendment to employee severance benefits resulted in a one-time past service cost of $3 million and the immediate recognition of a previously unrecognized net actuarial gain of $3 million.
Beginning in 2011, the accumulation of severance benefits for voluntary departures ceased for certain employee groups. Employees subject to these changes are being given the option to be paid the full or partial value of benefits earned to date or collect the full or remaining value of benefits upon departure from the public service. The curtailments this year resulted in the immediate recognition of a previously unrecognized net actuarial loss of $2 million (one-time past service cost reduction of $3 million and immediate recognition of a previously unrecognized net actuarial gain of $37 million in 2015), representing the portion related to the obligation for employees subject to the curtailments.
In 2016, payments of $63 million ($643 million in 2015) were made to employees affected by the curtailments of severance benefits who opted to cash out the full or partial value of their accumulated benefits. The settlements resulted in the immediate recognition of a previously unrecognized net actuarial loss of $28 million (one-time past service cost reduction of $49 million and immediate recognition of a previously unrecognized net actuarial gain of $101 million in 2015), representing the portion related to the obligation for employees subject to the settlements.
During the year, expenses relating to these benefits were as follows:
(in millions of dollars)
2016 2015
Actuarial losses Net Benefits Plan (gains) benefit Interest earned amendments recognized expense cost Total Total
Veterans’ disability and other future benefits .............. 2,223 3,750 2,634 8,607 1,442 10,049 6,901 Royal Canadian Mounted Police disability
and other future benefits ......................................... 436 – 396 832 218 1,050 806 Public Service Health Care Plan ................................... 1,015 – 188 1,203 624 1,827 1,017
Pensioners’ Dental Services Plan ................................. 144 – 108 252 105 357 258
Severance and other benefits ........................................ 116 – 132 248 80 328 (53)
Accumulated sick leave entitlements ........................... 270 – 2 272 39 311 260
Workers’ compensation ................................................ 229 – 18 247 32 279 88
Consolidated Crown corporations and other entities ..................................................... 19 – (2) 17 9 26 30
Total .............................................................................. 4,452 3,750 3,476 11,678 2,549 14,227 9,307
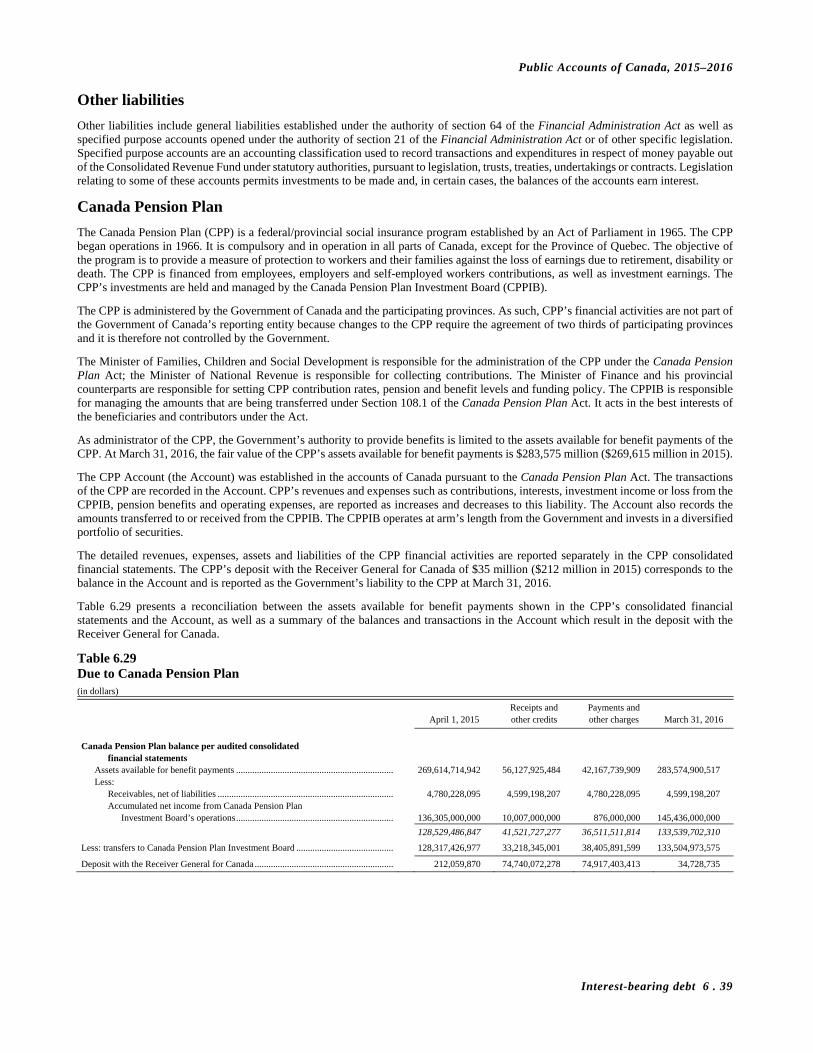
Public Accounts of Canada, 2015–2016
Interest-bearing debt 6 . 39
Other liabilities
Other liabilities include general liabilities established under the authority of section 64 of the Financial Administration Act as well as specified purpose accounts opened under the authority of section 21 of the Financial Administration Act or of other specific legislation. Specified purpose accounts are an accounting classification used to record transactions and expenditures in respect of money payable out of the Consolidated Revenue Fund under statutory authorities, pursuant to legislation, trusts, treaties, undertakings or contracts. Legislation relating to some of these accounts permits investments to be made and, in certain cases, the balances of the accounts earn interest.
Canada Pension Plan
The Canada Pension Plan (CPP) is a federal/provincial social insurance program established by an Act of Parliament in 1965. The CPP began operations in 1966. It is compulsory and in operation in all parts of Canada, except for the Province of Quebec. The objective of the program is to provide a measure of protection to workers and their families against the loss of earnings due to retirement, disability or death. The CPP is financed from employees, employers and self-employed workers contributions, as well as investment earnings. The CPP’s investments are held and managed by the Canada Pension Plan Investment Board (CPPIB).
The CPP is administered by the Government of Canada and the participating provinces. As such, CPP’s financial activities are not part of the Government of Canada’s reporting entity because changes to the CPP require the agreement of two thirds of participating provinces and it is therefore not controlled by the Government.
The Minister of Families, Children and Social Development is responsible for the administration of the CPP under the Canada Pension Plan Act; the Minister of National Revenue is responsible for collecting contributions. The Minister of Finance and his provincial counterparts are responsible for setting CPP contribution rates, pension and benefit levels and funding policy. The CPPIB is responsible for managing the amounts that are being transferred under Section 108.1 of the Canada Pension Plan Act. It acts in the best interests of the beneficiaries and contributors under the Act.
As administrator of the CPP, the Government’s authority to provide benefits is limited to the assets available for benefit payments of the CPP. At March 31, 2016, the fair value of the CPP’s assets available for benefit payments is $283,575 million ($269,615 million in 2015).
The CPP Account (the Account) was established in the accounts of Canada pursuant to the Canada Pension Plan Act. The transactions of the CPP are recorded in the Account. CPP’s revenues and expenses such as contributions, interests, investment income or loss from the CPPIB, pension benefits and operating expenses, are reported as increases and decreases to this liability. The Account also records the amounts transferred to or received from the CPPIB. The CPPIB operates at arm’s length from the Government and invests in a diversified portfolio of securities.
The detailed revenues, expenses, assets and liabilities of the CPP financial activities are reported separately in the CPP consolidated financial statements. The CPP’s deposit with the Receiver General for Canada of $35 million ($212 million in 2015) corresponds to the balance in the Account and is reported as the Government’s liability to the CPP at March 31, 2016.
Table 6.29 presents a reconciliation between the assets available for benefit payments shown in the CPP’s consolidated financial statements and the Account, as well as a summary of the balances and transactions in the Account which result in the deposit with the Receiver General for Canada.
Table 6.29 Due to Canada Pension Plan (in dollars)
Receipts and Payments and April 1, 2015 other credits other charges March 31, 2016
Canada Pension Plan balance per audited consolidated
financial statements Assets available for benefit payments .................................................................... 269,614,714,942 56,127,925,484 42,167,739,909 283,574,900,517 Less:
Receivables, net of liabilities ............................................................................ 4,780,228,095 4,599,198,207 4,780,228,095 4,599,198,207 Accumulated net income from Canada Pension Plan
Investment Board’s operations .................................................................... 136,305,000,000 10,007,000,000 876,000,000 145,436,000,000
128,529,486,847 41,521,727,277 36,511,511,814 133,539,702,310
Less: transfers to Canada Pension Plan Investment Board .......................................... 128,317,426,977 33,218,345,001 38,405,891,599 133,504,973,575
Deposit with the Receiver General for Canada ............................................................ 212,059,870 74,740,072,278 74,917,403,413 34,728,735
Public Accounts of Canada, 2015–2016
6 . 40 Interest-bearing debt
Receipts and other credits include:
(a) contributions at the combined employer and employee rates of 9.9 per cent of pensionable earnings for the 2015 and 2016 calendar years, subject to maximum combined contributions of $4,960 and $5,089 respectively and contributions to the post-retirement benefit pension according to provisions of Bill C-51 of 2009;
(b) income from the average daily operating balance deposited with the Receiver General for Canada;
(c) gains on investments held by the CPPIB; and
(d) payments received on overpayments established.
Payments and other charges include:
(a) pensions and benefits paid under the CPP as retirement and post-retirement benefit pensions, survivors’ benefits paid to spouse or common-law partner and orphans, or as lump sum death benefits, and disability benefits to eligible contributors and their children;
(b) pensions and benefits paid and recovered from the CPP, in accordance with an agreement with a province providing a comprehensive pension plan;
(c) payments that are required to be charged to the CPP, in accordance with reciprocal agreements with other countries;
(d) costs of administration of the CPP;
(e) funds transferred to the CPPIB; and
(f) losses on investments held by the CPPIB.
For additional information, the consolidated financial statements of the CPP are included with the Supplementary Statements at the end of this section. Additional information on the funding of CPP may also be obtained from the 26th Actuarial Report on the Canada Pension Plan prepared by the Chief Actuary of the Office of the Superintendent of Financial Institutions.
Government Annuities Account
This account was established by the Government Annuities Act, and modified by the Government Annuities Improvement Act, which discontinued sales of annuities in 1975. The account is valued on an actuarial basis each year, with the deficit or surplus charged or credited to the Consolidated Revenue Fund.
The purpose of the Government Annuities Act was to assist Canadians to provide for their later years, by the purchase of Government annuities. The Government Annuities Improvement Act increased the rate of return and flexibility of Government annuity contracts.
Receipts and other credits consist of premiums received, funds reclaimed from the Consolidated Revenue Fund for previously untraceable annuitants, earned interest of 7 per cent calculated on the actuarial present value of accrued benefits and any credit needed to cover the actuarial deficit. Payments and other charges represent matured annuities, the commuted value of death benefits, premium refunds and withdrawals, and actuarial surpluses and unclaimed annuities transferred to non-tax revenues. The amounts of unclaimed annuities, related to untraceable annuitants, are transferred to non-tax revenues.
As of March 31, 2016, over 31,343 annuitants held 33,357 active contracts, each annuitant receiving an average payment of $666.24. During the year, 57 deferred annuities came into payment and another 23 deferred contracts were adjusted or terminated at or before maturity, due to death, small refunds or unclaimed funds. Therefore, as of March 31, 2016, there were 316 outstanding deferred annuities, the last of which will come into payment around the year 2030.
During the 2015–2016 fiscal year, 3,325 annuities were terminated or adjusted as a result of annuitant deaths: 2,184 group certificates and 1,141 individual contracts. The average age at death for males was 88.1 while the female age at death averaged 91.3.
The opening balance of $141.4 million was reduced due to charges exceeding income by $14.9 million during 2015–2016. Since the actuarial reserves required as of March 31, 2016 were $126.5 million, an excess amount of $1,830,626 was transferred to the Government’s revenues.
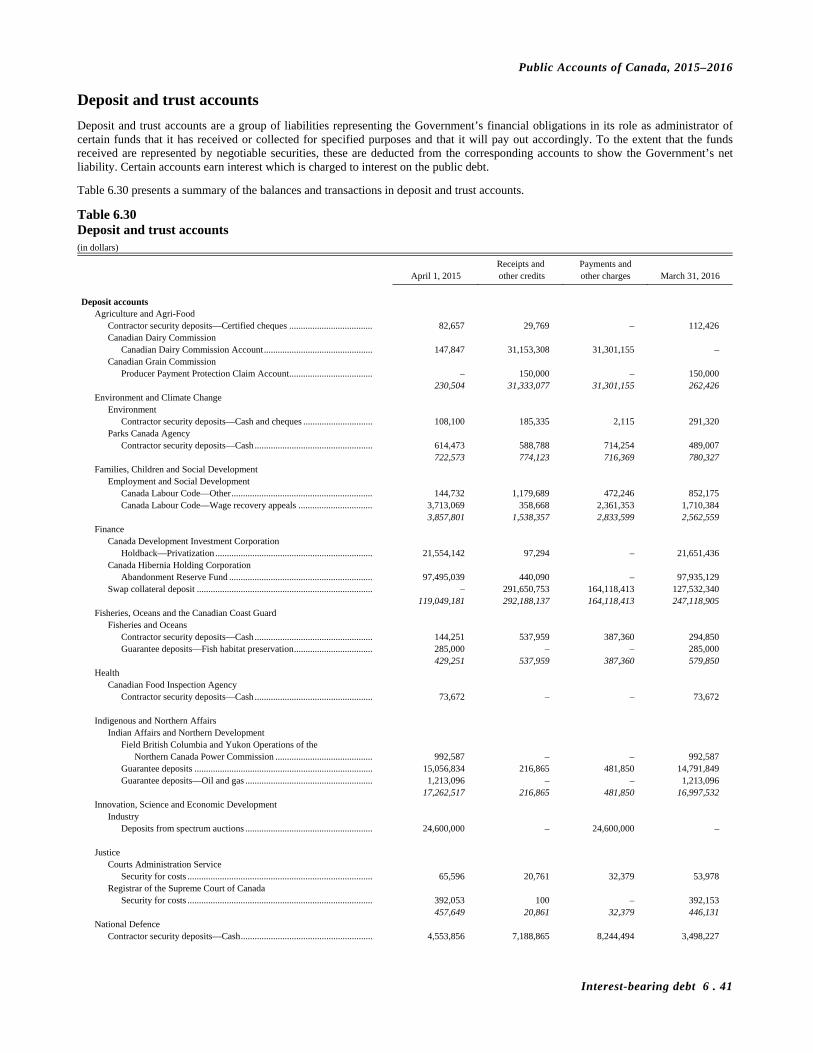
Public Accounts of Canada, 2015–2016
Interest-bearing debt 6 . 41
Deposit and trust accounts
Deposit and trust accounts are a group of liabilities representing the Government’s financial obligations in its role as administrator of certain funds that it has received or collected for specified purposes and that it will pay out accordingly. To the extent that the funds received are represented by negotiable securities, these are deducted from the corresponding accounts to show the Government’s net liability. Certain accounts earn interest which is charged to interest on the public debt.
Table 6.30 presents a summary of the balances and transactions in deposit and trust accounts.
Table 6.30 Deposit and trust accounts (in dollars)
Receipts and Payments and April 1, 2015 other credits other charges March 31, 2016
Deposit accounts
Agriculture and Agri-Food Contractor security deposits—Certified cheques .................................... 82,657 29,769 – 112,426 Canadian Dairy Commission
Canadian Dairy Commission Account ............................................... 147,847 31,153,308 31,301,155 – Canadian Grain Commission
Producer Payment Protection Claim Account .................................... – 150,000 – 150,000 230,504 31,333,077 31,301,155 262,426 Environment and Climate Change
Environment Contractor security deposits—Cash and cheques .............................. 108,100 185,335 2,115 291,320
Parks Canada Agency Contractor security deposits—Cash ................................................... 614,473 588,788 714,254 489,007
722,573 774,123 716,369 780,327 Families, Children and Social Development
Employment and Social Development Canada Labour Code—Other ............................................................. 144,732 1,179,689 472,246 852,175 Canada Labour Code—Wage recovery appeals ................................ 3,713,069 358,668 2,361,353 1,710,384
3,857,801 1,538,357 2,833,599 2,562,559 Finance
Canada Development Investment Corporation Holdback—Privatization .................................................................... 21,554,142 97,294 – 21,651,436
Canada Hibernia Holding Corporation Abandonment Reserve Fund .............................................................. 97,495,039 440,090 – 97,935,129
Swap collateral deposit ............................................................................ – 291,650,753 164,118,413 127,532,340 119,049,181 292,188,137 164,118,413 247,118,905 Fisheries, Oceans and the Canadian Coast Guard
Fisheries and Oceans Contractor security deposits—Cash ................................................... 144,251 537,959 387,360 294,850 Guarantee deposits—Fish habitat preservation .................................. 285,000 – – 285,000
429,251 537,959 387,360 579,850 Health
Canadian Food Inspection Agency Contractor security deposits—Cash ................................................... 73,672 – – 73,672
Indigenous and Northern Affairs
Indian Affairs and Northern Development Field British Columbia and Yukon Operations of the
Northern Canada Power Commission .......................................... 992,587 – – 992,587 Guarantee deposits ............................................................................. 15,056,834 216,865 481,850 14,791,849 Guarantee deposits—Oil and gas ....................................................... 1,213,096 – – 1,213,096
17,262,517 216,865 481,850 16,997,532 Innovation, Science and Economic Development
Industry Deposits from spectrum auctions ....................................................... 24,600,000 – 24,600,000 –
Justice
Courts Administration Service Security for costs ................................................................................ 65,596 20,761 32,379 53,978
Registrar of the Supreme Court of Canada Security for costs ................................................................................ 392,053 100 – 392,153
457,649 20,861 32,379 446,131 National Defence
Contractor security deposits—Cash ......................................................... 4,553,856 7,188,865 8,244,494 3,498,227

Public Accounts of Canada, 2015–2016
6 . 42 Interest-bearing debt
Table 6.30 Deposit and trust accounts—continued (in dollars)
Receipts and Payments and April 1, 2015 other credits other charges March 31, 2016
National Revenue
Canada Revenue Agency Guarantee deposits ............................................................................. 178,548,394 40,981,321 29,510,455 190,019,260
Less: securities held in trust ......................................................... 40,000 – – 40,000 178,508,394 40,981,321 29,510,455 189,979,260 Natural Resources
Contractor security deposits—Cash ......................................................... 43,454 47,612 52,174 38,892 Guarantee deposits—Oil and gas ............................................................. 8,383,603 5,276,780 5,728,790 7,931,593
8,427,057 5,324,392 5,780,964 7,970,485 Privy Council
Privy Council Office Office of the Chief Electoral Officer
Candidates’ and committees’ deposits—Election and referendum ... 99,000 1,800,000 1,149,000 750,000 Public Safety and Emergency Preparedness
Canada Border Services Agency General security deposits.................................................................... 6,218,715 521,987 121,986 6,618,716 Guarantee deposits ............................................................................. 9,495,816 4,357,764 2,173,486 11,680,094 Immigration Guarantee Fund ............................................................. 21,092,081 7,046,509 6,761,050 21,377,540 Temporary deposits received from importers .................................... 1,123,571 385,955 432,943 1,076,583
37,930,183 12,312,215 9,489,465 40,752,933 Royal Canadian Mounted Police
Contractor security deposits—Cash ................................................... 363,513 – 269,218 94,295 38,293,696 12,312,215 9,758,683 40,847,228 Public Services and Procurement
Public Works and Government Services Contractor security deposits—Bonds ................................................. 750,000 – 750,000 – Contractor security deposits—Cash ................................................... 4,423,017 8,560,801 4,550,236 8,433,582 Deposits on disposals ......................................................................... 181,307 12,888,988 11,912,931 1,157,364 Seized property—Cash ....................................................................... 54,672,368 20,795,923 24,221,869 51,246,422
60,026,692 42,245,712 41,435,036 60,837,368 Transport
Contractor security deposits—Cash ......................................................... 332,798 65,308 101,253 296,853
Total deposit accounts ......................................................................................... 456,924,641 436,527,192 320,451,010 573,000,823
Trust accounts
Families, Children and Social Development Employment and Social Development
Indian Residential Schools Settlement Agreement Common experience payments ..................................................... 301,978,300 896,252 220,723,839 82,150,713
Indigenous and Northern Affairs
Indian Affairs and Northern Development Indian band funds
Capital accounts, Table 6.31 ........................................................ 648,634,230 338,395,885 458,374,456 528,655,659 Revenue accounts, Table 6.32 ...................................................... 186,063,434 65,467,535 69,892,303 181,638,666
834,697,664 403,863,420 528,266,759 710,294,325 Indian estate accounts ......................................................................... 24,897,727 6,433,695 5,515,889 25,815,533 Indian savings accounts ...................................................................... 32,658,629 1,761,036 3,720,440 30,699,225
892,254,020 412,058,151 537,503,088 766,809,083 Innovation, Science and Economic Development
Industry Restitutions under the Competition Act .............................................. 3,834 459 – 4,293
National Defence
Estates—Armed services ......................................................................... 1,239,520 1,164,979 1,630,230 774,269 Public Safety and Emergency Preparedness
Canadian Security Intelligence Service Scholastic awards ............................................................................... 26,302 119 – 26,421
Correctional Service of Canada Inmates’ Trust Fund ........................................................................... 18,250,310 43,386,878 43,401,210 18,235,978
Royal Canadian Mounted Police Benefit Trust Fund .............................................................................. 2,080,734 206,608 128,174 2,159,168
20,357,346 43,593,605 43,529,384 20,421,567

Public Accounts of Canada, 2015–2016
Interest-bearing debt 6 . 43
Table 6.30 Deposit and trust accounts—concluded (in dollars)
Receipts and Payments and April 1, 2015 other credits other charges March 31, 2016
Veterans Affairs
Administered accounts ............................................................................. 176,815 35,751 33,234 179,332 Estates Fund ............................................................................................. 248,137 15,693 – 263,830 Veterans Administration and Welfare Trust Fund ................................... 1,342,398 37,840 312,851 1,067,387
1,767,350 89,284 346,085 1,510,549
Total trust accounts .............................................................................................. 1,217,600,370 457,802,730 803,732,626 871,670,474
Total deposit and trust accounts .......................................................................... 1,674,525,011 894,329,922 1,124,183,636 1,444,671,297
Contractor security deposits—Certified cheques—Agriculture and Agri-Food
This account was established to record contractor security deposits that are required for the satisfactory performance of work in accordance with Government Contracts Regulations.
Canadian Dairy Commission Account
The Canadian Dairy Commission is a Crown corporation listed in Part I of Schedule III of the Financial Administration Act. This account was established for banking purposes using the Consolidated Revenue Fund pursuant to section 15 of the Canadian Dairy Commission Act.
Producer Payment Protection Claim Account
This account was established to coordinate receipt of security (bond, letter of credit, insurance) funds and disbursement to eligible producer claims as determined by the Canadian Grain Commission’s Producer Protection Program under sections 45 and 49 the Canada Grain Act and the Canada Grain Regulations. These funds are held in trust for eligible producers until disbursed.
Contractor security deposits—Cash and cheques—Environment
This account was established for the management of deposits of money belonging to third parties.
Contractor security deposits—Cash—Parks Canada Agency
This account was established to record contractor security deposits that are required for the satisfactory performance of work in accordance with Government Contracts Regulations.
Securities held in trust by the Canada Revenue Agency are made up of cash deposited to the Consolidated Revenue Fund.
Canada Labour Code—Other
This account was established to record amounts received under the provisions of section 251 of the Canada Labour Code Part III. The receipts are wage payments ordered by a Labour inspector in settlement of a wages dispute, which the employer has chosen to pay to the Minister of Employment, Workforce Development and Labour instead of paying them directly to the employee. These amounts are then paid out to the employees.
Canada Labour Code—Wage recovery appeals
This account was established to record amounts received under the provisions of section 251.1 of the Canada Labour Code Part III. This requires federally-regulated employers who wish to appeal a payment order made by a Labour inspector regarding wages due to employees, to forward the amounts due to the Minister of Employment, Workforce Development and Labour for deposit. They are held until the appeal is completed and the adjudicator has directed payment of the disputed amount to the employee or return to the employer. Deposits in this account are interest-bearing at the rate set by the Minister of Finance for contractor’s deposits.
Holdback—Privatization—Canada Development Investment Corporation
This account was established pursuant to subsection 129(1) of the Financial Administration Act. This special purpose money is to be used to meet costs incurred on the sale of Crown corporations and demand for payment by purchasers pursuant to the acquisition agreement and costs incurred by the Canada Development Investment Corporation in connection with their sale.
Abandonment Reserve Fund—Canada Hibernia Holding Corporation
This account was established to record funds which will be used to defray the future abandonment costs that will occur at the closure of the Hibernia field.

Public Accounts of Canada, 2015–2016
6 . 44 Interest-bearing debt
Swap collateral deposit
This account was established to record cash received as credit support under a collateral agreement with financial institutions.
An amount of $98 million US is held in this account at year end.
Contractor security deposits—Cash—Fisheries and Oceans
This account was established to record contractor security deposits that are required for the satisfactory performance of work in accordance with Government Contracts Regulations.
Guarantee deposits—Fish habitat preservation
This account was established to record cash and securities deposited as guarantees for preservation of fish habitat as required by permits, leases or authorizations, pursuant to Section 35 of the Fisheries Act. Interest is not allowed on cash deposits.
Contractor security deposits—Cash—Canadian Food Inspection Agency
This account was established to record contractor security deposits that are required for the satisfactory performance of work in accordance with Government Contracts Regulations.
Field British Columbia and Yukon Operations of the Northern Canada Power Commission
This account was established to record amounts deposited by the Northern Canada Power Commission to reimburse liabilities pertaining to Field, British Columbia and Yukon Operations of the Northern Canada Power Commission.
Guarantee deposits—Indian Affairs and Northern Development
This account was established to record cash and securities deposited as guarantees for performance as required by permits, leases, authorizations and water licences, pursuant to section 8 of the Arctic Waters Pollution Prevention Act and of the Northwest Territories Waters Act and various regulations under the Territorial Lands Act and the Mackenzie Valley Resource Management Act. Interest is not allowed on cash deposits.
Guarantee deposits—Oil and gas—Indian Affairs and Northern Development
This account was established to record securities in the form of cash, letters of credit or other acceptable instruments which are required to be issued to, and held by the Government of Canada pursuant to an interest issued in accordance with the Canada Petroleum Resources Act. These securities are a performance guarantee or refundable rental that the agreed exploration work will be performed in the manner and time frame specified. Interest is not paid on these deposits.
Deposits from spectrum auctions
This account was established to record amounts deposited by external parties to be eligible to participate in an auction of spectrum licences.
During the year, the account was closed.
Security for costs—Courts Administration Service
This account was established to maintain accounts on behalf of litigants before the Tax Court of Canada. These accounts record the funds paid into the Tax Court of Canada, pursuant to an order of the Court, rules of the Court or statutes, to be held pending payment of such funds, in accordance with an order/judgment of the Court.
Security for costs—Registrar of the Supreme Court of Canada
This account was established to record security to the value of $500 deposited by an Appellant with the Registrar of the Supreme Court of Canada in accordance with paragraph 60(1)(b) of the Supreme Court Act. As per section 87 of the Rules of the Supreme Court of Canada, interest is paid on money deposited as security.
Contractor security deposits—Cash—National Defence
This account was established to record contractor security deposits that are required for the satisfactory performance of work in accordance with Government Contracts Regulations.
Guarantee deposits—Canada Revenue Agency
This account was established to record cash securities required to guarantee payment of goods and services tax / harmonized sales tax (GST/HST) as it relates to non-resident registrants and, certain licensees as it relates to excise taxes, which are both payable pursuant to the Excise Tax Act.
Public Accounts of Canada, 2015–2016
Interest-bearing debt 6 . 45
Contractor security deposits—Cash—Natural Resources
This account was established to record contractor security deposits that are required for the satisfactory performance of work in accordance with Government Contracts Regulations.
Guarantee deposits—Oil and gas—Natural Resources
This account was established to record securities in the form of cash, which are required to be issued to, and held by the Government of Canada pursuant to an Exploration Licence in accordance with section 24 of the Canada Petroleum Resources Act. These securities are a performance guarantee that the agreed exploration will be performed in the manner and time frame specified. Interest is not paid on these deposits.
Candidates’ and committees’ deposits—Election and referendum
This account was established to record candidates’ election and committees’ referendum deposits received in respect of an election (general or by-election) or a referendum.
Pursuant to the Canada Elections Act or the Referendum Act, amounts received are either refunded to candidates or committees, or are transferred to non-tax revenues.
General security deposits
This account was established to record general security deposits from transportation companies in accordance with section 148 of the Immigration and Refugee Protection Act.
Guarantee deposits—Canada Border Services Agency
This account was established to record cash required to guarantee payment of customs duties on imported goods pursuant to the Customs Act.
Immigration Guarantee Fund
This account was established to record amounts collected and held pending final disposition, either by refund to the original depositor, or forfeiture to the Crown pursuant to sections 14, 26, 44, 56, 58 and 148 of the Immigration and Refugee Protection Act.
Temporary deposits received from importers
This account was established to record temporary security deposits received from importers to ensure compliance with various (Customs) regulations regarding temporary entry of goods.
Contractor security deposits—Cash—Royal Canadian Mounted Police
This account was established to record contractor security deposits that are required for the satisfactory performance of work in accordance with Government Contracts Regulations.
Contractor security deposits—Bonds—Public Works and Government Services
This account was established to record contractor security deposits that are required for the satisfactory performance of work in accordance with Government Contracts Regulations.
Contractor security deposits—Cash—Public Works and Government Services
This account was established to record contractor security deposits that are required for the satisfactory performance of work in accordance with Government Contracts Regulations.
Deposits on disposals
This account was established to report transactions associated to deposits on disposals for Public Works and Government Services Canada (PWGSC), security deposits and revenues of leased space belonging to PWGSC.
Seized property—Cash
This account was established pursuant to the Seized Property Management Act, to record seized cash. These funds will be deposited to the Consolidated Revenue Fund and credited to the account until returned to the owner or forfeited.
Contractor security deposits—Cash—Transport
This account was established to record contractor security deposits that are required for the satisfactory performance of work in accordance with Government Contracts Regulations.
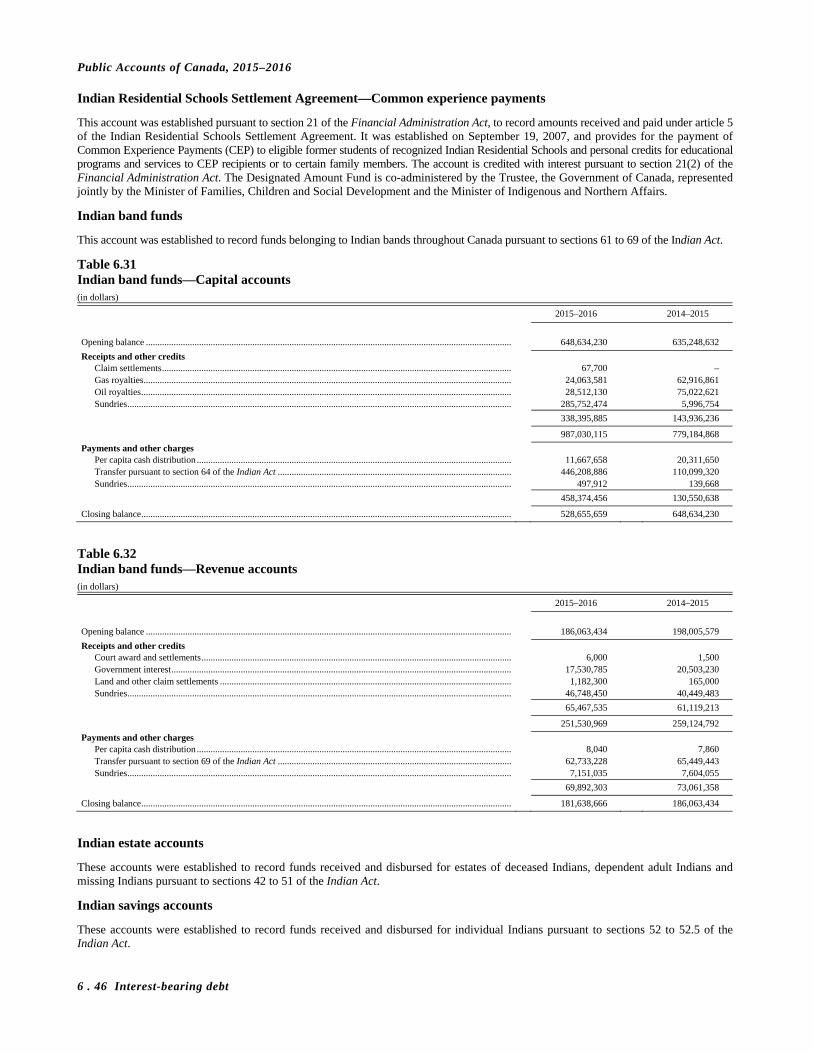
Public Accounts of Canada, 2015–2016
6 . 46 Interest-bearing debt
Indian Residential Schools Settlement Agreement—Common experience payments
This account was established pursuant to section 21 of the Financial Administration Act, to record amounts received and paid under article 5 of the Indian Residential Schools Settlement Agreement. It was established on September 19, 2007, and provides for the payment of Common Experience Payments (CEP) to eligible former students of recognized Indian Residential Schools and personal credits for educational programs and services to CEP recipients or to certain family members. The account is credited with interest pursuant to section 21(2) of the Financial Administration Act. The Designated Amount Fund is co-administered by the Trustee, the Government of Canada, represented jointly by the Minister of Families, Children and Social Development and the Minister of Indigenous and Northern Affairs.
Indian band funds
This account was established to record funds belonging to Indian bands throughout Canada pursuant to sections 61 to 69 of the Indian Act.
Table 6.31 Indian band funds—Capital accounts (in dollars)
2015–2016 2014–2015
Opening balance .............................................................................................................................................................. 648,634,230 635,248,632
Receipts and other credits Claim settlements ....................................................................................................................................................... 67,700 – Gas royalties ............................................................................................................................................................... 24,063,581 62,916,861 Oil royalties ................................................................................................................................................................ 28,512,130 75,022,621 Sundries ...................................................................................................................................................................... 285,752,474 5,996,754
338,395,885 143,936,236
987,030,115 779,184,868
Payments and other charges Per capita cash distribution ........................................................................................................................................ 11,667,658 20,311,650 Transfer pursuant to section 64 of the Indian Act ..................................................................................................... 446,208,886 110,099,320 Sundries ...................................................................................................................................................................... 497,912 139,668
458,374,456 130,550,638
Closing balance ................................................................................................................................................................ 528,655,659 648,634,230
Table 6.32 Indian band funds—Revenue accounts (in dollars)
2015–2016 2014–2015
Opening balance .............................................................................................................................................................. 186,063,434 198,005,579
Receipts and other credits Court award and settlements ...................................................................................................................................... 6,000 1,500 Government interest ................................................................................................................................................... 17,530,785 20,503,230 Land and other claim settlements .............................................................................................................................. 1,182,300 165,000 Sundries ...................................................................................................................................................................... 46,748,450 40,449,483
65,467,535 61,119,213
251,530,969 259,124,792
Payments and other charges Per capita cash distribution ........................................................................................................................................ 8,040 7,860 Transfer pursuant to section 69 of the Indian Act ..................................................................................................... 62,733,228 65,449,443 Sundries ...................................................................................................................................................................... 7,151,035 7,604,055
69,892,303 73,061,358
Closing balance ................................................................................................................................................................ 181,638,666 186,063,434
Indian estate accounts
These accounts were established to record funds received and disbursed for estates of deceased Indians, dependent adult Indians and missing Indians pursuant to sections 42 to 51 of the Indian Act.
Indian savings accounts
These accounts were established to record funds received and disbursed for individual Indians pursuant to sections 52 to 52.5 of the Indian Act.
Public Accounts of Canada, 2015–2016
Interest-bearing debt 6 . 47
Restitutions under the Competition Act
This account was established to facilitate judgements rendered under section 52 of the Competition Act, and account for funds received in trust for restitution and for subsequent payment.
Estates—Armed services
This account was established to record the service estates pursuant to section 42 of the National Defence Act of officers and non-commissioned members who die during their service in the Canadian Forces. Under the administration of the Judge Advocate General, in his capacity as Director of Estates, net assets of estates are distributed to the lawful representative of the personal estate.
Scholastic awards
This account was established to record donations of $26,000 to be used for the presentation of scholarship awards to children of employees of the Canadian Security Intelligence Service to encourage university studies.
Inmates’ Trust Fund
Pursuant to section 111 of the Corrections and Conditional Release Regulations, this account is credited with all moneys brought into the institution by an inmate on admission or readmission, and all moneys that are received on the inmate’s behalf while in custody, including, monetary gifts from a third party, payments for program participation, pay earned while on work release or conditional release in the community, moneys received from a third party for work performed in an institution or a Correctional Service of Canada approved inmate operated business enterprise, sale of hobby craft or custom work, a payment, allowance or income paid by either a private or government source. Deductions may be made from this account for issues such as debts to the Crown, the Inmate Welfare Fund, canteen expenditures, telephone calls, payments to assist in the rehabilitation of the inmate, and any other payments for which the inmate is liable.
Benefit Trust Fund
This account was established by section 23 of the Royal Canadian Mounted Police Act, to record funds received by personnel of the Royal Canadian Mounted Police, in connection with the performance of duties, over and above their pay and allowances, as well as forfeitures of pay. The money paid to the Benefit Trust Fund is used for the benefit of RCMP members, former members and their dependants; use of the funds is governed by the Royal Canadian Mounted Police Regulations.
Administered accounts
Pursuant to section 41 of the Pension Act, section 15 of the War Veterans Allowance Act, section 55 of the Veterans Treatment Regulations and section 8 of the Guardianship of Veterans Property Regulations, these accounts are under the jurisdiction of the Department of Veterans Affairs. Funds held in these accounts include: (a) pensions, war veterans allowances and treatment allowances placed under the administration of the Department of Veterans Affairs; and (b) benefits from other sources such as Old Age Security, Guaranteed Income Supplement or Canada Pension Plan, placed under administration with the consent of the client. These persons have demonstrated their inability to manage their own affairs.
Payments are made out of the accounts, to provide food, shelter, clothing, comforts and other necessities.
Estates Fund
This account was established to record the proceeds from the estates of those veterans who died while receiving hospital treatment or institutional care, and for those veterans whose funds had been administered by the Government, in accordance with sections 5, 6 and 7 of the Veterans’ Estates Regulations. Individual accounts are maintained and payments are made to beneficiaries pursuant to the appropriate legislative authority.
Veterans Administration and Welfare Trust Fund
This account was established to record donations, legacies, gifts, bequests, etc., received, to be disbursed for the benefit of veterans or their dependents under certain conditions, and for the benefit of patients in institutions, in accordance with section 9 of the Guardianship of Veterans’ Property Regulations.
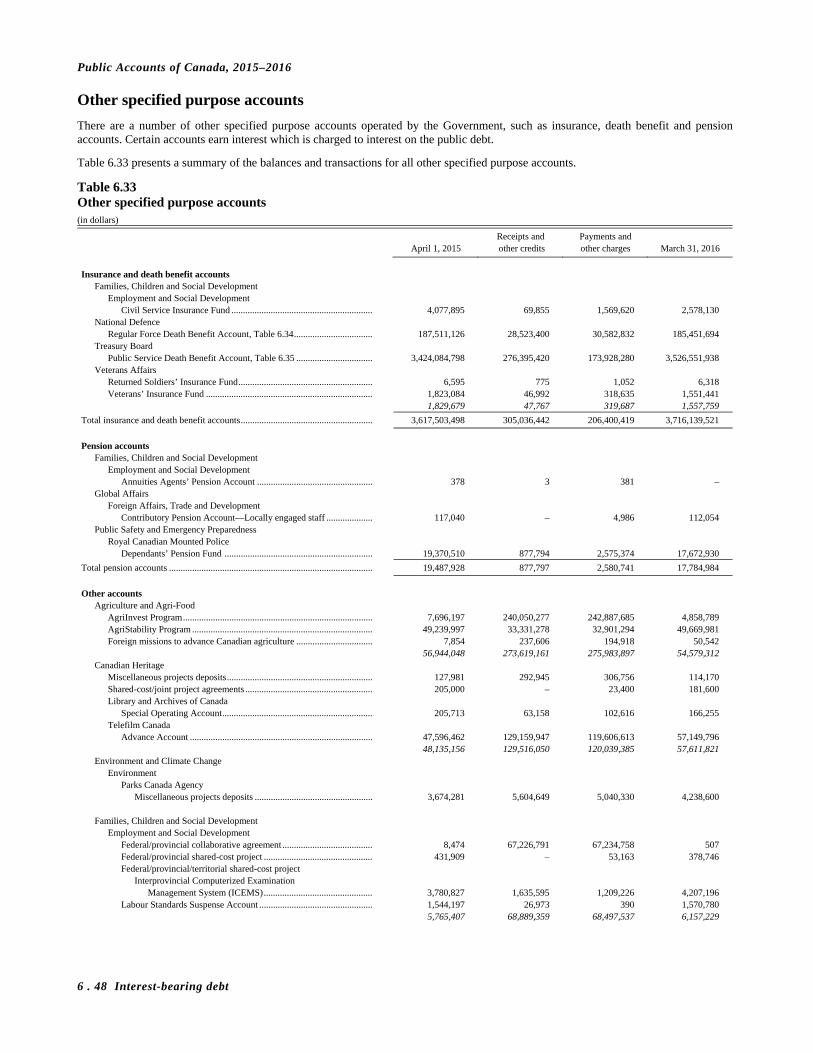
Public Accounts of Canada, 2015–2016
6 . 48 Interest-bearing debt
Other specified purpose accounts
There are a number of other specified purpose accounts operated by the Government, such as insurance, death benefit and pension accounts. Certain accounts earn interest which is charged to interest on the public debt.
Table 6.33 presents a summary of the balances and transactions for all other specified purpose accounts.
Table 6.33 Other specified purpose accounts (in dollars)
Receipts and Payments and April 1, 2015 other credits other charges March 31, 2016
Insurance and death benefit accounts
Families, Children and Social Development Employment and Social Development
Civil Service Insurance Fund ............................................................. 4,077,895 69,855 1,569,620 2,578,130 National Defence
Regular Force Death Benefit Account, Table 6.34 .................................. 187,511,126 28,523,400 30,582,832 185,451,694 Treasury Board
Public Service Death Benefit Account, Table 6.35 ................................. 3,424,084,798 276,395,420 173,928,280 3,526,551,938 Veterans Affairs
Returned Soldiers’ Insurance Fund .......................................................... 6,595 775 1,052 6,318 Veterans’ Insurance Fund ........................................................................ 1,823,084 46,992 318,635 1,551,441
1,829,679 47,767 319,687 1,557,759
Total insurance and death benefit accounts ......................................................... 3,617,503,498 305,036,442 206,400,419 3,716,139,521
Pension accounts
Families, Children and Social Development Employment and Social Development
Annuities Agents’ Pension Account .................................................. 378 3 381 – Global Affairs
Foreign Affairs, Trade and Development Contributory Pension Account—Locally engaged staff .................... 117,040 – 4,986 112,054
Public Safety and Emergency Preparedness Royal Canadian Mounted Police
Dependants’ Pension Fund ................................................................ 19,370,510 877,794 2,575,374 17,672,930
Total pension accounts ........................................................................................ 19,487,928 877,797 2,580,741 17,784,984
Other accounts
Agriculture and Agri-Food AgriInvest Program .................................................................................. 7,696,197 240,050,277 242,887,685 4,858,789 AgriStability Program .............................................................................. 49,239,997 33,331,278 32,901,294 49,669,981 Foreign missions to advance Canadian agriculture ................................. 7,854 237,606 194,918 50,542
56,944,048 273,619,161 275,983,897 54,579,312 Canadian Heritage
Miscellaneous projects deposits ............................................................... 127,981 292,945 306,756 114,170 Shared-cost/joint project agreements ....................................................... 205,000 – 23,400 181,600 Library and Archives of Canada
Special Operating Account ................................................................. 205,713 63,158 102,616 166,255 Telefilm Canada
Advance Account ............................................................................... 47,596,462 129,159,947 119,606,613 57,149,796 48,135,156 129,516,050 120,039,385 57,611,821 Environment and Climate Change
Environment Parks Canada Agency
Miscellaneous projects deposits ................................................... 3,674,281 5,604,649 5,040,330 4,238,600 Families, Children and Social Development
Employment and Social Development Federal/provincial collaborative agreement ....................................... 8,474 67,226,791 67,234,758 507 Federal/provincial shared-cost project ............................................... 431,909 – 53,163 378,746 Federal/provincial/territorial shared-cost project
Interprovincial Computerized Examination Management System (ICEMS) ............................................... 3,780,827 1,635,595 1,209,226 4,207,196
Labour Standards Suspense Account ................................................. 1,544,197 26,973 390 1,570,780 5,765,407 68,889,359 68,497,537 6,157,229

Public Accounts of Canada, 2015–2016
Interest-bearing debt 6 . 49
Table 6.33 Other specified purpose accounts—continued (in dollars)
Receipts and Payments and April 1, 2015 other credits other charges March 31, 2016
Finance
Common school funds—Ontario and Quebec ......................................... 2,677,771 – – 2,677,771 Foreign Claims Fund ................................................................................ 179,020 – – 179,020 War Claims Fund—World War II ........................................................... 4,236 – – 4,236
2,861,027 – – 2,861,027 Fisheries, Oceans and the Canadian Coast Guard
Fisheries and Oceans Federal/provincial cost-sharing agreements ....................................... 313,528 447,020 546,246 214,302 Miscellaneous projects deposits ......................................................... 22,814,103 7,891,304 9,815,916 20,889,491 Sales of seized assets .......................................................................... 1,250,015 382,984 303,773 1,329,226
24,377,646 8,721,308 10,665,935 22,433,019 Global Affairs
Foreign Affairs, Trade and Development Canada Foundation Account .............................................................. 389,039 7,737 13,588 383,188
Less: Securities held in trust ............................................................. 376,036 11,871 6,760 370,925 Deposits in a special bank account ......................................... 13,003 1,717 977 12,263
– 21,325 21,325 – Financial assistance to Canadians abroad ................................................ 180,859 937,120 922,591 195,388 Funds from non-governmental organizations .......................................... 2,397,265 6,759,067 7,146,697 2,009,635 Shared-cost projects ................................................................................. 9,957,325 6,811,103 6,972,513 9,795,915 Shared-cost projects—Support to various programs ............................... 6,244,500 2,855,248 5,282,341 3,817,407
18,779,949 17,383,863 20,345,467 15,818,345 Health
Collaborative research projects ................................................................ 2,921,441 723,016 531,956 3,112,501 Miscellaneous federal/provincial projects ............................................... 1,620,315 311,348 359,483 1,572,180 World Health Organization ...................................................................... 106,133 – – 106,133 Canadian Food Inspection Agency
Shared-cost agreements ...................................................................... 1,267,618 871,321 1,027,381 1,111,558 Public Health Agency of Canada
Collaborative research projects .......................................................... 1,698,613 336,117 1,209,945 824,785 Miscellaneous federal/provincial projects .......................................... 986,197 – 13,000 973,197
8,600,317 2,241,802 3,141,765 7,700,354 Immigration, Refugees and Citizenship
Citizenship and Immigration Immigrant Investor Program .............................................................. 61,239,879 665,368,960 703,245,119 23,363,720
Indigenous and Northern Affairs
Indian Affairs and Northern Development Indian band funds
Shares and certificates .................................................................. 20,000 – – 20,000 Less: securities held in trust .................................................... 20,000 – – 20,000
– – – – Indian Moneys Suspense Account ..................................................... 52,907,650 286,400,765 296,265,834 43,042,581 Indian special accounts ....................................................................... 413,294 5,055 – 418,349 Non-Indian moneys ............................................................................ 22,671 315,287 337,958 –
53,343,615 286,721,107 296,603,792 43,460,930 Innovation, Science and Economic Development
Industry Federal/provincial agreement—Advance Account ............................ 355,617 260,000 466,029 149,588 Income from securities in trust—Bankruptcy and Insolvency Act ..... 52,031 – – 52,031 Petro-Canada Enterprises Inc.—Unclaimed shares ........................... 687,348 – – 687,348 Securities in trust—Bankruptcy and Insolvency Act .......................... 31,266 – 31,266 –
Less: securities held in trust ......................................................... 31,266 31,266 – – – 31,266 31,266 –
Shared-cost projects ........................................................................... 1,239,899 490,421 148,330 1,581,990 Unclaimed dividends and undistributed assets
Bankruptcy and Insolvency Act .................................................... 27,067,116 1,908,981 520,204 28,455,893 Canada Business Corporations Act.............................................. 7,790,875 175,583 261,969 7,704,489 Winding-up and Restructuring Act ............................................... 3,688,033 1,229,239 – 4,917,272
Canadian Space Agency RADARSAT ................................................................................. 97,461 – 97,461 –
Statistics Canada Project deposits ............................................................................. 1,186,902 102,317,032 103,121,738 382,196
42,165,282 106,412,522 104,646,997 43,930,807

Public Accounts of Canada, 2015–2016
6 . 50 Interest-bearing debt
Table 6.33 Other specified purpose accounts—concluded (in dollars)
Receipts and Payments and April 1, 2015 other credits other charges March 31, 2016
Justice
Courts Administration Service Special Account .................................................................................. 7,837,800 3,225,861 4,071,853 6,991,808
National Defence
Foreign governments—United Kingdom British Army—Suffield, Alberta ........................................................ 1,269,109 – – 1,269,109
Joint research and development projects ................................................. 2,835,664 1,634,038 1,048,155 3,421,547 Non-government agencies ........................................................................ 2,912,626 3,378,327 3,290,396 3,000,557 Communications Security Establishment
Foreign partners—Security ................................................................ 2,063,294 361,854 1,427,528 997,620 9,080,693 5,374,219 5,766,079 8,688,833 National Revenue
Canada Revenue Agency Deposits/Disbursements—Workers’ Compensation Board ............... 154,879 270,723,966 270,277,183 601,662
Natural Resources
Market development incentive payments—Alberta ................................ 2,113,857 – 326,544 1,787,313 Newfoundland Offshore Revenue Account ............................................. – 268,588,906 268,588,906 – Nova Scotia Offshore Revenue Account ................................................. – 27,556,021 27,556,021 – Shared-cost agreements—Research ......................................................... 4,261,784 2,858,278 2,472,380 4,647,682 Shared-cost projects ................................................................................. 477,208 948,824 1,244,497 181,535 Canadian Nuclear Safety Commission
Security equipment purchases ............................................................ 6,466 – 683 5,783 6,859,315 299,952,029 300,189,031 6,622,313 Office of the Governor General’s Secretary
Cost sharing collaborate agreement ......................................................... – 33,686 32,309 1,377 Privy Council
Privy Council Office Shared-cost projects—Media travel expenses ................................... 82,941 579,296 576,246 85,991
Public Safety and Emergency Preparedness
Royal Canadian Mounted Police Joint research and development projects ............................................ 1,186,072 80,000 314,573 951,499
Public Services and Procurement
Public Works and Government Services Military purchases excess funds deposit ............................................ 190,729,261 – 21,360,707 169,368,554
Less: securities held in trust ......................................................... 190,729,261 21,360,707 – 169,368,554 – 21,360,707 21,360,707 – Transport
Shared-cost agreements—Remediation projects ..................................... 24,788,842 – 19,048,842 5,740,000 Veterans Affairs
Shared-cost agreements ............................................................................ 3,273 661 3,273 661
Total ..................................................................................................................... 375,880,422 2,165,809,206 2,229,850,320 311,839,308
Less: consolidation adjustment¹ .......................................................................... 47,596,462 9,553,334 – 57,149,796
Total other accounts ............................................................................................. 328,283,960 2,156,255,872 2,229,850,320 254,689,512
Total other specified purpose accounts ............................................................... 3,965,275,386 2,462,170,111 2,438,831,480 3,988,614,017
1 Additional information on consolidated Crown corporations and other entities is provided in Section 4 of this volume.

Public Accounts of Canada, 2015–2016
Interest-bearing debt 6 . 51
Civil Service Insurance Fund
This account was established by the Civil Service Insurance Act, introduced to enable the Minister of Finance to contract with a person appointed to a permanent position in any branch of the public service, for the payment of certain death benefits. No new contracts have been entered into since 1954, when the Supplementary Death Benefit Plan for the Public Service and Canadian Forces was introduced as part of the Public Service Superannuation Act and the Canadian Forces Superannuation Act, respectively.
The number of policies in force as of March 31, 2016 was 279 and the average age of the policyholders was 92.5 years. During the year, premiums of $315 were received. Death benefits, settlement annuities and premium refunds of $1,569,620 were paid during 2015–2016.
According to the actuarial valuation and with the prescribed actuarial assumptions, the liabilities in respect of the benefits provided under the Act are estimated at $2,578,130 as at March 31, 2016. The balance in the Account as at March 31, 2016 is $2,508,590. The deficit as at March 31, 2016 is therefore $69,540. Pursuant to subsection 16(3) of the Civil Service Insurance Regulations, an amount of 69,540 has therefore been credited to the Account in 2015–2016.
Regular Force Death Benefit Account
This account was established by the Canadian Armed Forces Superannuation Act to provide life insurance to contributing members and former members of the Canadian Armed Forces. Receipts and other credits consist of: (a) contributions by participants; (b) Government’s contribution paid in respect of participants; (c) single premiums payable by the Government in respect of participants who became entitled to a basic benefit of $5,000 without contribution; and (d) interest.
Payments and other charges consist of: (a) benefits paid in respect of participants; (b) benefits paid in respect of elective; and (c) the portion of benefits payable for which the Government has paid a single premium.
Table 6.34 Regular Force Death Benefit Account (in dollars)
2015–2016 2014–2015
Opening balance .................................................................................................................................................................. 187,511,126 189,251,651
Receipts and other credits Employee contributions ................................................................................................................................................. 17,680,864 17,515,935 Employer contributions
Government General ............................................................................................................................................................... 1,928,531 2,017,428 Single premiums payable by the Government in respect of Regular Force participants
who became entitled to a basic benefit of $5,000 without contribution ...................................................... 243,349 786,290 Interest ............................................................................................................................................................................ 8,670,656 9,456,294
Total receipts and other credits ...................................................................................................................................... 28,523,400 29,775,947
Subtotal ................................................................................................................................................................................ 216,034,526 219,027,598
Payments and other charges Benefit payments
Benefits paid in respect of participants who, at the time of death, were members of the Regular Force, or who were elective Regular Force participants ............................................................ 30,582,832 31,516,472
Closing balance .................................................................................................................................................................... 185,451,694 187,511,126
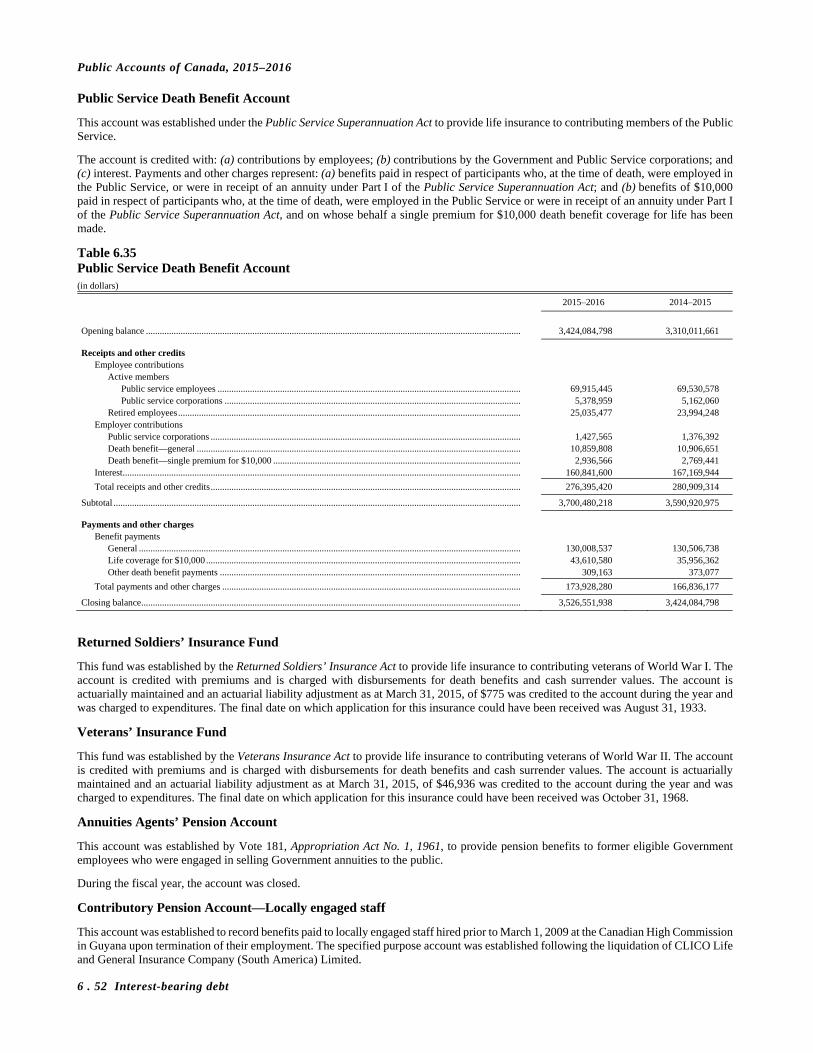
Public Accounts of Canada, 2015–2016
6 . 52 Interest-bearing debt
Public Service Death Benefit Account
This account was established under the Public Service Superannuation Act to provide life insurance to contributing members of the Public Service.
The account is credited with: (a) contributions by employees; (b) contributions by the Government and Public Service corporations; and (c) interest. Payments and other charges represent: (a) benefits paid in respect of participants who, at the time of death, were employed in the Public Service, or were in receipt of an annuity under Part I of the Public Service Superannuation Act; and (b) benefits of $10,000 paid in respect of participants who, at the time of death, were employed in the Public Service or were in receipt of an annuity under Part I of the Public Service Superannuation Act, and on whose behalf a single premium for $10,000 death benefit coverage for life has been made.
Table 6.35 Public Service Death Benefit Account (in dollars)
2015–2016 2014–2015
Opening balance .................................................................................................................................................................. 3,424,084,798 3,310,011,661
Receipts and other credits Employee contributions
Active members Public service employees ................................................................................................................................... 69,915,445 69,530,578 Public service corporations ................................................................................................................................ 5,378,959 5,162,060
Retired employees .................................................................................................................................................... 25,035,477 23,994,248 Employer contributions
Public service corporations ...................................................................................................................................... 1,427,565 1,376,392 Death benefit—general ............................................................................................................................................ 10,859,808 10,906,651 Death benefit—single premium for $10,000 ........................................................................................................... 2,936,566 2,769,441
Interest ............................................................................................................................................................................ 160,841,600 167,169,944
Total receipts and other credits ...................................................................................................................................... 276,395,420 280,909,314
Subtotal ................................................................................................................................................................................ 3,700,480,218 3,590,920,975
Payments and other charges Benefit payments
General ..................................................................................................................................................................... 130,008,537 130,506,738 Life coverage for $10,000 ........................................................................................................................................ 43,610,580 35,956,362 Other death benefit payments .................................................................................................................................. 309,163 373,077
Total payments and other charges ................................................................................................................................. 173,928,280 166,836,177
Closing balance .................................................................................................................................................................... 3,526,551,938 3,424,084,798
Returned Soldiers’ Insurance Fund
This fund was established by the Returned Soldiers’ Insurance Act to provide life insurance to contributing veterans of World War I. The account is credited with premiums and is charged with disbursements for death benefits and cash surrender values. The account is actuarially maintained and an actuarial liability adjustment as at March 31, 2015, of $775 was credited to the account during the year and was charged to expenditures. The final date on which application for this insurance could have been received was August 31, 1933.
Veterans’ Insurance Fund
This fund was established by the Veterans Insurance Act to provide life insurance to contributing veterans of World War II. The account is credited with premiums and is charged with disbursements for death benefits and cash surrender values. The account is actuarially maintained and an actuarial liability adjustment as at March 31, 2015, of $46,936 was credited to the account during the year and was charged to expenditures. The final date on which application for this insurance could have been received was October 31, 1968.
Annuities Agents’ Pension Account
This account was established by Vote 181, Appropriation Act No. 1, 1961, to provide pension benefits to former eligible Government employees who were engaged in selling Government annuities to the public.
During the fiscal year, the account was closed.
Contributory Pension Account—Locally engaged staff
This account was established to record benefits paid to locally engaged staff hired prior to March 1, 2009 at the Canadian High Commission in Guyana upon termination of their employment. The specified purpose account was established following the liquidation of CLICO Life and General Insurance Company (South America) Limited.

Public Accounts of Canada, 2015–2016
Interest-bearing debt 6 . 53
Dependants’ Pension Fund
This fund, which pertains to Part IV of the Royal Canadian Mounted Police Pension Continuation Act, provides pension benefits to certain widows and other dependants of Constables of the Royal Canadian Mounted Police, who purchased pension benefits between October 1, 1934 and March 1, 1949. There are no longer any active members amongst the contributors.
AgriInvest Program
The AgriInvest Program is a savings account designed to help producers cover small margin declines.
The AgriInvest Program is cost-shared with provinces and territories on a 60/40 basis. The provinces and territories are invoiced for their share of the contributions, which are held in the specified purpose accounts until they are applied and transferred to the producer accounts. The funds in the producers specified purpose accounts are then drawn down as AgriInvest account holders request withdrawals or when the funds are transferred to a financial institution.
Starting with the 2009 program year, producers are required to make their AgriInvest deposits at a financial institution of their choice and any funds which were previously held by the federal government will be transferred to the new accounts.
AgriStability Program
The AgriStability Program is designed to cover larger margin declines caused by circumstances such as low prices, production losses, and rising input costs.
The AgriStability Program is cost-shared with provinces and territories on a 60/40 basis. Producers are charged a fee in order to participate in the program, which covers a portion of the program expenditure. The provinces and territories as well as producers are invoiced for their share of the contributions, which are held in the specified purpose accounts. These funds are drawn down as applications are processed and benefits are paid out.
Foreign missions to advance Canadian agriculture
This account was established to record deposits made by Canadian agri-food industry organizations towards the costs of hosting incoming government-to-government foreign missions that advance Canadian agri-food commercial interests, or for costs related to outgoing foreign missions in support of incremental agri-food market development activities, for which there is a collaborative agreement with the Federal Government. The costs incurred by the Federal Government to undertake these missions are charged to this account and any unspent deposits are returned to the relevant Canadian agri-food industry organizations at the completion of each mission.
Miscellaneous projects deposits—Canadian Heritage
This account was established to record contributions received from organizations and individuals for various projects.
Shared-cost/joint project agreements—Canadian Heritage
This account was established to record monies received from other governments and organizations in order to cover expenditures incurred under various shared-cost/joint project agreements.
Special Operating Account
This account was established pursuant to section 18 of the Library and Archives of Canada Act, which also directed that: (a) the account be credited with funds received for the purpose of the Library and Archives Canada by way of donation, bequest or otherwise; and (b) any amounts required for the purpose of the Act may be paid out of the account or out of money appropriated by Parliament for such purposes.
Advance Account—Telefilm Canada
This account was established pursuant to section 19 of the Telefilm Canada Act, to reserve for use in future years the revenues and recoveries generated from projects funded by Telefilm Canada.
Miscellaneous projects deposits—Parks Canada Agency
This account was established to record contributions received from organizations and individuals for various projects.
Federal/provincial collaborative agreement
This account was established to record amounts received by Employment and Social Development from a province as funding under the provisions of a collaborative agreement with the province.
Public Accounts of Canada, 2015–2016
6 . 54 Interest-bearing debt
Federal/provincial shared-cost project—Employment and Social Development
This account was established to record the deposit of advance payments made by provinces towards the costs of projects and programs for which there is a cost-sharing agreement with the Federal Government. Disbursements are made to pay the provinces’ share of costs as per official agreements or to refund unused amounts.
Federal/provincial/territorial shared-cost project—Interprovincial Computerized Examination Management System (ICEMS)
This account was established to record advance payments received from provinces and territories to pay for the development and annual operating costs of the ICEMS. Advance payments are made pursuant to the “Agreement on the Joint Project for the ongoing operations of the ICEMS”. The costs incurred are charged to the account and any unexpended funds will be allocated according to the common will of the Parties and shall be in accordance with applicable legislation.
Labour Standards Suspense Account
This account was established under the authority of section 23 of the Canada Labour Standards Regulations to record wages received by the Minister of Employment, Workforce Development and Labour from employers who cannot locate employees. Efforts are then made to locate employees. Wages are paid out when employees are located or when employees contact the department for payment.
Common school funds—Ontario and Quebec
This account was established under 12 Victoria 1849, Chapter 200, to record the proceeds from the sale of lands set apart for the support and maintenance of common schools in Upper and Lower Canada, now Ontario and Quebec. Interest of $133,889, apportioned on the basis of population, is paid directly to these provinces on a semi-annual basis, at the rate of 5 per cent per annum, and is charged to interest on the public debt.
Foreign Claims Fund
This account was established by Vote 22a, Appropriation Act No. 9, 1966, to record: (a) such part of the money received from the Custodian of Enemy Property, proceeds of the sale of property and the earnings of property, and (b) all amounts received from governments of other countries pursuant to agreements entered into after April 1, 1966 relating to the settlement of Canadian claims, and also records payment of claims submitted, including payment of the expenses incurred in investigating and reporting on such claims.
War Claims Fund—World War II
This account was established by Vote 696, Appropriation Act No. 4, 1952, to record funds received from the Custodian of Enemy Property or from other sources, and payments: (a) to eligible claimants for compensation in respect of World War II; (b) of a supplementary award amounting to 50 per cent of the original award (PC 1958-1467, October 23, 1958); and (c) of expenses incurred in investigating and reporting on claims.
A War Claims Commission was established to enquire into and report on claims made by Canadians arising out of World War II for which compensation may be paid from this or any other fund established for the purpose. The expenses of the Commission are chargeable hereto.
Federal/provincial cost-sharing agreements
This account was established to record the deposit of funds received from the provinces for cost-shared programs according to official signed agreements.
Miscellaneous projects deposits—Fisheries and Oceans
This account was established to record contributions received from organizations and individuals, for the advancement of research work.
Sales of seized assets
The account was established to record the proceeds of the sale of seized items by the Department of Fisheries and Oceans from a person contravening the Fisheries Act. Funds so received are held in the Consolidated Revenue Fund pending final resolution of the case by the Minister of Fisheries and Oceans or the courts.
Canada Foundation Account
This account was established by Vote 6g, Appropriation Act No. 2, 1967, to record funds received in connection with the Civilian Relief Agreement of 1950, and the Cultural Agreement of 1954 between Canada and Italy, and disbursements for the purposes of the said agreements.
Financial assistance to Canadians abroad
This account was established to record funds received from families or friends as prepayment for financial assistance to distressed Canadians abroad.

Public Accounts of Canada, 2015–2016
Interest-bearing debt 6 . 55
Funds from non-governmental organizations
This account was established to record funds received as prepayment for services to be performed by the Department of Foreign Affairs, Trade and Development on behalf of third parties.
Shared-cost projects—Foreign Affairs, Trade and Development
This account was established to record funds received from organizations outside the Government of Canada accounting entity for shared-cost projects.
Shared-cost projects—Support to various programs
This account was established to record deposits received and payments made in accordance with authorities for shared-cost projects to support various development programs.
Collaborative research projects—Health
This account was established to record funds received from client groups for cost shared and joint project research agreements.
Miscellaneous federal/provincial projects—Health
This account was established to record transactions relating to the provinces/territories share of costs incurred under federal/provincial cost-sharing agreements for joint federal/provincial/territorial projects which address health issues which are national in scope.
World Health Organization
This account was established to record funds received from the World Health Organization for scientific projects.
Shared-cost agreements—Canadian Food Inspection Agency
This account was established to record amounts deposited by external parties for shared-cost research projects. Funds are disbursed on behalf of depositors as specific projects are undertaken.
Collaborative research projects—Public Health Agency of Canada
This account was established to record funds received from client groups for cost shared and joint project research agreements.
Miscellaneous federal/provincial projects—Public Health Agency of Canada
This account was established to record transactions relating to the provinces/territories share of costs incurred under federal/provincial cost-sharing agreements for joint federal/provincial/territorial projects which address health issues which are national in scope.
Immigrant Investor Program
This account was established to record the receipt and disbursement of amounts received under the Immigrant Investor Program in accordance with section 12(2) of the Immigration and Refugee Protection Act and section 91(d) of the Immigration and Refugee Protection Regulations. This program allows qualified immigrants to gain permanent residence in Canada by making an investment in the Canadian economy.
The Economic Action Plan 2014 Act, No. 1 (Bill C-31) terminated the program and any application in the backlog for which a selection decision was not made before February 11, 2014. While the program has been terminated, outstanding investments will continue to be returned to investors approximately over the next 5 years.
Indian band funds—Shares and certificates
This account was established under the Indian Act, to record the historical value of TransAlta Utilities Corporation shares received as compensation for a power line right-of-way on the Blood Indian reserve. These shares are held in the name of the Receiver General for Canada for the credit of the Blood Indian Band.
Indian Moneys Suspense Account
This account was established to hold moneys received for individual Indians and bands, that cannot be disbursed to an Indian, or credited to an Indian Band Fund or Individual Trust Fund account, pending execution of the related lease, permit or licence, settlement of litigation, registration of the Indian or identification of the recipient.
Public Accounts of Canada, 2015–2016
6 . 56 Interest-bearing debt
Indian special accounts
Indian special accounts represent a number of non-interest bearing accounts which are maintained for specific purpose and include the following:
(a) Quebec fur account—This account was established to record funds received from the sales of pelts trapped on reserves in the Abitibi District in Quebec, to defer charges for tallymen’s wages, freight costs, etc. No activity was reported in the current year.
(b) Fines—Indian Act—Fines collected as defined in section 104 of the Indian Act, are credited to this account for the benefit of the bands or members of the bands. Expenditures may be made per the direction of the Governor in Council to cover certain costs in the administration or promotion of the purpose of the relative law.
Non-Indian moneys
This account was established as per Article 5.08 (a)(ii) of the Saskatchewan Treaty Land Entitlement Framework Agreement to collect “Provincial Mineral Revenues” on behalf of the Province of Saskatchewan and remit the same in the manner as described in an agreement between the two parties.
Federal/provincial agreement—Advance Account
This account was established to record deposits from non-federal partners for their share of costs under various projects. Funds are disbursed on behalf of contributors as projects are undertaken. Unused funds are to be returned to contributors.
Income from securities in trust—Bankruptcy and Insolvency Act
This account was established by sections 78, 84, 154 and 194 of the Bankruptcy and Insolvency Act, to record dividends paid on stocks originally held by a bankrupt stockbroker but subsequently sold to clients. As the stocks were not registered in the clients’ names, the dividends must be paid to the last registered owner, in this case, the stockbroker. The dividends are forwarded to the Superintendent of Bankruptcy for safekeeping.
Petro-Canada Enterprises Inc.—Unclaimed shares
This account was established by Section 227 of the Canada Business Corporations Act to record the liability to shareholders who have not presented their shares for payment.
Securities in trust—Bankruptcy and Insolvency Act
This account was established by section 67 of the Bankruptcy and Insolvency Act, to record the value of securities originally held by a bankrupt stockbroker, on behalf of clients who have not been located.
Shared-cost projects—Industry
This account was established to record funds received from other governments and organizations in order to cover expenditures incurred under various shared-cost/joint project agreements.
Unclaimed dividends and undistributed assets—Bankruptcy and Insolvency Act
This account represents amounts credited to the Receiver General in accordance with the provisions of section 154 of the Bankruptcy and Insolvency Act, pending distribution to creditors.
Unclaimed dividends and undistributed assets—Canada Business Corporations Act
This account was established in accordance with sections 227 and 228 of the Canada Business Corporations Act, for the purpose of recording liabilities to creditors and shareholders who have not been located. The account is charged when funds are paid to them.
Unclaimed dividends and undistributed assets—Winding-up and Restructuring Act
This account records amounts credited to the Receiver General, in accordance with sections 138 and 139 of the Winding-up and Restructuring Act, pending distribution.
RADARSAT
This account was established to record funds received for both cost-sharing and advance payments for RADARSAT scenes.
Project deposits—Statistics Canada
This account was established to record deposits received from outside parties to secure payments for special statistical services.

Public Accounts of Canada, 2015–2016
Interest-bearing debt 6 . 57
Special Account—Courts Administration Service
This account was established to maintain accounts on behalf of litigants before the Federal Court and Federal Court of Appeal. These accounts record the funds paid into the Federal Court and Federal Court of Appeal, pursuant to an order of the Courts, rules of the Courts or statutes, to be held pending payment of such funds, in accordance with an order/judgment of these Courts.
Foreign governments
These accounts were established to record funds received from foreign governments, to cover expenditures to be made on their behalf, in accordance with the provisions of agreements with the Government of Canada.
Joint research and development projects—National Defence
This account was established to record funds received from other governments and organizations through collaborative relationships where the work is shared between the government of Canada and other laboratories.
Non-government agencies
This account was established to record funds received for expenditures made on behalf of non-government agencies, for which specific accounts have not been established.
Foreign partners
These accounts were established to record funds received from foreign partners to cover expenditures to be made on their behalf, in accordance with the provisions of agreements with the Government of Canada.
Deposits/Disbursements—Workers’ Compensation Board
This account was established under the authority of the Canada Revenue Agency Act and the Workers’ Compensation Act, to enable the Canada Revenue Agency (CRA) to record and forward on daily basis, funds received from Nova Scotia employers to the Workers’ Compensation Board of Nova Scotia (Board), as part of a partnership arrangement between the CRA and the Board.
Market development incentive payments—Alberta
This account records funds received from the Government of Alberta to encourage the expansion of natural gas markets in Alberta and provinces to the East, in accordance with an agreement between the Government of Canada and the Government of Alberta dated September 1, 1981 and pursuant to section 39 of the Energy Administration Act. The original term of the agreement was from November 1, 1981 to January 31, 1987. As a result of the Western Accord of March 25, 1985, payments from the Government of Alberta terminated as at April 30, 1986; however, payments continued to be made from the account for selected programs, which encouraged the use of natural gas for vehicles.
More recently, a new strategy for the expenditure of these funds has been agreed upon. This strategy consists of expending the remaining funds in support of expanding the use of natural gas (NG) in transportation and combined heat and power applications across Canada.
Newfoundland Offshore Revenue Account
This account was established pursuant to section 214 of the Canada-Newfoundland and Labrador Atlantic Accord Implementation Act to facilitate the transfer of funds to the province of Newfoundland and Labrador equal to revenues from oil and gas activities in the Canada-Newfoundland and Labrador offshore. Through statutory provisions of the Act, an amount equal to certain offshore revenues (taxes, royalties and miscellaneous revenues) is credited to this account and subsequent payments to the Province of Newfoundland and Labrador are charged thereto.
Nova Scotia Offshore Revenue Account
This account was established pursuant to section 219 of the Canada-Nova Scotia Offshore Petroleum Resources Accord Implementation Act to facilitate the transfer of funds to the province of Nova Scotia equal to revenues from oil and gas activities in Canada-Nova Scotia offshore. Through statutory provisions of the Act, an amount equal to certain offshore revenues (taxes, royalties and miscellaneous revenues) is credited to this account and subsequent payments to the Province of Nova Scotia are charged thereto.
Shared-cost agreements—Research—Natural Resources
This account was established to facilitate the retention and disbursement of funds received from private industries and other governments for joint projects or shared-cost research agreements.
Shared-cost projects—Natural Resources
This account was established to facilitate the retention and disbursement of funds received from private organizations and other governments for cost-sharing scientific projects.
Public Accounts of Canada, 2015–2016
6 . 58 Interest-bearing debt
Security equipment purchases
Funds deposited in this account by licensees are used to provide for payment of purchases of security equipment for the licensees’ facilities in accordance with security arrangements mandated pursuant to the Nuclear Safety and Control Act.
Cost sharing collaborate agreement
This account was established to record amounts deposited by external parties for shared-cost projects.
Shared-cost projects—Media travel expenses
This account records medias’ (non-governmental organizations) reimbursements for travel arrangement services rendered to them.
Joint research and development projects—Royal Canadian Mounted Police
This account was established to record funds received from other government organizations in order to share costs incurred under various research project agreements, technical requirements and system improvements.
Military purchases excess funds deposit
This account was established by a written agreement between Canada and the United States, to record temporarily unused funds paid to the United States Government under contracts for purchases of military equipment. The funds are invested by the Federal Reserve Bank of New York to earn interest for the Government of Canada.
Shared-cost agreements—Remediation projects
This account was established to record funds received from external parties in order to cover expenditures incurred under shared-cost remediation projects.
Shared-cost agreements—Veterans Affairs
This account was established to record transactions relating to share of costs incurred under federal/provincial cost-sharing agreements and funding for research and other projects at Sainte Anne’s Hospital.

Public Accounts of Canada, 2015–2016
Interest-bearing debt 6 . 59
Supplementary Statements
Canada Pension Plan
Management’s responsibility for financial statements
The consolidated financial statements of the Canada Pension Plan are prepared in accordance with the legislation Canada Pension Plan (Canada Pension Plan) by the management of Employment and Social Development Canada. Management is responsible for determining that the applicable financial reporting framework is acceptable and is responsible for the integrity and objectivity of the information in the consolidated financial statements, including the amounts which must, of necessity, be based on best estimates and judgment. The significant accounting policies are identified in Note 2 to the consolidated financial statements. The financial information presented throughout the Annual Report is consistent with the consolidated financial statements.
To fulfill its accounting and reporting responsibilities, management has developed and maintains books of account, financial and management controls, information systems and management practices. These systems are designed to provide reasonable assurance that financial information is reliable, that assets are safeguarded and that transactions are properly authorized and recorded in accordance with the Canada Pension Plan, the Canada Pension Plan Investment Board Act and the Financial Administration Act and their accompanying regulations.
The Auditor General of Canada, the external auditor of the Canada Pension Plan, conducts an independent audit of the consolidated financial statements in accordance with Canadian generally accepted auditing standards and provides a report to the Minister of Families, Children and Social Development.
Louise Levonian Deputy Minister
Employment and Social Development Canada
Alain P. Séguin, MBA, CPA, CGA Chief Financial Officer
Employment and Social Development Canada
Gatineau, Canada September 1, 2016

Public Accounts of Canada, 2015–2016
6 . 60 Interest-bearing debt
Canada Pension Plan—continued
Independent Auditor’s Report
To the Minister of Families, Children and Social Development
I have audited the accompanying consolidated financial statements of the Canada Pension Plan, which comprise the consolidated statement of financial position as at 31 March 2016, and the consolidated statement of operations, consolidated statement of changes in financial assets available for benefit payments and consolidated statement of cash flow for the year then ended, and a summary of significant accounting policies and other explanatory information. The consolidated financial statements have been prepared by management of the Canada Pension Plan using the basis of accounting described in Note 2 to the consolidated financial statements.
Management’s responsibility for the consolidated financial statements
Management is responsible for the preparation of these consolidated financial statements in accordance with the basis of accounting described in Note 2 to the consolidated financial statements, and for such internal control as management determines is necessary to enable the preparation of consolidated financial statements that are free from material misstatement, whether due to fraud or error.
Auditor’s responsibility
My responsibility is to express an opinion on these consolidated financial statements based on my audit. I conducted my audit in accordance with Canadian generally accepted auditing standards. Those standards require that I comply with ethical requirements and plan and perform the audit to obtain reasonable assurance about whether the consolidated financial statements are free from material misstatement.
An audit involves performing procedures to obtain audit evidence about the amounts and disclosures in the consolidated financial statements. The procedures selected depend on the auditor’s judgment, including the assessment of the risks of material misstatement of the consolidated financial statements, whether due to fraud or error. In making those risk assessments, the auditor considers internal control relevant to the entity’s preparation of the consolidated financial statements in order to design audit procedures that are appropriate in the circumstances, but not for the purpose of expressing an opinion on the effectiveness of the entity’s internal control. An audit also includes evaluating the appropriateness of accounting policies used and the reasonableness of accounting estimates made by management, as well as evaluating the overall presentation of the consolidated financial statements.
I believe that the audit evidence I have obtained is sufficient and appropriate to provide a basis for my audit opinion.
Opinion
In my opinion, the consolidated financial statements of the Canada Pension Plan for year ended 31 March 2016 are prepared, in all material respects, in accordance with the basis of accounting described in Note 2 to the consolidated financial statements.
Basis of accounting
Without modifying my opinion, I draw attention to Note 2 to the consolidated financial statements, which describes the basis of accounting. The consolidated financial statements are prepared to comply with the financial reporting provisions of the Canada Pension Plan legislation. As a result, the consolidated financial statements may not be suitable for another purpose.
Robert Wilson, CPA, CA Principal for the Auditor General of Canada
1 September 2016 Ottawa, Canada
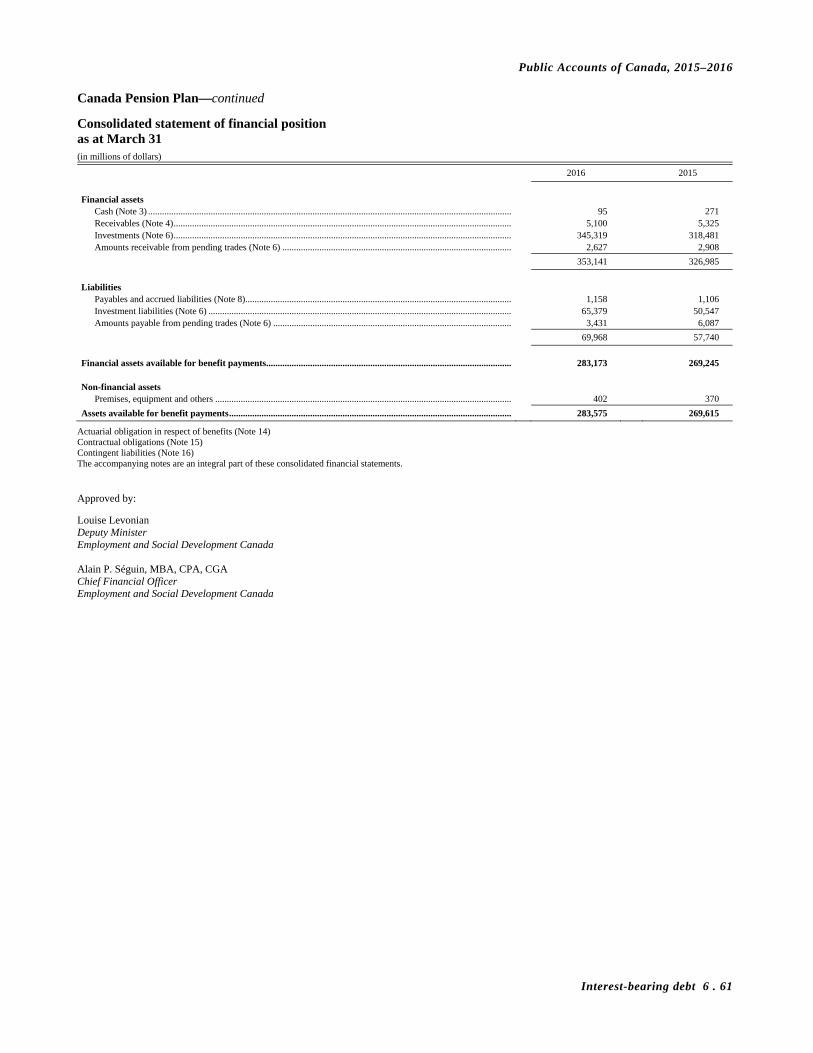
Public Accounts of Canada, 2015–2016
Interest-bearing debt 6 . 61
Canada Pension Plan—continued
Consolidated statement of financial position as at March 31 (in millions of dollars)
2016 2015
Financial assets
Cash (Note 3) ............................................................................................................................................................. 95 271 Receivables (Note 4) .................................................................................................................................................. 5,100 5,325 Investments (Note 6) .................................................................................................................................................. 345,319 318,481 Amounts receivable from pending trades (Note 6) ................................................................................................... 2,627 2,908
353,141 326,985
Liabilities
Payables and accrued liabilities (Note 8) ................................................................................................................... 1,158 1,106 Investment liabilities (Note 6) ................................................................................................................................... 65,379 50,547 Amounts payable from pending trades (Note 6) ....................................................................................................... 3,431 6,087
69,968 57,740
Financial assets available for benefit payments.......................................................................................................... 283,173 269,245 Non-financial assets
Premises, equipment and others ................................................................................................................................ 402 370
Assets available for benefit payments .......................................................................................................................... 283,575 269,615
Actuarial obligation in respect of benefits (Note 14) Contractual obligations (Note 15) Contingent liabilities (Note 16) The accompanying notes are an integral part of these consolidated financial statements.
Approved by:
Louise Levonian Deputy Minister Employment and Social Development Canada Alain P. Séguin, MBA, CPA, CGA Chief Financial Officer Employment and Social Development Canada
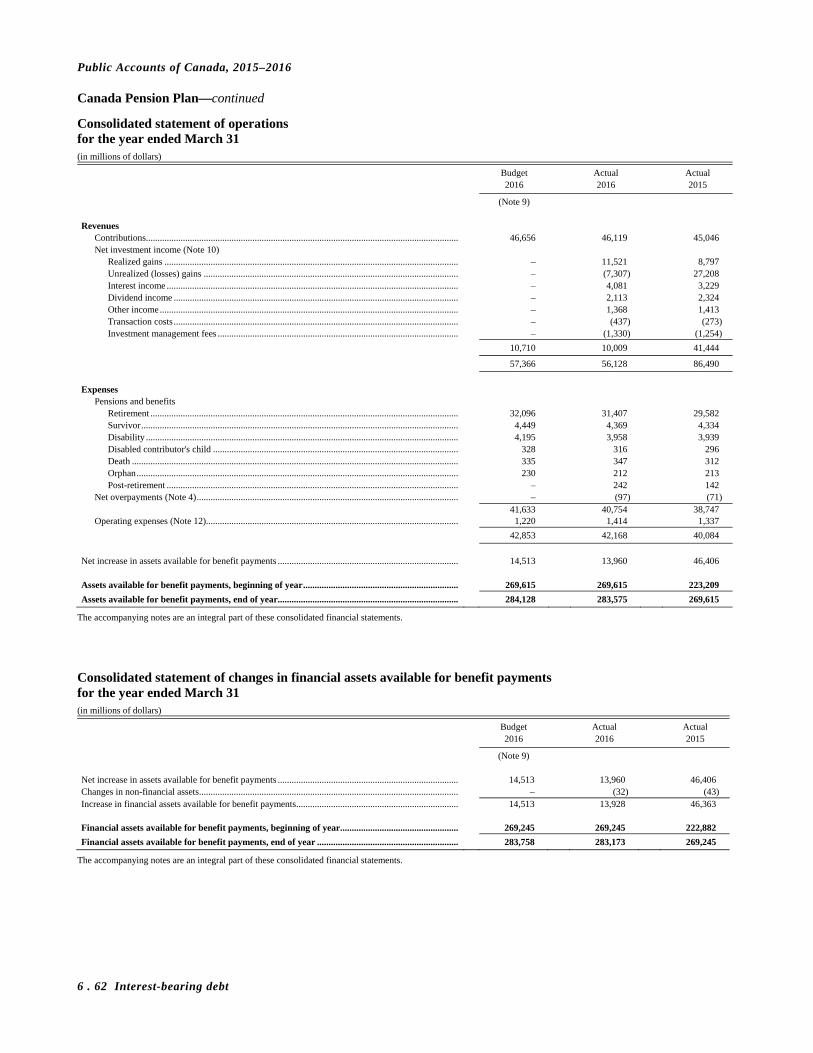
Public Accounts of Canada, 2015–2016
6 . 62 Interest-bearing debt
Canada Pension Plan—continued
Consolidated statement of operations for the year ended March 31 (in millions of dollars)
Budget Actual Actual 2016 2016 2015
(Note 9) Revenues
Contributions....................................................................................................................................... 46,656 46,119 45,046 Net investment income (Note 10)
Realized gains ............................................................................................................................... – 11,521 8,797 Unrealized (losses) gains .............................................................................................................. – (7,307) 27,208 Interest income .............................................................................................................................. – 4,081 3,229 Dividend income ........................................................................................................................... – 2,113 2,324 Other income ................................................................................................................................. – 1,368 1,413 Transaction costs ........................................................................................................................... – (437) (273) Investment management fees ........................................................................................................ – (1,330) (1,254)
10,710 10,009 41,444
57,366 56,128 86,490
Expenses
Pensions and benefits Retirement ..................................................................................................................................... 32,096 31,407 29,582 Survivor ......................................................................................................................................... 4,449 4,369 4,334 Disability ....................................................................................................................................... 4,195 3,958 3,939 Disabled contributor's child .......................................................................................................... 328 316 296 Death ............................................................................................................................................. 335 347 312 Orphan ........................................................................................................................................... 230 212 213 Post-retirement .............................................................................................................................. – 242 142
Net overpayments (Note 4) ................................................................................................................. – (97) (71) 41,633 40,754 38,747 Operating expenses (Note 12)............................................................................................................. 1,220 1,414 1,337
42,853 42,168 40,084
Net increase in assets available for benefit payments .............................................................................. 14,513 13,960 46,406 Assets available for benefit payments, beginning of year ................................................................... 269,615 269,615 223,209
Assets available for benefit payments, end of year.............................................................................. 284,128 283,575 269,615
The accompanying notes are an integral part of these consolidated financial statements.
Consolidated statement of changes in financial assets available for benefit payments for the year ended March 31 (in millions of dollars)
Budget Actual Actual 2016 2016 2015
(Note 9) Net increase in assets available for benefit payments .............................................................................. 14,513 13,960 46,406 Changes in non-financial assets ................................................................................................................ – (32) (43) Increase in financial assets available for benefit payments ...................................................................... 14,513 13,928 46,363 Financial assets available for benefit payments, beginning of year ................................................... 269,245 269,245 222,882
Financial assets available for benefit payments, end of year ............................................................. 283,758 283,173 269,245
The accompanying notes are an integral part of these consolidated financial statements.

Public Accounts of Canada, 2015–2016
Interest-bearing debt 6 . 63
Canada Pension Plan—continued
Consolidated statement of cash flow for the year ended March 31 (in millions of dollars)
2016 2015
Operating activities
Cash receipts Contributions ........................................................................................................................................................ 46,287 44,301 Dividends on investments .................................................................................................................................... 1,829 1,960 Interest on investments ......................................................................................................................................... 3,949 3,235 Other investment income ..................................................................................................................................... 1,376 1,223
Cash payments Pensions and benefits ........................................................................................................................................... (40,741) (38,845) Operating expenses .............................................................................................................................................. (1,299) (1,121) Investment management fees ............................................................................................................................... (1,053) (555) Transaction costs .................................................................................................................................................. (446) (241) Payment of interest on debt .................................................................................................................................. (39) (130)
Cash flows from operating activities............................................................................................................................ 9,863 9,827
Capital activities
Acquisition of premises and equipment .................................................................................................................... (50) (43)
Cash flows used in capital activities ............................................................................................................................. (50) (43)
Financing activities
Issuance of debt.......................................................................................................................................................... 62,303 34,678 Repayment of debt ..................................................................................................................................................... (55,691) (34,614)
Cash flows from financing activities ............................................................................................................................ 6,612 64
Investing activities
Purchases Equities ................................................................................................................................................................. (214,319) (161,599) Real assets ............................................................................................................................................................ (11,144) (6,255) Bonds .................................................................................................................................................................... (375,214) (274,391) Money market securities and absolute return strategies ...................................................................................... (4,910,894) (3,331,176) Other debt ............................................................................................................................................................. (14,260) (10,852)
Disposals Equities ................................................................................................................................................................. 220,927 150,246 Real assets ............................................................................................................................................................ 2,753 3,539 Bonds .................................................................................................................................................................... 361,636 275,690 Money market securities and absolute return strategies ...................................................................................... 4,915,750 3,340,393 Other debt ............................................................................................................................................................. 8,164 4,661
Cash flows used in investing activities ......................................................................................................................... (16,601) (9,744)
Net (decrease) increase in cash ..................................................................................................................................... (176) 104
Cash, beginning of year ................................................................................................................................................. 271 167
Cash, end of year ........................................................................................................................................................... 95 271
The accompanying notes are an integral part of these consolidated financial statements.
Public Accounts of Canada, 2015–2016
6 . 64 Interest-bearing debt
Canada Pension Plan—continued
Notes to consolidated financial statements for the year ended March 31, 2016
1. Authority, objective and responsibilities
(a) Description of the Canada Pension Plan
The Canada Pension Plan (CPP) is a federal/provincial plan established by an Act of Parliament in 1965. The CPP is administered by the Government of Canada and the participating provinces.
The CPP began operations in 1966. It is a compulsory and contributory social insurance program operating in all parts of Canada except Quebec, which operates the Quebec Pension Plan (QPP), a comparable program. The CPP’s objective is to provide a measure of protection to workers and their families against the loss of earnings due to retirement, disability or death. The CPP is financed by contributions and investment returns. Employers and employees pay contributions equally to the CPP. Self-employed workers pay the full amount.
The Minister of Families, Children and Social Development is responsible for the administration of the CPP, under the Canada Pension Plan; the Minister of National Revenue is responsible for collecting contributions. The Minister of Finance and his provincial counterparts are responsible for setting CPP contribution rates, pension and benefit levels and funding policy. The CPP Investment Board (CPPIB) is responsible for managing the amounts that are being transferred under section 108.1 of the Canada Pension Plan. It acts in the best interests of the beneficiaries and contributors under the Canada Pension Plan.
In accordance with the Canada Pension Plan, the financial activities of the CPP are recorded in the CPP Account (Note 3). The financial transactions affecting the Account are governed by the Canada Pension Plan and its regulations. The CPP’s investments are held by the CPPIB. The CPPIB was established pursuant to the Canada Pension Plan Investment Board Act (CPPIB Act). The CPPIB is a federal Crown corporation and all of its shares are owned by Her Majesty the Queen in right of Canada.
The CPPIB’s transactions are governed by the CPPIB Act and its accompanying regulations. The CPPIB’s assets are to be invested with a view to achieving a maximum rate of return without undue risk of loss, with regard to the factors that may affect the funding of the CPP and its ability to meet its financial obligations on any given business day.
The CPPIB and its wholly-owned subsidiaries are exempt from Part I income tax under paragraphs 149(1)(d) and 149 (1)(d.2) of the Income Tax Act (Canada) on the basis that all of the shares of the CPPIB and its subsidiaries are owned by Her Majesty the Queen in right of Canada or by a corporation whose shares are owned by Her Majesty the Queen in right of Canada, respectively.
The CPPIB is designed to operate at arm’s length from the government. It is required to be accountable to the public, Parliament (through the federal Minister of Finance) and the provinces. It provides regular reports of its activities and the results achieved. The financial statements of the CPPIB are audited annually by an external firm and are included in its annual report.
As stated in the Canada Pension Plan and CPPIB Act, changes to these Acts require the approval of at least two-thirds of the provinces that have, in the aggregate, not less than two-thirds of the population of all included provinces.
(b) Pensions and benefits
Retirement pensions – A retirement pension is payable to CPP contributors at age 60 or older, according to the provisions of the Canada Pension Plan. The monthly amount is equal to 25 per cent of the contributor’s average monthly pensionable earnings during the pensionable period. The amount is reduced or increased depending upon whether the contributor applies for a retirement pension before or after age 65. The maximum new monthly pension payable at age 65 in 2016 is $1,092.50 (2015 – $1,065.00).
Post-retirement benefits – A post-retirement benefit (PRB) pension is payable to each retirement pension recipient who has continued to work and has made contributions to the PRB while between the ages of 60 and 70, according to provisions of Bill C-51 of 2009. As of January 1, 2012, Canadians working outside Quebec who receive CPP or RRQ retirement benefits began making contributions to the PRB. Contributions are mandatory for CPP or RRQ retirement pension recipients aged 60-65, however, those between the ages of 65 and 70 can choose not to contribute. The PRB becomes payable the year after contributions are made. PRB payments to eligible contributors came into effect on January 1, 2013. The maximum new monthly PRB at age 65 in 2016 is $27.31 (2015 – $26.63).
Disability benefits – A disability benefit is payable to a contributor who is disabled, according to the provisions of the Canada Pension Plan. The amount of the disability benefit to be paid includes a flat-rate portion and an amount equal to 75 per cent of the earned retirement pension. The maximum new monthly disability benefit in 2016 is $1,290.81 (2015 – $1,264.59).
Survivor’s benefits – A survivor’s benefit is payable to the spouse or common-law partner (the beneficiary) of a deceased contributor, according to the provisions of the Canada Pension Plan. For a beneficiary under the age of 65, the benefit consists of a flat-rate portion and an amount equal to 37.5 per cent of the deceased contributor’s earned retirement pension. A beneficiary between the ages of 35 and 45 who is not disabled or who has no dependent children receives reduced benefits. For beneficiaries aged 65 and over, the benefit is equal to 60 per cent of the retirement pension granted to the deceased contributor. The maximum new monthly benefit payable to a beneficiary in 2016 is $655.50 (2015 – $639.00).

Public Accounts of Canada, 2015–2016
Interest-bearing debt 6 . 65
Canada Pension Plan—continued
Notes to consolidated financial statements for the year ended March 31, 2016—continued
Disabled contributor’s child and orphan benefits – According to the provisions of the Canada Pension Plan, each child of a contributor who is receiving disability benefits or a child of a deceased contributor is entitled to a benefit as long as the child is under the age of 18, or is between the ages of 18 and 25 and attending school full-time. The flat-rate monthly benefit in 2016 is $237.69 (2015 – $234.87).
Death benefits – According to the provisions of the Canada Pension Plan, a death benefit is a one-time payment to, or on behalf of, the estate of a contributor. The death benefit is a lump-sum payment that amounts to six times the amount of the deceased contributor’s monthly retirement pension, up to a maximum, in 2016 is $2,500.00 (2015 – $2,500.00).
Pensions and benefits indexation – As required by the Canada Pension Plan, pensions and benefits are indexed annually based on the Consumer Price Index for Canada. The rate of indexation for 2016 is 1.2 per cent (2015 – 1.8 per cent).
2. Significant accounting policies
(a) Basis of accounting
These financial statements have been prepared in accordance with the significant accounting policies described below in compliance with the Canada Pension Plan. The financial statements are presented on a consolidated basis to include the accounts of the CPP and the CPPIB and include a consolidated statement of financial position, a consolidated statement of operations, a consolidated statement of changes in financial assets available for benefit payments and a consolidated statement of cash flow.
The CPP, which is managed by both the Government of Canada and participating provinces, is not considered to be part of the reporting entity of the Government of Canada. Accordingly, its financial activities are not consolidated with those of the Government.
(b) International Financial Reporting Standards
The CPPIB, which is a significant component of the CPP consolidated financial statements, adopted International Financial Reporting Standards (IFRS) as of April 1, 2014. While there is no impact on financial assets available for benefit payments and net increase in assets available for benefit payments as a result of CPPIB’s IFRS adoption, CPPIB’s incremental financial statement disclosures related to investments, investment receivables and investment liabilities is supplementary information to the requirements of the Canada Pension Plan.
(c) Financial instruments
The CPP, through CPPIB, measures its investments, investment receivables and investment liabilities at fair value.
The investments and investment receivables are measured at fair value on the basis that they are part of a portfolio managed and evaluated on a fair value basis in accordance with investment strategies and risk management of CPPIB.
Investment liabilities are measured at fair value upon meeting the following criteria:
– It is acquired or incurred principally for the purpose of selling or repurchasing it in the near term;
– On initial recognition it is part of a portfolio of identified financial instruments that are managed together and for which there is evidence of a recent actual pattern of short-term profit taking; or
– It is a derivative, except for a derivative that is a financial guarantee contract or a designated and effective hedging instrument.
The CPP, through the CPPIB, recognizes investments, investment receivables and investment liabilities when, and only when, it becomes a party to the contractual provisions of the instrument. In addition, these are recorded on a trade date basis.
Investments and investment receivables are derecognized when the contractual rights to receive the cash flows expire or where the CPP, through CPPIB, has transferred the asset and substantially all the risks and rewards of the asset or no longer retains control over the asset. Investment liabilities are derecognized by CPP, through CPPIB, when the obligation under the liabilities is discharged, cancelled or expires.
Upon initial recognition, investments, investment receivables and investment liabilities are measured at fair value. Subsequent changes in the fair value are recorded as unrealized gain (loss) on investments and included in net investment income (loss), along with the interest and dividend income from such financial instruments.

Public Accounts of Canada, 2015–2016
6 . 66 Interest-bearing debt
Canada Pension Plan—continued
Notes to consolidated financial statements for the year ended March 31, 2016—continued
(d) Valuation of investments, investment receivables and investment liabilities
Investments, investment receivables and investment liabilities are recorded on a trade date basis and are stated at fair value. Fair value is an estimate of the amount of consideration that would be agreed upon in an arm’s length transaction between knowledgeable, willing parties who are under no compulsion to act.
In an active market, fair value is best evidenced by an independent quoted market price. In the absence of an active market, fair value is determined by valuation techniques that make maximum use of inputs observed from markets. These valuation techniques include using recent arm’s length market transactions, if available, or current fair value of another investment that is substantially the same, discounted cash flow analysis, option pricing models and other accepted industry valuation methods, that may include the use of estimates made by management, appraisers or both where significant judgment is required. By using valuation methods based on reasonable alternative assumptions, different fair values could result. CPP, through CPPIB’s management, has determined that the potential impact on fair values using these reasonable alternative assumptions would not be significant.
(e) Contributions
Contributions include CPP contributions earned for the year. The Canada Revenue Agency (CRA) collects contributions and measures them using the assessment of tax returns. In determining the amount of contributions earned for the year, the CRA considers cash received and contributions assessed, and makes an estimate for contributions related to tax returns not yet assessed. This estimate is subject to review. Adjustments, if any, are recorded as contributions in the year they are known.
(f) Investment income
Income from investments includes realized gains and losses from investments, changes in unrealized gains and losses on investments, dividend income and interest income. Dividend income is recognized on the ex-dividend date, which is when the right to receive the dividend has been established. Interest income is recognized using the effective interest rate method.
(g) Transaction costs
Transaction costs are incremental costs that are directly attributable to the acquisition or disposal of an investment. Transaction costs are expensed as incurred and included in net investment income (loss).
(h) Investment management fees
Investment management fees, which include hedge fund performance fees, are paid to investment managers for externally managed investments. Investment management fees are expensed as incurred and included in net investment income (loss).
(i) Securities purchased under reverse repurchase agreements and sold under repurchase agreements
Securities purchased under reverse repurchase agreements represent the purchase of securities effected with a simultaneous agreement to sell them back at a specified price at a specified future date and are accounted for as an investment receivable. These securities are not recognized as an investment of the CPP, through the CPPIB. The fair value of securities to be resold under these reverse repurchase agreements is monitored and additional collateral is obtained, when appropriate, to protect against credit exposure. In the event of counterparty default, the CPP, through the CPPIB, has the right to liquidate the collateral held.
Securities sold under repurchase agreements are accounted for as collateralized borrowing because they represent the sale of securities with a simultaneous agreement to buy them back at a specified price at a specified future date. The securities sold continue to be recognized as an investment of the CPP, through the CPPIB, with any changes in fair value recorded as net gain (loss) on investments and included in net investment income (loss). Interest earned on reverse repurchase agreements and interest incurred on repurchase agreements is included in net investment income (loss) (refer to Note 10).
(j) Securities sold short
Securities sold short represent securities that are sold, but not owned, by the CPP, through the CPPIB. The CPP, through the CPPIB, has an obligation to cover these short positions, which are accounted for as an investment liability based on the fair value of the securities sold. Collateral is pledged to the counterparty, when appropriate (refer to Note 7). Interest and dividend expense on securities sold short are included in net investment income (loss) (refer to Note 10).

Public Accounts of Canada, 2015–2016
Interest-bearing debt 6 . 67
Canada Pension Plan—continued
Notes to consolidated financial statements for the year ended March 31, 2016—continued
(k) Translation of foreign currencies
Transactions, including purchases and sales of investments, income and expenses, are translated at the rate of exchange prevailing on the date of the transaction. Monetary assets and liabilities denominated in foreign currencies are translated into Canadian dollars at exchange rates prevailing on the year-end date. Non- monetary items that are measured in terms of historical cost in a foreign currency are translated using the exchange rates as at the dates of the initial transactions.
Foreign currency transaction gains and losses on financial instruments are included in net investment income (loss) (refer to Note 10).
(l) Pensions and benefits
Pensions and benefits expenses are recorded when incurred or reasonably estimated.
(m) Tax deductions due to the Canada Revenue Agency
Tax deductions due to the CRA consist primarily of voluntary and non-resident taxes withheld from pensions and benefit payments to CPP beneficiaries (refer to Note 8).
(n) Net overpayments
Net overpayments comprise overpayments of pensions and benefits that were established during the year less remissions of debts granted.
(o) Operating expenses
Operating expenses are recorded as incurred.
(p) Other claims and legal actions
The CPP records an allowance for claims and legal proceedings when it is likely that there will be a future payment and a reasonable estimate can be made.
(q) Measurement uncertainty
The preparation of consolidated financial statements in accordance with the Canada Pension Plan requires management to make certain estimates, judgments and assumptions that affect the reported values of assets and liabilities as at the date of the consolidated financial statements and revenues and expenses during the reporting period. Estimates are based on the best information available at the time of preparation of the consolidated financial statements and are reviewed annually to reflect new information as it becomes available. Significant estimates and judgments are required principally in determining the reported estimated contributions, allowance for doubtful accounts, contingent liabilities, actuarial obligation in respect of benefits and valuation of financial instruments which are not actively traded. Measurement uncertainty exists in these consolidated financial statements. Actual results could significantly differ from those estimates.
(r) Future changes in accounting standards
The CPP is currently analyzing the impact of these new sections relevant to the consolidated financial statements:
Related party disclosures, effective date April 1, 2017
This new section PS 2200 defines a related party and establishes disclosures required for related party transactions. Disclosure of information about related party transactions and the relationship underlying them is required when they have occurred at a value different from that which would have been arrived at if the parties were unrelated, and they have, or could have, a material financial effect on the financial statements.
Assets, effective date April 1, 2017
This new section PS 3210 provides guidance for applying the definition of assets and establishes the general disclosure requirements.
Contingent assets, effective date April 1, 2017
This new section PS 3320 defines contingent assets as possible assets arising from existing conditions or situations involving uncertainty. That uncertainty will ultimately be resolved when one or more future events not wholly within the public sector entity's control occurs or fails to occur. Resolution of the uncertainty will confirm the existence or non-existence of an asset.
Contractual rights, effective date April 1, 2017
This new section PS 3380 defines and establishes disclosure standards on contractual rights which are rights to economic resources arising from contracts or agreements that will result in both an asset and revenue in the future.

Public Accounts of Canada, 2015–2016
6 . 68 Interest-bearing debt
Canada Pension Plan—continued
Notes to consolidated financial statements for the year ended March 31, 2016—continued
Inter-entity transactions, effective date April 1, 2017
This new section PS 3420 establishes how to account for and report transactions between public sector entities that comprise a government reporting entity from both a provider and recipient perspective.
Restructuring transactions, effective date April 1, 2018
This new section PS 3430 introduces accounting guidance for both transferors and recipients of a restructuring transaction which is a transfer of an integrated set of assets and/or liabilities, together with related program or operating responsibilities without consideration based primarily on the fair value of the individual assets and liabilities transferred.
Financial instruments, effective date April 1, 2019
i. Financial instruments
The new section PS 3450 (financial instruments) establishes standards for recognizing and measuring financial assets, financial liabilities and non-financial derivatives. Items within the scope of the section are assigned to one of two measurement categories: fair value and cost or amortized cost. Until an item is derecognized, gains and losses arising as a result of fair value remeasurement will be reported in the consolidated statement of remeasurement gains and losses.
ii. Foreign currency translation
The revised section PS 2601 (foreign currency translation) requires that remeasurement gains and losses on foreign currency translation be reported in a new consolidated statement of remeasurement gains and losses until such time as the financial instrument is derecognized, at which point, the accumulated remeasurement gain and loss is recognized in the consolidated statement of operations.
iii. Financial statement presentation
The revised section PS 1201 (financial statements presentation) establishes the general principles and information standards applicable to consolidated financial statements. It requires that remeasurement gains and losses be reported in a new statement. Also, the assets available for benefit payments will be presented as the total of the net increase in assets available for benefit payments for the year and the accumulated remeasurement gains and losses.
Portfolio investments, effective date April 1, 2019
This section PS 3041 establishes standards on how to account for and report portfolio investments in government financial statements.
3. Cash
Cash consists of the total cash held by the CPP Account and the CPPIB. The CPP Account was established in the accounts of Canada by the Canada Pension Plan to record the contributions, interest, pensions, benefits and operating expenses of the CPP. It also records the amounts transferred to or received from the CPPIB. As at March 31, 2016, the deposit with the Receiver General for Canada in the CPP Account is $35 million (2015 – $212 million) and the CPPIB’s cash is $60 million (2015 – $59 million) for a total of $95 million (2015 – $271 million).
4. Receivables
Receivables comprised the following:
(in millions of dollars)
2016 2015
Contributions ................................................................................................................................................................... 4,945 5,114 Quebec Pension Plan ....................................................................................................................................................... 91 162 Beneficiaries
Balance of pensions and benefits overpayments ....................................................................................................... 192 169 Allowance for doubtful accounts ............................................................................................................................... (135) (120)
Others ............................................................................................................................................................................... 7 –
5,100 5,325

Public Accounts of Canada, 2015–2016
Interest-bearing debt 6 . 69
Canada Pension Plan—continued
Notes to consolidated financial statements for the year ended March 31, 2016—continued
Contributions receivable represent the estimated amount to be collected from the CRA relating to contributions earned at year end and adjusted for tax returns not yet assessed. The amount includes an estimate that takes into consideration the number of contributors and the average contribution to be received, which is based on the average earning and the CPP contribution rate. On an annual basis, the model used to make the estimate is reviewed. The difference between the estimate and the actual amount has not been significant in the past.
The CPP has procedures to detect overpayments. During the year, overpayments totalling $102 million (2015 – $75 million) were established and debts totalling $5 million (2015 – $4 million) were forgiven as per the remission provisions of the Canada Pension Plan. A further $74 million (2015 – $49 million) was recovered through collection of payments and withholdings from beneficiaries.
5. Investment activities risk management
The CPP, through the investment activities carried out by the CPPIB, is exposed to a variety of financial risks. These risks include market risk, credit risk and liquidity risk. The CPPIB manages and mitigates financial risks through the Risk/Return Accountability Framework that is contained within the Risk Policy approved by the Board of Directors at least once every fiscal year. This policy contains risk limits and risk management provisions that govern investment decisions. It has been designed to achieve the mandate of the CPPIB, which is to invest its assets with a view to achieving a maximum rate of return, without undue risk of loss, having regard to the factors that may affect the funding of the CPP and the ability of the CPP to meet its financial obligations on any given business day.
Effective April 1, 2015, changes were made to the Risk/Return Accountability Framework. Upper and Lower Absolute Risk Limits and the Absolute Risk Operating Range are included within the Risk/Return Accountability Framework, and these govern the amount of total investment risk that CPPIB can take in the long term CPP Investment Portfolio. CPPIB monitors the absolute risk, the possible losses of value expressed in absolute dollar or percentage terms, in the CPP Investment Portfolio daily and reports risk exposures to the Board of Directors on at least a quarterly basis.
i. Market Risk: Market risk (including currency risk, interest rate risk and other price risk) is the risk that the fair value or future cash flows of an investment or investment liability will fluctuate because of changes in market prices and rates.
Currency Risk: The CPP, through the CPPIB, is exposed to currency risk through holdings of investments or investment liabilities in various currencies.
In Canadian dollars, the net underlying currency exposures, after allocating foreign currency derivatives, as at March 31, are as follows:
(in millions of dollars)
2016 2015
Currency Net exposure % of total Net exposure % of total
United States dollar .......................................................................... 138,624 61 116,292 59 Euro ................................................................................................... 29,697 13 30,955 16 British pound sterling ....................................................................... 16,245 7 12,595 6 Japanese yen ..................................................................................... 14,692 6 11,879 6 Australian dollar ............................................................................... 8,026 4 6,499 3 Chinese yuan ..................................................................................... 3,356 1 2,614 1 Hong Kong dollar ............................................................................. 2,592 1 2,425 1 Chilean peso...................................................................................... 2,042 1 1,855 1 Swiss franc ........................................................................................ 2,020 1 2,045 1 South Korean won ............................................................................ 1,886 1 1,792 1 Indian rupee ...................................................................................... 1,821 1 1,344 1 Brazilian real ..................................................................................... 1,309 1 1,404 1 Other ................................................................................................. 5,960 2 5,657 3
228,270 100 197,356 100

Public Accounts of Canada, 2015–2016
6 . 70 Interest-bearing debt
Canada Pension Plan—continued
Notes to consolidated financial statements for the year ended March 31, 2016—continued
As at March 31, 2016, with all other variables and underlying values held constant, a change in the value of the Canadian dollar against major foreign currencies by 5 per cent would result in an approximate increase (decrease) in the value of investments and investment liabilities as follows:
(in millions of dollars)
2016 2015
Change in investment value Change in investment value
Currency +5% -5% +5% -5%
United States dollar ........................................................................... (6,931) 6,931 (5,815) 5,815 Euro .................................................................................................... (1,485) 1,485 (1,548) 1,548 British pound sterling ........................................................................ (812) 812 (630) 630 Japanese yen ...................................................................................... (735) 735 (594) 594 Australian dollar ................................................................................ (401) 401 (325) 325 Chinese yuan ...................................................................................... (168) 168 (131) 131 Hong Kong dollar .............................................................................. (130) 130 (121) 121 Chilean peso....................................................................................... (102) 102 (93) 93 Swiss franc ......................................................................................... (101) 101 (102) 102 South Korean won ............................................................................. (94) 94 (89) 89 Indian rupee ....................................................................................... (91) 91 (67) 67 Brazilian real ...................................................................................... (66) 66 (70) 70 Other .................................................................................................. (298) 298 (283) 283
(11,414) 11,414 (9,868) 9,868
Interest Rate Risk: Interest rate risk is the risk that the fair value or future cash flows of an investment or investment-related liability will fluctuate because of changes in market interest rates.
Other Price Risk: Other price risk is the risk that the fair value or future cash flows of an investment will fluctuate because of changes in market prices arising primarily from equity price risk, commodity price risk and credit spread risk, whether those changes are caused by factors specific to the individual investment or factors affecting all securities traded in the market.
ii. Credit Risk: Credit risk is the risk of financial loss due to a counterparty failing to meet its contractual obligations, or a reduction in the value of the assets due to a decline in the credit quality of the borrower, counterparty, guarantor or the assets (collateral) supporting the credit exposure. The CPP’s, through the CPPIB, most significant exposure to credit risk is through its investment in debt securities, over-the-counter derivatives (as discussed in Note 6f) and guarantees. The carrying amounts of the investments are presented in Note 6 and guarantees are presented in Note 16c.
iii. Liquidity Risk: Liquidity risk is the risk of being unable to generate sufficient cash or its equivalent in a timely and cost-effective manner to meet pensions and benefit payments, investment commitments and investment liabilities as they come due. The CPP manages this risk through cash flow planning for both short-term and long-term requirements. The cash flow is prepared for a two-year period and updated on a weekly basis to inform CPPIB of the fund required by CPP to meet its financial obligations. Also, the CPP, through the CPPIB, supplements its management of liquidity risk through its ability to raise funds through the issuance of commercial paper and term debt and transacting in securities sold under repurchase agreements (refer to Note 6 and Note 7).
The CPPIB maintains $1.5 billion (2015 – $1.5 billion) of unsecured credit facilities to meet potential liquidity requirements. As at March 31, 2016, the total amount drawn on the credit facilities is $nil (2015 – $nil). The CPPIB also has the ability to readily dispose of certain investments that are traded in an active market. These include a liquid portfolio of publicly traded equities, money market securities and marketable bonds.
The CPPIB is also exposed to liquidity risk through its responsibility for providing cash management services to the CPP (refer to Note 18). In order to manage liquidity risk associated with this short-term cash management program, certain assets are segregated and managed separately. Liquidity risk is also managed by investing these assets in liquid money market instruments with the primary objective of ensuring that the CPP has the necessary liquidity to meet benefit payment obligations on any business day.

Public Accounts of Canada, 2015–2016
Interest-bearing debt 6 . 71
Canada Pension Plan—continued
Notes to consolidated financial statements for the year ended March 31, 2016—continued
6. Investments and investment liabilities
As stated in Note 1, the role of the CPPIB is to invest the assets with a view to achieving a maximum rate of return without undue risk of loss, with regard to the factors that may affect the funding of the CPP and the ability of the CPP to meet its financial obligations on any given business day. To achieve its mandate, the CPPIB has established investment policies in accordance with its regulations. These set out the manner in which their assets shall be invested and their financial risks managed and mitigated through the Risk/Return Accountability Framework.
The CPPIB’s investments are grouped by asset class based on the nature of the investment. The investments are as follows:
(in millions of dollars)
2016 2015
Equities
Canada ........................................................................................................................................................................ 7,100 8,798 Foreign developed markets ........................................................................................................................................ 113,480 116,040 Emerging markets ...................................................................................................................................................... 17,953 14,574
Total equities ................................................................................................................................................................. 138,533 139,412
Fixed income
Bonds ......................................................................................................................................................................... 73,061 65,642 Other debt ................................................................................................................................................................... 26,144 21,024 Money market securities ............................................................................................................................................ 16,732 17,740
Total fixed income ......................................................................................................................................................... 115,937 104,406
Absolute return strategies1 ........................................................................................................................................... 17,034 16,185
Real assets
Real estate .................................................................................................................................................................. 35,857 29,656 Infrastructure .............................................................................................................................................................. 20,373 15,013
Total real assets .............................................................................................................................................................. 56,230 44,669
Investment receivables
Securities purchased under reverse repurchase agreements ...................................................................................... 12,199 10,817 Accrued interest ......................................................................................................................................................... 1,161 928 Derivative receivables ................................................................................................................................................ 4,060 1,882 Dividends receivable .................................................................................................................................................. 165 182
Total investment receivables ....................................................................................................................................... 17,585 13,809
Total investments ........................................................................................................................................................... 345,319 318,481
Investment liabilities
Securities sold under repurchase agreements ............................................................................................................ (19,926) (15,779) Securities sold short ................................................................................................................................................... (27,371) (22,385) Debt financing liabilities ............................................................................................................................................ (15,568) (9,955) Derivative liabilities ................................................................................................................................................... (2,514) (2,428)
Total investment liabilities ............................................................................................................................................ (65,379) (50,547)
Amounts receivable from pending trades ........................................................................................................................ 2,627 2,908 Amounts payable from pending trades ............................................................................................................................ (3,431) (6,087)
Net investments2 ............................................................................................................................................................. 279,136 264,755
1 Includes only investments in funds. 2 The total of net investments not actively traded as at March 31, 2016 is $190,989 million (2015 – $166,210 million).
Public Accounts of Canada, 2015–2016
6 . 72 Interest-bearing debt
Canada Pension Plan—continued
Notes to consolidated financial statements for the year ended March 31, 2016—continued
(a) Equities
Equities consist of public and private investments in each of these three markets: Canadian, foreign developed and emerging.
i. Public equity investments are made directly or through funds, including hedge funds. As at March 31, 2016, public equities included fund investments with a fair value of $7,807 million (2015 – $8,541 million). Fair value for fund investments is generally based on the net asset value as reported by the external administrators or managers of the funds.
ii. Private equity investments are generally made directly or through ownership in limited partnership funds. As at March 31, 2016, private equities included direct investments with a fair value of $25,161 million (2015 – $15,124 million). The fair value for investments held directly is primarily determined using earnings multiples of comparable publicly traded companies or discounted cash flows. Recent market transactions, where available, are also used. In the case of investments held through a limited partnership fund, fair value is generally determined based on relevant information reported by the general partner using similar accepted industry valuation methods.
(b) Fixed income
i. Bonds consist of non-marketable and marketable bonds.
The non-marketable bonds issued by the provinces prior to 1998 have rollover provisions attached to them. In lieu of exercising its statutory rollover right, agreements between CPPIB and the provinces permit each province to repay the bond and concurrently cause CPPIB to purchase a replacement bond or bonds in a total principal amount not exceeding the principal amount of the maturing security for a term of not less than five years and not more than 30 years, at the prevailing yield existing at the time for that province. Such replacement bonds contain rollover provisions that permit the issuer, at its option, to roll over the bond for successive terms of not less than five years and subject in all cases to the maximum 30 years outside the maturity date. The replacement bonds are also redeemable before maturity at the option of the issuers. Fair value for non-marketable Canadian provincial government bonds is calculated using discounted cash flows. In the case of marketable bonds, including bond short positions, fair value is based on quoted prices or calculated using discounted cash flows.
ii. Other debt consists of investments in direct private debt, asset-backed securities, intellectual property, royalties, distressed mortgage funds, private debt funds and hedge funds. Fair value for direct investments in private debt and asset-backed securities is based on quoted market prices or broker quotes or recent market transactions, if available. Where the market price is not available, fair value is calculated using discounted cash flows.
iii. Money market securities consist of cash, term deposits, treasury bills, commercial paper and floating rate notes. Fair value is determined using cost, which, together with accrued interest income, approximates fair value due to the short-term or floating rate nature of these securities.
(c) Absolute return strategies
Absolute return strategies consist of investments in hedge funds and internally managed portfolios whose objective is to generate positive returns regardless of market conditions, that is, returns with a low correlation to broad market indices. The underlying securities of the funds and the internally managed portfolios could include, but are not limited to, equities, fixed income securities and derivatives. Fair value for fund investments is generally based on the net asset value as reported by the external administrators or managers of the funds.
(d) Real assets
i. The CPPIB obtains exposure to real estate through direct investments in privately held real estate and real estate funds.
Private real estate investments are managed on behalf of the CPPIB by investment managers primarily through co-ownership arrangements. As at March 31, 2016, real estate investments include assets of $35,857 million (2015 – $29,656 million).
ii. Infrastructure investments are generally made directly. As at March 31, 2016, infrastructure includes direct investments with a fair value of $20,335 million (2015 – $14,956 million) and $38 million in fund investments (2015 – $57 million).
Fair value for private real estate investments and infrastructure investments is primarily determined using discounted cash flows. Fair value for real estate funds and infrastructure funds are generally based on the net asset value as reported by the external managers of the funds.
(e) Securities purchased under reverse repurchase agreements and sold under repurchase agreements
Reverse repurchase and repurchase agreements are carried at the amounts at which the securities were initially acquired or sold, which, together with accrued interest income or expense, approximates fair value due to the short-term nature of these securities.

Public Accounts of Canada, 2015–2016
Interest-bearing debt 6 . 73
Canada Pension Plan—continued
Notes to consolidated financial statements for the year ended March 31, 2016—continued
The terms to maturity of the securities purchased under reverse repurchase agreements, as at March 31, 2016, are as follows: within 1 year, $12,199 million (2015 – $10,817 million), and 1 year to over 10 years, $nil (2015 – $nil).
The terms to maturity of the undiscounted value of the securities sold under repurchase agreements, as at March 31, 2016, are as follows: within 1 year, $19,919 million (2015 – $15,780 million), and 1 year to over 10 years, $nil (2015 – $nil).
(f) Derivative contracts
A derivative contract is a financial contract, the value of which is derived from the value of underlying assets, indices, interest rates, currency exchange rates or other market-based factors. Derivatives are transacted through regulated exchanges or negotiated in over-the-counter markets. The CPPIB uses different types of derivative instruments, which include futures and forwards, swaps, options and warrants.
Notional amounts of derivative contracts represent the contractual amounts to which a rate or price is applied for computing the cash flows to be exchanged. The notional amounts are used to determine the gains/losses and fair value of the contracts. They are not recorded as assets or liabilities on the consolidated statement of financial position. Notional amounts do not necessarily represent the amount of potential market risk or credit risk arising from a derivative contract.
The fair value of these contracts is reported as derivative receivables and derivative liabilities on the schedule of investments as shown above. Fair value for exchange-traded derivatives, which includes futures, options and warrants, is based on quoted market prices. Fair value for over-the-counter derivatives, which includes swaps, options, forward contracts and warrants, is determined based on valuation techniques such as option pricing models, discounted cash flows and consensus pricing from independent brokers and/or third-party vendors.
The CPPIB uses derivatives to generate value-added investment returns and to manage or adjust exposures to interest rate, currency, credit and other market risks without directly purchasing or selling the underlying instrument.
(g) Securities sold short
As at March 31, 2016, securities sold short of $27,371 million (2015 – $22,385 million) are considered repayable within one year based on the earliest period in which the counterparty could request payment under certain conditions.
(h) Debt financing liabilities
Debt financing liabilities consist of commercial paper payable and term debt. Commercial paper payable is recorded at the amount originally issued, which, together with accrued interest expense, approximate fair value due to the short-term nature of these liabilities. Fair value for term debt is based on quoted market prices.
The terms to maturity of the undiscounted value of the commercial paper payable as at March 31, 2016, are as follows: within 1 year, $13,425 million (2015 – $9,959 million), and 1 year to over 10 years, $nil (2015 – $nil). The terms to maturity of the undiscounted value of the term debt as at March 31, 2016, are as follows: within 1 year, $nil (2015 – $nil), 1 year to 5 years, $2,149 million (2015 – $nil), and 6 years to over 10 years, $nil (2015 – $nil).
7. Collateral
Collateral transactions are conducted to support CPPIB’s investment activities under the terms and conditions that are common and customary to collateral arrangements. The net fair value of collateral held and pledged as at March 31 are as follows:
(in millions of dollars)
2016 2015
Assets held as collateral on:
Reverse repurchase agreements1 ................................................................................................................................ 10,289 10,812 Over-the-counter derivative transactions1 ................................................................................................................. 1,653 33 Other debt¹ ................................................................................................................................................................. 887 1,195
Assets pledged as collateral on: Repurchase agreements .............................................................................................................................................. (18,858) (15,792) Securities sold short ................................................................................................................................................... (23,508) (14,938) Over-the-counter derivative transactions ................................................................................................................... (50) (266) Debt on private real estate properties ........................................................................................................................ (3,624) (3,266)
(33,211) (22,222)
1 The fair value of the collateral held that may be sold or repledged as at March 31, 2016 is $12,302 million (2015 – $12,009 million). The fair value of collateral sold or repledged as at March 31, 2016 is $7,900 million (2015 – $10,368 million).
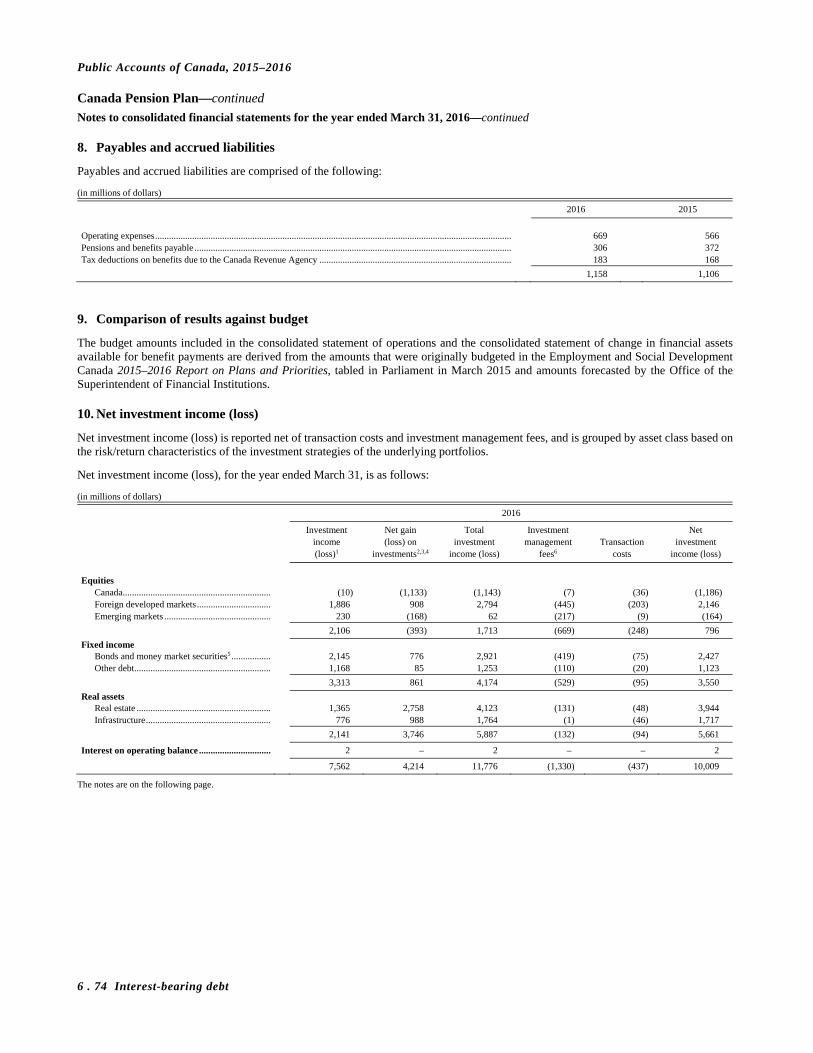
Public Accounts of Canada, 2015–2016
6 . 74 Interest-bearing debt
Canada Pension Plan—continued
Notes to consolidated financial statements for the year ended March 31, 2016—continued
8. Payables and accrued liabilities
Payables and accrued liabilities are comprised of the following:
(in millions of dollars)
2016 2015
Operating expenses .......................................................................................................................................................... 669 566 Pensions and benefits payable ......................................................................................................................................... 306 372 Tax deductions on benefits due to the Canada Revenue Agency ................................................................................... 183 168
1,158 1,106
9. Comparison of results against budget
The budget amounts included in the consolidated statement of operations and the consolidated statement of change in financial assets available for benefit payments are derived from the amounts that were originally budgeted in the Employment and Social Development Canada 2015–2016 Report on Plans and Priorities, tabled in Parliament in March 2015 and amounts forecasted by the Office of the Superintendent of Financial Institutions.
10. Net investment income (loss)
Net investment income (loss) is reported net of transaction costs and investment management fees, and is grouped by asset class based on the risk/return characteristics of the investment strategies of the underlying portfolios.
Net investment income (loss), for the year ended March 31, is as follows:
(in millions of dollars)
2016
Investment Net gain Total Investment Net income (loss) on investment management Transaction investment (loss)1 investments2,3,4 income (loss) fees6 costs income (loss)
Equities
Canada ................................................................ (10) (1,133) (1,143) (7) (36) (1,186) Foreign developed markets ................................ 1,886 908 2,794 (445) (203) 2,146 Emerging markets .............................................. 230 (168) 62 (217) (9) (164)
2,106 (393) 1,713 (669) (248) 796
Fixed income Bonds and money market securities5 ................. 2,145 776 2,921 (419) (75) 2,427 Other debt ........................................................... 1,168 85 1,253 (110) (20) 1,123
3,313 861 4,174 (529) (95) 3,550
Real assets Real estate .......................................................... 1,365 2,758 4,123 (131) (48) 3,944 Infrastructure ...................................................... 776 988 1,764 (1) (46) 1,717
2,141 3,746 5,887 (132) (94) 5,661
Interest on operating balance ............................... 2 – 2 – – 2
7,562 4,214 11,776 (1,330) (437) 10,009
The notes are on the following page.
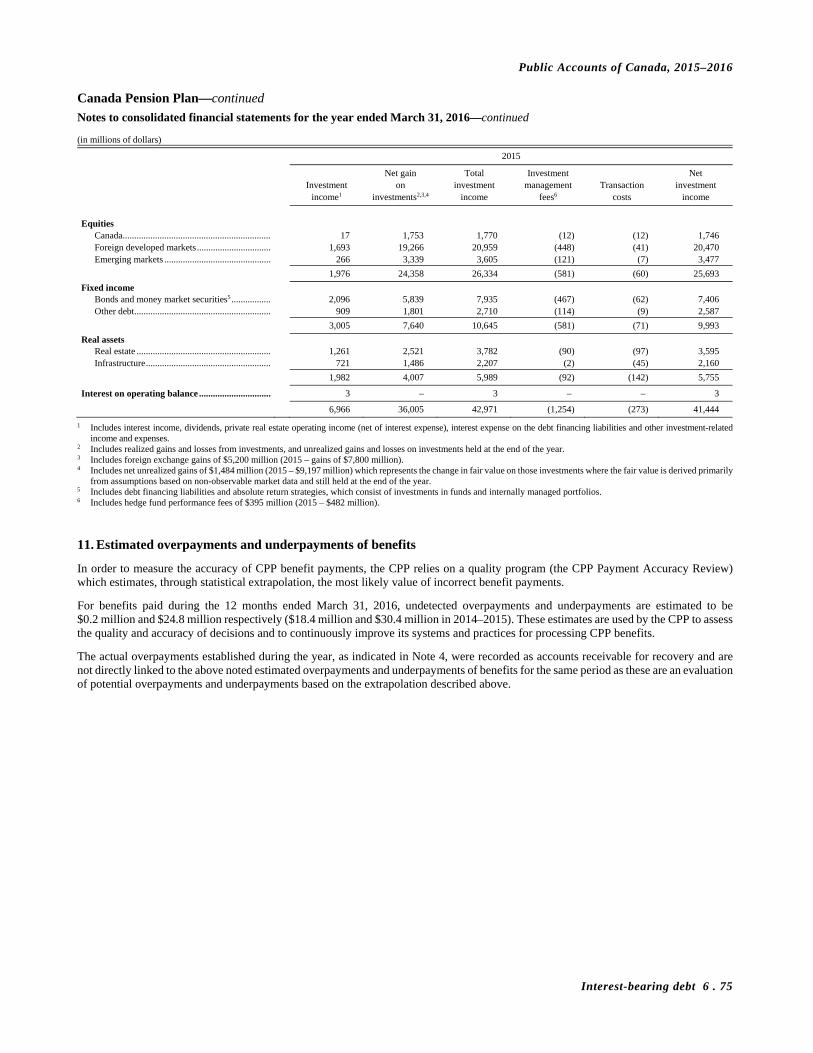
Public Accounts of Canada, 2015–2016
Interest-bearing debt 6 . 75
Canada Pension Plan—continued
Notes to consolidated financial statements for the year ended March 31, 2016—continued
(in millions of dollars)
2015
Net gain Total Investment Net Investment on investment management Transaction investment income1 investments2,3,4 income fees6 costs income
Equities
Canada ................................................................ 17 1,753 1,770 (12) (12) 1,746 Foreign developed markets ................................ 1,693 19,266 20,959 (448) (41) 20,470 Emerging markets .............................................. 266 3,339 3,605 (121) (7) 3,477
1,976 24,358 26,334 (581) (60) 25,693
Fixed income Bonds and money market securities5 ................. 2,096 5,839 7,935 (467) (62) 7,406 Other debt ........................................................... 909 1,801 2,710 (114) (9) 2,587
3,005 7,640 10,645 (581) (71) 9,993
Real assets Real estate .......................................................... 1,261 2,521 3,782 (90) (97) 3,595 Infrastructure ...................................................... 721 1,486 2,207 (2) (45) 2,160
1,982 4,007 5,989 (92) (142) 5,755
Interest on operating balance ............................... 3 – 3 – – 3
6,966 36,005 42,971 (1,254) (273) 41,444
1 Includes interest income, dividends, private real estate operating income (net of interest expense), interest expense on the debt financing liabilities and other investment-related income and expenses.
2 Includes realized gains and losses from investments, and unrealized gains and losses on investments held at the end of the year. 3 Includes foreign exchange gains of $5,200 million (2015 – gains of $7,800 million). 4 Includes net unrealized gains of $1,484 million (2015 – $9,197 million) which represents the change in fair value on those investments where the fair value is derived primarily
from assumptions based on non-observable market data and still held at the end of the year. 5 Includes debt financing liabilities and absolute return strategies, which consist of investments in funds and internally managed portfolios. 6 Includes hedge fund performance fees of $395 million (2015 – $482 million).
11. Estimated overpayments and underpayments of benefits
In order to measure the accuracy of CPP benefit payments, the CPP relies on a quality program (the CPP Payment Accuracy Review) which estimates, through statistical extrapolation, the most likely value of incorrect benefit payments.
For benefits paid during the 12 months ended March 31, 2016, undetected overpayments and underpayments are estimated to be $0.2 million and $24.8 million respectively ($18.4 million and $30.4 million in 2014–2015). These estimates are used by the CPP to assess the quality and accuracy of decisions and to continuously improve its systems and practices for processing CPP benefits.
The actual overpayments established during the year, as indicated in Note 4, were recorded as accounts receivable for recovery and are not directly linked to the above noted estimated overpayments and underpayments of benefits for the same period as these are an evaluation of potential overpayments and underpayments based on the extrapolation described above.

Public Accounts of Canada, 2015–2016
6 . 76 Interest-bearing debt
Canada Pension Plan—continued
Notes to consolidated financial statements for the year ended March 31, 2016—continued
12. Operating expenses
CPP’s operating expenses are composed of costs incurred by various Government of Canada (GoC) departments (refer to Note 17) for the administration of the CPP’s activities as well as the CPPIB’s operating expenses.
(in millions of dollars)
2016 2015
GoC CPPIB Total GoC CPPIB Total
Personnel related costs, including the Health Insurance Plan ........................ 246 594 840 255 558 813 Collection of contributions and investigation services .................................. 175 – 175 173 – 173 Operational business services ......................................................................... – 104 104 – 89 89 Program policy and delivery, accommodation and corporate services .......... 92 – 92 88 – 88 Professional and consulting fees .................................................................... – 51 51 – 61 61 Premises .......................................................................................................... – 39 39 – 28 28 Amortization of premises and equipment....................................................... – 30 30 – 25 25 Support services of the Social Security Tribunal ........................................... 17 – 17 7 – 7 Cheque issue and computer services .............................................................. 6 – 6 9 – 9 Others .............................................................................................................. 2 58 60 2 42 44
538 876 1,414 534 803 1,337
13. Financial sustainability of the Canada Pension Plan
The CPP is financed by contributions and investment returns. Employers and employees pay contributions equally to the CPP, and self-employed workers pay the full amount. At the time of the Plan’s inception in 1965, the demographic and economic conditions made pay-as-you-go financing appropriate. The pay-as-you-go financing, along with a small reserve equivalent to about two years’ worth of expenditures, meant the pensions and benefits for one generation would be paid largely from the contributions of later generations. However, changing demographics and economic conditions over time led to increasing CPP costs, and by the mid-1990s the fall in the level of assets of the CPP resulted in a portion of the reserve being required to cover expenditures. Therefore, for the CPP to remain unchanged, the contribution rate would have needed to be increased regularly.
As a result, the CPP was amended in 1997 to restore its long-term financial sustainability and to improve fairness across generations by changing its financing approach from a pay-as-you-go basis to a form of partial funding called steady-state funding, along with incremental full funding rules for new or enhanced benefits, and reducing the growth of benefits over the long term. In addition, a new investment policy was put in place, along with the creation of the CPPIB. Moreover, the statutory periodic reviews of the Plan by the federal and provincial financial ministers were increased from once every five years to every three years.
Key among the 1997 changes was the introduction of self-sustaining provisions to safeguard the Plan: in the event that the projected minimum contribution rate is greater than the legislated contribution rate and no recommendations are made by the Finance Ministers to correct the situation, the contribution rate would automatically increase and the indexation of the current benefits would be suspended.
The federal, provincial and territorial finance ministers took additional steps in 1999 to strengthen the transparency and accountability of actuarial reporting on the CPP by endorsing regular independent peer reviews of actuarial reports and consultations by the Chief Actuary with experts on the assumptions to be used in the actuarial reports.
The most recent triennial report, the Twenty-sixth Actuarial Report on the Canada Pension Plan as at December 31, 2012, was tabled in Parliament on December 3, 2013. The next triennial actuarial report as at December 31, 2015, is expected to be tabled by December 2016. According to the Twenty-sixth Actuarial Report, under the current legislated contribution rate of 9.9 per cent, the Plan’s assets are expected to increase significantly, with the asset/expenditure ratio growing from 4.7 in 2013 to about 5.4 by 2025 and to 5.9 by 2075 assuming all assumptions are realized.

Public Accounts of Canada, 2015–2016
Interest-bearing debt 6 . 77
Canada Pension Plan—continued
Notes to consolidated financial statements for the year ended March 31, 2016—continued
A number of assumptions were used in the Twenty-sixth Actuarial Report to project the CPP’s revenues and expenditures over the long projection period of 75 years, and to determine the minimum contribution rate. The assumptions provided in the table below represent the best estimates according to the Chief Actuary’s professional judgment relating to demographic, economic, and other factors; and have been peer reviewed by an independent expert actuary’s panel.
As at December 31, 20121 As at December 31, 20091
Males Females Males Females
Canadian life expectancy
at birth in 2013 (2009 – in 2010) ............................................................... 86.1 years 89.1 years 85.4 years 88.3 years at age 65 in 2013 (2009 – in 2010) ............................................................ 20.9 years 23.3 years 20.2 years 22.6 years
Retirement rates for cohort at age 60 .............................................................. 34% (2016+) 38% (2016+) 38% (2016+) 41% (2016+) CPP disability incidence rates (per 1,000 eligible) ......................................... 3.30 (2017+) 3.75 (2017+) 3.40 (2015+)2 3.79 (2015+)2
Total fertility rate ............................................................................................. 1.65 (2015+) 1.65 (2015+) Net migration rate ............................................................................................ 0.60% of population for 2017+ 0.58% of population for 2023+ Participation rate (age group 15-69) ................................................................ 76.8% (2030) 75.2% (2030) Employment rate (age group 15-69) ................................................................ 72.1% (2030) 70.6% (2030) Unemployment rate ......................................................................................... 6.0% (2023+) 6.1% (2022+) Rate of increase in prices ................................................................................. 2.2% (2021+) 2.3% (2019+) Real-wage increase .......................................................................................... 1.2% (2020+) 1.3% (2019+) Real rate of return ............................................................................................ 4.0% (2019+) 4.0% (2017+)3
1 Assumptions are expected to gradually converge to their ultimate value. Years in the brackets indicate when the ultimate assumptions value is expected to be reached. 2 The ultimate disability incidence rates assumption of the 25th CPP Actuarial Report has been adjusted based on the 2012 eligible population in order to compare with the
assumption for this 26th CPP Actuarial Report on the same basis. 3 For the 26th CPP Actuarial Report, the real rate of return assumption is net of all investment expenses, including CPPIB operating expenses. On a comparable basis, the
ultimate real rate of return assumption of the 25th CPP Actuarial Report would be restated as 3.9 per cent to reflect this improvement in the methodology.
In the Twenty-sixth Actuarial Report, the minimum contribution rate, which is the lowest rate to sustain the CPP, was determined to be 9.84 per cent of contributory earnings for the year 2016 and thereafter (9.86 per cent before 2023 and 9.85 per cent for the year 2023 and thereafter in the Twenty-fifth Actuarial Report).
The CPP assets available for benefit payments represent the funds accumulated for the payment of pensions, benefits, and operating expenses, i.e. total CPP expenditures. The partial funding nature of the CPP means that contributions as opposed to these assets are the main source for financing CPP expenditures. The Twenty-sixth Actuarial Report confirms that, on the basis of the assumptions selected, the current legislated combined employer-employee contribution rate of 9.9 per cent is and will continue to be sufficient to pay for future expenditures over the period 2013 to 2022. Thereafter, a portion of investment income (27 per cent in 2050) will be required to make up the difference between contributions and expenditures. Under the current legislated contribution rate of 9.9 per cent and the average expected nominal return on assets of 5.26 per cent, total assets available for benefit payments are expected to grow to $300 billion by the end of 2020.
As at March 31, 2016, the value of CPP assets available for benefit payments is $283.6 billion (2015 – $269.6 billion). This amount represents approximately 6.3 times the 2017 planned expenditures of $45.2 billion (2015 – 6.3 times the 2016 planned expenditures of $42.9 billion).
A variety of tests were performed to measure the sensitivity of the long-term projected financial position of the CPP to future changes in the demographic and economic environments. Key best-estimate demographic and economic assumptions were varied individually to measure the potential impact on the financial status of the CPP.

Public Accounts of Canada, 2015–2016
6 . 78 Interest-bearing debt
Canada Pension Plan—continued
Notes to consolidated financial statements for the year ended March 31, 2016—continued
The low-cost and high-cost alternatives for the three most sensitive assumptions are shown in the table below. In the case of mortality, the assumptions for the low-cost and high-cost alternatives were developed using a combination of confidence intervals and different long-term trajectories. In the case of real wage increase and real rate of return, these assumptions are defined as the upper and lower boundaries of the 80 per cent confidence intervals.
Low-cost Best-estimate High-cost
Mortality: Canadian life expectancy at age 65 in 2050 Males 20.7 Males 23.0 Males 25.6
with future improvements ......................................................... Females 22.9 Females 25.3 Females 27.7
Real wage increase ......................................................................... 1.9% 1.2% 0.4%
Real rate of return ........................................................................... 5.5% 4.0% 2.5%
Mortality is the most sensitive demographic assumption as it impacts the length of the benefit payment period. If male and female life expectancies at age 65 were to increase by approximately 2.5 years more than expected by 2050, the minimum contribution rate in 2016 and thereafter would increase to 10.22 per cent, well above the legislated rate of 9.9 per cent. On the other hand, if male and female life expectancies at age 65 were to be about 2.5 years lower than expected, the minimum contribution rate would decrease to 9.46 per cent.
The most sensitive economic assumptions are the real wage increase and the real rate of return on investments. The growth in real wage directly impacts the amount of future CPP contributions. If an ultimate real wage increase of 1.9 per cent is assumed for 2020 and thereafter, the minimum contribution rate would decrease to 9.26 per cent. However, if an ultimate real wage increase of 0.4 per cent is assumed for 2014 and thereafter, the minimum contribution rate would increase to 10.51 per cent.
Real rates of return can fluctuate greatly from year to year and can have a significant impact on the size of assets and on the ratio of assets to the following year expenditures. If a real rate of return of 5.5 per cent is assumed for 2019 and thereafter, the minimum contribution rate will decrease to 8.97 per cent. However, if the real rate of return is assumed to be 2.5 per cent for 2019 and thereafter, the minimum contribution rate increases to 10.73 per cent.
The table below summarizes the results of the sensitivity of the minimum contribution rate and the ratio of the assets to the next year expenditures under the legislated 9.9 per cent contribution rate to the changes in mortality, real wage increase and real rate of return on investments assumptions:
Minimum Ratio of assets to contribution rate1 expenditures under 9.9 per cent Assumption Scenario (per cent) contribution rate
2025 2050 2087
Best estimate 9.84 5.35 6.02 5.70 Mortality ............................................................... Low cost 9.46 5.54 7.45 11.64 High cost 10.22 5.15 4.67 0.50 Real wage increases .............................................. Low cost 9.26 5.56 8.07 12.09 High cost 10.51 5.09 3.40 2
Real rate of return on investments ........................ Low cost 8.97 6.31 11.23 30.49 High cost 10.73 4.54 2.98 3
1 The minimum contribution rate in this table refers to the rate applicable for 2016 and thereafter. 2 Assets depleted by 2069. 3 Assets depleted by 2076.
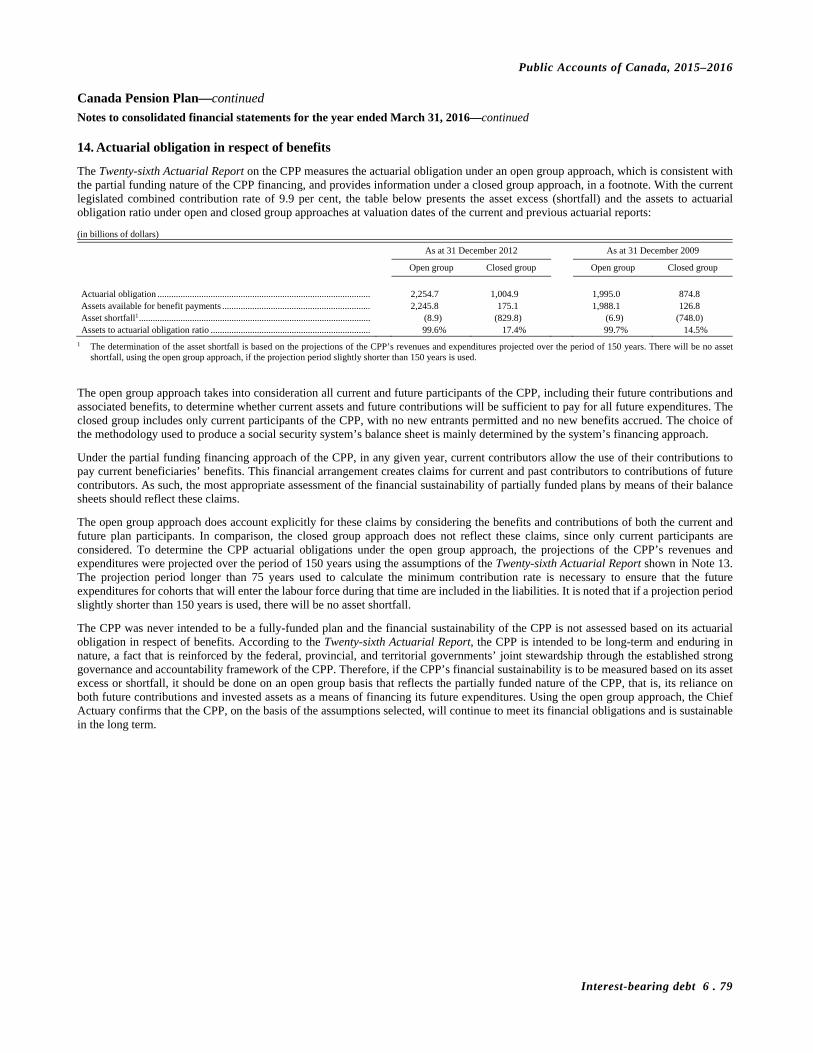
Public Accounts of Canada, 2015–2016
Interest-bearing debt 6 . 79
Canada Pension Plan—continued
Notes to consolidated financial statements for the year ended March 31, 2016—continued
14. Actuarial obligation in respect of benefits
The Twenty-sixth Actuarial Report on the CPP measures the actuarial obligation under an open group approach, which is consistent with the partial funding nature of the CPP financing, and provides information under a closed group approach, in a footnote. With the current legislated combined contribution rate of 9.9 per cent, the table below presents the asset excess (shortfall) and the assets to actuarial obligation ratio under open and closed group approaches at valuation dates of the current and previous actuarial reports:
(in billions of dollars)
As at 31 December 2012 As at 31 December 2009
Open group Closed group Open group Closed group
Actuarial obligation ............................................................................................ 2,254.7 1,004.9 1,995.0 874.8 Assets available for benefit payments ................................................................ 2,245.8 175.1 1,988.1 126.8 Asset shortfall1 .................................................................................................... (8.9) (829.8) (6.9) (748.0) Assets to actuarial obligation ratio ..................................................................... 99.6% 17.4% 99.7% 14.5%
1 The determination of the asset shortfall is based on the projections of the CPP’s revenues and expenditures projected over the period of 150 years. There will be no asset shortfall, using the open group approach, if the projection period slightly shorter than 150 years is used.
The open group approach takes into consideration all current and future participants of the CPP, including their future contributions and associated benefits, to determine whether current assets and future contributions will be sufficient to pay for all future expenditures. The closed group includes only current participants of the CPP, with no new entrants permitted and no new benefits accrued. The choice of the methodology used to produce a social security system’s balance sheet is mainly determined by the system’s financing approach.
Under the partial funding financing approach of the CPP, in any given year, current contributors allow the use of their contributions to pay current beneficiaries’ benefits. This financial arrangement creates claims for current and past contributors to contributions of future contributors. As such, the most appropriate assessment of the financial sustainability of partially funded plans by means of their balance sheets should reflect these claims.
The open group approach does account explicitly for these claims by considering the benefits and contributions of both the current and future plan participants. In comparison, the closed group approach does not reflect these claims, since only current participants are considered. To determine the CPP actuarial obligations under the open group approach, the projections of the CPP’s revenues and expenditures were projected over the period of 150 years using the assumptions of the Twenty-sixth Actuarial Report shown in Note 13. The projection period longer than 75 years used to calculate the minimum contribution rate is necessary to ensure that the future expenditures for cohorts that will enter the labour force during that time are included in the liabilities. It is noted that if a projection period slightly shorter than 150 years is used, there will be no asset shortfall.
The CPP was never intended to be a fully-funded plan and the financial sustainability of the CPP is not assessed based on its actuarial obligation in respect of benefits. According to the Twenty-sixth Actuarial Report, the CPP is intended to be long-term and enduring in nature, a fact that is reinforced by the federal, provincial, and territorial governments’ joint stewardship through the established strong governance and accountability framework of the CPP. Therefore, if the CPP’s financial sustainability is to be measured based on its asset excess or shortfall, it should be done on an open group basis that reflects the partially funded nature of the CPP, that is, its reliance on both future contributions and invested assets as a means of financing its future expenditures. Using the open group approach, the Chief Actuary confirms that the CPP, on the basis of the assumptions selected, will continue to meet its financial obligations and is sustainable in the long term.
Public Accounts of Canada, 2015–2016
6 . 80 Interest-bearing debt
Canada Pension Plan—continued
Notes to consolidated financial statements for the year ended March 31, 2016—continued
15. Contractual obligations
The CPP, through the CPPIB, has committed to enter into contractual obligations related to the funding of investments. These contractual obligations are generally payable on demand based on the funding needs of the investment subject to the terms and conditions of each agreement. As at March 31, 2016, the contractual obligations totalled $34.7 billion (2015 – $30.7 billion).
As at March 31, 2016, the CPP, through the CPPIB, has made lease and other contractual obligations, which will require future annual payments as follows:
(in millions of dollars)
2016 2015
Within one year ............................................................................................................................................................... 34 36 After one year but not more than five years .................................................................................................................... 115 114 More than five years ........................................................................................................................................................ 67 40
216 190
16. Contingent liabilities
(a) Appeals relating to the payment of pensions and benefits
At March 31, 2016, there were 7,619 appeals (2015 – 14,007) relating to the payment of CPP disability benefits. These contingencies are reasonably estimated, using historical information, at an amount of $60.5 million (2015 – $164.4 million), which was recorded as an accrued liability in the CPP 2015–2016 consolidated financial statements.
(b) Other claims and legal proceedings
In the normal course of operations, the CPP is involved in various claims and legal proceedings. The total amount claimed in these actions and their outcomes are not determinable at this time. The CPP records an allowance for claims and legal proceedings when it is likely that there will be a future payment and a reasonable estimate of the loss can be made. No such allowance was recognized in the financial statements for the 2015–2016 and 2014–2015 fiscal years for these claims and legal proceedings.
(c) Guarantees
As part of certain investment transactions, the CPP, through the CPPIB, agreed to guarantee, as at March 31, 2016, up to $2.5 billion (2015 – $1.9 billion) to other counterparties in the event certain investee entities default under the terms of loan and other related agreements.
(d) Indemnifications
The CPPIB provides indemnifications to its officers, directors, certain others and, in certain circumstances, to various counterparties and other entities. The CPPIB may be required to compensate these indemnified parties for costs incurred as a result of various contingencies such as changes in laws, regulations and litigation claims. The contingent nature of these indemnification agreements prevents the CPPIB from making a reasonable estimate of the maximum potential payments the CPPIB could be required to make. To date, the CPPIB has not received any claims nor made any payments pursuant to such indemnifications.

Public Accounts of Canada, 2015–2016
Interest-bearing debt 6 . 81
Canada Pension Plan—continued
Notes to consolidated financial statements for the year ended March 31, 2016—continued
17. Related party transactions
As stated in Note 4, the CPP has $4,945 million (2015 – $5,114 million) of contributions receivable from the Canada Revenue Agency.
The CPP enters into transactions with the Government of Canada in the normal course of business, which are recorded at the exchange value. The costs are based on estimated allocations of costs and are charged to the CPP in accordance with various memoranda of understanding.
Transactions for the year are comprised of the following:
(in millions of dollars)
2016 2015
Employment and Social Development Canada
Personnel related costs ............................................................................................................................................... 229 238 Program policy and delivery, accomodation and corporate services ........................................................................ 92 88
Canada Revenue Agency Collection of contributions and investigation services .............................................................................................. 175 173
Treasury Board Secretariat Health Insurance Plan ................................................................................................................................................ 17 17
Administrative Tribunals Support Service Canada Support services of the Social Security Tribunal ...................................................................................................... 17 7
Public Services and Procurement Canada Cheque issue and computer services ......................................................................................................................... 6 9
Office of the Superintendent of Financial Institutions and Department of Finance Actuarial services ....................................................................................................................................................... 2 2
538 534
18. Supplementary information
The administration of the CPP’s assets and activities is shared between various Government of Canada (GoC) departments and the CPPIB. The CPPIB is responsible for investing the majority of the CPP’s assets, while the GoC through various federal departments, manages the remainder of the assets, as well as the collection of the CPP contributions and the administration and payments of the CPP benefits. For accountability purposes, the following table presents summary information on the levels of assets and liabilities and sources of income and expenses managed by the GoC and the CPPIB respectively.
(in millions of dollars)
2016 2015
GoC CPPIB Total GoC CPPIB Total
Financial assets ............................................................................................... 5,128 348,013 353,141 5,537 321,448 326,985 Non-financial assets ........................................................................................ – 402 402 – 370 370 Liabilities ........................................................................................................ 494 69,474 69,968 545 57,195 57,740
Assets available for benefit payments ............................................................ 4,634 278,941 283,575 4,992 264,623 269,615
Income Contributions............................................................................................. 46,119 – 46,119 45,046 – 45,046 Investment income .................................................................................... 2 10,007 10,009 3 41,441 41,444
46,121 10,007 56,128 45,049 41,441 86,490
Expenses Pensions and benefits ................................................................................ 40,754 – 40,754 38,747 – 38,747 Operating expenses ................................................................................... 538 876 1,414 534 803 1,337
41,292 876 42,168 39,281 803 40,084
Net increase in assets available for benefit payments .................................... 4,829 9,131 13,960 5,768 40,638 46,406
Public Accounts of Canada, 2015–2016
6 . 82 Interest-bearing debt
Canada Pension Plan—concluded
Notes to consolidated financial statements for the year ended March 31, 2016—concluded
Pursuant to Section 108.1 of the Canada Pension Plan and the Agreement dated as of April 1, 2004, amounts not required to meet specified obligations of the CPP are transferred weekly to the CPPIB. The funds originate from employer and employee contributions to the CPP and interest income generated from the deposit with the Receiver General.
In September 2004, the CPPIB assumed responsibility for providing cash management services to the CPP, including periodic return, on at least a monthly basis, of funds required to meet CPP pensions, benefits and operating expenses obligations.
During the year ended March 31, 2016, a total of $38 billion (2015 – $36 billion) was transferred to the CPPIB and a total of $33 billion (2015 – $31 billion) was returned to the CPP to meet its liquidity requirements.
Activities during the year (in millions of dollars)
2016 2015
Canada Pension Plan Investment Board
Accumulated transfers to CPPIB, beginning of year ................................................................................................. 377,685 341,662 Transfers of funds to CPPIB ................................................................................................................................ 38,406 36,023
Accumulated transfers to CPPIB, end of year ........................................................................................................... 416,091 377,685
Accumulated transfers from CPPIB, beginning of year ............................................................................................ (249,367) (218,237)
Transfers of funds from CPPIB ........................................................................................................................... (33,219) (31,130)
Accumulated transfers from CPPIB, end of year ...................................................................................................... (282,586) (249,367)
Net accumulated transfers to CPPIB ......................................................................................................................... 133,505 128,318
19. Comparative information
Certain comparative figures have been reclassified to conform to the current year’s presentation.
Public Accounts of Canada, 2015–2016
Interest-bearing debt 6 . 83
Government Annuities Account
Management’s responsibility for financial statements
The financial statements of the Government Annuities Account are prepared in accordance with Canadian accounting standards for pension plans by the management of Employment and Social Development Canada. Management is responsible for the integrity and objectivity of the information in the financial statements, including the amounts which must, of necessity, be based on best estimates and judgment. The significant accounting policies are identified in Note 2 to the financial statements.
To fulfill its accounting and reporting responsibilities, management has developed and maintains books of account, financial and management controls, information systems and management practices. These systems are designed to provide reasonable assurance that financial information is reliable, that assets are safeguarded and that transactions are properly authorized and recorded in accordance with the Government Annuities Improvement Act and the Government Annuities Act and regulations.
The Auditor General of Canada, the external auditor of the Government Annuities Account, conducts an independent audit of the financial statements in accordance with Canadian generally accepted auditing standards and provides a report to the Minister of Families, Children and Social Development.
Louise Levonian Deputy Minister
Employment and Social Development Canada
Alain P. Séguin, MBA, CPA, CGA Chief Financial Officer
Employment and Social Development Canada
Gatineau, Canada September 1, 2016

Public Accounts of Canada, 2015–2016
6 . 84 Interest-bearing debt
Government Annuities Account—continued
Report of the Actuary
The Office of the Chief Actuary, Office of the Superintendent of Financial Institutions Canada, has the mandate of performing the annual actuarial valuation of the Government Annuities Account (the “Account”) as at 31 March 2016. The purpose of this valuation is to determine the actuarial liabilities and financial position of the Account as at 31 March 2016. The results of the valuation are included in the Public Accounts of Canada as well as in the Account’s financial statements.
As at 31 March 2016, the actuarial liabilities presented in the Public Accounts of Canada and used to determine the amount charged to the Account and credited to the Consolidated Revenue Fund, are based on prescribed mortality rates. In addition, the actuarial liabilities presented in the statement of financial position, statement of changes in net assets available for benefits, and statement of changes in pension obligations of the Account’s financial statements, are based on best estimate experience-adjusted mortality rates.
The valuation of the Account’s actuarial liabilities and financial position is therefore based on:
– membership data as at 31 March 2016 provided by Employment and Social Development Canada (ESDC) and Service Canada;
– asset data provided by ESDC;
– a seven per cent annual interest rate as prescribed by the Government Annuities Regulations;
– for purposes of the Public Accounts of Canada, mortality rates as prescribed by the Government Annuities Regulations, that is, the Annuity Table for 1983, for individual and group annuities, as modified by Projection Scale G published by the Society of Actuaries; and
– for purposes of the Account’s financial statements, best estimate experience-adjusted mortality rates.
The Account’s assets are notional and in the form of a deposit with the Receiver General for Canada. Therefore, actuarial liabilities equal the present value of future payments discounted at the prescribed interest rate. Since administrative expenses are paid by the government out of general funds, no provision for expenses is made in the valuation. This valuation contains no added margins for adverse deviation.
In our opinion, considering that the valuation is prepared pursuant to the Government Annuities Act and the Government Annuities Improvement Act:
– the data on which our valuation is based are sufficient and reliable for the purpose of the valuation;
– the assumptions used for purposes of the Public Accounts of Canada comply with legislative;
– the mortality assumption used for purposes of the Accounts financial statements is reasonable and appropriate; all other assumptions comply with legislative requirements;
– the methodology employed is appropriate and consistent with sound actuarial principles; and
– the actuarial valuation is appropriate, it conforms to statutory requirements and the financial statements fairly present its results.
Our valuation has been prepared, and our opinions given, in accordance with accepted actuarial practice in Canada. As at 1 September 2016, there are no subsequent events of which we are aware that would have an impact on the valuation. The next valuation will be performed as at 31 March 2017.
Michel Millette Senior Actuary
Fellow of the Canadian Institute of Actuaries Office of the Chief Actuary
Myriam Demers
Actuarial Officer Associate of the Society of Actuaries
Office of the Chief Actuary
Assia Billig Actuary
Fellow of the Canadian Institute of Actuaries Office of the Chief Actuary
Office of the Superintendent of Financial Institutions Canada Ottawa, Canada 1 September 2016
Public Accounts of Canada, 2015–2016
Interest-bearing debt 6 . 85
Government Annuities Account—continued
Independent Auditor’s Report
To the Minister of Families, Children and Social Development
Report on the financial statements
I have audited the accompanying financial statements of the Government Annuities Account, which comprise the statement of financial position as at 31 March 2016, and the statement of changes in net assets available for benefits and statement of changes in pension obligations for the year then ended, and a summary of significant accounting policies and other explanatory information.
Management’s Responsibility for the Financial Statements
Management is responsible for the preparation and fair presentation of these financial statements in accordance with Canadian accounting standards for pension plans, and for such internal control as management determines is necessary to enable the preparation of financial statements that are free from material misstatement, whether due to fraud or error.
Auditor’s Responsibility
My responsibility is to express an opinion on these financial statements based on my audit. I conducted my audit in accordance with Canadian generally accepted auditing standards. Those standards require that I comply with ethical requirements and plan and perform the audit to obtain reasonable assurance about whether the financial statements are free from material misstatement.
An audit involves performing procedures to obtain audit evidence about the amounts and disclosures in the financial statements. The procedures selected depend on the auditor’s judgment, including the assessment of the risks of material misstatement of the financial statements, whether due to fraud or error. In making those risk assessments, the auditor considers internal control relevant to the entity’s preparation and fair presentation of the financial statements in order to design audit procedures that are appropriate in the circumstances, but not for the purpose of expressing an opinion on the effectiveness of the entity’s internal control. An audit also includes evaluating the appropriateness of accounting policies used and the reasonableness of accounting estimates made by management, as well as evaluating the overall presentation of the financial statements.
I believe that the audit evidence I have obtained is sufficient and appropriate to provide a basis for my audit opinion.
Opinion
In my opinion, the financial statements present fairly, in all material respects, the financial position of the Government Annuities Account as at 31 March 2016, and the changes in its net assets available for benefits and changes in its pension obligations for the year then ended in accordance with Canadian accounting standards for pension plans.
Report on other legal and regulatory requirements
In my opinion, the transactions of the Government Annuities Account that have come to my notice during my audit of the financial statements have, in all significant respects, been in accordance with the Government Annuities Improvement Act, and the Government Annuities Act and regulations.
Heather McManaman, CPA, CA Principal for the Auditor General of Canada
1 September 2016 Halifax, Canada
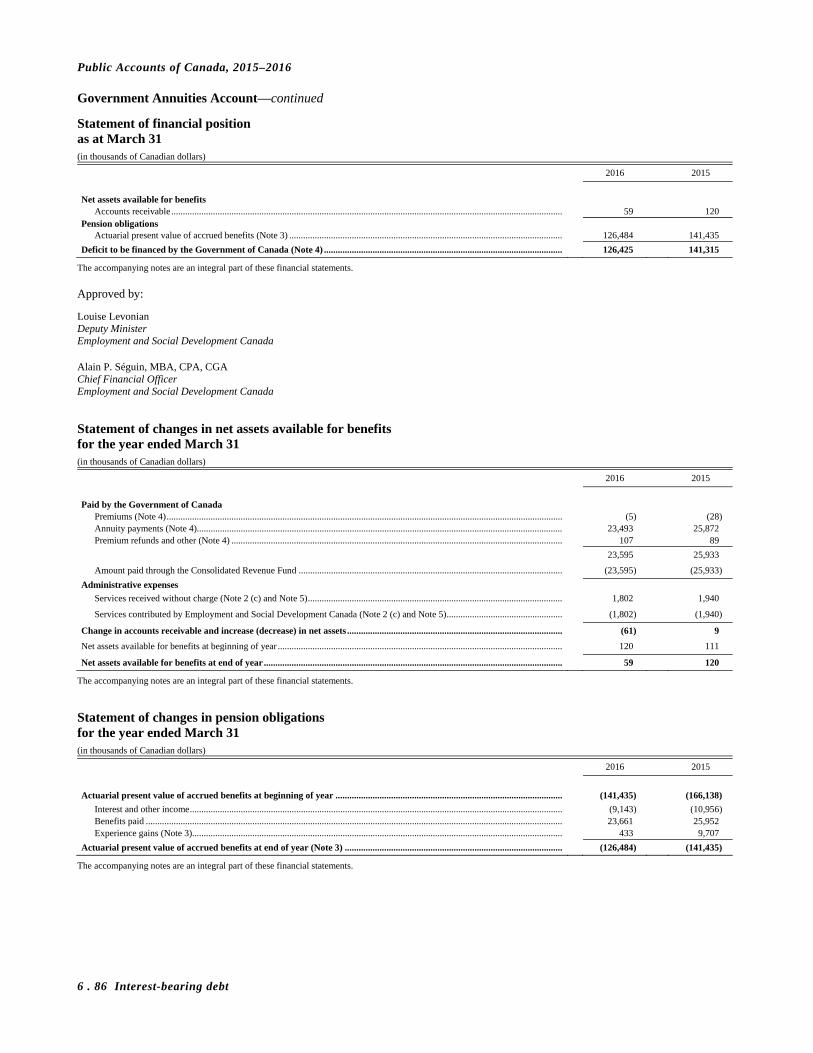
Public Accounts of Canada, 2015–2016
6 . 86 Interest-bearing debt
Government Annuities Account—continued
Statement of financial position as at March 31 (in thousands of Canadian dollars)
2016 2015
Net assets available for benefits
Accounts receivable ......................................................................................................................................................................... 59 120 Pension obligations
Actuarial present value of accrued benefits (Note 3) ...................................................................................................................... 126,484 141,435
Deficit to be financed by the Government of Canada (Note 4) ....................................................................................................... 126,425 141,315
The accompanying notes are an integral part of these financial statements.
Approved by:
Louise Levonian Deputy Minister Employment and Social Development Canada Alain P. Séguin, MBA, CPA, CGA Chief Financial Officer Employment and Social Development Canada
Statement of changes in net assets available for benefits for the year ended March 31 (in thousands of Canadian dollars)
2016 2015
Paid by the Government of Canada
Premiums (Note 4) ........................................................................................................................................................................... (5) (28) Annuity payments (Note 4).............................................................................................................................................................. 23,493 25,872 Premium refunds and other (Note 4) ............................................................................................................................................... 107 89
23,595 25,933
Amount paid through the Consolidated Revenue Fund .................................................................................................................. (23,595) (25,933)
Administrative expenses
Services received without charge (Note 2 (c) and Note 5) .............................................................................................................. 1,802 1,940
Services contributed by Employment and Social Development Canada (Note 2 (c) and Note 5) .................................................. (1,802) (1,940)
Change in accounts receivable and increase (decrease) in net assets ............................................................................................. (61) 9
Net assets available for benefits at beginning of year ........................................................................................................................... 120 111
Net assets available for benefits at end of year ................................................................................................................................. 59 120
The accompanying notes are an integral part of these financial statements.
Statement of changes in pension obligations for the year ended March 31 (in thousands of Canadian dollars)
2016 2015
Actuarial present value of accrued benefits at beginning of year .................................................................................................. (141,435) (166,138)
Interest and other income ................................................................................................................................................................. (9,143) (10,956) Benefits paid .................................................................................................................................................................................... 23,661 25,952 Experience gains (Note 3)................................................................................................................................................................ 433 9,707
Actuarial present value of accrued benefits at end of year (Note 3) .............................................................................................. (126,484) (141,435)
The accompanying notes are an integral part of these financial statements.
Public Accounts of Canada, 2015–2016
Interest-bearing debt 6 . 87
Government Annuities Account—continued
Notes to the financial statements for the year ended March 31, 2016
1. Authority, objective and responsibilities
The Government Annuities Account (the Account) was established in 1908 by the Government Annuities Act, as modified by the Government Annuities Improvement Act.
The purpose of the Government Annuities Act was to assist individuals and groups of Canadians to prepare financially for their retirement by purchasing Government Annuities. In 1975, the Government Annuities Improvement Act discontinued future sales of Government Annuity contracts. Annuities are deferred until their maturity date, at which time payments to annuitants begin.
The Account is administered by Employment and Social Development Canada (ESDC) and operates through the Consolidated Revenue Fund.
2. Significant accounting policies
(a) Basis of presentation
The financial statements of the Account are prepared in accordance with Canadian accounting standards for pension plans (Section 4600) on a going concern basis. They are prepared in Canadian dollars, the Account’s functional currency. This section requires pension plans of publicly accountable enterprises to comply on a consistent basis with International Financial Reporting Standards (IFRS) to the extent that those standards do not conflict with the requirements of Section 4600, which take precedence.
The financial statements for the year ended March 31, 2016 were authorized for issue by the signatories on September 1, 2016.
(b) Actuarial present value of accrued benefits
The method utilized to calculate the actuarial present value of accrued benefits comprises, in respect of deferred and matured annuities, the present value of such annuities actuarially determined on the basis of prescribed interest rates and best estimate experience-adjusted mortality tables.
(c) Service received without charge
Administrative services received without charge from ESDC are recorded in the statement of changes in net assets available for benefits at their estimated cost. A corresponding amount is credited directly to the statement of changes in net assets available for benefits.
(d) Measurement uncertainty
The preparation of these financial statements in accordance with Canadian accounting standards for pension plans requires management to make estimates and assumptions that affect the reported amount of assets, actuarial present value of accrued benefits, and income at the date of the financial statements. The actuarial present value of accrued benefits depends on factors that are determined on an actuarial basis using assumptions such as mortality rates. Any changes in these assumptions will impact the carrying amount of the actuarial present value of accrued benefits. The carrying amount of the actuarial present value of accrued benefits as at the end of the reporting fiscal years is included in Note 3. Actual results may differ significantly from the estimates and assumptions; therefore it is possible that the amounts for the actuarial present value of accrued benefits and related accounts could change materially in the near term. Revisions to accounting estimates are recognized in the period in which the estimate is revised if the revision affects only that period or in the period of the revision and future periods if the revision affects both current and future periods.

Public Accounts of Canada, 2015–2016
6 . 88 Interest-bearing debt
Government Annuities Account—continued
Notes to the financial statements for the year ended March 31, 2016—continued
3. Actuarial present value of accrued benefits
The Office of the Chief Actuary, Office of the Superintendent of Financial Institutions Canada, performs the annual actuarial valuation of the Government Annuities Account as at March 31.
As per the Government Annuities Improvement Act and Government Annuities Regulations, expected future payments are to be discounted using an annual interest rate of seven per cent. Future payments are to be estimated using the mortality rates from the 1983 mortality tables published by the Society of Actuaries, for individual and group annuities respectively, modified by Projection Scale G. Based on these Act and Regulations, the balance of the Government Annuities Account as presented in Table 6.1 of Volume I of the Public Accounts of Canada 2016 is $133.8 million ($149.6 million in 2014–2015).
As per a mortality experience study performed by the Office of the Chief Actuary, the actuarial present value of accrued benefits as at March 31, 2016, estimated using experience-adjusted mortality rates, would be $126.5 million ($141.4 million in 2014–2015). This amount is $7.3 million lower than what would be the actuarial present value of accrued benefits estimated using the mortality tables prescribed by regulations ($8.2 million in 2014–2015).
As per Canadian accounting standards for pension plans, the financial statements of the Account need to present management’s best estimate of the actuarial present value of accrued benefits. Management determined that the amount of $126.5 million represents its best estimate of the pension obligations. As a result, the mortality assumption used in the calculation of the actuarial present value of the accrued benefits reflects the experience-adjusted mortality rates.
Consequently, the amount of the pension obligation presented in the Account’s financial statements differs from the balance of the Account in the Public Accounts of Canada 2016.
(in thousands of Canadian dollars)
2016 2015
Actuarial present value of accrued benefits is comprised of:
Deferred annuities ............................................................................................................................................................................ 5,004 7,019 Mature annuities............................................................................................................................................................................... 121,480 134,416
126,484 141,435
The average age of annuitants was estimated to be 84.2 years and the remaining life of the Account was estimated at 43 years as at March 31, 2016.
The next actuarial valuation will be performed as at March 31, 2017.
4. Deficit to be financed by the Government of Canada
The Government Annuities Act provided authority for the Government of Canada to sell annuities to the Canadian Public. The Government of Canada has entered into individual annuity contracts with a promise to pay the annuities and is required under the Act to keep an account, the Government Annuities Account, in the Consolidated Revenue Fund to record all transactions related to these annuities. These transactions include all moneys received and paid, the assets and liabilities relating to the granting of an annuity, unclaimed and reclaimed annuities and the liability representing the present value of prospective annuities contracted. It also includes the accrual of interest earned.
(in thousands of Canadian dollars)
2016 2015
Liability of the Government of Canada at beginning of year ......................................................................................................... 141,315 166,027
Accrued interest ............................................................................................................................................................................... 9,006 10,651 Premiums ......................................................................................................................................................................................... 5 28 Reclaimed annuities ......................................................................................................................................................................... 206 310 Annuity payments ............................................................................................................................................................................ (23,493) (25,872) Premium refunds and other .............................................................................................................................................................. (107) (89) Unclaimed annuities ........................................................................................................................................................................ (74) (33) Actuarial surplus .............................................................................................................................................................................. (433) (1,544) Change in mortality assumption ...................................................................................................................................................... – (8,163)
(14,890) (24,712)
Liability of the Government of Canada at end of year .................................................................................................................... 126,425 141,315

Public Accounts of Canada, 2015–2016
Interest-bearing debt 6 . 89
Government Annuities Account—concluded
Notes to the financial statements for the year ended March 31, 2016—concluded
Accrued interest
Interest is recorded on an accrual basis and is calculated on the actuarial present value of accrued benefits as prescribed by the Government Annuities Improvement Act and the Government Annuities Regulations.
Premiums
Premiums are deposited in the Consolidated Revenue Fund. This deposit earns interest at a rate of seven per cent in accordance with the Government Annuities Improvement Act and the Government Annuities Regulations. Due to the short-term nature, the carrying value of the deposit with the Receiver General for Canada approximates its fair value.
Reclaimed annuities
Reclaimed annuities represent previously unclaimed amounts of annuitants that could not be located. If the annuitants are subsequently located, the actuarial present value of these annuities is paid.
Unclaimed annuities
Unclaimed annuities represent amounts of annuities that could not be paid because the annuitants could not be located.
Actuarial surplus/deficit
At the end of any fiscal year, the amount of the actuarial present value of accrued benefits may be different than the amount of actuarial liabilities determined by the actuary.
5. Related party transactions
The Account is related to Government departments, agencies and Crown corporations through common control held by the Government of Canada. There were no further significant transactions with related parties other than those described in Note 2(c), Services received without charge. These administrative services include the following:
(in thousands of Canadian dollars)
2016 2015
Salaries ................................................................................................................................................................................................... 1,329 1,367 Operating costs ...................................................................................................................................................................................... 406 516 Actuarial services .................................................................................................................................................................................. 67 57
Services received without charge 1,802 1,940
Public Accounts of Canada, 2015–2016
6 . 90 Interest-bearing debt
Royal Canadian Mounted Police (Dependants) Pension Fund
Management responsibility for financial statements
Responsibility for the integrity and fairness of the financial statements of the Royal Canadian Mounted Police (Dependants) Pension Fund rests with the management of the Royal Canadian Mounted Police.
The financial statements of the Royal Canadian Mounted Police (Dependants) Pension Fund have been prepared in accordance with Canadian accounting standards for pension plans. The financial statements include management’s best estimates and judgments where appropriate.
To fulfill its accounting and reporting responsibilities, management has developed and maintained books, records, internal controls and management practices designed to provide reasonable assurance as to the reliability of the financial information and to ensure that transactions are in accordance with the Royal Canadian Mounted Police Pension Continuation Act and regulations as well as the Financial Administration Act and regulations.
These financial statements have been audited by the Auditor General of Canada, the independent auditor for the Government of Canada.
Approved by:
Bob Paulson Commissioner
Dennis Watters, CPA, CA, CFE
Acting Chief Financial and Administrative Officer
July 26, 2016
Public Accounts of Canada, 2015–2016
Interest-bearing debt 6 . 91
Royal Canadian Mounted Police (Dependants) Pension Fund—continued
Independent Auditor’s Report
To the Minister of Public Safety and Emergency Preparedness
Report on the financial statements
I have audited the accompanying financial statements of the Royal Canadian Mounted Police (Dependants) Pension Fund, which comprise the statement of financial position as at 31 March 2016, and the statement of changes in net assets available for benefits and statement of changes in pension obligations for the year then ended, and a summary of significant accounting policies and other explanatory information.
Management’s responsibility for the financial statements
Management is responsible for the preparation and fair presentation of these financial statements in accordance with Canadian accounting standards for pension plans, and for such internal control as management determines is necessary to enable the preparation of financial statements that are free from material misstatement, whether due to fraud or error.
Auditor’s responsibility
My responsibility is to express an opinion on these financial statements based on my audit. I conducted my audit in accordance with Canadian generally accepted auditing standards. Those standards require that I comply with ethical requirements and plan and perform the audit to obtain reasonable assurance about whether the financial statements are free from material misstatement.
An audit involves performing procedures to obtain audit evidence about the amounts and disclosures in the financial statements. The procedures selected depend on the auditor’s judgment, including the assessment of the risks of material misstatement of the financial statements, whether due to fraud or error. In making those risk assessments, the auditor considers internal control relevant to the entity’s preparation and fair presentation of the financial statements in order to design audit procedures that are appropriate in the circumstances, but not for the purpose of expressing an opinion on the effectiveness of the entity’s internal control. An audit also includes evaluating the appropriateness of accounting policies used and the reasonableness of accounting estimates made by management, as well as evaluating the overall presentation of the financial statements.
I believe that the audit evidence I have obtained is sufficient and appropriate to provide a basis for my audit opinion.
Opinion
In my opinion, the financial statements present fairly, in all material respects, the financial position of Royal Canadian Mounted Police (Dependants) Pension Fund as at 31 March 2016, and the changes in its net assets available for benefits and changes in its pension obligations for the year then ended in accordance with Canadian accounting standards for pension plans.
Report on other legal and regulatory requirements
In my opinion, the transactions of the Royal Canadian Mounted Police (Dependants) Pension Fund that have come to my notice during my audit of the financial statements have, in all significant respects, been in accordance with the applicable provisions of the Financial Administration Act and regulations, and the Royal Canadian Mounted Police Pension Continuation Act and regulations.
Margaret Haire, CPA, CA Principal for the Auditor General of Canada
26 July 2016 Ottawa, Canada
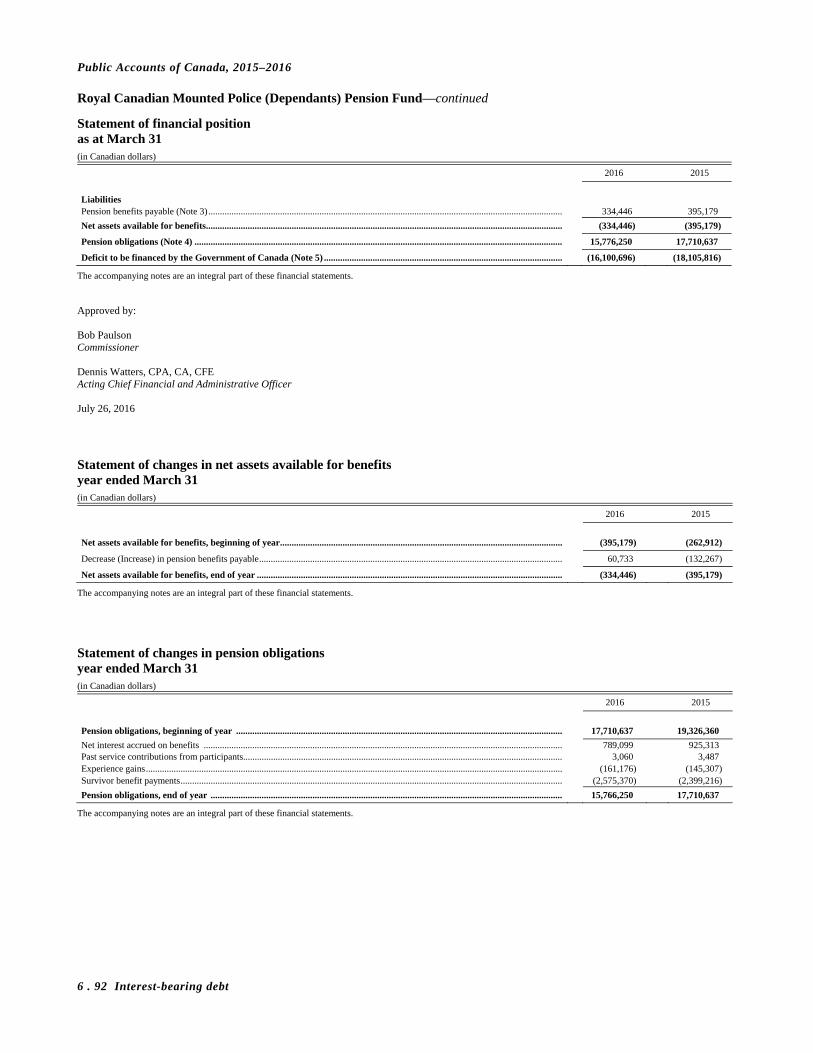
Public Accounts of Canada, 2015–2016
6 . 92 Interest-bearing debt
Royal Canadian Mounted Police (Dependants) Pension Fund—continued
Statement of financial position as at March 31 (in Canadian dollars)
2016 2015
Liabilities Pension benefits payable (Note 3) ......................................................................................................................................................... 334,446 395,179
Net assets available for benefits .......................................................................................................................................................... (334,446) (395,179)
Pension obligations (Note 4) ............................................................................................................................................................... 15,776,250 17,710,637
Deficit to be financed by the Government of Canada (Note 5) ....................................................................................................... (16,100,696) (18,105,816)
The accompanying notes are an integral part of these financial statements.
Approved by: Bob Paulson Commissioner Dennis Watters, CPA, CA, CFE Acting Chief Financial and Administrative Officer July 26, 2016
Statement of changes in net assets available for benefits year ended March 31 (in Canadian dollars)
2016 2015
Net assets available for benefits, beginning of year .......................................................................................................................... (395,179) (262,912)
Decrease (Increase) in pension benefits payable ................................................................................................................................... 60,733 (132,267)
Net assets available for benefits, end of year .................................................................................................................................... (334,446) (395,179)
The accompanying notes are an integral part of these financial statements.
Statement of changes in pension obligations year ended March 31 (in Canadian dollars)
2016 2015
Pension obligations, beginning of year ............................................................................................................................................. 17,710,637 19,326,360
Net interest accrued on benefits ........................................................................................................................................................... 789,099 925,313 Past service contributions from participants.......................................................................................................................................... 3,060 3,487 Experience gains .................................................................................................................................................................................... (161,176) (145,307) Survivor benefit payments ..................................................................................................................................................................... (2,575,370) (2,399,216)
Pension obligations, end of year ........................................................................................................................................................ 15,766,250 17,710,637
The accompanying notes are an integral part of these financial statements.

Public Accounts of Canada, 2015–2016
Interest-bearing debt 6 . 93
Royal Canadian Mounted Police (Dependants) Pension Fund—continued
Notes to the financial statements for the year ended March 31, 2016
1. Description of the Fund
The following is a summary description of the Royal Canadian Mounted Police (Dependants) Pension Fund.
(a) General
The Royal Canadian Mounted Police (Dependants) Pension Fund (the Fund) was established in 1934 pursuant to the Royal Canadian Mounted Police Act and is currently operated under Part IV of the Royal Canadian Mounted Police Pension Continuation Act (the Act) (effective 1959) and the related Regulations.
The Act provides for members of the Force, other than commissioned officers, appointed before March 1, 1949, the right to purchase certain survivorship benefits for their dependants by payment of specified contributions.
The Royal Canadian Mounted Police (RCMP) is responsible for the management of the Fund and Public Services and Procurement Canada (PSPC) provides the day-to-day administration of the Fund. The Office of the Chief Actuary (OCA) of the Office of the Superintendent of Financial Institutions (OSFI) performs periodic actuarial valuations of the Fund.
All monetary transactions of the Fund are made through a specified purpose account in the Consolidated Revenue Fund (CRF).
The Fund is accounted for using the standards applicable to a defined benefit pension plan as described in Note 2(a).
(b) Funding policy
All eligible members have now retired and, as such, there are no more active members contributing to the Fund; however, retired members may continue to make instalment payments in respect of previous elections made before their retirement.
The Act directs the Minister of Finance to have an actuarial valuation for funding purposes prepared at least every five years. If the actuarial valuation discloses a surplus, the Governor in Council may, by order, increase the benefit payments. If there is an actuarial deficiency, the Governor in Council may direct that there be amounts transferred to the Fund, out of any unappropriated moneys in the CRF, as may be required to re-establish the solvency of the Fund.
(c) Survivor benefit payments
The following benefits, as applicable, are payable on the death of a member who has made the scheduled contributions and has left them in the Fund.
i. Widow’s pension benefit
The widow is entitled to the pension purchased by the member. In many cases the pension benefit equals approximately 1.5 per cent of the member’s final pension benefit payment multiplied by his years of credited service. The pension benefit is payable for life with a guarantee that the total payments shall be no less than the member’s contributions.
ii. Lump sum benefits
If a member is not survived by a widow, a lump sum payment is made to the dependants and relatives of the member who are, in the opinion of the Minister, best entitled to share the benefit.
iii. Benefit limitations
Under certain circumstances, the basic death benefits payable to a surviving widow are reduced. This can occur when a member marries after age 60; in that case, the value of the pension to the widow cannot exceed the lump sum payable if he were not survived by a widow.

Public Accounts of Canada, 2015–2016
6 . 94 Interest-bearing debt
Royal Canadian Mounted Police (Dependants) Pension Fund—continued
Notes to the financial statements for the year ended March 31, 2016—continued
(d) Dividends on survivor benefit payments
The Act provides that if the Fund is substantially in excess of the amount required to make adequate provision for the prospective payments, the Governor in Council may, by order, increase the benefits provided under Part IV of the Act in such manner as may appear equitable and expedient. The authority of the Governor in Council is delegated to the Treasury Board under section 7(2) of the Financial Administration Act.
To date, most of these benefit increases have taken the form of proportionate dividends applied to all basic death benefits, both accrued and prospective.
(e) Withdrawal of contributions
A retired member who did not elect to withdraw his contributions from the Fund upon retirement retains the right to do so at any time thereafter; however, all his rights under Part IV of the Act and those of his dependants shall cease upon such election. All returns of contributions are made without interest.
2. Significant accounting policies
(a) Basis of presentation
These financial statements present information on the Fund as a separate financial reporting entity independent of the sponsor and Fund members, on a going concern basis. They are prepared to assist Fund members and others in reviewing the activities of the Fund for the year, but they are not meant to portray the funding requirements of the Fund.
These financial statements are prepared in Canadian dollars, the Fund’s functional currency, in accordance with Canadian accounting standards for pension plans in Part IV of the Chartered Professional Accountants (CPA) Canada Handbook, Section 4600. Section 4600 provides specific accounting guidance on investments and pension obligations.
For accounting policies that do not relate to either investments or pension obligations, the Fund complies with International Financial Reporting Standards (IFRS) in Part I of the CPA Canada Handbook. To the extent that IFRS in Part I is inconsistent with Section 4600, Section 4600 takes precedence.
The financial statements for the year ended March 31, 2016 were authorized for issue by the signatories on July 26, 2016.
(b) Significant accounting policies
The significant accounting policies are as follows:
i. Survivor benefit payments
Benefits are recognized on an accrual basis as a reduction of pension obligations and net assets available for benefits upon the death of a member who has made the scheduled contributions and has left them in the Fund or upon the death of a widow.
ii. Pension obligations
The present value of pension obligations is calculated using the projected benefit method prorated on pensionable service, based on management’s best estimate assumptions.
iii. Services provided without charge and related party transactions
The Fund does not record the value of administrative services it receives without charge from various government departments and agencies as they are insignificant in the context of the financial statements taken as a whole. These services include the following:
– Financial management and other support services from the RCMP;
– Actuarial valuation and other services from the OCA;
– Office of the Auditor General of Canada audit costs.
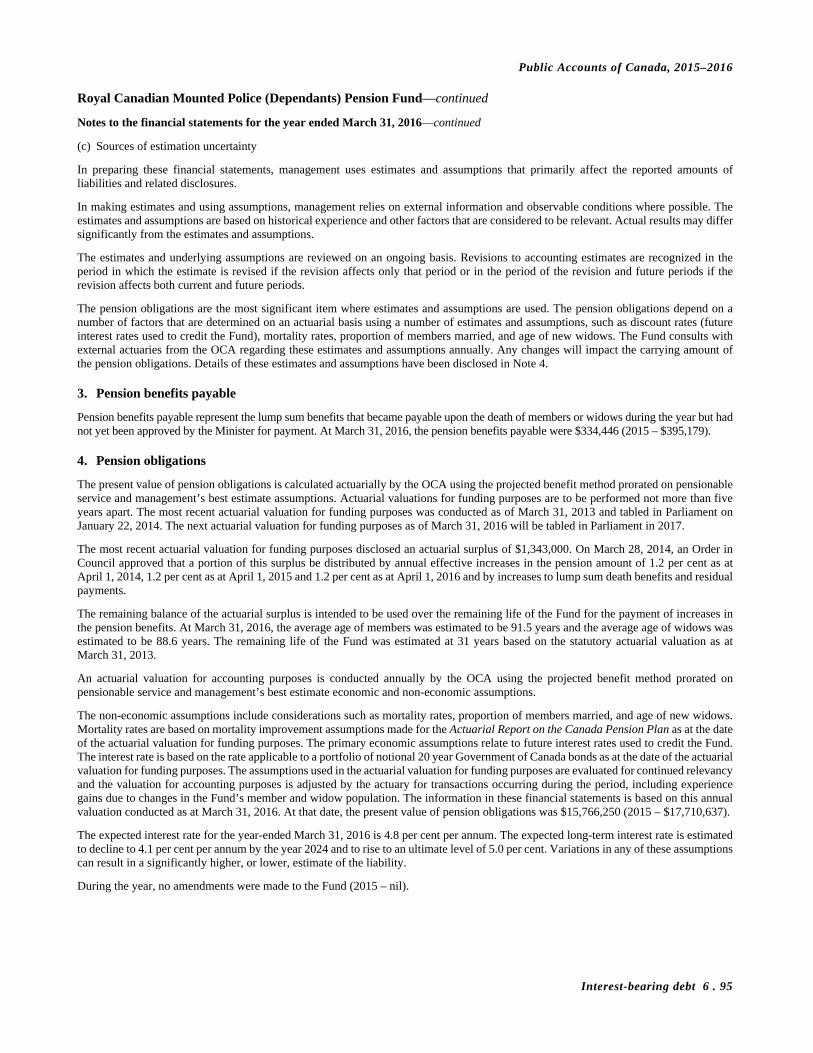
Public Accounts of Canada, 2015–2016
Interest-bearing debt 6 . 95
Royal Canadian Mounted Police (Dependants) Pension Fund—continued
Notes to the financial statements for the year ended March 31, 2016—continued
(c) Sources of estimation uncertainty
In preparing these financial statements, management uses estimates and assumptions that primarily affect the reported amounts of liabilities and related disclosures.
In making estimates and using assumptions, management relies on external information and observable conditions where possible. The estimates and assumptions are based on historical experience and other factors that are considered to be relevant. Actual results may differ significantly from the estimates and assumptions.
The estimates and underlying assumptions are reviewed on an ongoing basis. Revisions to accounting estimates are recognized in the period in which the estimate is revised if the revision affects only that period or in the period of the revision and future periods if the revision affects both current and future periods.
The pension obligations are the most significant item where estimates and assumptions are used. The pension obligations depend on a number of factors that are determined on an actuarial basis using a number of estimates and assumptions, such as discount rates (future interest rates used to credit the Fund), mortality rates, proportion of members married, and age of new widows. The Fund consults with external actuaries from the OCA regarding these estimates and assumptions annually. Any changes will impact the carrying amount of the pension obligations. Details of these estimates and assumptions have been disclosed in Note 4.
3. Pension benefits payable
Pension benefits payable represent the lump sum benefits that became payable upon the death of members or widows during the year but had not yet been approved by the Minister for payment. At March 31, 2016, the pension benefits payable were $334,446 (2015 – $395,179).
4. Pension obligations
The present value of pension obligations is calculated actuarially by the OCA using the projected benefit method prorated on pensionable service and management’s best estimate assumptions. Actuarial valuations for funding purposes are to be performed not more than five years apart. The most recent actuarial valuation for funding purposes was conducted as of March 31, 2013 and tabled in Parliament on January 22, 2014. The next actuarial valuation for funding purposes as of March 31, 2016 will be tabled in Parliament in 2017.
The most recent actuarial valuation for funding purposes disclosed an actuarial surplus of $1,343,000. On March 28, 2014, an Order in Council approved that a portion of this surplus be distributed by annual effective increases in the pension amount of 1.2 per cent as at April 1, 2014, 1.2 per cent as at April 1, 2015 and 1.2 per cent as at April 1, 2016 and by increases to lump sum death benefits and residual payments.
The remaining balance of the actuarial surplus is intended to be used over the remaining life of the Fund for the payment of increases in the pension benefits. At March 31, 2016, the average age of members was estimated to be 91.5 years and the average age of widows was estimated to be 88.6 years. The remaining life of the Fund was estimated at 31 years based on the statutory actuarial valuation as at March 31, 2013.
An actuarial valuation for accounting purposes is conducted annually by the OCA using the projected benefit method prorated on pensionable service and management’s best estimate economic and non-economic assumptions.
The non-economic assumptions include considerations such as mortality rates, proportion of members married, and age of new widows. Mortality rates are based on mortality improvement assumptions made for the Actuarial Report on the Canada Pension Plan as at the date of the actuarial valuation for funding purposes. The primary economic assumptions relate to future interest rates used to credit the Fund. The interest rate is based on the rate applicable to a portfolio of notional 20 year Government of Canada bonds as at the date of the actuarial valuation for funding purposes. The assumptions used in the actuarial valuation for funding purposes are evaluated for continued relevancy and the valuation for accounting purposes is adjusted by the actuary for transactions occurring during the period, including experience gains due to changes in the Fund’s member and widow population. The information in these financial statements is based on this annual valuation conducted as at March 31, 2016. At that date, the present value of pension obligations was $15,766,250 (2015 – $17,710,637).
The expected interest rate for the year-ended March 31, 2016 is 4.8 per cent per annum. The expected long-term interest rate is estimated to decline to 4.1 per cent per annum by the year 2024 and to rise to an ultimate level of 5.0 per cent. Variations in any of these assumptions can result in a significantly higher, or lower, estimate of the liability.
During the year, no amendments were made to the Fund (2015 – nil).
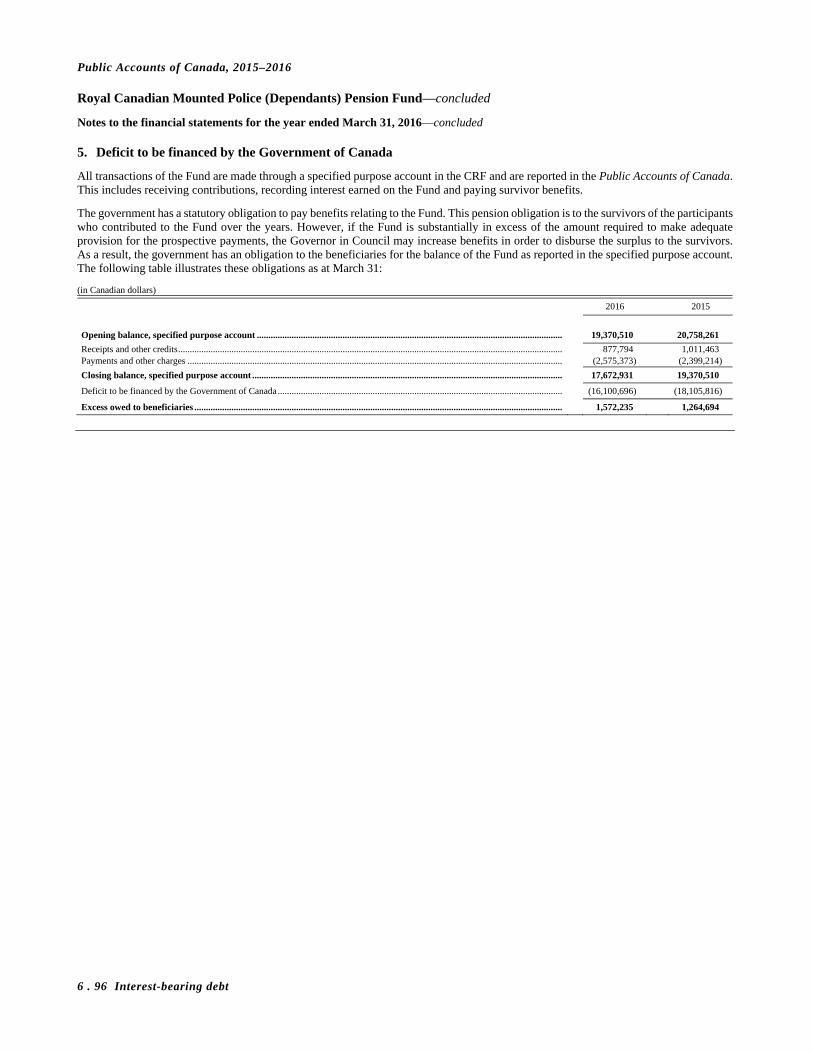
Public Accounts of Canada, 2015–2016
6 . 96 Interest-bearing debt
Royal Canadian Mounted Police (Dependants) Pension Fund—concluded
Notes to the financial statements for the year ended March 31, 2016—concluded
5. Deficit to be financed by the Government of Canada
All transactions of the Fund are made through a specified purpose account in the CRF and are reported in the Public Accounts of Canada. This includes receiving contributions, recording interest earned on the Fund and paying survivor benefits.
The government has a statutory obligation to pay benefits relating to the Fund. This pension obligation is to the survivors of the participants who contributed to the Fund over the years. However, if the Fund is substantially in excess of the amount required to make adequate provision for the prospective payments, the Governor in Council may increase benefits in order to disburse the surplus to the survivors. As a result, the government has an obligation to the beneficiaries for the balance of the Fund as reported in the specified purpose account. The following table illustrates these obligations as at March 31:
(in Canadian dollars)
2016 2015
Opening balance, specified purpose account .................................................................................................................................... 19,370,510 20,758,261
Receipts and other credits ...................................................................................................................................................................... 877,794 1,011,463 Payments and other charges .................................................................................................................................................................. (2,575,373) (2,399,214)
Closing balance, specified purpose account ...................................................................................................................................... 17,672,931 19,370,510
Deficit to be financed by the Government of Canada ........................................................................................................................... (16,100,696) (18,105,816)
Excess owed to beneficiaries ............................................................................................................................................................... 1,572,235 1,264,694
Section 7
2015–2016
Public Accounts of Canada
Cash and accounts receivable Table of contents Page
Cash and cash equivalents ............................................................... 7.2 Taxes receivable .............................................................................. 7.3 Other accounts receivable ............................................................... 7.4
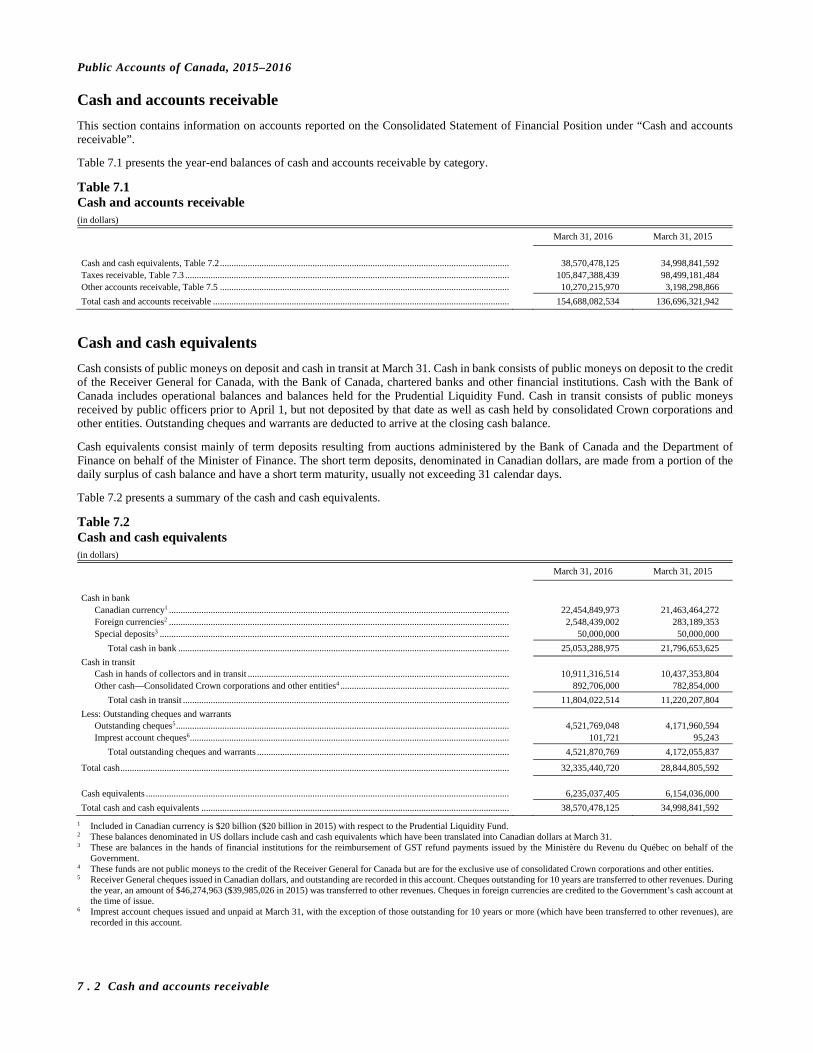
Public Accounts of Canada, 2015–2016
7 . 2 Cash and accounts receivable
Cash and accounts receivable
This section contains information on accounts reported on the Consolidated Statement of Financial Position under “Cash and accounts receivable”.
Table 7.1 presents the year-end balances of cash and accounts receivable by category.
Table 7.1 Cash and accounts receivable (in dollars)
March 31, 2016 March 31, 2015
Cash and cash equivalents, Table 7.2 ............................................................................................................................. 38,570,478,125 34,998,841,592 Taxes receivable, Table 7.3 ............................................................................................................................................ 105,847,388,439 98,499,181,484 Other accounts receivable, Table 7.5 ............................................................................................................................. 10,270,215,970 3,198,298,866
Total cash and accounts receivable ................................................................................................................................ 154,688,082,534 136,696,321,942
Cash and cash equivalents
Cash consists of public moneys on deposit and cash in transit at March 31. Cash in bank consists of public moneys on deposit to the credit of the Receiver General for Canada, with the Bank of Canada, chartered banks and other financial institutions. Cash with the Bank of Canada includes operational balances and balances held for the Prudential Liquidity Fund. Cash in transit consists of public moneys received by public officers prior to April 1, but not deposited by that date as well as cash held by consolidated Crown corporations and other entities. Outstanding cheques and warrants are deducted to arrive at the closing cash balance.
Cash equivalents consist mainly of term deposits resulting from auctions administered by the Bank of Canada and the Department of Finance on behalf of the Minister of Finance. The short term deposits, denominated in Canadian dollars, are made from a portion of the daily surplus of cash balance and have a short term maturity, usually not exceeding 31 calendar days.
Table 7.2 presents a summary of the cash and cash equivalents.
Table 7.2 Cash and cash equivalents (in dollars)
March 31, 2016 March 31, 2015
Cash in bank
Canadian currency1 ................................................................................................................................................... 22,454,849,973 21,463,464,272 Foreign currencies2 ................................................................................................................................................... 2,548,439,002 283,189,353 Special deposits3 ....................................................................................................................................................... 50,000,000 50,000,000
Total cash in bank ............................................................................................................................................... 25,053,288,975 21,796,653,625
Cash in transit Cash in hands of collectors and in transit ................................................................................................................. 10,911,316,514 10,437,353,804 Other cash—Consolidated Crown corporations and other entities4 ......................................................................... 892,706,000 782,854,000
Total cash in transit ............................................................................................................................................. 11,804,022,514 11,220,207,804
Less: Outstanding cheques and warrants Outstanding cheques5 ................................................................................................................................................ 4,521,769,048 4,171,960,594 Imprest account cheques6 .......................................................................................................................................... 101,721 95,243
Total outstanding cheques and warrants ............................................................................................................. 4,521,870,769 4,172,055,837
Total cash ........................................................................................................................................................................ 32,335,440,720 28,844,805,592
Cash equivalents ............................................................................................................................................................. 6,235,037,405 6,154,036,000
Total cash and cash equivalents ..................................................................................................................................... 38,570,478,125 34,998,841,592
1 Included in Canadian currency is $20 billion ($20 billion in 2015) with respect to the Prudential Liquidity Fund. 2 These balances denominated in US dollars include cash and cash equivalents which have been translated into Canadian dollars at March 31. 3 These are balances in the hands of financial institutions for the reimbursement of GST refund payments issued by the Ministère du Revenu du Québec on behalf of the
Government. 4 These funds are not public moneys to the credit of the Receiver General for Canada but are for the exclusive use of consolidated Crown corporations and other entities. 5 Receiver General cheques issued in Canadian dollars, and outstanding are recorded in this account. Cheques outstanding for 10 years are transferred to other revenues. During
the year, an amount of $46,274,963 ($39,985,026 in 2015) was transferred to other revenues. Cheques in foreign currencies are credited to the Government’s cash account at the time of issue.
6 Imprest account cheques issued and unpaid at March 31, with the exception of those outstanding for 10 years or more (which have been transferred to other revenues), are recorded in this account.
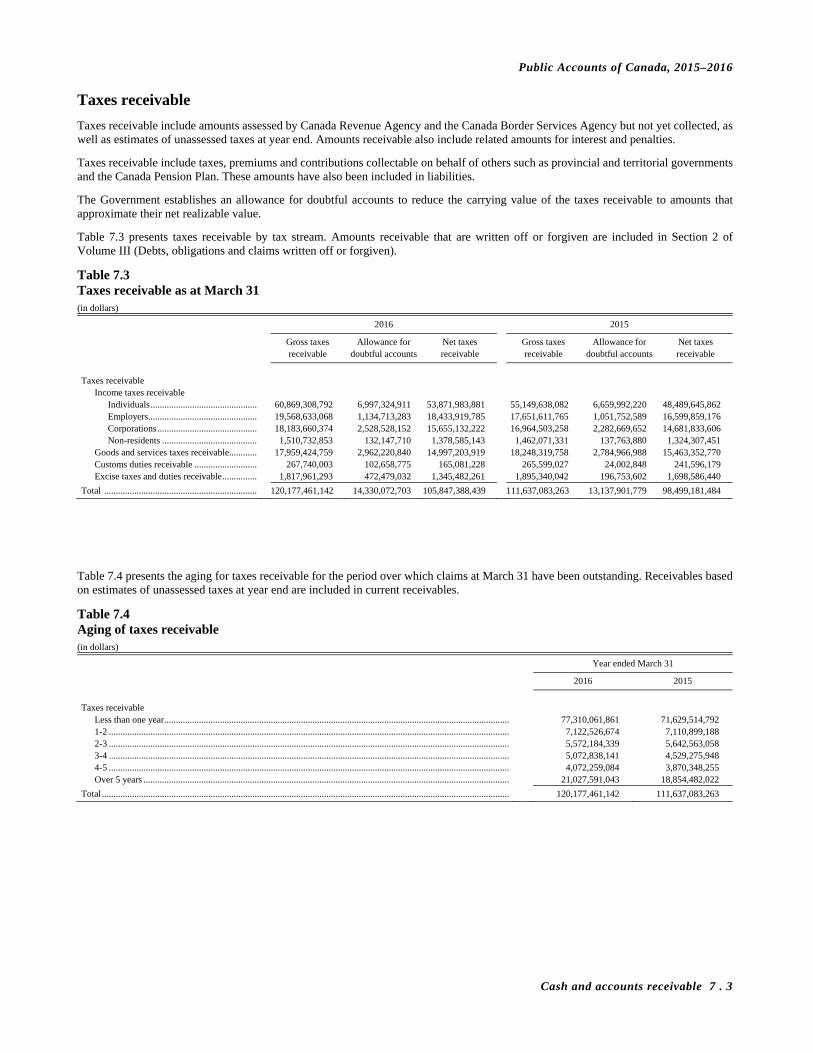
Public Accounts of Canada, 2015–2016
Cash and accounts receivable 7 . 3
Taxes receivable
Taxes receivable include amounts assessed by Canada Revenue Agency and the Canada Border Services Agency but not yet collected, as well as estimates of unassessed taxes at year end. Amounts receivable also include related amounts for interest and penalties.
Taxes receivable include taxes, premiums and contributions collectable on behalf of others such as provincial and territorial governments and the Canada Pension Plan. These amounts have also been included in liabilities.
The Government establishes an allowance for doubtful accounts to reduce the carrying value of the taxes receivable to amounts that approximate their net realizable value.
Table 7.3 presents taxes receivable by tax stream. Amounts receivable that are written off or forgiven are included in Section 2 of Volume III (Debts, obligations and claims written off or forgiven).
Table 7.3 Taxes receivable as at March 31 (in dollars)
2016 2015
Gross taxes Allowance for Net taxes Gross taxes Allowance for Net taxes receivable doubtful accounts receivable receivable doubtful accounts receivable
Taxes receivable
Income taxes receivable Individuals .............................................. 60,869,308,792 6,997,324,911 53,871,983,881 55,149,638,082 6,659,992,220 48,489,645,862 Employers............................................... 19,568,633,068 1,134,713,283 18,433,919,785 17,651,611,765 1,051,752,589 16,599,859,176 Corporations ........................................... 18,183,660,374 2,528,528,152 15,655,132,222 16,964,503,258 2,282,669,652 14,681,833,606 Non-residents ......................................... 1,510,732,853 132,147,710 1,378,585,143 1,462,071,331 137,763,880 1,324,307,451
Goods and services taxes receivable ............ 17,959,424,759 2,962,220,840 14,997,203,919 18,248,319,758 2,784,966,988 15,463,352,770 Customs duties receivable ........................... 267,740,003 102,658,775 165,081,228 265,599,027 24,002,848 241,596,179 Excise taxes and duties receivable ............... 1,817,961,293 472,479,032 1,345,482,261 1,895,340,042 196,753,602 1,698,586,440
Total .................................................................. 120,177,461,142 14,330,072,703 105,847,388,439 111,637,083,263 13,137,901,779 98,499,181,484
Table 7.4 presents the aging for taxes receivable for the period over which claims at March 31 have been outstanding. Receivables based on estimates of unassessed taxes at year end are included in current receivables.
Table 7.4 Aging of taxes receivable (in dollars)
Year ended March 31
2016 2015
Taxes receivable
Less than one year ..................................................................................................................................................... 77,310,061,861 71,629,514,792 1-2 ............................................................................................................................................................................. 7,122,526,674 7,110,899,188 2-3 ............................................................................................................................................................................. 5,572,184,339 5,642,563,058 3-4 ............................................................................................................................................................................. 5,072,838,141 4,529,275,948 4-5 ............................................................................................................................................................................. 4,072,259,084 3,870,348,255 Over 5 years .............................................................................................................................................................. 21,027,591,043 18,854,482,022
Total ................................................................................................................................................................................ 120,177,461,142 111,637,083,263

Public Accounts of Canada, 2015–2016
7 . 4 Cash and accounts receivable
Other accounts receivable
Other accounts receivable represent billed (but uncollected) and unbilled or accrued financial claims arising from amounts owed to the Government for use of its assets or from the proceeds for provision of services, and cash collateral pledged to counterparties, as of March 31, 2016.
Amounts receivable written off or forgiven are included in Section 2 of Volume III (Debts, obligations and claims written off or forgiven).
Table 7.5 presents a summary of the balances for other accounts receivable.
Table 7.5 Other accounts receivable as at March 31 (in dollars)
2016 2015
Gross Allowance for Net Gross Allowance for Net receivables doubtful accounts receivables receivables doubtful accounts receivables
Other receivables1 .............................................. 5,665,273,881 2,591,056,606 3,074,217,275 4,777,571,810 2,219,790,944 2,557,780,866 Cash collateral pledged to counterparties2 ........ 6,556,958,695 – 6,556,958,695 – – – Accounts receivable of consolidated Crown
corporations and other entities ..................... 639,040,000 – 639,040,000 640,518,000 – 640,518,000
Total ................................................................... 12,861,272,576 2,591,056,606 10,270,215,970 5,418,089,810 2,219,790,944 3,198,298,866
1 Other receivables are the financial claims owed to the Government and arising from other revenues. 2 Cash collateral pledged to counterparties represents collateral support under International Swaps and Derivatives Association (ISDA) master agreements in respect of
outstanding cross-currency swap arrangements.
Table 7.6 presents the aging of other accounts receivable for the period over which claims at March 31 have been outstanding.
Table 7.6 Aging of other accounts receivable (in dollars)
Year ended March 31
2016 2015
Outstanding days
0-30 ........................................................................................................................................................................... 1,987,314,947 1,459,142,044 31-60 ......................................................................................................................................................................... 110,273,828 180,169,914 61-90 ......................................................................................................................................................................... 68,516,086 161,232,978 91-365 ....................................................................................................................................................................... 618,226,186 495,045,788 Over 365 .................................................................................................................................................................... 2,880,942,834 2,481,981,086
Total ................................................................................................................................................................................ 5,665,273,881 4,777,571,810
Cash collateral pledged to counterparties ....................................................................................................................... 6,556,958,695 – Accounts receivable of consolidated Crown corporations and other entities ................................................................ 639,040,000 640,518,000
Total ................................................................................................................................................................................ 12,861,272,576 5,418,089,810
Section 8
2015–2016
Public Accounts of Canada
Foreign exchange accounts Table of contents Page
International reserves held in the Exchange Fund Account............ 8.3 International Monetary Fund ........................................................... 8.4 Special drawing rights allocations ................................................... 8.4 Supplementary statement
Exchange Fund Account.............................................................. 8.5
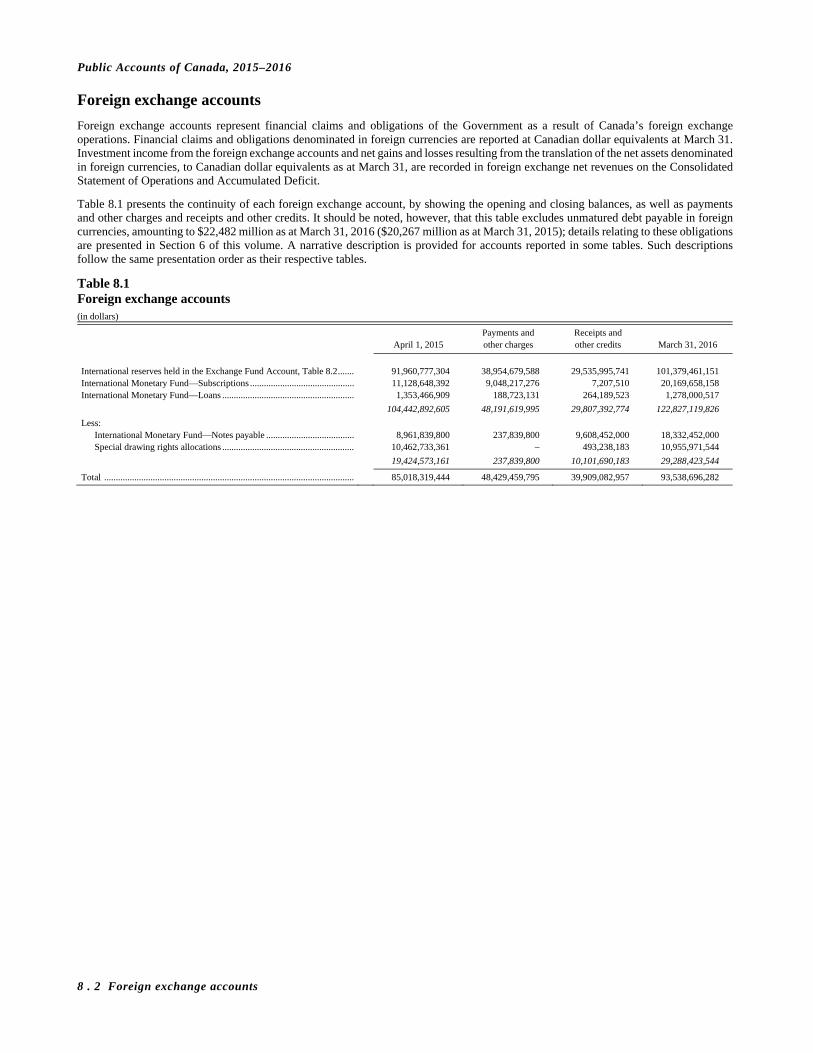
Public Accounts of Canada, 2015–2016
8 . 2 Foreign exchange accounts
Foreign exchange accounts
Foreign exchange accounts represent financial claims and obligations of the Government as a result of Canada’s foreign exchange operations. Financial claims and obligations denominated in foreign currencies are reported at Canadian dollar equivalents at March 31. Investment income from the foreign exchange accounts and net gains and losses resulting from the translation of the net assets denominated in foreign currencies, to Canadian dollar equivalents as at March 31, are recorded in foreign exchange net revenues on the Consolidated Statement of Operations and Accumulated Deficit.
Table 8.1 presents the continuity of each foreign exchange account, by showing the opening and closing balances, as well as payments and other charges and receipts and other credits. It should be noted, however, that this table excludes unmatured debt payable in foreign currencies, amounting to $22,482 million as at March 31, 2016 ($20,267 million as at March 31, 2015); details relating to these obligations are presented in Section 6 of this volume. A narrative description is provided for accounts reported in some tables. Such descriptions follow the same presentation order as their respective tables.
Table 8.1 Foreign exchange accounts (in dollars)
Payments and Receipts and April 1, 2015 other charges other credits March 31, 2016
International reserves held in the Exchange Fund Account, Table 8.2 ....... 91,960,777,304 38,954,679,588 29,535,995,741 101,379,461,151 International Monetary Fund—Subscriptions ............................................. 11,128,648,392 9,048,217,276 7,207,510 20,169,658,158 International Monetary Fund—Loans ......................................................... 1,353,466,909 188,723,131 264,189,523 1,278,000,517
104,442,892,605 48,191,619,995 29,807,392,774 122,827,119,826
Less: International Monetary Fund—Notes payable ...................................... 8,961,839,800 237,839,800 9,608,452,000 18,332,452,000 Special drawing rights allocations ......................................................... 10,462,733,361 – 493,238,183 10,955,971,544
19,424,573,161 237,839,800 10,101,690,183 29,288,423,544
Total ............................................................................................................ 85,018,319,444 48,429,459,795 39,909,082,957 93,538,696,282

Public Accounts of Canada, 2015–2016
Foreign exchange accounts 8 . 3
International reserves held in the Exchange Fund Account
This account records the moneys advanced from the Government to the Exchange Fund Account, in Canadian and other currencies, for the purchase of gold, foreign currencies and securities, and special drawing rights (SDRs).
The Exchange Fund Account is operated under the provisions of the Currency Act. The financial statements at March 31, 2016 are found at the end of this section.
Table 8.2 shows international reserves held in and advances to the Exchange Fund Account as at March 31, 2016.
In 2015–2016, payments and other charges consisted of advances to the Exchange Fund Account in the amount of $34,127 million, an adjustment of $2,187 million to recognize the net income of the Exchange Fund Account for the period April 1, 2015 to March 31, 2016, and a net valuation adjustment of $2,641 million. Receipts and other credits consisted of repayments of advances of $29,536 million.
Table 8.2 International reserves held in the Exchange Fund Account (in millions of dollars)
March 31, 2016 March 31, 2015
US dollar cash and cash equivalents ............................................................................................................................... 5,303 441 US dollar marketable securities ....................................................................................................................................... 56,638 60,558 Euro cash and cash equivalents ....................................................................................................................................... 304 189 Euro marketable securities............................................................................................................................................... 20,162 17,685 British pound sterling cash and cash equivalents ............................................................................................................ 114 48 British pound sterling marketable securities ................................................................................................................... 7,534 2,405 Japanese yen cash and cash equivalents .......................................................................................................................... 181 17 Japanese yen marketable securities ................................................................................................................................. 712 794 Short-term deposits .......................................................................................................................................................... – – Special drawing rights ..................................................................................................................................................... 10,431 9,818 Gold ................................................................................................................................................................................. – 6
Total ................................................................................................................................................................................. 101,379 91,961
Advances by the Consolidated Revenue Fund were denominated as follows: US dollar .................................................................................................................................................................... 64,406 63,301 Euro ............................................................................................................................................................................ 19,415 16,822 British pound sterling ................................................................................................................................................. 7,653 2,440 Japanese yen ............................................................................................................................................................... 871 797 Special drawing rights (2016, SDR 3,435 million; 2015, SDR 4,599 million)......................................................... 6,285 8,035 Canadian dollar .......................................................................................................................................................... 562 (274)
Total advances from the Consolidated Revenue Fund .............................................................................................. 99,192 91,121
Total net revenue for the year .......................................................................................................................................... 2,187 840
Total ................................................................................................................................................................................. 101,379 91,961
Public Accounts of Canada, 2015–2016
8 . 4 Foreign exchange accounts
International Monetary Fund
Subscriptions
This account records the value of Canada’s subscription (its “quota”) to the capital of the International Monetary Fund (IMF).
The amount by which the sum of Canada’s subscriptions plus loans to the IMF under special facilities exceeds the IMF’s holdings of Canadian dollars represents the amount of foreign exchange which Canada is entitled to draw from the IMF on demand for balance of payments purposes. The subscription is expressed in terms of SDR, a unit of account defined in terms of a “basket” of four major currencies, the Euro, the US dollar, the British pound sterling and the Japanese yen.
Canada has accumulated its subscriptions through settlements to the IMF in Canadian dollars, gold and SDRs. Annual maintenance of value payments are made to, or received from, the IMF when the Canadian dollar depreciates or appreciates against the SDR, in order to maintain the SDR-value of the IMF’s holdings of Canadian dollars.
In 2015–2016, payments and other charges consisted of an increase in subscriptions of $9,048 million (SDR 4,655 million). The receipts and other credits consisted of a valuation adjustment of $7 million.
Loans
This account records the value of interest-bearing loans made under Canada’s multi-lateral and bi-lateral borrowing arrangements with the IMF. The purpose of these arrangements is to provide temporary resources for IMF-member countries requiring balance of payment assistance.
There are two outstanding lending arrangements with the IMF outside of the quota system: the multi-lateral New Arrangements to Borrow (NAB) and General Arrangements to Borrow (GAB).
Canada’s current participation in the NAB is governed by technical amendments from December, 2011, made as a result of the IMF’s 14th General Review of Quotas. The maximum lending by Canada to the IMF under these arrangements is limited to SDR 3,874 million. As at March 31, 2016, SDR 699 million or $1,278 million (SDR 775 million or $1,353 million in 2015) in lending have been provided to the IMF under the NAB.
Canada also participates in the GAB which was renewed in December 2013. The maximum lending by Canada to the IMF under these arrangements is limited to SDR 893 million. As at March 31, 2016, no lending had been provided to the IMF under the GAB.
Collectively, the outstanding loans under multi-lateral arrangements with the IMF cannot exceed SDR 4,767 million at any given time. This reflects the maximum commitment under both the NAB and GAB.
At March 31, 2016, a total of SDR 699 million or $1,278 million was outstanding under these arrangements. Amounts advanced under these arrangements are considered part of the Official International Reserves of Canada.
Notes payable
This account records non-marketable, non-interest bearing notes issued by the Government to the IMF. These notes are payable on demand and are subject to redemption or re-issue, depending on the needs of the IMF for Canadian currency.
Canadian dollar holdings of the IMF include these notes and a small working balance (initially equal to one-quarter of one per cent of Canada’s subscription) held on deposit at the Bank of Canada. In 2015–2016, notes payable to the IMF increased by $9,370 million.
Special drawing rights allocations
This account records the value of SDRs allocated to Canada by the IMF. The SDR is an international currency created by the IMF, and allocated to countries participating in its Special Drawing Rights Department. It represents a liability of Canada, as circumstances could arise whereby Canada could be called upon to repay these allocations, in part or in total.
As an asset, SDRs represent rights to purchase currencies of other countries participating in the IMF’s Special Drawing Rights Department, as well as to make payments to the IMF itself. All SDRs allocated to Canada by the IMF have either been used to settle subscriptions in the IMF, or have been advanced to the Exchange Fund Account.
There was no allocation of SDRs by the IMF to Canada during the year. In 2015–2016, receipts and other credits consisted of a valuation adjustment of $493 million.
Public Accounts of Canada, 2015–2016
Foreign exchange accounts 8 . 5
Supplementary statement
Exchange Fund Account
Statement of financial position (unaudited) as at 31 March (in millions of Canadian dollars)
2016 2015
Financial assets
Cash and cash equivalents (Note 2, Note 3) .................................................................................................................................... 5,902 695 Investments (Note 2, Note 3)
Marketable securities ................................................................................................................................................................. 85,046 81,442 Special drawing rights ................................................................................................................................................................ 10,431 9,818 Gold ............................................................................................................................................................................................ – 6
Total investments ............................................................................................................................................................................. 95,477 91,266
Total financial assets ............................................................................................................................................................................. 101,379 91,961
Liabilities
Due to the Consolidated Revenue Fund (Note 4) ............................................................................................................................ 101,379 91,961
The accompanying notes are an integral part of these financial statements. Paul Rochon Deputy Minister Department of Finance
Christopher Meyers, CPA, CA Chief Financial Officer Department of Finance
Statement of operations (unaudited) for the year ended 31 March (in millions of Canadian dollars)
2016 2015
Net revenue from investments
Marketable securities Interest ........................................................................................................................................................................................ 1,235 1,152 Net gains on sales of marketable securities ............................................................................................................................... 793 238 Transaction costs and other ........................................................................................................................................................ (2) (4)
Interest on cash and cash equivalents .............................................................................................................................................. 7 – Interest on special drawing rights .................................................................................................................................................... 5 6 Gains on sales of gold ...................................................................................................................................................................... 140 –
Total net revenue from investments ...................................................................................................................................................... 2,178 1,392
Other Net foreign exchange gain (loss) ..................................................................................................................................................... 9 (552)
Net revenue for the year (Note 2) ....................................................................................................................................................... 2,187 840
The accompanying notes are an integral part of these financial statements.
Public Accounts of Canada, 2015–2016
8 . 6 Foreign exchange accounts
Exchange Fund Account—continued
Notes to the financial statements for the year ended 31 March 2016 (unaudited)
1. Authority and objectives
The Exchange Fund Account (the Account) is governed by Part II of the Currency Act. The Account is in the name of the Minister of Finance and is administered by the Bank of Canada as fiscal agent. The Financial Administration Act does not apply to the Account.
The legislative mandate of the Account is to aid in the control and protection of the external value of the Canadian dollar. The Minister of Finance empowers the Account to acquire or sell assets deemed appropriate for this purpose, in accordance with the Account’s Statement of Investment Policy.
Assets held in the Account are managed to provide foreign-currency liquidity to the government and to promote orderly conditions for the Canadian dollar in foreign exchange markets, if required. Canada’s current policy is to intervene in foreign exchange markets on a discretionary, rather than a systematic, basis and only in the most exceptional of circumstances. Since September 1998, no transactions have been aimed at moderating movements in the value of Canadian dollar.
In accordance with the Currency Act, the net revenue for the year is paid to or charged to the Consolidated Revenue Fund (CRF) of the Government of Canada within three months after the end of the fiscal year, and the Minister of Finance reports to Parliament on the operations of the Account within the first 60 days on which Parliament is sitting after the end of the fiscal year. These statements have been prepared by the Department of Finance.
2. Significant accounting policies
As stipulated in the Currency Act, the financial statements of the Account are prepared in a manner consistent with the accounting policies used by the Government of Canada to prepare its financial statements.
(a) Revenue recognition
Revenue from investments is recognized on an accrual basis and includes interest earned (including the amortization of premiums and discounts), gains or losses on sales of securities and on sales of gold, and revenues from securities lending activities. Interest is accrued on short-term deposits, deposits held under repurchase agreements, marketable securities, and special drawing rights (SDRs).
(b) Expense recognition
The Account’s administrative, custodial, and fiscal agency services are provided and paid for by the Bank of Canada and the Department of Finance. These costs have not been recognized in the Statements.
In addition, the notional cost of the funding of the Account’s assets and advances from the CRF is not recognized in the Statements.
(c) Financial assets
Cash and cash equivalents
Cash and cash equivalents consists of cash on hand and short-term deposits. Short-term deposits are measured at cost and are generally held to maturity. The resulting revenue is included in interest on cash and cash equivalents.
Deposits held under repurchase agreements
Deposits held under repurchase agreements are measured at cost. The resulting revenue is included in Net revenue from marketable securities. As of 31 March 2016 and 31 March 2015 the Account did not hold any deposits held under repurchase agreements.
Marketable securities
Purchases and sales of securities are recognized at the settlement dates. Marketable securities are measured at cost and are adjusted for amortization of purchase discounts and premiums on a straight-line basis over the term to maturity of the security. The carrying value of marketable securities includes accrued interest.
On de-recognition of a financial asset measured at amortized cost, the difference between the asset’s carrying amount and the sum of the consideration received and receivable is recognized in net revenue.
For short-term deposits, deposits held under repurchase agreements and marketable securities, the Bank assesses at the end of each reporting period whether there is an other-than-temporary impairment in value. Once impaired, these assets remeasured at their recoverable amount with the amount of the impairment recognized in Total net revenue from investments in the statement of operations.
Public Accounts of Canada, 2015–2016
Foreign exchange accounts 8 . 7
Exchange Fund Account—continued
Notes to the financial statements for the year ended 31 March 2016 (unaudited)—continued
Securities lending program
Under the securities lending program, the Account has agency agreements with two major financial institutions. Loans of securities are effected on behalf of the Account by these agents, who guarantee the loans and obtain collateral of equal or greater value from approved counterparties. These transactions can range from 1 to 31 days in duration. The securities loaned continue to be accounted for as investment assets. Income on securities lending transactions is included in Total net revenue from investments in the statement of operations.
Special drawing rights
The SDR serves as the unit of account for the International Monetary Fund (IMF) and its value is based on a “basket” of four major currencies: the Euro, the US dollar, the British pound sterling and the Japanese yen. On 30 November 2015 the Executive Board of the IMF decided to include the Chinese renminbi in the SDR basket effective 1 October 2016.
SDRs are initially recognized at cost and are subsequently remeasured at each reporting date into Canadian dollars at market exchange rates.
Gold
Gold is carried in the Account at a value of 35 SDRs per fine ounce.
Translation of foreign currencies and special drawing rights
Assets denominated in foreign currencies and SDRs are translated into Canadian-dollar equivalents at the rates prevailing as of March 31, which were as follows:
2016 2015
US dollar ..................................................................................................................................................................................................... 1.2987 1.2666 Euro ............................................................................................................................................................................................................. 1.4777 1.3615 Japanese yen ............................................................................................................................................................................................... 0.0115 0.0106 British pound sterling ................................................................................................................................................................................. 1.8654 1.8792 SDR ............................................................................................................................................................................................................. 1.8296 1.7473
Gains or losses resulting from the translation of assets and advances from the CRF denominated in foreign currencies and SDRs, as well as from transactions throughout the fiscal year, are recognized as net foreign exchange gains or losses and are included in the statement of operations.
Investment revenue in foreign currencies and SDRs is translated into Canadian-dollars at the foreign exchange rates prevailing on the date the revenue is earned.
(d) Use of estimates and measurement uncertainty
The preparation of the Statements requires management to make estimates and assumptions based on information available as of the date of the Statements. Significant estimates are primarily in the area of the fair values of financial instruments, including any impairment (Note 3).

Public Accounts of Canada, 2015–2016
8 . 8 Foreign exchange accounts
Exchange Fund Account—continued
Notes to the financial statements for the year ended 31 March 2016 (unaudited)—continued
3. Financial instruments
Fair value of financial assets (in millions of Canadian dollars)
31 March 2016 31 March 2015
Carrying amount Fair value Carrying amount Fair value
Cash and cash equivalents
US dollar ..................................................................................................... 5,303 5,303 441 441 Euro ............................................................................................................. 304 304 189 189 Japanese yen ................................................................................................ 181 181 17 17 British pound sterling .................................................................................. 114 114 48 48
Total cash and cash equivalents ....................................................................... 5,902 5,902 695 695
Investments Marketable securities
US dollar ............................................................................................... 56,638 57,685 60,558 61,895 Euro ....................................................................................................... 20,161 21,132 17,685 19,088 Japanese yen .......................................................................................... 712 720 794 797 British pound sterling ............................................................................ 7,535 7,810 2,405 2,461
Total marketable securities ......................................................................... 85,046 87,347 81,442 84,241
SDR ............................................................................................................. 10,431 10,431 9,818 9,818 Gold ............................................................................................................. – – 6 144
Total investments .............................................................................................. 95,477 97,778 91,266 94,203
Total financial assets ........................................................................................ 101,379 103,680 91,961 94,898
The estimated fair value of cash and cash equivalents approximates their carrying value, given their short term to maturity.
The estimated fair values of marketable securities are based on quoted market prices and include accrued interest. If such prices are not available, the fair value is determined by discounting future cash flows using an appropriate yield curve. During the year, and in the prior year, no marketable securities were written down to reflect an other-than-temporary impairment in value.
Since SDRs are translated into Canadian-dollar equivalents at the rates prevailing at the Statements date, the carrying value approximates fair value on the reporting date.
The portfolio of gold holdings was sold during the year for a gain of $140 million. The estimated fair value of gold at 31 March 2015 was based on the London gold fixing of $1,503.45 per fine ounce.

Public Accounts of Canada, 2015–2016
Foreign exchange accounts 8 . 9
Exchange Fund Account—continued
Notes to the financial statements for the year ended 31 March 2016 (unaudited)—continued
Credit risk
Credit risk is the risk that a counterparty to a financial contract will cause a loss to the Account by failing to discharge its obligations in accordance with agreed upon terms.
To ensure that the Account’s asset portfolio is prudently diversified with respect to credit risk, the Statement of Investment Policy prescribed by the Minister of Finance specifies limits on holdings by class of issuer (sovereign, agency, supranational, corporation or commercial financial institution), by any one issuer or counterparty, and by type of instruments.
The Statement of Investment Policy also specifies the treatment of holdings that do not meet eligibility criteria or limits due to exceptional circumstances such as ratings downgrades.
With respect to the Statement of Investment Policy, the Account may hold fixed income securities of highly rated sovereigns, central banks, government-supported entities and supranational organizations. To be eligible for investment, an entity must have a credit rating in the top seven categories from two of four designated rating agencies (Standard & Poor’s, Moody’s, Fitch, and Dominion Bond Rating Service). The Account may also make deposits and execute other transactions, up to prescribed limits, with commercial financial institutions that meet the same rating criteria.
As stipulated in the Currency Act, the Minister of Finance may appoint agents to perform services concerning the Account. Through the securities-lending program, agents can lend securities only up to a prescribed maximum amount and only to a list of approved counterparties. Each borrower must enter into a Securities Loan Agreement with at least one of the agents. Borrowers are also required to provide collateral for securities borrowed, according to a specific list approved by the Government. Collateral is limited to specific security types, terms to maturity, and credit ratings.
The agents also provide an indemnity in the event of default by the borrower. The Account enters into securities lending transactions in order to increase its return on investments.
Market risk
Market risk is the risk that the fair value or future cash flows of a financial instrument will fluctuate due to changes in market prices. Market risk comprises three types of risk: interest rate risk, currency risk, and other price risk. Interest rate risk is the risk that the fair value or future cash flows of a financial instrument will fluctuate due to changes in market interest rates. Currency risk is the risk that the fair value or future cash flows of a financial instrument will fluctuate because of changes in foreign exchange rates. Other price risk is the risk that the fair value or future cash flows of a financial instrument will fluctuate because of changes in market prices, other than those arising from interest rate risk or currency risk. The Account is not exposed to significant other price risk.
Interest rate and currency risks are managed, with due consideration of the risk to the Government of Canada, through the asset-liability management policy. This policy utilizes a strategy of matching the duration structure and the currency of the Account’s assets with the foreign currency borrowings of the Government of Canada that notionally finance the Account’s assets. Other price risks are mitigated by holding high quality liquid assets.
Liquidity risk
Liquidity risk is the risk that an entity will encounter difficulty in meeting its obligations associated with financial liabilities. Liquidity risk is minimized by limiting the portion of the Government of Canada’s foreign liabilities that needs to be renewed within a one year period. In addition, liquidity risk is mitigated by holding short-term investments that are matched to the Government of Canada’s maturing liabilities in foreign currencies.
Securities lending
As at 31 March 2016, the Account’s investments included securities held by its agents in connection with the securities-lending program. Investments with a fair market value of $385 million ($387 million at 31 March 2015) and an amortized cost of $387 million ($380 million at 31 March 2015) were being used in the securities-lending program.
No securities were lent to eligible borrowers at the reporting date (nil at 31 March 2015).

Public Accounts of Canada, 2015–2016
8 . 10 Foreign exchange accounts
Exchange Fund Account—concluded
Notes to the financial statements for the year ended 31 March 2016 (unaudited)—concluded
4. Due to the Consolidated Revenue Fund (CRF)
The Account is funded by the Government of Canada through interest-free advances from the CRF. Advances to the Account from the CRF are authorized by the Minister of Finance under the terms and conditions prescribed by the Minister of Finance. Pursuant to Section 19 of the Currency Act, these advances are limited to US $150 billion by order of the Minister of Finance effective 26 March 2015.
The CRF advances the proceeds of the Government of Canada’s borrowings in foreign currencies and allocations of SDRs by IMF to the Account. Subsequent repayments of foreign currency debt are made using the assets of the Account and result in reductions of foreign currency advances from the CRF.
The Account requires Canadian-dollar advances to settle its purchases of foreign currencies. Canadian dollars received from sales of foreign currencies are remitted to the CRF. This, together with foreign currency payments made on behalf of the Government of Canada, causes reductions in the level of outstanding Canadian-dollar advances and can result in overall net deposits of Canadian-dollars by the Account with the CRF.
At 31 March, advances from the CRF were comprised of the following currencies:
Currency composition of advances from the CRF (in millions of Canadian dollars)
2016 2015
US dollar ................................................................................................................................................................................................ 64,406 63,301 Euro ........................................................................................................................................................................................................ 19,415 16,822 Japanese yen .......................................................................................................................................................................................... 871 2,440 British pound sterling ............................................................................................................................................................................ 7,653 797 SDR ........................................................................................................................................................................................................ 6,285 8,035
Subtotal—Foreign currencies ................................................................................................................................................................ 98,630 91,395
Canadian dollar ...................................................................................................................................................................................... 562 (274) Net revenue ............................................................................................................................................................................................ 2,187 840
Total ...................................................................................................................................................................................................... 101,379 91,961
Section 9
2015–2016
Public Accounts of Canada
Loans, investments and advances Table of contents Page
Enterprise Crown corporations and other government business enterprises .................................................................. 9.4
Summary financial statements of enterprise Crown corporations and other government business enterprises................................................................................. 9.8
Borrowings by enterprise Crown corporations and other government business enterprises .............................. 9.14
Maturity and currency of borrowings by enterprise Crown corporations and other government businessenterprises................................................................................. 9.15
Contingent liabilities of enterprise Crown corporations and other government business enterprises .............................. 9.15
Contractual obligations of enterprise Crown corporationsand other government business enterprises .............................. 9.16
Financial assistance to enterprise Crown corporationsand other government business enterprises .............................. 9.16
Portfolio investments ....................................................................... 9.17 National governments including developing countries ................... 9.20 International organizations .............................................................. 9.24 Provincial and territorial governments ............................................ 9.29 Other loans, investments and advances ........................................... 9.31 Allowance for valuation .................................................................. 9.41

This page has been intentionally left blank.

Public Accounts of Canada, 2015–2016
Loans, investments and advances 9 . 3
Loans, investments and advances
Loans, investments and advances is a category of financial claims represented by debt instruments and ownership interests held by the Government of Canada acquired through the use of parliamentary appropriations, except for the portion of the investment balances representing adjustments for the equity of enterprise Crown corporations and other government business enterprises. Some of these appropriations permit repayments to be used for further loans and advances. Details of the use of non-budgetary appropriations, for loans, investments and advances, can be found in the ministerial sections of Volume II.
The investment in enterprise Crown corporations and other government business enterprises is accounted for under the modified equity method and is carried at cost which is adjusted for the annual profits or losses of the enterprises and reduced by any dividends paid by the corporations to the Government. Under the modified equity method, the accounting policies of the enterprise Crown corporations and other government business enterprises are not adjusted to conform to the Government’s accounting policies. The Government also reports any amounts receivable from or payable to these corporations and where the Government has advanced funds to the corporations to support their direct lending activities, the amounts are recorded as loans and advances by the Government.
Other loans, investments and advances are initially recorded at cost and are subject to annual valuation to reflect reductions from the recorded value to the approximate net recoverable value. Foreign currency transactions are translated and recorded in Canadian dollar equivalents at the exchange rates prevailing at the transaction dates. Balances of loans, investments and advances resulting from foreign currency transactions are reported at year-end closing rates of exchange; net gains and losses related to these sovereign loans are presented with the return on investments from these loans under other program revenues.
The allowance established to reflect reductions from the recorded value to the approximate net recoverable value of financial claims held by the Government has been authorized by the Minister of Finance and the President of the Treasury Board, under subsection 63(2) of the Financial Administration Act.
Revenues received during the year on loans, investments and advances, are credited to other revenues; details are provided in Section 3 of this volume and in Section 10 of Volume III.
Table 9.1 presents the transactions and year-end balances of loans, investments and advances by category.
Some tables in this section present the continuity of accounts, by showing the opening and closing balances, as well as payments and other charges and receipts and other credits. A narrative description is provided for accounts reported in some tables. Such descriptions follow the same presentation order as their respective tables.
Table 9.1 Loans, investments and advances (in dollars)
Payments and Receipts and April 1, 2015 other charges other credits March 31, 2016
Enterprise Crown corporations and other
government business enterprises, Table 9.2 .......................................... 89,374,816,914 59,428,431,837 57,687,566,809 91,115,681,942 Portfolio investments, Table 9.11 ................................................................ 78,204,351 – 4,608,891 73,595,460 National governments including developing countries, Table 9.12 ............ 987,937,466 39,297,354 61,223,245 966,011,575 International organizations, Table 9.13 ....................................................... 20,189,000,296 993,719,122 21,372,123 21,161,347,295 Provincial and territorial governments, Table 9.14 ..................................... 1,112,139,912 73,629,000 766,736,822 419,032,090 Other loans, investments and advances, Table 9.15 .................................... 28,245,810,702 6,641,943,082 5,290,576,094 29,597,177,690
139,987,909,641 67,177,020,395 63,832,083,984 143,332,846,052
Less: allowance for valuation ...................................................................... 26,306,691,248 1,646,629,023 577,043,483 27,376,276,788
Total ............................................................................................................. 113,681,218,393 65,530,391,372 63,255,040,501 115,956,569,264

Public Accounts of Canada, 2015–2016
9 . 4 Loans, investments and advances
Enterprise Crown corporations and other government business enterprises
Loans and advances to, and investments in, enterprise Crown corporations and other government business enterprises represent the balance of financial claims held by the Government against corporations and enterprises for working capital, capital expenditures and other purposes, investments in the capital stock of corporations, and loans and advances to corporations and enterprises for re-lending.
A Crown corporation means a parent Crown corporation or a wholly-owned subsidiary; a parent Crown corporation is wholly-owned directly by the Crown; a wholly-owned subsidiary is wholly-owned by one or more parent Crown corporations directly or indirectly through any number of subsidiaries.
Enterprise Crown corporations are a type of government business enterprise and are defined as those Crown corporations which are not dependent on parliamentary appropriations and whose principal activity and source of revenue is the sale of goods and services to outside parties. These include selected Crown corporations listed in Part I, all the Crown corporations listed in Part II of Schedule III of the Financial Administration Act and the Bank of Canada. Although a Crown corporation, the Canada Pension Plan Investment Board is not part of the Government reporting entity since its mandate is to manage an investment portfolio on behalf of the Canada Pension Plan which is itself excluded from the reporting entity.
There are also a number of self-sustaining government business enterprises that are not considered Crown corporations within the meaning of the Financial Administration Act, but which are controlled by the Government and in most cases accountable to Parliament through a Minister of the Crown for the conduct of their affairs. These are referred to as “other government business enterprises” and include the various Canada Port Authorities.
Most of the enterprise Crown corporations and other government business enterprises are agents of Her Majesty for the conduct of all or part of their activities. This status is granted in one of the following ways:
– designation by Parliament, through a special act of incorporation;
– statutory authorization; or
– proclamation by the Government Corporations Operation Act.
Further information on the business and activities of all parent Crown corporations and information on all Crown corporations and other corporate interests of Canada is provided in the quarterly report entitled Inventory of Government of Canada Organizations. Although no longer included as part of this Report, a compilation of the audited financial statements of the parent Crown corporations is also available upon request.
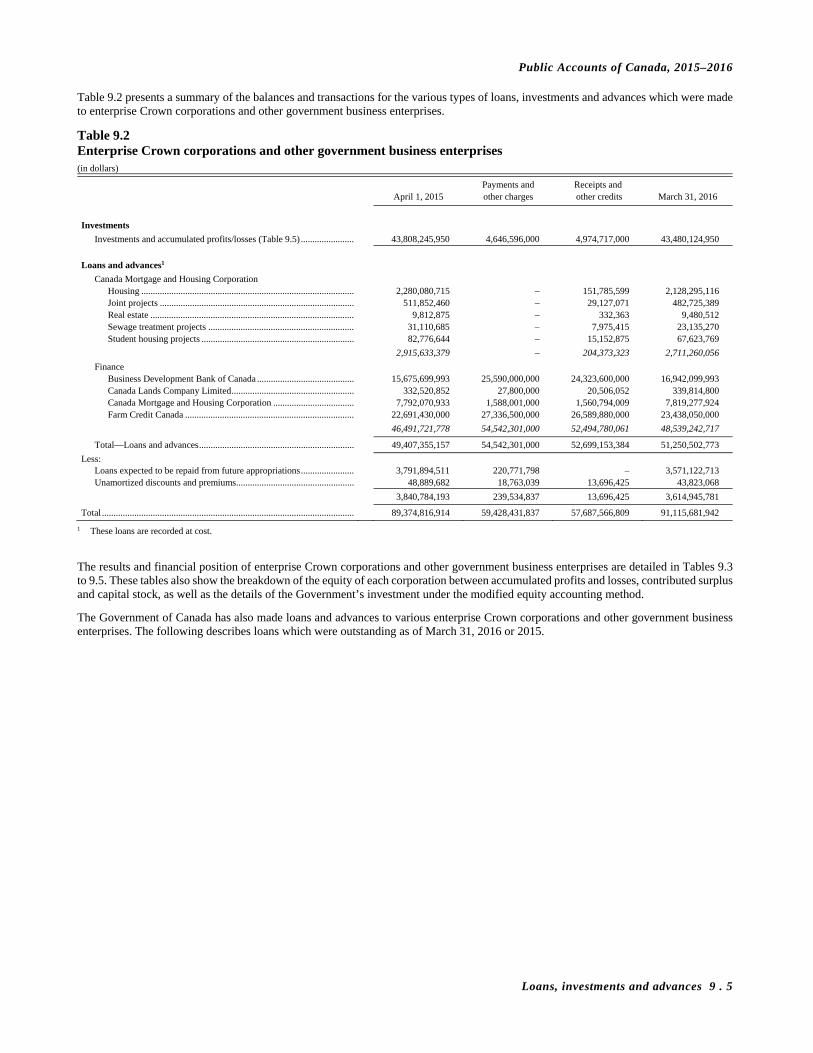
Public Accounts of Canada, 2015–2016
Loans, investments and advances 9 . 5
Table 9.2 presents a summary of the balances and transactions for the various types of loans, investments and advances which were made to enterprise Crown corporations and other government business enterprises.
Table 9.2 Enterprise Crown corporations and other government business enterprises (in dollars)
Payments and Receipts and April 1, 2015 other charges other credits March 31, 2016
Investments
Investments and accumulated profits/losses (Table 9.5) ....................... 43,808,245,950 4,646,596,000 4,974,717,000 43,480,124,950
Loans and advances1
Canada Mortgage and Housing Corporation Housing ............................................................................................ 2,280,080,715 – 151,785,599 2,128,295,116 Joint projects .................................................................................... 511,852,460 – 29,127,071 482,725,389 Real estate ........................................................................................ 9,812,875 – 332,363 9,480,512 Sewage treatment projects ............................................................... 31,110,685 – 7,975,415 23,135,270 Student housing projects .................................................................. 82,776,644 – 15,152,875 67,623,769
2,915,633,379 – 204,373,323 2,711,260,056
Finance Business Development Bank of Canada .......................................... 15,675,699,993 25,590,000,000 24,323,600,000 16,942,099,993 Canada Lands Company Limited ..................................................... 332,520,852 27,800,000 20,506,052 339,814,800 Canada Mortgage and Housing Corporation ................................... 7,792,070,933 1,588,001,000 1,560,794,009 7,819,277,924 Farm Credit Canada ......................................................................... 22,691,430,000 27,336,500,000 26,589,880,000 23,438,050,000
46,491,721,778 54,542,301,000 52,494,780,061 48,539,242,717
Total—Loans and advances ................................................................... 49,407,355,157 54,542,301,000 52,699,153,384 51,250,502,773
Less: Loans expected to be repaid from future appropriations ....................... 3,791,894,511 220,771,798 – 3,571,122,713 Unamortized discounts and premiums ................................................... 48,889,682 18,763,039 13,696,425 43,823,068
3,840,784,193 239,534,837 13,696,425 3,614,945,781
Total ............................................................................................................. 89,374,816,914 59,428,431,837 57,687,566,809 91,115,681,942
1 These loans are recorded at cost.
The results and financial position of enterprise Crown corporations and other government business enterprises are detailed in Tables 9.3 to 9.5. These tables also show the breakdown of the equity of each corporation between accumulated profits and losses, contributed surplus and capital stock, as well as the details of the Government’s investment under the modified equity accounting method.
The Government of Canada has also made loans and advances to various enterprise Crown corporations and other government business enterprises. The following describes loans which were outstanding as of March 31, 2016 or 2015.
Public Accounts of Canada, 2015–2016
9 . 6 Loans, investments and advances
Canada Mortgage and Housing Corporation
The Corporation was incorporated, on January 1, 1946, by the Canada Mortgage and Housing Corporation Act. The Corporation’s mandate, as stated in the National Housing Act, is to promote the construction, repair and modernization of housing, the improvement of housing and living conditions, housing affordability and choice, the availability of low-cost financing for housing, and the national well-being of the housing sector. Advances have been made to the Canada Mortgage and Housing Corporation to support various programs undertaken by the Corporation.
Housing
Advances made for moderate to low income housing bear interest at rates from 5.25 per cent to 16.10 per cent per annum, and are repayable over 1 to 50 years, with the final instalment due on March 31, 2037.
Joint projects
Advances made to undertake housing projects jointly with the provinces bear interest at rates from 5.13 per cent to 17.96 per cent per annum, and are repayable over 1 to 50 years, with the final instalment due on June 30, 2038.
Real estate
Advances made for the acquisition and development of real estate bear interest at rates from 10.07 per cent to 15 per cent per annum, and are repayable over 50 years, with the final instalment due on June 30, 2036.
Sewage treatment projects
Advances made to assist in the establishment or expansion of sewage treatment projects and the construction of trunk storm sewers bear interest at rates from 5 per cent to 9.63 per cent per annum, and are repayable over 20 to 50 years, with the final instalment due on March 31, 2023.
Student housing projects
Advances made for student housing projects bear interest at rates from 5.13 per cent to 10.05 per cent per annum, and are repayable over 20 to 50 years, with the final instalment due on April 1, 2030.
Business Development Bank of Canada
Direct lending to Crown corporations
The Business Development Bank of Canada (BDC) was established in 1974 by the Federal Business Development Bank of Canada Act and was continued under its current name by an Act of Parliament on July 13, 1995. The Corporation is a Crown corporation named in Part I of Schedule III to the Financial Administration Act, is wholly-owned by the Government of Canada and is not subject to the requirements of the Income Tax Act.
The role of the Corporation is to promote and assist in the establishment and development of business enterprises in Canada, with specific attention to small and medium-sized businesses. The Corporation provides a wide range of lending, investment and consulting services complementary to those of commercial financial institutions. The Corporation offers Canadian companies services tailored to meet the current needs of small and medium-sized businesses while earning an appropriate return on investment capital, which is used to further the Corporation’s activities.
Pursuant to Section 19 of the Business Development Bank of Canada Act, the federal government, at the request of the Corporation, may lend money to the Corporation on any terms and conditions that the Minister of Finance may fix.
Loans outstanding at year end bear interest at rates from 0.42 per cent to 1.12 per cent per annum.

Public Accounts of Canada, 2015–2016
Loans, investments and advances 9 . 7
Canada Lands Company Limited
Canada Lands Company Limited (originally Public Works Lands Company Limited) was incorporated under the Companies Act in 1956 and was continued under the Canada Business Corporations Act. The Corporation is a Crown corporation named in Part I of Schedule III of the Financial Administration Act and is wholly-owned by the Government of Canada. The Corporation conducts its business through Canada Lands Company CLC Limited (CLC), its principal wholly-owned subsidiary. CLC’s objective is to carry out a commercially-oriented and orderly disposal program of certain Government real properties and the management of certain select properties. In undertaking this objective, CLC may manage, develop and dispose of real properties, either in the capacity of owner or as agent of the Government.
CLC has acquired an interest in a number of real properties from the Government in consideration for the issuance of promissory notes, which bear no interest and are repayable from the proceeds of the sale of the properties in respect of which they were issued. The notes were discounted using the Consolidated Revenue Fund lending rate applicable to Crown corporations and recorded at their discounted value.
During the year, new notes have been issued for an amount of $27.8 million. An amount of $20.5 million was repaid during the year and an amount of $4.8 million was amortized to income. The balance in the account represents the balance of the notes receivable net of the corresponding unamortized discount.
Canada Mortgage and Housing Corporation
Direct lending to Crown corporations
Pursuant to Section 21(1) of the Canada Mortgage and Housing Corporation Act, the federal government, at the request of the Corporation, may, out of the Consolidated Revenue Fund, lend money to the Corporation on any terms and conditions that the Minister of Finance may fix.
Loans outstanding at year end bear interest at rates from 0.38 per cent to 3.94 per cent per annum.
Farm Credit Canada
Direct lending to Crown corporations
The Farm Credit Canada was established in 1959 by the Farm Credit Canada Act as the successor to the Canadian Farm Loan Board, and is a Crown corporation named in Part I of Schedule III to the Financial Administration Act. The Corporation is wholly-owned by the Government of Canada and is not subject to the requirements of the Income Tax Act.
The Corporation’s role is to enhance rural Canada by providing business and financial solutions for farm families and agribusiness. Additionally, the Corporation may deliver specific programs for the Government of Canada on a cost recovery basis.
Pursuant to Section 12(2) of the Farm Credit Canada Act, the federal government, at the request of the Corporation, may lend money to the Corporation on any terms and conditions that the Minister of Finance may fix.
Loans outstanding at year end bear interest at rates from 0.28 per cent to 3.84 per cent per annum.
Interest paid to the Government
Interest paid to the Government of Canada with respect to these loans in the years ended March 31, 2016 and 2015 is as follows:
(in millions of dollars)
2015–2016 2014–2015
Business Development Bank of Canada............................................................................................................................................... 76.2 127.4 Canada Mortgage and Housing Corporation ........................................................................................................................................ 438.9 595.4 Farm Credit Canada .............................................................................................................................................................................. 132.8 214.0
Total ...................................................................................................................................................................................................... 647.9 936.8

Public Accounts of Canada, 2015–2016
9 . 8 Loans, investments and advances
Summary financial statements of enterprise Crown corporations and other government business enterprises
The following tables display details of the assets, liabilities, equity, revenues and expenses of enterprise Crown corporations and other government business enterprises.
Tables 9.3 to 9.5 present the assets, liabilities, equity, revenues, expenses and other changes in equity of enterprise Crown corporations and other government business enterprises grouped in five segments. The segment of competitive, self-sustaining corporations consists of those corporations named in Part I of Schedule III of the Financial Administration Act and of other competitive and self-sustaining government business enterprises.
For those corporations having year ends other than March 31, the data are based on unaudited interim financial statements which have been prepared on a basis consistent with the most recent audited financial statements.
The tables summarize the financial transactions and results of operations of each enterprise Crown corporation and other government business enterprise in accordance with its own respective accounting policies. All enterprise Crown corporations and other government business enterprises follow International Financial Reporting Standards.
Financial assets include cash and cash equivalents, receivables, loans and investments. Financial assets are segregated between third parties and Government, Crown corporations and other entities. The financial assets reported under Government, Crown corporations and other entities represent receivables, loans and investments between related parties. Non-financial assets represent the unexpensed portion of capital assets, such as buildings, machinery and equipment in use or under construction, as well as inventories, prepayments and other items of expenditure which will be expensed as these assets are used. Liabilities include payables, borrowings and other obligations. Liabilities are segregated between third parties and Government, Crown corporations and other entities. Borrowings from third parties represent amounts repayable to financial institutions and other investors. Other third party liabilities are amounts due for purchases, pensions and other employee future benefits, accrued interest on borrowings, various other accruals, capital leases and sundry accounts payable. The liabilities reported under Government, Crown corporations and other entities represent payables and borrowings between related parties.
Revenues include financial assistance received or receivable from the Government in respect of the current year’s operations, when applicable. Expenses are segregated between third parties and Government, Crown corporations and other entities. Equity adjustments and other include prior period adjustments and other miscellaneous items recorded by the corporations and enterprises. Other comprehensive income or loss comprises certain unrealized gains and losses on financial instruments and certain actuarial gains and losses related to pensions and other employee future benefits which are recognized in comprehensive income but excluded from net income. Other comprehensive income is excluded from the calculation of the Government’s annual deficit. It is instead recorded directly to the Government’s accumulated deficit. Upon realization of the gains and losses on financial instruments, the associated amounts are reclassified to the profit or loss of enterprise Crown corporations and other government business enterprises and then, reflected in the government’s annual deficit. The actuarial gains and losses related to pensions and other employee future benefits are not reclassified. Equity transactions with the Government include dividends declared or transfers of profits to the Government, as well as equity contributions provided by the Government. Any unrealized inter-organizational gains and losses are eliminated as part of the modified equity accounting adjustment.
These tables present financial information on parent enterprise Crown corporations and other government business enterprises, as well as financial information on wholly-owned subsidiaries that are considered “deemed parent Crown corporations” and are excluded from the consolidated financial statements of their parent Crown corporations.
Enterprise Crown corporations and other government business enterprises are also categorized as being either agents or non-agents of the Crown. In some situations, agent status may be restricted to certain designated activities of a corporation.
A summary of financial assistance to enterprise Crown corporations and other government business enterprises for the year ended March 31, 2016 is provided in Table 9.10.

Public Accounts of Canada, 2015–2016
Loans, investments and advances 9 . 9
Table 9.3 Summary combined financial statements of enterprise Crown corporations and other government business enterprises by segment (in thousands of dollars)
Competitive, Bank of Lending and self-sustaining Canada insurance Marketing Other Total
Assets, liabilities and equity as at March 31, 2016 Assets
Financial Third parties ........................................................... 4,281,539 7,498,745 364,297,822 10,359 39,674 376,128,139 Government, Crown corporations and
other entities ..................................................... 2,399,919 91,151,717 7,543,424 – 4,073 101,099,133
Total financial assets .................................................... 6,681,458 98,650,462 371,841,246 10,359 43,747 477,227,272
Non-financial assets ..................................................... 7,227,158 548,447 1,051,053 43,930 36,726 8,907,314
Total assets as reported ...................................................... 13,908,616 99,198,909 372,892,299 54,289 80,473 486,134,586
Elimination adjustments .................................................... (336,178) 504 (420,545) – (102) (756,321)
Total assets......................................................................... 13,572,438 99,199,413 372,471,754 54,289 80,371 485,378,265
Liabilities Third parties
Borrowings ............................................................. 1,403,030 – 265,375,950 26,445 6,955 266,812,380 Bank of Canada notes in circulation and
amounts owing to depositors ............................ 74,080,223 74,080,223 Other liabilities ....................................................... 10,090,255 1,945,079 14,170,010 27,844 28,430 26,261,618
Government, Crown corporations and other entities ........................................................... 469,951 22,681,677 51,725,894 – 529 74,878,051
Total liabilities as reported ................................................ 11,963,236 98,706,979 331,271,854 54,289 35,914 442,032,272
Elimination adjustments .................................................... – – (134,131) – – (134,131)
Total liabilities ................................................................... 11,963,236 98,706,979 331,137,723 54,289 35,914 441,898,141
Equity of Canada as reported ............................................ 1,945,380 491,930 41,620,445 – 44,559 44,102,314 Elimination adjustments .................................................... (336,178) 504 (286,414) – (102) (622,190)
Equity of Canada ............................................................... 1,609,202 492,434 41,334,031 – 44,457 43,480,124
Total liabilities and equity ................................................. 13,572,438 99,199,413 372,471,754 54,289 80,371 485,378,265
Contingent liabilities .......................................................... 137,930 64,696 2,754,778 – – 2,957,404
Contractual obligations ...................................................... 1,804,342 238,597 45,167,346 – 11,674 47,221,959
Revenues, expenses and other changes in
equity for the year ended March 31, 2016 Revenues
Third parties ................................................................. 13,999,079 15,808 11,812,339 259,507 209,706 26,296,439 Government, Crown corporations and
other entities ........................................................... 426,124 1,712,334 2,180,136 – 86 4,318,680
Total revenues .................................................................... 14,425,203 1,728,142 13,992,475 259,507 209,792 30,615,119
Expenses Third parties ................................................................. 11,690,583 454,250 9,055,341 219,508 210,242 21,629,924 Government, Crown corporations and
other entities ........................................................... 255,340 115,885 1,161,205 – 1,595 1,534,025
Total expenses ................................................................... 11,945,923 570,135 10,216,546 219,508 211,837 23,163,949
Net income (loss) for the year ........................................... 2,479,280 1,158,007 3,775,929 39,999 (2,045) 7,451,170 Equity of Canada, beginning of the year as reported ........ 5,180,584 482,855 38,659,916 – 46,839 44,370,194 Equity adjustments and other ............................................ (252) (504) (10) (39,999) – (40,765) Elimination adjustments .................................................... (336,178) 504 (286,414) – (102) (622,190) Other comprehensive income (loss) .................................. (2,356,926) (34,285) (312,122) – (235) (2,703,568) Equity transactions with the Government
Dividends ..................................................................... (2,234,073) (1,114,143) (653,268) – – (4,001,484) Capital .......................................................................... (1,123,233) – 150,000 – – (973,233)
Equity of Canada, end of the year ..................................... 1,609,202 492,434 41,334,031 – 44,457 43,480,124
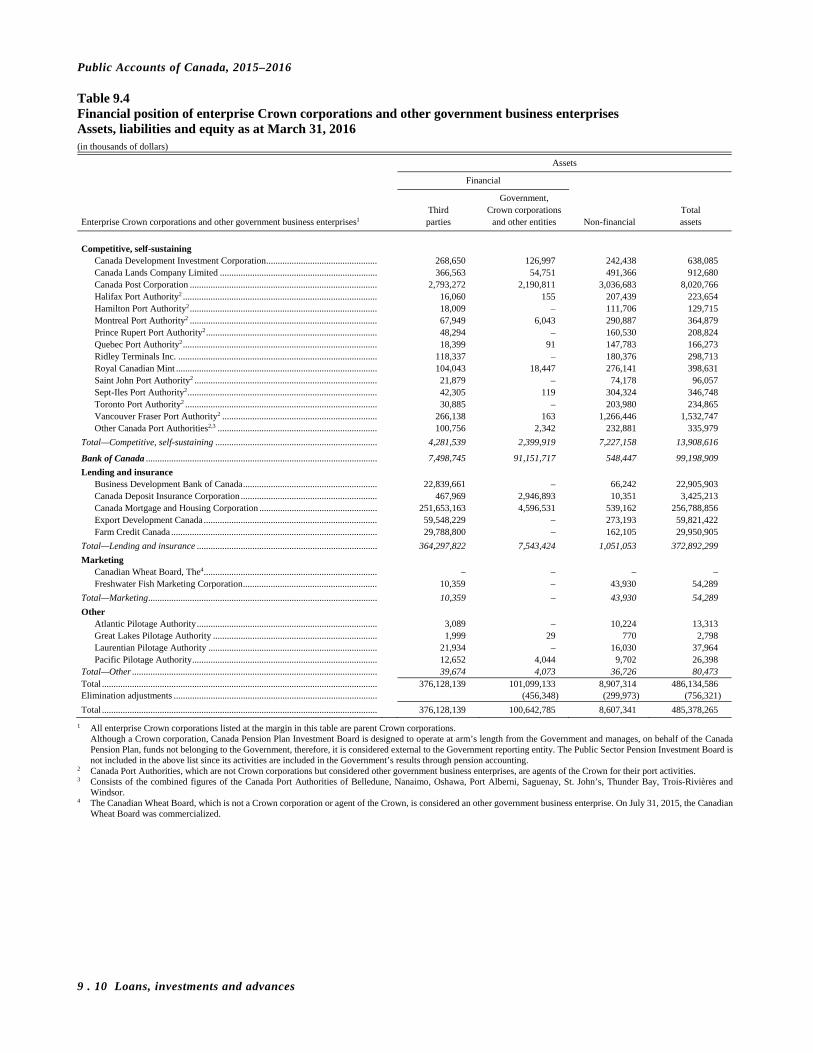
Public Accounts of Canada, 2015–2016
9 . 10 Loans, investments and advances
Table 9.4 Financial position of enterprise Crown corporations and other government business enterprises Assets, liabilities and equity as at March 31, 2016 (in thousands of dollars)
Assets
Financial
Government, Third Crown corporations Total Enterprise Crown corporations and other government business enterprises1 parties and other entities Non-financial assets
Competitive, self-sustaining
Canada Development Investment Corporation ................................................ 268,650 126,997 242,438 638,085 Canada Lands Company Limited .................................................................... 366,563 54,751 491,366 912,680 Canada Post Corporation ................................................................................. 2,793,272 2,190,811 3,036,683 8,020,766 Halifax Port Authority2 .................................................................................... 16,060 155 207,439 223,654 Hamilton Port Authority2 ................................................................................. 18,009 – 111,706 129,715 Montreal Port Authority2 ................................................................................. 67,949 6,043 290,887 364,879 Prince Rupert Port Authority2 .......................................................................... 48,294 – 160,530 208,824 Quebec Port Authority2 .................................................................................... 18,399 91 147,783 166,273 Ridley Terminals Inc. ...................................................................................... 118,337 – 180,376 298,713 Royal Canadian Mint ....................................................................................... 104,043 18,447 276,141 398,631 Saint John Port Authority2 ............................................................................... 21,879 – 74,178 96,057 Sept-Iles Port Authority2 .................................................................................. 42,305 119 304,324 346,748 Toronto Port Authority2 ................................................................................... 30,885 – 203,980 234,865 Vancouver Fraser Port Authority2 ................................................................... 266,138 163 1,266,446 1,532,747 Other Canada Port Authorities2,3 ..................................................................... 100,756 2,342 232,881 335,979
Total—Competitive, self-sustaining ...................................................................... 4,281,539 2,399,919 7,227,158 13,908,616
Bank of Canada .................................................................................................... 7,498,745 91,151,717 548,447 99,198,909
Lending and insurance Business Development Bank of Canada .......................................................... 22,839,661 – 66,242 22,905,903 Canada Deposit Insurance Corporation ........................................................... 467,969 2,946,893 10,351 3,425,213 Canada Mortgage and Housing Corporation ................................................... 251,653,163 4,596,531 539,162 256,788,856 Export Development Canada ........................................................................... 59,548,229 – 273,193 59,821,422 Farm Credit Canada ......................................................................................... 29,788,800 – 162,105 29,950,905
Total—Lending and insurance .............................................................................. 364,297,822 7,543,424 1,051,053 372,892,299
Marketing Canadian Wheat Board, The4 ........................................................................... – – – – Freshwater Fish Marketing Corporation .......................................................... 10,359 – 43,930 54,289
Total—Marketing ................................................................................................... 10,359 – 43,930 54,289
Other Atlantic Pilotage Authority .............................................................................. 3,089 – 10,224 13,313 Great Lakes Pilotage Authority ....................................................................... 1,999 29 770 2,798 Laurentian Pilotage Authority ......................................................................... 21,934 – 16,030 37,964 Pacific Pilotage Authority ................................................................................ 12,652 4,044 9,702 26,398
Total—Other .......................................................................................................... 39,674 4,073 36,726 80,473 Total ....................................................................................................................... 376,128,139 101,099,133 8,907,314 486,134,586 Elimination adjustments ........................................................................................ (456,348) (299,973) (756,321)
Total ....................................................................................................................... 376,128,139 100,642,785 8,607,341 485,378,265
1 All enterprise Crown corporations listed at the margin in this table are parent Crown corporations. Although a Crown corporation, Canada Pension Plan Investment Board is designed to operate at arm’s length from the Government and manages, on behalf of the Canada Pension Plan, funds not belonging to the Government, therefore, it is considered external to the Government reporting entity. The Public Sector Pension Investment Board is not included in the above list since its activities are included in the Government’s results through pension accounting.
2 Canada Port Authorities, which are not Crown corporations but considered other government business enterprises, are agents of the Crown for their port activities. 3 Consists of the combined figures of the Canada Port Authorities of Belledune, Nanaimo, Oshawa, Port Alberni, Saguenay, St. John’s, Thunder Bay, Trois-Rivières and
Windsor. 4 The Canadian Wheat Board, which is not a Crown corporation or agent of the Crown, is considered an other government business enterprise. On July 31, 2015, the Canadian
Wheat Board was commercialized.

Public Accounts of Canada, 2015–2016
Loans, investments and advances 9 . 11
Liabilities
Third parties
Government, Accumulated Equity Total Crown corporations Total profits Contributed Capital of liabilities
Borrowings Other and other entities liabilities (losses) surplus stock Canada and equity
– 176,880 – 176,880 (142,090) 603,294 1 461,205 638,085 47,900 94,380 296,524 438,804 292,706 181,170 – 473,876 912,680
996,600 9,073,546 107,265 10,177,411 (3,311,816) 1,155,171 – (2,156,645) 8,020,766 46,956 13,465 636 61,057 111,740 50,857 – 162,597 223,654
– 7,561 – 7,561 103,788 18,366 – 122,154 129,715 – 54,671 1,196 55,867 73,813 235,199 – 309,012 364,879
4,540 64,411 – 68,951 103,660 36,213 – 139,873 208,824 8,299 15,860 47,078 71,237 37,774 57,262 – 95,036 166,273
25,904 74,026 – 99,930 (1,259) 64,000 136,042 198,783 298,713 34,567 96,528 9,614 140,709 217,922 – 40,000 257,922 398,631
– 5,357 – 5,357 29,041 61,659 – 90,700 96,057 71,986 205,065 – 277,051 57,990 11,707 – 69,697 346,748 27,771 92,398 – 120,169 114,696 – – 114,696 234,865
103,270 90,968 1,985 196,223 1,186,265 150,259 – 1,336,524 1,532,747 35,237 25,139 5,653 66,029 126,880 143,070 – 269,950 335,979
1,403,030 10,090,255 469,951 11,963,236 (998,890) 2,768,227 176,043 1,945,380 13,908,616
– 76,025,302 22,681,677 98,706,979 461,930 25,000 5,000 491,930 99,198,909
253,021 381,445 16,947,964 17,582,430 3,007,295 27,778 2,288,400 5,323,473 22,905,903
– 1,308,077 870 1,308,947 2,116,266 – – 2,116,266 3,425,213 217,674,098 8,401,135 10,775,097 236,850,330 19,913,516 25,010 – 19,938,526 256,788,856 46,686,894 3,745,031 500,987 50,932,912 7,555,310 – 1,333,200 8,888,510 59,821,422
761,937 334,322 23,500,976 24,597,235 4,805,945 547,725 – 5,353,670 29,950,905
265,375,950 14,170,010 51,725,894 331,271,854 37,398,332 600,513 3,621,600 41,620,445 372,892,299
– – – – – – – – –
26,445 27,844 – 54,289 – – – – 54,289
26,445 27,844 – 54,289 – – – – 54,289
4,110 3,103 – 7,213 6,100 – – 6,100 13,313
– 4,332 401 4,733 (1,935) – – (1,935) 2,798 – 10,618 – 10,618 27,346 – – 27,346 37,964
2,845 10,377 128 13,350 13,048 – – 13,048 26,398 6,955 28,430 529 35,914 44,559 – – 44,559 80,473
266,812,380 100,341,841 74,878,051 442,032,272 36,905,931 3,393,740 3,802,643 44,102,314 486,134,586 (134,131) (134,131) (622,190) (622,190) (756,321)
266,812,380 100,341,841 74,743,920 441,898,141 36,283,741 3,393,740 3,802,643 43,480,124 485,378,265
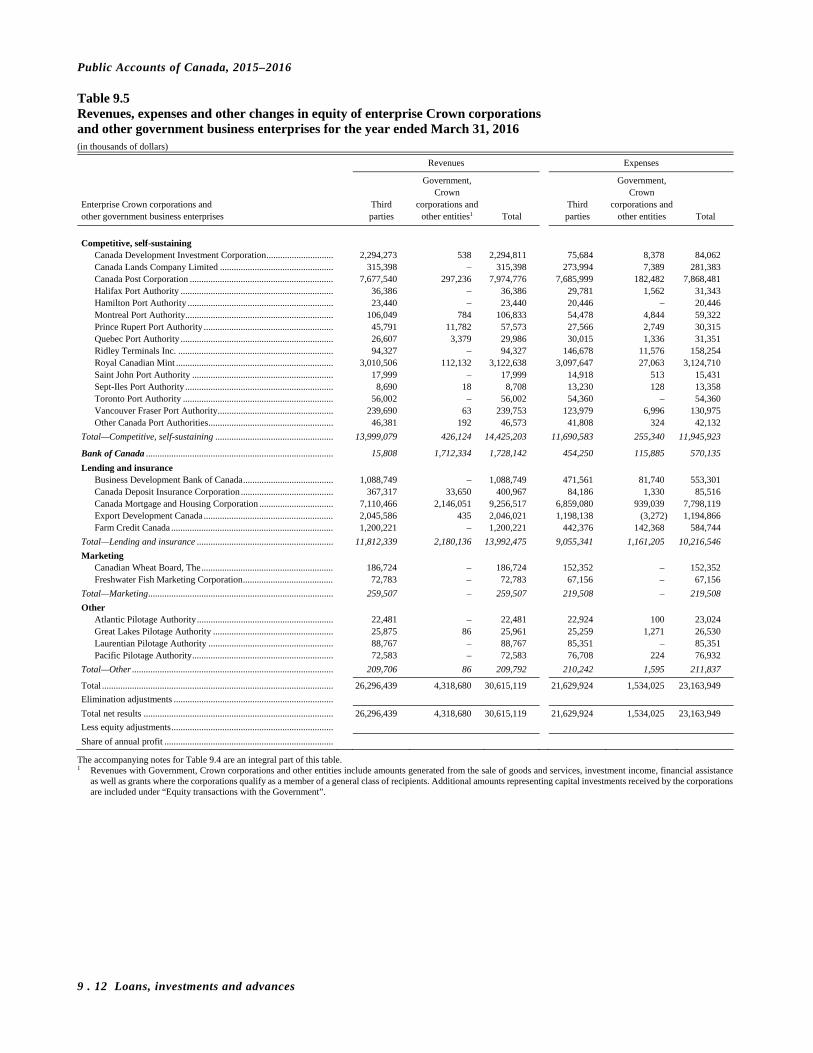
Public Accounts of Canada, 2015–2016
9 . 12 Loans, investments and advances
Table 9.5 Revenues, expenses and other changes in equity of enterprise Crown corporations and other government business enterprises for the year ended March 31, 2016 (in thousands of dollars)
Revenues Expenses
Government, Government, Crown Crown Enterprise Crown corporations and Third corporations and Third corporations and other government business enterprises parties other entities1 Total parties other entities Total
Competitive, self-sustaining
Canada Development Investment Corporation ............................. 2,294,273 538 2,294,811 75,684 8,378 84,062 Canada Lands Company Limited ................................................. 315,398 – 315,398 273,994 7,389 281,383 Canada Post Corporation .............................................................. 7,677,540 297,236 7,974,776 7,685,999 182,482 7,868,481 Halifax Port Authority .................................................................. 36,386 – 36,386 29,781 1,562 31,343 Hamilton Port Authority ............................................................... 23,440 – 23,440 20,446 – 20,446 Montreal Port Authority ................................................................ 106,049 784 106,833 54,478 4,844 59,322 Prince Rupert Port Authority ........................................................ 45,791 11,782 57,573 27,566 2,749 30,315 Quebec Port Authority .................................................................. 26,607 3,379 29,986 30,015 1,336 31,351 Ridley Terminals Inc. ................................................................... 94,327 – 94,327 146,678 11,576 158,254 Royal Canadian Mint .................................................................... 3,010,506 112,132 3,122,638 3,097,647 27,063 3,124,710 Saint John Port Authority ............................................................. 17,999 – 17,999 14,918 513 15,431 Sept-Iles Port Authority ................................................................ 8,690 18 8,708 13,230 128 13,358 Toronto Port Authority ................................................................. 56,002 – 56,002 54,360 – 54,360 Vancouver Fraser Port Authority .................................................. 239,690 63 239,753 123,979 6,996 130,975 Other Canada Port Authorities ...................................................... 46,381 192 46,573 41,808 324 42,132
Total—Competitive, self-sustaining ................................................... 13,999,079 426,124 14,425,203 11,690,583 255,340 11,945,923
Bank of Canada ................................................................................. 15,808 1,712,334 1,728,142 454,250 115,885 570,135
Lending and insurance Business Development Bank of Canada ....................................... 1,088,749 – 1,088,749 471,561 81,740 553,301 Canada Deposit Insurance Corporation ........................................ 367,317 33,650 400,967 84,186 1,330 85,516 Canada Mortgage and Housing Corporation ................................ 7,110,466 2,146,051 9,256,517 6,859,080 939,039 7,798,119 Export Development Canada ........................................................ 2,045,586 435 2,046,021 1,198,138 (3,272) 1,194,866 Farm Credit Canada ...................................................................... 1,200,221 – 1,200,221 442,376 142,368 584,744
Total—Lending and insurance ........................................................... 11,812,339 2,180,136 13,992,475 9,055,341 1,161,205 10,216,546
Marketing Canadian Wheat Board, The ......................................................... 186,724 – 186,724 152,352 – 152,352 Freshwater Fish Marketing Corporation ....................................... 72,783 – 72,783 67,156 – 67,156
Total—Marketing ................................................................................ 259,507 – 259,507 219,508 – 219,508
Other Atlantic Pilotage Authority ........................................................... 22,481 – 22,481 22,924 100 23,024 Great Lakes Pilotage Authority .................................................... 25,875 86 25,961 25,259 1,271 26,530 Laurentian Pilotage Authority ...................................................... 88,767 – 88,767 85,351 – 85,351 Pacific Pilotage Authority ............................................................. 72,583 – 72,583 76,708 224 76,932
Total—Other ....................................................................................... 209,706 86 209,792 210,242 1,595 211,837
Total .................................................................................................... 26,296,439 4,318,680 30,615,119 21,629,924 1,534,025 23,163,949
Elimination adjustments .....................................................................
Total net results .................................................................................. 26,296,439 4,318,680 30,615,119 21,629,924 1,534,025 23,163,949
Less equity adjustments ......................................................................
Share of annual profit .........................................................................
The accompanying notes for Table 9.4 are an integral part of this table. 1 Revenues with Government, Crown corporations and other entities include amounts generated from the sale of goods and services, investment income, financial assistance
as well as grants where the corporations qualify as a member of a general class of recipients. Additional amounts representing capital investments received by the corporations are included under “Equity transactions with the Government”.
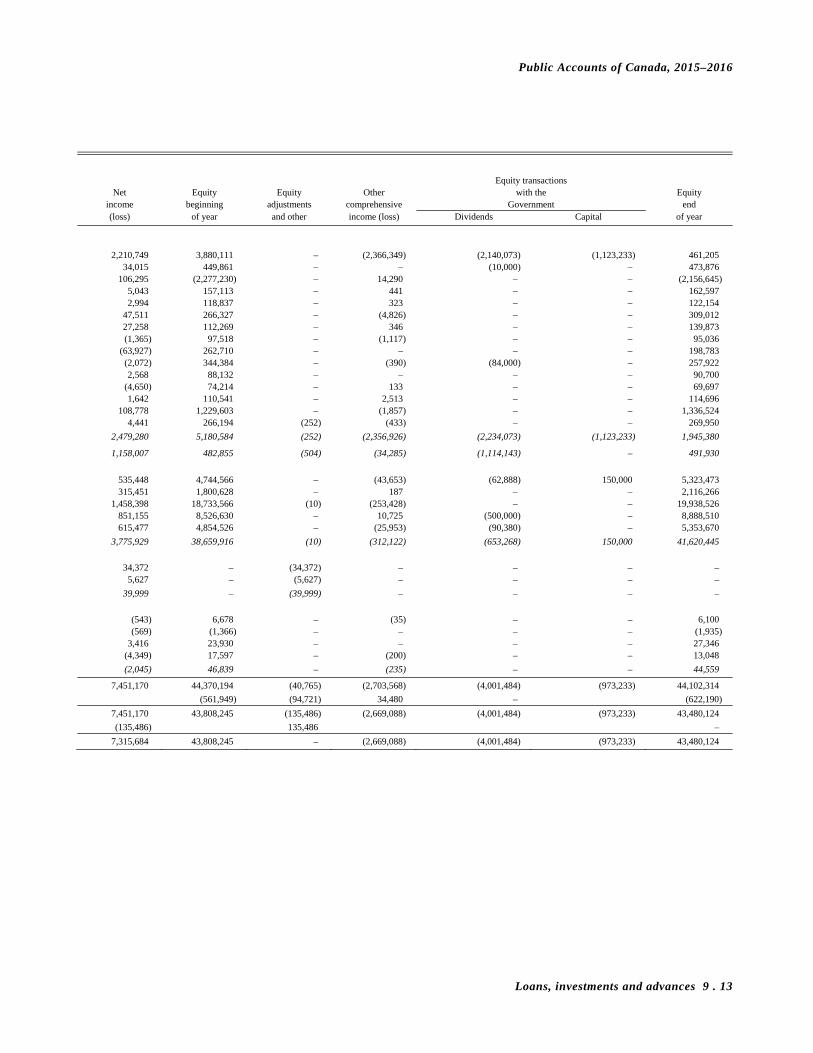
Public Accounts of Canada, 2015–2016
Loans, investments and advances 9 . 13
Equity transactions Net Equity Equity Other with the Equity
income beginning adjustments comprehensive Government end (loss) of year and other income (loss) Dividends Capital of year
2,210,749 3,880,111 – (2,366,349) (2,140,073) (1,123,233) 461,205 34,015 449,861 – – (10,000) – 473,876
106,295 (2,277,230) – 14,290 – – (2,156,645) 5,043 157,113 – 441 – – 162,597 2,994 118,837 – 323 – – 122,154
47,511 266,327 – (4,826) – – 309,012 27,258 112,269 – 346 – – 139,873 (1,365) 97,518 – (1,117) – – 95,036
(63,927) 262,710 – – – – 198,783 (2,072) 344,384 – (390) (84,000) – 257,922 2,568 88,132 – – – – 90,700
(4,650) 74,214 – 133 – – 69,697 1,642 110,541 – 2,513 – – 114,696
108,778 1,229,603 – (1,857) – – 1,336,524 4,441 266,194 (252) (433) – – 269,950
2,479,280 5,180,584 (252) (2,356,926) (2,234,073) (1,123,233) 1,945,380
1,158,007 482,855 (504) (34,285) (1,114,143) – 491,930
535,448 4,744,566 – (43,653) (62,888) 150,000 5,323,473 315,451 1,800,628 – 187 – – 2,116,266
1,458,398 18,733,566 (10) (253,428) – – 19,938,526 851,155 8,526,630 – 10,725 (500,000) – 8,888,510 615,477 4,854,526 – (25,953) (90,380) – 5,353,670
3,775,929 38,659,916 (10) (312,122) (653,268) 150,000 41,620,445
34,372 – (34,372) – – – –
5,627 – (5,627) – – – –
39,999 – (39,999) – – – –
(543) 6,678 – (35) – – 6,100 (569) (1,366) – – – – (1,935)
3,416 23,930 – – – – 27,346 (4,349) 17,597 – (200) – – 13,048
(2,045) 46,839 – (235) – – 44,559
7,451,170 44,370,194 (40,765) (2,703,568) (4,001,484) (973,233) 44,102,314
(561,949) (94,721) 34,480 – (622,190)
7,451,170 43,808,245 (135,486) (2,669,088) (4,001,484) (973,233) 43,480,124
(135,486) 135,486 –
7,315,684 43,808,245 – (2,669,088) (4,001,484) (973,233) 43,480,124
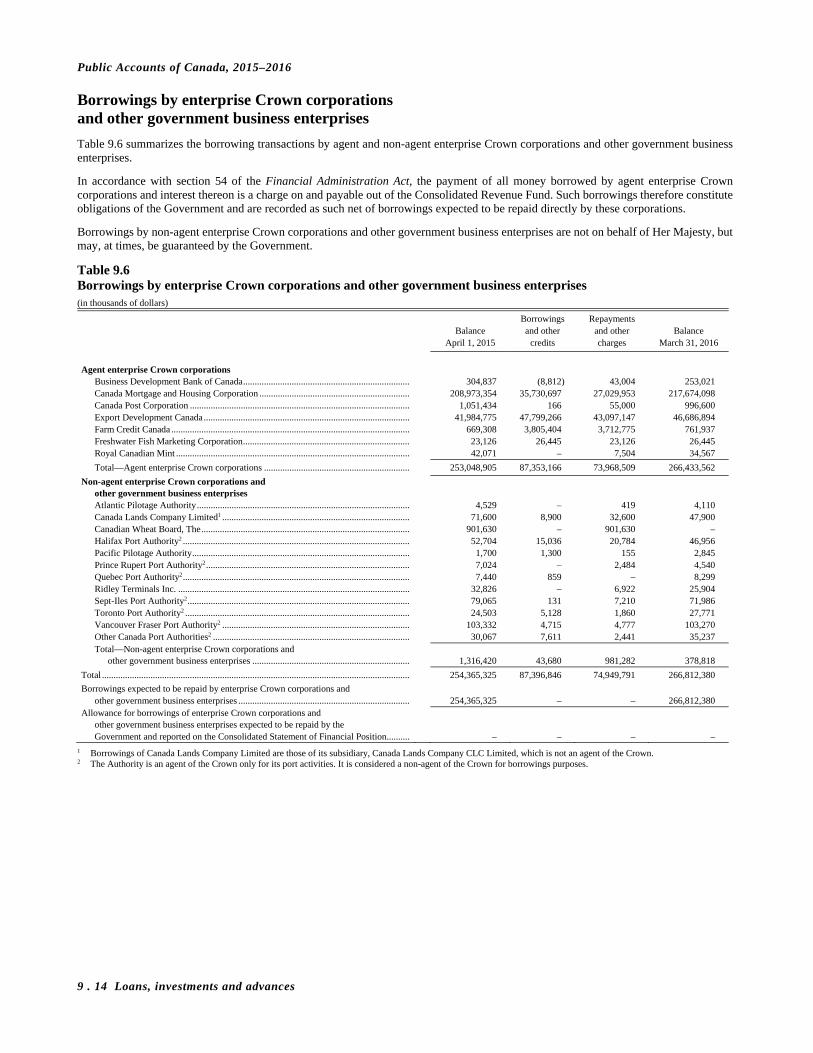
Public Accounts of Canada, 2015–2016
9 . 14 Loans, investments and advances
Borrowings by enterprise Crown corporations and other government business enterprises
Table 9.6 summarizes the borrowing transactions by agent and non-agent enterprise Crown corporations and other government business enterprises.
In accordance with section 54 of the Financial Administration Act, the payment of all money borrowed by agent enterprise Crown corporations and interest thereon is a charge on and payable out of the Consolidated Revenue Fund. Such borrowings therefore constitute obligations of the Government and are recorded as such net of borrowings expected to be repaid directly by these corporations.
Borrowings by non-agent enterprise Crown corporations and other government business enterprises are not on behalf of Her Majesty, but may, at times, be guaranteed by the Government.
Table 9.6 Borrowings by enterprise Crown corporations and other government business enterprises (in thousands of dollars)
Borrowings Repayments Balance and other and other Balance April 1, 2015 credits charges March 31, 2016
Agent enterprise Crown corporations
Business Development Bank of Canada ........................................................................ 304,837 (8,812) 43,004 253,021 Canada Mortgage and Housing Corporation ................................................................. 208,973,354 35,730,697 27,029,953 217,674,098 Canada Post Corporation ............................................................................................... 1,051,434 166 55,000 996,600 Export Development Canada ......................................................................................... 41,984,775 47,799,266 43,097,147 46,686,894 Farm Credit Canada ....................................................................................................... 669,308 3,805,404 3,712,775 761,937 Freshwater Fish Marketing Corporation ........................................................................ 23,126 26,445 23,126 26,445 Royal Canadian Mint ..................................................................................................... 42,071 – 7,504 34,567
Total—Agent enterprise Crown corporations ............................................................... 253,048,905 87,353,166 73,968,509 266,433,562
Non-agent enterprise Crown corporations and other government business enterprises Atlantic Pilotage Authority ............................................................................................ 4,529 – 419 4,110 Canada Lands Company Limited1 ................................................................................. 71,600 8,900 32,600 47,900 Canadian Wheat Board, The .......................................................................................... 901,630 – 901,630 – Halifax Port Authority2 .................................................................................................. 52,704 15,036 20,784 46,956 Pacific Pilotage Authority .............................................................................................. 1,700 1,300 155 2,845 Prince Rupert Port Authority2 ........................................................................................ 7,024 – 2,484 4,540 Quebec Port Authority2 .................................................................................................. 7,440 859 – 8,299 Ridley Terminals Inc. .................................................................................................... 32,826 – 6,922 25,904 Sept-Iles Port Authority2 ................................................................................................ 79,065 131 7,210 71,986 Toronto Port Authority2 ................................................................................................. 24,503 5,128 1,860 27,771 Vancouver Fraser Port Authority2 ................................................................................. 103,332 4,715 4,777 103,270 Other Canada Port Authorities2 ..................................................................................... 30,067 7,611 2,441 35,237 Total—Non-agent enterprise Crown corporations and
other government business enterprises .................................................................... 1,316,420 43,680 981,282 378,818
Total ..................................................................................................................................... 254,365,325 87,396,846 74,949,791 266,812,380
Borrowings expected to be repaid by enterprise Crown corporations and other government business enterprises .......................................................................... 254,365,325 – – 266,812,380
Allowance for borrowings of enterprise Crown corporations and other government business enterprises expected to be repaid by the Government and reported on the Consolidated Statement of Financial Position .......... – – – –
1 Borrowings of Canada Lands Company Limited are those of its subsidiary, Canada Lands Company CLC Limited, which is not an agent of the Crown. 2 The Authority is an agent of the Crown only for its port activities. It is considered a non-agent of the Crown for borrowings purposes.
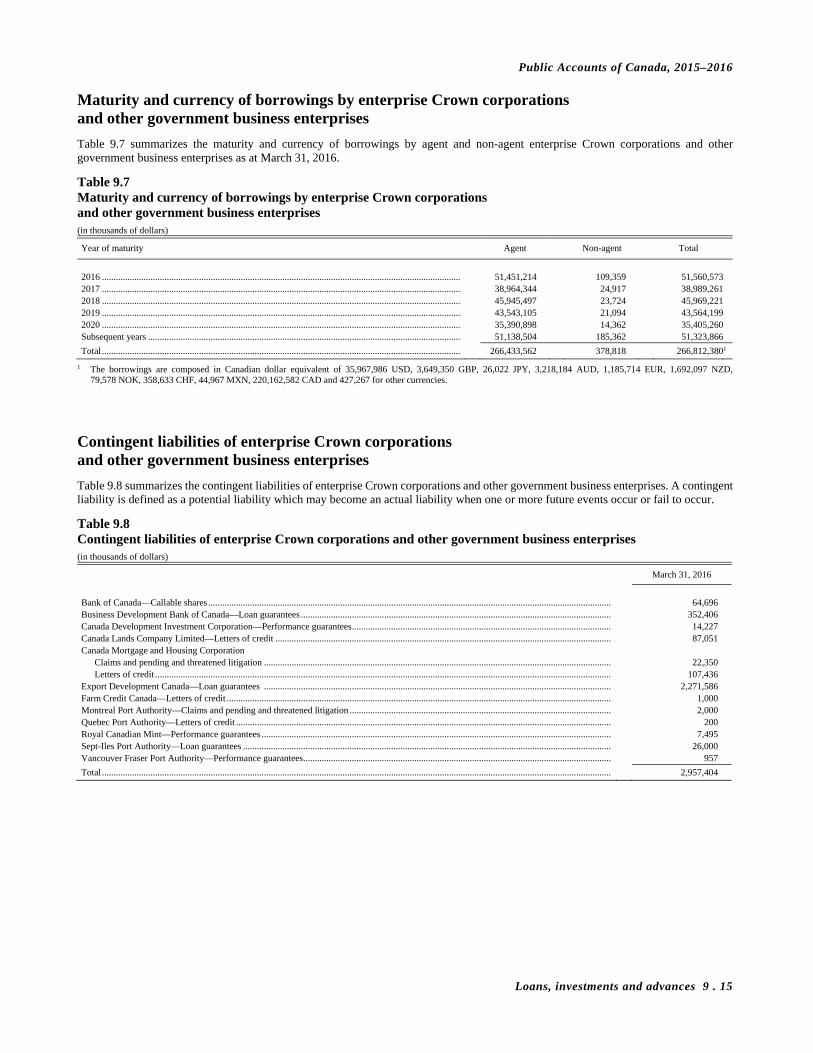
Public Accounts of Canada, 2015–2016
Loans, investments and advances 9 . 15
Maturity and currency of borrowings by enterprise Crown corporations and other government business enterprises
Table 9.7 summarizes the maturity and currency of borrowings by agent and non-agent enterprise Crown corporations and other government business enterprises as at March 31, 2016.
Table 9.7 Maturity and currency of borrowings by enterprise Crown corporations and other government business enterprises (in thousands of dollars)
Year of maturity Agent Non-agent Total
2016 ........................................................................................................................................................... 51,451,214 109,359 51,560,573 2017 ........................................................................................................................................................... 38,964,344 24,917 38,989,261 2018 ........................................................................................................................................................... 45,945,497 23,724 45,969,221 2019 ........................................................................................................................................................... 43,543,105 21,094 43,564,199 2020 ........................................................................................................................................................... 35,390,898 14,362 35,405,260 Subsequent years ....................................................................................................................................... 51,138,504 185,362 51,323,866
Total ........................................................................................................................................................... 266,433,562 378,818 266,812,3801
1 The borrowings are composed in Canadian dollar equivalent of 35,967,986 USD, 3,649,350 GBP, 26,022 JPY, 3,218,184 AUD, 1,185,714 EUR, 1,692,097 NZD, 79,578 NOK, 358,633 CHF, 44,967 MXN, 220,162,582 CAD and 427,267 for other currencies.
Contingent liabilities of enterprise Crown corporations and other government business enterprises
Table 9.8 summarizes the contingent liabilities of enterprise Crown corporations and other government business enterprises. A contingent liability is defined as a potential liability which may become an actual liability when one or more future events occur or fail to occur.
Table 9.8 Contingent liabilities of enterprise Crown corporations and other government business enterprises (in thousands of dollars)
March 31, 2016
Bank of Canada—Callable shares .............................................................................................................................................................................. 64,696 Business Development Bank of Canada—Loan guarantees ...................................................................................................................................... 352,406 Canada Development Investment Corporation—Performance guarantees ................................................................................................................ 14,227 Canada Lands Company Limited—Letters of credit ................................................................................................................................................. 87,051 Canada Mortgage and Housing Corporation
Claims and pending and threatened litigation ...................................................................................................................................................... 22,350 Letters of credit ..................................................................................................................................................................................................... 107,436
Export Development Canada—Loan guarantees ...................................................................................................................................................... 2,271,586 Farm Credit Canada—Letters of credit ...................................................................................................................................................................... 1,000 Montreal Port Authority—Claims and pending and threatened litigation ................................................................................................................. 2,000 Quebec Port Authority—Letters of credit .................................................................................................................................................................. 200 Royal Canadian Mint—Performance guarantees ....................................................................................................................................................... 7,495 Sept-Iles Port Authority—Loan guarantees ............................................................................................................................................................... 26,000 Vancouver Fraser Port Authority—Performance guarantees ..................................................................................................................................... 957
Total ............................................................................................................................................................................................................................ 2,957,404
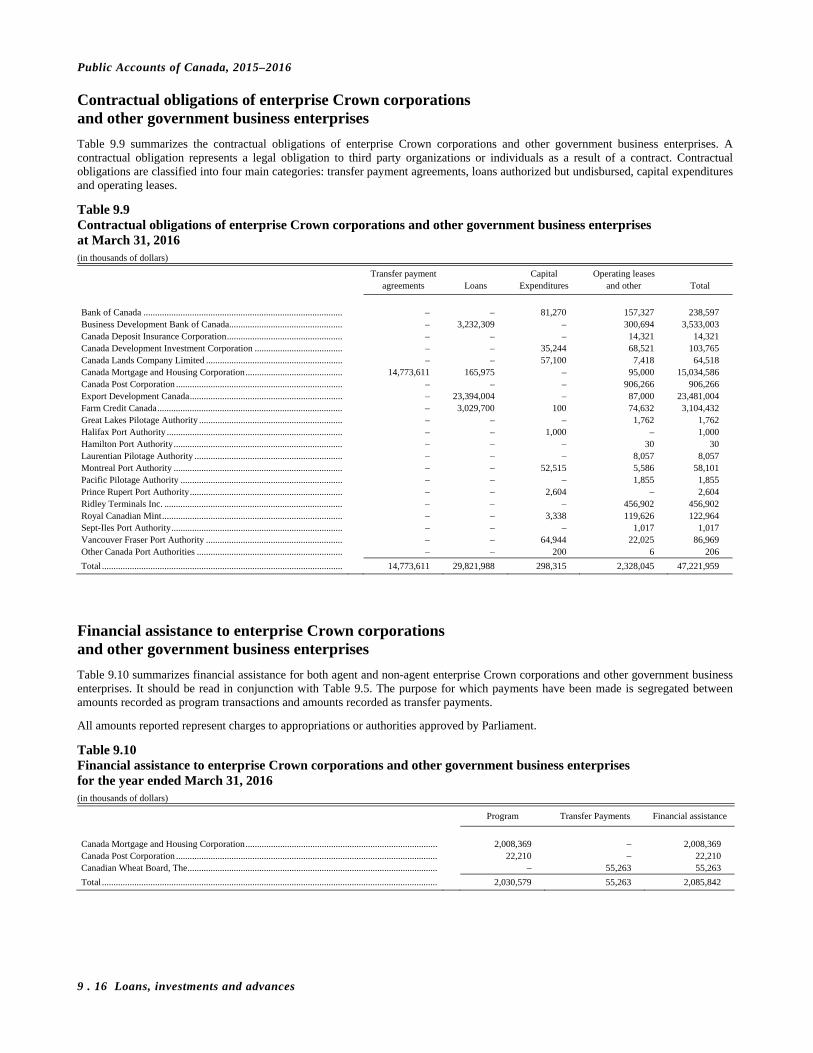
Public Accounts of Canada, 2015–2016
9 . 16 Loans, investments and advances
Contractual obligations of enterprise Crown corporations and other government business enterprises
Table 9.9 summarizes the contractual obligations of enterprise Crown corporations and other government business enterprises. A contractual obligation represents a legal obligation to third party organizations or individuals as a result of a contract. Contractual obligations are classified into four main categories: transfer payment agreements, loans authorized but undisbursed, capital expenditures and operating leases.
Table 9.9 Contractual obligations of enterprise Crown corporations and other government business enterprises at March 31, 2016 (in thousands of dollars)
Transfer payment Capital Operating leases agreements Loans Expenditures and other Total
Bank of Canada ...................................................................................... – – 81,270 157,327 238,597 Business Development Bank of Canada................................................. – 3,232,309 – 300,694 3,533,003 Canada Deposit Insurance Corporation .................................................. – – – 14,321 14,321 Canada Development Investment Corporation ...................................... – – 35,244 68,521 103,765 Canada Lands Company Limited ........................................................... – – 57,100 7,418 64,518 Canada Mortgage and Housing Corporation .......................................... 14,773,611 165,975 – 95,000 15,034,586 Canada Post Corporation ........................................................................ – – – 906,266 906,266 Export Development Canada .................................................................. – 23,394,004 – 87,000 23,481,004 Farm Credit Canada ................................................................................ – 3,029,700 100 74,632 3,104,432 Great Lakes Pilotage Authority .............................................................. – – – 1,762 1,762 Halifax Port Authority ............................................................................ – – 1,000 – 1,000 Hamilton Port Authority ......................................................................... – – – 30 30 Laurentian Pilotage Authority ................................................................ – – – 8,057 8,057 Montreal Port Authority ......................................................................... – – 52,515 5,586 58,101 Pacific Pilotage Authority ...................................................................... – – – 1,855 1,855 Prince Rupert Port Authority .................................................................. – – 2,604 – 2,604 Ridley Terminals Inc. ............................................................................. – – – 456,902 456,902 Royal Canadian Mint .............................................................................. – – 3,338 119,626 122,964 Sept-Iles Port Authority .......................................................................... – – – 1,017 1,017 Vancouver Fraser Port Authority ........................................................... – – 64,944 22,025 86,969 Other Canada Port Authorities ............................................................... – – 200 6 206
Total ........................................................................................................ 14,773,611 29,821,988 298,315 2,328,045 47,221,959
Financial assistance to enterprise Crown corporations and other government business enterprises
Table 9.10 summarizes financial assistance for both agent and non-agent enterprise Crown corporations and other government business enterprises. It should be read in conjunction with Table 9.5. The purpose for which payments have been made is segregated between amounts recorded as program transactions and amounts recorded as transfer payments.
All amounts reported represent charges to appropriations or authorities approved by Parliament.
Table 9.10 Financial assistance to enterprise Crown corporations and other government business enterprises for the year ended March 31, 2016 (in thousands of dollars)
Program Transfer Payments Financial assistance
Canada Mortgage and Housing Corporation ................................................................................... 2,008,369 – 2,008,369 Canada Post Corporation ................................................................................................................. 22,210 – 22,210 Canadian Wheat Board, The ............................................................................................................ – 55,263 55,263
Total ................................................................................................................................................. 2,030,579 55,263 2,085,842
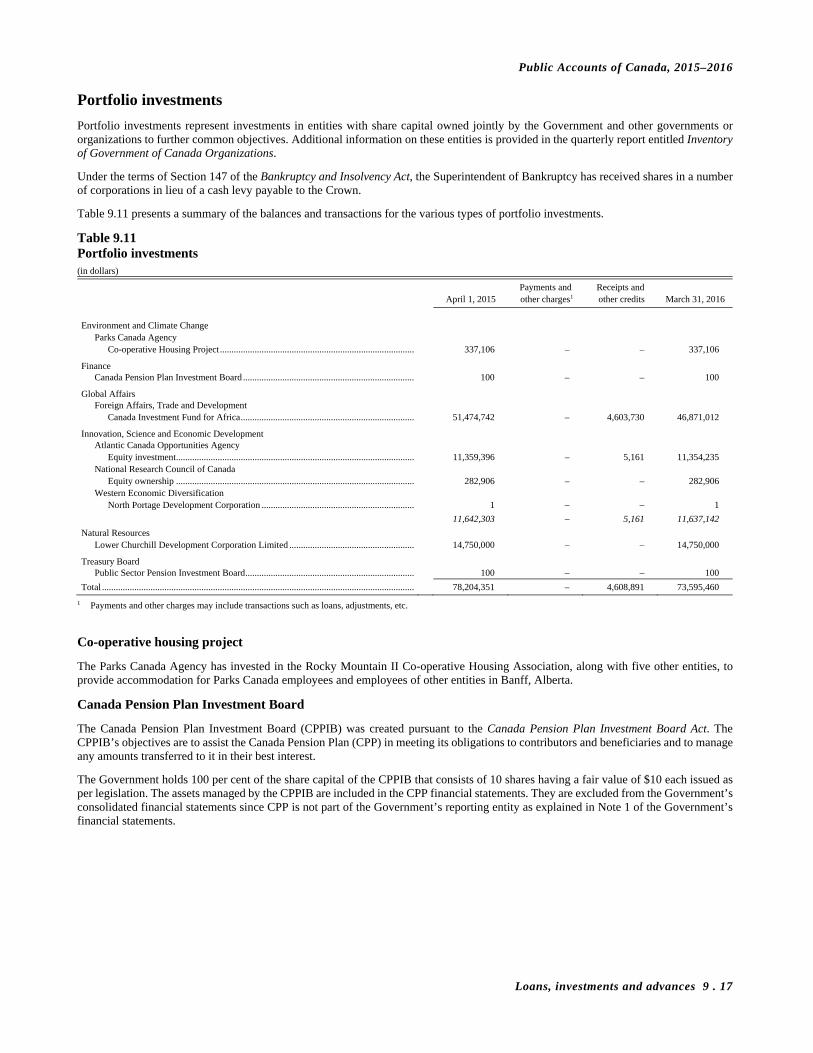
Public Accounts of Canada, 2015–2016
Loans, investments and advances 9 . 17
Portfolio investments
Portfolio investments represent investments in entities with share capital owned jointly by the Government and other governments or organizations to further common objectives. Additional information on these entities is provided in the quarterly report entitled Inventory of Government of Canada Organizations.
Under the terms of Section 147 of the Bankruptcy and Insolvency Act, the Superintendent of Bankruptcy has received shares in a number of corporations in lieu of a cash levy payable to the Crown.
Table 9.11 presents a summary of the balances and transactions for the various types of portfolio investments.
Table 9.11 Portfolio investments (in dollars)
Payments and Receipts and April 1, 2015 other charges1 other credits March 31, 2016
Environment and Climate Change
Parks Canada Agency Co-operative Housing Project .................................................................................... 337,106 – – 337,106
Finance
Canada Pension Plan Investment Board .......................................................................... 100 – – 100
Global Affairs
Foreign Affairs, Trade and Development Canada Investment Fund for Africa ........................................................................... 51,474,742 – 4,603,730 46,871,012
Innovation, Science and Economic Development
Atlantic Canada Opportunities Agency Equity investment ....................................................................................................... 11,359,396 – 5,161 11,354,235
National Research Council of Canada Equity ownership ....................................................................................................... 282,906 – – 282,906
Western Economic Diversification North Portage Development Corporation .................................................................. 1 – – 1
11,642,303 – 5,161 11,637,142
Natural Resources Lower Churchill Development Corporation Limited ...................................................... 14,750,000 – – 14,750,000
Treasury Board
Public Sector Pension Investment Board ......................................................................... 100 – – 100
Total ....................................................................................................................................... 78,204,351 – 4,608,891 73,595,460
1 Payments and other charges may include transactions such as loans, adjustments, etc.
Co-operative housing project
The Parks Canada Agency has invested in the Rocky Mountain II Co-operative Housing Association, along with five other entities, to provide accommodation for Parks Canada employees and employees of other entities in Banff, Alberta.
Canada Pension Plan Investment Board
The Canada Pension Plan Investment Board (CPPIB) was created pursuant to the Canada Pension Plan Investment Board Act. The CPPIB’s objectives are to assist the Canada Pension Plan (CPP) in meeting its obligations to contributors and beneficiaries and to manage any amounts transferred to it in their best interest.
The Government holds 100 per cent of the share capital of the CPPIB that consists of 10 shares having a fair value of $10 each issued as per legislation. The assets managed by the CPPIB are included in the CPP financial statements. They are excluded from the Government’s consolidated financial statements since CPP is not part of the Government’s reporting entity as explained in Note 1 of the Government’s financial statements.
Public Accounts of Canada, 2015–2016
9 . 18 Loans, investments and advances
Canada Investment Fund for Africa
The Canada Investment Fund for Africa (CIFA) is a joint public-private sector initiative designed to provide risk capital for private investments in Africa that generate growth. The CIFA is a direct response to the New Partnership for Africa’s Development (NEPAD) and the G8 Africa Action Plan. The main objectives of the CIFA are to optimize public-private investment in the Fund, to confer a beneficial development impact on Africa by way of increased foreign direct investment and to optimize the beneficial impact of the Fund’s activities on Canadian interests.
The Government of Canada is a limited partner in the CIFA and its commitment towards the Fund was subject to matching funds of other investors and was to be equal to the lesser of: (i) $100 million or (ii) the aggregated commitments of all other limited partners of the partnership. The investment period in the CIFA ended January 1, 2009. The CIFA was dissolved on December 31, 2015 and is currently closing its operations. From thereon, the Department of Foreign Affairs, Trade and Development (DFATD) will only receive returns of capital. Since its inception, the Canadian International Development Agency (now amalgamated with DFATD) received capital reimbursement from CIFA amounting to $60.1 million and investment income of $8.2 million.
Equity investment
In order to help fulfill its mandate to promote economic development in the Cape Breton Region of Nova Scotia, Enterprise Cape Breton Corporation (ECBC) had taken equity interests in several companies to help the organizations expand or innovate.
Upon ECBC’s dissolution on June 19, 2014, all of ECBC assets and obligations, except real property, were transferred to Atlantic Canada Opportunities Agency (ACOA). ACOA has been given the authority to hold or exercise, or surrender, sell, assign or otherwise dispose of, a stock option, share or other similar financial instruments that it acquires from ECBC or any of its subsidiaries.
Equity ownership
In order to help fulfill its mandate to promote industrial innovation in Canada, the National Research Council of Canada (NRC) has taken equity interests in several new firms based on NRC technology. NRC provides financial assistance at better than market conditions to firms through access to equipment, intellectual property and incubation space in laboratories and in the organization’s Industry Partnership Facilities.
Since these companies often cannot afford to pay the full cost of the assistance received from the NRC, the NRC takes an equity position in a company in order to help the firms survive the critical development stage. In turn, it allows NRC to earn a return that somewhat reflects the risk taken should the company become successful.
This investment in equity is authorized under subsection 92(1)(b) of the Financial Administration Act which allows for the acquisition or the sale or other disposal of shares or assets in the ordinary course of a business of providing financial assistance to publicly and privately held companies and are recorded at cost.
The Government’s holdings of shares represent a minority interest in two publicly traded companies and one privately held company.
North Portage Development Corporation
The Corporation was incorporated under The Corporations Act of Manitoba, to foster the social and economic development of the North Portage area in the core area of Winnipeg. The objective of the Government’s participation is to stimulate economic recovery in Canada and Manitoba.
The Government’s holding of common shares represents 33.3 per cent of the shares outstanding. The Corporation is owned equally by the City of Winnipeg, the Province of Manitoba and the Government of Canada. There are 3 common shares issued, having a par value of $1 each.

Public Accounts of Canada, 2015–2016
Loans, investments and advances 9 . 19
Lower Churchill Development Corporation Limited
The Lower Churchill Development Corporation (LCDC) was incorporated in 1978 under the Companies Act of Newfoundland, with the objective of developing all or part of the hydroelectric potential of the Lower Churchill Basin. It is owned 51 per cent by Newfoundland and Labrador Hydro, the designate for the Government of Newfoundland and Labrador, and 49 per cent by Canada. LCDC in not an active operating company.
Canada owns 1,475 class A shares, which it purchased for $10,000 per share in the initial years of the corporation. Funds were used to finance feasibility studies for proposed Lower Churchill projects. The corporation’s only asset was an Option Right to purchase the Gull Island Production Company’s assets and acquire hydroelectric development rights on the Lower Churchill River, granted by the Government of Newfoundland and Labrador in exchange for its initial ownership stake, valued at $5,200,000.
The option expired on November 24, 2006 and has not been extended by the province, resulting in an investment write-down for LCDC.
Public Sector Pension Investment Board
The Public Sector Pension Investment Board (PSPIB) was created pursuant to the Public Sector Pension Investment Board Act. Its mandate is to invest the amounts transferred since April 1, 2000 by the Government of Canada. These amounts represent contributions less benefits and other payments for the pension plans of the public service, Canadian Forces, Royal Canadian Mounted Police and since March 1, 2007 for the Reserve Force Pension Plan. The PSPIB’s objective is to achieve maximum rates of return on investments, without undue risk of loss while respecting the funding, policies, requirements and financial obligations of those plans.
The Government holds 100 per cent of the share capital of the PSPIB that consists of 10 shares having a par value of $10 each issued as per legislation. The assets managed by the PSPIB are recorded against the pension obligations.
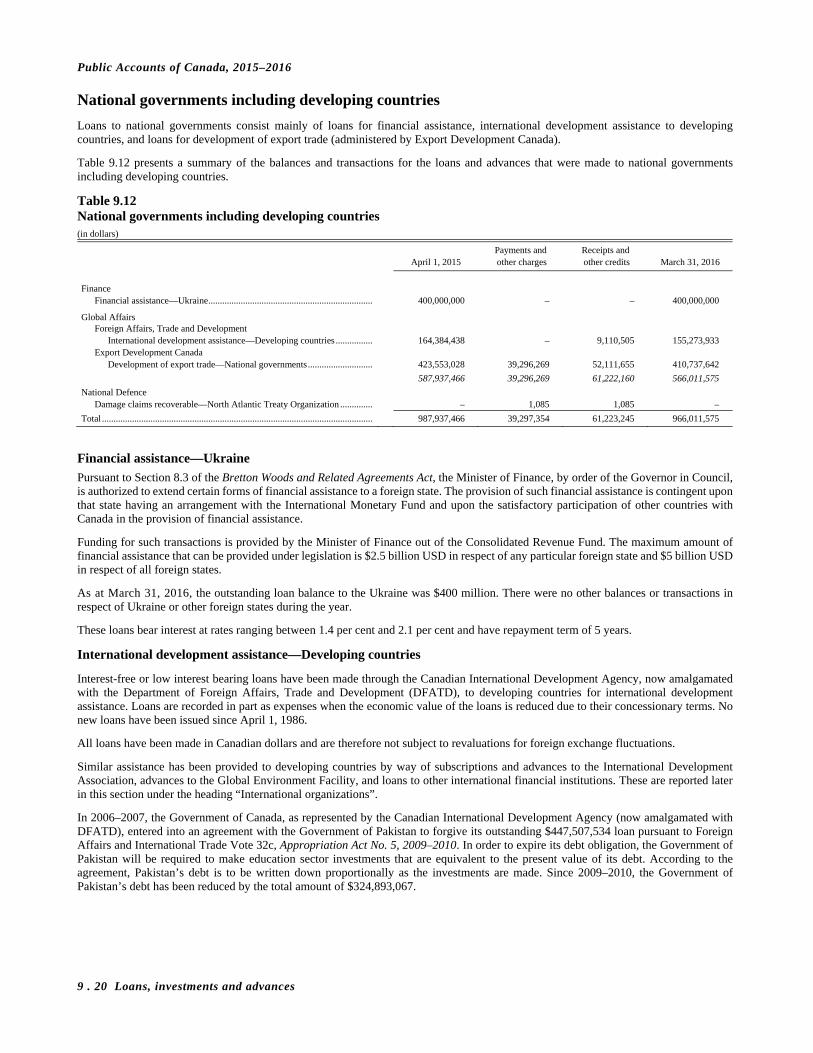
Public Accounts of Canada, 2015–2016
9 . 20 Loans, investments and advances
National governments including developing countries
Loans to national governments consist mainly of loans for financial assistance, international development assistance to developing countries, and loans for development of export trade (administered by Export Development Canada).
Table 9.12 presents a summary of the balances and transactions for the loans and advances that were made to national governments including developing countries.
Table 9.12 National governments including developing countries (in dollars)
Payments and Receipts and April 1, 2015 other charges other credits March 31, 2016
Finance
Financial assistance—Ukraine ....................................................................... 400,000,000 – – 400,000,000
Global Affairs
Foreign Affairs, Trade and Development International development assistance—Developing countries ................ 164,384,438 – 9,110,505 155,273,933
Export Development Canada Development of export trade—National governments ............................ 423,553,028 39,296,269 52,111,655 410,737,642
587,937,466 39,296,269 61,222,160 566,011,575
National Defence Damage claims recoverable—North Atlantic Treaty Organization .............. – 1,085 1,085 –
Total ..................................................................................................................... 987,937,466 39,297,354 61,223,245 966,011,575
Financial assistance—Ukraine
Pursuant to Section 8.3 of the Bretton Woods and Related Agreements Act, the Minister of Finance, by order of the Governor in Council, is authorized to extend certain forms of financial assistance to a foreign state. The provision of such financial assistance is contingent upon that state having an arrangement with the International Monetary Fund and upon the satisfactory participation of other countries with Canada in the provision of financial assistance.
Funding for such transactions is provided by the Minister of Finance out of the Consolidated Revenue Fund. The maximum amount of financial assistance that can be provided under legislation is $2.5 billion USD in respect of any particular foreign state and $5 billion USD in respect of all foreign states.
As at March 31, 2016, the outstanding loan balance to the Ukraine was $400 million. There were no other balances or transactions in respect of Ukraine or other foreign states during the year.
These loans bear interest at rates ranging between 1.4 per cent and 2.1 per cent and have repayment term of 5 years.
International development assistance—Developing countries
Interest-free or low interest bearing loans have been made through the Canadian International Development Agency, now amalgamated with the Department of Foreign Affairs, Trade and Development (DFATD), to developing countries for international development assistance. Loans are recorded in part as expenses when the economic value of the loans is reduced due to their concessionary terms. No new loans have been issued since April 1, 1986.
All loans have been made in Canadian dollars and are therefore not subject to revaluations for foreign exchange fluctuations.
Similar assistance has been provided to developing countries by way of subscriptions and advances to the International Development Association, advances to the Global Environment Facility, and loans to other international financial institutions. These are reported later in this section under the heading “International organizations”.
In 2006–2007, the Government of Canada, as represented by the Canadian International Development Agency (now amalgamated with DFATD), entered into an agreement with the Government of Pakistan to forgive its outstanding $447,507,534 loan pursuant to Foreign Affairs and International Trade Vote 32c, Appropriation Act No. 5, 2009–2010. In order to expire its debt obligation, the Government of Pakistan will be required to make education sector investments that are equivalent to the present value of its debt. According to the agreement, Pakistan’s debt is to be written down proportionally as the investments are made. Since 2009–2010, the Government of Pakistan’s debt has been reduced by the total amount of $324,893,067.
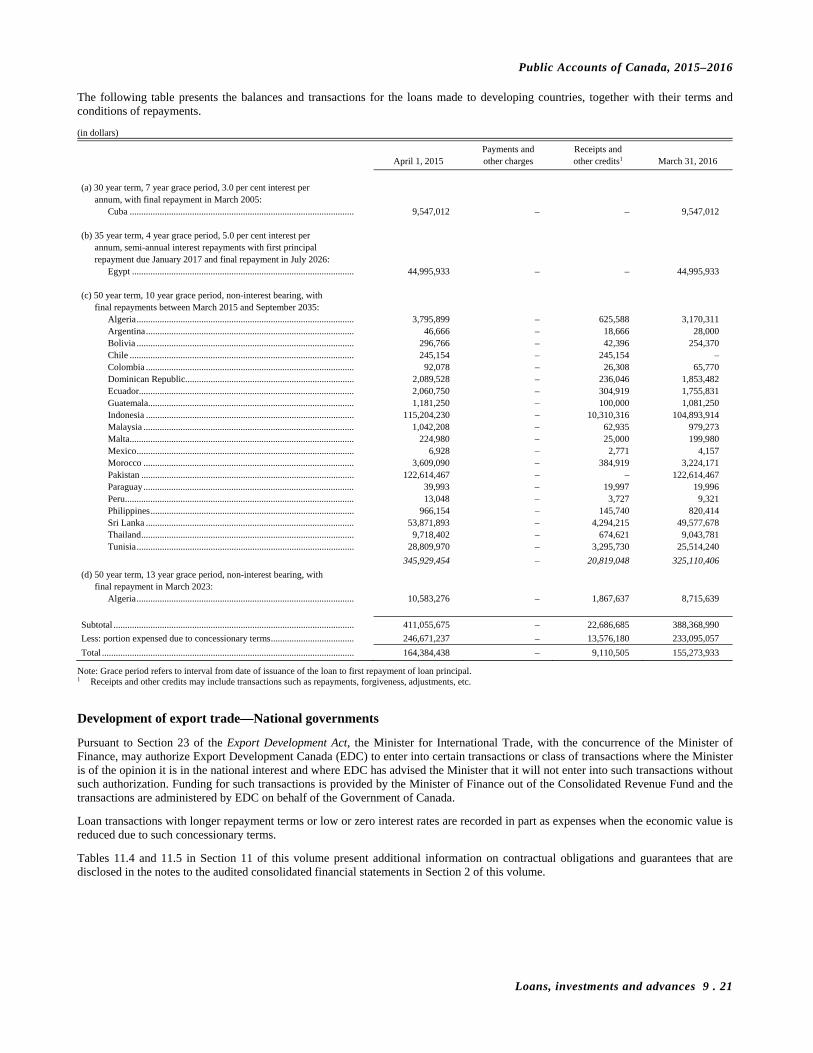
Public Accounts of Canada, 2015–2016
Loans, investments and advances 9 . 21
The following table presents the balances and transactions for the loans made to developing countries, together with their terms and conditions of repayments.
(in dollars)
Payments and Receipts and April 1, 2015 other charges other credits1 March 31, 2016
(a) 30 year term, 7 year grace period, 3.0 per cent interest per
annum, with final repayment in March 2005: Cuba ................................................................................................. 9,547,012 – – 9,547,012
(b) 35 year term, 4 year grace period, 5.0 per cent interest per annum, semi-annual interest repayments with first principal repayment due January 2017 and final repayment in July 2026:
Egypt ................................................................................................ 44,995,933 – – 44,995,933
(c) 50 year term, 10 year grace period, non-interest bearing, with final repayments between March 2015 and September 2035:
Algeria .............................................................................................. 3,795,899 – 625,588 3,170,311 Argentina .......................................................................................... 46,666 – 18,666 28,000 Bolivia .............................................................................................. 296,766 – 42,396 254,370 Chile ................................................................................................. 245,154 – 245,154 – Colombia .......................................................................................... 92,078 – 26,308 65,770 Dominican Republic......................................................................... 2,089,528 – 236,046 1,853,482 Ecuador............................................................................................. 2,060,750 – 304,919 1,755,831 Guatemala......................................................................................... 1,181,250 – 100,000 1,081,250 Indonesia .......................................................................................... 115,204,230 – 10,310,316 104,893,914 Malaysia ........................................................................................... 1,042,208 – 62,935 979,273 Malta ................................................................................................. 224,980 – 25,000 199,980 Mexico .............................................................................................. 6,928 – 2,771 4,157 Morocco ........................................................................................... 3,609,090 – 384,919 3,224,171 Pakistan ............................................................................................ 122,614,467 – – 122,614,467 Paraguay ........................................................................................... 39,993 – 19,997 19,996 Peru ................................................................................................... 13,048 – 3,727 9,321 Philippines ........................................................................................ 966,154 – 145,740 820,414 Sri Lanka .......................................................................................... 53,871,893 – 4,294,215 49,577,678 Thailand ............................................................................................ 9,718,402 – 674,621 9,043,781 Tunisia .............................................................................................. 28,809,970 – 3,295,730 25,514,240
345,929,454 – 20,819,048 325,110,406
(d) 50 year term, 13 year grace period, non-interest bearing, with final repayment in March 2023:
Algeria .............................................................................................. 10,583,276 – 1,867,637 8,715,639
Subtotal ........................................................................................................ 411,055,675 – 22,686,685 388,368,990
Less: portion expensed due to concessionary terms .................................... 246,671,237 – 13,576,180 233,095,057
Total ............................................................................................................. 164,384,438 – 9,110,505 155,273,933
Note: Grace period refers to interval from date of issuance of the loan to first repayment of loan principal. 1 Receipts and other credits may include transactions such as repayments, forgiveness, adjustments, etc.
Development of export trade—National governments
Pursuant to Section 23 of the Export Development Act, the Minister for International Trade, with the concurrence of the Minister of Finance, may authorize Export Development Canada (EDC) to enter into certain transactions or class of transactions where the Minister is of the opinion it is in the national interest and where EDC has advised the Minister that it will not enter into such transactions without such authorization. Funding for such transactions is provided by the Minister of Finance out of the Consolidated Revenue Fund and the transactions are administered by EDC on behalf of the Government of Canada.
Loan transactions with longer repayment terms or low or zero interest rates are recorded in part as expenses when the economic value is reduced due to such concessionary terms.
Tables 11.4 and 11.5 in Section 11 of this volume present additional information on contractual obligations and guarantees that are disclosed in the notes to the audited consolidated financial statements in Section 2 of this volume.

Public Accounts of Canada, 2015–2016
9 . 22 Loans, investments and advances
The following table presents the balances and transactions for loans made to national governments, together with their terms and conditions of repayments.
(in dollars)
Payments and other charges Receipts and other credits
Payments or Receipts or other other April 1, 2015 charges1 Revaluation credits2 Revaluation March 31, 2016
Non-budgetary loans3
(a) 1 to 5 year term, Canadian prime rate plus 0.35 per cent interest per annum, assumed from the Canadian Wheat Board (CWB), with final repayments in June 2016:
Egypt ................................................................................ 18,961,792 – – 12,291,450 – 6,670,342 (b) 1 to 5 year term, 3.0 per cent to 9.0 per cent interest per
annum, with final repayments in May 2019: Argentina .......................................................................... 23,394,076 – 544,589 7,750,725 – 16,187,940
(c) 11 to 15 year term, based on 6 month London Interbank
Offered Rate (LIBOR), plus 0.50 per cent interest per annum, assumed from CWB with final repayments in January 2028:
Iraq ................................................................................... 140,629,608 – 3,555,071 11,082,851 – 133,101,828 (d) 11 to 15 year term, interest based on LIBOR, plus a range
of rates from 0.5 per cent to 1.0 per cent per annum, with final repayments between December 2019 and June 2020:
Kenya ............................................................................... 901,783 – 24,517 90,653 – 835,647 (e) 16 to 20 year term, interest based on LIBOR, plus a range
of rates from 0.5 per cent to 0.63 per cent per annum, with final repayments between October 2018 and June 2021:
Indonesia .......................................................................... 483,425 – 12,167 57,808 – 437,784 Venezuela ......................................................................... 20,298,023 – 231,731 9,929,523 – 10,600,231
20,781,448 – 243,898 9,987,331 – 11,038,015
(f) 21 to 25 year term, 9.0 per cent to 10.0 per cent interest per annum, with final repayments in September 2000:
Sudan ................................................................................ 4,891,619 – 123,970 – – 5,015,589 (g) 21 to 25 year term, interest based on LIBOR, plus
0.55 per cent per annum, with final repayments in November 2024:
Pakistan ............................................................................ 6,665,035 – 168,557 374,259 – 6,459,333
(h) 21 to 25 year term, based on 6 month LIBOR, plus 0.55 per cent interest per annum, assumed from CWB, with final repayments in November 2024:
Pakistan ............................................................................ – 16,103,336 695,880 469,152 – 16,330,064
Total—Non-budgetary loans ....................................................... 216,225,361 16,103,336 5,356,482 42,046,421 – 195,638,758
Budgetary loans3
(a) 21 to 25 year term, 0 per cent to 3.5 per cent interest per annum, with final repayments between March 2011 and November 2015:
Indonesia .......................................................................... 1,676,490 – 92,699 1,769,189 – – (b) 26 to 30 year term, 3.0 per cent interest per annum, with
final repayments between December 2016 and April 2018: Algeria .............................................................................. 1,574,000 – – 568,000 – 1,006,000

Public Accounts of Canada, 2015–2016
Loans, investments and advances 9 . 23
(in dollars)
Payments and other charges Receipts and other credits
Payments or Receipts or other other April 1, 2015 charges1 Revaluation credits2 Revaluation March 31, 2016
(c) 31 to 55 year term, 0 per cent to 10.29 per cent interest
per annum, with final repayments between September 2029 and February 2045:
China ................................................................................ 440,002,200 – 11,412,069 22,489,097 – 428,925,172 Egypt ................................................................................ 7,861,526 – 66,197 349,749 – 7,577,974 Gabon ............................................................................... 8,013,592 – 204,283 323,414 – 7,894,461 India .................................................................................. 46,399,121 – 1,107,783 1,597,641 – 45,909,263 Jamaica ............................................................................. 5,446,380 – 145,148 244,752 – 5,346,776 Morocco ........................................................................... 77,027,932 – 2,134,337 3,515,552 – 75,646,717 Turkey .............................................................................. 95,004,620 – 2,543,030 3,677,554 – 93,870,096
679,755,371 – 17,612,847 32,197,759 – 665,170,459
(d) 31 to 55 year term, comprised of several loans with fixed or variable interest rates currently ranging from 0 per cent to 2.21 per cent per annum, with final repayments between December 2018 and December 2033:
Kenya ............................................................................... 4,980,610 – 130,905 304,131 – 4,807,384
Total—Budgetary loans ............................................................... 687,986,471 – 17,836,451 34,839,079 – 670,983,843
Subtotal ........................................................................................ 904,211,832 16,103,336 23,192,933 76,885,500 – 866,622,601
Less: portion expensed due to concessionary terms .................... 480,658,804 – – 24,773,845 – 455,884,959
Total ............................................................................................. 423,553,028 16,103,336 23,192,933 52,111,655 – 410,737,642
Note: Final repayment dates may change if loan amounts are rescheduled or restructured. 1 Payments or other charges may include transactions such as loans, adjustments, etc. 2 Receipts or other credits may include transactions such as repayments, forgiveness, adjustments, etc. 3 Prior to April 1, 1987, these loans were authorized by miscellaneous non-budgetary authorities. Subsequently, they were authorized by miscellaneous budgetary authorities.
Damage claims recoverable—North Atlantic Treaty Organization
Article VIII of the NATO Status of Forces Agreement signed April 4, 1949, as amended, deals with claims for damages to third parties arising from accidents in which a member of a visiting force is involved. This account is charged with the amount recoverable from other states, for claims for damages which took place in Canada, and is credited with recoveries.
The advances are non-interest bearing and have no specific repayment terms.

Public Accounts of Canada, 2015–2016
9 . 24 Loans, investments and advances
International organizations
This group records Canada’s subscriptions to the share capital of international banks. It also includes loans and advances to associations and other international organizations.
Canada’s subscriptions to the share capital of a number of international banks are composed of both paid-in and callable capital. Subscriptions to international organizations do not provide a return on investment but are repayable on termination of the organization or withdrawal from it.
Paid-in capital subscriptions are made through a combination of cash payments and the issuance of non-interest bearing, non-negotiable notes payable to the organization. Although payable on demand, these notes are typically encashed according to terms of agreements reached between the organization and participating countries. Canada’s subscriptions to the paid-in capital of these organizations are reported in Table 9.13.
Callable share capital is composed of resources that are not paid to the banks but act as a guarantee to allow them to borrow on international capital markets to finance their lending program. Callable share capital, which has never been drawn on by the banks, would only be utilized in extreme circumstances to repay loans, should a bank’s reserves not be sufficient. It represents a contingent liability of the Government, and is listed with other contingent liabilities related to international organizations in Table 11.6 in Section 11 of this volume.
Most loans and advances to international organizations are made to banks and associations that use these funds to make loans to developing countries at significant concessionary terms. Loans made on a long-term, low-interest or interest-free basis, and investments in organizations that make similar loans, are recorded in full or in part as expenses when the economic value is reduced due to their concessionary terms.
Table 9.13 presents a summary of the balances and transactions for share capital, loans and advances to international organizations. The revaluation amount represents the conversion of foreign currency balances to the year-end closing rates of exchange. Balances denominated in United States dollars were converted to Canadian dollars at year-end exchange rate of $1 USD/$1.2987 CAD.
Tables 11.4 and 11.6 of Section 11 of this volume present additional information on contractual obligations and contingent liabilities for international organizations that are disclosed in the notes to the audited consolidated financial statements in Section 2 of this volume.
The notes payable outstanding at year end of $35,312,954 ($34,440,123 in 2015) are reported in Table 5.3 in Section 5 of this volume.
Table 9.13 International organizations (in dollars)
Payments and other charges Receipts and other credits
Participation Reimburse- or ments or April 1, 2015 other charges Revaluation other credits Revaluation March 31, 2016
Capital subscriptions1
Finance European Bank for Reconstruction and Development ....... 273,835,966 – 6,939,944 – – 280,775,910 International Bank for Reconstruction and Development . 545,558,359 – 13,410,589 – – 558,968,948 International Development Association2 ............................ 10,730,948,061 441,610,000 – – – 11,172,558,061 International Finance Corporation ...................................... 103,027,777 – 2,611,078 – – 105,638,855 Multilateral Investment Guarantee Agency ........................ 13,593,468 – 344,505 – – 13,937,973
11,666,963,631 441,610,000 23,306,116 – – 12,131,879,747
Global Affairs Foreign Affairs, Trade and Development
African Development Bank ........................................... 263,345,255 34,833,444 6,998,157 – – 305,176,856 Asian Development Bank .............................................. 375,909,414 – 4,101,241 – – 380,010,655 Caribbean Development Bank ...................................... 49,713,462 – 1,101,734 – – 50,815,196 Inter-American Development Bank .............................. 296,223,291 18,647,977 6,463,034 – – 321,334,302 Inter-American Investment Corporation ....................... 1,899,900 – 48,150 – – 1,948,050
987,091,322 53,481,421 18,712,316 – – 1,059,285,059
12,654,054,953 495,091,421 42,018,432 – – 13,191,164,806
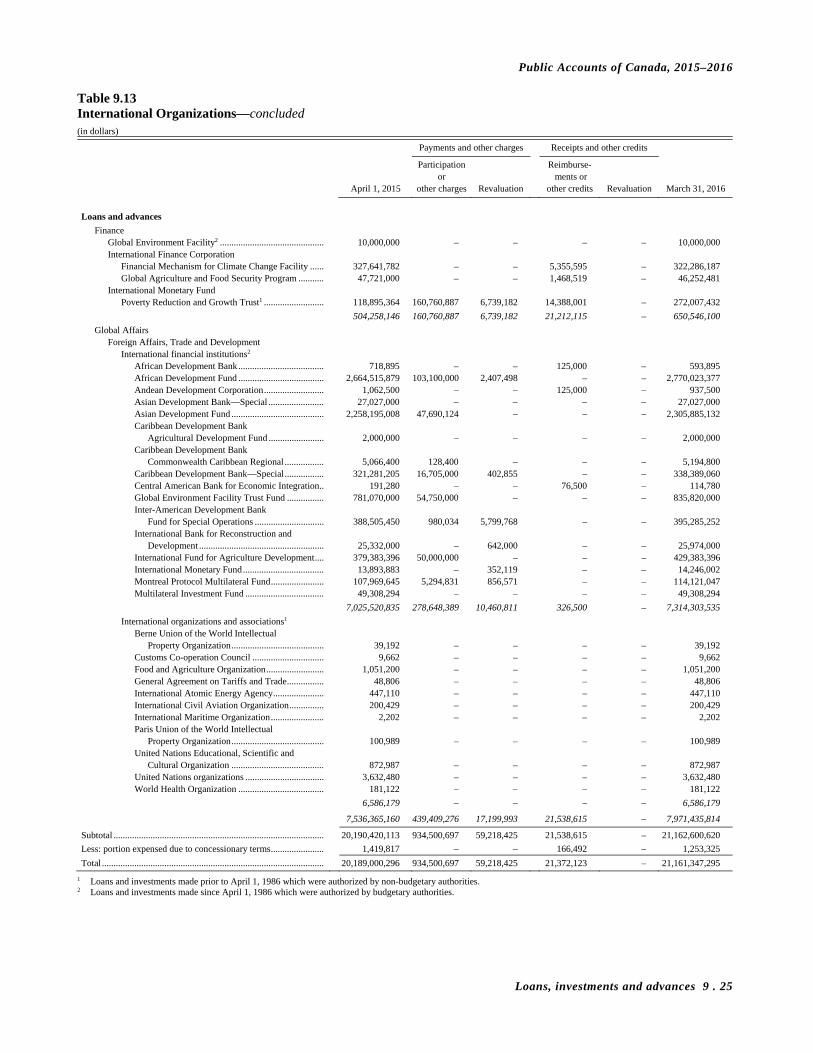
Public Accounts of Canada, 2015–2016
Loans, investments and advances 9 . 25
Table 9.13 International Organizations—concluded (in dollars)
Payments and other charges Receipts and other credits
Participation Reimburse- or ments or April 1, 2015 other charges Revaluation other credits Revaluation March 31, 2016
Loans and advances
Finance Global Environment Facility2 ............................................. 10,000,000 – – – – 10,000,000 International Finance Corporation
Financial Mechanism for Climate Change Facility ...... 327,641,782 – – 5,355,595 – 322,286,187 Global Agriculture and Food Security Program ........... 47,721,000 – – 1,468,519 – 46,252,481
International Monetary Fund Poverty Reduction and Growth Trust1 .......................... 118,895,364 160,760,887 6,739,182 14,388,001 – 272,007,432
504,258,146 160,760,887 6,739,182 21,212,115 – 650,546,100
Global Affairs Foreign Affairs, Trade and Development
International financial institutions2 African Development Bank ..................................... 718,895 – – 125,000 – 593,895 African Development Fund ..................................... 2,664,515,879 103,100,000 2,407,498 – – 2,770,023,377 Andean Development Corporation .......................... 1,062,500 – – 125,000 – 937,500 Asian Development Bank—Special ........................ 27,027,000 – – – – 27,027,000 Asian Development Fund ........................................ 2,258,195,008 47,690,124 – – – 2,305,885,132 Caribbean Development Bank
Agricultural Development Fund ........................ 2,000,000 – – – – 2,000,000 Caribbean Development Bank
Commonwealth Caribbean Regional ................. 5,066,400 128,400 – – – 5,194,800 Caribbean Development Bank—Special ................. 321,281,205 16,705,000 402,855 – – 338,389,060 Central American Bank for Economic Integration .. 191,280 – – 76,500 – 114,780 Global Environment Facility Trust Fund ................ 781,070,000 54,750,000 – – – 835,820,000 Inter-American Development Bank
Fund for Special Operations .............................. 388,505,450 980,034 5,799,768 – – 395,285,252 International Bank for Reconstruction and
Development ...................................................... 25,332,000 – 642,000 – – 25,974,000 International Fund for Agriculture Development .... 379,383,396 50,000,000 – – – 429,383,396 International Monetary Fund ................................... 13,893,883 – 352,119 – – 14,246,002 Montreal Protocol Multilateral Fund ....................... 107,969,645 5,294,831 856,571 – – 114,121,047 Multilateral Investment Fund .................................. 49,308,294 – – – – 49,308,294
7,025,520,835 278,648,389 10,460,811 326,500 – 7,314,303,535
International organizations and associations1 Berne Union of the World Intellectual
Property Organization ........................................ 39,192 – – – – 39,192 Customs Co-operation Council ............................... 9,662 – – – – 9,662 Food and Agriculture Organization ......................... 1,051,200 – – – – 1,051,200 General Agreement on Tariffs and Trade ................ 48,806 – – – – 48,806 International Atomic Energy Agency ...................... 447,110 – – – – 447,110 International Civil Aviation Organization ............... 200,429 – – – – 200,429 International Maritime Organization ....................... 2,202 – – – – 2,202 Paris Union of the World Intellectual
Property Organization ........................................ 100,989 – – – – 100,989 United Nations Educational, Scientific and
Cultural Organization ........................................ 872,987 – – – – 872,987 United Nations organizations .................................. 3,632,480 – – – – 3,632,480 World Health Organization ..................................... 181,122 – – – – 181,122
6,586,179 – – – – 6,586,179
7,536,365,160 439,409,276 17,199,993 21,538,615 – 7,971,435,814
Subtotal ........................................................................................... 20,190,420,113 934,500,697 59,218,425 21,538,615 – 21,162,600,620
Less: portion expensed due to concessionary terms ....................... 1,419,817 – – 166,492 – 1,253,325
Total ................................................................................................ 20,189,000,296 934,500,697 59,218,425 21,372,123 – 21,161,347,295
1 Loans and investments made prior to April 1, 1986 which were authorized by non-budgetary authorities. 2 Loans and investments made since April 1, 1986 which were authorized by budgetary authorities.

Public Accounts of Canada, 2015–2016
9 . 26 Loans, investments and advances
European Bank for Reconstruction and Development
This account records Canada’s subscriptions to the capital of the European Bank for Reconstruction and Development (EBRD), as authorized by the European Bank for Reconstruction and Development Agreement Act, and various appropriation acts.
At year end, Canada has subscribed to 102,049 shares of the EBRD’s authorized capital valued at 1,020,490,000 EUR.
Only 212,850,000 EUR or about 21 per cent of Canada’s share subscription is considered “paid-in”. The balance is callable meaning the institution can request the resources in the unlikely event that it requires them to meet its financial obligations to bondholders. Payments for the share subscription are authorized by the Act. Each payment to the EBRD is comprised of cash and a promissory note.
Canada’s contingent liability for the callable portion of its shares was 807,640,000 EUR.
Up to and including March 31, 2016, Canada’s total cash contributions into the “paid-in” capital of the EBRD total $216,197,668 USD.
International Bank for Reconstruction and Development
This account records Canada’s subscriptions to the capital of the International Bank for Reconstruction and Development (World Bank), as authorized by the Bretton Woods and Related Agreements Act, and various appropriation acts.
As at March 31, 2016, Canada has subscribed to 58,354 shares. The total value of these shares is $7,039,534,790 USD, of which $417,775,385 USD plus $16,404,055 CAD has been paid-in. The remaining portion is callable.
The callable portion is subject to call by the World Bank under certain circumstances. Canada’s contingent liability for the callable portion of its shares is $6,606 million USD.
International Development Association
This account records Canada’s contributions and subscriptions to the International Development Association (IDA), as authorized by the Bretton Woods and Related Agreements Act, and various appropriation acts (including Finance Vote 10, Appropriation Act No. 2, 2015–2016). The contributions and subscriptions to IDA, which is part of the World Bank Group, are used to lend funds to the poorest developing countries for development purposes, on highly favourable terms (no interest, with a 35 to 40 year maturity and 10 years of grace).
As at March 31, 2016, Canada’s total participation in IDA amounted to $11,172,558,061 CAD.
International Finance Corporation
This account records Canada’s subscriptions to the capital of the International Finance Corporation, which is part of the World Bank Group, as authorized by the Bretton Woods and Related Agreements Act, and various appropriation acts.
As at March 31, 2016, Canada has subscribed to 81,342 shares. These shares have a total value of $81,342,000 USD, all of which has been paid-in.
Multilateral Investment Guarantee Agency
This account records Canada’s subscriptions to the capital of the Multilateral Investment Guarantee Agency, as authorized by the Bretton Woods and Related Agreements Act, and various appropriation acts.
As at March 31, 2016, Canada has subscribed to 5,225 shares. The total value of these shares is $56,534,500 USD, of which $10,732,250 USD is paid-in and the remaining portion is callable.
The callable portion is subject to call by the Multilateral Investment Guarantee Agency under certain circumstances. Canada’s contingent liability for the callable portion of its shares is $45,802,250 USD.
African Development Bank
This account records Canada’s subscriptions to the capital of the African Development Bank, as authorized by the International Development (Financial Institutions) Assistance Act, and various appropriation acts.
At year end, authority had been granted for subscriptions of 18,146 paid-in shares and 228,171 callable shares. Paid-in shares are purchased using direct payments.
As at March 31, 2016, Canada’s participation to the paid-in capital is $305,176,856 CAD for 17,833 paid-in shares and of these paid-in shares, 13,305 were issued in US dollars.
The callable shares are subject to call by the African Development Bank under certain circumstances. Canada’s contingent liability for callable shares has a current value of $984,917,646 CAD and $2,487,840,899 USD for a total value of $4,215,876,621 CAD.

Public Accounts of Canada, 2015–2016
Loans, investments and advances 9 . 27
Asian Development Bank
This account records Canada’s subscriptions to the capital of the Asian Development Bank, as authorized by the International Development (Financial Institutions) Assistance Act, and various appropriation acts.
At year end, authority had been granted for subscriptions of 27,768 paid-in shares and 527,490 callable shares. Paid-in shares are purchased using direct payments.
As at March 31, 2016, Canada’s participation to the paid-in capital is $380,010,655 CAD for 27,768 paid-in shares. Of these paid-in shares, 25,398 were issued in US dollars.
The callable shares are subject to call by the Asian Development Bank under certain circumstances. Canada’s contingent liability for callable shares has a current value of $6,363,375,615 USD for a total value of $8,264,115,911 CAD.
Caribbean Development Bank
This account records Canada’s subscriptions to the capital of the Caribbean Development Bank, as authorized by the International Development (Financial Institutions) Assistance Act, and various appropriation acts.
At year end, authority had been granted for subscriptions of 5,710 paid-in shares and 20,294 callable shares. Paid-in shares are purchased using direct payments.
As at March 31, 2016, Canada’s participation to the paid-in capital is $50,815,196 CAD for 5,710 paid-in shares. These shares were issued in US dollars.
The callable shares are subject to call by the Caribbean Development Bank under certain circumstances. Canada’s contingent liability for callable shares has a current value of $122,408,132 USD for a total value of $158,971,440 CAD.
Inter-American Development Bank
This account records Canada’s subscriptions to the capital of the Inter-American Development Bank, as authorized by the International Development (Financial Institutions) Assistance Act, and various appropriation acts.
At year end, authority had been granted for subscriptions of 20,034 paid-in shares and 547,005 callable shares. Paid-in shares are purchased using direct payments.
As at March 31, 2016, Canada’s participation to the paid-in capital is $321,334,302 CAD for 20,034 paid-in shares. These shares were issued in US dollars.
The callable shares are subject to call by the Inter-American Development Bank under certain circumstances. Canada’s contingent liability for callable shares has a current value of $6,598,757,829 USD for a total value of $8,569,806,792 CAD.
Inter-American Investment Corporation
This account records Canada’s subscriptions to the capital of the Inter-American Investment Corporation, as authorized by the International Development (Financial Institutions) Assistance Act, and various appropriation acts.
At year end, authority had been granted for subscriptions of 4,088 paid-in shares. Paid-in shares are purchased using direct payments.
As at March 31, 2016, Canada’s participation to the paid-in capital is $1,948,050 CAD for 150 paid-in shares. These shares were issued in US dollars.
Global Environment Facility
This account records the funding of a facility for environmental funding in developing countries in the areas of ozone, climate change biodiversity and international waters as authorized by the Bretton Woods and Related Agreements Act, and various appropriation acts. Advances to the Global Environment Facility (GEF) are made in non-negotiable, non-interest bearing demand notes that are later encashed.
As at March 31, 2016, advances to the GEF amounted to $10,000,000 CAD.
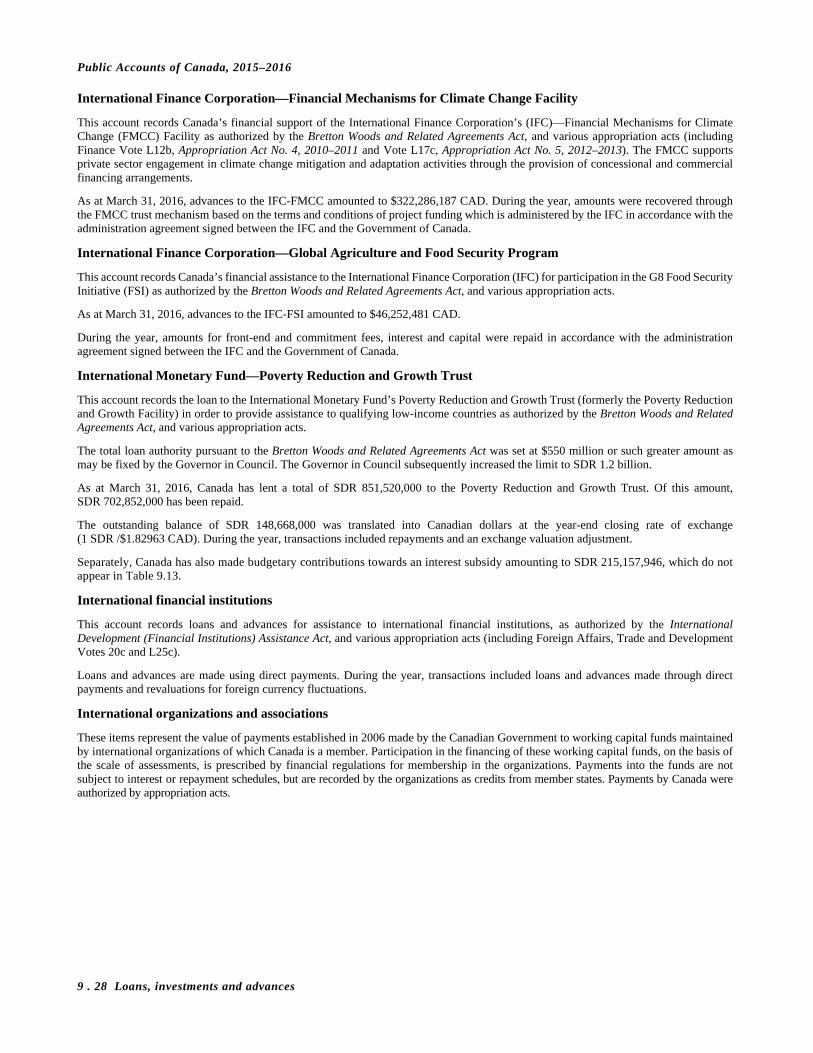
Public Accounts of Canada, 2015–2016
9 . 28 Loans, investments and advances
International Finance Corporation—Financial Mechanisms for Climate Change Facility
This account records Canada’s financial support of the International Finance Corporation’s (IFC)—Financial Mechanisms for Climate Change (FMCC) Facility as authorized by the Bretton Woods and Related Agreements Act, and various appropriation acts (including Finance Vote L12b, Appropriation Act No. 4, 2010–2011 and Vote L17c, Appropriation Act No. 5, 2012–2013). The FMCC supports private sector engagement in climate change mitigation and adaptation activities through the provision of concessional and commercial financing arrangements.
As at March 31, 2016, advances to the IFC-FMCC amounted to $322,286,187 CAD. During the year, amounts were recovered through the FMCC trust mechanism based on the terms and conditions of project funding which is administered by the IFC in accordance with the administration agreement signed between the IFC and the Government of Canada.
International Finance Corporation—Global Agriculture and Food Security Program
This account records Canada’s financial assistance to the International Finance Corporation (IFC) for participation in the G8 Food Security Initiative (FSI) as authorized by the Bretton Woods and Related Agreements Act, and various appropriation acts.
As at March 31, 2016, advances to the IFC-FSI amounted to $46,252,481 CAD.
During the year, amounts for front-end and commitment fees, interest and capital were repaid in accordance with the administration agreement signed between the IFC and the Government of Canada.
International Monetary Fund—Poverty Reduction and Growth Trust
This account records the loan to the International Monetary Fund’s Poverty Reduction and Growth Trust (formerly the Poverty Reduction and Growth Facility) in order to provide assistance to qualifying low-income countries as authorized by the Bretton Woods and Related Agreements Act, and various appropriation acts.
The total loan authority pursuant to the Bretton Woods and Related Agreements Act was set at $550 million or such greater amount as may be fixed by the Governor in Council. The Governor in Council subsequently increased the limit to SDR 1.2 billion.
As at March 31, 2016, Canada has lent a total of SDR 851,520,000 to the Poverty Reduction and Growth Trust. Of this amount, SDR 702,852,000 has been repaid.
The outstanding balance of SDR 148,668,000 was translated into Canadian dollars at the year-end closing rate of exchange (1 SDR /$1.82963 CAD). During the year, transactions included repayments and an exchange valuation adjustment.
Separately, Canada has also made budgetary contributions towards an interest subsidy amounting to SDR 215,157,946, which do not appear in Table 9.13.
International financial institutions
This account records loans and advances for assistance to international financial institutions, as authorized by the International Development (Financial Institutions) Assistance Act, and various appropriation acts (including Foreign Affairs, Trade and Development Votes 20c and L25c).
Loans and advances are made using direct payments. During the year, transactions included loans and advances made through direct payments and revaluations for foreign currency fluctuations.
International organizations and associations
These items represent the value of payments established in 2006 made by the Canadian Government to working capital funds maintained by international organizations of which Canada is a member. Participation in the financing of these working capital funds, on the basis of the scale of assessments, is prescribed by financial regulations for membership in the organizations. Payments into the funds are not subject to interest or repayment schedules, but are recorded by the organizations as credits from member states. Payments by Canada were authorized by appropriation acts.

Public Accounts of Canada, 2015–2016
Loans, investments and advances 9 . 29
Provincial and territorial governments
This category records loans to provinces and territories made under relief acts and other legislation.
Loans made on a long-term, low-interest or interest-free basis are recorded in part as expenses when the economic value of these loans is reduced due to their concessionary terms.
Table 9.14 presents a summary of the balances and transactions for the various types of loans and advances that have been made to provincial and territorial governments.
Table 9.14 Provincial and territorial governments (in dollars)
Payments and Receipts and April 1, 2015 other charges other credits March 31, 2016
Finance
Newfoundland and Labrador Federal-provincial fiscal arrangements ............................................ 290,124,428 – 18,936,328 271,188,100 Municipal Development and Loan Board ........................................ 315,626 – – 315,626 Winter capital projects fund ............................................................. 2,836,758 – – 2,836,758
293,276,812 – 18,936,328 274,340,484
Nova Scotia Federal-provincial fiscal arrangements ............................................ 33,319,584 – 33,319,584 –
Prince Edward Island
Federal-provincial fiscal arrangements ............................................ 4,561,136 – 3,907,784 653,352 Winter capital projects fund ............................................................. 63,079 – – 63,079
4,624,215 – 3,907,784 716,431
New Brunswick Federal-provincial fiscal arrangements ............................................ 20,832,056 – 20,832,056 –
Quebec
Federal-provincial fiscal arrangements ............................................ 164,105,128 73,629,000 283,391,878 (45,657,750)
Ontario Federal-provincial fiscal arrangements ............................................ 105,255,488 – 15,036,504 90,218,984
Manitoba
Federal-provincial fiscal arrangements ............................................ 4,697,536 – 4,697,536 –
Saskatchewan Federal-provincial fiscal arrangements ............................................ 156,549,936 – 23,660,128 132,889,808
Alberta
Federal-provincial fiscal arrangements ............................................ 2,297,264 – 2,297,264 –
British Columbia Comprehensive Integrated Tax Coordination Agreement ............... 319,800,000 – 319,800,000 – Federal-provincial fiscal arrangements ............................................ 60,097,064 – 60,097,064 –
379,897,064 – 379,897,064 –
Subtotal ........................................................................................................ 1,164,855,083 73,629,000 785,976,126 452,507,957
Less: portion expensed due to concessionary terms .................................... 52,715,171 – 19,239,304 33,475,867
Total ............................................................................................................. 1,112,139,912 73,629,000 766,736,822 419,032,090

Public Accounts of Canada, 2015–2016
9 . 30 Loans, investments and advances
Federal-provincial fiscal arrangements
These amounts represent net overpayments in respect of transfer payments to provinces under the Constitution Acts 1867 to 1982, the Federal-Provincial Fiscal Arrangements Act, and other statutory authorities.
The overpayments are non-interest bearing and will be repaid by reducing transfer payments in subsequent years.
Municipal Development and Loan Board
Loans have been made to provinces and municipalities, to augment or accelerate municipal capital works programs.
The loans bear interest at rates from 5.25 per cent to 5.375 per cent per annum, and are repayable in annual or semi-annual instalments over 15 to 50 years.
Winter capital projects fund
Loans have been made to provinces, provincial agencies and municipalities, to assist in the creation of employment.
The loans bear interest at rates from 7.4 per cent to 9.5 per cent per annum, and are repayable either in annual instalments over 5 to 20 years, or at maturity.
Comprehensive Integrated Tax Coordination Agreement
Transitional assistance that had been paid to British Columbia as part as a Comprehensive Integrated Tax Coordination Agreement with Canada was recovered in equal annual instalments with final payment received in March 2016.
The government has not collected interest on these amounts.
During the year, the account was closed.

Public Accounts of Canada, 2015–2016
Loans, investments and advances 9 . 31
Other loans, investments and advances
This group records loans, investments and advances not classified elsewhere.
Table 9.15 presents a summary of the balances and transactions for the various types of other loans, investments and advances.
Table 9.15 Other loans, investments and advances (in dollars)
Payments and Receipts and April 1, 2015 other charges other credits March 31, 2016
Unconditionally repayable contributions
Agriculture and Agri-Food ........................................................................... 115,950,213 25,051,872 22,767,218 118,234,867
Global Affairs
Foreign Affairs, Trade and Development ............................................... 525,000,000 – – 525,000,000
Innovation, Science and Economic Development
Industry.................................................................................................... 882,294,234 1,374,720,499 312,374,690 1,944,640,043 Atlantic Canada Opportunities Agency .................................................. 347,257,740 58,135,778 66,265,185 339,128,333 Economic Development Agency of Canada
for the Regions of Quebec ................................................................. 443,465,744 91,487,739 67,473,970 467,479,513 Federal Economic Development Agency for Southern Ontario ............. 182,281,073 77,343,103 32,892,857 226,731,319 Western Economic Diversification ......................................................... 30,004,266 19,920,331 2,695,963 47,228,634
1,885,303,057 1,621,607,450 481,702,665 3,025,207,842
Subtotal ............................................................................................................... 2,526,253,270 1,646,659,322 504,469,883 3,668,442,709
Less: portion expensed due to concessionary terms ........................................... 245,890,377 9,449,873 18,276,404 237,063,846
Total—Unconditionally repayable contributions ............................................... 2,280,362,893 1,637,209,449 486,193,479 3,431,378,863
Loans and accountable advances
Global Affairs Foreign Affairs, Trade and Development
Missions abroad ................................................................................. 46,017,787 177,505,542 180,879,307 42,644,022 Personnel posted abroad .................................................................... 22,512,773 16,910,409 15,045,777 24,377,405
68,530,560 194,415,951 195,925,084 67,021,427
National Defence Imprest accounts, standing advances and authorized loans .................... 36,229,547 132,335,461 129,707,453 38,857,555
Other departments
Miscellaneous accountable advances ...................................................... 21,094,306 16,772,875 17,959,042 19,908,139 Miscellaneous accountable imprest funds and standing advances ......... 20,023,503 721,252 455,916 20,288,839
41,117,809 17,494,127 18,414,958 40,196,978
Total—Loans and accountable advances ........................................................... 145,877,916 344,245,539 344,047,495 146,075,960
Other
Agriculture and Agri-Food Construction of multi-purpose exhibition buildings ............................... 35,593 – – 35,593 Hog Industry Loan Loss Reserve Program ............................................. 187,678,432 – 55,278,546 132,399,886 National Marketing Programs ................................................................. 277,889,614 32,073,044 49,236,986 260,725,672
465,603,639 32,073,044 104,515,532 393,161,151
Families, Children and Social Development Employment and Social Development
Canada apprentice loans .................................................................... 18,808,790 68,803,068 2,340,587 85,271,271 Canada Student Loans Program ........................................................ 17,607,570,547 4,311,093,736 3,622,683,952 18,295,980,331 Provincial workers' compensation boards ......................................... 13,607,001 – – 13,607,001
17,639,986,338 4,379,896,804 3,625,024,539 18,394,858,603
Finance Canadian Commercial Bank ................................................................... 42,202,293 – – 42,202,293 Financial Consumer Agency of Canada—Advances .............................. 4,000,000 8,000,000 12,000,000 –
46,202,293 8,000,000 12,000,000 42,202,293
Fisheries, Oceans and the Canadian Coast Guard Fisheries and Oceans
Canadian producers of frozen groundfish ......................................... 128,315 – – 128,315 Haddock fishermen ............................................................................ 1,343,337 – – 1,343,337
1,471,652 – – 1,471,652

Public Accounts of Canada, 2015–2016
9 . 32 Loans, investments and advances
Table 9.15 Other loans, investments and advances—concluded (in dollars)
Payments and Receipts and April 1, 2015 other charges other credits March 31, 2016
Global Affairs
Export Development Canada Support and development of trade .................................................... 2,772,322,727 66,147,900 171,883,928 2,666,586,699
Immigration, Refugees and Citizenship
Citizenship and Immigration Immigration loans .............................................................................. 42,833,344 17,301,999 13,580,351 46,554,992
Indigenous and Northern Affairs
Indian Affairs and Northern Development Council of Yukon First Nations—Elders .......................................... 2,469,055 – 691,300 1,777,755 Farm Credit Canada Guarantee Loans Program ............................... 103,695 – – 103,695 First Nations in British Columbia ..................................................... 505,895,962 18,729,431 1,844,831 522,780,562 Indian Economic Development Fund ................................................ 43,149 – – 43,149 Indian Economic Development Guarantee Loans Program .............. 422,127 – – 422,127 Inuit Loan Fund ................................................................................. 71,457 – – 71,457 Native Claimants ............................................................................... 444,656,491 19,232,248 8,260,570 455,628,169 On Reserve Housing Guarantee Loans Program .............................. 9,263,159 2,156,452 461,733 10,957,878 Stoney Band Perpetual Loan ............................................................. 389,615 – – 389,615
963,314,710 40,118,131 11,258,434 992,174,407
Innovation, Science and Economic Development Industry
Manufacturing, processing and service industries in Canada ........... 110,000,000 – – 110,000,000 Other business loans .......................................................................... 77,963,193 62,791,651 68,330,038 72,424,806
National Research Council of Canada H.L. Holmes Fund ............................................................................. 5,005,889 63,866 – 5,069,755
192,969,082 62,855,517 68,330,038 187,494,561
Natural Resources Nordion International Inc. ....................................................................... 42,000,000 – 42,000,000 –
Public Services and Procurement
Public Works and Government Services Seized Property Working Capital Account ....................................... (12,206,001) 44,440,992 34,983,862 (2,748,871)
Transport
Greater Victoria Harbour Authority ........................................................ 2,151,269 – 42,720 2,108,549 St. Lawrence Seaway Management Corporation .................................... 173,698 – – 173,698
2,324,967 – 42,720 2,282,247
Treasury Board Federal Public Service Heatlh Care Administration Authority .............. 574,965 2,066,051 2,082,164 558,852 Joint Learning Program ........................................................................... 628,022 1,909,207 2,274,108 263,121
1,202,987 3,975,258 4,356,272 821,973
Veterans Affairs Commonwealth War Graves Commission .............................................. 56,376 – 414 55,962 Veterans' Land Fund
Advances ........................................................................................... 5,523 – 3,716 1,807
61,899 – 4,130 57,769
Other departments Transition payments—Pay in arrears ...................................................... 691,612,328 5,623,191 31,847,086 665,388,433 Miscellaneous .......................................................................................... 399,678 55,258 144,223 310,713
692,012,006 5,678,449 31,991,309 665,699,146
Subtotal—Other .................................................................................................. 22,850,099,643 4,660,488,094 4,119,971,115 23,390,616,622
Less: portion expensed due to concessionary terms and other discounts .......... 99,078,750 – 34,178,995 64,899,755
22,751,020,893 4,660,488,094 4,085,792,120 23,325,716,867
Add: consolidation adjustment1 .......................................................................... 3,068,549,000 – 374,543,000 2,694,006,000
Total—Other ....................................................................................................... 25,819,569,893 4,660,488,094 4,460,335,120 26,019,722,867
Total .................................................................................................................... 28,245,810,702 6,641,943,082 5,290,576,094 29,597,177,690
1 Additional information on consolidated Crown corporations and other entities is also provided in Section 4 of this volume.

Public Accounts of Canada, 2015–2016
Loans, investments and advances 9 . 33
Unconditionally repayable contributions
Unconditionally repayable contributions are, in substance loans, and are generally made to businesses pursuant to various Acts of Parliament, with various amounts outstanding.
These loans are aimed at stimulating economic development or for assistance. They bear various interest rates, some of which have concessional terms, and are repayable at various due dates with final instalments generally due within up to 10 years of initial disbursement.
Loans made on a long-term, low-interest or interest-free basis are recorded in part as expenses when the economic value of the loans is reduced due to their concessionary terms.
Missions abroad
Non-interest bearing advances have been made for interim financing of expenses at missions abroad, pending distribution to appropriations of Foreign Affairs, Trade and Development and other departments and agencies.
The total amount authorized to be outstanding at any time is $50,000,000.
Personnel posted abroad
A working capital advance account was established to finance loans and advances to employees posted abroad, including employees of other Government departments and agencies, as well as medical advances to locally-engaged staff.
The total amount authorized to be outstanding at any time is $38,200,000, as last amended by Foreign Affairs and International Trade Vote L12c, Appropriation Act No. 5, 2009-2010.
The closing balance consists of loans to employees, $17,711,250; advances for medical expenses, $1,321,694; advances for workmen’s compensation, $6,358; security and other deposits under Foreign Service Directives, $2,714,995 and, school and club debentures, $2,623,108.
The loans to employees bear interest at rates from 0.75 per cent to 2.5 per cent per annum, and are repayable within 4 years, with final instalments between April 1, 2016 and March 1, 2019.
Imprest accounts, standing advances and authorized loans
This account was established for the purpose of financing: (a) public funds imprest and public funds advance accounts; (b) standing advances; (c) authorized loans and advances to employees posted abroad; and (d) authorized recoverable advances to establish military messes and canteens.
The total amount authorized to be outstanding at any time is $120,000,000, as last amended by National Defence Vote L11b, Appropriation Act No. 4, 2001-2002.
Miscellaneous accountable advances
The closing balance reflects amounts outstanding in the hands of departments, agencies and individuals, at year end, to be expended in the following year.
Miscellaneous accountable imprest funds and standing advances
This account is operated to provide imprest funds, accountable advances and recoverable advances to departments and agencies.
The total amount authorized to be outstanding at any time is $22,000,000.
Construction of multi-purpose exhibition buildings
The remaining loan has been made to finance the construction of a multi-purpose exhibition building.
Hog Industry Loan Loss Reserve Program
Loans made by financial institutions under the Hog Industry Loan Loss Reserve Program are partially guaranteed by the Crown. Where the producers have defaulted and the lenders have carried out regular collection activities, the Crown becomes subrogated to the lender’s rights against the producer in default, to the extent of an amount equal to the withdrawal from the Reserve Fund.
National Marketing Programs
Loans made by financial institutions under the Canadian Agricultural Loans Act and advances made by producer organizations under the Agricultural Marketing Programs Act are guaranteed by the Crown. Where the guarantee is honoured, the Crown becomes subrogated to the financial institution’s or producer organization’s rights to outstanding principal, interest and costs.
Public Accounts of Canada, 2015–2016
9 . 34 Loans, investments and advances
Canada apprentice loans
Canada apprentice loans are administrated under the authority of Section 4 of the Apprentice Loans Act which came into effect on January 2, 2015. The Minister of Families, Children and Social Development is authorized to enter into a loan agreement directly with any eligible apprentice. The loans bear interest at either a variable rate (prime rate plus 2.5 per cent) or a fixed rate (prime rate plus 5.0 per cent). Apprentices are not required to pay interest on their loans while they are still in their apprenticeship program. The typical repayment period is 10 years, but the maximum period is 15 years. Borrowers having difficulty repaying their loans may be eligible for assistance under the Repayment Assistance Plan.
The total amount of apprentice loans issued under the authority of the Apprentice Loans Act may not exceed $1.5 billion. The total amount of outstanding apprentice loans as at March 31, 2016 amounts to $85,271,271 ($18,808,790 as at March 31, 2015). During the year, no loans were written off (none as at March 31, 2015).
Canada Student Loans Program
Since August 1, 2000, Canada Student Loans are issued under the Direct Loan Regime. Before this date, the loans were issued under the Guaranteed Loan Regime (1964-1995) or under the Risk-Shared Loan Regime (1995-2000). Under these three different regimes, no security is received from the students and the loans bear interest at either a variable rate (prime rate plus 2.5 per cent) or a fixed rate (prime rate plus 5.0 per cent). Students are not required to pay interest on their loans while they are still studying. The typical repayment period is 10 years, but the maximum period is 15 years. Borrowers having difficulty repaying their loans may be eligible for assistance under the Repayment Assistance Plan.
The total amount of direct loans issued under the authority of the Canada Student Financial Assistance Act and outstanding risk-shared loans bought-back by Employment and Social Development may not exceed 24 billion dollars.
During the year, loans and interest receivable on these loans totaling $172,045,002 ($287,430,643 as at March 31, 2015) were written off by Employment and Social Development Vote 9c from the Appropriation Act No. 5, 2015-16 and $95,293,311 ($111,122,408 as at March 31, 2015) were written off pursuant to Section 25.1 of the Financial Administration Act. In addition, loans and interest receivable on these loans totalling $238,236,858 ($209,757,496 as at March 31, 2015) were forgiven as per the Canada Student Financial Assistance Act and $34,696 ($37,163 as at March 31, 2015) were forgiven as per the Canada Student Loans Act.
Direct loans to students
Loans issued on or after August 1, 2000 are administered under the authority of Section 6.1 of the Canada Student Financial Assistance Act, which authorizes the Minister of Families, Children and Social Development to enter into loan agreements directly with any qualifying student. Agreements are subject to the terms and conditions approved by the Governor in Council, on the recommendation of the Minister of Families, Children and Social Development with the concurrence of the Minister of Finance. The total amount of outstanding direct loans as at March 31, 2016 amounts to $18,091,457,031 ($17,340,771,357 as at March 31, 2015).
Risk-shared student loans
Loans issued prior to August 1, 2000 and on or after August 1, 1995 are amounts related to student loans subrogated to the Crown under the authority of the Canada Student Financial Assistance Act. The total amount of loans outstanding as at March 31, 2016 amounts to $68,353,582 ($96,701,249 as at March 31, 2015) for loans owned by Employment and Social Development and $966,926,519 ($1,086,269,018 as at March 31, 2015) for loans under the current ownership of the financial institutions.
Guaranteed student loans
Loans issued prior to August 1, 1995 are amounts related to student loans subrogated to the Crown under the authority of the Canada Student Loans Act. The total amount of loans outstanding as at March 31, 2016 amounts to $136,169,718 ($170,097,941 as at March 31, 2015) for loans owned by Employment and Social Development and $5,530,501 ($7,847,771 as at March 31, 2015) for loans under the current ownership of the financial institutions.
Provincial workers’ compensation boards
This account is operated under the authority of subsection 4(6)(b) and (e) of the Government Employees Compensation Act, to provide funds to enable provincial workers’ compensation boards to administer claims on behalf of the Crown, and provide compensation benefits to Canadian Government employees injured or ill in the course of their employment.
The total amount of advances that is authorized to be made for each provincial workers’ compensation board is not to exceed three months’ disbursements for compensation.
The advances are subject to the terms and conditions of agreements with provincial workers’ compensation boards and are to be repaid on termination of those agreements.
Public Accounts of Canada, 2015–2016
Loans, investments and advances 9 . 35
Canadian Commercial Bank
Advances have been made to the Canadian Commercial Bank representing the Government’s participation in the support group as authorized by the Canadian Commercial Bank Financial Assistance Act. These funds represent the Government’s participation in the loan portfolio that was acquired from the Bank and the purchase of outstanding debentures from existing holders.
Financial Consumer Agency of Canada
Interest-bearing advances have been made to defray the cost of operation of the Agency pursuant to Section 13(1) of the Financial Consumer Agency of Canada Act.
Canadian producers of frozen groundfish
Loans have been made to Canadian producers of frozen groundfish, canned and frozen crabmeat, and canned and frozen lobster meat, to assist in the financing of inventories.
The loans bore interest at the rate of 13 per cent per annum, and were repayable in equal annual instalments over 7 years, with the final instalment in December 1987. These loans are deemed unrecoverable and parliamentary authority is required to write off the balance.
Haddock fishermen
Loans have been made to Nova Scotia haddock fishermen whose fishery was closed from February 1 to May 31, 1975, pursuant to an agreement under the International Agreement for the Northwest Atlantic Fisheries. The total loan authority is $1,650,000.
The loans bore interest at the rate of 8 per cent per annum, and were repayable in equal annual instalments over 4 years, with the final instalment in 1979. These loans are deemed unrecoverable and parliamentary authority is required to write off the balance.
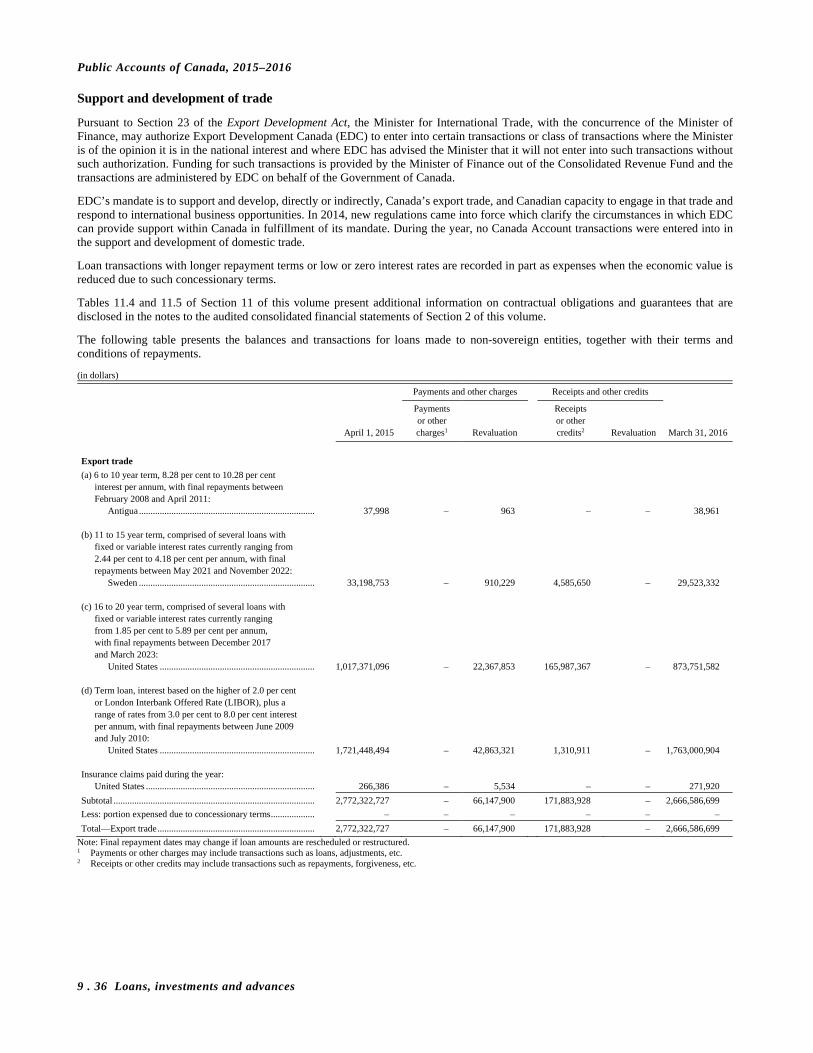
Public Accounts of Canada, 2015–2016
9 . 36 Loans, investments and advances
Support and development of trade
Pursuant to Section 23 of the Export Development Act, the Minister for International Trade, with the concurrence of the Minister of Finance, may authorize Export Development Canada (EDC) to enter into certain transactions or class of transactions where the Minister is of the opinion it is in the national interest and where EDC has advised the Minister that it will not enter into such transactions without such authorization. Funding for such transactions is provided by the Minister of Finance out of the Consolidated Revenue Fund and the transactions are administered by EDC on behalf of the Government of Canada.
EDC’s mandate is to support and develop, directly or indirectly, Canada’s export trade, and Canadian capacity to engage in that trade and respond to international business opportunities. In 2014, new regulations came into force which clarify the circumstances in which EDC can provide support within Canada in fulfillment of its mandate. During the year, no Canada Account transactions were entered into in the support and development of domestic trade.
Loan transactions with longer repayment terms or low or zero interest rates are recorded in part as expenses when the economic value is reduced due to such concessionary terms.
Tables 11.4 and 11.5 of Section 11 of this volume present additional information on contractual obligations and guarantees that are disclosed in the notes to the audited consolidated financial statements of Section 2 of this volume.
The following table presents the balances and transactions for loans made to non-sovereign entities, together with their terms and conditions of repayments.
(in dollars)
Payments and other charges Receipts and other credits
Payments Receipts or other or other April 1, 2015 charges1 Revaluation credits2 Revaluation March 31, 2016
Export trade
(a) 6 to 10 year term, 8.28 per cent to 10.28 per cent interest per annum, with final repayments between February 2008 and April 2011:
Antigua ............................................................................ 37,998 – 963 – – 38,961 (b) 11 to 15 year term, comprised of several loans with
fixed or variable interest rates currently ranging from 2.44 per cent to 4.18 per cent per annum, with final repayments between May 2021 and November 2022:
Sweden ............................................................................ 33,198,753 – 910,229 4,585,650 – 29,523,332 (c) 16 to 20 year term, comprised of several loans with
fixed or variable interest rates currently ranging from 1.85 per cent to 5.89 per cent per annum, with final repayments between December 2017 and March 2023:
United States ................................................................... 1,017,371,096 – 22,367,853 165,987,367 – 873,751,582 (d) Term loan, interest based on the higher of 2.0 per cent
or London Interbank Offered Rate (LIBOR), plus a range of rates from 3.0 per cent to 8.0 per cent interest per annum, with final repayments between June 2009 and July 2010:
United States ................................................................... 1,721,448,494 – 42,863,321 1,310,911 – 1,763,000,904 Insurance claims paid during the year:
United States ......................................................................... 266,386 – 5,534 – – 271,920
Subtotal ....................................................................................... 2,772,322,727 – 66,147,900 171,883,928 – 2,666,586,699
Less: portion expensed due to concessionary terms ................... – – – – – –
Total—Export trade .................................................................... 2,772,322,727 – 66,147,900 171,883,928 – 2,666,586,699
Note: Final repayment dates may change if loan amounts are rescheduled or restructured. 1 Payments or other charges may include transactions such as loans, adjustments, etc. 2 Receipts or other credits may include transactions such as repayments, forgiveness, etc.
Public Accounts of Canada, 2015–2016
Loans, investments and advances 9 . 37
Immigration loans
Section 88 of the Immigration and Refugee Protection Act authorizes the making of loans for the purpose of the Act.
The total amount authorized to be outstanding at any time is $110,000,000.
The terms and conditions of the loans, with their year-end balances, are as follows:
(a) repayable by monthly instalments over 1 to 6 years, with a possible deferment of 2 years, bearing interest at rates from 0.76 per cent to 9.06 per cent per annum, with final instalments between April 1, 2016 and April 1, 2022, $46,544,861; and
(b) repayable by monthly instalments over 1 to 6 years, with a possible deferment of 2 years, non-interest bearing, with final instalments past due, $10,131.
Council of Yukon First Nations—Elders
Loans have been made to the Council of Yukon First Nations to provide interim benefits to elderly Yukon Indians pending settlement of Yukon Indian land claims.
The terms and conditions of the loans are as follows:
(a) loans made before an agreement-in-principle for the settlement of a claim is reached are non-interest bearing;
(b) loans made after the date on which an agreement-in-principle for the settlement of a claim has been reached, bear interest at a rate equal to the rate established by the Minister of Finance in respect of borrowings for equivalent terms by Crown corporations; and
(c) loans are due and payable, as to principal and interest, on the date on which the claim is settled or on a date fixed in the loan agreement or promissory note, whichever date is earlier.
All the loans outstanding at year end bear interest at rates from 2.28 per cent to 6.00 per cent per annum.
Farm Credit Canada Guarantee Loans Program
The Farm Credit Canada guarantee loans program was discontinued as of November 14, 1989. The last active loan guarantee has expired and no future loan guarantees will be given under this program.
As of March 31, 2016, the outstanding amount represents the remaining defaulted loans reimbursed to the lenders by the Minister. These loans are deemed unrecoverable and the balance will be written off in future years.
First Nations in British Columbia
Loans have been made to First Nations in British Columbia to support their participation in the British Columbia Treaty Commission process related to the research, development and negotiation of treaties.
During the year, loans were authorized by Indian Affairs and Northern Development Vote L20, Appropriation Act No.2, 2015-2016.
The terms and conditions of the loans are as follows:
(a) loans made before an agreement-in-principle for the settlement of a treaty is reached are non-interest bearing;
(b) loans made before April 1, 2004 and after the date on which an agreement-in-principle for the settlement of a treaty has been reached, bear interest at a rate equal to the rate established by the Minister of Finance in respect of borrowings for equivalent terms by Crown corporations;
(c) loans made between April 1, 2004 and March 31, 2016 and after the date on which an agreement-in-principle for the settlement of a treaty has been reached, shall be interest free, unless the loans become due and payable during this period; and
(d) loans are due and payable by the First Nations and will pay the loan on the earliest of the following dates:
i. date on which the treaty is settled;
ii. twelfth anniversary of the first loan advance to the First Nations under the earliest First Nations’ funding agreement;
iii. seventh anniversary after the signing of an agreement-in-principle; or
iv. date the federal minister demands payment of the loans due to an event of default under this agreement or under any First Nations’ funding agreement.
The interest-bearing and non-interest bearing portions of the loans outstanding at year end are $14,583,196 and $508,197,366 respectively. Rates are from 0.6594 per cent to 4.545 per cent per annum for the interest-bearing portion.

Public Accounts of Canada, 2015–2016
9 . 38 Loans, investments and advances
Indian Economic Development Fund
Loans have been made for the purposes of economic development of Indians to Indians or Indian bands, or to individuals, partnerships or corporations, the activities of which contribute or may contribute to such development.
The total amount authorized to be outstanding at any time is $48,550,835, as last amended by Indian Affairs and Northern Development Vote 7b, Appropriation Act No. 4, 1996-97.
All outstanding loans bear interest at rates from 7 per cent to 11.25 per cent per annum.
Indian Economic Development Guarantee Loans Program
The Indian Economic Development Guarantee authority, established under Vote L53b, Appropriation Act No. 1, 1970, amended under P.C. 1977-3608, authorized the department to guarantee loans for Indian businesses on a risk-sharing basis with commercial lenders. The guarantee level is not to exceed at any time $60,000,000, less the total amount of payments made to implement previous guarantees under that authority.
Simple interest, usually based on a percentage plus the prime rate, will accrue on the debt after payout. All payments, including accrued interest, remain as a debt of the client until recovered in full.
Inuit Loan Fund
Loans have been made to individual Inuit or groups of Inuit to promote commercial activities and gainful occupations. Loans have also been made to co-operative associations, credit unions, caisses populaires or other credit societies incorporated under provincial laws, where the majority of members are Inuit, or to corporations incorporated under the laws of Canada, or provincial laws, where the controlling interest is held by Inuit.
The total amount authorized to be outstanding at any time is $6,633,697, as last amended by Indian Affairs and Northern Development Vote 37b, Appropriation Act No. 4, 1995-96.
The remaining loan bears interest at a rate of 5.50 per cent per annum.
Native claimants
Loans have been made to native claimants to defray the costs related to the research, development and negotiation of claims.
During the year, loans were authorized by Indian Affairs and Northern Development Vote L15, Appropriation Act No. 2, 2015-2016.
The terms and conditions of the loans are as follows:
(a) loans made before an agreement-in-principle for the settlement of a claim is reached are non-interest bearing;
(b) loans made after the date on which an agreement-in-principle for the settlement of a claim has been reached, bear interest at a rate equal to the rate established by the Minister of Finance in respect of borrowings for equivalent terms by Crown corporations; and
(c) loans are due and payable as to principal and interest on the date on which the claim is settled, or on a date fixed in the agreement.
The interest bearing and the non-interest bearing portions of the loans outstanding at year end are $58,223,312 and $397,404,857 respectively. Rates are from 0.69 per cent to 11.89 per cent per annum for the interest-bearing portion.
On Reserve Housing Guarantee Loans Program
On Reserve Housing guarantees provide needed support to Indian or Indian bands residing on reserves or Crown land. Reserves are, as such, non-mortgageable and the ministerial guarantee provides security to the lending institution in the event of a default by the client.
The total amount authorized to be outstanding at any time is $2.2 billion, as last amended by Indian Affairs and Northern Development Vote 7b, Appropriation Act No. 4, 2008-2009.
If a loan made under the Minister’s guarantee goes into default, the lender has recourse to the Minister for reimbursement. In 1987, a reserve for losses of $2 million per annum was established within the department’s reference levels to cover all Guarantee Loan Programs administered by Indian Affairs and Northern Development. Such payments remain a debt of the First Nation to the Crown and interest is accrued and capitalized on these debts at the contract interest rate applicable at the time the loan was assigned to the Minister. Recovery of the debt is made to the extent possible, from the security used as collateral, such as land claim funds, or through repayment agreements.
Public Accounts of Canada, 2015–2016
Loans, investments and advances 9 . 39
Stoney Band Perpetual Loan
In 1946, loans were made to Stoney Band of Alberta (Band) for land acquisition beyond their treaty entitlement.
A loan not exceeding $500,000 was made to purchase additional land. Under the terms of the agreement, as stated in Treasury Board Minutes, P.C. 2/1437 dated April 11, 1946, the Band assigned monies accruing to them, from the rental of their water resources, to provide interest payments at the rate of 3 per cent annually on the amount of the loan that had actually been expended. In the same agreement, the Band resolved that the Department allots $200,000 to the Pekisko Group, and $300,000 for the additions to Morley Reserve.
Manufacturing, processing and service industries in Canada
This account records loans made to persons engaged or about to engage or assist in manufacturing, processing or service industries in Canada in order to promote the establishment, improvement, growth, efficiency or international competitiveness of such industries or to assist them in their financial restructuring.
Loans are authorized by Industry Vote L20, Appropriation Act No. 2. During the year, no loans were issued.
There is one remaining loan which is interest free unless it goes into default, and otherwise is repayable at maturity on April 1, 2017.
Other business loans
This account records money owed to the Government by borrowers upon default of loans that are subject to statutory authorities, pursuant to the Small Business Loans Act, the Canada Small Business Financing Act, the capital leasing pilot project and the Department of Industry Act. These authorities provide for the payment of claims or the sharing of loan losses between lenders and the Government.
H.L. Holmes Fund
This account was established pursuant to paragraph 5(1)(f) of the National Research Council Act to record the residue of the estate of H.L. Holmes. Up to two thirds of the yearly net income from the fund shall be used to finance the H.L. Holmes Award on an annual basis. These awards will provide the opportunity to post-doctoral students to study at world famous graduate schools or research institutes under outstanding research persons.
Nordion International Inc.
A $100 million loan has been made to Nordion International Inc. for the construction of two nuclear reactors and related processing facilities to be used in the production of medical isotopes pursuant to an agreement reached on June 28, 1996 between MDS Health Group Ltd., Nordion International Inc. and Natural Resources Canada.
The secured loan was interest-free and fully repayable over 15 years commencing 42 months after the first loan drawdown was made. The final repayment was received on April 1, 2015.
During the year, the account was closed.
Seized Property Working Capital Account
This account was established by Section 12 of the Seized Property Management Act. Expenses incurred, and advances made, to maintain and manage any seized or restrained property and other properties subject to a management order or forfeited to Her Majesty, are charged to this account. This account is credited when expenses and advances to third parties are repaid or recovered and when revenues from these properties or proceeds of their disposal are received and credited with seized cash upon forfeiture.
The total amount authorized to be outstanding at any time is $50,000,000.
Any shortfall between the proceeds from the disposition of any property forfeited to Her Majesty and the amounts that were charged to this account and that are still outstanding, is charged to a Seized Property Proceeds Account and credited to this account.
Greater Victoria Harbour Authority
The Victoria Harbour loan receivable relates to the sale of a parcel of Victoria Harbour land. A discount of $356,131 is recorded to reflect the concessionary nature of the loan.
The loan bears interest at the rate of 4.9 per cent per annum, and is repayable over 15 years, with the final instalment on May 9, 2020.
Public Accounts of Canada, 2015–2016
9 . 40 Loans, investments and advances
St. Lawrence Seaway Management Corporation
This account was established by subsection 80(1) of the Canada Marine Act. Loans previously managed by the St. Lawrence Seaway Authority are now managed by the St. Lawrence Seaway Management Corporation in accordance with an agreement between the Department of Transport and the Corporation. The repayments of these loans are recorded in this account.
The loan bore interest at a rate of prime plus 2.0 per cent per annum. The final instalment of the existing terms was anticipated for March 2013. During the year 2014, a reclassification was done to transfer the accumulated interest to the capital portion.
As of March 31, 2016, the remaining amount of this loan is deemed unrecoverable and parliamentary authority is required to write-off the balance.
Federal Public Service Health Care Administration Authority
The Federal Public Service Health Care Plan Administration Authority (referred to as the Administration Authority) was incorporated, without share capital, under subsection 7.2(1) of the Financial Administration Act effective May 1, 2007. Effective May 31, 2007, the assets and liabilities of the Public Service Health Care Plan (PSHCP) were transferred to the Government of Canada and to the Administration Authority as directed by the President of the Treasury Board of Canada and consistent with the Trust Agreement, which terminated May 31, 2007.
The Administration Authority is charged with the administration of the PSHCP. Its objective is to ensure that benefits and services to Plan members and their covered dependents, as defined in the PSHCP documentation, are delivered in a manner that ensures the effective and efficient administration of the PSHCP. Payments are made to the Administration Authority under Vote 20 and are authorized under the terms of reference of the funding agreement between the President of the Treasury Board and the Administration Authority. The funding agreement allows for the transfer of funds from the Treasury Board of Canada Secretariat to the Administration Authority in four quarterly instalments upon approval of the operating budget by the Secretary of the Treasury Board of Canada. These quarterly instalments are made in advance and actual expenses are recorded upon approval of the Administration Authority’s Quarterly Financial Report.
Joint Learning Program
Advances have been made to the Public Service Alliance of Canada (PSAC) for the Joint Learning Program (JLP). Following the collective bargaining round of October 2004, 2008 and subsequently of 2010, a Memorandum of Understanding between the Treasury Board and PSAC was included in the collective bargaining agreements to provide funding for a JLP. The JLP is a negotiated partnership between PSAC and the Treasury Board of Canada Secretariat (TBS).The objective of the JLP is to improve labour relations in the public service. It is intended to provide joint union-management learning opportunities in areas where both parties have roles and responsibilities, and for which the employer does not already have a legal obligation to provide training.
Payments are made to PSAC under Vote 20 and are authorized under the terms of reference of the Program. The terms of reference include the program costs, funding conditions, payment conditions, timelines, as well as a schedule of payments. The schedule of payments provides for a 3-month advance from TBS to PSAC to provide for program delivery costs. When actual expenses are reported every three months, the advance is reversed and the expenditure is recorded.
Commonwealth War Graves Commission
Advances have been made to the working capital fund of the Commonwealth War Graves Commission, to maintain graves and cemeteries.
At year end, the balance of the advances was 30,000 GBP. This balance was converted to Canadian dollars, using the year-end rate of exchange. The advances are non-interest bearing and have no fixed terms of repayments.
Veterans’ Land Fund
Advances
Advances have been made, under Parts I and III of the Veterans’ Land Act, for the acquisition of land, permanent improvements, removal of encumbrances, purchase of stock and equipment, and protection of security. The total amount authorized to be outstanding at any time is $605,000,000.
Allowance for conditional benefits
A provision equal to 1/10 of the benefits to veterans was established each year up to and including 1978–1979. Since that time, a forecast of requirements has been performed each year, and provisions are established as necessary. These provisions are charged to expenses and credited to the allowance for conditional benefits account. This account represents the accumulated net provisions for benefits to veterans in the form of forgiveness of loans authorized by the Veterans’ Land Act. These benefits come into effect only after certain conditions are fulfilled by the veterans. At the end of 10 years, the conditions having been met, the accumulated provision is charged to the allowance for conditional benefits account, and credited to the veteran’s loan account.

Public Accounts of Canada, 2015–2016
Loans, investments and advances 9 . 41
Other departments—Transition payments—Pay in arrears
During the 2014-2015 fiscal year, a one-time payment was issued to employees as a result of the implementation of pay in arrears. This amount will be recovered from the employees upon their departure from the public service. The amount at year-end represents the balance to be recovered in the future.
Other departments—Miscellaneous
This account represents amounts outstanding in the hands of agencies and individuals, at year end. This group records loans, investments and advances not classified elsewhere.
Consolidation adjustment
The consolidation adjustment reflects the total loans, investments and advances held by consolidated Crown corporations and other entities. These mainly include investments such as bonds, money market funds and fixed income securities.
Allowance for Valuation
In accordance with the comprehensive policy on valuation, assets are subject to an annual valuation to reflect reductions from the recorded value to the estimated net recoverable value.
The allowance for valuation, for loans, investments and advances, represents the estimated losses on the realization of the loans, investments and advances included in the accounts of Canada at year end.

This page has been intentionally left blank.

Section 10
2015–2016
Public Accounts of Canada
Non-financial assets Table of contents Page
Non-financial assets ......................................................................... 10.2 Tangible capital assets ..................................................................... 10.4 Vehicles ........................................................................................... 10.6 Assets under capital leases .............................................................. 10.6

Public Accounts of Canada, 2015–2016
10 . 2 Non-financial assets
Non-financial assets
Non-financial assets are assets that have an economic life that extends beyond the accounting period and that are intended for consumption in the normal course of operations. They are converted into expense in future periods and include tangible capital assets, inventories, and prepaid expenses.
Tangible capital assets consist of acquired, built, developed or improved tangible assets, which are intended to be used on a continuous basis and are not intended for sale in the ordinary course of business. For financial reporting purposes, tangible capital assets are grouped in the following categories: land, buildings, works and infrastructure, machinery and equipment, vehicles, leasehold improvements, assets under construction, and assets under capital leases.
Inventories are items of tangible property that are to be used in the delivery of program outputs. Some revolving funds and a few departments may have inventories held for resale to parties outside the Government.
Prepaid expenses and other are disbursements made, pursuant to a contract, before the completion of the work, delivery of the goods or rendering of the service.
Table 10.1 presents the non-financial assets by category.
Table 10.1 Non-financial assets by category (in thousands of dollars)
March 31, 2016 March 31, 2015
Net tangible capital assets, Table 10.2
Land .......................................................................................................................................................................... 1,665,250 1,604,805 Buildings ................................................................................................................................................................... 14,948,686 14,414,181 Works and infrastructure .......................................................................................................................................... 6,433,048 6,273,001 Machinery and equipment ........................................................................................................................................ 9,851,603 9,313,628 Vehicles, Table 10.3 ................................................................................................................................................. 16,367,357 14,234,608 Leasehold improvements .......................................................................................................................................... 1,170,515 1,205,890 Assets under construction ......................................................................................................................................... 12,574,468 13,358,804 Assets under capital leases, Table 10.4 .................................................................................................................... 2,826,935 2,942,291
65,837,862 63,347,208 Inventories ...................................................................................................................................................................... 7,221,554 7,250,094 Prepaid expenses and other............................................................................................................................................. 4,705,789 4,031,737
Total ................................................................................................................................................................................ 77,765,205 74,629,039

Public Accounts of Canada, 2015–2016
Non-financial assets 10 . 3
Chart 10A Non-financial assets by category at March 31, 2016
Chart 10B Non-financial assets at March 31, 2016 (in millions of dollars)
Land2.1% Buildings
19.2%
Works and infrastructure
8.3%
Machinery and equipment
12.7%
Vehicles21.0%
Leasehold improvements
1.5%
Assets under construction
16.2%
Assets under capital leases
3.6%
Inventories9.3%
Prepaid expenses and other
6.1%
50,000
55,000
60,000
65,000
70,000
75,000
80,000
2007 2008 2009 2010 2011 2012 2013 2014 2015 2016

Public Accounts of Canada, 2015–2016
10 . 4 Non-financial assets
Tangible capital assets
Table 10.2 presents tangible capital assets by main custodian ministries.
Table 10.2 Tangible capital assets by main custodian ministries (in thousands of dollars)
Works and Machinery and Land Buildings infrastructure equipment
Capital assets at cost
Environment and Climate Change ............................... 207,174 1,078,504 3,140,624 892,147 Fisheries, Oceans and the Canadian Coast Guard ....... 22,217 730,337 2,493,802 489,400 Global Affairs .............................................................. 257,710 1,603,224 8,238 179,905 Innovation, Science and Economic development ........ 11,338 955,265 49,323 2,492,729 National Defence ......................................................... 87,358 10,905,537 2,586,001 20,871,653 Public Safety and Emergency Preparedness ................ 84,786 4,654,612 773,508 1,916,458 Public Services and Procurement ................................ 243,002 5,394,606 1,321,374 1,997,598 Transport ...................................................................... 276,119 829,962 2,706,583 230,977 Other ministries ............................................................ 62,692 1,626,853 93,503 3,499,178
1,252,396 27,778,900 13,172,956 32,570,045 Consolidated Crown corporations and other entities ........ 412,854 2,799,259 1,898,647 3,015,376
Gross total capital assets .................................................... 1,665,250 30,578,159 15,071,603 35,585,421
Accumulated amortization
Environment and Climate Change ............................... – 737,502 1,885,774 615,374 Fisheries, Oceans and the Canadian Coast Guard ....... – 475,909 1,355,773 347,844 Global Affairs .............................................................. – 905,018 761 110,978 Innovation, Science and Economic development ........ – 643,736 30,943 1,902,003 National Defence ......................................................... – 4,256,777 1,451,812 15,282,406 Public Safety and Emergency Preparedness ................ – 2,029,078 468,453 1,342,359 Public Services and Procurement ................................ – 3,529,550 576,361 1,439,054 Transport ...................................................................... – 579,037 1,993,634 166,591 Other ministries ............................................................ – 1,214,809 44,034 2,361,408
– 14,371,416 7,807,545 23,568,017 Consolidated Crown corporations and other entities ........ – 1,258,057 831,010 2,165,801
Total accumulated amortization ........................................ – 15,629,473 8,638,555 25,733,818
Total net capital assets
Environment and Climate Change ............................... 207,174 341,002 1,254,850 276,773 Fisheries, Oceans and the Canadian Coast Guard ....... 22,217 254,428 1,138,029 141,556 Global Affairs .............................................................. 257,710 698,206 7,477 68,927 Innovation, Science and Economic development ........ 11,338 311,529 18,380 590,726 National Defence ......................................................... 87,358 6,648,760 1,134,189 5,589,247 Public Safety and Emergency Preparedness ................ 84,786 2,625,534 305,055 574,099 Public Services and Procurement ................................ 243,002 1,865,056 745,013 558,544 Transport ...................................................................... 276,119 250,925 712,949 64,386 Other ministries ............................................................ 62,692 412,044 49,469 1,137,770
1,252,396 13,407,484 5,365,411 9,002,028 Consolidated Crown corporations and other entities ........ 412,854 1,541,202 1,067,637 849,575
Total net capital assets ....................................................... 1,665,250 14,948,686 6,433,048 9,851,603
Certain comparative figures have been reclassified to conform to the current year’s presentation. 1 Details can be found in Table 10.3. 2 Details can be found in Table 10.4.
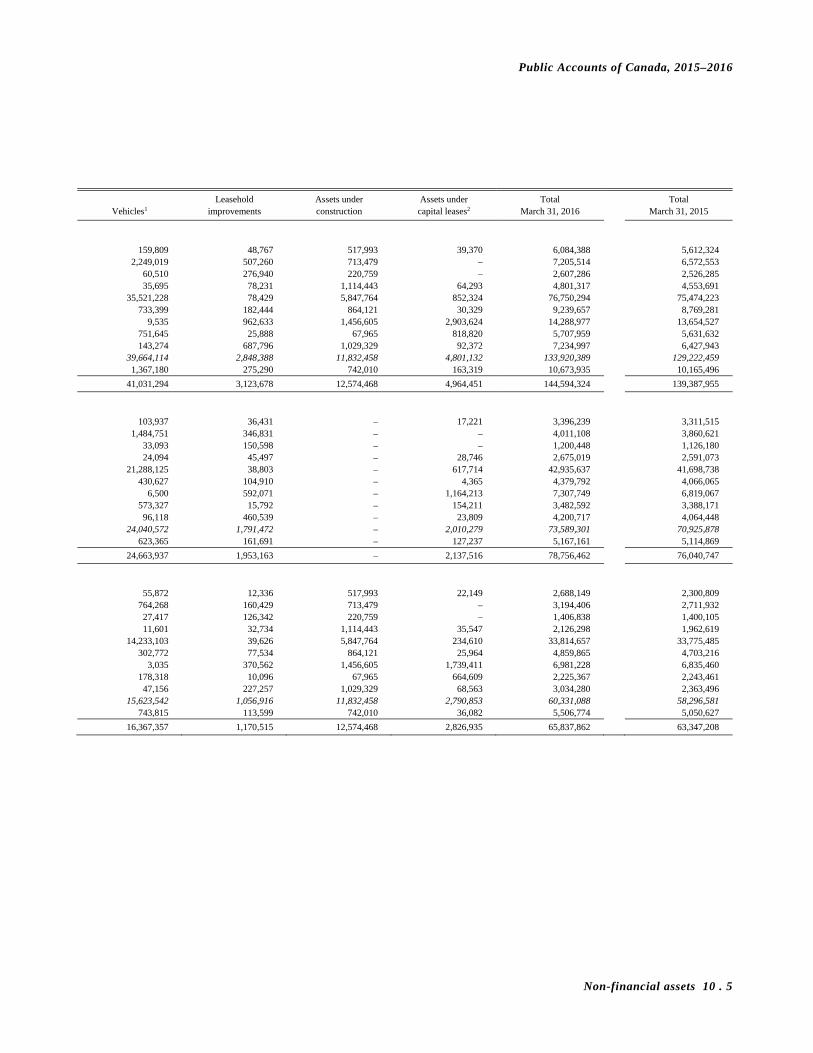
Public Accounts of Canada, 2015–2016
Non-financial assets 10 . 5
Leasehold Assets under Assets under Total Total Vehicles1 improvements construction capital leases2 March 31, 2016 March 31, 2015
159,809 48,767 517,993 39,370 6,084,388 5,612,324 2,249,019 507,260 713,479 – 7,205,514 6,572,553
60,510 276,940 220,759 – 2,607,286 2,526,285 35,695 78,231 1,114,443 64,293 4,801,317 4,553,691
35,521,228 78,429 5,847,764 852,324 76,750,294 75,474,223 733,399 182,444 864,121 30,329 9,239,657 8,769,281
9,535 962,633 1,456,605 2,903,624 14,288,977 13,654,527 751,645 25,888 67,965 818,820 5,707,959 5,631,632 143,274 687,796 1,029,329 92,372 7,234,997 6,427,943
39,664,114 2,848,388 11,832,458 4,801,132 133,920,389 129,222,459 1,367,180 275,290 742,010 163,319 10,673,935 10,165,496
41,031,294 3,123,678 12,574,468 4,964,451 144,594,324 139,387,955
103,937 36,431 – 17,221 3,396,239 3,311,515 1,484,751 346,831 – – 4,011,108 3,860,621
33,093 150,598 – – 1,200,448 1,126,180 24,094 45,497 – 28,746 2,675,019 2,591,073
21,288,125 38,803 – 617,714 42,935,637 41,698,738 430,627 104,910 – 4,365 4,379,792 4,066,065
6,500 592,071 – 1,164,213 7,307,749 6,819,067 573,327 15,792 – 154,211 3,482,592 3,388,171 96,118 460,539 – 23,809 4,200,717 4,064,448
24,040,572 1,791,472 – 2,010,279 73,589,301 70,925,878 623,365 161,691 – 127,237 5,167,161 5,114,869
24,663,937 1,953,163 – 2,137,516 78,756,462 76,040,747
55,872 12,336 517,993 22,149 2,688,149 2,300,809 764,268 160,429 713,479 – 3,194,406 2,711,932 27,417 126,342 220,759 – 1,406,838 1,400,105 11,601 32,734 1,114,443 35,547 2,126,298 1,962,619
14,233,103 39,626 5,847,764 234,610 33,814,657 33,775,485 302,772 77,534 864,121 25,964 4,859,865 4,703,216
3,035 370,562 1,456,605 1,739,411 6,981,228 6,835,460 178,318 10,096 67,965 664,609 2,225,367 2,243,461 47,156 227,257 1,029,329 68,563 3,034,280 2,363,496
15,623,542 1,056,916 11,832,458 2,790,853 60,331,088 58,296,581 743,815 113,599 742,010 36,082 5,506,774 5,050,627
16,367,357 1,170,515 12,574,468 2,826,935 65,837,862 63,347,208
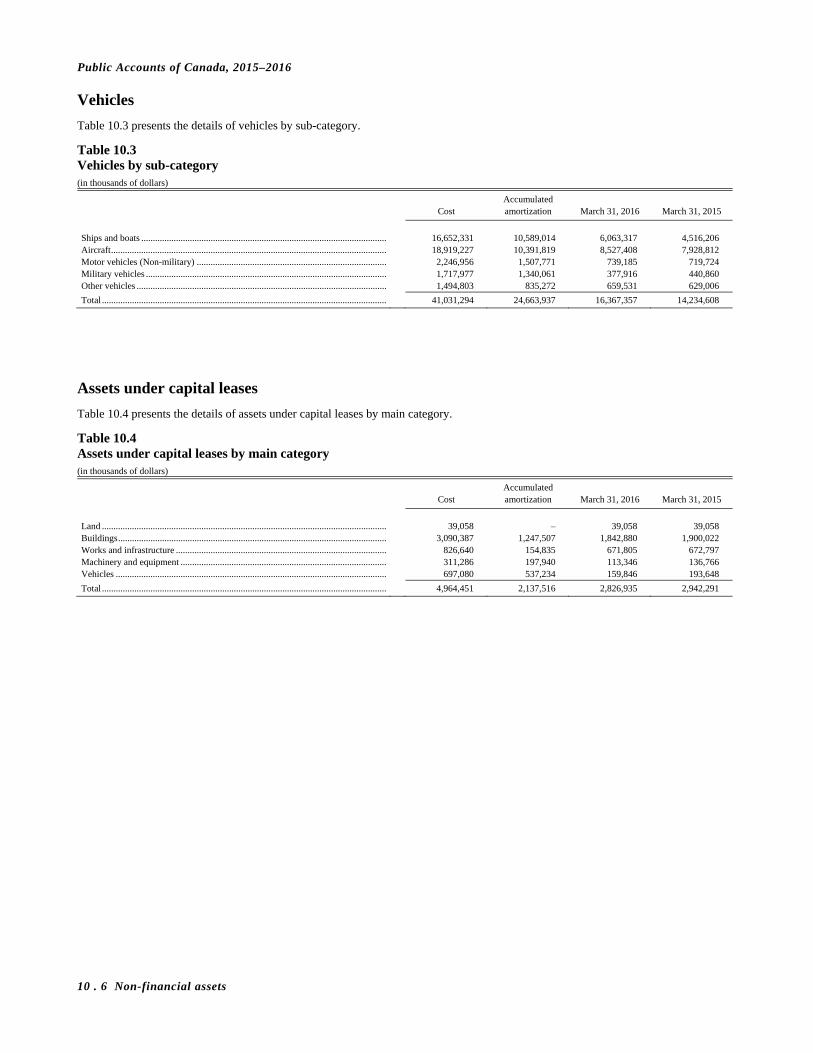
Public Accounts of Canada, 2015–2016
10 . 6 Non-financial assets
Vehicles
Table 10.3 presents the details of vehicles by sub-category.
Table 10.3 Vehicles by sub-category (in thousands of dollars)
Accumulated Cost amortization March 31, 2016 March 31, 2015
Ships and boats .......................................................................................................... 16,652,331 10,589,014 6,063,317 4,516,206 Aircraft ....................................................................................................................... 18,919,227 10,391,819 8,527,408 7,928,812 Motor vehicles (Non-military) .................................................................................. 2,246,956 1,507,771 739,185 719,724 Military vehicles ........................................................................................................ 1,717,977 1,340,061 377,916 440,860 Other vehicles ............................................................................................................ 1,494,803 835,272 659,531 629,006
Total ........................................................................................................................... 41,031,294 24,663,937 16,367,357 14,234,608
Assets under capital leases
Table 10.4 presents the details of assets under capital leases by main category.
Table 10.4 Assets under capital leases by main category (in thousands of dollars)
Accumulated Cost amortization March 31, 2016 March 31, 2015
Land ........................................................................................................................... 39,058 – 39,058 39,058 Buildings .................................................................................................................... 3,090,387 1,247,507 1,842,880 1,900,022 Works and infrastructure ........................................................................................... 826,640 154,835 671,805 672,797 Machinery and equipment ......................................................................................... 311,286 197,940 113,346 136,766 Vehicles ..................................................................................................................... 697,080 537,234 159,846 193,648
Total ........................................................................................................................... 4,964,451 2,137,516 2,826,935 2,942,291
Section 11
2015–2016
Public Accounts of Canada
Contractual obligations and contingent liabilities Table of contents Page
Contractual obligations .................................................................... 11.2 Contingent liabilities ....................................................................... 11.37
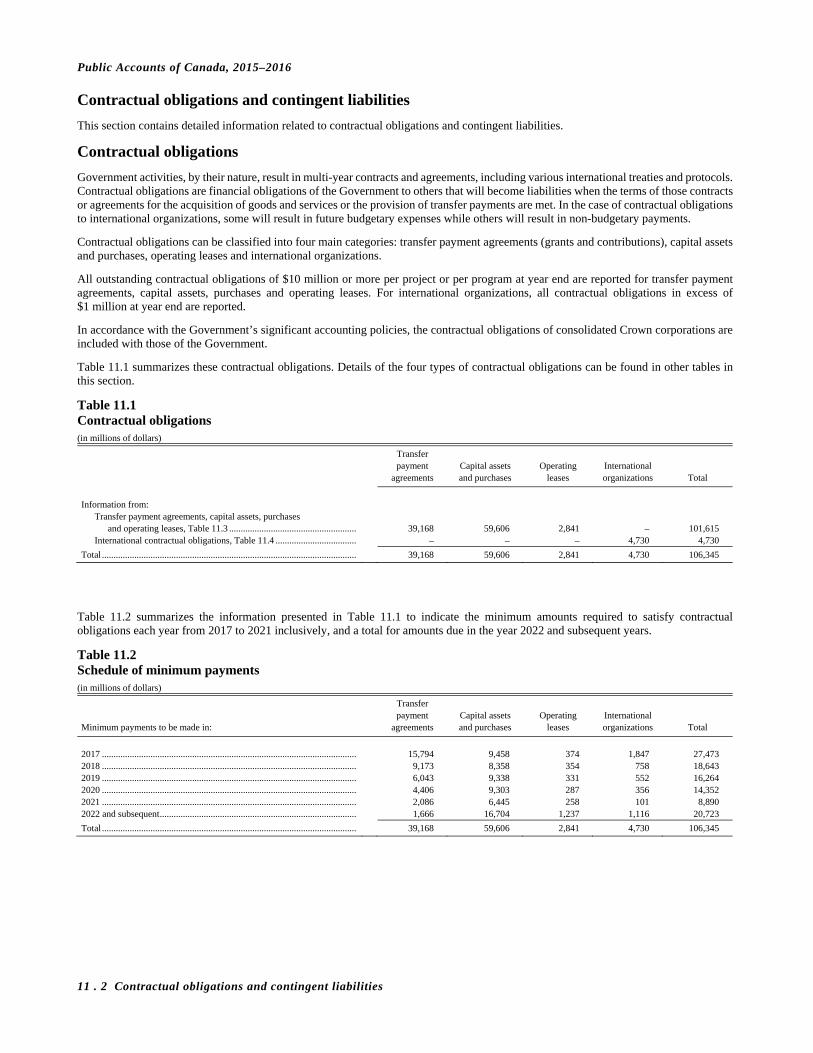
Public Accounts of Canada, 2015–2016
11 . 2 Contractual obligations and contingent liabilities
Contractual obligations and contingent liabilities
This section contains detailed information related to contractual obligations and contingent liabilities.
Contractual obligations
Government activities, by their nature, result in multi-year contracts and agreements, including various international treaties and protocols. Contractual obligations are financial obligations of the Government to others that will become liabilities when the terms of those contracts or agreements for the acquisition of goods and services or the provision of transfer payments are met. In the case of contractual obligations to international organizations, some will result in future budgetary expenses while others will result in non-budgetary payments.
Contractual obligations can be classified into four main categories: transfer payment agreements (grants and contributions), capital assets and purchases, operating leases and international organizations.
All outstanding contractual obligations of $10 million or more per project or per program at year end are reported for transfer payment agreements, capital assets, purchases and operating leases. For international organizations, all contractual obligations in excess of $1 million at year end are reported.
In accordance with the Government’s significant accounting policies, the contractual obligations of consolidated Crown corporations are included with those of the Government.
Table 11.1 summarizes these contractual obligations. Details of the four types of contractual obligations can be found in other tables in this section.
Table 11.1 Contractual obligations (in millions of dollars)
Transfer payment Capital assets Operating International agreements and purchases leases organizations Total
Information from:
Transfer payment agreements, capital assets, purchases and operating leases, Table 11.3 ....................................................... 39,168 59,606 2,841 – 101,615
International contractual obligations, Table 11.4 ................................... – – – 4,730 4,730
Total .............................................................................................................. 39,168 59,606 2,841 4,730 106,345
Table 11.2 summarizes the information presented in Table 11.1 to indicate the minimum amounts required to satisfy contractual obligations each year from 2017 to 2021 inclusively, and a total for amounts due in the year 2022 and subsequent years.
Table 11.2 Schedule of minimum payments (in millions of dollars)
Transfer payment Capital assets Operating International Minimum payments to be made in: agreements and purchases leases organizations Total
2017 .............................................................................................................. 15,794 9,458 374 1,847 27,473 2018 .............................................................................................................. 9,173 8,358 354 758 18,643 2019 .............................................................................................................. 6,043 9,338 331 552 16,264 2020 .............................................................................................................. 4,406 9,303 287 356 14,352 2021 .............................................................................................................. 2,086 6,445 258 101 8,890 2022 and subsequent ..................................................................................... 1,666 16,704 1,237 1,116 20,723
Total .............................................................................................................. 39,168 59,606 2,841 4,730 106,345
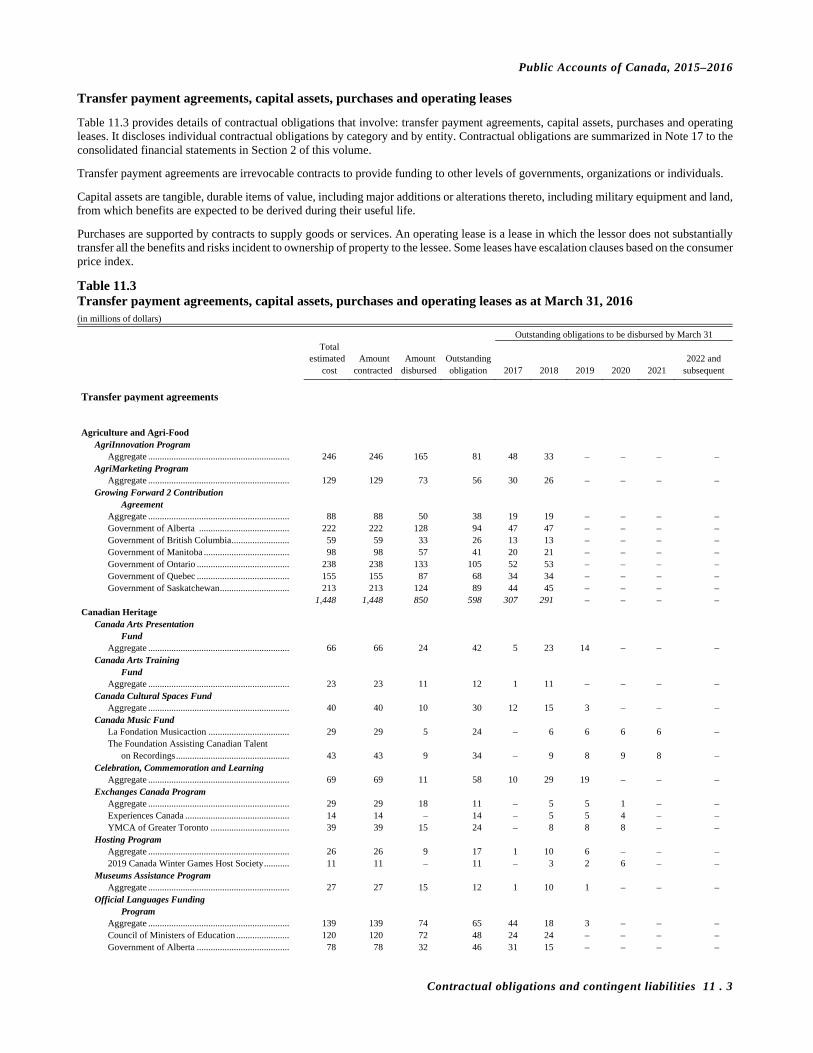
Public Accounts of Canada, 2015–2016
Contractual obligations and contingent liabilities 11 . 3
Transfer payment agreements, capital assets, purchases and operating leases
Table 11.3 provides details of contractual obligations that involve: transfer payment agreements, capital assets, purchases and operating leases. It discloses individual contractual obligations by category and by entity. Contractual obligations are summarized in Note 17 to the consolidated financial statements in Section 2 of this volume.
Transfer payment agreements are irrevocable contracts to provide funding to other levels of governments, organizations or individuals.
Capital assets are tangible, durable items of value, including major additions or alterations thereto, including military equipment and land, from which benefits are expected to be derived during their useful life.
Purchases are supported by contracts to supply goods or services. An operating lease is a lease in which the lessor does not substantially transfer all the benefits and risks incident to ownership of property to the lessee. Some leases have escalation clauses based on the consumer price index.
Table 11.3 Transfer payment agreements, capital assets, purchases and operating leases as at March 31, 2016 (in millions of dollars)
Outstanding obligations to be disbursed by March 31 Total estimated Amount Amount Outstanding 2022 and cost contracted disbursed obligation 2017 2018 2019 2020 2021 subsequent
Transfer payment agreements Agriculture and Agri-Food
AgriInnovation Program Aggregate ............................................................. 246 246 165 81 48 33 – – – –
AgriMarketing Program Aggregate ............................................................. 129 129 73 56 30 26 – – – –
Growing Forward 2 Contribution Agreement
Aggregate ............................................................. 88 88 50 38 19 19 – – – – Government of Alberta ....................................... 222 222 128 94 47 47 – – – – Government of British Columbia ......................... 59 59 33 26 13 13 – – – – Government of Manitoba ..................................... 98 98 57 41 20 21 – – – – Government of Ontario ........................................ 238 238 133 105 52 53 – – – – Government of Quebec ........................................ 155 155 87 68 34 34 – – – – Government of Saskatchewan .............................. 213 213 124 89 44 45 – – – –
1,448 1,448 850 598 307 291 – – – – Canadian Heritage
Canada Arts Presentation Fund
Aggregate ............................................................. 66 66 24 42 5 23 14 – – – Canada Arts Training
Fund Aggregate ............................................................. 23 23 11 12 1 11 – – – –
Canada Cultural Spaces Fund Aggregate ............................................................. 40 40 10 30 12 15 3 – – –
Canada Music Fund La Fondation Musicaction ................................... 29 29 5 24 – 6 6 6 6 – The Foundation Assisting Canadian Talent
on Recordings ................................................. 43 43 9 34 – 9 8 9 8 – Celebration, Commemoration and Learning
Aggregate ............................................................. 69 69 11 58 10 29 19 – – – Exchanges Canada Program
Aggregate ............................................................. 29 29 18 11 – 5 5 1 – – Experiences Canada ............................................. 14 14 – 14 – 5 5 4 – – YMCA of Greater Toronto .................................. 39 39 15 24 – 8 8 8 – –
Hosting Program Aggregate ............................................................. 26 26 9 17 1 10 6 – – – 2019 Canada Winter Games Host Society ........... 11 11 – 11 – 3 2 6 – –
Museums Assistance Program Aggregate ............................................................. 27 27 15 12 1 10 1 – – –
Official Languages Funding Program
Aggregate ............................................................. 139 139 74 65 44 18 3 – – – Council of Ministers of Education ....................... 120 120 72 48 24 24 – – – – Government of Alberta ........................................ 78 78 32 46 31 15 – – – –
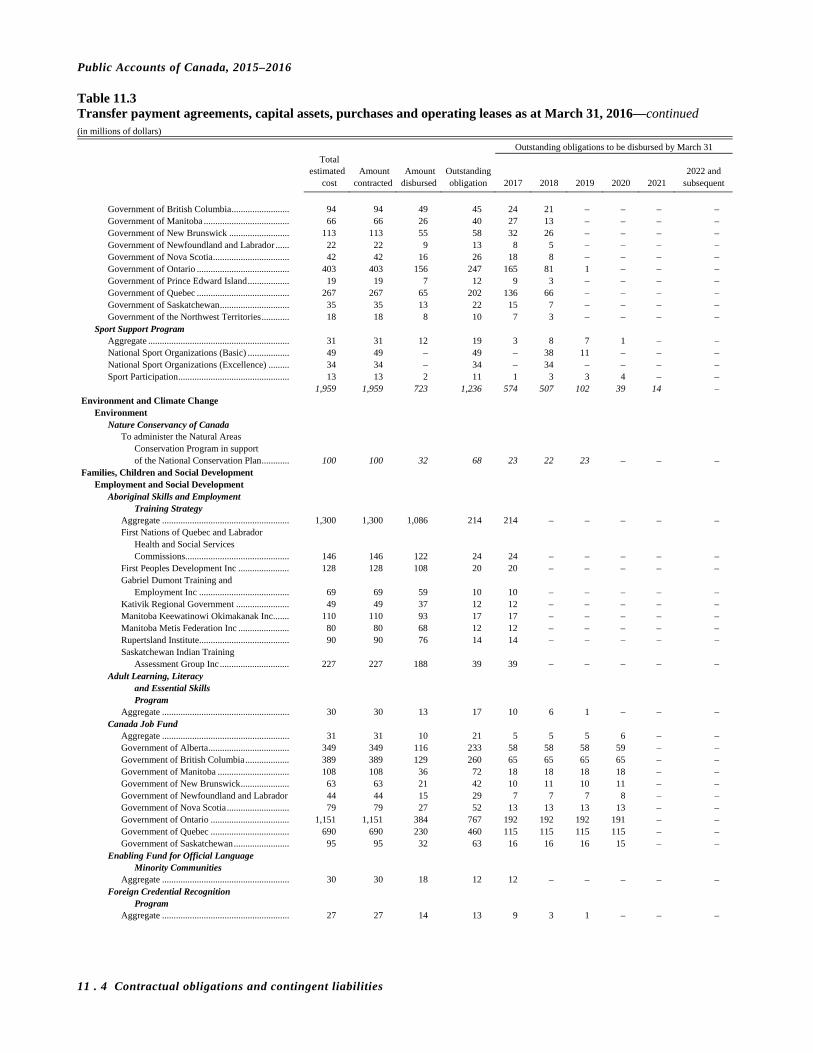
Public Accounts of Canada, 2015–2016
11 . 4 Contractual obligations and contingent liabilities
Table 11.3 Transfer payment agreements, capital assets, purchases and operating leases as at March 31, 2016—continued (in millions of dollars)
Outstanding obligations to be disbursed by March 31 Total estimated Amount Amount Outstanding 2022 and cost contracted disbursed obligation 2017 2018 2019 2020 2021 subsequent
Government of British Columbia ......................... 94 94 49 45 24 21 – – – – Government of Manitoba ..................................... 66 66 26 40 27 13 – – – – Government of New Brunswick .......................... 113 113 55 58 32 26 – – – – Government of Newfoundland and Labrador ...... 22 22 9 13 8 5 – – – – Government of Nova Scotia ................................. 42 42 16 26 18 8 – – – – Government of Ontario ........................................ 403 403 156 247 165 81 1 – – – Government of Prince Edward Island .................. 19 19 7 12 9 3 – – – – Government of Quebec ........................................ 267 267 65 202 136 66 – – – – Government of Saskatchewan .............................. 35 35 13 22 15 7 – – – – Government of the Northwest Territories ............ 18 18 8 10 7 3 – – – –
Sport Support Program Aggregate ............................................................. 31 31 12 19 3 8 7 1 – – National Sport Organizations (Basic) .................. 49 49 – 49 – 38 11 – – – National Sport Organizations (Excellence) ......... 34 34 – 34 – 34 – – – – Sport Participation ................................................ 13 13 2 11 1 3 3 4 – –
1,959 1,959 723 1,236 574 507 102 39 14 – Environment and Climate Change
Environment Nature Conservancy of Canada
To administer the Natural Areas Conservation Program in support of the National Conservation Plan ............ 100 100 32 68 23 22 23 – – –
Families, Children and Social Development Employment and Social Development
Aboriginal Skills and Employment Training Strategy
Aggregate ....................................................... 1,300 1,300 1,086 214 214 – – – – – First Nations of Quebec and Labrador
Health and Social Services Commissions............................................. 146 146 122 24 24 – – – – –
First Peoples Development Inc ...................... 128 128 108 20 20 – – – – – Gabriel Dumont Training and
Employment Inc ....................................... 69 69 59 10 10 – – – – – Kativik Regional Government ....................... 49 49 37 12 12 – – – – – Manitoba Keewatinowi Okimakanak Inc ....... 110 110 93 17 17 – – – – – Manitoba Metis Federation Inc ...................... 80 80 68 12 12 – – – – – Rupertsland Institute ....................................... 90 90 76 14 14 – – – – – Saskatchewan Indian Training
Assessment Group Inc .............................. 227 227 188 39 39 – – – – – Adult Learning, Literacy
and Essential Skills Program
Aggregate ....................................................... 30 30 13 17 10 6 1 – – – Canada Job Fund
Aggregate ....................................................... 31 31 10 21 5 5 5 6 – – Government of Alberta ................................... 349 349 116 233 58 58 58 59 – – Government of British Columbia ................... 389 389 129 260 65 65 65 65 – – Government of Manitoba ............................... 108 108 36 72 18 18 18 18 – – Government of New Brunswick ..................... 63 63 21 42 10 11 10 11 – – Government of Newfoundland and Labrador 44 44 15 29 7 7 7 8 – – Government of Nova Scotia ........................... 79 79 27 52 13 13 13 13 – – Government of Ontario .................................. 1,151 1,151 384 767 192 192 192 191 – – Government of Quebec .................................. 690 690 230 460 115 115 115 115 – – Government of Saskatchewan ........................ 95 95 32 63 16 16 16 15 – –
Enabling Fund for Official Language Minority Communities
Aggregate ....................................................... 30 30 18 12 12 – – – – – Foreign Credential Recognition
Program Aggregate ....................................................... 27 27 14 13 9 3 1 – – –
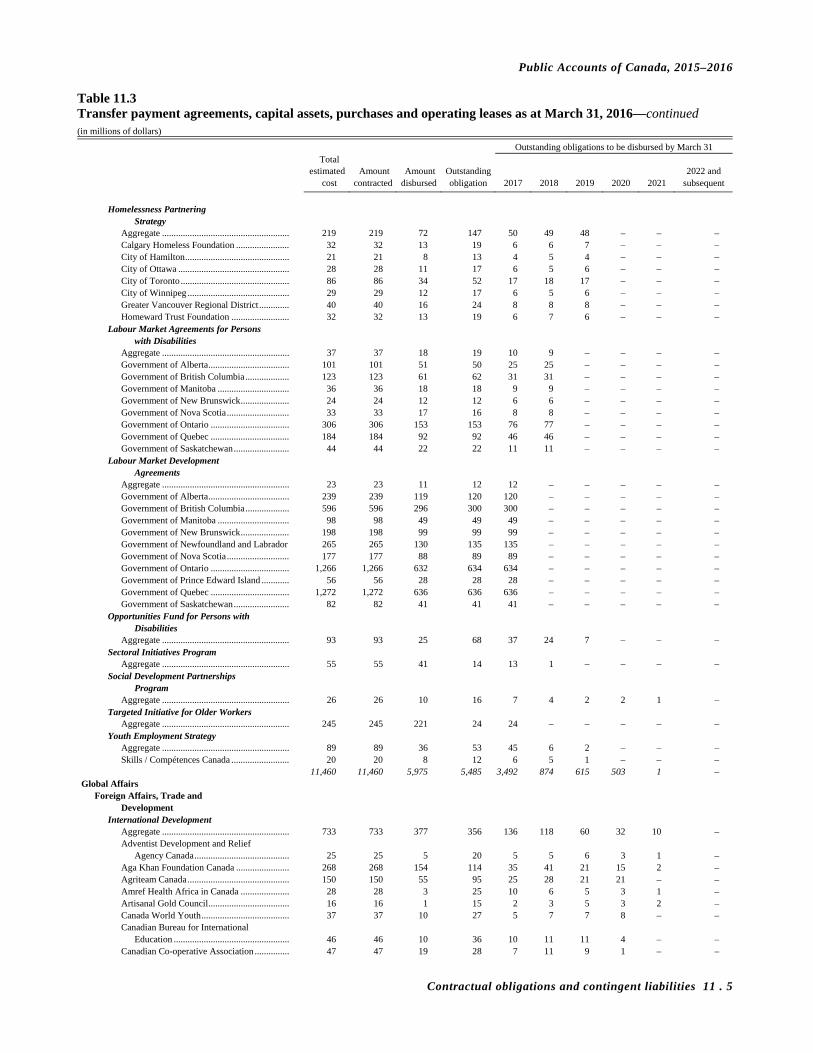
Public Accounts of Canada, 2015–2016
Contractual obligations and contingent liabilities 11 . 5
Table 11.3 Transfer payment agreements, capital assets, purchases and operating leases as at March 31, 2016—continued (in millions of dollars)
Outstanding obligations to be disbursed by March 31 Total estimated Amount Amount Outstanding 2022 and cost contracted disbursed obligation 2017 2018 2019 2020 2021 subsequent
Homelessness Partnering
Strategy Aggregate ....................................................... 219 219 72 147 50 49 48 – – – Calgary Homeless Foundation ....................... 32 32 13 19 6 6 7 – – – City of Hamilton ............................................. 21 21 8 13 4 5 4 – – – City of Ottawa ................................................ 28 28 11 17 6 5 6 – – – City of Toronto ............................................... 86 86 34 52 17 18 17 – – – City of Winnipeg ............................................ 29 29 12 17 6 5 6 – – – Greater Vancouver Regional District ............. 40 40 16 24 8 8 8 – – – Homeward Trust Foundation ......................... 32 32 13 19 6 7 6 – – –
Labour Market Agreements for Persons with Disabilities
Aggregate ....................................................... 37 37 18 19 10 9 – – – – Government of Alberta ................................... 101 101 51 50 25 25 – – – – Government of British Columbia ................... 123 123 61 62 31 31 – – – – Government of Manitoba ............................... 36 36 18 18 9 9 – – – – Government of New Brunswick ..................... 24 24 12 12 6 6 – – – – Government of Nova Scotia ........................... 33 33 17 16 8 8 – – – – Government of Ontario .................................. 306 306 153 153 76 77 – – – – Government of Quebec .................................. 184 184 92 92 46 46 – – – – Government of Saskatchewan ........................ 44 44 22 22 11 11 – – – –
Labour Market Development Agreements
Aggregate ....................................................... 23 23 11 12 12 – – – – – Government of Alberta ................................... 239 239 119 120 120 – – – – – Government of British Columbia ................... 596 596 296 300 300 – – – – – Government of Manitoba ............................... 98 98 49 49 49 – – – – – Government of New Brunswick ..................... 198 198 99 99 99 – – – – – Government of Newfoundland and Labrador 265 265 130 135 135 – – – – – Government of Nova Scotia ........................... 177 177 88 89 89 – – – – – Government of Ontario .................................. 1,266 1,266 632 634 634 – – – – – Government of Prince Edward Island ............ 56 56 28 28 28 – – – – – Government of Quebec .................................. 1,272 1,272 636 636 636 – – – – – Government of Saskatchewan ........................ 82 82 41 41 41 – – – – –
Opportunities Fund for Persons with Disabilities
Aggregate ....................................................... 93 93 25 68 37 24 7 – – – Sectoral Initiatives Program
Aggregate ....................................................... 55 55 41 14 13 1 – – – – Social Development Partnerships
Program Aggregate ....................................................... 26 26 10 16 7 4 2 2 1 –
Targeted Initiative for Older Workers Aggregate ....................................................... 245 245 221 24 24 – – – – –
Youth Employment Strategy Aggregate ....................................................... 89 89 36 53 45 6 2 – – – Skills / Compétences Canada ......................... 20 20 8 12 6 5 1 – – –
11,460 11,460 5,975 5,485 3,492 874 615 503 1 – Global Affairs
Foreign Affairs, Trade and Development
International Development Aggregate ....................................................... 733 733 377 356 136 118 60 32 10 – Adventist Development and Relief
Agency Canada ......................................... 25 25 5 20 5 5 6 3 1 – Aga Khan Foundation Canada ....................... 268 268 154 114 35 41 21 15 2 – Agriteam Canada ............................................ 150 150 55 95 25 28 21 21 – – Amref Health Africa in Canada ..................... 28 28 3 25 10 6 5 3 1 – Artisanal Gold Council ................................... 16 16 1 15 2 3 5 3 2 – Canada World Youth ...................................... 37 37 10 27 5 7 7 8 – – Canadian Bureau for International
Education .................................................. 46 46 10 36 10 11 11 4 – – Canadian Co-operative Association ............... 47 47 19 28 7 11 9 1 – –

Public Accounts of Canada, 2015–2016
11 . 6 Contractual obligations and contingent liabilities
Table 11.3 Transfer payment agreements, capital assets, purchases and operating leases as at March 31, 2016—continued (in millions of dollars)
Outstanding obligations to be disbursed by March 31 Total estimated Amount Amount Outstanding 2022 and cost contracted disbursed obligation 2017 2018 2019 2020 2021 subsequent
Canadian Cooperation Society for
International Development ....................... 85 85 45 40 15 14 10 1 – – Canadian Executive Service
Organization ............................................. 39 39 5 34 8 7 9 7 3 – Canadian Network for Maternal Newborn
and Child Health ....................................... 14 14 – 14 2 3 3 3 2 1 Canadian Organization for Development
Through Education ................................... 24 24 8 16 4 2 3 3 2 2 Canadian Red Cross ....................................... 41 41 7 34 10 10 10 3 1 – CARE Canada ................................................ 89 89 37 52 15 16 12 8 1 – Center for International Cooperation in
Health and Development .......................... 34 34 17 17 4 7 6 – – – Colleges and Institutes Canada ...................... 99 99 40 59 22 14 12 10 1 – Consortium CECI / ENAP / Avocats
sans frontières ........................................... 20 20 5 15 1 5 9 – – – Consortium Cowater International Inc /
CRC Sogema Inc. / Roche Ltd Consulting Group ..................................... 15 15 – 15 2 3 3 3 2 2
Consortium DID-FADQDI ............................ 33 33 11 22 4 7 7 4 – – Consortium FCM / UMQ / City of Montreal . 19 19 7 12 2 3 7 – – – Consortium Sogema Technologies Inc /
CRC Sogema Inc ...................................... 14 14 1 13 3 4 3 2 – 1 Consortium World University Service of
Canada / Center for International Studies and Cooperation ........................... 67 67 15 52 7 15 15 15 – –
Convergence Blended Finance Inc ................. 19 19 2 17 5 7 4 1 – – Cowater International Inc ............................... 107 107 39 68 14 17 17 14 5 1 CRC Sogema Inc ............................................ 49 49 22 27 10 12 3 2 – – Cuso International .......................................... 110 110 33 77 19 22 19 16 1 – Dalhousie University ...................................... 19 19 6 13 4 4 3 2 – – Développement international Desjardins ....... 86 86 40 46 11 15 10 8 2 – Digital Opportunity Trust ............................... 25 25 7 18 4 6 6 2 – – Federation of Canadian Municipalities .......... 77 77 27 50 12 15 12 5 6 – Grand Challenges Canada .............................. 169 169 13 156 20 37 37 34 17 11 Horizons of Friendship ................................... 11 11 – 11 3 2 3 2 1 – International Bureau for Children's Rights .... 14 14 2 12 2 3 3 2 2 – International Development Enterprises
Association Inc ......................................... 14 14 4 10 3 2 2 3 – – Mennonite Economic Development
Associates ................................................. 146 146 50 96 22 26 22 19 6 1 Micronutrient Initiative .................................. 270 270 85 185 55 55 55 20 – – Oxfam-Québec ............................................... 101 101 22 79 18 21 19 18 3 – Partnership Africa Canada.............................. 16 16 2 14 2 4 4 4 – – Plan International Canada Inc ........................ 132 132 47 85 28 22 20 12 3 – Primate's World Relief and
Development Fund ................................... 27 27 9 18 5 4 4 4 1 – Right To Play International ............................ 33 33 11 22 14 5 1 2 – – Save the Children Canada .............................. 80 80 45 35 12 9 7 7 – – Solidarité Union Coopération ......................... 31 31 12 19 6 4 4 4 1 – The Conference Board of Canada .................. 42 42 21 21 6 6 5 2 2 – The Jules and Paul-Émile Léger Foundation . 24 24 9 15 5 5 5 – – – Union des producteurs agricoles,
développement international..................... 17 17 3 14 4 4 3 3 – – Université Laval ............................................. 24 24 5 19 3 6 5 5 – – University of British Columbia ...................... 29 29 12 17 6 7 4 – – – University of Waterloo ................................... 15 15 2 13 3 3 3 4 – – World University Service of Canada ............. 52 52 24 28 12 9 2 2 2 1 World Vision Canada ..................................... 112 112 38 74 24 27 16 5 2 –
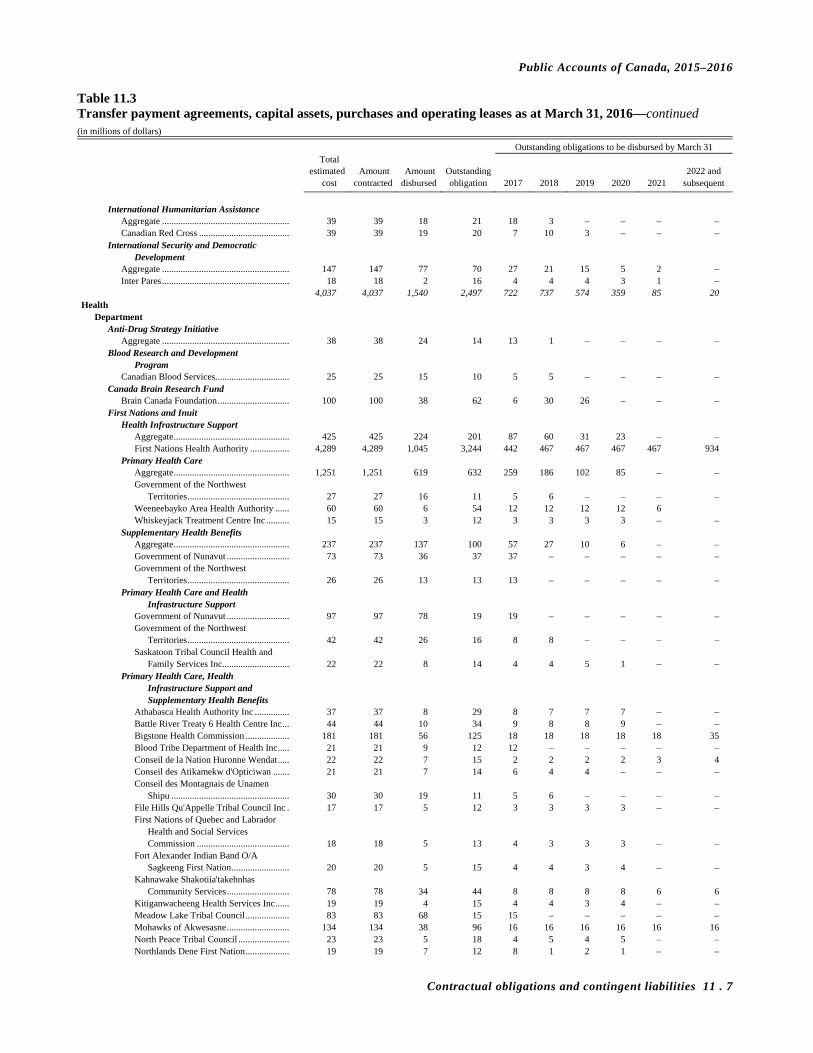
Public Accounts of Canada, 2015–2016
Contractual obligations and contingent liabilities 11 . 7
Table 11.3 Transfer payment agreements, capital assets, purchases and operating leases as at March 31, 2016—continued (in millions of dollars)
Outstanding obligations to be disbursed by March 31 Total estimated Amount Amount Outstanding 2022 and cost contracted disbursed obligation 2017 2018 2019 2020 2021 subsequent
International Humanitarian Assistance
Aggregate ....................................................... 39 39 18 21 18 3 – – – – Canadian Red Cross ....................................... 39 39 19 20 7 10 3 – – –
International Security and Democratic Development
Aggregate ....................................................... 147 147 77 70 27 21 15 5 2 – Inter Pares ....................................................... 18 18 2 16 4 4 4 3 1 –
4,037 4,037 1,540 2,497 722 737 574 359 85 20 Health
Department Anti-Drug Strategy Initiative
Aggregate ....................................................... 38 38 24 14 13 1 – – – – Blood Research and Development
Program Canadian Blood Services................................ 25 25 15 10 5 5 – – – –
Canada Brain Research Fund Brain Canada Foundation ............................... 100 100 38 62 6 30 26 – – –
First Nations and Inuit Health Infrastructure Support
Aggregate .................................................. 425 425 224 201 87 60 31 23 – – First Nations Health Authority ................. 4,289 4,289 1,045 3,244 442 467 467 467 467 934
Primary Health Care Aggregate .................................................. 1,251 1,251 619 632 259 186 102 85 – – Government of the Northwest
Territories ............................................ 27 27 16 11 5 6 – – – – Weeneebayko Area Health Authority ...... 60 60 6 54 12 12 12 12 6 Whiskeyjack Treatment Centre Inc .......... 15 15 3 12 3 3 3 3 – –
Supplementary Health Benefits Aggregate .................................................. 237 237 137 100 57 27 10 6 – – Government of Nunavut ........................... 73 73 36 37 37 – – – – – Government of the Northwest
Territories ............................................ 26 26 13 13 13 – – – – – Primary Health Care and Health
Infrastructure Support Government of Nunavut ........................... 97 97 78 19 19 – – – – – Government of the Northwest
Territories ............................................ 42 42 26 16 8 8 – – – – Saskatoon Tribal Council Health and
Family Services Inc............................. 22 22 8 14 4 4 5 1 – – Primary Health Care, Health
Infrastructure Support and Supplementary Health Benefits
Athabasca Health Authority Inc ............... 37 37 8 29 8 7 7 7 – – Battle River Treaty 6 Health Centre Inc ... 44 44 10 34 9 8 8 9 – – Bigstone Health Commission ................... 181 181 56 125 18 18 18 18 18 35 Blood Tribe Department of Health Inc ..... 21 21 9 12 12 – – – – – Conseil de la Nation Huronne Wendat ..... 22 22 7 15 2 2 2 2 3 4 Conseil des Atikamekw d'Opticiwan ....... 21 21 7 14 6 4 4 – – – Conseil des Montagnais de Unamen
Shipu ................................................... 30 30 19 11 5 6 – – – – File Hills Qu'Appelle Tribal Council Inc . 17 17 5 12 3 3 3 3 – – First Nations of Quebec and Labrador
Health and Social Services Commission ........................................ 18 18 5 13 4 3 3 3 – –
Fort Alexander Indian Band O/A Sagkeeng First Nation ......................... 20 20 5 15 4 4 3 4 – –
Kahnawake Shakotiia'takehnhas Community Services ........................... 78 78 34 44 8 8 8 8 6 6
Kitiganwacheeng Health Services Inc ...... 19 19 4 15 4 4 3 4 – – Meadow Lake Tribal Council ................... 83 83 68 15 15 – – – – – Mohawks of Akwesasne ........................... 134 134 38 96 16 16 16 16 16 16 North Peace Tribal Council ...................... 23 23 5 18 4 5 4 5 – – Northlands Dene First Nation ................... 19 19 7 12 8 1 2 1 – –
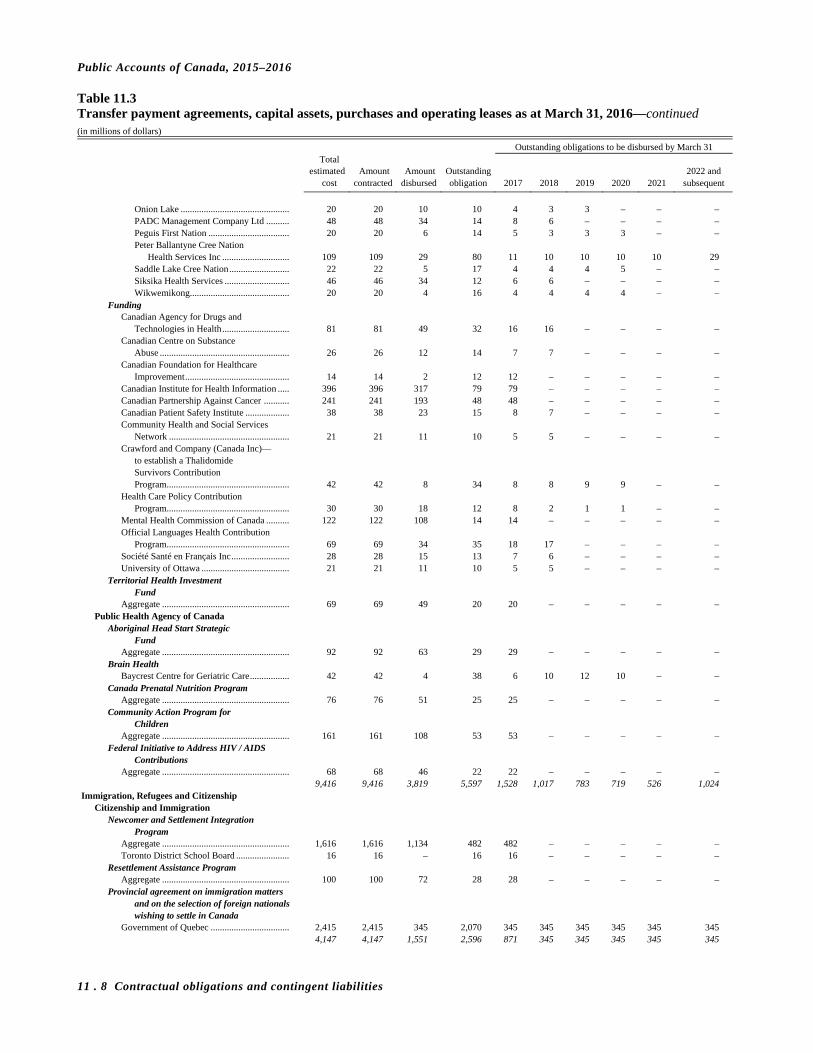
Public Accounts of Canada, 2015–2016
11 . 8 Contractual obligations and contingent liabilities
Table 11.3 Transfer payment agreements, capital assets, purchases and operating leases as at March 31, 2016—continued (in millions of dollars)
Outstanding obligations to be disbursed by March 31 Total estimated Amount Amount Outstanding 2022 and cost contracted disbursed obligation 2017 2018 2019 2020 2021 subsequent
Onion Lake ............................................... 20 20 10 10 4 3 3 – – – PADC Management Company Ltd .......... 48 48 34 14 8 6 – – – – Peguis First Nation ................................... 20 20 6 14 5 3 3 3 – – Peter Ballantyne Cree Nation
Health Services Inc ............................. 109 109 29 80 11 10 10 10 10 29 Saddle Lake Cree Nation .......................... 22 22 5 17 4 4 4 5 – – Siksika Health Services ............................ 46 46 34 12 6 6 – – – – Wikwemikong........................................... 20 20 4 16 4 4 4 4 – –
Funding Canadian Agency for Drugs and
Technologies in Health ............................. 81 81 49 32 16 16 – – – – Canadian Centre on Substance
Abuse ........................................................ 26 26 12 14 7 7 – – – – Canadian Foundation for Healthcare
Improvement ............................................. 14 14 2 12 12 – – – – – Canadian Institute for Health Information ..... 396 396 317 79 79 – – – – – Canadian Partnership Against Cancer ........... 241 241 193 48 48 – – – – – Canadian Patient Safety Institute ................... 38 38 23 15 8 7 – – – – Community Health and Social Services
Network .................................................... 21 21 11 10 5 5 – – – – Crawford and Company (Canada Inc)—
to establish a Thalidomide Survivors Contribution Program ..................................................... 42 42 8 34 8 8 9 9 – –
Health Care Policy Contribution Program ..................................................... 30 30 18 12 8 2 1 1 – –
Mental Health Commission of Canada .......... 122 122 108 14 14 – – – – – Official Languages Health Contribution
Program ..................................................... 69 69 34 35 18 17 – – – – Société Santé en Français Inc ......................... 28 28 15 13 7 6 – – – – University of Ottawa ...................................... 21 21 11 10 5 5 – – – –
Territorial Health Investment Fund
Aggregate ....................................................... 69 69 49 20 20 – – – – – Public Health Agency of Canada
Aboriginal Head Start Strategic Fund
Aggregate ....................................................... 92 92 63 29 29 – – – – – Brain Health
Baycrest Centre for Geriatric Care ................. 42 42 4 38 6 10 12 10 – – Canada Prenatal Nutrition Program
Aggregate ....................................................... 76 76 51 25 25 – – – – – Community Action Program for
Children Aggregate ....................................................... 161 161 108 53 53 – – – – –
Federal Initiative to Address HIV / AIDS Contributions
Aggregate ....................................................... 68 68 46 22 22 – – – – – 9,416 9,416 3,819 5,597 1,528 1,017 783 719 526 1,024 Immigration, Refugees and Citizenship
Citizenship and Immigration Newcomer and Settlement Integration
Program Aggregate ....................................................... 1,616 1,616 1,134 482 482 – – – – – Toronto District School Board ....................... 16 16 – 16 16 – – – – –
Resettlement Assistance Program Aggregate ....................................................... 100 100 72 28 28 – – – – –
Provincial agreement on immigration matters and on the selection of foreign nationals wishing to settle in Canada
Government of Quebec .................................. 2,415 2,415 345 2,070 345 345 345 345 345 345 4,147 4,147 1,551 2,596 871 345 345 345 345 345
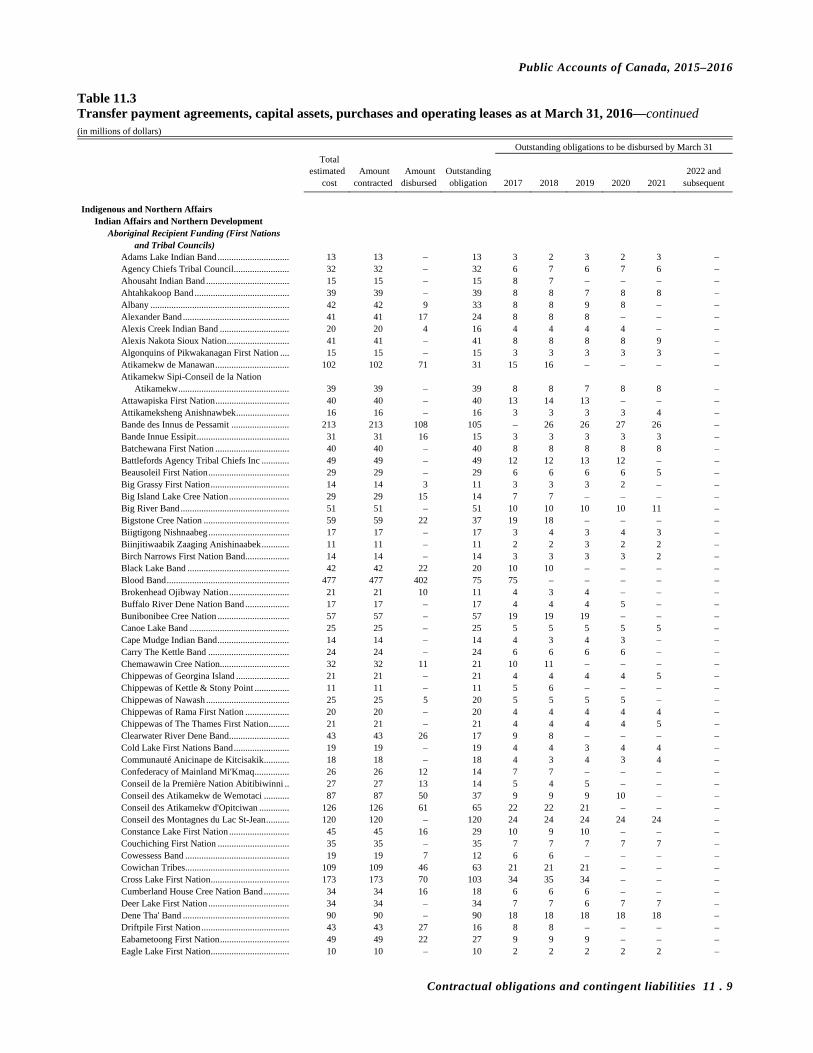
Public Accounts of Canada, 2015–2016
Contractual obligations and contingent liabilities 11 . 9
Table 11.3 Transfer payment agreements, capital assets, purchases and operating leases as at March 31, 2016—continued (in millions of dollars)
Outstanding obligations to be disbursed by March 31 Total estimated Amount Amount Outstanding 2022 and cost contracted disbursed obligation 2017 2018 2019 2020 2021 subsequent
Indigenous and Northern Affairs
Indian Affairs and Northern Development Aboriginal Recipient Funding (First Nations
and Tribal Councils) Adams Lake Indian Band ............................... 13 13 – 13 3 2 3 2 3 – Agency Chiefs Tribal Council ........................ 32 32 – 32 6 7 6 7 6 – Ahousaht Indian Band .................................... 15 15 – 15 8 7 – – – – Ahtahkakoop Band ......................................... 39 39 – 39 8 8 7 8 8 – Albany ............................................................ 42 42 9 33 8 8 9 8 – – Alexander Band .............................................. 41 41 17 24 8 8 8 – – – Alexis Creek Indian Band .............................. 20 20 4 16 4 4 4 4 – – Alexis Nakota Sioux Nation ........................... 41 41 – 41 8 8 8 8 9 – Algonquins of Pikwakanagan First Nation .... 15 15 – 15 3 3 3 3 3 – Atikamekw de Manawan ................................ 102 102 71 31 15 16 – – – – Atikamekw Sipi-Conseil de la Nation
Atikamekw ................................................ 39 39 – 39 8 8 7 8 8 – Attawapiska First Nation ................................ 40 40 – 40 13 14 13 – – – Attikameksheng Anishnawbek ....................... 16 16 – 16 3 3 3 3 4 – Bande des Innus de Pessamit ......................... 213 213 108 105 – 26 26 27 26 – Bande Innue Essipit ........................................ 31 31 16 15 3 3 3 3 3 – Batchewana First Nation ................................ 40 40 – 40 8 8 8 8 8 – Battlefords Agency Tribal Chiefs Inc ............ 49 49 – 49 12 12 13 12 – – Beausoleil First Nation ................................... 29 29 – 29 6 6 6 6 5 – Big Grassy First Nation .................................. 14 14 3 11 3 3 3 2 – – Big Island Lake Cree Nation .......................... 29 29 15 14 7 7 – – – – Big River Band ............................................... 51 51 – 51 10 10 10 10 11 – Bigstone Cree Nation ..................................... 59 59 22 37 19 18 – – – – Biigtigong Nishnaabeg ................................... 17 17 – 17 3 4 3 4 3 – Biinjitiwaabik Zaaging Anishinaabek ............ 11 11 – 11 2 2 3 2 2 – Birch Narrows First Nation Band ................... 14 14 – 14 3 3 3 3 2 – Black Lake Band ............................................ 42 42 22 20 10 10 – – – – Blood Band ..................................................... 477 477 402 75 75 – – – – – Brokenhead Ojibway Nation .......................... 21 21 10 11 4 3 4 – – – Buffalo River Dene Nation Band ................... 17 17 – 17 4 4 4 5 – – Bunibonibee Cree Nation ............................... 57 57 – 57 19 19 19 – – – Canoe Lake Band ........................................... 25 25 – 25 5 5 5 5 5 – Cape Mudge Indian Band ............................... 14 14 – 14 4 3 4 3 – – Carry The Kettle Band ................................... 24 24 – 24 6 6 6 6 – – Chemawawin Cree Nation.............................. 32 32 11 21 10 11 – – – – Chippewas of Georgina Island ....................... 21 21 – 21 4 4 4 4 5 – Chippewas of Kettle & Stony Point ............... 11 11 – 11 5 6 – – – – Chippewas of Nawash .................................... 25 25 5 20 5 5 5 5 – – Chippewas of Rama First Nation ................... 20 20 – 20 4 4 4 4 4 – Chippewas of The Thames First Nation ......... 21 21 – 21 4 4 4 4 5 – Clearwater River Dene Band .......................... 43 43 26 17 9 8 – – – – Cold Lake First Nations Band ........................ 19 19 – 19 4 4 3 4 4 – Communauté Anicinape de Kitcisakik ........... 18 18 – 18 4 3 4 3 4 – Confederacy of Mainland Mi'Kmaq ............... 26 26 12 14 7 7 – – – – Conseil de la Première Nation Abitibiwinni .. 27 27 13 14 5 4 5 – – – Conseil des Atikamekw de Wemotaci ........... 87 87 50 37 9 9 9 10 – – Conseil des Atikamekw d'Opitciwan ............. 126 126 61 65 22 22 21 – – – Conseil des Montagnes du Lac St-Jean .......... 120 120 – 120 24 24 24 24 24 – Constance Lake First Nation .......................... 45 45 16 29 10 9 10 – – – Couchiching First Nation ............................... 35 35 – 35 7 7 7 7 7 – Cowessess Band ............................................. 19 19 7 12 6 6 – – – – Cowichan Tribes ............................................. 109 109 46 63 21 21 21 – – – Cross Lake First Nation .................................. 173 173 70 103 34 35 34 – – – Cumberland House Cree Nation Band ........... 34 34 16 18 6 6 6 – – – Deer Lake First Nation ................................... 34 34 – 34 7 7 6 7 7 – Dene Tha' Band .............................................. 90 90 – 90 18 18 18 18 18 – Driftpile First Nation ...................................... 43 43 27 16 8 8 – – – – Eabametoong First Nation .............................. 49 49 22 27 9 9 9 – – – Eagle Lake First Nation .................................. 10 10 – 10 2 2 2 2 2 –
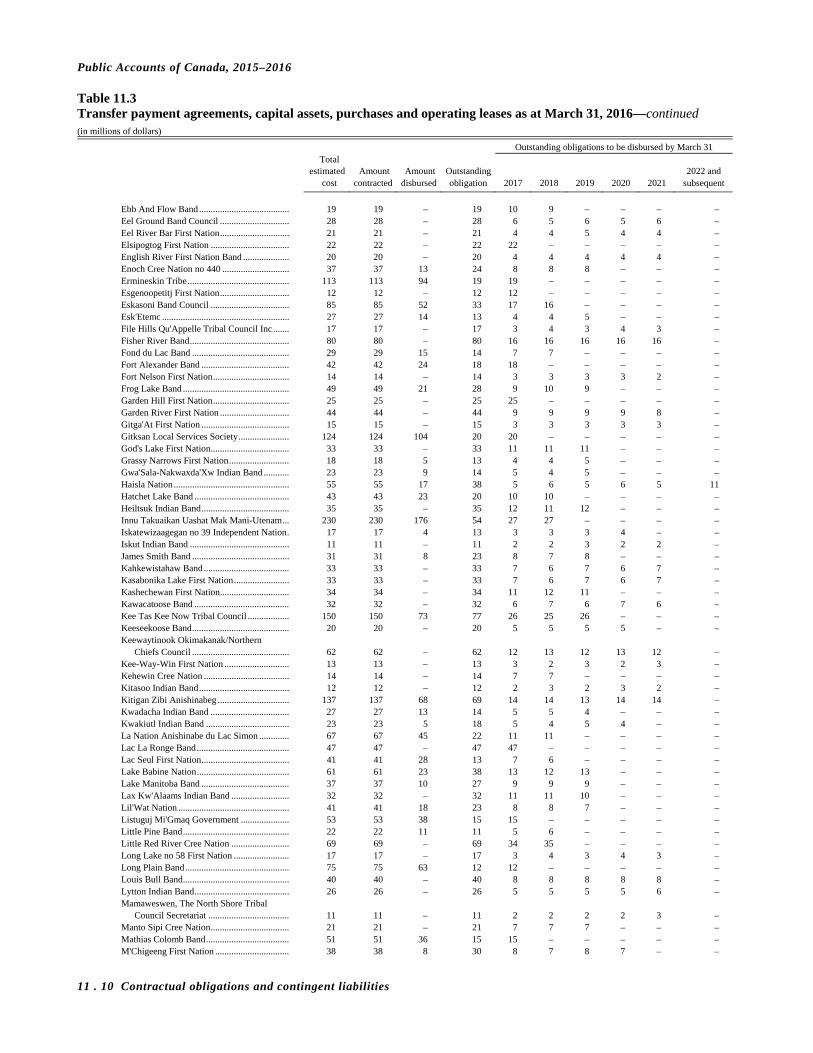
Public Accounts of Canada, 2015–2016
11 . 10 Contractual obligations and contingent liabilities
Table 11.3 Transfer payment agreements, capital assets, purchases and operating leases as at March 31, 2016—continued (in millions of dollars)
Outstanding obligations to be disbursed by March 31 Total estimated Amount Amount Outstanding 2022 and cost contracted disbursed obligation 2017 2018 2019 2020 2021 subsequent
Ebb And Flow Band ....................................... 19 19 – 19 10 9 – – – – Eel Ground Band Council .............................. 28 28 – 28 6 5 6 5 6 – Eel River Bar First Nation .............................. 21 21 – 21 4 4 5 4 4 – Elsipogtog First Nation .................................. 22 22 – 22 22 – – – – – English River First Nation Band .................... 20 20 – 20 4 4 4 4 4 – Enoch Cree Nation no 440 ............................. 37 37 13 24 8 8 8 – – – Ermineskin Tribe ............................................ 113 113 94 19 19 – – – – – Esgenoopetitj First Nation .............................. 12 12 – 12 12 – – – – – Eskasoni Band Council .................................. 85 85 52 33 17 16 – – – – Esk'Etemc ....................................................... 27 27 14 13 4 4 5 – – – File Hills Qu'Appelle Tribal Council Inc ....... 17 17 – 17 3 4 3 4 3 – Fisher River Band ........................................... 80 80 – 80 16 16 16 16 16 – Fond du Lac Band .......................................... 29 29 15 14 7 7 – – – – Fort Alexander Band ...................................... 42 42 24 18 18 – – – – – Fort Nelson First Nation ................................. 14 14 – 14 3 3 3 3 2 – Frog Lake Band .............................................. 49 49 21 28 9 10 9 – – – Garden Hill First Nation ................................. 25 25 – 25 25 – – – – – Garden River First Nation .............................. 44 44 – 44 9 9 9 9 8 – Gitga'At First Nation ...................................... 15 15 – 15 3 3 3 3 3 – Gitksan Local Services Society ...................... 124 124 104 20 20 – – – – – God's Lake First Nation .................................. 33 33 – 33 11 11 11 – – – Grassy Narrows First Nation .......................... 18 18 5 13 4 4 5 – – – Gwa'Sala-Nakwaxda'Xw Indian Band ........... 23 23 9 14 5 4 5 – – – Haisla Nation .................................................. 55 55 17 38 5 6 5 6 5 11 Hatchet Lake Band ......................................... 43 43 23 20 10 10 – – – – Heiltsuk Indian Band ...................................... 35 35 – 35 12 11 12 – – – Innu Takuaikan Uashat Mak Mani-Utenam ... 230 230 176 54 27 27 – – – – Iskatewizaagegan no 39 Independent Nation . 17 17 4 13 3 3 3 4 – – Iskut Indian Band ........................................... 11 11 – 11 2 2 3 2 2 – James Smith Band .......................................... 31 31 8 23 8 7 8 – – – Kahkewistahaw Band ..................................... 33 33 – 33 7 6 7 6 7 – Kasabonika Lake First Nation ........................ 33 33 – 33 7 6 7 6 7 – Kashechewan First Nation.............................. 34 34 – 34 11 12 11 – – – Kawacatoose Band ......................................... 32 32 – 32 6 7 6 7 6 – Kee Tas Kee Now Tribal Council .................. 150 150 73 77 26 25 26 – – – Keeseekoose Band .......................................... 20 20 – 20 5 5 5 5 – – Keewaytinook Okimakanak/Northern
Chiefs Council .......................................... 62 62 – 62 12 13 12 13 12 – Kee-Way-Win First Nation ............................ 13 13 – 13 3 2 3 2 3 – Kehewin Cree Nation ..................................... 14 14 – 14 7 7 – – – – Kitasoo Indian Band ....................................... 12 12 – 12 2 3 2 3 2 – Kitigan Zibi Anishinabeg ............................... 137 137 68 69 14 14 13 14 14 – Kwadacha Indian Band .................................. 27 27 13 14 5 5 4 – – – Kwakiutl Indian Band .................................... 23 23 5 18 5 4 5 4 – – La Nation Anishinabe du Lac Simon ............. 67 67 45 22 11 11 – – – – Lac La Ronge Band ........................................ 47 47 – 47 47 – – – – – Lac Seul First Nation ...................................... 41 41 28 13 7 6 – – – – Lake Babine Nation ........................................ 61 61 23 38 13 12 13 – – – Lake Manitoba Band ...................................... 37 37 10 27 9 9 9 – – – Lax Kw'Alaams Indian Band ......................... 32 32 – 32 11 11 10 – – – Lil'Wat Nation ................................................ 41 41 18 23 8 8 7 – – – Listuguj Mi'Gmaq Government ..................... 53 53 38 15 15 – – – – – Little Pine Band .............................................. 22 22 11 11 5 6 – – – – Little Red River Cree Nation ......................... 69 69 – 69 34 35 – – – – Long Lake no 58 First Nation ........................ 17 17 – 17 3 4 3 4 3 – Long Plain Band ............................................. 75 75 63 12 12 – – – – – Louis Bull Band .............................................. 40 40 – 40 8 8 8 8 8 – Lytton Indian Band ......................................... 26 26 – 26 5 5 5 5 6 – Mamaweswen, The North Shore Tribal
Council Secretariat ................................... 11 11 – 11 2 2 2 2 3 – Manto Sipi Cree Nation .................................. 21 21 – 21 7 7 7 – – – Mathias Colomb Band .................................... 51 51 36 15 15 – – – – – M'Chigeeng First Nation ................................ 38 38 8 30 8 7 8 7 – –
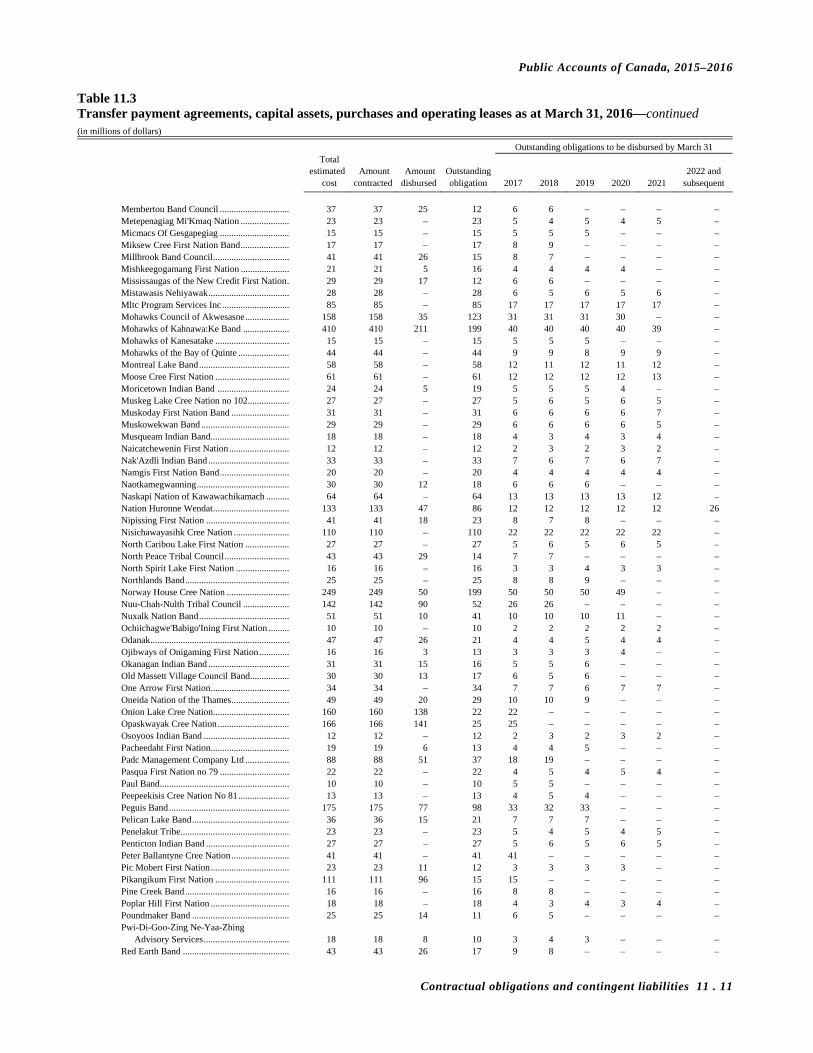
Public Accounts of Canada, 2015–2016
Contractual obligations and contingent liabilities 11 . 11
Table 11.3 Transfer payment agreements, capital assets, purchases and operating leases as at March 31, 2016—continued (in millions of dollars)
Outstanding obligations to be disbursed by March 31 Total estimated Amount Amount Outstanding 2022 and cost contracted disbursed obligation 2017 2018 2019 2020 2021 subsequent
Membertou Band Council .............................. 37 37 25 12 6 6 – – – – Metepenagiag Mi'Kmaq Nation ..................... 23 23 – 23 5 4 5 4 5 – Micmacs Of Gesgapegiag .............................. 15 15 – 15 5 5 5 – – – Miksew Cree First Nation Band ..................... 17 17 – 17 8 9 – – – – Millbrook Band Council ................................. 41 41 26 15 8 7 – – – – Mishkeegogamang First Nation ..................... 21 21 5 16 4 4 4 4 – – Mississaugas of the New Credit First Nation . 29 29 17 12 6 6 – – – – Mistawasis Nehiyawak ................................... 28 28 – 28 6 5 6 5 6 – Mltc Program Services Inc ............................. 85 85 – 85 17 17 17 17 17 – Mohawks Council of Akwesasne ................... 158 158 35 123 31 31 31 30 – – Mohawks of Kahnawa:Ke Band .................... 410 410 211 199 40 40 40 40 39 – Mohawks of Kanesatake ................................ 15 15 – 15 5 5 5 – – – Mohawks of the Bay of Quinte ...................... 44 44 – 44 9 9 8 9 9 – Montreal Lake Band ....................................... 58 58 – 58 12 11 12 11 12 – Moose Cree First Nation ................................ 61 61 – 61 12 12 12 12 13 – Moricetown Indian Band ............................... 24 24 5 19 5 5 5 4 – – Muskeg Lake Cree Nation no 102 .................. 27 27 – 27 5 6 5 6 5 – Muskoday First Nation Band ......................... 31 31 – 31 6 6 6 6 7 – Muskowekwan Band ...................................... 29 29 – 29 6 6 6 6 5 – Musqueam Indian Band.................................. 18 18 – 18 4 3 4 3 4 – Naicatchewenin First Nation .......................... 12 12 – 12 2 3 2 3 2 – Nak'Azdli Indian Band ................................... 33 33 – 33 7 6 7 6 7 – Namgis First Nation Band .............................. 20 20 – 20 4 4 4 4 4 – Naotkamegwanning ........................................ 30 30 12 18 6 6 6 – – – Naskapi Nation of Kawawachikamach .......... 64 64 – 64 13 13 13 13 12 – Nation Huronne Wendat ................................. 133 133 47 86 12 12 12 12 12 26 Nipissing First Nation .................................... 41 41 18 23 8 7 8 – – – Nisichawayasihk Cree Nation ........................ 110 110 – 110 22 22 22 22 22 – North Caribou Lake First Nation ................... 27 27 – 27 5 6 5 6 5 – North Peace Tribal Council ............................ 43 43 29 14 7 7 – – – – North Spirit Lake First Nation ....................... 16 16 – 16 3 3 4 3 3 – Northlands Band ............................................. 25 25 – 25 8 8 9 – – – Norway House Cree Nation ........................... 249 249 50 199 50 50 50 49 – – Nuu-Chah-Nulth Tribal Council .................... 142 142 90 52 26 26 – – – – Nuxalk Nation Band ....................................... 51 51 10 41 10 10 10 11 – – Ochiichagwe'Babigo'Ining First Nation ......... 10 10 – 10 2 2 2 2 2 – Odanak ............................................................ 47 47 26 21 4 4 5 4 4 – Ojibways of Onigaming First Nation ............. 16 16 3 13 3 3 3 4 – – Okanagan Indian Band ................................... 31 31 15 16 5 5 6 – – – Old Massett Village Council Band................. 30 30 13 17 6 5 6 – – – One Arrow First Nation .................................. 34 34 – 34 7 7 6 7 7 – Oneida Nation of the Thames ......................... 49 49 20 29 10 10 9 – – – Onion Lake Cree Nation................................. 160 160 138 22 22 – – – – – Opaskwayak Cree Nation ............................... 166 166 141 25 25 – – – – – Osoyoos Indian Band ..................................... 12 12 – 12 2 3 2 3 2 – Pacheedaht First Nation.................................. 19 19 6 13 4 4 5 – – – Padc Management Company Ltd ................... 88 88 51 37 18 19 – – – – Pasqua First Nation no 79 .............................. 22 22 – 22 4 5 4 5 4 – Paul Band........................................................ 10 10 – 10 5 5 – – – – Peepeekisis Cree Nation No 81 ...................... 13 13 – 13 4 5 4 – – – Peguis Band .................................................... 175 175 77 98 33 32 33 – – – Pelican Lake Band .......................................... 36 36 15 21 7 7 7 – – – Penelakut Tribe ............................................... 23 23 – 23 5 4 5 4 5 – Penticton Indian Band .................................... 27 27 – 27 5 6 5 6 5 – Peter Ballantyne Cree Nation ......................... 41 41 – 41 41 – – – – – Pic Mobert First Nation .................................. 23 23 11 12 3 3 3 3 – – Pikangikum First Nation ................................ 111 111 96 15 15 – – – – – Pine Creek Band ............................................. 16 16 – 16 8 8 – – – – Poplar Hill First Nation .................................. 18 18 – 18 4 3 4 3 4 – Poundmaker Band .......................................... 25 25 14 11 6 5 – – – – Pwi-Di-Goo-Zing Ne-Yaa-Zhing
Advisory Services ..................................... 18 18 8 10 3 4 3 – – – Red Earth Band .............................................. 43 43 26 17 9 8 – – – –

Public Accounts of Canada, 2015–2016
11 . 12 Contractual obligations and contingent liabilities
Table 11.3 Transfer payment agreements, capital assets, purchases and operating leases as at March 31, 2016—continued (in millions of dollars)
Outstanding obligations to be disbursed by March 31 Total estimated Amount Amount Outstanding 2022 and cost contracted disbursed obligation 2017 2018 2019 2020 2021 subsequent
Red Rock First Nation .................................... 14 14 – 14 3 3 2 3 3 – Regroupement Mamit Innuat Inc ................... 42 42 – 42 8 9 8 9 8 – Sachigo Lake First Nation .............................. 18 18 – 18 4 3 4 3 4 – Saddle Lake Band ........................................... 179 179 109 70 35 35 – – – – Sagamok Anishnawbek First Nation .............. 40 40 24 16 8 8 – – – – Saint Mary's Band Council ............................. 77 77 55 22 11 11 – – – – Samson Band .................................................. 21 21 – 21 21 – – – – – Sandy Bay Band ............................................. 40 40 22 18 18 – – – – – Sandy Lake First Nation ................................. 51 51 35 16 16 – – – – – Saskatoon Tribal Council ............................... 14 14 – 14 3 3 2 3 3 – Saugeen First Nation ...................................... 28 28 6 22 6 5 6 5 – – Saulteau First Nations .................................... 20 20 5 15 4 4 4 3 – – Sayisi Dene First Nation................................. 12 12 – 12 4 4 4 – – – Seabird Island Indian Band ............................ 33 33 – 33 7 6 7 6 7 – Serpent River First Nation .............................. 16 16 – 16 3 3 3 3 4 – Shamattawa First Nation ................................ 35 35 – 35 12 12 11 – – – Shawanaga First Nation Ojibway Territory ... 10 10 – 10 2 2 2 2 2 – Shibogama First Nations Council .................. 14 14 – 14 3 3 2 3 3 – Siksika Nation Band ....................................... 255 255 216 39 39 – – – – – Sipekne'Katik .................................................. 38 38 – 38 8 7 8 7 8 – Six Nations of the Grand River ...................... 92 92 – 92 18 19 18 19 18 – Skidegate Indian Band .................................... 34 34 – 34 7 7 6 7 7 – Skownan First Nation ..................................... 37 37 10 27 9 9 9 – – – Snuneymuxw First Nation .............................. 24 24 – 24 6 6 6 6 – – Southeast Resource Development
Council Corp ............................................. 34 34 23 11 11 – – – – – Southern First Nations Secretariat .................. 42 42 8 34 8 9 8 9 – – Splatsin ........................................................... 20 20 9 11 4 3 4 – – – Squamish Indian Band.................................... 60 60 – 60 12 12 12 12 12 – St Theresa Point Band .................................... 80 80 – 80 27 26 27 – – – Sto:Lo Nation ................................................. 24 24 6 18 5 4 5 4 – – Sts'Ailes Band ................................................. 23 23 11 12 4 4 4 – – – Sturgeon Lake First Nation ............................ 28 28 – 28 9 9 10 – – – Stz'Uminus First Nation ................................. 32 32 – 32 6 7 6 7 6 – Sucker Creek Band ......................................... 37 37 22 15 7 8 – – – – Sumas First Nation ......................................... 28 28 7 21 5 5 5 6 – – Tataskweyak Cree Nation .............................. 81 81 – 81 16 16 17 16 16 – Thunderchild First Nation .............................. 29 29 – 29 10 9 10 – – – Timiskaming First Nation .............................. 34 34 8 26 7 6 7 6 – – Tk'Emlups Te Secwepemc ............................. 22 22 – 22 4 5 4 5 4 – Tootinaowaziibeeng Treaty Reserve .............. 15 15 5 10 3 3 4 – – – Tribal Chiefs Ventures Incorporated .............. 52 52 28 24 8 8 8 – – – Tsartlip Indian Band ....................................... 38 38 10 28 9 9 10 – – – Tsay Keh Dene Band ...................................... 14 14 4 10 3 2 3 2 – – Tsuut'Ina Nation ............................................. 85 85 73 12 12 – – – – – Wabaseemoong Independent Nation .............. 28 28 12 16 5 6 5 – – – Walpole Island First Nation ........................... 20 20 – 20 10 10 – – – – Wapekeka First Nation ................................... 15 15 – 15 3 3 3 3 3 – Wasagamack First Nation .............................. 13 13 – 13 13 – – – – – Wasauksing First Nation ................................ 15 15 – 15 3 3 3 3 3 – Waterhen Lake Band ...................................... 23 23 – 23 5 4 5 4 5 – Waywayseecappo First Nation Treaty Four ... 41 41 – 41 14 13 14 – – – Webequie ....................................................... 30 30 8 22 6 5 6 5 – – Western Cree Tribal Council .......................... 111 111 70 41 20 21 – – – – White Bear Band ............................................ 25 25 – 25 5 5 5 5 5 – Whitefish Lake no 128 ................................... 16 16 – 16 8 8 – – – – Whitefish River First Nation .......................... 15 15 – 15 3 3 3 3 3 – Wikwemikong Unceded Indian Reserve ........ 98 98 62 36 18 18 – – – – Wunnumin Lake First Nation ......................... 22 22 6 16 4 4 4 4 – – Yellow Quil Band ........................................... 28 28 – 28 6 5 6 5 6 – Yellowhead Tribal Development Foundation 37 37 14 23 8 7 8 – – –
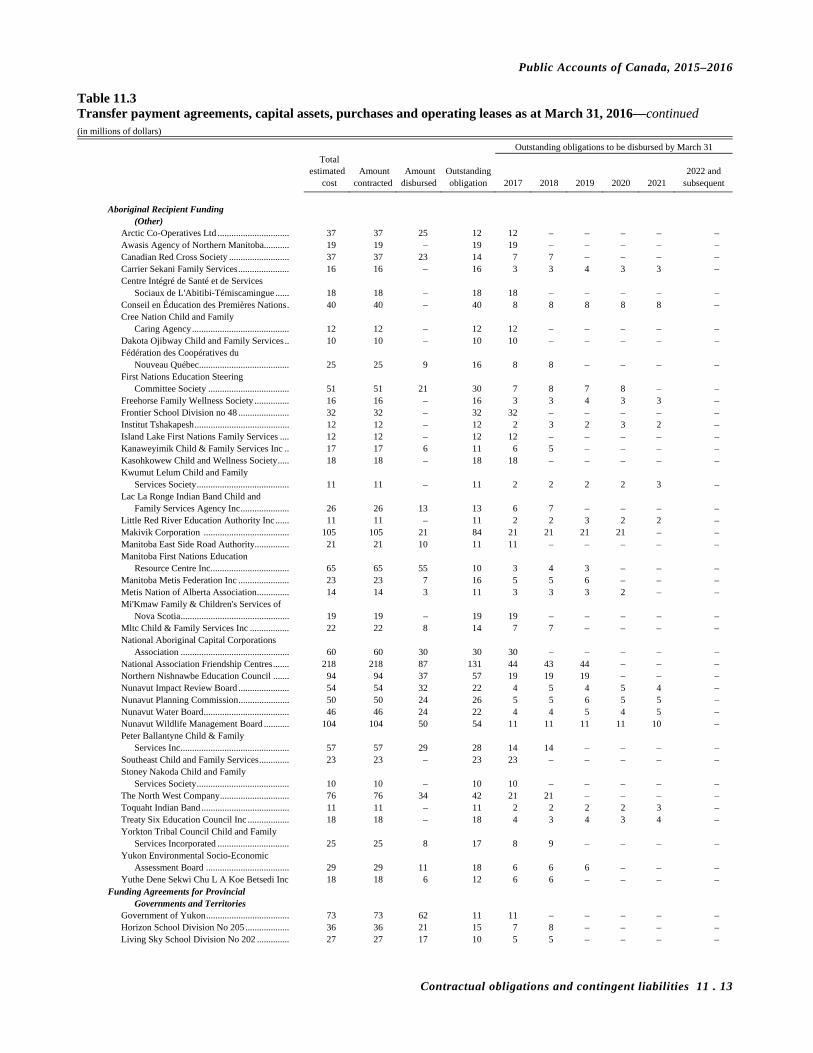
Public Accounts of Canada, 2015–2016
Contractual obligations and contingent liabilities 11 . 13
Table 11.3 Transfer payment agreements, capital assets, purchases and operating leases as at March 31, 2016—continued (in millions of dollars)
Outstanding obligations to be disbursed by March 31 Total estimated Amount Amount Outstanding 2022 and cost contracted disbursed obligation 2017 2018 2019 2020 2021 subsequent
Aboriginal Recipient Funding
(Other) Arctic Co-Operatives Ltd ............................... 37 37 25 12 12 – – – – – Awasis Agency of Northern Manitoba........... 19 19 – 19 19 – – – – – Canadian Red Cross Society .......................... 37 37 23 14 7 7 – – – – Carrier Sekani Family Services ...................... 16 16 – 16 3 3 4 3 3 – Centre Intégré de Santé et de Services
Sociaux de L'Abitibi-Témiscamingue ...... 18 18 – 18 18 – – – – – Conseil en Éducation des Premières Nations . 40 40 – 40 8 8 8 8 8 – Cree Nation Child and Family
Caring Agency .......................................... 12 12 – 12 12 – – – – – Dakota Ojibway Child and Family Services .. 10 10 – 10 10 – – – – – Fédération des Coopératives du
Nouveau Québec ....................................... 25 25 9 16 8 8 – – – – First Nations Education Steering
Committee Society ................................... 51 51 21 30 7 8 7 8 – – Freehorse Family Wellness Society ............... 16 16 – 16 3 3 4 3 3 – Frontier School Division no 48 ...................... 32 32 – 32 32 – – – – – Institut Tshakapesh ......................................... 12 12 – 12 2 3 2 3 2 – Island Lake First Nations Family Services .... 12 12 – 12 12 – – – – – Kanaweyimik Child & Family Services Inc .. 17 17 6 11 6 5 – – – – Kasohkowew Child and Wellness Society ..... 18 18 – 18 18 – – – – – Kwumut Lelum Child and Family
Services Society ........................................ 11 11 – 11 2 2 2 2 3 – Lac La Ronge Indian Band Child and
Family Services Agency Inc ..................... 26 26 13 13 6 7 – – – – Little Red River Education Authority Inc ...... 11 11 – 11 2 2 3 2 2 – Makivik Corporation ..................................... 105 105 21 84 21 21 21 21 – – Manitoba East Side Road Authority............... 21 21 10 11 11 – – – – – Manitoba First Nations Education
Resource Centre Inc .................................. 65 65 55 10 3 4 3 – – – Manitoba Metis Federation Inc ...................... 23 23 7 16 5 5 6 – – – Metis Nation of Alberta Association .............. 14 14 3 11 3 3 3 2 – – Mi'Kmaw Family & Children's Services of
Nova Scotia ............................................... 19 19 – 19 19 – – – – – Mltc Child & Family Services Inc ................. 22 22 8 14 7 7 – – – – National Aboriginal Capital Corporations
Association ............................................... 60 60 30 30 30 – – – – – National Association Friendship Centres ....... 218 218 87 131 44 43 44 – – – Northern Nishnawbe Education Council ....... 94 94 37 57 19 19 19 – – – Nunavut Impact Review Board ...................... 54 54 32 22 4 5 4 5 4 – Nunavut Planning Commission ...................... 50 50 24 26 5 5 6 5 5 – Nunavut Water Board ..................................... 46 46 24 22 4 4 5 4 5 – Nunavut Wildlife Management Board ........... 104 104 50 54 11 11 11 11 10 – Peter Ballantyne Child & Family
Services Inc ............................................... 57 57 29 28 14 14 – – – – Southeast Child and Family Services ............. 23 23 – 23 23 – – – – – Stoney Nakoda Child and Family
Services Society ........................................ 10 10 – 10 10 – – – – – The North West Company .............................. 76 76 34 42 21 21 – – – – Toquaht Indian Band ...................................... 11 11 – 11 2 2 2 2 3 – Treaty Six Education Council Inc .................. 18 18 – 18 4 3 4 3 4 – Yorkton Tribal Council Child and Family
Services Incorporated ............................... 25 25 8 17 8 9 – – – – Yukon Environmental Socio-Economic
Assessment Board .................................... 29 29 11 18 6 6 6 – – – Yuthe Dene Sekwi Chu L A Koe Betsedi Inc 18 18 6 12 6 6 – – – –
Funding Agreements for Provincial Governments and Territories
Government of Yukon .................................... 73 73 62 11 11 – – – – – Horizon School Division No 205 ................... 36 36 21 15 7 8 – – – – Living Sky School Division No 202 .............. 27 27 17 10 5 5 – – – –

Public Accounts of Canada, 2015–2016
11 . 14 Contractual obligations and contingent liabilities
Table 11.3 Transfer payment agreements, capital assets, purchases and operating leases as at March 31, 2016—continued (in millions of dollars)
Outstanding obligations to be disbursed by March 31 Total estimated Amount Amount Outstanding 2022 and cost contracted disbursed obligation 2017 2018 2019 2020 2021 subsequent
Minister of Finance, Alberta .......................... 24 24 6 18 2 2 3 2 2 7 Ministry of Community and Social
Services, Ontario ...................................... 1,288 1,288 506 782 261 260 261 – – – Prairie Valley School Division No 208 .......... 16 16 6 10 3 4 3 – – –
Grant Cree Nation Government................................ 639 639 302 337 112 113 112 – – – Miawpukek Band ........................................... 107 107 31 76 11 11 11 11 11 21 Mi'Kmaw Kina'Matnewey.............................. 317 317 216 101 51 50 – – – – Nunatsiavut Government ................................ 234 234 161 73 24 24 25 – – –
Indian Self-Government Carcross/Tagish First Nation .......................... 56 56 22 34 8 9 8 9 – – Huu-Ay-Aht First Nations .............................. 43 43 25 18 3 3 4 4 4 – Ka:'Yu:'K'T'H/Che:K:Tles7Et'H' First Nation 50 50 28 22 4 4 4 5 5 – Kluane First Nation ........................................ 45 45 26 19 5 5 5 4 – – Kwanlin Dun First Nation .............................. 121 121 69 52 13 13 13 13 – – Nisga'A Nation ............................................... 489 489 417 72 72 – – – – – Sechelt Indian Band ........................................ 55 55 27 28 7 7 7 7 – – Sioux Valley Dakota Nation .......................... 15 15 – 15 15 – – – – – Ta'An Kwach'An Council............................... 42 42 24 18 4 5 4 5 – – Ucluelet First Nation ...................................... 51 51 29 22 4 4 4 5 5 – Westbank First Nation .................................... 90 90 52 38 6 6 7 6 7 6
Aggregate of various transfer payment agreements under $10 million
Aggregate ....................................................... 4,676 4,676 2,483 2,193 1,184 491 277 147 86 8 21,549 21,549 9,310 12,239 4,656 3,142 2,338 1,190 834 79 Infrastructure and Communities
Office of Infrastructure of Canada Border Infrastructure Fund
Aggregate ....................................................... 140 140 131 9 2 7 – – – – Government of Quebec
Highways 35, 55, 73 and 173, Phase I and II ...................................... 147 147 130 17 – – – 17 – –
Building Canada Fund—Communities Component
Aggregate ....................................................... 503 503 487 16 16 – – – – – Government of Ontario .................................. 362 362 325 37 37 – – – – – Government of Quebec .................................. 210 210 126 84 13 14 13 44 – –
Building Canada Fund—Large Urban Centres Component
Government of Quebec .................................. 200 200 49 151 30 30 30 61 – – Building Canada Fund—Major
Infrastructure Component Aggregate ....................................................... 847 847 660 187 149 33 5 – – – City of Ottawa
Ottawa Light Rail Transit Project ............. 600 600 386 214 126 30 58 – – – City of Toronto
Union Station revitalization ...................... 133 133 85 48 23 18 7 – – – City of Toronto and Regional Municipality
of York Toronto-York Spadina Subway
extension ............................................. 622 622 531 91 61 30 – – – – Government of Alberta
Royal Alberta Museum ............................. 113 113 72 41 30 11 – – – – Government of British Columbia
Evergreen Line Project ............................. 340 340 205 135 25 110 – – – – Highway 1: Mountain Highway
Interchange .......................................... 13 13 1 12 7 5 – – – – Highway 1: Pritchard at Hoffman's Bluff . 26 26 14 12 12 – – – – – Transit Improvement
Initiative .............................................. 48 48 28 20 20 – – – – –
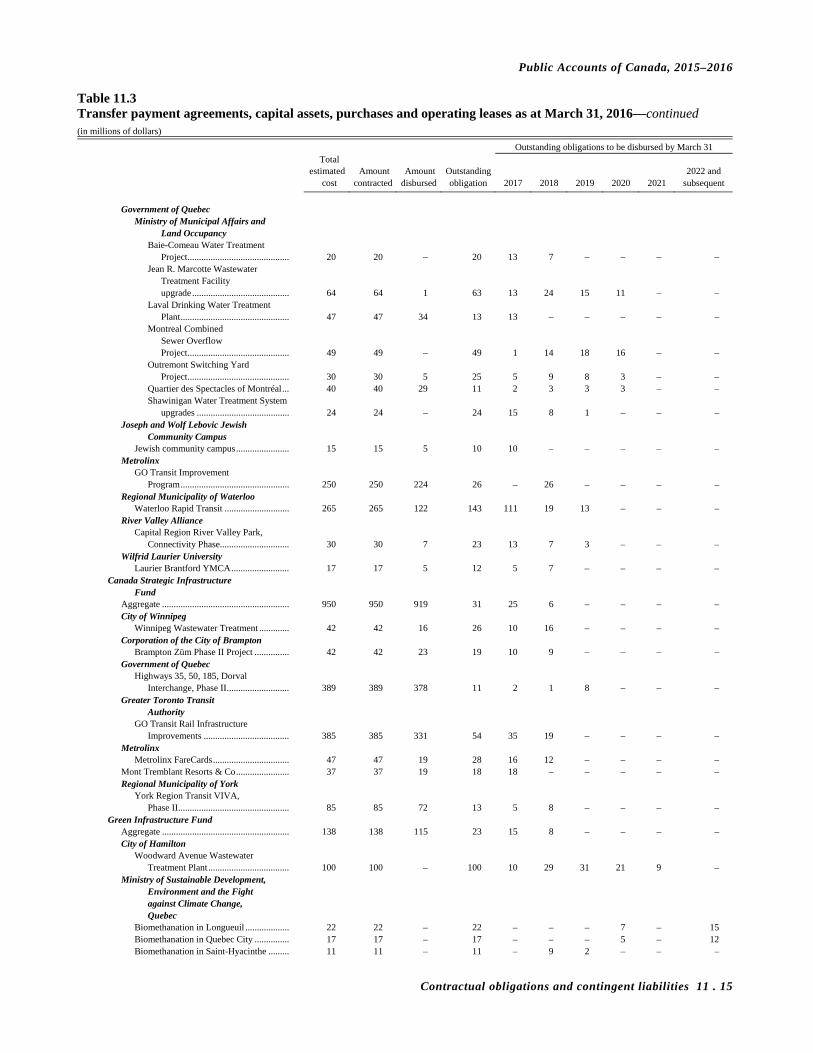
Public Accounts of Canada, 2015–2016
Contractual obligations and contingent liabilities 11 . 15
Table 11.3 Transfer payment agreements, capital assets, purchases and operating leases as at March 31, 2016—continued (in millions of dollars)
Outstanding obligations to be disbursed by March 31 Total estimated Amount Amount Outstanding 2022 and cost contracted disbursed obligation 2017 2018 2019 2020 2021 subsequent
Government of Quebec
Ministry of Municipal Affairs and Land Occupancy
Baie-Comeau Water Treatment Project ............................................ 20 20 – 20 13 7 – – – –
Jean R. Marcotte Wastewater Treatment Facility upgrade .......................................... 64 64 1 63 13 24 15 11 – –
Laval Drinking Water Treatment Plant ............................................... 47 47 34 13 13 – – – – –
Montreal Combined Sewer Overflow Project ............................................ 49 49 – 49 1 14 18 16 – –
Outremont Switching Yard Project ............................................ 30 30 5 25 5 9 8 3 – –
Quartier des Spectacles of Montréal ... 40 40 29 11 2 3 3 3 – – Shawinigan Water Treatment System
upgrades ........................................ 24 24 – 24 15 8 1 – – – Joseph and Wolf Lebovic Jewish
Community Campus Jewish community campus ....................... 15 15 5 10 10 – – – – –
Metrolinx GO Transit Improvement
Program ............................................... 250 250 224 26 – 26 – – – – Regional Municipality of Waterloo
Waterloo Rapid Transit ............................ 265 265 122 143 111 19 13 – – – River Valley Alliance
Capital Region River Valley Park, Connectivity Phase.............................. 30 30 7 23 13 7 3 – – –
Wilfrid Laurier University Laurier Brantford YMCA ......................... 17 17 5 12 5 7 – – – –
Canada Strategic Infrastructure Fund
Aggregate ....................................................... 950 950 919 31 25 6 – – – – City of Winnipeg
Winnipeg Wastewater Treatment ............. 42 42 16 26 10 16 – – – – Corporation of the City of Brampton
Brampton Züm Phase II Project ............... 42 42 23 19 10 9 – – – – Government of Quebec
Highways 35, 50, 185, Dorval Interchange, Phase II ........................... 389 389 378 11 2 1 8 – – –
Greater Toronto Transit Authority
GO Transit Rail Infrastructure Improvements ..................................... 385 385 331 54 35 19 – – – –
Metrolinx Metrolinx FareCards ................................. 47 47 19 28 16 12 – – – –
Mont Tremblant Resorts & Co ....................... 37 37 19 18 18 – – – – – Regional Municipality of York
York Region Transit VIVA, Phase II ................................................ 85 85 72 13 5 8 – – – –
Green Infrastructure Fund Aggregate ....................................................... 138 138 115 23 15 8 – – – – City of Hamilton
Woodward Avenue Wastewater Treatment Plant ................................... 100 100 – 100 10 29 31 21 9 –
Ministry of Sustainable Development, Environment and the Fight against Climate Change, Quebec
Biomethanation in Longueuil ................... 22 22 – 22 – – – 7 – 15 Biomethanation in Quebec City ............... 17 17 – 17 – – – 5 – 12 Biomethanation in Saint-Hyacinthe ......... 11 11 – 11 – 9 2 – – –
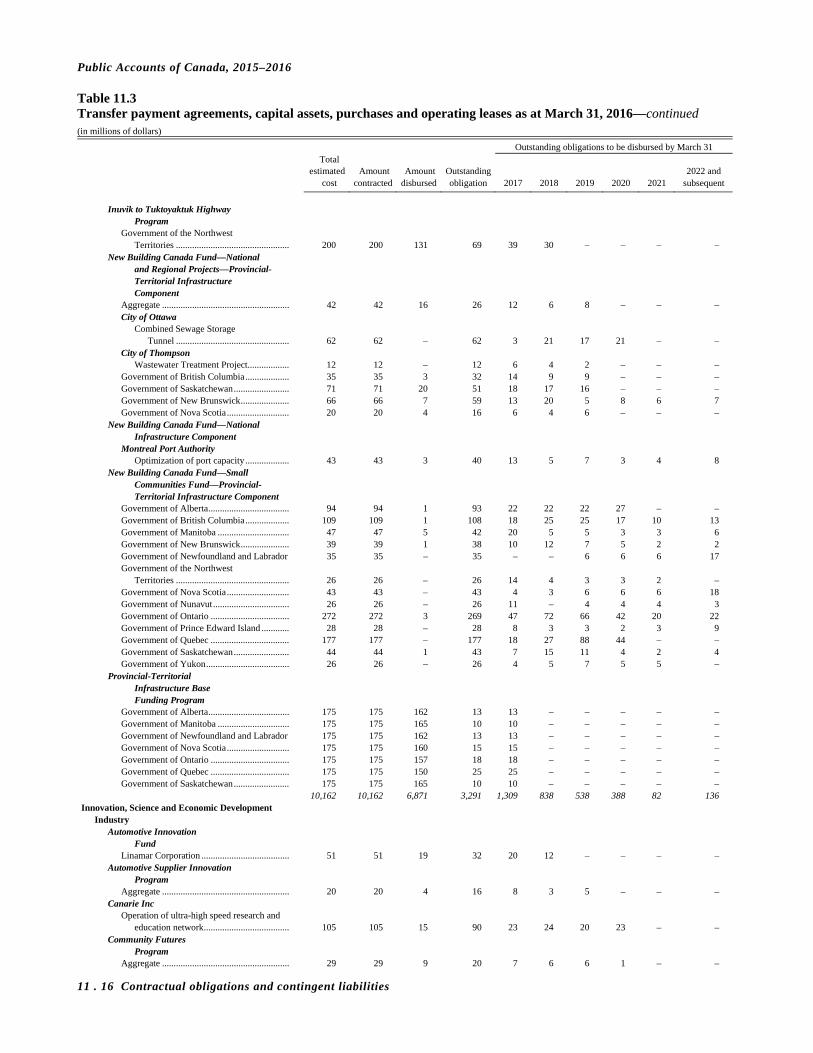
Public Accounts of Canada, 2015–2016
11 . 16 Contractual obligations and contingent liabilities
Table 11.3 Transfer payment agreements, capital assets, purchases and operating leases as at March 31, 2016—continued (in millions of dollars)
Outstanding obligations to be disbursed by March 31 Total estimated Amount Amount Outstanding 2022 and cost contracted disbursed obligation 2017 2018 2019 2020 2021 subsequent
Inuvik to Tuktoyaktuk Highway
Program Government of the Northwest
Territories ................................................. 200 200 131 69 39 30 – – – – New Building Canada Fund—National
and Regional Projects—Provincial- Territorial Infrastructure Component
Aggregate ....................................................... 42 42 16 26 12 6 8 – – – City of Ottawa
Combined Sewage Storage Tunnel ................................................. 62 62 – 62 3 21 17 21 – –
City of Thompson Wastewater Treatment Project.................. 12 12 – 12 6 4 2 – – –
Government of British Columbia ................... 35 35 3 32 14 9 9 – – – Government of Saskatchewan ........................ 71 71 20 51 18 17 16 – – – Government of New Brunswick ..................... 66 66 7 59 13 20 5 8 6 7 Government of Nova Scotia ........................... 20 20 4 16 6 4 6 – – –
New Building Canada Fund—National Infrastructure Component
Montreal Port Authority Optimization of port capacity ................... 43 43 3 40 13 5 7 3 4 8
New Building Canada Fund—Small Communities Fund—Provincial- Territorial Infrastructure Component
Government of Alberta ................................... 94 94 1 93 22 22 22 27 – – Government of British Columbia ................... 109 109 1 108 18 25 25 17 10 13 Government of Manitoba ............................... 47 47 5 42 20 5 5 3 3 6 Government of New Brunswick ..................... 39 39 1 38 10 12 7 5 2 2 Government of Newfoundland and Labrador 35 35 – 35 – – 6 6 6 17 Government of the Northwest
Territories ................................................. 26 26 – 26 14 4 3 3 2 – Government of Nova Scotia ........................... 43 43 – 43 4 3 6 6 6 18 Government of Nunavut ................................. 26 26 – 26 11 – 4 4 4 3 Government of Ontario .................................. 272 272 3 269 47 72 66 42 20 22 Government of Prince Edward Island ............ 28 28 – 28 8 3 3 2 3 9 Government of Quebec .................................. 177 177 – 177 18 27 88 44 – – Government of Saskatchewan ........................ 44 44 1 43 7 15 11 4 2 4 Government of Yukon .................................... 26 26 – 26 4 5 7 5 5 –
Provincial-Territorial Infrastructure Base Funding Program
Government of Alberta ................................... 175 175 162 13 13 – – – – – Government of Manitoba ............................... 175 175 165 10 10 – – – – – Government of Newfoundland and Labrador 175 175 162 13 13 – – – – – Government of Nova Scotia ........................... 175 175 160 15 15 – – – – – Government of Ontario .................................. 175 175 157 18 18 – – – – – Government of Quebec .................................. 175 175 150 25 25 – – – – – Government of Saskatchewan ........................ 175 175 165 10 10 – – – – – 10,162 10,162 6,871 3,291 1,309 838 538 388 82 136
Innovation, Science and Economic Development Industry
Automotive Innovation Fund
Linamar Corporation ...................................... 51 51 19 32 20 12 – – – – Automotive Supplier Innovation
Program Aggregate ....................................................... 20 20 4 16 8 3 5 – – –
Canarie Inc Operation of ultra-high speed research and
education network ..................................... 105 105 15 90 23 24 20 23 – – Community Futures
Program Aggregate ....................................................... 29 29 9 20 7 6 6 1 – –

Public Accounts of Canada, 2015–2016
Contractual obligations and contingent liabilities 11 . 17
Table 11.3 Transfer payment agreements, capital assets, purchases and operating leases as at March 31, 2016—continued (in millions of dollars)
Outstanding obligations to be disbursed by March 31 Total estimated Amount Amount Outstanding 2022 and cost contracted disbursed obligation 2017 2018 2019 2020 2021 subsequent
Connecting Canadians Program
Aggregate ....................................................... 88 88 27 61 48 11 2 – – – TELUS Communications Inc ......................... 24 24 4 20 11 8 1 – – –
Council of Canadian Academies Produce science-based, expert, objective
assessments of the current state of knowledge ................................................. 15 15 2 13 3 3 3 4 – –
Let's Talk Science Promote youth engagement in science,
technology, engineering and math .......................................................... 13 13 2 11 3 3 3 2 – –
Miltacs Inc Delivery of industrial research and
development internships ........................... 53 53 36 17 12 5 – – – – Northern Ontario Development
Program Aggregate ....................................................... 93 93 48 45 33 10 2 – – –
Perimeter Institute for Theoretical Physics
Research, training and education in theoretical physics .................................... 50 50 40 10 10 – – – – –
Strategic Aerospace and Defence Initiative
Aggregate ....................................................... 87 87 56 31 17 11 2 1 – – CAE Inc .......................................................... 250 250 110 140 52 51 37 – – – Héroux-Devtek Inc ......................................... 49 49 24 25 25 – – – – – Magellan Aerospace Limited ......................... 43 43 26 17 9 8 – – – – Wescam Inc .................................................... 75 75 13 62 15 15 16 16 – –
Technology Demonstration Program
Bombardier Inc ............................................... 54 54 – 54 10 13 13 10 8 – Consortium for Aerospace Research
and Innovation in Canada ......................... 30 30 10 20 8 6 6 – – – MDA Systems Ltd .......................................... 54 54 8 46 13 14 8 7 4 –
Economic Development Agency of Canada for the Regions of Quebec
Economic Development of Quebec Program
Gaz Métro Limited Partnership ...................... 21 21 1 20 20 – – – – – Montréal International .................................... 41 41 25 16 4 3 2 2 5 – Small and medium-sized enterprises (SME),
SME groups and associations and non-profit organizations ........................... 887 887 715 172 111 54 6 1 – –
Société du Parc Jean-Drapeau ........................ 62 62 5 57 6 6 6 6 6 27 Federal Economic Development Agency for
Southern Ontario Advanced Manufacturing Fund
Aggregate ....................................................... 44 44 21 23 11 6 6 – – – Centre for Commercialization of
Regenerative Medicine ............................. 20 20 1 19 7 7 5 – – – Essar Steel Algoma Incorporated ................... 30 30 1 29 8 13 8 – – –
Community Futures Program
Aggregate ....................................................... 26 26 14 12 7 3 2 – – – Eastern Ontario Development
Program Aggregate ....................................................... 38 38 15 23 8 7 8 – – –
Southern Ontario Prosperity Initiative
Aggregate ....................................................... 197 197 83 114 55 36 23 – – – Canadian Manufacturers and Exporters ......... 20 20 7 13 11 2 – – – –
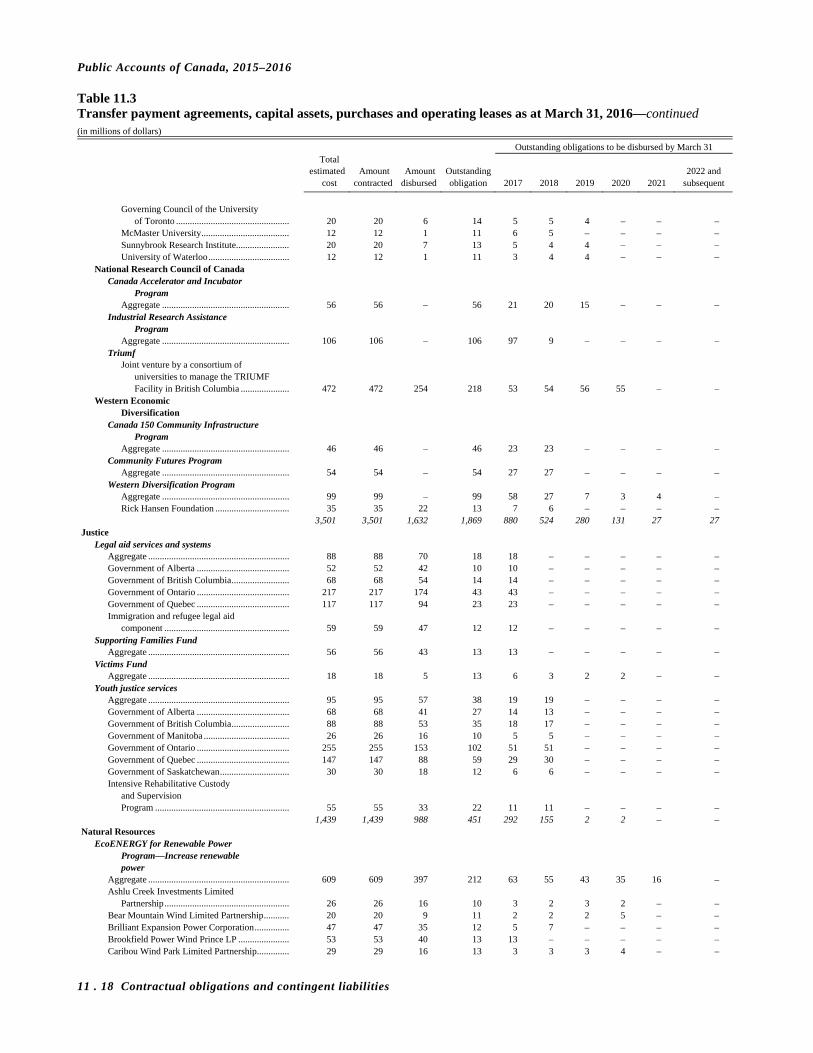
Public Accounts of Canada, 2015–2016
11 . 18 Contractual obligations and contingent liabilities
Table 11.3 Transfer payment agreements, capital assets, purchases and operating leases as at March 31, 2016—continued (in millions of dollars)
Outstanding obligations to be disbursed by March 31 Total estimated Amount Amount Outstanding 2022 and cost contracted disbursed obligation 2017 2018 2019 2020 2021 subsequent
Governing Council of the University
of Toronto ................................................. 20 20 6 14 5 5 4 – – – McMaster University ...................................... 12 12 1 11 6 5 – – – – Sunnybrook Research Institute ....................... 20 20 7 13 5 4 4 – – – University of Waterloo ................................... 12 12 1 11 3 4 4 – – –
National Research Council of Canada Canada Accelerator and Incubator
Program Aggregate ....................................................... 56 56 – 56 21 20 15 – – –
Industrial Research Assistance Program
Aggregate ....................................................... 106 106 – 106 97 9 – – – – Triumf
Joint venture by a consortium of universities to manage the TRIUMF Facility in British Columbia ..................... 472 472 254 218 53 54 56 55 – –
Western Economic Diversification
Canada 150 Community Infrastructure Program
Aggregate ....................................................... 46 46 – 46 23 23 – – – – Community Futures Program
Aggregate ....................................................... 54 54 – 54 27 27 – – – – Western Diversification Program
Aggregate ....................................................... 99 99 – 99 58 27 7 3 4 – Rick Hansen Foundation ................................ 35 35 22 13 7 6 – – – –
3,501 3,501 1,632 1,869 880 524 280 131 27 27 Justice
Legal aid services and systems Aggregate ............................................................. 88 88 70 18 18 – – – – – Government of Alberta ........................................ 52 52 42 10 10 – – – – – Government of British Columbia ......................... 68 68 54 14 14 – – – – – Government of Ontario ........................................ 217 217 174 43 43 – – – – – Government of Quebec ........................................ 117 117 94 23 23 – – – – – Immigration and refugee legal aid
component ...................................................... 59 59 47 12 12 – – – – – Supporting Families Fund
Aggregate ............................................................. 56 56 43 13 13 – – – – – Victims Fund
Aggregate ............................................................. 18 18 5 13 6 3 2 2 – – Youth justice services
Aggregate ............................................................. 95 95 57 38 19 19 – – – – Government of Alberta ........................................ 68 68 41 27 14 13 – – – – Government of British Columbia ......................... 88 88 53 35 18 17 – – – – Government of Manitoba ..................................... 26 26 16 10 5 5 – – – – Government of Ontario ........................................ 255 255 153 102 51 51 – – – – Government of Quebec ........................................ 147 147 88 59 29 30 – – – – Government of Saskatchewan .............................. 30 30 18 12 6 6 – – – – Intensive Rehabilitative Custody
and Supervision Program .......................................................... 55 55 33 22 11 11 – – – –
1,439 1,439 988 451 292 155 2 2 – – Natural Resources
EcoENERGY for Renewable Power Program—Increase renewable power
Aggregate ............................................................. 609 609 397 212 63 55 43 35 16 – Ashlu Creek Investments Limited
Partnership ...................................................... 26 26 16 10 3 2 3 2 – – Bear Mountain Wind Limited Partnership ........... 20 20 9 11 2 2 2 5 – – Brilliant Expansion Power Corporation ............... 47 47 35 12 5 7 – – – – Brookfield Power Wind Prince LP ...................... 53 53 40 13 13 – – – – – Caribou Wind Park Limited Partnership .............. 29 29 16 13 3 3 3 4 – –

Public Accounts of Canada, 2015–2016
Contractual obligations and contingent liabilities 11 . 19
Table 11.3 Transfer payment agreements, capital assets, purchases and operating leases as at March 31, 2016—continued (in millions of dollars)
Outstanding obligations to be disbursed by March 31 Total estimated Amount Amount Outstanding 2022 and cost contracted disbursed obligation 2017 2018 2019 2020 2021 subsequent
Castle Rock Ridge Limited Partnership ............... 23 23 8 15 2 2 2 2 2 5 Dokie General Partnership ................................... 33 33 16 17 3 4 3 3 4 – Enbridge Ontario Wind Power LP ....................... 48 48 33 15 5 5 5 – – – Ghost Pine Windfarm LP ..................................... 21 21 11 10 2 2 2 2 2 – Harrison Hydro Limited Partnership (1 of 2) ...... 35 35 21 14 3 4 4 3 – – Harrison Hydro Limited Partnership (2 of 2) ...... 25 25 13 12 3 2 3 2 2 – Kruger Energy Chatham LP ................................. 31 31 16 15 3 3 3 3 3 – Melancthon Wolfe Wind LP ................................ 49 49 33 16 5 5 5 1 – – Mont Louis Wind LP ........................................... 31 31 15 16 3 3 3 3 4 – Saint-Ulric Saint-Léandre Wind LP ..................... 32 32 21 11 3 3 3 2 – – St Joseph WindFarm Inc ...................................... 42 42 21 21 4 4 5 4 4 – Talbot Windfarm LP ............................................ 30 30 14 16 3 3 3 3 4 – Terraform IWG Ontario Holdings, LLC .............. 24 24 12 12 2 3 2 3 2 – Toba Montrose General Partnership .................... 73 73 37 36 7 7 8 7 7 – Western Sustainable Power Inc ........................... 21 21 10 11 2 2 2 2 3 – Weyerhaeuser Company Limited ......................... 33 33 17 16 3 3 4 3 3 –
Forest Innovation Program—Investing in Canada's Forest Sector
FPInnovations ...................................................... 19 19 – 19 19 – – – – – Wind Power Production
Incentive Aggregate ............................................................. 76 76 65 11 11 – – – – –
1,430 1,430 876 554 172 124 108 89 56 5 Public Safety and Emergency Preparedness
Department Financial Assistance Agreement,
Lac-Mégantic Government of Quebec .................................. 120 120 82 38 38 – – – – –
First Nations Policing Program
Aggregate ....................................................... 118 118 58 60 30 30 – – – – Anishinabek Police Service ............................ 17 17 6 11 6 5 – – – – Cree Regional Authority ................................ 35 35 17 18 9 9 – – – – Kativik Regional Government ....................... 36 36 18 18 9 9 – – – – Nishnawbe-Aski Police Service ..................... 38 38 13 25 13 12 – – – – Treaty Three Police Service Board ................ 27 27 13 14 7 7 – – – –
Safer Communities Initiative Aggregate ....................................................... 133 133 46 87 28 28 20 10 1 –
Royal Canadian Mounted Police Canadian Firearms Program
Aggregate ....................................................... 60 60 46 14 14 – – – – – 584 584 299 285 154 100 20 10 1 – Transport
Airports Capital Assistance Program
Aggregate ............................................................. 40 40 5 35 26 9 – – – – Développement Aéroport Saint-Hubert
de Longueil ..................................................... 17 17 – 17 12 5 – – – – Asia-Pacific Gateway and Corridor
Transportation Infrastructure Fund
Aggregate ............................................................. 137 137 108 29 28 1 – – – – Gateways and Border Crossings
Fund Aéroport de Québec Inc ....................................... 29 29 6 23 9 14 – – – – Government of Manitoba ..................................... 51 51 27 24 8 12 3 1 – – Government of Ontario ........................................ 764 764 625 139 139 – – – – – Saint Mary's River Bridge Company ................... 52 52 29 23 15 8 – – – – Trois-Rivières Port Authority .............................. 16 16 2 14 10 4 – – – –
Outaouais Roads Development Quebec Ministry of Transportation ...................... 175 175 142 33 1 2 4 1 25 –
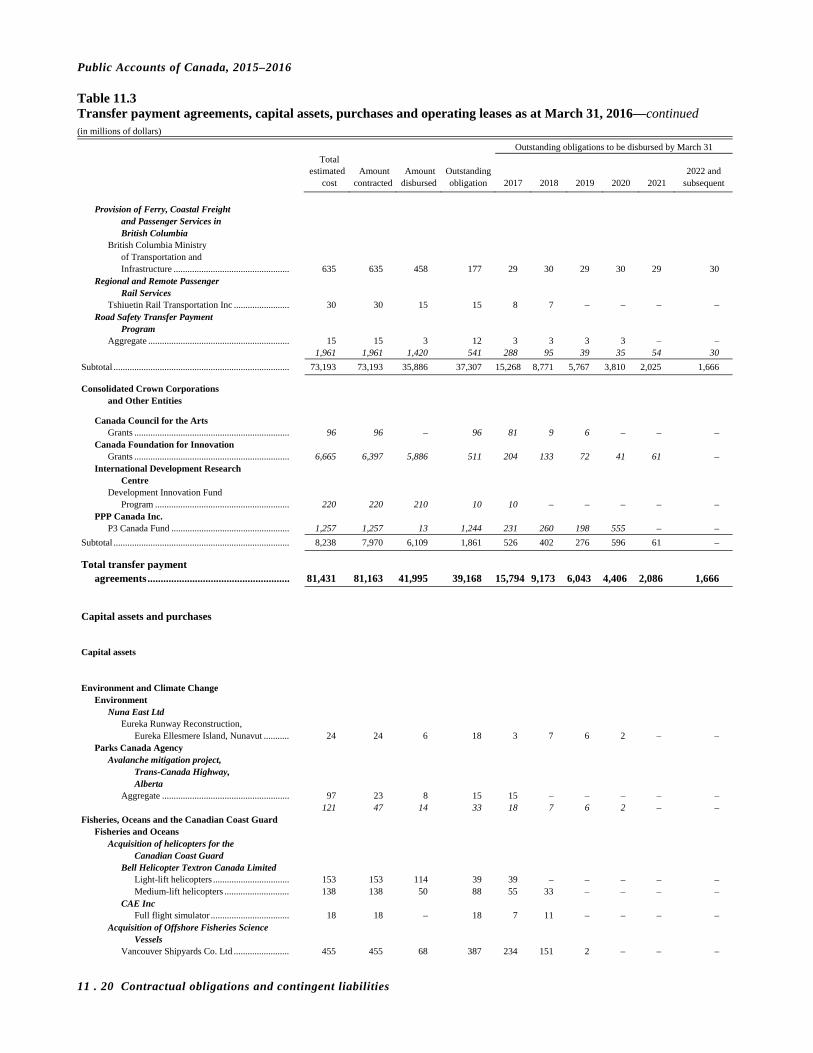
Public Accounts of Canada, 2015–2016
11 . 20 Contractual obligations and contingent liabilities
Table 11.3 Transfer payment agreements, capital assets, purchases and operating leases as at March 31, 2016—continued (in millions of dollars)
Outstanding obligations to be disbursed by March 31 Total estimated Amount Amount Outstanding 2022 and cost contracted disbursed obligation 2017 2018 2019 2020 2021 subsequent
Provision of Ferry, Coastal Freight
and Passenger Services in British Columbia
British Columbia Ministry of Transportation and Infrastructure .................................................. 635 635 458 177 29 30 29 30 29 30
Regional and Remote Passenger Rail Services
Tshiuetin Rail Transportation Inc ........................ 30 30 15 15 8 7 – – – – Road Safety Transfer Payment
Program Aggregate ............................................................. 15 15 3 12 3 3 3 3 – –
1,961 1,961 1,420 541 288 95 39 35 54 30
Subtotal ............................................................................ 73,193 73,193 35,886 37,307 15,268 8,771 5,767 3,810 2,025 1,666
Consolidated Crown Corporations and Other Entities
Canada Council for the Arts Grants ................................................................... 96 96 – 96 81 9 6 – – –
Canada Foundation for Innovation Grants ................................................................... 6,665 6,397 5,886 511 204 133 72 41 61 –
International Development Research Centre
Development Innovation Fund Program .......................................................... 220 220 210 10 10 – – – – –
PPP Canada Inc. P3 Canada Fund ................................................... 1,257 1,257 13 1,244 231 260 198 555 – –
Subtotal ............................................................................ 8,238 7,970 6,109 1,861 526 402 276 596 61 –
Total transfer payment
agreements ...................................................... 81,431 81,163 41,995 39,168 15,794 9,173 6,043 4,406 2,086 1,666 Capital assets and purchases Capital assets Environment and Climate Change
Environment Nuna East Ltd
Eureka Runway Reconstruction, Eureka Ellesmere Island, Nunavut ........... 24 24 6 18 3 7 6 2 – –
Parks Canada Agency Avalanche mitigation project,
Trans-Canada Highway, Alberta
Aggregate ....................................................... 97 23 8 15 15 – – – – – 121 47 14 33 18 7 6 2 – – Fisheries, Oceans and the Canadian Coast Guard
Fisheries and Oceans Acquisition of helicopters for the
Canadian Coast Guard Bell Helicopter Textron Canada Limited
Light-lift helicopters ................................. 153 153 114 39 39 – – – – – Medium-lift helicopters ............................ 138 138 50 88 55 33 – – – –
CAE Inc Full flight simulator .................................. 18 18 – 18 7 11 – – – –
Acquisition of Offshore Fisheries Science Vessels
Vancouver Shipyards Co. Ltd ........................ 455 455 68 387 234 151 2 – – –

Public Accounts of Canada, 2015–2016
Contractual obligations and contingent liabilities 11 . 21
Table 11.3 Transfer payment agreements, capital assets, purchases and operating leases as at March 31, 2016—continued (in millions of dollars)
Outstanding obligations to be disbursed by March 31 Total estimated Amount Amount Outstanding 2022 and cost contracted disbursed obligation 2017 2018 2019 2020 2021 subsequent
Procurement of fifteen Canadian
Coast Guard Search and Rescue Lifeboats
Chantier Naval Forillon Inc ............................ 40 40 2 38 16 20 2 – – – Hike Metal Products Ltd ................................ 38 38 3 35 15 17 3 – – –
842 842 237 605 366 232 7 – – – Infrastructure and Communities
Office of Infrastructure of Canada Signature on the St. Lawrence Group
New bridge for the St. Lawrence corridor Project1 ...................................................... 2,542 2,542 575 1,967 2 501 701 513 29 221
Innovation, Science and Economic Development Canadian Space Agency
RADARSAT Constellation Mission Aggregate ....................................................... 6 6 4 2 2 – – – – – MacDonald, Dettwiler and Associates Ltd .... 983 983 724 259 133 58 64 4 – –
989 989 728 261 135 58 64 4 – – National Defence
Aecon / SNC-Lavalin Construction (Atlantic) in Joint Venture
Consolidate training and support facilities, Canadian Forces Base, Halifax, Esquimalt, Nanisivik......................................................... 83 83 62 21 20 1 – – – –
Almiq Contracting Ltd Arctic/Offshore Patrol Ships Project,
design and construct naval facility ............................................................. 66 58 28 30 25 5 – – – –
Boeing, Ridley Park, Pennsylvania 15 Medium to Heavy Lift
Helicopters (Chinooks)................................... 1,273 1,273 1,235 38 31 7 – – – – CAE Inc
Aircrew operational training services in support of the CC-130J and CH147F aircrafts ............................................ 305 304 280 24 24 – – – – –
Dexter Construction Company Limited Replace jetty and dockyard,
Halifax ............................................................ 132 83 10 73 46 27 – – – – DEW Engineering and Development ULC
CBRN decontamination system ........................... 22 21 4 17 8 8 1 – – – EADS Deutschland GBMH, Ulm, Germany
Area Surveillance and Secondary Surveillance Radar ......................................... 68 67 27 40 27 13 – – – –
EllisDon Kinetic—Joint Venture Design and construct maintenance
facility, CFB Esquimalt, British Columbia ............................................ 210 206 114 92 59 33 – – – –
FFG Flensburger Fahrzeugbau Gesellschaft mbH, Flensburg, Germany
Armoured engineer vehicles ................................ 180 180 75 105 60 45 – – – – General Dynamics Canada Ltd
CP-140 Aurora Data Management System Project ................................................ 618 618 401 217 55 56 69 28 9 –
Design and build of Mercury Global Anchor Stations .............................................. 59 59 8 51 11 33 7 – – –
Joint Information and Intelligence Fusion Compatibility Data Mediation Interface ........ 16 16 4 12 5 4 3 – – –
Land Command Support System Engineering and Integration Long Term Support Contract ............................................. 750 669 633 36 36 – – – – –
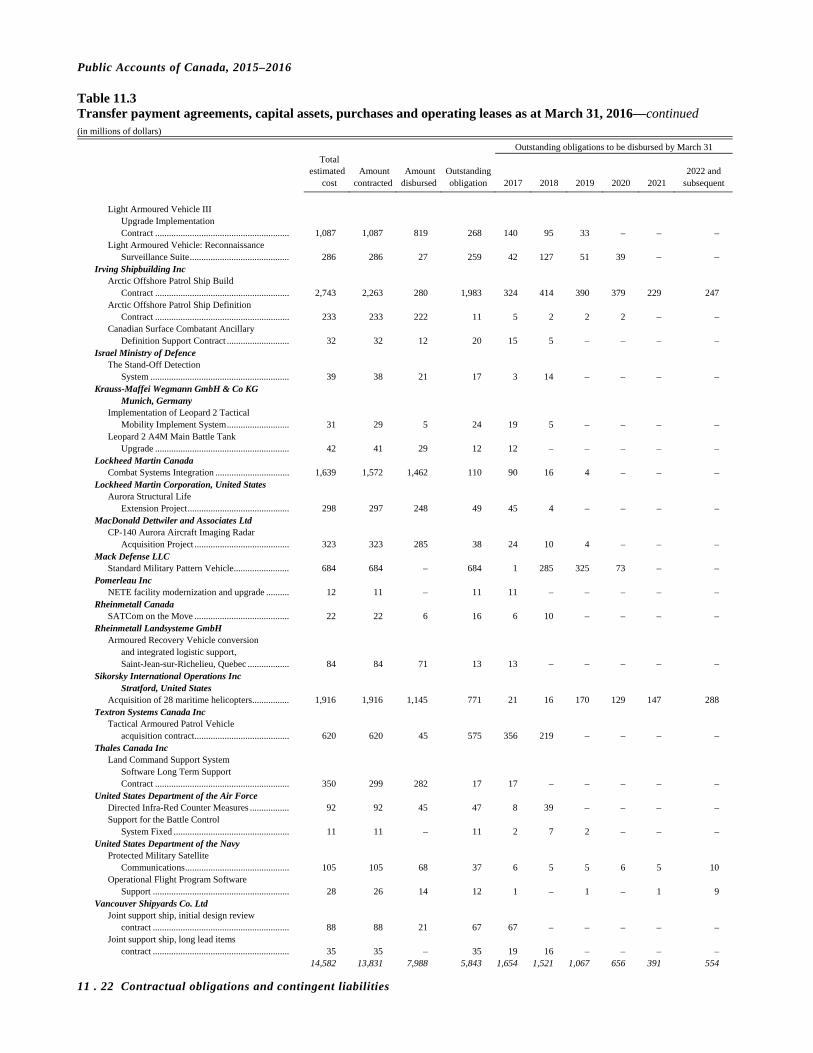
Public Accounts of Canada, 2015–2016
11 . 22 Contractual obligations and contingent liabilities
Table 11.3 Transfer payment agreements, capital assets, purchases and operating leases as at March 31, 2016—continued (in millions of dollars)
Outstanding obligations to be disbursed by March 31 Total estimated Amount Amount Outstanding 2022 and cost contracted disbursed obligation 2017 2018 2019 2020 2021 subsequent
Light Armoured Vehicle III
Upgrade Implementation Contract .......................................................... 1,087 1,087 819 268 140 95 33 – – –
Light Armoured Vehicle: Reconnaissance Surveillance Suite ........................................... 286 286 27 259 42 127 51 39 – –
Irving Shipbuilding Inc Arctic Offshore Patrol Ship Build
Contract .......................................................... 2,743 2,263 280 1,983 324 414 390 379 229 247 Arctic Offshore Patrol Ship Definition
Contract .......................................................... 233 233 222 11 5 2 2 2 – – Canadian Surface Combatant Ancillary
Definition Support Contract ........................... 32 32 12 20 15 5 – – – – Israel Ministry of Defence
The Stand-Off Detection System ............................................................ 39 38 21 17 3 14 – – – –
Krauss-Maffei Wegmann GmbH & Co KG Munich, Germany
Implementation of Leopard 2 Tactical Mobility Implement System ........................... 31 29 5 24 19 5 – – – –
Leopard 2 A4M Main Battle Tank Upgrade .......................................................... 42 41 29 12 12 – – – – –
Lockheed Martin Canada Combat Systems Integration ................................ 1,639 1,572 1,462 110 90 16 4 – – –
Lockheed Martin Corporation, United States Aurora Structural Life
Extension Project ............................................ 298 297 248 49 45 4 – – – – MacDonald Dettwiler and Associates Ltd
CP-140 Aurora Aircraft Imaging Radar Acquisition Project ......................................... 323 323 285 38 24 10 4 – – –
Mack Defense LLC Standard Military Pattern Vehicle ........................ 684 684 – 684 1 285 325 73 – –
Pomerleau Inc NETE facility modernization and upgrade .......... 12 11 – 11 11 – – – – –
Rheinmetall Canada SATCom on the Move ......................................... 22 22 6 16 6 10 – – – –
Rheinmetall Landsysteme GmbH Armoured Recovery Vehicle conversion
and integrated logistic support, Saint-Jean-sur-Richelieu, Quebec .................. 84 84 71 13 13 – – – – –
Sikorsky International Operations Inc Stratford, United States
Acquisition of 28 maritime helicopters ................ 1,916 1,916 1,145 771 21 16 170 129 147 288 Textron Systems Canada Inc
Tactical Armoured Patrol Vehicle acquisition contract ......................................... 620 620 45 575 356 219 – – – –
Thales Canada Inc Land Command Support System
Software Long Term Support Contract .......................................................... 350 299 282 17 17 – – – – –
United States Department of the Air Force Directed Infra-Red Counter Measures ................. 92 92 45 47 8 39 – – – – Support for the Battle Control
System Fixed .................................................. 11 11 – 11 2 7 2 – – – United States Department of the Navy
Protected Military Satellite Communications ............................................. 105 105 68 37 6 5 5 6 5 10
Operational Flight Program Software Support ........................................................... 28 26 14 12 1 – 1 – 1 9
Vancouver Shipyards Co. Ltd Joint support ship, initial design review
contract ........................................................... 88 88 21 67 67 – – – – – Joint support ship, long lead items
contract ........................................................... 35 35 – 35 19 16 – – – – 14,582 13,831 7,988 5,843 1,654 1,521 1,067 656 391 554

Public Accounts of Canada, 2015–2016
Contractual obligations and contingent liabilities 11 . 23
Table 11.3 Transfer payment agreements, capital assets, purchases and operating leases as at March 31, 2016—continued (in millions of dollars)
Outstanding obligations to be disbursed by March 31 Total estimated Amount Amount Outstanding 2022 and cost contracted disbursed obligation 2017 2018 2019 2020 2021 subsequent
Public Services and Procurement
Public Works and Government Services 8424934 Canada Inc
Public Service Pay Centre lease, Miramichi, New Brunswick2 .................... 64 64 – 64 – 1 2 3 3 55
Cobalt Construction Inc North Alaska Highway, reconstruction
services, British Columbia ........................ 13 13 1 12 12 – – – – – Construction Demathieu & Bard Inc
Latchford dam replacement, Ontario ............. 27 27 15 12 12 – – – – – EllisDon Corporation
Canadian High Arctic Research Station (CHARS), Cambridge Bay, Nunavut ......................... 128 128 70 58 38 20 – – – –
Government Conference Centre, Ottawa, Ontario
Aggregate ....................................................... 138 30 22 8 5 3 – – – – PCL Constructors Canada Inc ........................ 132 132 33 99 39 60 – – – –
Pomerleau Inc Reconstruction of the Voltigeurs de Québec
Armoury .................................................... 64 64 16 48 28 20 – – – – Postal Station B Envelope Rehabilitation
Project Aggregate ....................................................... 19 9 4 5 4 1 – – – – EllisDon Corporation ..................................... 30 30 – 30 13 17 – – – –
Scansa Construction Ltd Esquimalt Graving Dock,
electrical upgrade ...................................... 18 18 6 12 12 – – – – – Société d'habitation et de développement
de Montréal National Film Board of Canada lease,
Quartier des spectacles, Montréal, Quebec2 .................................... 65 65 – 65 – – 3 3 3 56
Transformation of Pay Administration Aggregate ....................................................... 16 16 15 1 1 – – – – – IBM Canada Ltd ............................................. 135 127 110 17 17 – – – – –
Visitor Welcome Centre, Ottawa, Ontario .............................................. 130 78 34 44 32 12 – – – –
Wellington Building Renovation, Ottawa, Ontario .............................................. 425 399 381 18 16 2 – – – –
West Block Program, Ottawa, Ontario .............................................. 1,171 961 745 216 173 40 3 – – –
Wright Construction Western Inc Semiarid Prairie Agricultural Research
Centre Research, Saskatchewan ............................................ 28 28 5 23 13 10 – – – –
2,603 2,189 1,457 732 415 186 8 6 6 111
Subtotal ............................................................................ 21,679 20,440 10,999 9,441 2,590 2,505 1,853 1,181 426 886
Consolidated Crown Corporations and Other Entities
Canadian Air Transport Security Authority
Aéroports de Montréal ......................................... 19 19 3 16 16 – – – – – Greater Toronto Airports Authority ..................... 80 80 44 36 33 3 – – – – The Calgary Airport Authority ............................ 14 14 2 12 3 4 5 – – – Vancouver International Airport Authority ......... 114 114 47 67 5 20 25 17 – –
227 227 96 131 57 27 30 17 – – Canada Science and Technology Museum
Corporation Pomerleau ............................................................. 80 32 7 25 25 – – – – –
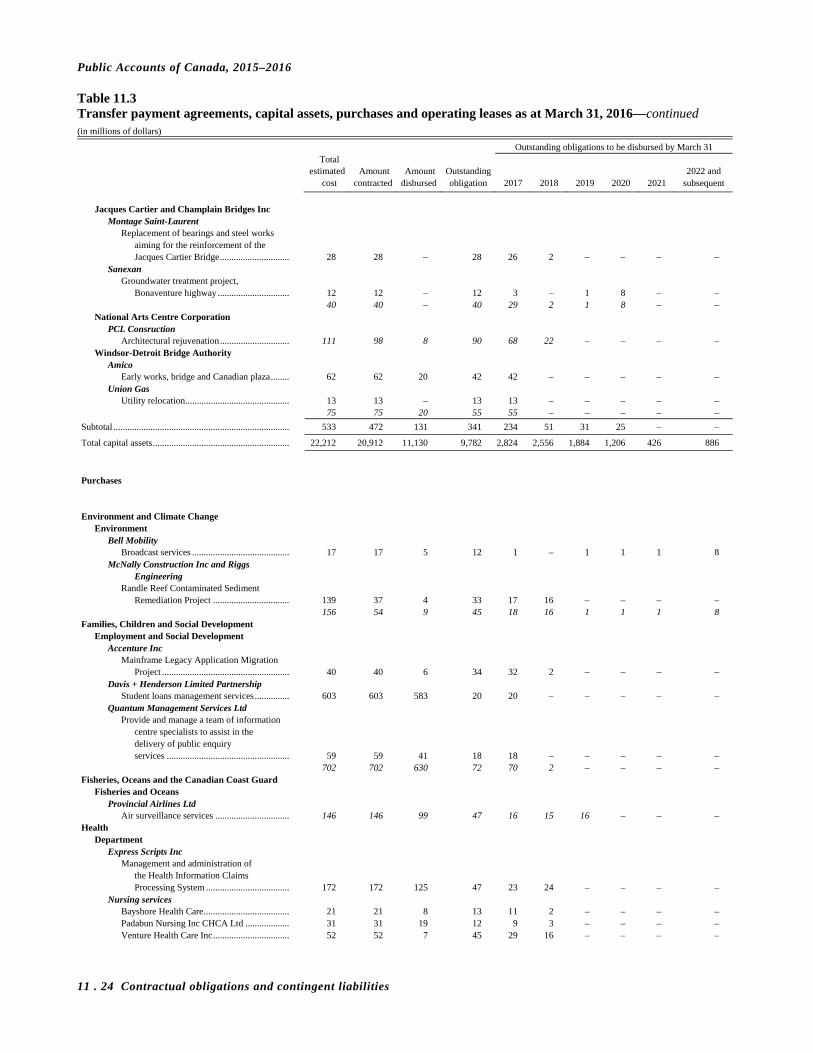
Public Accounts of Canada, 2015–2016
11 . 24 Contractual obligations and contingent liabilities
Table 11.3 Transfer payment agreements, capital assets, purchases and operating leases as at March 31, 2016—continued (in millions of dollars)
Outstanding obligations to be disbursed by March 31 Total estimated Amount Amount Outstanding 2022 and cost contracted disbursed obligation 2017 2018 2019 2020 2021 subsequent
Jacques Cartier and Champlain Bridges Inc
Montage Saint-Laurent Replacement of bearings and steel works
aiming for the reinforcement of the Jacques Cartier Bridge .............................. 28 28 – 28 26 2 – – – –
Sanexan Groundwater treatment project,
Bonaventure highway ............................... 12 12 – 12 3 – 1 8 – – 40 40 – 40 29 2 1 8 – –
National Arts Centre Corporation PCL Consruction
Architectural rejuvenation .............................. 111 98 8 90 68 22 – – – – Windsor-Detroit Bridge Authority
Amico Early works, bridge and Canadian plaza ........ 62 62 20 42 42 – – – – –
Union Gas Utility relocation ............................................. 13 13 – 13 13 – – – – –
75 75 20 55 55 – – – – –
Subtotal ............................................................................ 533 472 131 341 234 51 31 25 – –
Total capital assets ........................................................... 22,212 20,912 11,130 9,782 2,824 2,556 1,884 1,206 426 886
Purchases Environment and Climate Change
Environment Bell Mobility
Broadcast services .......................................... 17 17 5 12 1 – 1 1 1 8 McNally Construction Inc and Riggs
Engineering Randle Reef Contaminated Sediment
Remediation Project ................................. 139 37 4 33 17 16 – – – – 156 54 9 45 18 16 1 1 1 8
Families, Children and Social Development Employment and Social Development
Accenture Inc Mainframe Legacy Application Migration
Project ....................................................... 40 40 6 34 32 2 – – – – Davis + Henderson Limited Partnership
Student loans management services ............... 603 603 583 20 20 – – – – – Quantum Management Services Ltd
Provide and manage a team of information centre specialists to assist in the delivery of public enquiry services ..................................................... 59 59 41 18 18 – – – – –
702 702 630 72 70 2 – – – – Fisheries, Oceans and the Canadian Coast Guard
Fisheries and Oceans Provincial Airlines Ltd
Air surveillance services ................................ 146 146 99 47 16 15 16 – – – Health
Department Express Scripts Inc
Management and administration of the Health Information Claims Processing System .................................... 172 172 125 47 23 24 – – – –
Nursing services Bayshore Health Care ..................................... 21 21 8 13 11 2 – – – – Padabun Nursing Inc CHCA Ltd ................... 31 31 19 12 9 3 – – – – Venture Health Care Inc ................................. 52 52 7 45 29 16 – – – –
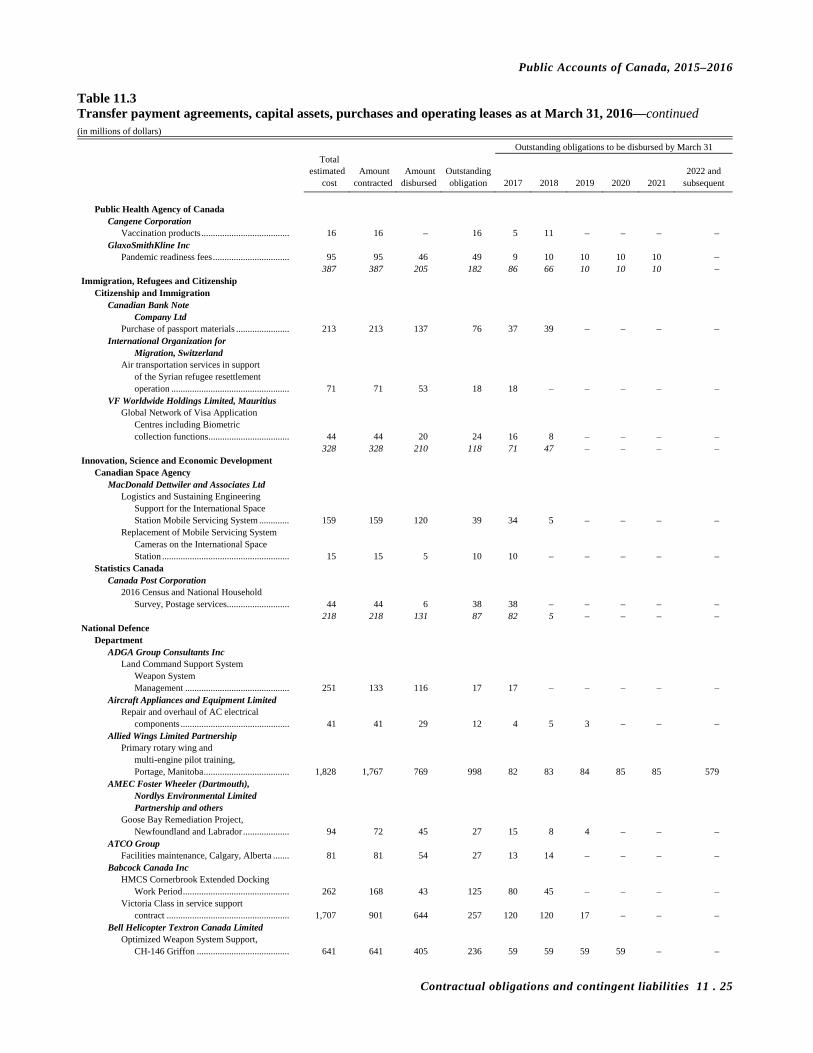
Public Accounts of Canada, 2015–2016
Contractual obligations and contingent liabilities 11 . 25
Table 11.3 Transfer payment agreements, capital assets, purchases and operating leases as at March 31, 2016—continued (in millions of dollars)
Outstanding obligations to be disbursed by March 31 Total estimated Amount Amount Outstanding 2022 and cost contracted disbursed obligation 2017 2018 2019 2020 2021 subsequent
Public Health Agency of Canada
Cangene Corporation Vaccination products ...................................... 16 16 – 16 5 11 – – – –
GlaxoSmithKline Inc Pandemic readiness fees ................................. 95 95 46 49 9 10 10 10 10 –
387 387 205 182 86 66 10 10 10 – Immigration, Refugees and Citizenship
Citizenship and Immigration Canadian Bank Note
Company Ltd Purchase of passport materials ....................... 213 213 137 76 37 39 – – – –
International Organization for Migration, Switzerland
Air transportation services in support of the Syrian refugee resettlement operation ................................................... 71 71 53 18 18 – – – – –
VF Worldwide Holdings Limited, Mauritius Global Network of Visa Application
Centres including Biometric collection functions ................................... 44 44 20 24 16 8 – – – –
328 328 210 118 71 47 – – – – Innovation, Science and Economic Development
Canadian Space Agency MacDonald Dettwiler and Associates Ltd
Logistics and Sustaining Engineering Support for the International Space Station Mobile Servicing System ............. 159 159 120 39 34 5 – – – –
Replacement of Mobile Servicing System Cameras on the International Space Station ....................................................... 15 15 5 10 10 – – – – –
Statistics Canada Canada Post Corporation
2016 Census and National Household Survey, Postage services........................... 44 44 6 38 38 – – – – – 218 218 131 87 82 5 – – – –
National Defence Department
ADGA Group Consultants Inc Land Command Support System
Weapon System Management ............................................. 251 133 116 17 17 – – – – –
Aircraft Appliances and Equipment Limited Repair and overhaul of AC electrical
components ............................................... 41 41 29 12 4 5 3 – – – Allied Wings Limited Partnership
Primary rotary wing and multi-engine pilot training, Portage, Manitoba ..................................... 1,828 1,767 769 998 82 83 84 85 85 579
AMEC Foster Wheeler (Dartmouth), Nordlys Environmental Limited Partnership and others
Goose Bay Remediation Project, Newfoundland and Labrador .................... 94 72 45 27 15 8 4 – – –
ATCO Group Facilities maintenance, Calgary, Alberta ....... 81 81 54 27 13 14 – – – –
Babcock Canada Inc HMCS Cornerbrook Extended Docking
Work Period .............................................. 262 168 43 125 80 45 – – – – Victoria Class in service support
contract ..................................................... 1,707 901 644 257 120 120 17 – – – Bell Helicopter Textron Canada Limited
Optimized Weapon System Support, CH-146 Griffon ........................................ 641 641 405 236 59 59 59 59 – –
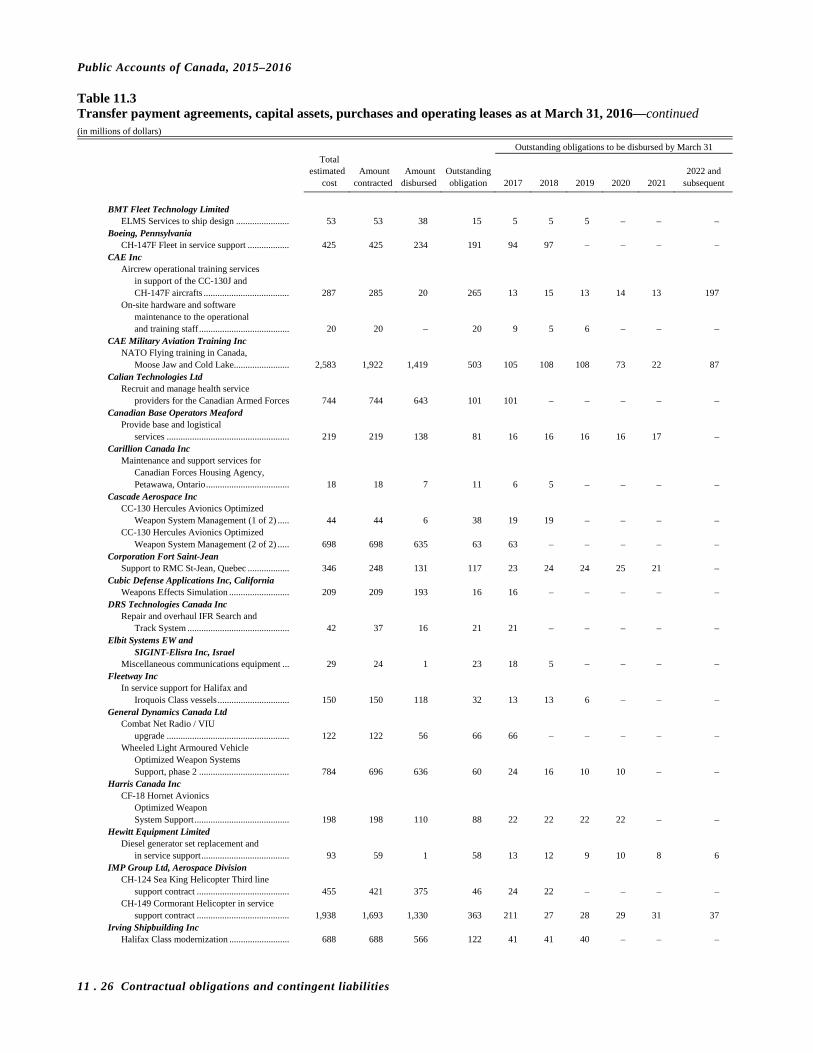
Public Accounts of Canada, 2015–2016
11 . 26 Contractual obligations and contingent liabilities
Table 11.3 Transfer payment agreements, capital assets, purchases and operating leases as at March 31, 2016—continued (in millions of dollars)
Outstanding obligations to be disbursed by March 31 Total estimated Amount Amount Outstanding 2022 and cost contracted disbursed obligation 2017 2018 2019 2020 2021 subsequent
BMT Fleet Technology Limited
ELMS Services to ship design ....................... 53 53 38 15 5 5 5 – – – Boeing, Pennsylvania
CH-147F Fleet in service support .................. 425 425 234 191 94 97 – – – – CAE Inc
Aircrew operational training services in support of the CC-130J and CH-147F aircrafts ..................................... 287 285 20 265 13 15 13 14 13 197
On-site hardware and software maintenance to the operational and training staff ....................................... 20 20 – 20 9 5 6 – – –
CAE Military Aviation Training Inc NATO Flying training in Canada,
Moose Jaw and Cold Lake........................ 2,583 1,922 1,419 503 105 108 108 73 22 87 Calian Technologies Ltd
Recruit and manage health service providers for the Canadian Armed Forces 744 744 643 101 101 – – – – –
Canadian Base Operators Meaford Provide base and logistical
services ..................................................... 219 219 138 81 16 16 16 16 17 – Carillion Canada Inc
Maintenance and support services for Canadian Forces Housing Agency, Petawawa, Ontario .................................... 18 18 7 11 6 5 – – – –
Cascade Aerospace Inc CC-130 Hercules Avionics Optimized
Weapon System Management (1 of 2) ..... 44 44 6 38 19 19 – – – – CC-130 Hercules Avionics Optimized
Weapon System Management (2 of 2) ..... 698 698 635 63 63 – – – – – Corporation Fort Saint-Jean
Support to RMC St-Jean, Quebec .................. 346 248 131 117 23 24 24 25 21 – Cubic Defense Applications Inc, California
Weapons Effects Simulation .......................... 209 209 193 16 16 – – – – – DRS Technologies Canada Inc
Repair and overhaul IFR Search and Track System ............................................ 42 37 16 21 21 – – – – –
Elbit Systems EW and SIGINT-Elisra Inc, Israel
Miscellaneous communications equipment ... 29 24 1 23 18 5 – – – – Fleetway Inc
In service support for Halifax and Iroquois Class vessels ............................... 150 150 118 32 13 13 6 – – –
General Dynamics Canada Ltd Combat Net Radio / VIU
upgrade ..................................................... 122 122 56 66 66 – – – – – Wheeled Light Armoured Vehicle
Optimized Weapon Systems Support, phase 2 ....................................... 784 696 636 60 24 16 10 10 – –
Harris Canada Inc CF-18 Hornet Avionics
Optimized Weapon System Support ......................................... 198 198 110 88 22 22 22 22 – –
Hewitt Equipment Limited Diesel generator set replacement and
in service support ...................................... 93 59 1 58 13 12 9 10 8 6 IMP Group Ltd, Aerospace Division
CH-124 Sea King Helicopter Third line support contract ........................................ 455 421 375 46 24 22 – – – –
CH-149 Cormorant Helicopter in service support contract ........................................ 1,938 1,693 1,330 363 211 27 28 29 31 37
Irving Shipbuilding Inc Halifax Class modernization .......................... 688 688 566 122 41 41 40 – – –
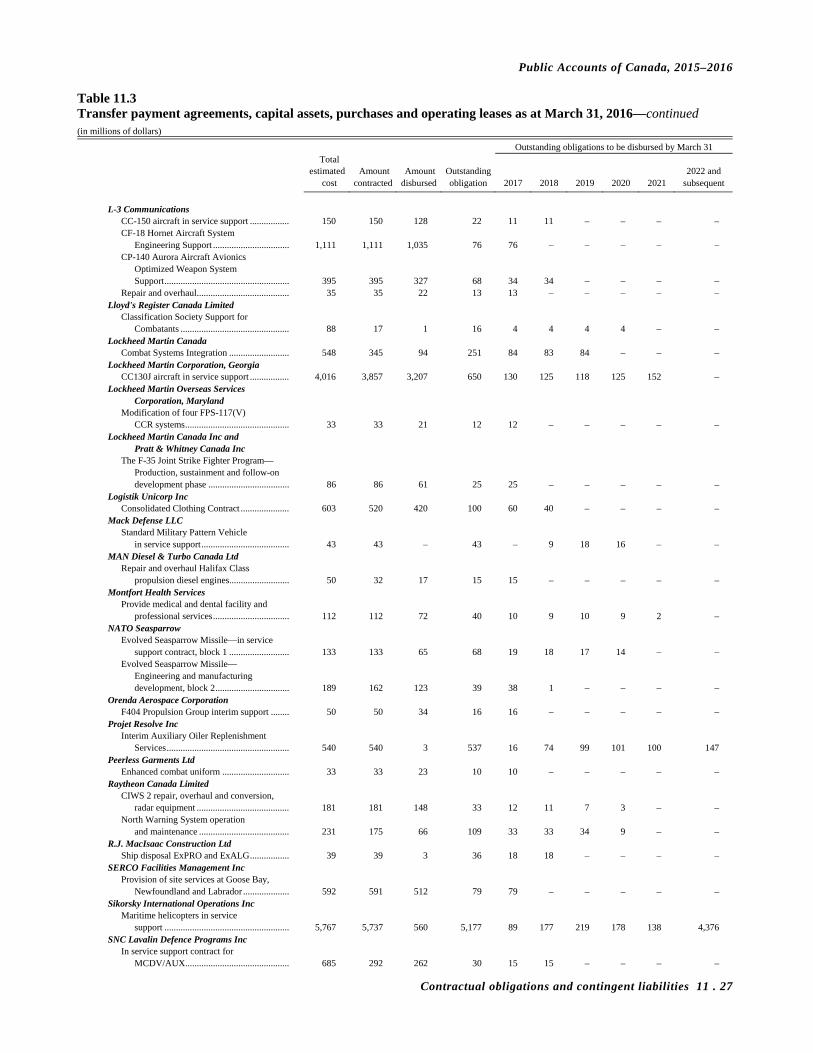
Public Accounts of Canada, 2015–2016
Contractual obligations and contingent liabilities 11 . 27
Table 11.3 Transfer payment agreements, capital assets, purchases and operating leases as at March 31, 2016—continued (in millions of dollars)
Outstanding obligations to be disbursed by March 31 Total estimated Amount Amount Outstanding 2022 and cost contracted disbursed obligation 2017 2018 2019 2020 2021 subsequent
L-3 Communications
CC-150 aircraft in service support ................. 150 150 128 22 11 11 – – – – CF-18 Hornet Aircraft System
Engineering Support ................................. 1,111 1,111 1,035 76 76 – – – – – CP-140 Aurora Aircraft Avionics
Optimized Weapon System Support ...................................................... 395 395 327 68 34 34 – – – –
Repair and overhaul ........................................ 35 35 22 13 13 – – – – – Lloyd's Register Canada Limited
Classification Society Support for Combatants ............................................... 88 17 1 16 4 4 4 4 – –
Lockheed Martin Canada Combat Systems Integration .......................... 548 345 94 251 84 83 84 – – –
Lockheed Martin Corporation, Georgia CC130J aircraft in service support ................. 4,016 3,857 3,207 650 130 125 118 125 152 –
Lockheed Martin Overseas Services Corporation, Maryland
Modification of four FPS-117(V) CCR systems ............................................. 33 33 21 12 12 – – – – –
Lockheed Martin Canada Inc and Pratt & Whitney Canada Inc
The F-35 Joint Strike Fighter Program— Production, sustainment and follow-on development phase ................................... 86 86 61 25 25 – – – – –
Logistik Unicorp Inc Consolidated Clothing Contract ..................... 603 520 420 100 60 40 – – – –
Mack Defense LLC Standard Military Pattern Vehicle
in service support ...................................... 43 43 – 43 – 9 18 16 – – MAN Diesel & Turbo Canada Ltd
Repair and overhaul Halifax Class propulsion diesel engines.......................... 50 32 17 15 15 – – – – –
Montfort Health Services Provide medical and dental facility and
professional services ................................. 112 112 72 40 10 9 10 9 2 – NATO Seasparrow
Evolved Seasparrow Missile—in service support contract, block 1 .......................... 133 133 65 68 19 18 17 14 – –
Evolved Seasparrow Missile— Engineering and manufacturing development, block 2 ................................ 189 162 123 39 38 1 – – – –
Orenda Aerospace Corporation F404 Propulsion Group interim support ........ 50 50 34 16 16 – – – – –
Projet Resolve Inc Interim Auxiliary Oiler Replenishment
Services ..................................................... 540 540 3 537 16 74 99 101 100 147 Peerless Garments Ltd
Enhanced combat uniform ............................. 33 33 23 10 10 – – – – – Raytheon Canada Limited
CIWS 2 repair, overhaul and conversion, radar equipment ........................................ 181 181 148 33 12 11 7 3 – –
North Warning System operation and maintenance ....................................... 231 175 66 109 33 33 34 9 – –
R.J. MacIsaac Construction Ltd Ship disposal ExPRO and ExALG ................. 39 39 3 36 18 18 – – – –
SERCO Facilities Management Inc Provision of site services at Goose Bay,
Newfoundland and Labrador .................... 592 591 512 79 79 – – – – – Sikorsky International Operations Inc
Maritime helicopters in service support ...................................................... 5,767 5,737 560 5,177 89 177 219 178 138 4,376
SNC Lavalin Defence Programs Inc In service support contract for
MCDV/AUX............................................. 685 292 262 30 15 15 – – – –
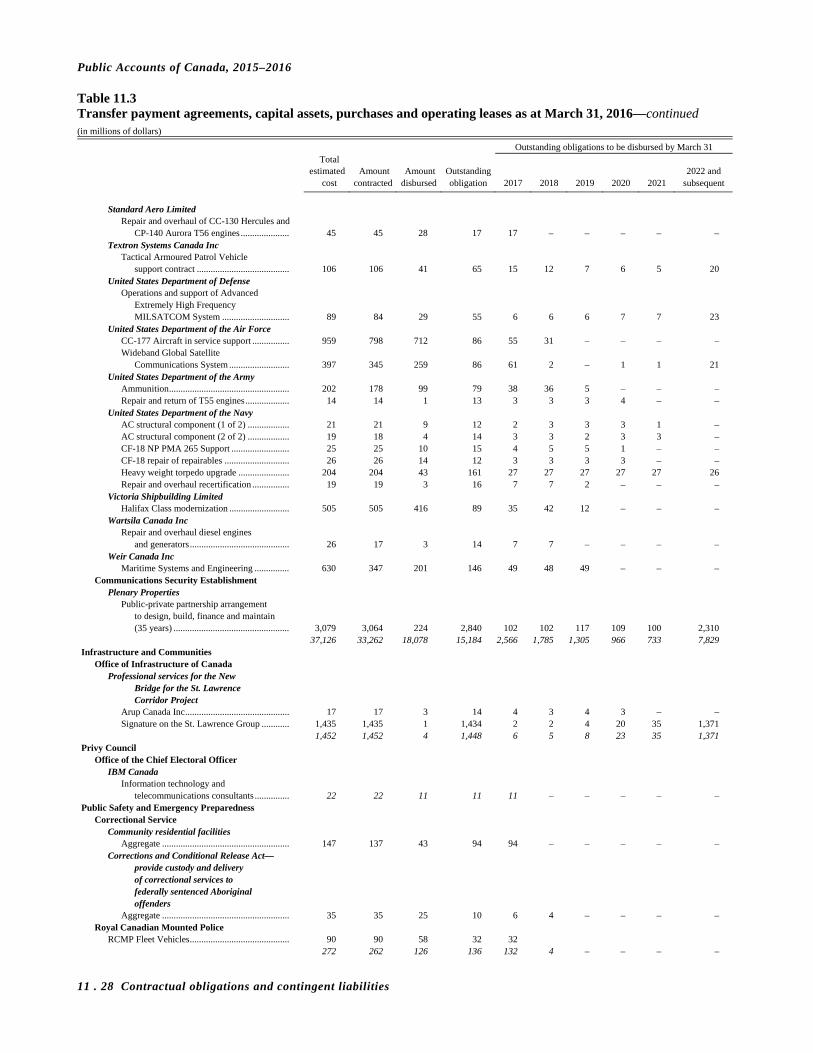
Public Accounts of Canada, 2015–2016
11 . 28 Contractual obligations and contingent liabilities
Table 11.3 Transfer payment agreements, capital assets, purchases and operating leases as at March 31, 2016—continued (in millions of dollars)
Outstanding obligations to be disbursed by March 31 Total estimated Amount Amount Outstanding 2022 and cost contracted disbursed obligation 2017 2018 2019 2020 2021 subsequent
Standard Aero Limited
Repair and overhaul of CC-130 Hercules and CP-140 Aurora T56 engines ..................... 45 45 28 17 17 – – – – –
Textron Systems Canada Inc Tactical Armoured Patrol Vehicle
support contract ........................................ 106 106 41 65 15 12 7 6 5 20 United States Department of Defense
Operations and support of Advanced Extremely High Frequency MILSATCOM System ............................. 89 84 29 55 6 6 6 7 7 23
United States Department of the Air Force CC-177 Aircraft in service support ................ 959 798 712 86 55 31 – – – – Wideband Global Satellite
Communications System .......................... 397 345 259 86 61 2 – 1 1 21 United States Department of the Army
Ammunition .................................................... 202 178 99 79 38 36 5 – – – Repair and return of T55 engines ................... 14 14 1 13 3 3 3 4 – –
United States Department of the Navy AC structural component (1 of 2) .................. 21 21 9 12 2 3 3 3 1 – AC structural component (2 of 2) .................. 19 18 4 14 3 3 2 3 3 – CF-18 NP PMA 265 Support ......................... 25 25 10 15 4 5 5 1 – – CF-18 repair of repairables ............................ 26 26 14 12 3 3 3 3 – – Heavy weight torpedo upgrade ...................... 204 204 43 161 27 27 27 27 27 26 Repair and overhaul recertification ................ 19 19 3 16 7 7 2 – – –
Victoria Shipbuilding Limited Halifax Class modernization .......................... 505 505 416 89 35 42 12 – – –
Wartsila Canada Inc Repair and overhaul diesel engines
and generators ........................................... 26 17 3 14 7 7 – – – – Weir Canada Inc
Maritime Systems and Engineering ............... 630 347 201 146 49 48 49 – – – Communications Security Establishment
Plenary Properties Public-private partnership arrangement
to design, build, finance and maintain (35 years) .................................................. 3,079 3,064 224 2,840 102 102 117 109 100 2,310
37,126 33,262 18,078 15,184 2,566 1,785 1,305 966 733 7,829 Infrastructure and Communities
Office of Infrastructure of Canada Professional services for the New
Bridge for the St. Lawrence Corridor Project
Arup Canada Inc ............................................. 17 17 3 14 4 3 4 3 – – Signature on the St. Lawrence Group ............ 1,435 1,435 1 1,434 2 2 4 20 35 1,371
1,452 1,452 4 1,448 6 5 8 23 35 1,371 Privy Council
Office of the Chief Electoral Officer IBM Canada
Information technology and telecommunications consultants ............... 22 22 11 11 11 – – – – –
Public Safety and Emergency Preparedness Correctional Service
Community residential facilities Aggregate ....................................................... 147 137 43 94 94 – – – – –
Corrections and Conditional Release Act— provide custody and delivery of correctional services to federally sentenced Aboriginal offenders
Aggregate ....................................................... 35 35 25 10 6 4 – – – – Royal Canadian Mounted Police
RCMP Fleet Vehicles ........................................... 90 90 58 32 32 272 262 126 136 132 4 – – – –

Public Accounts of Canada, 2015–2016
Contractual obligations and contingent liabilities 11 . 29
Table 11.3 Transfer payment agreements, capital assets, purchases and operating leases as at March 31, 2016—continued (in millions of dollars)
Outstanding obligations to be disbursed by March 31 Total estimated Amount Amount Outstanding 2022 and cost contracted disbursed obligation 2017 2018 2019 2020 2021 subsequent
Public Services and Procurement
Public Works and Government Services Build in Canada Innovation
Program Aggregate ....................................................... 34 34 21 13 13 – – – – –
Brookfield Global Integrated Solutions Canada LP
Building maintenance services ....................... 9,091 8,989 581 8,408 1,392 1,155 1,139 1,140 1,139 2,443 Card acceptance services
Amex Bank of Canada ................................... 22 22 2 20 4 5 6 5 – – Moneris Solutions Corporation ...................... 185 185 11 174 46 44 40 44 – –
Entreprise de Construction TEQ Inc Major redevelopment and development
of call centre ............................................. 19 19 – 19 14 5 – – – – Dexter Construction Company Limited
Bridge replacement, St-Peter's, Nova Scotia ............................................... 13 13 – 13 12 1 – – – –
Dragage Océan DSM Inc Maintenance dredging of St Lawrence
Seaway, North Traverse, Quebec ............. 30 30 19 11 4 3 4 – – – Green Timbers Limited Partnership
Public-Private Partnership Relocation Project—RCMP "E" Division relocation, Surrey, British Columbia .......................... 713 713 96 617 30 29 29 29 30 470
McNally Construction Inc Randle Reef Contaminated Sediment
Remediation Project, Stage 1 Construction, Hamilton Harbour, Ontario 29 29 3 26 20 6 – – – –
North Alaska Highway maintenance and repair services, British Columbia
Aggregate ....................................................... 123 123 91 32 16 14 2 – – – Nuna East Ltd
Runway and tarmac rehabilitation and construction of new tarmac, Eureka, Nunavut ....................................... 22 22 5 17 6 11 – – – –
Nuna Logistics Limited Giant Mine remediation, Yellowknife,
Northwest Territories ................................ 37 37 27 10 10 – – – – – Pension Modernization
Aggregate ....................................................... 27 16 14 2 2 – – – – – Hewlett-Packard (Canada) Company ............. 319 289 276 13 13 – – – – –
Vancouver Shipyards Co. Ltd National Shipbuilding Procurement
Strategy ..................................................... 40 40 25 15 10 5 – – – – Tax and operation and maintenance portion
on leases 2237800 Ontario Ltd
395 Terminal Avenue, Ottawa, Ontario ... 68 68 11 57 4 4 4 5 5 35 4345177 Canada Inc
Fontaine Building, 200 Sacré-Cœur Boulevard, Gatineau, Quebec ............. 46 46 22 24 3 3 3 4 4 7
519719 Ontario Inc 1600 Star Top Road, Ottawa, Ontario ...... 57 57 47 10 3 3 3 1 – –
6149625 Canada Inc Place Vincent Massey, 351 Saint-Joseph
Boulevard, Gatineau, Quebec ............. 23 23 3 20 1 – 1 1 1 16 6149626 Canada Inc
Place Vincent Massey, 351 Saint-Joseph Boulevard, Gatineau, Quebec ............. 107 107 15 92 3 4 4 4 4 73
8424934 Canada Inc Public Service Pay
Centre lease, Miramichi, New Brunswick3 .............. 15 15 – 15 – – – 1 1 13
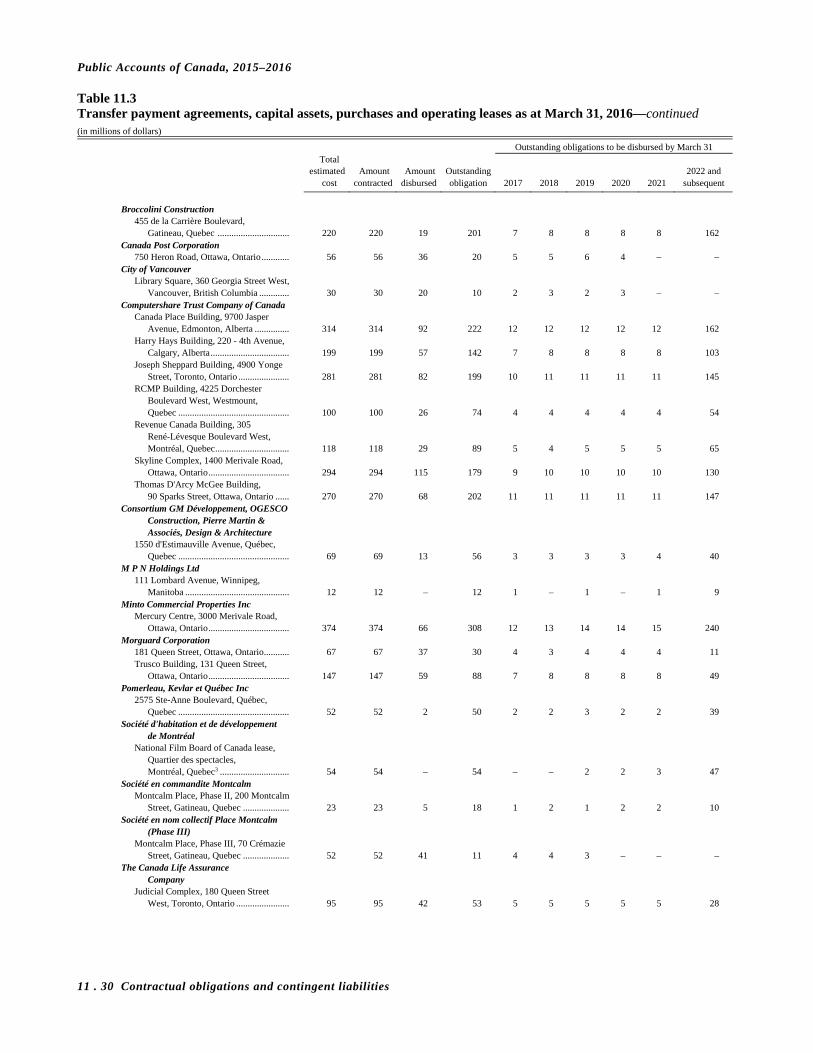
Public Accounts of Canada, 2015–2016
11 . 30 Contractual obligations and contingent liabilities
Table 11.3 Transfer payment agreements, capital assets, purchases and operating leases as at March 31, 2016—continued (in millions of dollars)
Outstanding obligations to be disbursed by March 31 Total estimated Amount Amount Outstanding 2022 and cost contracted disbursed obligation 2017 2018 2019 2020 2021 subsequent
Broccolini Construction
455 de la Carrière Boulevard, Gatineau, Quebec ............................... 220 220 19 201 7 8 8 8 8 162
Canada Post Corporation 750 Heron Road, Ottawa, Ontario ............ 56 56 36 20 5 5 6 4 – –
City of Vancouver Library Square, 360 Georgia Street West,
Vancouver, British Columbia ............. 30 30 20 10 2 3 2 3 – – Computershare Trust Company of Canada
Canada Place Building, 9700 Jasper Avenue, Edmonton, Alberta ............... 314 314 92 222 12 12 12 12 12 162
Harry Hays Building, 220 - 4th Avenue, Calgary, Alberta .................................. 199 199 57 142 7 8 8 8 8 103
Joseph Sheppard Building, 4900 Yonge Street, Toronto, Ontario ...................... 281 281 82 199 10 11 11 11 11 145
RCMP Building, 4225 Dorchester Boulevard West, Westmount, Quebec ................................................ 100 100 26 74 4 4 4 4 4 54
Revenue Canada Building, 305 René-Lévesque Boulevard West, Montréal, Quebec ................................ 118 118 29 89 5 4 5 5 5 65
Skyline Complex, 1400 Merivale Road, Ottawa, Ontario ................................... 294 294 115 179 9 10 10 10 10 130
Thomas D'Arcy McGee Building, 90 Sparks Street, Ottawa, Ontario ...... 270 270 68 202 11 11 11 11 11 147
Consortium GM Développement, OGESCO Construction, Pierre Martin & Associés, Design & Architecture
1550 d'Estimauville Avenue, Québec, Quebec ................................................ 69 69 13 56 3 3 3 3 4 40
M P N Holdings Ltd 111 Lombard Avenue, Winnipeg,
Manitoba ............................................. 12 12 – 12 1 – 1 – 1 9 Minto Commercial Properties Inc
Mercury Centre, 3000 Merivale Road, Ottawa, Ontario ................................... 374 374 66 308 12 13 14 14 15 240
Morguard Corporation 181 Queen Street, Ottawa, Ontario ........... 67 67 37 30 4 3 4 4 4 11 Trusco Building, 131 Queen Street,
Ottawa, Ontario ................................... 147 147 59 88 7 8 8 8 8 49 Pomerleau, Kevlar et Québec Inc
2575 Ste-Anne Boulevard, Québec, Quebec ................................................ 52 52 2 50 2 2 3 2 2 39
Société d'habitation et de développement de Montréal
National Film Board of Canada lease, Quartier des spectacles, Montréal, Quebec3 .............................. 54 54 – 54 – – 2 2 3 47
Société en commandite Montcalm Montcalm Place, Phase II, 200 Montcalm
Street, Gatineau, Quebec .................... 23 23 5 18 1 2 1 2 2 10 Société en nom collectif Place Montcalm
(Phase III) Montcalm Place, Phase III, 70 Crémazie
Street, Gatineau, Quebec .................... 52 52 41 11 4 4 3 – – – The Canada Life Assurance
Company Judicial Complex, 180 Queen Street
West, Toronto, Ontario ....................... 95 95 42 53 5 5 5 5 5 28

Public Accounts of Canada, 2015–2016
Contractual obligations and contingent liabilities 11 . 31
Table 11.3 Transfer payment agreements, capital assets, purchases and operating leases as at March 31, 2016—continued (in millions of dollars)
Outstanding obligations to be disbursed by March 31 Total estimated Amount Amount Outstanding 2022 and cost contracted disbursed obligation 2017 2018 2019 2020 2021 subsequent
The Great-West Life Assurance Company
James Michael Flaherty Building, 90 Elgin Street, Ottawa, Ontario ......... 309 309 19 290 12 12 12 12 12 230
The Great-West Life Assurance Company of Canada and London Life Insurance Company
269 Laurier Street West, Ottawa, Ontario 84 84 57 27 6 6 6 6 3 – Shared Services Canada
Allstream Wide area network services ............................ 241 241 51 190 1 26 32 39 45 47
Bell Canada Data networks—Government cabling
services ..................................................... 170 170 35 135 15 30 30 30 30 – Wide area network services / Networking
equipment and services ............................. 72 72 48 24 9 15 – – – – IBM Canada Ltd
Data centres consolidation— Workplace technology devices strategic sourcing ...................................... 49 49 25 24 1 1 3 3 4 12
Data centres—Large computers and operating systems ..................................... 257 257 100 157 6 84 67 – – –
Telus Communications Company Wide area network services (1 of 3)............... 241 241 51 190 2 26 32 39 45 46 Wide area network services (2 of 3)............... 156 156 111 45 7 8 21 9 – – Wide area network services (3 of 3)............... 28 28 8 20 – 6 7 7 – –
15,454 15,311 2,583 12,728 1,776 1,622 1,566 1,495 1,436 4,833 Treasury Board
Sun Life Assurance Company of Canada
Public Service Health Care Plan (Administration) ............................................. 175 175 150 25 25 – – – – –
Subtotal ............................................................................ 56,438 52,319 22,236 30,083 4,859 3,567 2,906 2,495 2,215 14,041
Consolidated Crown Corporations and Other Entities
Atomic Energy of Canada Limited Purchase orders .................................................... 728 728 425 303 303 – – – – –
Canadian Air Transport Security Authority
Garda Security Screening Inc—Central ............... 652 652 516 136 136 – – – – – Garda Security Screening Inc—Prairies .............. 422 422 353 69 69 – – – – – G4S Secure Solutions (Canada) Ltd .................... 416 416 340 76 76 – – – – – Logistik Unicorp Inc ............................................ 17 17 6 11 3 4 4 – – – Morpho Detection Inc .......................................... 201 201 94 107 61 46 – – – – NAV Canada ........................................................ 112 112 51 61 12 12 12 12 13 – Securitas Transport Aviation Security Ltd .......... 462 462 384 78 78 – – – – – Smiths Detection Montreal Inc ............................ 39 39 17 22 6 6 6 4 – – Sun Life Assurance Company of Canada ............ 31 31 11 20 4 4 4 4 4 –
2,352 2,352 1,772 580 445 72 26 20 17 – Canada Council for the Arts
Commited capital for investments ....................... 56 56 34 22 11 7 4 – – – Canadian Broadcasting Corporation
Programming rights Sports .............................................................. 169 169 20 149 14 20 13 11 36 55 Other ............................................................... 33 33 – 33 – – 6 8 8 11
SAP Canada ......................................................... 14 14 1 13 1 1 2 1 2 6 SNC-Lavalin Profac Inc ....................................... 471 471 312 159 38 39 40 42 – – Transmission and distribution .............................. 35 35 6 29 6 6 6 6 5 –
722 722 339 383 59 66 67 68 51 72 Canadian Commercial Corporation
Contracts with Canadian exporters ...................... 19,085 19,085 762 18,323 861 2,076 4,446 5,509 3,735 1,696
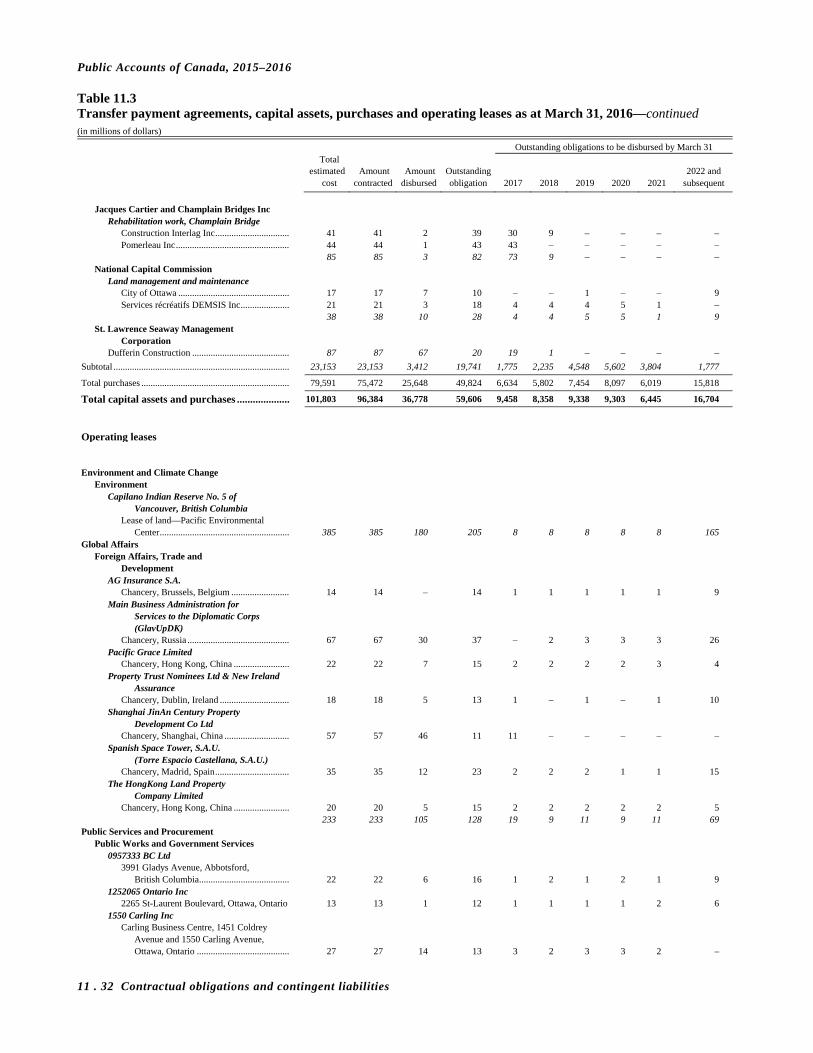
Public Accounts of Canada, 2015–2016
11 . 32 Contractual obligations and contingent liabilities
Table 11.3 Transfer payment agreements, capital assets, purchases and operating leases as at March 31, 2016—continued (in millions of dollars)
Outstanding obligations to be disbursed by March 31 Total estimated Amount Amount Outstanding 2022 and cost contracted disbursed obligation 2017 2018 2019 2020 2021 subsequent
Jacques Cartier and Champlain Bridges Inc
Rehabilitation work, Champlain Bridge Construction Interlag Inc ................................ 41 41 2 39 30 9 – – – – Pomerleau Inc ................................................. 44 44 1 43 43 – – – – –
85 85 3 82 73 9 – – – – National Capital Commission
Land management and maintenance City of Ottawa ................................................ 17 17 7 10 – – 1 – – 9 Services récréatifs DEMSIS Inc ..................... 21 21 3 18 4 4 4 5 1 –
38 38 10 28 4 4 5 5 1 9 St. Lawrence Seaway Management
Corporation Dufferin Construction .......................................... 87 87 67 20 19 1 – – – –
Subtotal ............................................................................ 23,153 23,153 3,412 19,741 1,775 2,235 4,548 5,602 3,804 1,777
Total purchases ................................................................ 79,591 75,472 25,648 49,824 6,634 5,802 7,454 8,097 6,019 15,818
Total capital assets and purchases .................... 101,803 96,384 36,778 59,606 9,458 8,358 9,338 9,303 6,445 16,704
Operating leases Environment and Climate Change
Environment Capilano Indian Reserve No. 5 of
Vancouver, British Columbia Lease of land—Pacific Environmental
Center ........................................................ 385 385 180 205 8 8 8 8 8 165 Global Affairs
Foreign Affairs, Trade and Development
AG Insurance S.A. Chancery, Brussels, Belgium ......................... 14 14 – 14 1 1 1 1 1 9
Main Business Administration for Services to the Diplomatic Corps (GlavUpDK)
Chancery, Russia ............................................ 67 67 30 37 – 2 3 3 3 26 Pacific Grace Limited
Chancery, Hong Kong, China ........................ 22 22 7 15 2 2 2 2 3 4 Property Trust Nominees Ltd & New Ireland
Assurance Chancery, Dublin, Ireland .............................. 18 18 5 13 1 – 1 – 1 10
Shanghai JinAn Century Property Development Co Ltd
Chancery, Shanghai, China ............................ 57 57 46 11 11 – – – – – Spanish Space Tower, S.A.U.
(Torre Espacio Castellana, S.A.U.) Chancery, Madrid, Spain ................................ 35 35 12 23 2 2 2 1 1 15
The HongKong Land Property Company Limited
Chancery, Hong Kong, China ........................ 20 20 5 15 2 2 2 2 2 5 233 233 105 128 19 9 11 9 11 69 Public Services and Procurement
Public Works and Government Services 0957333 BC Ltd
3991 Gladys Avenue, Abbotsford, British Columbia ....................................... 22 22 6 16 1 2 1 2 1 9
1252065 Ontario Inc 2265 St-Laurent Boulevard, Ottawa, Ontario 13 13 1 12 1 1 1 1 2 6
1550 Carling Inc Carling Business Centre, 1451 Coldrey
Avenue and 1550 Carling Avenue, Ottawa, Ontario ........................................ 27 27 14 13 3 2 3 3 2 –
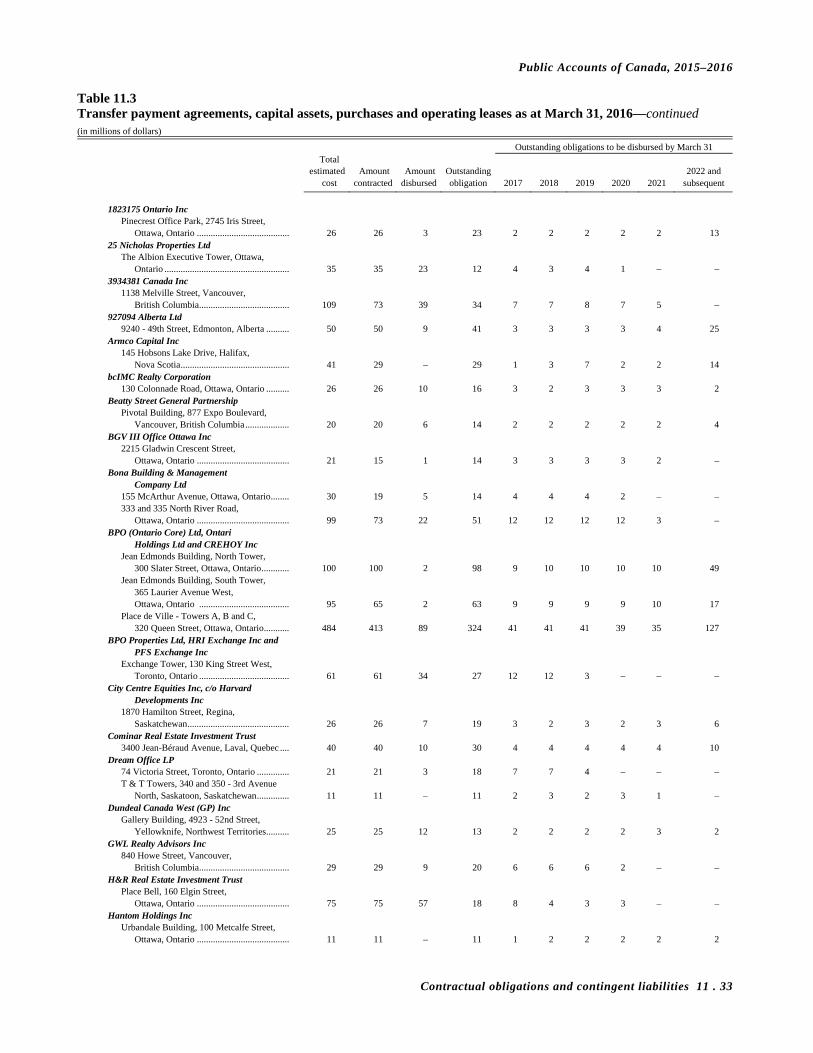
Public Accounts of Canada, 2015–2016
Contractual obligations and contingent liabilities 11 . 33
Table 11.3 Transfer payment agreements, capital assets, purchases and operating leases as at March 31, 2016—continued (in millions of dollars)
Outstanding obligations to be disbursed by March 31 Total estimated Amount Amount Outstanding 2022 and cost contracted disbursed obligation 2017 2018 2019 2020 2021 subsequent
1823175 Ontario Inc
Pinecrest Office Park, 2745 Iris Street, Ottawa, Ontario ........................................ 26 26 3 23 2 2 2 2 2 13
25 Nicholas Properties Ltd The Albion Executive Tower, Ottawa,
Ontario ...................................................... 35 35 23 12 4 3 4 1 – – 3934381 Canada Inc
1138 Melville Street, Vancouver, British Columbia ....................................... 109 73 39 34 7 7 8 7 5 –
927094 Alberta Ltd 9240 - 49th Street, Edmonton, Alberta .......... 50 50 9 41 3 3 3 3 4 25
Armco Capital Inc 145 Hobsons Lake Drive, Halifax,
Nova Scotia ............................................... 41 29 – 29 1 3 7 2 2 14 bcIMC Realty Corporation
130 Colonnade Road, Ottawa, Ontario .......... 26 26 10 16 3 2 3 3 3 2 Beatty Street General Partnership
Pivotal Building, 877 Expo Boulevard, Vancouver, British Columbia ................... 20 20 6 14 2 2 2 2 2 4
BGV III Office Ottawa Inc 2215 Gladwin Crescent Street,
Ottawa, Ontario ........................................ 21 15 1 14 3 3 3 3 2 – Bona Building & Management
Company Ltd 155 McArthur Avenue, Ottawa, Ontario ........ 30 19 5 14 4 4 4 2 – – 333 and 335 North River Road,
Ottawa, Ontario ........................................ 99 73 22 51 12 12 12 12 3 – BPO (Ontario Core) Ltd, Ontari
Holdings Ltd and CREHOY Inc Jean Edmonds Building, North Tower,
300 Slater Street, Ottawa, Ontario ............ 100 100 2 98 9 10 10 10 10 49 Jean Edmonds Building, South Tower,
365 Laurier Avenue West, Ottawa, Ontario ....................................... 95 65 2 63 9 9 9 9 10 17
Place de Ville - Towers A, B and C, 320 Queen Street, Ottawa, Ontario ........... 484 413 89 324 41 41 41 39 35 127
BPO Properties Ltd, HRI Exchange Inc and PFS Exchange Inc
Exchange Tower, 130 King Street West, Toronto, Ontario ....................................... 61 61 34 27 12 12 3 – – –
City Centre Equities Inc, c/o Harvard Developments Inc
1870 Hamilton Street, Regina, Saskatchewan ............................................ 26 26 7 19 3 2 3 2 3 6
Cominar Real Estate Investment Trust 3400 Jean-Béraud Avenue, Laval, Quebec .... 40 40 10 30 4 4 4 4 4 10
Dream Office LP 74 Victoria Street, Toronto, Ontario .............. 21 21 3 18 7 7 4 – – – T & T Towers, 340 and 350 - 3rd Avenue
North, Saskatoon, Saskatchewan .............. 11 11 – 11 2 3 2 3 1 – Dundeal Canada West (GP) Inc
Gallery Building, 4923 - 52nd Street, Yellowknife, Northwest Territories .......... 25 25 12 13 2 2 2 2 3 2
GWL Realty Advisors Inc 840 Howe Street, Vancouver,
British Columbia ....................................... 29 29 9 20 6 6 6 2 – – H&R Real Estate Investment Trust
Place Bell, 160 Elgin Street, Ottawa, Ontario ........................................ 75 75 57 18 8 4 3 3 – –
Hantom Holdings Inc Urbandale Building, 100 Metcalfe Street,
Ottawa, Ontario ........................................ 11 11 – 11 1 2 2 2 2 2
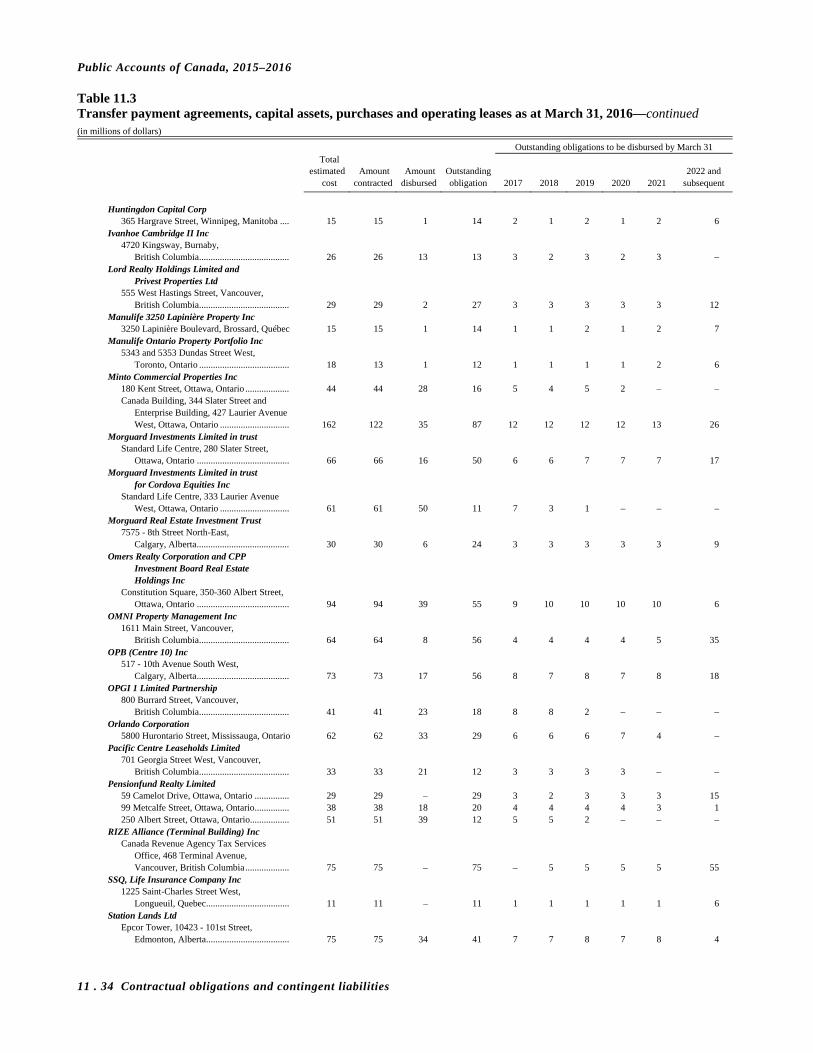
Public Accounts of Canada, 2015–2016
11 . 34 Contractual obligations and contingent liabilities
Table 11.3 Transfer payment agreements, capital assets, purchases and operating leases as at March 31, 2016—continued (in millions of dollars)
Outstanding obligations to be disbursed by March 31 Total estimated Amount Amount Outstanding 2022 and cost contracted disbursed obligation 2017 2018 2019 2020 2021 subsequent
Huntingdon Capital Corp
365 Hargrave Street, Winnipeg, Manitoba .... 15 15 1 14 2 1 2 1 2 6 Ivanhoe Cambridge II Inc
4720 Kingsway, Burnaby, British Columbia ....................................... 26 26 13 13 3 2 3 2 3 –
Lord Realty Holdings Limited and Privest Properties Ltd
555 West Hastings Street, Vancouver, British Columbia ....................................... 29 29 2 27 3 3 3 3 3 12
Manulife 3250 Lapinière Property Inc 3250 Lapinière Boulevard, Brossard, Québec 15 15 1 14 1 1 2 1 2 7
Manulife Ontario Property Portfolio Inc 5343 and 5353 Dundas Street West,
Toronto, Ontario ....................................... 18 13 1 12 1 1 1 1 2 6 Minto Commercial Properties Inc
180 Kent Street, Ottawa, Ontario ................... 44 44 28 16 5 4 5 2 – – Canada Building, 344 Slater Street and
Enterprise Building, 427 Laurier Avenue West, Ottawa, Ontario .............................. 162 122 35 87 12 12 12 12 13 26
Morguard Investments Limited in trust Standard Life Centre, 280 Slater Street,
Ottawa, Ontario ........................................ 66 66 16 50 6 6 7 7 7 17 Morguard Investments Limited in trust
for Cordova Equities Inc Standard Life Centre, 333 Laurier Avenue
West, Ottawa, Ontario .............................. 61 61 50 11 7 3 1 – – – Morguard Real Estate Investment Trust
7575 - 8th Street North-East, Calgary, Alberta ........................................ 30 30 6 24 3 3 3 3 3 9
Omers Realty Corporation and CPP Investment Board Real Estate Holdings Inc
Constitution Square, 350-360 Albert Street, Ottawa, Ontario ........................................ 94 94 39 55 9 10 10 10 10 6
OMNI Property Management Inc 1611 Main Street, Vancouver,
British Columbia ....................................... 64 64 8 56 4 4 4 4 5 35 OPB (Centre 10) Inc
517 - 10th Avenue South West, Calgary, Alberta ........................................ 73 73 17 56 8 7 8 7 8 18
OPGI 1 Limited Partnership 800 Burrard Street, Vancouver,
British Columbia ....................................... 41 41 23 18 8 8 2 – – – Orlando Corporation
5800 Hurontario Street, Mississauga, Ontario 62 62 33 29 6 6 6 7 4 – Pacific Centre Leaseholds Limited
701 Georgia Street West, Vancouver, British Columbia ....................................... 33 33 21 12 3 3 3 3 – –
Pensionfund Realty Limited 59 Camelot Drive, Ottawa, Ontario ............... 29 29 – 29 3 2 3 3 3 15 99 Metcalfe Street, Ottawa, Ontario ............... 38 38 18 20 4 4 4 4 3 1 250 Albert Street, Ottawa, Ontario................. 51 51 39 12 5 5 2 – – –
RIZE Alliance (Terminal Building) Inc Canada Revenue Agency Tax Services
Office, 468 Terminal Avenue, Vancouver, British Columbia ................... 75 75 – 75 – 5 5 5 5 55
SSQ, Life Insurance Company Inc 1225 Saint-Charles Street West,
Longueuil, Quebec .................................... 11 11 – 11 1 1 1 1 1 6 Station Lands Ltd
Epcor Tower, 10423 - 101st Street, Edmonton, Alberta .................................... 75 75 34 41 7 7 8 7 8 4

Public Accounts of Canada, 2015–2016
Contractual obligations and contingent liabilities 11 . 35
Table 11.3 Transfer payment agreements, capital assets, purchases and operating leases as at March 31, 2016—concluded (in millions of dollars)
Outstanding obligations to be disbursed by March 31 Total estimated Amount Amount Outstanding 2022 and cost contracted disbursed obligation 2017 2018 2019 2020 2021 subsequent
Sun Life Assurance Company of Canada and Ontari Holdings Limited
Sun Life Financial Centre, East Tower, 50 O'Connor Street, Ottawa, Ontario ....... 71 53 1 52 5 5 5 5 5 27
Sun Life Assurance Company of Canada and SITQ National Inc
1155 Metcalfe Street, Suite 55, Montréal, Quebec ..................................... 18 18 5 13 2 2 2 2 2 3
Surrey CC Properties Inc 13450 - 102nd Avenue, Surrey,
British Columbia ....................................... 30 30 1 29 3 3 3 3 2 15 The Great-West Life Assurance Company
Centennial Towers, 200 Kent Street, Ottawa, Ontario ........................................ 235 183 34 149 14 14 15 15 15 76
TNC 340 Laurier Ltd Sir Wilfrid Laurier Building, 340 Laurier
Avenue West, Ottawa, Ontario ................. 61 61 42 19 10 9 – – – – West Corr Holdings Ltd
3427 Faithfull Avenue, Saskatoon, Saskatchewan ............................................ 24 24 3 21 2 1 2 1 2 13
3,048 2,741 835 1,906 287 280 264 228 204 643
Subtotal ............................................................................ 3,666 3,359 1,120 2,239 314 297 283 245 223 877
Consolidated Crown Corporations and Other Entities
Canada Council for the Arts Office accommodation, 150 Elgin Street,
Ottawa, Ontario .............................................. 90 90 10 80 4 4 4 4 4 60 Canadian Air Transport Security
Authority Sun Life Assurance Company of Canada ............ 49 49 20 29 4 5 4 5 4 7
Canadian Broadcasting Corporation Eurofax Properties ................................................ 17 17 2 15 1 1 1 2 1 9 Morguard .............................................................. 144 144 84 60 7 8 7 8 8 22
161 161 86 75 8 9 8 10 9 31 Canadian Commercial Corporation
Office space .......................................................... 38 38 13 25 1 1 2 1 2 18 Canadian Museum of Immigration
at Pier 21 1055 Marginal Road, Halifax, Nova Scotia ......... 69 69 6 63 2 1 2 1 2 55
International Development Research Centre
Head office, 150 Kent Street, Ottawa, Ontario .... 98 98 52 46 6 7 7 7 7 12 Marine Atlantic Inc.
MV Atlantic Vision .............................................. 38 38 17 21 13 8 – – – – National Capital Commission
Chambers Building, Ottawa, Ontario ................... 195 195 156 39 10 10 11 8 – – VIA Rail Canada Inc.
Canadian National Railways Montréal Central Station ................................ 104 104 88 16 6 6 4 – – –
City of Toronto Union Station .................................................. 218 218 40 178 3 3 3 3 3 163
SITQ Place Ville Marie, Montréal ........................... 36 36 6 30 3 3 3 3 4 14
358 358 134 224 12 12 10 6 7 177
Subtotal ............................................................................ 1,096 1,096 494 602 60 57 48 42 35 360
Total operating
leases ................................................................ 4,762 4,455 1,614 2,841 374 354 331 287 258 1,237
Grand total .......................................................... 187,996 182,002 80,387 101,615 25,626 17,885 15,712 13,996 8,789 19,607
1 The amount disbursed relates to the reduction of contractual obligations for assets under construction through a public-private partnership arrangement. 2 The amounts shown relate to a future capital lease obligation. 3 The amounts shown relate to interest and executory costs associated with a future capital lease obligation.

Public Accounts of Canada, 2015–2016
11 . 36 Contractual obligations and contingent liabilities
International contractual obligations
Table 11.4 summarizes the international contractual obligations according to whether they would result in the disbursement of funds for non-budgetary share capital and loans, or for budgetary transfer payments, loans and advances and contractual obligations.
International contractual obligations reported in this table include transfer payments, and loans and advances to international organizations as well as loans for the development of export trade (administered by Export Development Canada), if any, which Canada has agreed to disburse in the future. Future paid-in share capital represents commitments made by Canada for future purchases of non-budgetary share capital in international organizations. The amounts reported in Table 11.4 as undisbursed loans and advances and as future paid-in share capital exclude notes that have been issued and that are still unpaid as at March 31, 2016.
Table 11.4 presents information that is summarized in Note 17 to the consolidated financial statements in Section 2 of this volume.
Table 11.4 International contractual obligations (in millions of dollars)1
Undisbursed Future Transfer loans and paid-in payments advances share capital Total
Non-budgetary share capital and loans
Foreign Affairs, Trade and Development African Development Bank ............................................................................................... – – 6 6 Inter-American Investment Corporation ............................................................................ – – 83 83
– – 89 89 Budgetary transfer payments, loans and advances
Environment Commission for Environmental Cooperation .................................................................... 4 – – 4 United Nations Environment Programme
Climate change and clean air ....................................................................................... 4 – – 4 World Meteorological Organization .................................................................................. 4 – – 4
12 – – 12
Finance African Development Fund—Multilateral Debt Relief Initiative ..................................... 402 – – 402 International Development Association
Multilateral Debt Relief Initiative ................................................................................ 925 – – 925 Subscriptions and contributions ................................................................................... 441 – – 441
1,768 – – 1,768
Foreign Affairs, Trade and Development Diplomacy, advocacy and international agreements ......................................................... 14 – – 14 International Development ................................................................................................. 1,965 – – 1,965 International Humanitarian Assistance .............................................................................. 24 – – 24 International Security and Democratic Development ........................................................ 124 – – 124 United Nations Environment Programme .......................................................................... 4 – – 4 African Development Fund ................................................................................................ – 103 – 103 Asian Development Fund ................................................................................................... – 48 – 48 Caribbean Development Bank—Special Development Fund ........................................... – 17 – 17 Global Environment Facility Trust Fund ........................................................................... – 135 – 135 International Fund for Agricultural Development ............................................................. – 25 – 25 Montreal Protocol Multilateral Fund ................................................................................. – 10 – 10
2,131 338 – 2,469
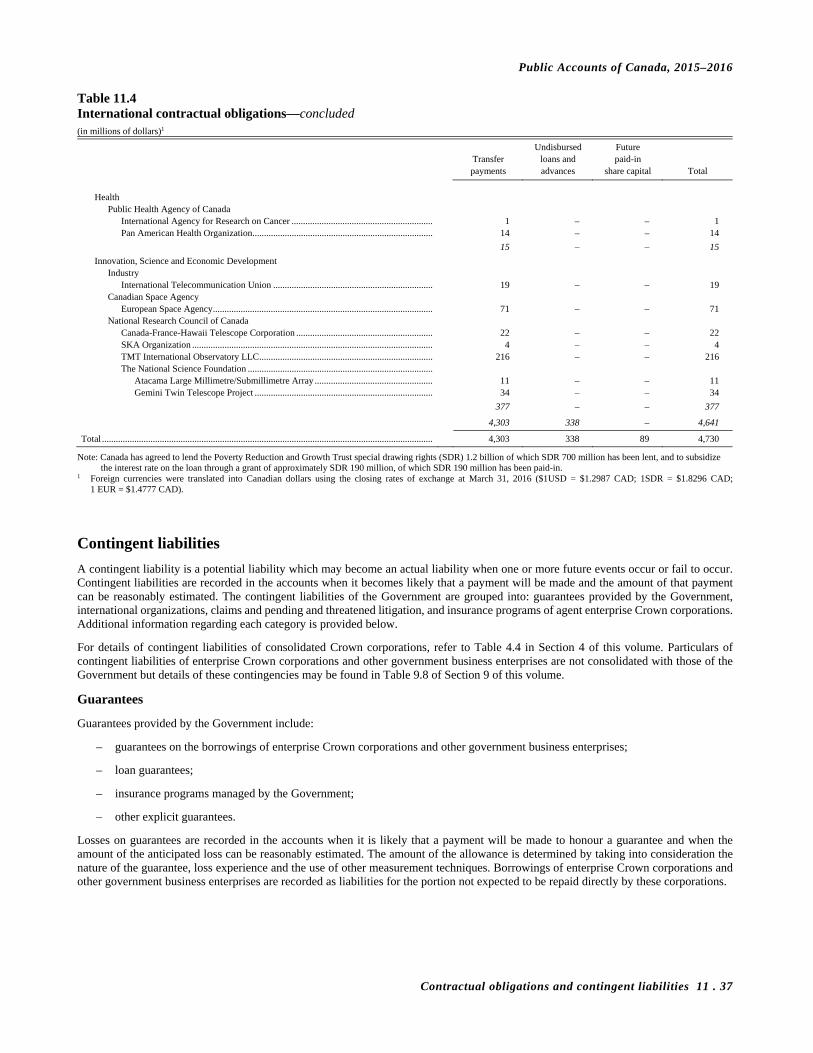
Public Accounts of Canada, 2015–2016
Contractual obligations and contingent liabilities 11 . 37
Table 11.4 International contractual obligations—concluded (in millions of dollars)1
Undisbursed Future Transfer loans and paid-in payments advances share capital Total
Health
Public Health Agency of Canada International Agency for Research on Cancer ............................................................. 1 – – 1 Pan American Health Organization .............................................................................. 14 – – 14
15 – – 15
Innovation, Science and Economic Development Industry
International Telecommunication Union ..................................................................... 19 – – 19 Canadian Space Agency
European Space Agency ............................................................................................... 71 – – 71 National Research Council of Canada
Canada-France-Hawaii Telescope Corporation ........................................................... 22 – – 22 SKA Organization ........................................................................................................ 4 – – 4 TMT International Observatory LLC ........................................................................... 216 – – 216 The National Science Foundation ................................................................................
Atacama Large Millimetre/Submillimetre Array ................................................... 11 – – 11 Gemini Twin Telescope Project ............................................................................. 34 – – 34
377 – – 377
4,303 338 – 4,641
Total ............................................................................................................................................... 4,303 338 89 4,730
Note: Canada has agreed to lend the Poverty Reduction and Growth Trust special drawing rights (SDR) 1.2 billion of which SDR 700 million has been lent, and to subsidize the interest rate on the loan through a grant of approximately SDR 190 million, of which SDR 190 million has been paid-in. 1 Foreign currencies were translated into Canadian dollars using the closing rates of exchange at March 31, 2016 ($1USD = $1.2987 CAD; 1SDR = $1.8296 CAD;
1 EUR = $1.4777 CAD).
Contingent liabilities
A contingent liability is a potential liability which may become an actual liability when one or more future events occur or fail to occur. Contingent liabilities are recorded in the accounts when it becomes likely that a payment will be made and the amount of that payment can be reasonably estimated. The contingent liabilities of the Government are grouped into: guarantees provided by the Government, international organizations, claims and pending and threatened litigation, and insurance programs of agent enterprise Crown corporations. Additional information regarding each category is provided below.
For details of contingent liabilities of consolidated Crown corporations, refer to Table 4.4 in Section 4 of this volume. Particulars of contingent liabilities of enterprise Crown corporations and other government business enterprises are not consolidated with those of the Government but details of these contingencies may be found in Table 9.8 of Section 9 of this volume.
Guarantees
Guarantees provided by the Government include:
– guarantees on the borrowings of enterprise Crown corporations and other government business enterprises;
– loan guarantees;
– insurance programs managed by the Government;
– other explicit guarantees.
Losses on guarantees are recorded in the accounts when it is likely that a payment will be made to honour a guarantee and when the amount of the anticipated loss can be reasonably estimated. The amount of the allowance is determined by taking into consideration the nature of the guarantee, loss experience and the use of other measurement techniques. Borrowings of enterprise Crown corporations and other government business enterprises are recorded as liabilities for the portion not expected to be repaid directly by these corporations.

Public Accounts of Canada, 2015–2016
11 . 38 Contractual obligations and contingent liabilities
Table 11.5 lists the outstanding guarantees and is summarized in Note 18 to the consolidated financial statements in Section 2 of this volume. The authorized limits indicated in Table 11.5 represent the aggregate total of various types of authorities of Government bodies as stipulated in legislation, legal agreements or other documents that may be in force at any one time.
Table 11.5 Guarantees provided by the Government as at March 31, 2016 (in millions of dollars)
Authorized limit Principal (where applicable) outstanding
Guaranteed borrowings of enterprise Crown corporations and other government business enterprises
Agent enterprise Crown corporations .............................................................................................................. 266,434 1
Other guarantees provided by the Government Loan guarantees
Agriculture and Agri-Food Advance Payments Program—Agricultural Marketing Programs Act ..................................................... 5,000 1,165 Farm Improvement Loans Act and Canadian Agricultural Loans Act ...................................................... 3,000 104
Families, Children and Social Development Employment and Social Development
Canada Student Loans Act ................................................................................................................... 10,782 6 Indigenous and Northern Affairs
Indian Affairs and Northern Development Indian Economic Development Guarantee Program............................................................................ 60 1 On-Reserve Housing Guarantee Program ............................................................................................ 2,200
Canada Mortgage and Housing Corporation .................................................................................. 1,431 Other approved lenders ................................................................................................................... 352
Innovation, Science and Economic Development Industry
Regional Aircraft Credit Facility .......................................................................................................... 1,500 101 Small Business Loans Act ..................................................................................................................... 1,838 – 2
Canada Small Business Financing Act ................................................................................................ 2,249 779 Capital Leasing Pilot Project .......................................................................................................... 16 – 3
Natural Resources
Lower Churchill Hydro Electric Projects .................................................................................................. 6,300 3,550
Total—Loan guarantees ........................................................................................................................................ 32,945 7,489
Insurance programs managed by the Government Canadian Heritage
Canada Travelling Exhibitions Indemnification Act ................................................................................. 3,000 – 3
Finance Mortgage or Hypothecary Insurance Protection ........................................................................................ 300,000 215,713
Global Affairs Foreign Affairs, Trade and Development
Accounts administered for the Government by Export Development Canada .................................... 20,000 155 Natural Resources
Canadian Nuclear Safety Commission Nuclear Liability Reinsurance Account ............................................................................................... 1,275 713
Transport Aviation War Risks .................................................................................................................................... – 3
Total—Insurance programs managed by the Government ................................................................................... 324,275 216,581
Other explicit guarantees Agriculture and Agri-Food
National Biomass Ethanol Program ........................................................................................................... 140 25 Price Pooling Program—Agricultural Marketing Programs Act .............................................................. 1
Consolidated Crown corporations VIA Rail Canada Inc.
Letters of credit .................................................................................................................................... 27
Total—Other explicit guarantees .......................................................................................................................... 140 53
Total—Gross guarantees ...................................................................................................................................... 357,360 490,557
Less: allowance for guarantees ........................................................................................................................ 312
Net exposure under guarantees .............................................................................................................................. 490,245
Note: This table excludes insurance programs operated by agent enterprise Crown corporations. Information on these programs is disclosed in Note 18 to the consolidated financial statements in Section 2 of this volume and additional information is provided in Table 11.7 of this section. 1 Details can be found in Table 9.6, Section 9 of this volume. 2 Less than $500,000. 3 No principal amount outstanding.

Public Accounts of Canada, 2015–2016
Contractual obligations and contingent liabilities 11 . 39
Advance Payments Program—Agricultural Marketing Programs Act
The Advance Payments Program (APP) provides producers with a cash advance on the value of their agricultural products during a specified period. By improving their cash flow throughout the year, the APP helps crop and livestock producers meet their financial obligations and benefit from the best market conditions.
Under the APP, the federal government guarantees repayment of cash advances issued to farmers by the producer organization. These guarantees help the producer organization borrow money from financial institutions at lower interest rates and issue producers a cash advance on the anticipated value of their farm product that is being produced or that is in storage. The maximum cash advance of the program is $0.4 million and the loans generally have a repayment term of 18-24 months.
Farm Improvement Loans Act and Canadian Agricultural Loans Act
The Canadian Agricultural Loans Act (CALA) program is a financial loan guarantee program that gives farmers easier access to credit. Farmers can use these loans to establish, improve, and develop farms; while Agricultural co-operatives may also access loans to process, distribute, or market the products of farming.
The CALA program builds on and replaces the previous Farm Improvement and Marketing Co-operative Loans Act (FIMCLA) program, which has helped farming operations grow their businesses by guaranteeing loans issued through financial institutions since 1988.
Through the CALA, the Government of Canada is supporting the renewal of the agricultural sector and enabling co-operatives to better seize market opportunities. This program guarantees 95 per cent of the value of loans provided to farms and cooperatives by financial institutions. For individual applicants, including corporations, the maximum amount for a Canadian Agricultural Loans Act loan is $0.5 million. Most loans are repayable within ten years; for loans on land purchases, the repayment period is 15 years.
Canada Student Loans Act
Loans provided by financial institutions between 1964 and August 1995, under the Canada Student Loans Act, are fully guaranteed by Employment and Social Development (ESDC) to the lenders. ESDC reimburses the lenders for the outstanding principal, accrued interest and costs in the event of default, permanent disability or death of the borrower. ESDC bears all risks associated with guaranteed loans.
Indian Economic Development Guarantee Program
This program authorizes Indian Affairs and Northern Development Canada to guarantee loans for non-incorporated Indian businesses on a risk-sharing basis with commercial lenders because security restrictions in the Indian Act prevent the mortgage and seizure of property located on reserves. Guarantees are provided for various types of borrowers whose activities contribute to the economic development of Indians and enable them to develop long-term credit relationships with mainstream financial institutions.
Loans issued under this program cannot exceed a term of 15 years and the line of credit must be renewed every year. Interest rates on guaranteed loans are consistent with rates provided by lending institutions to commercial businesses, which are usually based on a spread from the prime lending rate. Any security pledged for a guaranteed loan may not be released by the lending institution without the prior approval of the Minister of Indian Affairs and Northern Development.
On-Reserve Housing Guarantee Program
This program authorizes Indian Affairs and Northern Development Canada to guarantee loans to individuals and Indian bands to assist in the purchase of housing on reserves because security restrictions in the Indian Act prevent the mortgage and seizure of property located on reserves. These loan guarantees enable status Indians residing on reserves, Band councils, or their delegated authorities, to secure housing loans without giving the lending institution rights to the property.
Loans under this program are issued by registered lending institutions and Canada Mortgage and Housing Corporation. Payments of principal and interest for loans issued under this program are amortized over a period of 25 years. The interest rates on the guaranteed loans are consistent with conventional mortgage interest rates offered by the major banks.
Regional Aircraft Credit Facility
The Regional Aircraft Credit Facility Program was established in 2004 to provide sales financing assistance in the form of loan guarantees to enable domestic air carriers to acquire Canadian-built fixed-wing commercial jets.
The guarantees are provided on commercial terms and are secured by the aircraft financed by private lenders. These guarantees have a life of 15 years. This program expired on March 31, 2008.
Public Accounts of Canada, 2015–2016
11 . 40 Contractual obligations and contingent liabilities
Small Business Loans Act and Canada Small Business Financing Act
The Small Business Loans Act (SBLA) includes loans registered until March 31, 1999 and the Canada Small Business Financing Act (CSBFA) includes both the core loans component (loans registered since April 1, 1999) and the Capital Leasing Pilot Project (leases registered between April 1, 2002 and March 31, 2007). In collaboration with financial institutions, the programs offered under these Acts are designed to help Canadian small and medium-sized enterprises (SMEs) get access to loan and capital leasing financing that would not otherwise have been available, or would only have been available under less favourable terms. In the event a registered loan or lease defaults, the Government pays 85 per cent of the net eligible losses. To be eligible, SMEs must be for-profit businesses with revenues not exceeding $5 million per year.
Lower Churchill Hydroelectric Projects
In 2011, the Government of Canada committed to providing a loan guarantee to support the Lower Churchill Hydroelectric Projects, including two projects sponsored by Nalcor Energy ((1) Muskrat Falls and Labrador Transmission Assets and (2) Labrador-Island Link) and one project sponsored by Emera Inc. (Maritime Link). The federal loan guarantee applied to the debt raised for the construction of these projects. Subsequent to signing of the Guarantee Agreements by the Minister of Natural Resources for the Muskrat Falls / Labrador Transmission Assets and for the Labrador Island Link, on December 13, 2013, the financing was completed for the Nalcor-led projects, raising $5 billion of guaranteed debt in the form of a bond financing. These bonds have a life varying from about 15 years to 40 years. After the Minister of Natural Resources signed the Guarantee Agreement for the Maritime Link on April 23, 2014, the bond financing was completed for the Maritime Link, raising $1.3 billion of guaranteed debt for a life of about 39 years. As of March 31, 2016, $3,549,839,354 of guaranteed debt has been released to the project entities. As per the terms of the bonds that were issued, initially, only interest payments are being made on the guaranteed debt. The commencement of principal payments on the guaranteed debt has been scheduled to coincide with the expected commissioning dates of the projects, with the schedule of these payments depending on the specific terms and conditions of each of the guaranteed bonds. Among the many safeguards put in place to protect Canada’s interest, all of the project entities’ shares, assets and agreements have been pledged as security to Canada.
Canada Travelling Exhibitions Indemnification Act
Pursuant to s. 3(1) of the Canada Travelling Exhibitions Indemnification Act (the Act) the Minister of Canadian Heritage is authorized to enter into indemnification agreements with owners of objects or appurtenances on loan to travelling exhibitions in Canada. Under the Act, maximum levels of liability are established including: no more than $600 million in respect of each travelling exhibition and; no more than $3 billion at any given time in respect of all traveling exhibitions. The Canada Travelling Exhibitions Indemnification Regulations set out specific requirements to be met when owners are seeking indemnification agreements with the Minister. The Regulations also set limitations on the scope of indemnity, establish deductibles, define maximums for and period of coverage, set requirements for condition reporting, outline a claims procedure and provide for dispute resolution, among other things. Applicants may include institutions organizing or participating in travelling exhibitions who apply on behalf of owners. Upon approval of an application by the Minister, the owner of an object or appurtenance included in the particular travelling exhibition may enter into an indemnification agreement with the Minister.
Mortgage or hypothecary insurance protection
The Protection of Residential Mortgage or Hypothecary Insurance Act (PRMHIA) received Royal Assent on June 26, 2011 and came into force on January 1, 2013.
The PRMHIA authorizes the Minister of Finance to provide protection in respect of certain mortgage or hypothecary insurance contracts written by approved mortgage insurers. Under the PRMHIA, a payment in respect of this guarantee would only be made if a winding-up order were made in respect of an approved mortgage insurer that had written an insurance contract guaranteed under the PRMHIA. In that case, the Minister would honour lender claims for insured mortgages in default, subject to: (1) any proceeds the beneficiary has received from the underlying property or the insurer’s liquidation, and (2) a deductible of 10 per cent of the original principal amount of the insured mortgage.
As at March 31, 2016, the aggregate outstanding principal amount of loans that are guaranteed under the PRMHIA is estimated at $242.5 billion ($205.8 billion in 2015). Any payment by the Minister is subject to a deductible equal to 10 per cent of the original principal amount of these loans, or $26.8 billion ($23.3 billion in 2015). The principal amount outstanding presented within Table 11.5 does not refer to anticipated losses or payments in respect of the guarantee. No provision has been made in these accounts for payments under the guarantee. As at March 31, 2016, there are two approved mortgage insurers under the PRMHIA: Genworth Financial Mortgage Insurance Company Canada, and Canada Guaranty Mortgage Insurance Company.
Accounts administered for the Government by Export Development Canada (EDC)
The Government of Canada has authorized support for insurance and guarantee programs which on the basis of EDC’s risk management practices, could not be supported under EDC’s Corporate Account but are in the national interest. Canada Account transactions consist of activities undertaken by EDC pursuant to Section 23 of the Export Development Act.
Public Accounts of Canada, 2015–2016
Contractual obligations and contingent liabilities 11 . 41
Nuclear Liability Reinsurance Account
Under the Nuclear Liability Act (NLA), operators of designated nuclear installations are required to possess basic or supplementary insurance of $75 million per installation for specified liabilities. The federal government has designated the Nuclear Insurance Association of Canada (NIAC) as the sole provider of third-party liability insurance and property insurance for the nuclear industry in Canada. The NIAC provides insurance to nuclear operators under a standard policy.
The policy consists of two types of coverage:
Coverage A and Coverage B. Coverage A includes only those risks that are accepted by the insurer; that is, bodily injury and property damage. Coverage B risks include personal injury that is not bodily; for example, psychological injury, damage arising from normal emissions, and damage due to acts of terrorism.
The NIAC receives premiums from operators for both coverages; however, premiums for Coverage B risks are remitted to the federal government, which reinsures these risks under its reinsurance agreement with the NIAC. Through the reinsurance agreement, the federal government assumes the liability associated with the difference between the basic insurance coverage provided by the NIAC and the full $75 million of liability imposed by the NLA, as well as for events listed under coverage B.
The Canadian Nuclear Safety Commission (CNSC) administers the Nuclear Liability Reinsurance Account on behalf of the federal government. The CNSC receives the premiums, paid by the operators of nuclear installations, for the supplementary insurance coverage and credits these to the Nuclear Liability Reinsurance Account in the Consolidated Revenue Fund.
Aviation war risks
The Aviation War Risk Liability Program’s guarantee is a blanket indemnity to the air industry for any losses arising as a result of war risks causing personal injury or property damage to third parties. Under the current program, airlines and other stakeholders are responsible for obtaining a certain threshold of third party war risk liability insurance. The Government’s indemnity covers the gap between the threshold amounts and the individual policy holder’s general liability policy limit. There is neither specified amount, nor amount specifiable—any given claim is up to the level of the individual participants’ general insurance policy and there is no limit on the number of claims that can be made. The guarantee is in effect until June 30, 2016.
National Biomass Ethanol Program
By Agreement dated March 30, 2001 (and amended in September 1, 2003), Her Majesty the Queen in Right of Canada as represented by the Minister of Agriculture and Agri-Food and Farm Credit Canada (FCC) entered into the National Biomass Ethanol Program (NBEP). The purpose of the program is to encourage new biomass fuel ethanol production in Canada. Guarantees are provided in relation to the Line of Credit Agreements entered into by Farm Credit Canada.
Price Pooling Program—Agricultural Marketing Programs Act
The Price Pooling Program (PPP) provides a price guarantee that protects marketing agencies and producers against unanticipated declines in the market price of their products. Program participants use the price guarantee as security in obtaining credit from lending institutions. This credit allows the marketing agency to improve cash flow of producers through an initial payment for products delivered. It also provides equal returns to producers for products of like grades, varieties and types. This program is designed to assist and encourage cooperative marketing of eligible agricultural products, including processed products.
Letters of credit
VIA Rail Canada Inc. has issued letters of credit to various provincial government workers’ compensation boards as security for future payment streams.
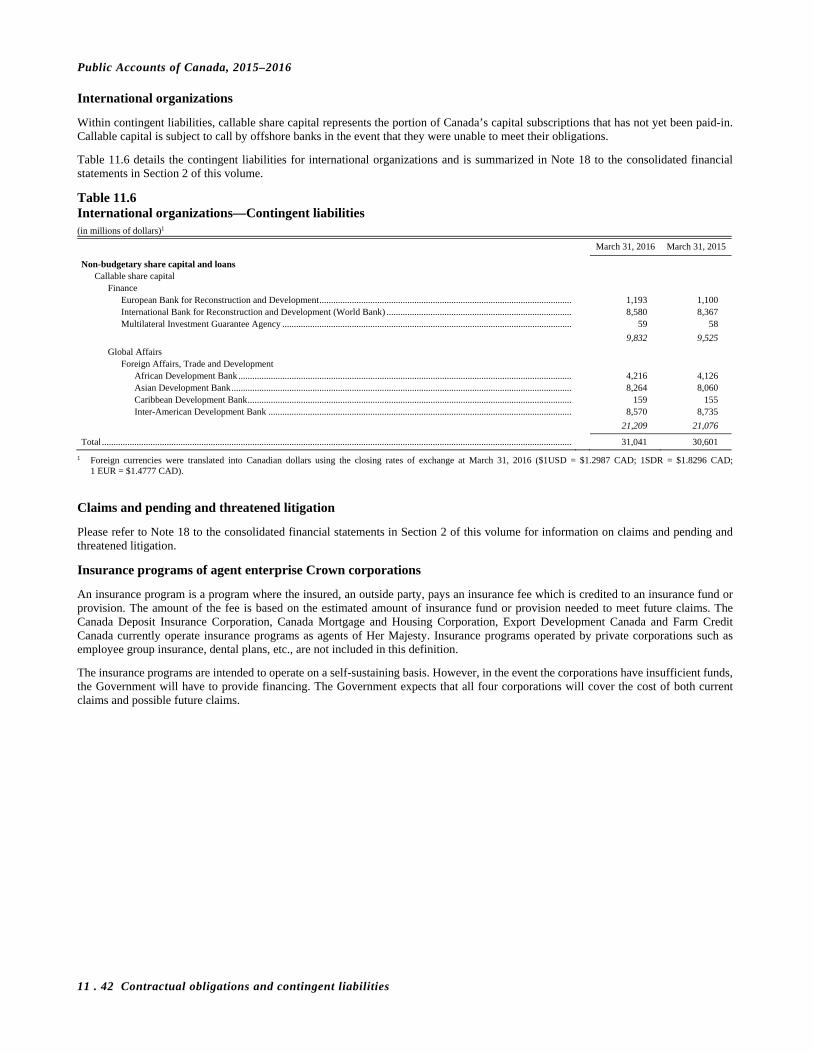
Public Accounts of Canada, 2015–2016
11 . 42 Contractual obligations and contingent liabilities
International organizations
Within contingent liabilities, callable share capital represents the portion of Canada’s capital subscriptions that has not yet been paid-in. Callable capital is subject to call by offshore banks in the event that they were unable to meet their obligations.
Table 11.6 details the contingent liabilities for international organizations and is summarized in Note 18 to the consolidated financial statements in Section 2 of this volume.
Table 11.6 International organizations—Contingent liabilities (in millions of dollars)1
March 31, 2016 March 31, 2015
Non-budgetary share capital and loans Callable share capital
Finance European Bank for Reconstruction and Development ............................................................................................................. 1,193 1,100 International Bank for Reconstruction and Development (World Bank) ................................................................................ 8,580 8,367 Multilateral Investment Guarantee Agency ............................................................................................................................. 59 58
9,832 9,525
Global Affairs Foreign Affairs, Trade and Development
African Development Bank ................................................................................................................................................ 4,216 4,126 Asian Development Bank ................................................................................................................................................... 8,264 8,060 Caribbean Development Bank ............................................................................................................................................ 159 155 Inter-American Development Bank ................................................................................................................................... 8,570 8,735
21,209 21,076
Total ........................................................................................................................................................................................................... 31,041 30,601
1 Foreign currencies were translated into Canadian dollars using the closing rates of exchange at March 31, 2016 ($1USD = $1.2987 CAD; 1SDR = $1.8296 CAD; 1 EUR = $1.4777 CAD).
Claims and pending and threatened litigation
Please refer to Note 18 to the consolidated financial statements in Section 2 of this volume for information on claims and pending and threatened litigation.
Insurance programs of agent enterprise Crown corporations
An insurance program is a program where the insured, an outside party, pays an insurance fee which is credited to an insurance fund or provision. The amount of the fee is based on the estimated amount of insurance fund or provision needed to meet future claims. The Canada Deposit Insurance Corporation, Canada Mortgage and Housing Corporation, Export Development Canada and Farm Credit Canada currently operate insurance programs as agents of Her Majesty. Insurance programs operated by private corporations such as employee group insurance, dental plans, etc., are not included in this definition.
The insurance programs are intended to operate on a self-sustaining basis. However, in the event the corporations have insufficient funds, the Government will have to provide financing. The Government expects that all four corporations will cover the cost of both current claims and possible future claims.
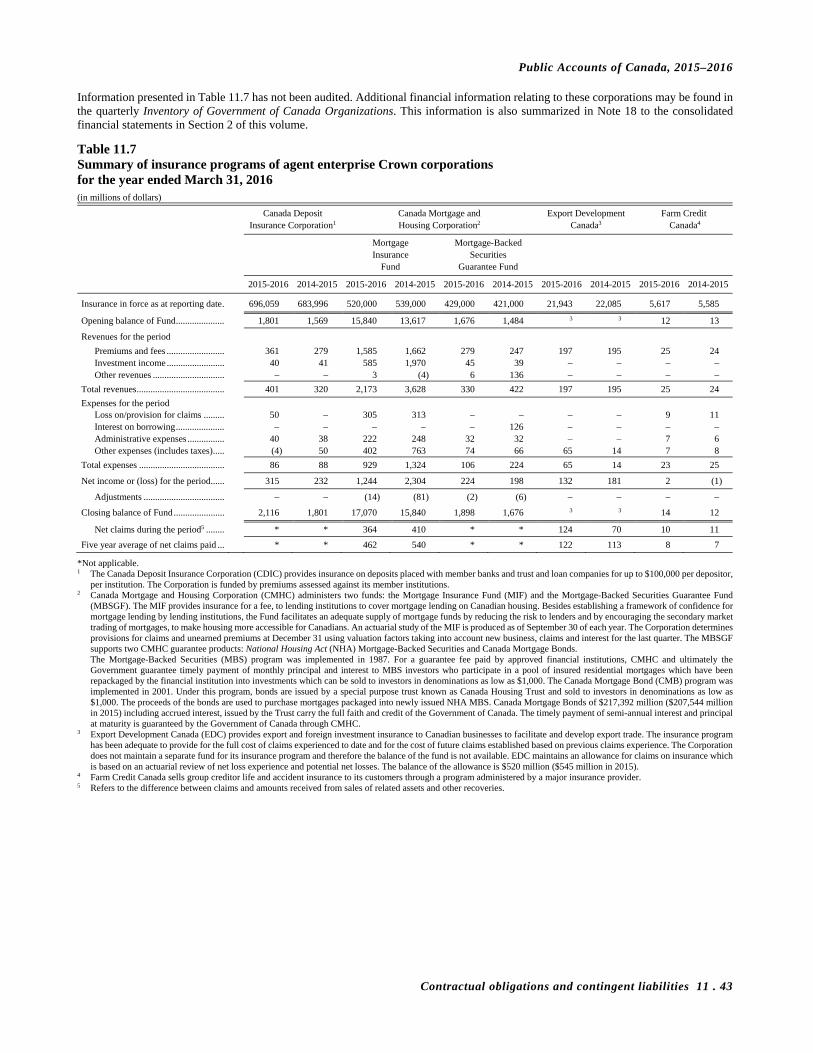
Public Accounts of Canada, 2015–2016
Contractual obligations and contingent liabilities 11 . 43
Information presented in Table 11.7 has not been audited. Additional financial information relating to these corporations may be found in the quarterly Inventory of Government of Canada Organizations. This information is also summarized in Note 18 to the consolidated financial statements in Section 2 of this volume.
Table 11.7 Summary of insurance programs of agent enterprise Crown corporations for the year ended March 31, 2016 (in millions of dollars)
Canada Deposit Canada Mortgage and Export Development Farm Credit Insurance Corporation1 Housing Corporation2 Canada3 Canada4
Mortgage Mortgage-Backed Insurance Securities Fund Guarantee Fund
2015-2016 2014-2015 2015-2016 2014-2015 2015-2016 2014-2015 2015-2016 2014-2015 2015-2016 2014-2015
Insurance in force as at reporting date . 696,059 683,996 520,000 539,000 429,000 421,000 21,943 22,085 5,617 5,585
Opening balance of Fund ..................... 1,801 1,569 15,840 13,617 1,676 1,484 3 3 12 13
Revenues for the period
Premiums and fees ......................... 361 279 1,585 1,662 279 247 197 195 25 24 Investment income ......................... 40 41 585 1,970 45 39 – – – – Other revenues ............................... – – 3 (4) 6 136 – – – –
Total revenues ...................................... 401 320 2,173 3,628 330 422 197 195 25 24
Expenses for the period Loss on/provision for claims ......... 50 – 305 313 – – – – 9 11 Interest on borrowing ..................... – – – – – 126 – – – – Administrative expenses ................ 40 38 222 248 32 32 – – 7 6 Other expenses (includes taxes) ..... (4) 50 402 763 74 66 65 14 7 8
Total expenses ..................................... 86 88 929 1,324 106 224 65 14 23 25
Net income or (loss) for the period ...... 315 232 1,244 2,304 224 198 132 181 2 (1)
Adjustments ................................... – – (14) (81) (2) (6) – – – –
Closing balance of Fund ...................... 2,116 1,801 17,070 15,840 1,898 1,676 3 3 14 12
Net claims during the period5 ........ * * 364 410 * * 124 70 10 11
Five year average of net claims paid ... * * 462 540 * * 122 113 8 7
*Not applicable. 1 The Canada Deposit Insurance Corporation (CDIC) provides insurance on deposits placed with member banks and trust and loan companies for up to $100,000 per depositor,
per institution. The Corporation is funded by premiums assessed against its member institutions. 2 Canada Mortgage and Housing Corporation (CMHC) administers two funds: the Mortgage Insurance Fund (MIF) and the Mortgage-Backed Securities Guarantee Fund
(MBSGF). The MIF provides insurance for a fee, to lending institutions to cover mortgage lending on Canadian housing. Besides establishing a framework of confidence for mortgage lending by lending institutions, the Fund facilitates an adequate supply of mortgage funds by reducing the risk to lenders and by encouraging the secondary market trading of mortgages, to make housing more accessible for Canadians. An actuarial study of the MIF is produced as of September 30 of each year. The Corporation determines provisions for claims and unearned premiums at December 31 using valuation factors taking into account new business, claims and interest for the last quarter. The MBSGF supports two CMHC guarantee products: National Housing Act (NHA) Mortgage-Backed Securities and Canada Mortgage Bonds. The Mortgage-Backed Securities (MBS) program was implemented in 1987. For a guarantee fee paid by approved financial institutions, CMHC and ultimately the Government guarantee timely payment of monthly principal and interest to MBS investors who participate in a pool of insured residential mortgages which have been repackaged by the financial institution into investments which can be sold to investors in denominations as low as $1,000. The Canada Mortgage Bond (CMB) program was implemented in 2001. Under this program, bonds are issued by a special purpose trust known as Canada Housing Trust and sold to investors in denominations as low as $1,000. The proceeds of the bonds are used to purchase mortgages packaged into newly issued NHA MBS. Canada Mortgage Bonds of $217,392 million ($207,544 million in 2015) including accrued interest, issued by the Trust carry the full faith and credit of the Government of Canada. The timely payment of semi-annual interest and principal at maturity is guaranteed by the Government of Canada through CMHC.
3 Export Development Canada (EDC) provides export and foreign investment insurance to Canadian businesses to facilitate and develop export trade. The insurance program has been adequate to provide for the full cost of claims experienced to date and for the cost of future claims established based on previous claims experience. The Corporation does not maintain a separate fund for its insurance program and therefore the balance of the fund is not available. EDC maintains an allowance for claims on insurance which is based on an actuarial review of net loss experience and potential net losses. The balance of the allowance is $520 million ($545 million in 2015).
4 Farm Credit Canada sells group creditor life and accident insurance to its customers through a program administered by a major insurance provider. 5 Refers to the difference between claims and amounts received from sales of related assets and other recoveries.

This page has been intentionally left blank.

Section 12
2015–2016
Public Accounts of Canada
Index

Public Accounts of Canada, 2015–2016
12 . 2 Index
Index
A
Abandonment Reserve Fund Canada Hibernia Holding Corporation, 6.41, 6.43
Accountable advances, miscellaneous, 9.31, 9.33 Accounting changes and restatement—Accumulated sick leave
entitlements, 1.24 Accounting for expenses, 3.8 Accounting for revenues, 3.3 Accounts administered for the Government by Export
Development Canada (EDC), 11.38, 11.40 Accounts payable, 5.3
and accrued liabilities, 1.16, 1.23, 2.6, 5.2 by category, 1.16, 5.2 change in, 1.25, 2.8 other, 1.23, 2.6, 5.2, 5.3, 5.5
Accounts payable and accrued liabilities, Section 5 Accounts receivable of consolidated Crown corporations
and other entities, 7.4 Accrued benefit obligations, 2.25 Accrued salaries and benefits, 5.3 Accumulated deficit, 1.11, 1.12, 1.23, 2.6, 2.19
at beginning of year, 1.22, 2.5, 3.3 at end of year, 1.22, 2.5, 3.3 Consolidated Statement of Operations and–detailed, 1.22
Accumulated other comprehensive income, 2.19 Acquisition of land, buildings and works,
refer to Volume III, Section 4 Acquisition of machinery and equipment,
refer to Volume III, Section 5 Actuarial assumptions, 2.27 Actuarial valuations, 2.24, 6.21
accounting purposes, for, 2.24 funding purposes, for, 2.24
Administered accounts, 6.43, 6.47 Advance account—Telefilm Canada, 6.48, 6.53 Advances from foreign customers,
Canadian Commercial Corporation, 5.6, 5.8 Advance Payments Program—Agricultural Marketing
Programs Act, 11.38, 11.39 African Development Bank, 9.24, 9.25, 9.26, 11.42 African Development Fund, 9.25 Agent enterprise Crown corporations, 11.38
Insurance programs of, 2.39 Aging of other accounts receivable, 7.4 Aging of taxes receivable, 7.3 Agricultural Commodities Stabilization Accounts, 4.10, 4.12 Agricultural Marketing Programs Act
Advance Payments Program, 11.38, 11.39 Price Pooling Program, 11.38, 11.41
AgriInvest Program, 6.48, 6.53 AgriStability Program, 6.48, 6.53 Air travellers security charge, 3.4 Allowance for guarantees, 1.24, 5.3, 5.5 Allowance for pension adjustments, 6.22, 6.35 Allowance for valuation, 1.26, 9.3, 9.41 Andean Development Corporation, 9.25 Annual surplus, 1.4, 1.23, 1.25, 1.26, 2.5, 2.7, 2.8, 3.3
or deficit, 1.22, 1.24, 1.25 Annuities Agents’ Pension Account, 6.48, 6.52 Armed services, Estates, 6.42, 6.47 Asian Development Bank, 9.24, 9.27, 11.42
Special, 9.25 Asian Development Fund, 9.25 Assessed taxes under objection or appeal, 2.39 Assets under capital leases, 10.2, 10.6
by main category, 10.6
A—concluded
Auditor General of Canada Observations on the consolidated financial statements, 2.42 Report on the consolidated financial statements, 2.4
Authorities available from previous years, refer to Volume II, Section 1
Authorities for the spending of proceeds from the disposal of surplus Crown assets, refer to Volume II, Section 1
Authorities granted by statutes other than Appropriation Acts, refer to Volume II, Section 1
Authorities granted in current year Appropriation Acts, refer to Volume II, Section 1
Aviation gasoline and diesel fuel, Excise tax, 3.4 Aviation war risks, 11.38, 11.41
B
Basis of accounting, 2.9 Benefit plans, changes to, 2.24 Benefit liabilities, Net future, 1.14 Benefit Trust Fund, 6.42, 6.47 Bonds for Canada Pension Plan, 1.23, 1.27, 6.9 Borrowing authorities, 2.15 Borrowings by consolidated agent Crown corporations, 4.8 Borrowings by enterprise Crown corporations and other
government business enterprises, 9.14 Borrowings of enterprise Crown corporations designated as agents
of Her Majesty, 6.10 British Army—Suffield, Alberta, 6.50 Budgetary balance, The, 1.4 Business Development Bank of Canada, 1.26, 9.5, 9.6, 9.7
C
Canada apprentice loans, 9.31, 9.34 Canada bills, 6.2, 6.7 Canada Development Investment Corporation
Holdback—Privatization, 6.41, 6.43 Canada Foundation Account, 6.49, 6.54 Canada Hibernia Holding Corporation
Abandonment Reserve Fund, 6.41, 6.43 Canada Investment Fund for Africa, 9.17, 9.18 Canada Labour Code
Other, 6.41, 6.43 Wage recovery appeals, 6.41, 6.43
Canada Lands Company Limited, 9.5, 9.7 Canada Mortgage and Housing Corporation, 1.26, 9.5, 9.6, 9.7, 11.38
Housing, 9.5, 9.6 Joint projects, 9.5, 9.6 Real estate, 9.5, 9.6 Sewage treatment projects, 9.5, 9.6 Student housing projects, 9.5, 9.6
Canada Pension Plan, 6.39 bonds for, 1.23, 1.27 due to, 1.23, 1.26, 2.29, 6.2, 6.38 Investment Board, 9.17 Supplementary statements, 6.59 transfers to, 6.39
Canada premium bonds, 6.6 Canada saving bonds, 6.6 Canada Small Business Financing Act, 11.38, 11.40 Canada Student Loans Act, 11.38, 11.39 Canada Student Loans Program, 9.31, 9.34 Canada Travelling Exhibitions Indemnification Act, 11.38, 11.40 Canadian Agricultural Loans Act, Farm Improvement
Loans Act and, 11.38, 11.39 Canadian Centre for Occupational Health and Safety
Donations, 5.6, 5.8
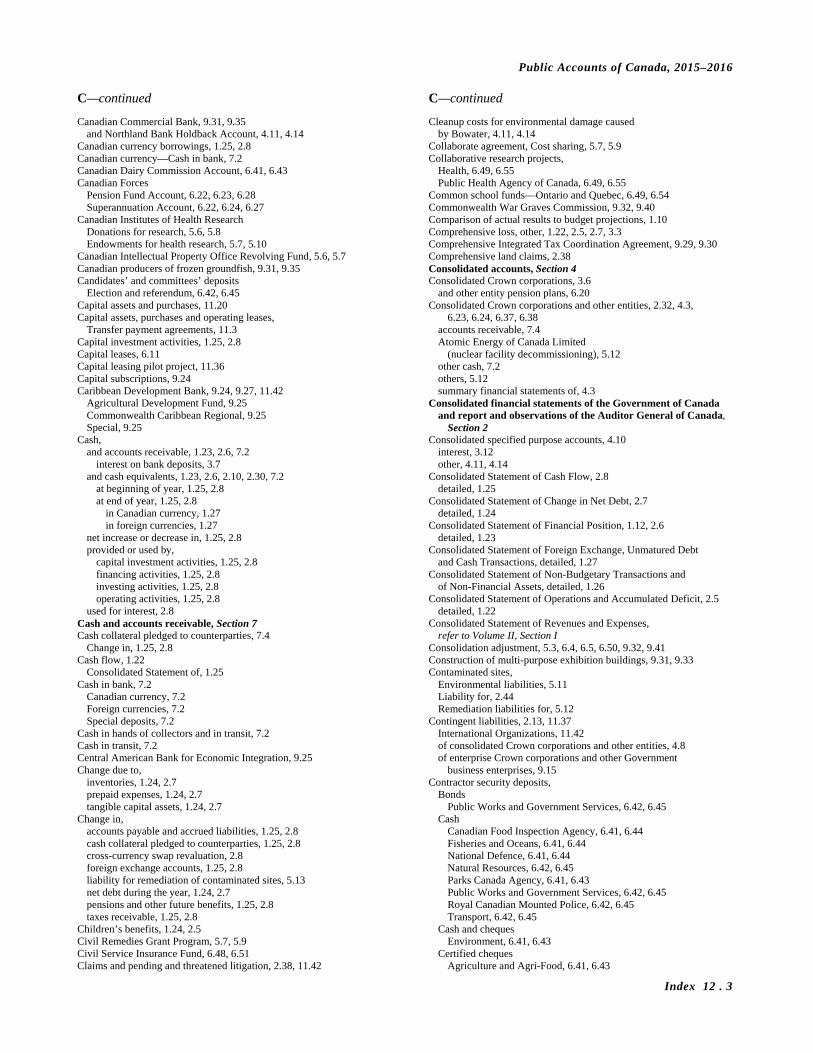
Public Accounts of Canada, 2015–2016
Index 12 . 3
C—continued
Canadian Commercial Bank, 9.31, 9.35 and Northland Bank Holdback Account, 4.11, 4.14
Canadian currency borrowings, 1.25, 2.8 Canadian currency—Cash in bank, 7.2 Canadian Dairy Commission Account, 6.41, 6.43 Canadian Forces
Pension Fund Account, 6.22, 6.23, 6.28 Superannuation Account, 6.22, 6.24, 6.27
Canadian Institutes of Health Research Donations for research, 5.6, 5.8 Endowments for health research, 5.7, 5.10
Canadian Intellectual Property Office Revolving Fund, 5.6, 5.7 Canadian producers of frozen groundfish, 9.31, 9.35 Candidates’ and committees’ deposits
Election and referendum, 6.42, 6.45 Capital assets and purchases, 11.20 Capital assets, purchases and operating leases,
Transfer payment agreements, 11.3 Capital investment activities, 1.25, 2.8 Capital leases, 6.11 Capital leasing pilot project, 11.36 Capital subscriptions, 9.24 Caribbean Development Bank, 9.24, 9.27, 11.42
Agricultural Development Fund, 9.25 Commonwealth Caribbean Regional, 9.25 Special, 9.25
Cash, and accounts receivable, 1.23, 2.6, 7.2
interest on bank deposits, 3.7 and cash equivalents, 1.23, 2.6, 2.10, 2.30, 7.2
at beginning of year, 1.25, 2.8 at end of year, 1.25, 2.8
in Canadian currency, 1.27 in foreign currencies, 1.27
net increase or decrease in, 1.25, 2.8 provided or used by,
capital investment activities, 1.25, 2.8 financing activities, 1.25, 2.8 investing activities, 1.25, 2.8 operating activities, 1.25, 2.8
used for interest, 2.8 Cash and accounts receivable, Section 7 Cash collateral pledged to counterparties, 7.4
Change in, 1.25, 2.8 Cash flow, 1.22
Consolidated Statement of, 1.25 Cash in bank, 7.2
Canadian currency, 7.2 Foreign currencies, 7.2 Special deposits, 7.2
Cash in hands of collectors and in transit, 7.2 Cash in transit, 7.2 Central American Bank for Economic Integration, 9.25 Change due to,
inventories, 1.24, 2.7 prepaid expenses, 1.24, 2.7 tangible capital assets, 1.24, 2.7
Change in, accounts payable and accrued liabilities, 1.25, 2.8 cash collateral pledged to counterparties, 1.25, 2.8 cross-currency swap revaluation, 2.8 foreign exchange accounts, 1.25, 2.8 liability for remediation of contaminated sites, 5.13 net debt during the year, 1.24, 2.7 pensions and other future benefits, 1.25, 2.8 taxes receivable, 1.25, 2.8
Children’s benefits, 1.24, 2.5 Civil Remedies Grant Program, 5.7, 5.9 Civil Service Insurance Fund, 6.48, 6.51 Claims and pending and threatened litigation, 2.38, 11.42
C—continued
Cleanup costs for environmental damage caused by Bowater, 4.11, 4.14
Collaborate agreement, Cost sharing, 5.7, 5.9 Collaborative research projects,
Health, 6.49, 6.55 Public Health Agency of Canada, 6.49, 6.55
Common school funds—Ontario and Quebec, 6.49, 6.54 Commonwealth War Graves Commission, 9.32, 9.40 Comparison of actual results to budget projections, 1.10 Comprehensive loss, other, 1.22, 2.5, 2.7, 3.3 Comprehensive Integrated Tax Coordination Agreement, 9.29, 9.30 Comprehensive land claims, 2.38 Consolidated accounts, Section 4 Consolidated Crown corporations, 3.6
and other entity pension plans, 6.20 Consolidated Crown corporations and other entities, 2.32, 4.3,
6.23, 6.24, 6.37, 6.38 accounts receivable, 7.4 Atomic Energy of Canada Limited
(nuclear facility decommissioning), 5.12 other cash, 7.2 others, 5.12 summary financial statements of, 4.3
Consolidated financial statements of the Government of Canada and report and observations of the Auditor General of Canada,
Section 2 Consolidated specified purpose accounts, 4.10
interest, 3.12 other, 4.11, 4.14
Consolidated Statement of Cash Flow, 2.8 detailed, 1.25
Consolidated Statement of Change in Net Debt, 2.7 detailed, 1.24
Consolidated Statement of Financial Position, 1.12, 2.6 detailed, 1.23
Consolidated Statement of Foreign Exchange, Unmatured Debt and Cash Transactions, detailed, 1.27
Consolidated Statement of Non-Budgetary Transactions and of Non-Financial Assets, detailed, 1.26
Consolidated Statement of Operations and Accumulated Deficit, 2.5 detailed, 1.22
Consolidated Statement of Revenues and Expenses, refer to Volume II, Section I
Consolidation adjustment, 5.3, 6.4, 6.5, 6.50, 9.32, 9.41 Construction of multi-purpose exhibition buildings, 9.31, 9.33 Contaminated sites,
Environmental liabilities, 5.11 Liability for, 2.44 Remediation liabilities for, 5.12
Contingent liabilities, 2.13, 11.37 International Organizations, 11.42 of consolidated Crown corporations and other entities, 4.8 of enterprise Crown corporations and other Government
business enterprises, 9.15 Contractor security deposits,
Bonds Public Works and Government Services, 6.42, 6.45
Cash Canadian Food Inspection Agency, 6.41, 6.44 Fisheries and Oceans, 6.41, 6.44 National Defence, 6.41, 6.44 Natural Resources, 6.42, 6.45 Parks Canada Agency, 6.41, 6.43 Public Works and Government Services, 6.42, 6.45 Royal Canadian Mounted Police, 6.42, 6.45 Transport, 6.42, 6.45
Cash and cheques Environment, 6.41, 6.43
Certified cheques Agriculture and Agri-Food, 6.41, 6.43

Public Accounts of Canada, 2015–2016
12 . 4 Index
C—concluded
Contractual obligations, 2.38, 11.2 and contingent liabilities, 2.6, 2.38, 11.2 of enterprise Crown corporations and other
Government business enterprises, 9.16 Schedule of minimum payments, 11.2
Contractual obligations and contingent liabilities, Section 11 Co-operative housing project, 9.17 Corporate—Income tax revenues, 1.22, 2.5, 3.4 Corporate sponsorships and donations, 5.6, 5.9 Cost sharing collaborate agreement, 6.50, 6.58 Council of Yukon First Nations—Elders, 9.32, 9.37 Court award deposits
Other than Environmental Damages Fund, 4.11, 4.14 Courts Administration Service
Security for costs, 6.41, 6.44 Special account, 6.50, 6.57
Credit risk related to swap and foreign-exchange forward agreements, 2.36
Crop Reinsurance Fund, 4.10, 4.12 Cross-currency swap revaluation, 1.23, 1.25, 1.27, 6.2, 6.8, 6.10
change-in, 2.8 Crown corporations, 3.6
other program expenses, 1.22, 2.5 other revenues, 1.22, 2.5, 3.6
Crown corporations and other entities, 2.32 Customs and excise, 5.10 Customs duties receivable, 2.30, 7.3 Customs import duties, 1.22, 2.5, 3.4, 3.5
D
Defence Services Pension Continuation Act, 6.24 Deferred revenues, 1.23, 2.6, 5.2, 5.6, 5.7
Specified purpose accounts, other, 5.6 Dependants’ Pension Fund, 6.48, 6.53, 6.90 Deposit accounts, 6.41 Deposit and trust accounts, 6.2, 6.41 Deposits/Disbursements—Worker’s Compensation Board, 6.50, 6.57 Deposits on disposals, 6.42, 6.45 Derivative financial instruments, 2.36 Details of obligation related to capital leases, 6.11 Details of other program expenses of other ministries,
refer to Volume II, Section 1 Details of other transfer payments by ministry,
refer to Volume II, Section 1 Details of respendable amounts,
refer to the related ministerial section in Volume II Developing countries—International development assistance, 9.20 Development of export trade—National government, 9.20, 9.21 Donation and bequest accounts, 5.6 Donations
Canadian Centre for Occupational Health and Safety, 5.6, 5.8 Endangered species, 5.6, 5.8 Rideau Hall, 5.7, 5.9
Donations for research, 5.6, 5.8 Due to Canada Pension Plan, 1.23, 1.26, 2.29, 6.2
E
Economic developments, 1.4 Election and referendum—Candidates’ and committees’ deposits,
6.42, 6.45 Employment insurance benefits, 1.22, 2.5 Employment Insurance Operating Account, 4.10, 4.12
supplementary statement, 4.16 transactions in the, 4.13
Employment insurance premiums, 1.6, 1.11, 1.22, 2.5, 3.3, 3.5 Endangered species—Donations, 5.6, 5.8 Endowment interest accounts, 5.7 Endowment principal, 4.11, 4.15
E—concluded
Endowments for Health Research, 4.11, 4.15, 5.7, 5.10 Energy taxes, 1.22, 2.5, 3.4, 3.5 Enterprise Crown corporations
and other government business enterprises, 1.23, 1.25, 1.26, 2.6, 2.8, 2.32, 9.3, 9.4, 9.5
borrowings by, 9.14 interest and other, 3.6 share of annual profit in, 1.26, 2.8, 3.6
Environmental damage caused by Bowater, Cleanup costs for, 4.11, 4.14
Environmental Damages Fund, 4.11, 4.14 Environmental liabilities, 1.23, 2.6, 2.13, 2.20, 5.2, 5.11, 5.12
Asset retirement obligations, 2.21, 5.12 Contaminated sites, 5.11
Remediation of, 2.20 other, 2.21, 5.11, 5.12
Environmental Studies Research Fund Indian Affairs and Northern Development, 4.11, 4.14 Natural Resources, 4.11, 4.14
Equity investment, 9.17, 9.18 Equity ownership, 9.17, 9.18 Equity transactions, 1.25, 2.8 Esso Ltd—Norman Wells Project profits, 3.7 Estates—Armed services, 6.42, 6.47 Estates Fund, 6.43, 6.47 European Bank for Reconstruction and Development, 9.24, 9.26, 11.42 Exchange Fund Account, 3.6
Supplementary statement, 8.5 Exchange valuation adjustment, 6.7 Excise duties, 3.4 Excise tax
aviation gasoline and diesel fuel, 3.4 gasoline, 3.4
Excise taxes and duties, other, 1.22, 2.5, 3.4, 3.5 receivable, 2.30, 7.3
Expenditures under statutory authorities, 3.14 Expenses, 1.7, 2.5, 2.10, 2.16, 3.3, 3.8
by object, 3.13 by segment, 2.17, 3.10 by type of resource used in operations, 2.18 compared to 2014–2015, 1.9 comparison of 2015–2016 outcomes to April 2015 budget, 1.11 comparison of 2015–2016 outcomes to March 2016 budget, 1.10 comparison to April 2015 budget plan, 1.10 comparison to March 2016 budget plan, 1.10 composition of, 1.7 total, 1.11
External expenses by segment and by type, 3.8
F
Fair value information, 2.37 Farm Credit Canada, 1.26, 9.5, 9.7
Guarantee Loans Program, 9.32, 9.37 Farm Improvement Loans Act and
Canadian Agricultural Loans Act, 11.38, 11.39 Federal/provincial agreement—Advance account, 6.49, 6.56 Federal/provincial collaborative agreement, 6.48, 6.53 Federal/provincial cost-sharing agreements, 6.49, 6.54 Federal-provincial fiscal arrangements, 9.29, 9.30 Federal-provincial shared-cost programs,
refer to Volume III, Section 9 Federal/provincial shared-cost project,
Employment and Social Development, 6.48, 6.54 Interprovincial Computerized Examination
Management System (ICEMS), 6.48, 6.55 Federal Public Service Health Care Administration Authority,
9.32, 9.40 Fees and charges, other, 3.6

Public Accounts of Canada, 2015–2016
Index 12 . 5
F—concluded
Field British Columbia and Yukon Operations of the Northern Canada Power Commission, 6.41, 6.44
Financial assets, 1.17, 1.23, 2.6 by category, 1.17
Financial assistance—Ukraine, 9.20 Financial assistance to,
Canadians abroad, 6.49, 6.54 enterprise Crown corporations and other Government
business enterprises, 9.16 Financial assistance under budgetary appropriations to
consolidated Crown corporations, 4.9 Financial Consumer Agency of Canada—Advances, 9.31, 9.35 Financial highlights, 1.2, 1.4 Financial information, Ten year comparative, 1.22 Financial instruments, 2.36 Financial position of consolidated Crown corporations
and other entities—Assets, liabilities and equity, 4.4 Financial position of enterprise Crown corporations
and other Government business enterprises Assets, liabilities and equity, 9.10
Financial statements discussion and analysis, Section 1 Financial statements discussion and analysis, 1.2
discussion and analysis, 1.3 accumulated deficit, 1.11 economic developments, 1.3 risks and uncertainties, 1.21 the budgetary balance, 1.4 total expenses, 1.9
glossary of terms, 1.28 introduction, 1.2
financial highlights, 1.2, 1.4 Financial statements of revolving funds, refer to Volume III, Section 1 Financing activities, 1.25, 2.8 Financing arrangements, 2.23 Fines for the transportation of dangerous goods, 4.11, 4.15 First Nations in British Columbia, 9.32, 9.37 Foreign Claims Fund, 6.49, 6.54 Foreign currency borrowings,
issuance of, 1.25, 2.8 repayment of, 1.25, 2.8
Foreign currencies—Cash in bank, 7.3 Foreign currency risk and sensitivity analysis to foreign
currency exposures, Managing, 2.37 Foreign currency translation, 2.14 Foreign exchange accounts, Section 8 Foreign exchange accounts, 1.23, 1.27, 2.6, 2.11, 2.31, 8.2
change in, 1.25, 2.8 Foreign-exchange forward agreements, 2.36 Foreign exchange, net revenues, 1.22, 2.5, 3.6
Exchange Fund Account, 3.6 International Monetary Fund, 3.6 other, 3.6
Foreign governments, 6.50, 6.57 Foreign holdings of Government of Canada
unmatured debt, 1.14 Foreign missions to advance Canadian agriculture, 6.48, 6.53 Foreign partners—Security, 6.50, 6.57 Funds from non-governmental organizations, 6.49, 6.55 Future benefit and interest expenses, 2.27 Future benefits, other, 2.24
G
Gasoline—Excise tax, 3.4 General security deposits, 6.42, 6.45 Global Environment Facility, 9.25, 9.27
Trust Fund, 9.25 Glossary of terms, 1.28
G—concluded
Goods and services tax, 1.22, 2.5, 3.4, 3.5, 5.10 receivable, 2.30, 7.3 sales of, 3.6
Government Annuities Account, 6.2, 6.40 Financial Statements, 6.83
Government net debt, G7 Total, 1.19 Government’s cost of operations, 3.10 Government’s holdings, 6.4, 6.5
and securities held for the retirement of unmatured debt, 6.4 Greater Victoria Harbour Authority, 9.32, 9.39 Guarantee deposits
Canada Border Services Agency, 6.42, 6.45 Canada Revenue Agency, 6.42, 6.44 Fisheries and Oceans—Fish habitat preservation, 6.41, 6.44 Indian Affairs and Northern Development, 6.41, 6.44
oil and gas, 6.41, 6.44 Natural Resources—Oil and gas, 6.42, 6.45
Guarantees, 11.37 Guarantees provided by the Government, 2.38, 11.38
contingent liabilities, 2.38
H
Haddock fishermen, 9.31, 9.35 Health Insurance Supplementary Account, 4.10, 4.13 H.L. Holmes Fund, 4.11, 4.15, 5.7, 5.10, 9.32, 9.39 Hog Industry Loan Loss Reserve Program, 9.31, 9.33 Holdback—Privatization, Canada Development
Investment Corporation, 6.41, 6.43
I
Immigrant Investor Program, 6.49, 6.55 Immigration Guarantee Fund, 6.42, 6.45 Immigration loans, 9.32, 9.37 Imprest account cheques, 7.2 Imprest accounts, standing advances and authorized loans, 9.31, 9.33 Income from securities in trust—Bankruptcy and Insolvency Act,
6.49, 6.56 Income tax revenues
corporate; non-resident; personal, 1.22, 2.5, 3.4 Income taxes receivable
corporations; employers; individuals; non-residents, 2.30, 7.3 Independent Auditor’s Report, 2.4 Indian,
band funds, 6.46 capital accounts, 6.42, 6.467 revenue accounts, 6.42, 6.46 shares and certificates, 6.49, 6.55
Economic Development Fund, 9.32, 9.38 Economic Development Guarantee Loans Program, 9.32, 9.38,
11.38, 11.39 estate accounts, 6.42, 6.46 Moneys Suspense Account, 6.49, 6.55 Residential Schools Settlement Agreement
Common experience payments, 6.42, 6.46 savings accounts, 6.42, 6.46 special accounts, 6.49, 6.56
Inmates’ Trust Fund, 6.42, 6.47 Insurance accounts, 4.10, 4.12 Insurance and death benefit accounts, 6.48 Insurance programs of agent enterprise Crown
corporations, 2.39, 11.42 Summary of, 11.43
Inter-American Development Bank, 9.24, 9.27, 11.42 Fund for Special Operations, 9.25
Inter-American Investment Corporation, 9.24, 9.27
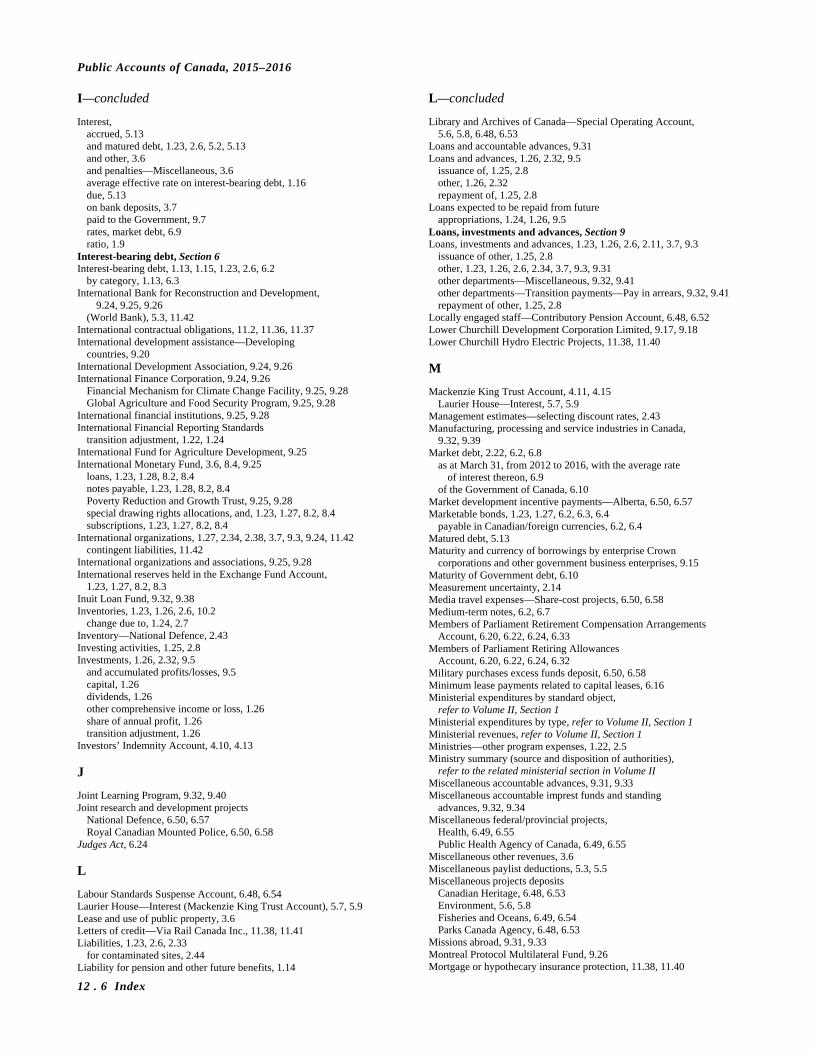
Public Accounts of Canada, 2015–2016
12 . 6 Index
I—concluded
Interest, accrued, 5.13 and matured debt, 1.23, 2.6, 5.2, 5.13 and other, 3.6 and penalties—Miscellaneous, 3.6 average effective rate on interest-bearing debt, 1.16 due, 5.13 on bank deposits, 3.7 paid to the Government, 9.7 rates, market debt, 6.9 ratio, 1.9
Interest-bearing debt, Section 6 Interest-bearing debt, 1.13, 1.15, 1.23, 2.6, 6.2
by category, 1.13, 6.3 International Bank for Reconstruction and Development,
9.24, 9.25, 9.26 (World Bank), 5.3, 11.42
International contractual obligations, 11.2, 11.36, 11.37 International development assistance—Developing
countries, 9.20 International Development Association, 9.24, 9.26 International Finance Corporation, 9.24, 9.26
Financial Mechanism for Climate Change Facility, 9.25, 9.28 Global Agriculture and Food Security Program, 9.25, 9.28
International financial institutions, 9.25, 9.28 International Financial Reporting Standards
transition adjustment, 1.22, 1.24 International Fund for Agriculture Development, 9.25 International Monetary Fund, 3.6, 8.4, 9.25
loans, 1.23, 1.28, 8.2, 8.4 notes payable, 1.23, 1.28, 8.2, 8.4 Poverty Reduction and Growth Trust, 9.25, 9.28 special drawing rights allocations, and, 1.23, 1.27, 8.2, 8.4 subscriptions, 1.23, 1.27, 8.2, 8.4
International organizations, 1.27, 2.34, 2.38, 3.7, 9.3, 9.24, 11.42 contingent liabilities, 11.42
International organizations and associations, 9.25, 9.28 International reserves held in the Exchange Fund Account,
1.23, 1.27, 8.2, 8.3 Inuit Loan Fund, 9.32, 9.38 Inventories, 1.23, 1.26, 2.6, 10.2
change due to, 1.24, 2.7 Inventory—National Defence, 2.43 Investing activities, 1.25, 2.8 Investments, 1.26, 2.32, 9.5
and accumulated profits/losses, 9.5 capital, 1.26 dividends, 1.26 other comprehensive income or loss, 1.26 share of annual profit, 1.26 transition adjustment, 1.26
Investors’ Indemnity Account, 4.10, 4.13
J
Joint Learning Program, 9.32, 9.40 Joint research and development projects
National Defence, 6.50, 6.57 Royal Canadian Mounted Police, 6.50, 6.58
Judges Act, 6.24
L
Labour Standards Suspense Account, 6.48, 6.54 Laurier House—Interest (Mackenzie King Trust Account), 5.7, 5.9 Lease and use of public property, 3.6 Letters of credit—Via Rail Canada Inc., 11.38, 11.41 Liabilities, 1.23, 2.6, 2.33
for contaminated sites, 2.44 Liability for pension and other future benefits, 1.14
L—concluded
Library and Archives of Canada—Special Operating Account, 5.6, 5.8, 6.48, 6.53
Loans and accountable advances, 9.31 Loans and advances, 1.26, 2.32, 9.5
issuance of, 1.25, 2.8 other, 1.26, 2.32 repayment of, 1.25, 2.8
Loans expected to be repaid from future appropriations, 1.24, 1.26, 9.5
Loans, investments and advances, Section 9 Loans, investments and advances, 1.23, 1.26, 2.6, 2.11, 3.7, 9.3
issuance of other, 1.25, 2.8 other, 1.23, 1.26, 2.6, 2.34, 3.7, 9.3, 9.31 other departments—Miscellaneous, 9.32, 9.41 other departments—Transition payments—Pay in arrears, 9.32, 9.41 repayment of other, 1.25, 2.8
Locally engaged staff—Contributory Pension Account, 6.48, 6.52 Lower Churchill Development Corporation Limited, 9.17, 9.18 Lower Churchill Hydro Electric Projects, 11.38, 11.40
M
Mackenzie King Trust Account, 4.11, 4.15 Laurier House—Interest, 5.7, 5.9
Management estimates—selecting discount rates, 2.43 Manufacturing, processing and service industries in Canada,
9.32, 9.39 Market debt, 2.22, 6.2, 6.8
as at March 31, from 2012 to 2016, with the average rate of interest thereon, 6.9
of the Government of Canada, 6.10 Market development incentive payments—Alberta, 6.50, 6.57 Marketable bonds, 1.23, 1.27, 6.2, 6.3, 6.4
payable in Canadian/foreign currencies, 6.2, 6.4 Matured debt, 5.13 Maturity and currency of borrowings by enterprise Crown
corporations and other government business enterprises, 9.15 Maturity of Government debt, 6.10 Measurement uncertainty, 2.14 Media travel expenses—Share-cost projects, 6.50, 6.58 Medium-term notes, 6.2, 6.7 Members of Parliament Retirement Compensation Arrangements
Account, 6.20, 6.22, 6.24, 6.33 Members of Parliament Retiring Allowances
Account, 6.20, 6.22, 6.24, 6.32 Military purchases excess funds deposit, 6.50, 6.58 Minimum lease payments related to capital leases, 6.16 Ministerial expenditures by standard object,
refer to Volume II, Section 1 Ministerial expenditures by type, refer to Volume II, Section 1 Ministerial revenues, refer to Volume II, Section 1 Ministries—other program expenses, 1.22, 2.5 Ministry summary (source and disposition of authorities),
refer to the related ministerial section in Volume II Miscellaneous accountable advances, 9.31, 9.33 Miscellaneous accountable imprest funds and standing
advances, 9.32, 9.34 Miscellaneous federal/provincial projects,
Health, 6.49, 6.55 Public Health Agency of Canada, 6.49, 6.55
Miscellaneous other revenues, 3.6 Miscellaneous paylist deductions, 5.3, 5.5 Miscellaneous projects deposits
Canadian Heritage, 6.48, 6.53 Environment, 5.6, 5.8 Fisheries and Oceans, 6.49, 6.54 Parks Canada Agency, 6.48, 6.53
Missions abroad, 9.31, 9.33 Montreal Protocol Multilateral Fund, 9.26 Mortgage or hypothecary insurance protection, 11.38, 11.40
Public Accounts of Canada, 2015–2016
Index 12 . 7
M—concluded
Mounted Police Foundation, 5.7, 5.9 Multilateral Investment Fund, 9.25 Multilateral Investment Guarantee Agency, 5.3, 9.24, 9.26, 11.42 Municipal Development and Loan Board, 9.29, 9.30
N
National Battlefields Commission—Trust Fund, 4.11, 4.14 National Biomass Ethanol Program, 11.38, 11.41 National governments including developing countries,
1.26, 3.7, 9.3, 9.20 National Marketing Programs, 9.31, 9.33 Native claimants, 9.32, 9.38 Net change in other accounts, 1.25, 2.8 Net debt, 1.18, 1.23, 2.6
at beginning of year, 1.24, 2.7 at end of year, 1.24, 2.7 net decrease or increase in, 1.24, 2.7
due to operations, 1.24, 2.7 Net increase in cash and cash equivalents, 2.8 Net foreign exchange, 3.6 Newfoundland Offshore Revenue Account, 6.50, 6.57 New Parks and Historic Sites Account, 4.11, 4.14 Non-budgetary transactions and non-financial assets, 1.26 Non-cash items, 1.25, 2.8 Non-financial assets, Section 10 Non-financial assets, 1.20, 1.23, 1.26, 2.6, 2.12, 10.2, 10.3
and non-budgetary transactions, 1.26 by category, 1.20, 10.2, 10.3
Non-government agencies, 6.50, 6.57 Non-government organizations, Deposits from, 5.6, 5.8 Non-Indian moneys, 6.49, 6.56 Non-lapsing authorities granted-repealed in the current year,
refer to Volume II, Section 1 Non-marketable bonds and notes,
refer to Bonds for Canada Pension Plan Non-public property, 2.33 Non-resident—Income tax revenues, 1.22, 2.5, 3.4 Nordion International Inc., 9.32, 9.39 North Atlantic Treaty Organization
Damage claims recoverable, 9.20, 9.23 North Portage Development Corporation, 9.17, 9.18 Northern Canada Power Commission, Field British Columbia
and Yukon Operations of the, 6.41, 6.44 Notes payable to international organizations, 5.3 Notes to the consolidated financial statements of the
Government of Canada, 2.9 Nova Scotia Offshore Revenue Account, 6.50, 6.57 Nuclear Liability Reinsurance Account, 4.10, 4.13, 11.38, 11.41
O
Obligation related to capital leases, 1.23, 1.27, 2.22, 6.2, 6.10, 6.11 details of, 6.11
Obligations to the Canadian Wheat Board under the Credit Grain Sales Program, 11.37, 11.40
Observations of the Auditor General of Canada on the consolidated financial statements of the Government of Canada, 2.42
Old age security benefits, guaranteed income supplement and spouse’s allowance, 1.22, 2.5
On Reserve Housing Guarantee Loans Program, 9.32, 9.38, 11.38, 11.39
Operating activities, 1.25, 2.8 Operating leases, 11.32 Other accounts, net change in, 1.25, 2.8 Other accounts payable and accrued liabilities, 1.23, 2.6, 5.2, 5.3, 5.5 Other accounts receivable, 1.23, 1.26, 2.6, 7.2, 7.5
Taxes and, 2.28 Other business loans, 9.32, 9.39
O—concluded
Other cash—Consolidated Crown corporations and other entities, 7.2
Other comprehensive income or loss, 1.22, 1.24, 2.5, 2.7, 2.14, 3.3 Other consolidated specified purpose accounts, 4.11, 4.14 Other deferred revenues—Specified purpose accounts, 5.6 Other departments,
Miscellaneous, 9.32, 9.41 Transition payments, pay in arrears, 9.32, 9.41
Other (diplomatic services, lieutenant governors, etc.), 6.24 Other employee and veteran future benefits, 1.23, 1.26
2.6, 6.2, 6.37 public sector pensions and, 2.13, 2.23
Other excise taxes and duties, 1.22, 2.5, 3.4, 3.5 Other fees and charges, 3.6 Other future benefits,
Financing arrangements, 2.24 Overview of benefit plans, 2.23
Other government-wide information, refer to Volume III, Section 10
Other levels of Government, Major transfer payments to, 1.22, 2.5, 2.16
Other liabilities, 1.23, 1.26, 2.6, 2.16, 2.29, 3.12, 6.2, 6.39 Others, 2.29
Other loans, investments and advances, 1.23, 1.26, 2.6, 2.34, 3.7, 9.3, 9.31
issuance of, 1.25, 2.8 repayment of, 1.25, 2.8
Other miscellaneous information, refer to Volume III, Section 11
Other program expenses, 1.22, 2.5, 3.3, 3.10, 3.13 Other receivables, 7.4 Other revenues, 1.22, 2.5, 3.3, 3.6 Other specified purpose accounts, 6.2, 6.48 Other taxes and duties, 1.22, 2.5, 3.4, 3.5 Other transactions, 1.26 Other transfer payments, 1.22, 2.5, 2.16 Outstanding cheques, 7.2
and warrants, 7.2 Overview of benefit plans, 2.23
P
Pacific Rim Mitigation Fund, 5.6, 5.8 Payments of claims against the crown, ex gratia payments
and court awards, refer to Volume III, Section 8 Pension accounts, 6.48 Pension assets, 2.26 Pension benefits,
overview of benefit plans, 2.23 funded, 2.23, 6.22, 6.23 unfunded, 2.24, 6.22, 6.24
Pension plan for federally appointed judges, 6.20 Pension plans, 6.18 Pensioners’ Dental Services Plan, 6.37, 6.38 Pensions and other future benefits, 1.23, 1.26, 2.6, 3.12, 6.18
change in, 1.25, 2.8 Pensions, other future benefits and other liabilities,
Public sector pensions, 6.2, 6.18 Personal and non-resident income tax, 5.10 Personal—Income tax revenues, 1.22, 2.5, 3.4 Personnel posted abroad, 9.31, 9.33 Petro-Canada Enterprises Inc—Unclaimed shares, 6.49, 6.56 Plan (Public sector pensions and other employee
and veteran future benefits), amendments, 2.24 curtailments, 2.25 settlements, 2.25
Portfolio investments, 1.26, 3.7, 9.3, 9.17 Preface to the consolidated financial statements of the
Government of Canada, 2.2
Public Accounts of Canada, 2015–2016
12 . 8 Index
P—concluded
Prepaid expenses and other, 1.23, 1.26, 2.6, 10.2 change due to, 1.24, 2.7
Price Pooling Program—Agricultural Marketing Programs Act, 11.38, 11.41
Prime Minister’s Awards, 5.6, 5.8 Private sector forecasts, Average, 1.3 Producer Payment Protection Claim Account, 6.41, 6.43 Professional and special services,
refer to Volume III, Section 3 Program activity, refer to the related ministerial section in Volume II Program expenses, other, 1.22, 2.5, 3.3, 3.10, 3.13 Program revenues, other, 3.6 Project deposits—Statistics Canada, 6.49, 6.56 Provincial and territorial governments, 1.26, 3.7, 9.3, 9.29 Provincial, Territorial and Aboriginal Tax Agreements
Account, 1.26, 5.3, 5.4 Provincial workers’ compensation boards, 9.31, 9.34 Public debt charges, refer to Volume III, Section 7 Public debt charges, 1.8, 1.23, 2.5, 2.16, 3.3, 3.12, 3.13, 3.14 Public sector pensions, 1.23, 1.26, 2.6, 6.2, 6.18, 6.22
and other employee and veteran future benefits, 2.13, 2.23 assets, 1.23, 2.6
Public Sector Pension Investment Board, 9.17, 9.20 Public Service Death Benefit Account, 6.48, 6.52 Public Service Health Care Plan, 6.37, 6.38 Public Service Pension Fund Account, 6.22, 6.23, 6.26 Public Service Superannuation Account, 6.22, 6.24, 6.25 Purchases, 11.24
Q
Queen’s Fellowship Fund, 4.11, 4.15, 5.7, 5.10
R
RADARSAT, 6.49, 6.56 RADARSAT-2, 5.6, 5.8
Data satellite, 5.6, 5.8 Recapitulation of external expenses by type,
refer to Volume II, Section 1 Recapitulation of external revenues by source,
refer to Volume II, Section 1 Reconciliation of external expenditures by standard
object to expenses, refer to Volume II, Section 1 Regional Aircraft Credit Facility, 11.38, 11.39 Regular Force Death Benefit Account, 6.48, 6.51 Remediation of contaminated sites, 2.20, 5.12
Changes in liability for, 5.13 Reporting entity, 2.9 Reserve Force Pension Fund Account, 6.22, 6.23, 6.29 Restitutions under the Competition Act, 6.42, 6.47 Restricted donations
Fisheries and Oceans, 5.6, 5.8 Veterans Affairs,
Canadian Memorial, 5.7, 5.9 Visitor Education Centre, Vimy Memorial, 5.7, 5.9 Wounded Warrior Fund, 5.7, 5.9
Retail debt, 1.23, 1.28, 6.2, 6.6 Retirement Compensation Arrangements (RCA) Account,
6.22, 6.24, 6.34 Retirement obligations, Asset, 5.11, 5.12 Retiring Allowances Account—Members of Parliament, 6.20 Return on investments, 3.6, 3.7
external, 3.7 internal to the Government, elimination of, 3.7 ministerial, 3.7
Accrual of other revenues, 3.7 Net (loss) gain on exchange, 3.7
Returned Soldiers’ Insurance Fund, 6.48, 6.52 Revenues, refer to the related ministerial section in Volume II
R—concluded
Revenues, 1.5, 1.22, 2.5, 2.9, 3.3 compared to 2014–2015, 1.6 composition of, 1.5 deferred, 5.2, 5.6 other, 1.22, 2.5, 3.3, 3.6 ratio, 1.6 tax, 1.22, 2.5, 3.3, 3.4
Revenues, expenses and accumulated deficit, Section 3 Revenues, expenses and accumulated deficit, 3.3 Revenues, expenses and other changes in equity of,
consolidated Crown corporations and other entities, 4.6 enterprise Crown corporations and other Government
business enterprises, 9.12 Rideau Hall—Donations, 5.7, 5.9 Rights and privileges, 3.6 Risks and uncertainties, 1.21 Royal Canadian Mounted Police
Benefit Trust Fund, 6.42, 6.47 Civil Remedies Grant Program, 5.7 Dependants’ Pension Fund, 6.48, 6.53
supplementary statement, 6.90 Disability and other future benefits, 6.37, 6.38 Pension Fund Account, 6.22, 6.23, 6.31 Pipe Band (NCR), 5.7, 5.9 Sponsorship Agreement — Contributions, 5.7, 5.9 Superannuation Account, 6.22, 6.24, 6.30
Royal Canadian Mounted Police Continuation Act, 6.24
S
Sales of goods and information products, 3.6 Sales of goods and services, refer to Volume II, Section 1 Sales of goods and services, 3.6 Sales of seized assets, 6.49, 6.54 Schedule of minimum payments, 11.2 Scholastic awards, 6.42, 6.47 Securities in trust—Bankruptcy and Insolvency Act, 6.49, 6.56 Security equipment purchases, 6.50, 6.58 Security for costs,
Courts Administration Service, 6.41, 6.44 Registrar of the Supreme Court of Canada, 6.41, 6.44
Segmented information, 2.40 Seized property—Cash, 6.42, 6.45 Seized Property Proceeds Account, 4.11, 4.15 Seized Property Working Capital Account, 9.32, 9.39 Sensitivity analysis, 2.28 Service fees for immigration and citizenship, 5.6, 5.7 Services of a non-regulatory nature, 3.6 Services of a regulatory nature, 3.6 Severance and other benefits, 6.37, 6.38 Share of annual profit in enterprise Crown corporations and
other government business enterprises, 1.25, 2.8 Shared-cost agreements
Agriculture and Agri-Food—Research, 5.6, 5.8 Canadian Food Inspection Agency, 6.49, 6.55 Natural Resources — Research, 6.50, 6.57 Remediation projects, 6.50, 6.58 Transportation research and development, 5.7, 5.9 Veterans Affairs, 6.49, 6.58
Shared-cost/joint project agreements Canadian Heritage, 6.48, 6.53
Shared-cost projects, Foreign Affairs, Trade and Development,
Support to various programs, 6.49, 6.55 Industry, 6.50, 6.57 Natural Resources, 6.49, 6.58 Privy Council Office—Media travel expenses, 6.50, 6.58
Ship-Source Oil Pollution Fund, 4.10, 4.13 Sick leave entitlements, accumulated, 6.37, 6.38 Significant accounting policies, Summary of, 2.9

Public Accounts of Canada, 2015–2016
Index 12 . 9
S—concluded
Small Business Loans Act, 11.38, 11.40 Social Sciences and Humanities Research Council
Queen’s Fellowship Fund, 5.7, 5.10 Trust Fund, 5.6, 5.9
Softwood lumber products export charge, 3.4 Source and disposition of authorities by type (voted and statutory),
refer to Volume II, Section 1 Source and disposition of budgetary authorities by ministry,
refer to Volume II, Section 1 Source and disposition of non-budgetary authorities by ministry,
refer to Volume II, Section 1 Source of budget amounts, 2.16 Special account—Courts Administration Service, 6.50, 6.57 Special deposits—Cash in bank, 7.2 Special drawing rights allocations, 1.27, 8.2, 8.4 Special Operating Account—Library and Archives of Canada,
5.6, 5.8, 6.48, 6.53 Specific claims, 2.39 Specified purpose accounts,
other, 6.2, 6.48 other deferred revenues, 5.6
Spectrum auctions, Deposits from, 6.41, 6.44 Spectrum license fees, 5.6, 5.7 Spending and borrowing authorities, 2.15 Spending authorities, 2.15
over-expenditure of, 2.15 Sponsorship agreement—Contributions, 5.7, 5.9 Statement of all borrowing transactions on behalf of
Her Majesty, 6.10 Statement of responsibility, 2.3 St. Lawrence Seaway Management Corporation, 9.32, 9.40 Stoney Band Perpetual Loan, 9.32, 9.39 Strategic outcome and program activity descriptions,
refer to the related ministerial section in Volume II Summary combined financial statements of enterprise
Crown corporations and other government business enterprises by segment, 9.9
Summary financial statements of, consolidated Crown corporations and other entities, 4.3 enterprise Crown corporations and other government
business enterprises, 9.8 Summary of insurance programs of agent enterprise Crown
corporations, 11.43 Summary of significant accounting policies, 2.9 Summary of transactions in public sector pensions that
resulted in charges to expenditures, 6.23, 6.24 Supplementary Fines Account—Species at Risk Act, 4.11, 4.14 Supplementary Fish Fines Account, 4.11, 4.14 Supplementary information required by the Financial administration
Act, refer to Volume III, Section 2 Supplementary Retirement Benefits Account, 6.22, 6.23, 6.24, 6.35
Judges, 6.22, 6.24 Others, 6.22, 6.24
Support and development of trade Export Development Canada, 9.32, 9.36
Swap agreements, 2.36 Swap collateral deposit, 6.41, 6.44
T
Tangible capital assets, 1.23, 1.26, 2.6, 2.35, 10.4 acquisitions of, 1.24, 1.25, 2.7, 2.8 amortization of, 1.24, 1.25, 2.7, 2.8 by main custodian ministries, 10.4 change due to, 1.24, 2.7 cost and accumulated amortization, 1.20 net, 10.2 net loss or gain on disposal of, including adjustments, 1.24, 1.25,
2.7, 2.8 proceeds from disposal of, 1.24, 1.25, 2.7, 2.8
Tax revenues, 1.22, 2.5, 3.3, 3.4 Taxes and duties, other, 3.5 Taxes and other accounts receivable, 2.30 Taxes receivable, 1.23, 1.26, 2.6, 7.2, 7.3
change in, 1.25, 2.8 Taxpayers, amounts payable to, 1.23, 1.26, 2.6, 5.2, 5.10
corporate income tax; customs and excise; goods and services tax; personal and non-resident income tax, 5.10
Telefilm Canada—Advance Account, 6.48, 6.53 Temporary deposits received from importers, 6.41, 6.44 Total expenses by segment, 2.17 Transactions in the Employment Insurance
Operating Account, 4.13 Transfer payments, refer to the related ministerial section in Volume II
and Volume III, Section 6 Transfer payments, 1.22, 2.5, 3.3, 3.10, 3.13
by province and territory, major, 3.11 Canada health and social transfer, 1.22 Canada health transfer, 1.22 Canada social transfer, 1.22 Fiscal arrangements, 1.22 other, 2.5 other major transfers, 1.22 to other levels of government, Major, 1.22, 2.5, 2.16
Transfer payment agreements, capital assets, purchases and operating leases, 11.3
Transformation of Pay Administration, 2.42 Transition payments—Pay in arrears, 9.32, 9.41 Treasury bills, 1.23, 1.27, 6.2, 6.5
average yields at tender, 6.9 Trust accounts, 6.42 Trust Fund,
Benefit, 6.42, 6.46 Global Environment Facility, 9.25, 9.27 Inmate’s, 6.42, 6.47 National Battlefields Commission, 4.11, 4.14 Social Sciences and Humanities Research Council, 5.6, 5.9 Veterans administration and welfare, 6.43, 6.47
Public Accounts of Canada, 2015–2016
12 . 10 Index
U
Unamortized discounts and premiums, 1.26, 9.5 on the buy-back of bonds, 1.24 on market debt, 1.23, 1.27, 6.2, 6.8, 6.10 on marketable bonds, 6.8
Unamortized discounts on, Canada Bills, 6.8 Treasury Bills, 6.8
Unclaimed dividends and undistributed assets Bankruptcy and Insolvency Act, 6.49, 6.56 Canada Business Corporations Act, 6.49, 6.56 Winding-up and Restructuring Act, 6.49, 6.56
Unconditionally repayable contributions, 9.31, 9.33 Unexploded explosive ordnance affected sites, 5.12 Unmatured debt, 1.23, 1.27, 2.6, 2.12, 2.21, 3.12, 6.2, 6.3
other, 1.23, 1.27, 6.2, 6.10 payable in Canadian currency, 1.23, 1.27, 6.2 payable in foreign currencies, 1.23, 1.27, 6.2
V
Vehicles, 10.6 by sub-category, 10.6
Veterans Administration and Welfare Trust Fund, 6.43, 6.47 Veterans’ disability and other future benefits, 6.37, 6.38 Veterans Insurance Fund, 6.48, 6.52 Veterans’ Land Fund
Advances, 9.32, 9.40 Allowance for conditional benefits, 9.41
Vimy Memorial—Visitor Education Centre, 5.7
W
War Claims Fund—World War II, 6.49, 6.54 W.G. Schneider Fund, 4.11, 4.15 Winter Capital Projects Fund, 9.29, 9.30 Workers’ compensation, 6.37, 6.38 Workers’ Compensation Board,
Deposits/Disbursements, 6.50, 6.57 World Health Organization, 6.49, 6.55


![MERC Basics PowerPoint - MASTER 10-9-17 [Read-Only]€¦ · · 2017-10-16Public School Strikes & Lockouts (2016 PA 194) 49 MERC Website and Contact Information 50 Glossary of Acronyms](https://static.documents.pub/doc/80x56/5ae185d87f8b9ab4688ecdfb/merc-basics-powerpoint-master-10-9-17-read-only-2017-10-16public-school-strikes.jpg)


