+ All Categories
Home > Documents > Public Alligator Hunting Season Report...

Public Alligator Hunting Season Report...

Date post: 15-Mar-2018
Category:
Upload: nguyentram
View: 217 times
Download: 3 times
Share this document with a friend
19
Alligator Hunting Season Report 2015 Submitted by: Jay Butfiloski Furbearer & Alligator Program Coordinator South Carolina Department of Natural Resources Wildlife & Freshwater Fisheries Division Alligator Project PO Box 167 Columbia, SC 29202 www.dnr.sc.gov F&AP Report 15-05
Transcript

Alligator Hunting Season

Report 2015

Submitted by:

Jay Butfiloski

Furbearer & Alligator

Program Coordinator

South Carolina Department of Natural Resources

Wildlife & Freshwater Fisheries Division

Alligator Project

PO Box 167

Columbia, SC 29202

www.dnr.sc.gov F&AP Report 15-05

1

INTRODUCTION

The successful return of the American alligator (Alligator mississippiensis) since its near demise and

subsequent listing as “endangered” by the Endangered Species Act in the 1960s has prompted most

Southeastern states to implement hunting seasons to allow the public use of this unique natural resource.

The hunts are also seen as an attempt to maintain the number of nuisance alligator complaints at a

manageable level. The alligator is currently listed as “threatened,” not because of population numbers,

which are decidedly secure, but because of its “similarity of appearance” to other rare and protected

crocodilians worldwide. It is estimated that a minimum of 100,000 alligators occur in the state of South

Carolina.

The 2015 Public Alligator Hunting Season marked the eighth general alligator hunting season after a

closure of nearly 40 years. However, alligators have been legally hunted in South Carolina since 1995

under the Private Lands Alligator Harvest Program. The Private Lands Program was established as a

means for large landowners having significant amounts of alligator habitat to manage their alligator

numbers on a sustained-yield basis, and included quotas for specific size-class alligators. This year’s

public hunt, utilizing a random computer drawing, was open to all applicants, including nonresidents, and

was conducted on public and private lands (not enrolled in the Private Lands Program) from the Midlands

to the coast.

Because alligators can grow to considerable size, alligator hunters can have others assist them with the

taking of an alligator during the season. Everyone who participates must have a South Carolina hunting

license, or be under the age of 16. To participate in the public alligator season one must first apply online,

be selected, then pay a fee for a permit and harvest tag. The fee for the permit and tag is $100. In addition,

any nonresident hunter or nonresident assistant 16 years of age or older must pay a $200 nonresident

alligator hunting fee. By law, all fees collected for the alligator hunting program are used to support

administration of the alligator program in South Carolina, and for research, monitoring, and management

of this important and unique natural resource.

HUNTER SELECTION

The public alligator hunt is a limited-drawing hunt in which participants are selected in a randomized

computer drawing. All potential hunters are required to submit an application online to the Department

of Natural Resources (DNR) website (www.dnr.sc.gov) and pay a non-refundable application fee of $10.

The four hunt units (Figure 1) remain unchanged. With the exception of a small portion of Berkeley

County located within Lake Marion, county lines bound all hunt units. The allocation of permits for 2015

was 250 per hunt unit based on 1,000 total tags available. Hunters could select the option to be considered

for any or all of the units for the computer drawing, but if successful, are only selected to hunt in one unit.

After paying the $100 tag fee, those selected for the hunt were issued a permit and one harvest tag. All

alligator harvest tags and permits are issued specifically to the selected hunter and are non-transferrable.

The harvest tag is a numbered, permanently locking nylon tag that must be attached to the alligator’s tail

immediately after harvest. The permit and tag allowed a hunter to take one alligator greater than 4 foot in

total length from either public or private waters in their selected hunt unit; however, no alligator hunting

is allowed on certain public lands such as Wildlife Management Areas (except in navigable waters

2

normally open to the general public for hunting), State Parks or Federal properties such as National

Wildlife Refuges and their jurisdictional waters.

Two Wildlife Management Area (WMA) properties, Bear Island and Santee Coastal Reserve, were opened

for alligator hunting beginning in 2011. These two WMAs were part of a special draw hunt held separately

from the regular Public Hunting Season. Applicants for the WMA Alligator Hunts were required to select

an area and a week to hunt on the WMA. Only two hunters per WMA were selected per week, with 4

weeks available, for a total of 16 slots available. If chosen, the applicant was issued a permit and tag that

was valid for the WMA and week selected, or at their choosing, could elect to use the tag in the same unit

that the specific WMA was located for the remainder of the public alligator season. Bear Island is in the

Southern Coastal Unit and Santee Coastal Reserve is located in the Middle Coastal Unit. The cost to apply

for the WMA Alligator Hunt is $15, and the cost for the permit and tag is $500 for residents and $800 for

nonresidents. A WMA Permit is required of all WMA Alligator Hunters and assistants. Because the two

draw hunts are separate, a person could potentially be drawn for both the Public and WMA hunting season.

Beginning in 2012, there was the option to purchase an additional tag for a smaller alligator during the

WMA hunt. This additional tag was only valid for an alligator from 4-7 feet in length, and only for the

chosen WMA during the week selected. Anyone in the hunting party could utilize the tag if the selected

hunter was present.

Figure 1. 2015 Alligator Management Units.

Bear Island

WMA

Santee Coastal

Reserve

WMA

3

Legislation passed during the 2010 legislative session requires that all nonresident alligator hunters pay a

nonresident alligator hunting fee. This fee is in addition to any application, licensing, and permit fees

normally required to hunt alligators, regardless of the alligator hunting program. The cost is $200 and is

required of all nonresident hunters, as well as all nonresident assistants that are 16 years of age or older.

Thus, the minimum cost for a nonresident alligator hunter that receives a permit and tag in the hunt

selection is $350. The fee breakdown would be: $10 for the application, $100 for the permit/tag, $200 for

the nonresident alligator hunting fee, and $40 for a 3-day nonresident hunting license. Nonresident

assistants 16 years of age or older would pay a minimum of $240. This would include the $200

nonresident fee and a 3-day hunting license ($40). The minimum cost for a nonresident alligator hunter

that receives a permit and tag in the WMA hunt selection is $1,131. The fee breakdown would be: $15

for the application, $800 for the permit/tag, $200 for the nonresident alligator hunting fee, $76 for the

WMA permit, and $40 for a 3-day nonresident hunting license. Nonresident assistants 16 years of age or

older would pay a minimum of $316. This would include the $200 nonresident fee, WMA permit ($76),

and a 3-day hunting license ($40). Nonresident assistants under 16 do not pay any fees. Other states have

similar additional nonresident fees or prohibit nonresident participation altogether.

The lottery selection process began as usual on May 1st and ended on June 15th. A total of 4,694 hunters

applied for the 2015 hunt, a decrease of 15.0% from the previous season. This percentage included

applicants from 43 different states (including SC) along with one applicant from the Virgin Islands. The

number of resident applicants decreased slightly to 88.1% of the total applications received for the Public

Hunting Season. Of the non-residents, NC and GA residents were 3.9% and 1.3% of the total number of

applicants. No other states' applicants were more than 1% of the total.

A total of 211 applications for the WMA Alligator Hunt were received from thirteen different states. The

number of applicants increased 8.2% from the previous season. SC residents comprised the majority

(75.8%) of the WMA applicant pool, followed by 6.2% from NC, 4.7% from VA, and 3.8% from GA.

As was the case last season, no one with less than two preference points was selected for the Public

Alligator Hunting season. The majority (90.5%) had two preference points. The remaining selected

hunters had three (9.0%) or four (0.5%) preference points. Another 272 applicants with two or more

preference points were not selected this season. Applicants lose any accumulated preference points once

selected for a permit, whether the permit is purchased or not.

A total of 798 of the 1,000 hunters selected (79.8%) in the 2015 season completed the application process

and were issued a harvest tag and permit. The tag purchase rate was down from last year's rate of 83.6%.

Nevertheless, this purchasing rate still remains above the predicted fulfillment rate of 75-80% relative to

the targeted tag distribution. Currently, the targeted allotment is 1,000 tags, a number which is subject to

change in future years based on harvest and/or alligator survey data.

The 2015 Alligator Hunting Guide, (http://www.dnr.sc.gov/wildlife/alligator/pdf/2015gatorguide.pdf),

was updated to reflect changes from the previous season.

The 2015 season began at noon on September 12th and ended at noon on October 10th.

4

SEASON RESULTS

All permitted alligator hunters were required to report their hunting activities by November 1st, regardless

of whether or not they actually went alligator hunting in South Carolina. Reporting compliance for 2015

was 70.5% for all fully permitted hunters. Those hunters who did not report are not eligible to apply for

the next hunting season.

The total number of alligators reported taken during the 2015 public alligator hunting season was 319, an

increase of 8 alligators (2.6%) from the 2014 season. This represents a success rate of 40.0% for all fully

permitted hunters (n=798) and 31.9% for all selected applicants (n=1,000). The Southern Coastal unit

had the most alligators taken at 95 (29.8% of total harvest), followed by the Middle Coastal with 81,

Midlands with 74, and the Pee Dee unit at 69 alligators (Table 1).

Table 1. The number of alligators taken and percent of total alligators harvested for the 2015 season by

Hunt Unit.

Hunt Unit Number of Alligators Percent of Total

Taken Harvest*

Middle Coastala 81 25.4%

Midlands 74 23.2%

Pee Dee 69 21.6%

Southern Coastal 95 29.8%

Total 319 100.0%

*Percentages may not be equal due to rounding of decimal numbers.

Fully permitted hunters (n=798) who actually reported going hunting (n=528) had a success rate of 60.4%.

The number of hunters that hunted but were unsuccessful was 209 (26.2%). Another 5.6 percent of hunters

(n=45) that paid their $100 tag fee reportedly did not go alligator hunting this season. The reported

participation rate was highest in the Southern Coastal unit with 56.4% of all selected hunters (n=250) for

the unit going on at least one alligator hunting trip. Participation rates for the other units were as follows:

Midlands unit at 52.8% (n=250), Pee Dee at 51.2% (n=250), and the Middle Coastal at 50.8% (n=250).

Statewide, the participation rate was 52.8% (Figure 2).

Of all participating hunters reporting, the Midlands hunters averaged 2.5 days afield (SD=1.8). In both

the Southern Coastal unit and the Pee Dee unit hunters went on 2.3 hunting trips (SD=1.8 and 1.9,

respectively) per hunter. Lastly, hunters in the Middle Coastal averaged 2.2 days per afield (SD=1.8).

Collectively, all hunters spent 2.4 days while hunting alligators (SD=1.9).

5

Figure 2. Reported participation rate (at least one trip afield) for all hunters selected to participate in the

2015 alligator season by Hunt Unit.

Considering only the successful hunters, the most efficient hunters were from the Pee Dee unit. These

hunters went afield 140 times for an average of 2.0 trips per alligator killed (SD=1.8). Successful Middle

Coastal hunters went, on average, 2.1 days for each alligator taken (SD=1.8) and Southern Coastal hunters

also averaged 2.1 days afield (SD=1.7). Lastly, Midlands hunters took one alligator for every 2.5 days

hunting for each alligator taken (SD=1.8). On average, all successful hunters spent 2.2 days hunting for

every alligator taken (SD=1.8).

The average size of all alligators reported taken during the 2015 public season was 8.9 feet (SD=1.8). The

average size of alligators taken in the Midlands units led all others at 9.6 feet (SD=2.1), followed by the

Middle Coastal at 9.1 feet (SD=2.0), the Southern Coastal at 8.6 feet (SD=1.8), and lastly the Pee Dee

averaged 8.3 feet (SD=1.8) (Figure 3). Three alligators were reported to be 13 feet or greater (0.01% of

total), one less than last year (Figure 4). According to harvest reports, the largest alligator taken this

season was 13’7 ½” from the Middle Coastal unit. The smallest alligator reported was 4’4”.

Twenty (6.3%) alligators taken were reported to be less than 6 feet in length. The number of smaller

alligators (six-feet and smaller) decreased from last year from sixty in 2014 to fifty-six (17.6% of total)

this season. The greatest number (34.6%) of larger alligators, those 10 feet and larger, came from the

Midlands unit followed closely by the Middle Coastal (30.1%). Of the very large alligators, the Midlands

(n=8) had a slightly larger number of the total alligators taken that were in the 12 or 13 foot-class, followed

closely by the Middle Coastal unit (n=6) The Pee Dee unit had three animals in the 12 to 13 foot-class

with the Southern Coastal having two. Three thirteen-foot class alligators were taken this season. One

50.8%52.8% 51.2%

56.4%

52.8%

0%

10%

20%

30%

40%

50%

60%

70%

80%

Middle Coastal Midlands Pee Dee Southern Coastal Statewide

Rep

ort

ed

Part

icip

ati

on

Rate

Hunt Unit

6

Figure 3. Average size of alligators taken during the 2015 Public Hunting Season by Hunt Unit.

Figure 4. Number of alligators taken by size class during the 2015 Public Hunting Season.

9.1

9.6

8.3

8.6

8.9

6

6.5

7

7.5

8

8.5

9

9.5

10

Middle Coastal Midlands Pee Dee Southern Coastal Statewide

Av

era

ge

Le

ng

th (

ft)

Hunt Unit

0

10

20

30

40

50

60

70

4 ft 5 ft 6 ft 7 ft 8 ft 9 ft 10 ft 11 ft 12 ft 13 ft

Nu

mb

er

Length Class

7

each in the Midlands, Middle and Southern Coastal units. Overall there was a 23.3% increase in the

number of alligators taken in all size classes greater than 8-foot. (Table 2; also see Appendices).

Alligator harvest was reported from nineteen coastal plain counties, one more than last season. Reported

take by county revealed that three counties: Berkeley, Georgetown, and Colleton, comprised over 64% of

the public alligator harvest (Table 3; Appendix V). Those same counties have accounted for

approximately 60% to 70% of the total harvest since the 2009 season. The largest alligators (10'+) also

came from these four counties that were in three different hunt units: Berkeley (n=25), Georgetown

(n=14), Clarendon (n=13), and Colleton (n=13). On average, the largest alligators came from Jasper

County, followed by Sumter, Barnwell, Calhoun, and Orangeburg. (Figure 5).

Table 2. Number of alligators taken by size class and Hunt Unit during the 2015 Public Hunting Season.

Hunt Unit Alligator Size Classa

4’ 5’ 6’ 7’ 8’ 9’ 10’ 11’ 12’ 13’

Middle Coastalb 0 4 9 14 9 13 13 13 5 1

Midlands 2 1 5 10 6 14 10 18 7 1

Pee Dee 0 6 11 13 16 9 8 3 3 0

Southern Coastal 0 7 11 18 18 19 14 6 1 1

Totals 2 18 36 55 49 55 45 40 16 3 Change from 2014 -2 -3 +1 -8 -10 +15 +7 +7 +2 -1

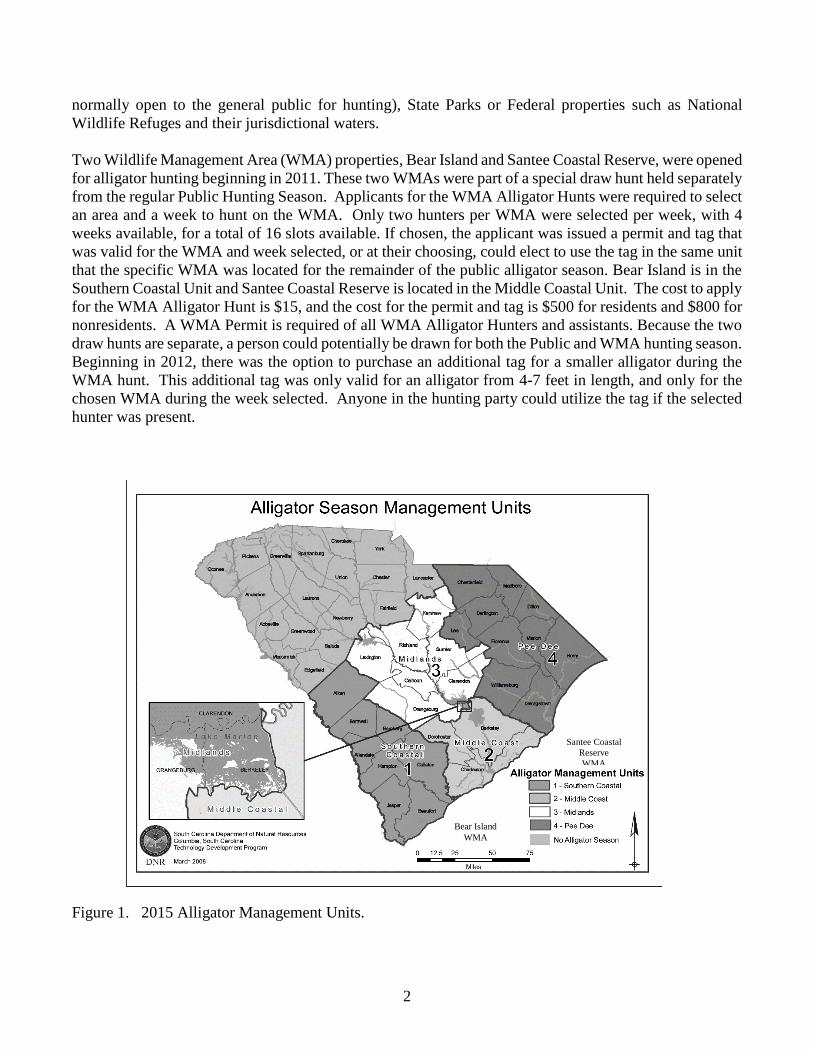
a Shaded area denotes “larger” alligator size classes.

8

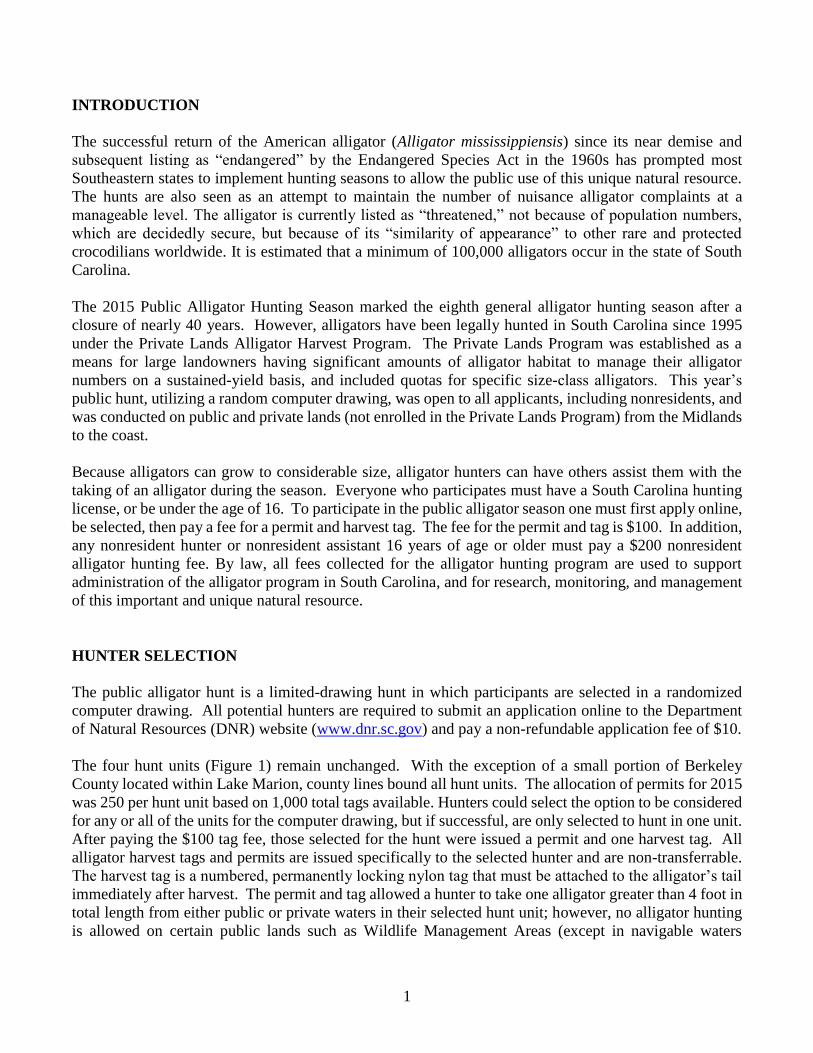
Table 3. 2015 Alligator harvest and percent of total alligator harvest by hunt unit and county.

Hunt Unit County Number of Alligators Percent of Total

Taken Harvest*

MIDDLE COASTAL 81 25.4%

Berkeleya 73 22.9%

Charlestonb 8 2.5%

MIDLANDSc 74 23.2%

Clarendon 28 8.8%

Orangeburg 16 5.0%

Berkeleyd 13 4.1%

Calhoun 11 3.4%

Sumter 5 1.6%

Kershaw 1 0.3%

SOUTHERN COASTAL 95 29.8%

Colleton 57 17.9%

Beaufort 31 9.7%

Hampton 2 0.6%

Jasper 2 0.6%

Aiken 1 0.3%

Allendale 1 0.3%

Barnwell 1 0.3%

PEE DEE 69 21.6%

Georgetown 64 20.1%

Florence 2 0.6%

Horry 2 0.6%

Marion 1 0.3%

TOTAL 319 100%

a Includes the portion of Berkeley County in the lower end of Lake Marion. b Does not include the portion of Berkeley County in the lower end of Lake Marion.

*Percentages may not be equal due to rounding of decimal numbers.

9

*Represented by only one alligator.

Figure 5. Average length of alligators reported taken during the 2015 Public Harvest Season by county.

0 2 4 6 8 10 12

AIKEN*

ALLENDALE*

FLORENCE

KERSHAW*

MARION*

HAMPTON

GEORGETOWN

BEAUFORT

COLLETON

HORRY

CHARLESTON

BERKELEY

CLARENDON

ORANGEBURG

CALHOUN

BARNWELL*

SUMTER

JASPER

Average Length (ft)

Co

un

ty o

f H

arv

est

10

Reported meat yield from all harvested alligators was 9,383lbs, a 16.9% increase from 2014.

The most commonly reported alligator capture technique was a hook and line, with three-quarters (74.8%)

of all successful hunters using this as a primary capture device. Just over eleven percent of hunters used

a crossbow, followed by a bow (8.2%), harpoon (5.0%) and the remainder of the hunters describing using

other devices (Figure 6). A total of 14.7% of the successful hunters utilized a guide’s services, down

slightly (0.5%) from the previous season.

Alligator hide utilization (sold, kept, or given away) was reported at 73.7%.

Figure 6. Reported initial capture device utilized during the 2015 Alligator Season.

Bow8.2%

Crossbow11.3%

Harpoon5.0%

Hook & Line74.8%

Other<1%

11

SEASON RESULTS – WILDLIFE MANAGEMENT AREAS

Starting with the 2012 season, WMA alligator permittees were given the option to purchase a "smaller"

alligator tag in addition to the normal WMA alligator tag. This tag allowed the take of an additional

alligator seven feet or smaller in length. Thus, with sixteen WMA permits available, up to a total of thirty-

two tags were offered to selected WMA hunters if the additional tag was purchased. Seven of the

additional "smaller" alligator tags were purchased this season. Eight alligators were taken from Bear Island

WMA and seven from Santee Coastal Reserve (Table 4). The average size for alligators on Bear Island

WMA using the normal WMA tag exceeded the public hunting average of 8.9 feet. Bear Island alligators

averaged 10.2 feet and Santee Coastal WMA averaged 10.1 feet. The largest alligator taken from Bear

Island was 11’6”, the largest on Santee Coastal Reserve was 12’0”.

While the normal WMA tag allows the hunter to take an alligator from the WMA during the week

assigned, this tag can also be used in the same Public Alligator Hunt Unit where the WMA is located. No

WMA hunters took advantage of this option this season.

Table 4. 2015 WMA Alligator harvest by week and management area.

Wildlife Management Week Number of Alligators

Area Taken

Bear Island WMA 8

First 4

Second 2

Third 1

Fourth 1

Santee Coastal WMA 7

First 2

Second 3

Third 2

Fourth 0

12

DISCUSSION AND RECOMMENDATIONS

The number of applicants for this season’s alligator hunt decreased. This year’s applicants were down

29.3% from the all-time high back in 2012 (n=6640), arguably at the height of various alligator-related

TV shows. It is also possible that for many people, alligator hunting is a one and done kind of activity.

Certainly there are hunters that apply annually; however, there is just as likely a segment of the hunting

community that wants to alligator hunt just once, then drop out of the applicant pool altogether.

This year’s application process was fairly uneventful. All notifications were delivered via email. Many of

the problems from previous years seem to be slowly fading away. Certainly, familiarity with the

application system can account for much of this. In addition, other Department lottery draw hunts are now

using this same application system, so many of the hunt customers may be getting used to the application

process in general.

An unanticipated event took place this season near the end of the hunting period. Historical rainfall and

flooding began in early October and impacted the remainder of the hunting season for many of the hunt

units. Certainly, many bodies of water were at dangerously high levels, preventing safe access to many

of the traditional hunting locations and access points. There is no doubt that overall harvest efforts and

totals were influenced by this event to some degree. Nevertheless, even given the potential loss of hunting

from the historical rainfall event, success rates for all selected hunters increased slightly from the previous

season, from 31.1% to 31.9%, but below the long-term average of 38.1%, with the present season excluded

(Figure 7).

Figure 7. Percent success rate for all selected hunters, by season.

0.0%

5.0%

10.0%

15.0%

20.0%

25.0%

30.0%

35.0%

40.0%

45.0%

50.0%

2008 2009 2010 2011 2012 2013 2014 2015

Year

% Success Rates for all Selected Hunters

Long-term average

13

The harvest of large alligators appears to have returned to some degree after concerns that too many very

large alligators were being removed from the population. There is still uncertainty as to how many of

these animals can be taken annually on a sustainable basis, but there is some encouragement that these

alligators are still available for hunters.

For the 2016 season, no changes are anticipated.

14

Appendix

2015 Harvest Graphs

by

Public Alligator Harvest Hunt Unit

&

County of Harvest

&

Cumulative Harvest Totals by Year

15

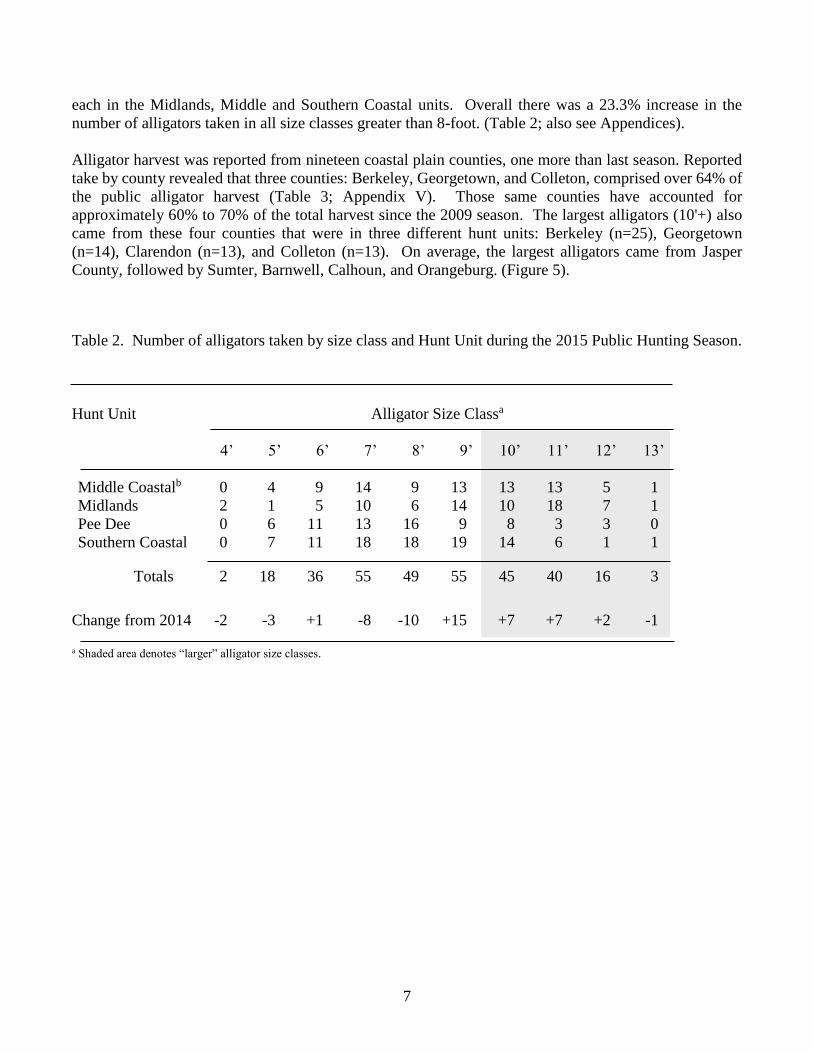
Appendix I. Number of alligators taken during the 2015 Public Hunting Season by size class for the

Midlands Hunt Unit.

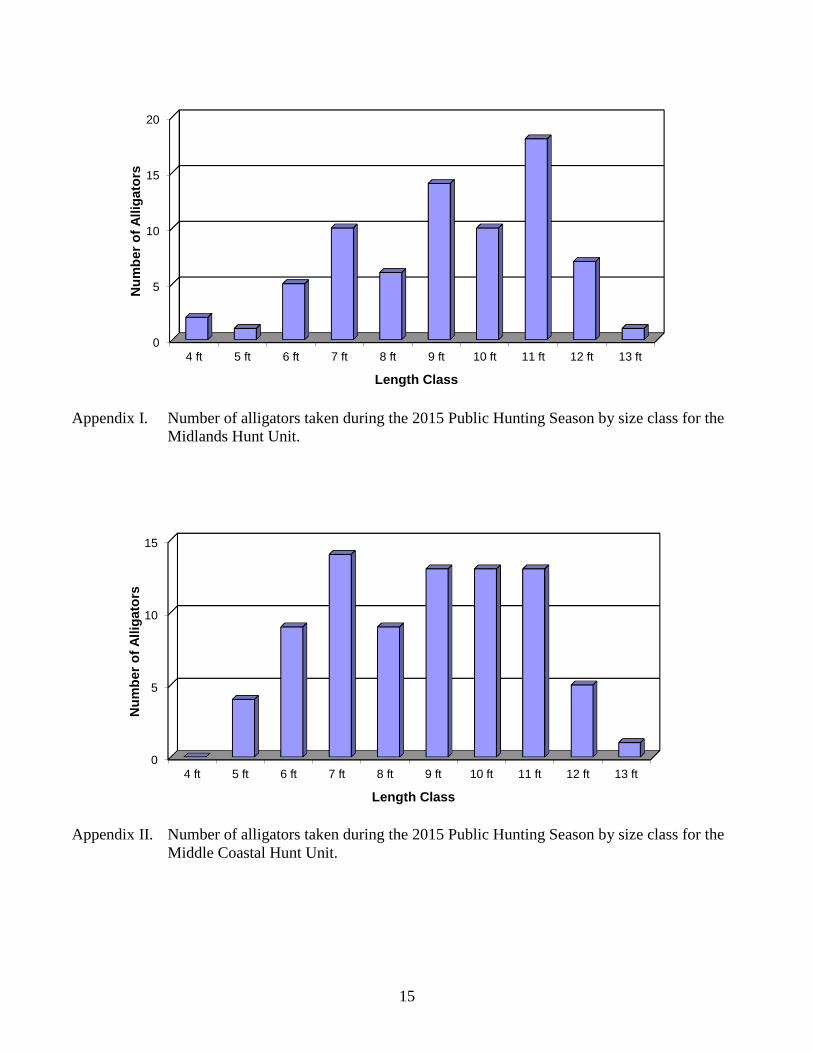
Appendix II. Number of alligators taken during the 2015 Public Hunting Season by size class for the

Middle Coastal Hunt Unit.

0

5

10

15

20

4 ft 5 ft 6 ft 7 ft 8 ft 9 ft 10 ft 11 ft 12 ft 13 ft

Nu

mb

er

of

Allig

ato

rs

Length Class

0

5

10

15

4 ft 5 ft 6 ft 7 ft 8 ft 9 ft 10 ft 11 ft 12 ft 13 ft

Nu

mb

er

of

Allig

ato

rs

Length Class

16

Appendix III. Number of alligators taken during the 2015 Public Hunting Season by size class for the

Southern Coastal Hunt Unit.

Appendix IV. Number of alligators taken during the 2015 Public Hunting Season by size class for the

Pee Dee Hunt Unit.

0

5

10

15

20

4 ft 5 ft 6 ft 7 ft 8 ft 9 ft 10 ft 11 ft 12 ft 13 ft

Nu

mb

er

of

Allig

ato

rs

Length Class

0

5

10

15

20

4 ft 5 ft 6 ft 7 ft 8 ft 9 ft 10 ft 11 ft 12 ft 13 ft

Nu

mb

er

of

Allig

ato

rs

Length Class

17

Appendix V. Number of alligators taken during the 2015 Public Hunting Season by county of reported

harvest.

0 10 20 30 40 50 60 70 80 90 100

BERKELEY

GEORGETOWN

COLLETON

BEAUFORT

CLARENDON

ORANGEBURG

CALHOUN

CHARLESTON

SUMTER

FLORENCE

HAMPTON

HORRY

JASPER

AIKEN

ALLENDALE

BARNWELL

KERSHAW

Number of Alligators

Co

un

ty o

f H

arv

est

18

0

10

20

30

40

50

60

70

80

90

4 ft 5 ft 6 ft 7 ft 8 ft 9 ft 10 ft 11 ft 12 ft 13 ft

Nu

mb

er

Length Class

2008

2009

2010

2011

2012

2013

2014

2015

Appendix VI. Number of alligators taken during all years of the Public & WMA Hunting Season, by

Hunt Unit.

Year

Hunt Unit 2008 2009 2010 2011 2012 2013 2014 2015 Total

Middle

Coastala 121 147 117 140 134 128 88 88 963

Midlands 87 93 104 87 90 82 57 74 674

Pee Dee 60 104 111 120 115 121 85 69 785

Southern

Coastalb 94 108 141 136 144 121 81 102 927

Annual

Total* 362 452 473 483 483 452 325 333 3,349

* includes alligators taken the WMA Alligator Hunting Program beginning in 2011.

a includes alligators taken at Bear Island WMA b includes alligators taken at Santee Coastal Reserve WMA

Appendix VII. Number of alligators taken during all years of the Public Alligator Hunting Seasons,

by size class.


Recommended