Public and Private Hospital Services Reform An Investigation in Iranian Hospitals Yaghoub Sheikh Zadeh, V.K. Seth, R.G. Vahidi, Ali Emrouznejad, Saeed Dastgiri* Abstract This research aimed to present a model of efficiency for selected public and private hospitals of East Azerbaijani province of Iran by making use of DEA approach in order to recognize and suggest the best practice standards. In other words, its aim was to suggest a suitable context to develop efficient hospital systems while maintaining the quality of care at minimum expenditures. It is recommended for inefficient hospitals to make use of the followings: transferring, selling, or renting idle/unused beds; transferring excess doctors and nurses to the efficient hospitals or other health centers; pensioning off, early retirement clinic officers, technicians/technologists, and other technical staff. The saving obtained from the above approaches could be used to improve remuneration for remaining staff and quality of health care services of hospitals, rural and urban health centers, support communities to start or sustain systematic risk and resource pooling and cost sharing mechanisms for protecting beneficiaries against unexpected health care costs, compensate the capital depreciation, increasing investments, and improve diseases prevention services and facilities in the provincial and national levels. Key words: DEA, linear programming, efficiency, hospital efficient management, public and private hospitals reform * - Yaghoub Sheikh Zadeh, Faculty of Management Studies, Delhi University, India, currently visiting BCIT, Canada; - Vijay. K. Seth, Faculty of Management Studies, Delhi University, India; - Reza G., Vahidi, Chairman of National Public Health Management Center (NPMC) and head of Public Health and Management Department, School of Public Health and Nutrition, University of Medical Sciences, Tabriz, Iran; - Ali Emrouznejad, Operations & Information Management, Aston Business School, Auston University, UK; - Saeed Dastgiri, Community Health and Epidemiology, Tabriz University of Medical Sciences, Iran, currently visiting University of Glasgow, UK; Correspondence author: Yaghoub Sheikh Zadeh [[email protected]].
Transcript
�
Public and Private Hospital Services Reform An Investigation in Iranian Hospitals
This research aimed to present a model of efficiency for selected public and private hospitals of East Azerbaijani province of Iran by making use of DEA approach in order to recognize and suggest the best practice standards. In other words, its aim was to suggest a suitable context to develop efficient hospital systems while maintaining the quality of care at minimum expenditures. It is recommended for inefficient hospitals to make use of the followings: transferring, selling, or renting idle/unused beds; transferring excess doctors and nurses to the efficient hospitals or other health centers; pensioning off, early retirement clinic officers, technicians/technologists, and other technical staff. The saving obtained from the above approaches could be used to improve remuneration for remaining staff and quality of health care services of hospitals, rural and urban health centers, support communities to start or sustain systematic risk and resource pooling and cost sharing mechanisms for protecting beneficiaries against unexpected health care costs, compensate the capital depreciation, increasing investments, and improve diseases prevention services and facilities in the provincial and national levels. Key words: DEA, linear programming, efficiency, hospital efficient management, public and private hospitals reform
* - Yaghoub Sheikh Zadeh, Faculty of Management Studies, Delhi University, India, currently visiting BCIT, Canada;
- Vijay. K. Seth, Faculty of Management Studies, Delhi University, India; - Reza G., Vahidi, Chairman of National Public Health Management Center (NPMC) and head of Public Health and
Management Department, School of Public Health and Nutrition, University of Medical Sciences, Tabriz, Iran; - Ali Emrouznejad, Operations & Information Management, Aston Business School, Auston University, UK; - Saeed Dastgiri, Community Health and Epidemiology, Tabriz University of Medical Sciences, Iran, currently visiting University
of Glasgow, UK; Correspondence author: Yaghoub Sheikh Zadeh [[email protected]].
Yaghoub Sheikh Zadeh et al. (2009) Public and Private Hospital Services Reform: An Investigation in Iranian Hospitals The 7th International Conference on Data Envelopment Analysis (by iDEAs), Philadelphia, PA.�
��
1. Introduction
This research was designed on the basis of the clear guidance of WHO which emphasizes
on “improving efficiency” as an objective, “cost-effectiveness” as an evaluation
indicator, and “health sector reform” as an strategy [1].
An efficient health care system saves time, money, and human energy, and ultimately
better serves patients in a more timely way. There are many ways to improve efficiency,
including ensuring services are provided by the most appropriate health professionals,
eliminating unnecessary paperwork/bureaucracy, performing the steps in a care process
in parallel instead of sequentially, and last but not least , of course more important doing
work with using less resources. A cost-effectiveness analysis takes into consideration the
policy targets and then examines the total costs of different alternative options to achieve
the target. A policy is cost-effective if it achieves the target at the lowest possible costs to
Yaghoub Sheikh Zadeh et al. (2009) Public and Private Hospital Services Reform: An Investigation in Iranian Hospitals The 7th International Conference on Data Envelopment Analysis (by iDEAs), Philadelphia, PA.�
��
society. Health sector reform takes place within a broader public sector reform context,
parallel to political reforms such as reallocation, decentralization, and financial reforms.
Health systems provide the critical interface between life-saving, life-enhancing
interventions and the people who need them. If health systems are weak, the effectiveness
of these interventions is likely to be weak too. Health systems thus deserve the highest
priority attention with a great effort to improve health and ensure that resources are
wisely used.
A. Statement of the Problem
In the literature of economics, health care services are considered as both public and
private goods (non-personal and personal services). Furthermore, non-personal services
are divided into two types: pure and impure; therefore, generally speaking, health care
services include three types of services: pure non-personal, impure non-personal, and
personal. In other words, health care services are considered as pure public goods (pure
non-personal services) since they are non-rival in consumption, i.e., when such goods are
produced, the producer can not preclude their consumption. From a different perspective,
since they don’t have complete non-rivalry feature (because someone’s consumption
decreases the others consumption capacity), health care services can be considered as
impure public goods (impure non-personal services). Also, health care services can be
private goods (personal services).In other words, one’s consumption can reduce the
possibility of the other’s consumption, and the producer sells the goods (services)
exclusively to the consumers who can afford the prices. You can put a price on private
goods (personal services) and ask the consumers to pay. Free rider is not possible about
private goods (personal services) while this is a characteristic of public goods (non-
Yaghoub Sheikh Zadeh et al. (2009) Public and Private Hospital Services Reform: An Investigation in Iranian Hospitals The 7th International Conference on Data Envelopment Analysis (by iDEAs), Philadelphia, PA.�
��
personal services). In economics and based on laws, governments are in charge of
producing public goods (non-personal services) especially the pure ones because the
private sector, which is seeking maximization of its benefits, has no motivation to
produce them. Moreover, it is difficult to identify their real consumers. As James W.
Henderson pointed out in “Health Economics & Policy”, “nonexcludable goods mean a
situation in which it is difficult to limit access to a good or service to a specific group of
customers. If the item is available to anyone, it becomes available to everyone.”
Even if they are identified, it is difficult to ask the consumers to pay; hence, the
production of private goods (personal services) is principally and mostly in the developed
countries ceded to the private sector; although the financing is on the basis of the tax-
public fund system.
By the help of the above concepts and criteria, we can analyse and investigate about the
philosophy of the public and private sector in the health care system and the
responsibilities and limitations of each of them.
Since health care services, like other goods and services, should follow economic
principles, it is necessary to use the minimum amount of scarce resources of production
in order to achieve country’s health care objectives.
1. Research Questions
The main questions in this research are:
1- To what extent are the current public and private hospitals of the province (mixed
system) efficient?
2- Which hospitals (public and private) have higher efficiency?
3- What changes can improve the hospitals’ efficiency/health care system?
Yaghoub Sheikh Zadeh et al. (2009) Public and Private Hospital Services Reform: An Investigation in Iranian Hospitals The 7th International Conference on Data Envelopment Analysis (by iDEAs), Philadelphia, PA.�
��
Concepts of efficiency: What does “efficiency” mean? Economics commonly distinguish
among different types: technical, scale, allocative, and cost efficiency.
According to Sophie Witter et al. in “Health Economics for Developing Countries: A
Practical Guide”, “Technical efficiency means carrying out agreed activities using the
least possible resources-or carrying the maximum activities possible using a fixed pot of
resources. For example, if you alter the procedures in your clinic so that you can increase
the number of patients you see (with quality remaining constant), then you have increased
your technical efficiency. (If you see more patients but provide a poorer service to each
one, then you have increased activity rates probably decreases efficiency.) Allocative
Efficiency indicates that a "just the right balance between pain and gain” has been
achieved, that is, directing resources to their most productive use. In health care terms, it
means assessing which intervention will produce greatest health gains for a given
investment of resources, and focusing on that activity. A hospital may be technically
efficient, for example, in that all procedures are carried out using the minimum of
resources necessary for those procedures. However, it may well be focusing on
allocatively inefficient activities-expensive, high technology activities which benefit a
small minority, rather than measures which offer more significant health gains.” As
Stephen Robbins et al. pointed out in “Management, “Efficiency refers to getting the
most output from the least amount of inputs or “doing things right”…while effectiveness
is often described as “doing the right things”-that is, those work activities that will help
the organization reach its goals…whereas efficiency is concerned with the means of
getting things done, effectiveness concerned with the end, or attainment of organizational
goals.” One fallacy in interpreting evaluation data is that of equating effectiveness with
efficiency. As Issel pointed out in “Health Program Planning and Evaluation: A Practical,
Yaghoub Sheikh Zadeh et al. (2009) Public and Private Hospital Services Reform: An Investigation in Iranian Hospitals The 7th International Conference on Data Envelopment Analysis (by iDEAs), Philadelphia, PA.�
��
Systematic Approach for Community Health”, effectiveness is the extent to which results
are achieved, whereas efficiency is a ratio of the amount of effect achieved to the amount
of effort or resources. According to Emmanuel Thanassoulis, in “Introduction to the
Theory and Application of Data Envelopment Analysis”, “Scale efficiency measures the
impact of scale size on the productivity of a decision making unit (DMU).” And finally,
economic or cost efficiency is the situation in which (with the given state of technology)
it is impossible to generate a larger welfare total from the available resources. In other
words, the situation where some people cannot be made better-off by reallocating the
resources or goods, without making others worse-off (Pareto Optimum).
2. Significance of the study
Since provision of health care services like production and provision of other goods and
services follow the economic rules, thereby it is necessary and a must to use the scares
resources at its minimum to achieve the health care system’s objectives (WHO, 1981).
In regards to the above discussion and inefficient performance of hospitals at East
Azerbaijani province gained from our experience, it is important to investigate the
efficiency status of the public and private hospitals of East Azerbaijani province in a
comparative study and to present a pattern for approaching a relatively ideal status
through prescribing for intervention in the system. The effect of the suggested model then
can be determined in some inefficient and selected hospitals by designing control and
experimental groups.
In order to make the importance of the issue clear, we take a short look at the funding of
health care in Iran. On the basis of Iran’s Budget Act in 2007/08 (1386, based on Iranian
calendar), general budget of East Azerbaijan was 6,044,622 million Rials, that is, 4.53
percent of the whole national budget and credits of provincial health care sector was
Yaghoub Sheikh Zadeh et al. (2009) Public and Private Hospital Services Reform: An Investigation in Iranian Hospitals The 7th International Conference on Data Envelopment Analysis (by iDEAs), Philadelphia, PA.�
��
1,609,197 million Rials (26.62 percent of the provincial budget) which 1,033,310 million
Rials out of that figure exactly allocated to the health care programs (almost all to the
public hospitals), and 3,889 million Rials allocated to the nonpublic health services plan
(nearly all to the private sector, charities, or institutional health centers), i.e., that totally
was 1,037,199 million Rials (64.45 percent of province health care university’s budget
and 17.16 percent of the general budget of the province) [2].
It seems that most of this amount of money –if not all- has been allocated to the public
hospitals (probably a limited amount is also given to private hospitals in the form of some
plans). We should note that these amounts are usually increased with specific percentages
every year depending on the incomes of the government – mostly oil incomes – and also
extent of the expansionary or concretionary monetary and fiscal policies.
3. Necessity of the Study
In this study we intended to investigate the efficiency of the use of these huge financial
resources which are spent in the hospitals of the province annually and by analysis of
various kinds of efficiency indicators, to be able to help the system to optimize the use of
public and private resources so that the saved amounts can be used for the promotion of
human beings life, health and their well-being.
Isn't there indeed any way for the better allocation of limited and rare resources in the
health care ground? Can a new plan be designed so as to emend health care system of the
province and even the whole country by making use of the saved financial amounts
through optimizing interventions and health economics rules and finally responding to
health needs of people which are being considered as their right?
The key questions which are important to answer are: how much efficiency do third level
health care providers (public hospitals) which consume an important part of annual health
Yaghoub Sheikh Zadeh et al. (2009) Public and Private Hospital Services Reform: An Investigation in Iranian Hospitals The 7th International Conference on Data Envelopment Analysis (by iDEAs), Philadelphia, PA.�
��
care budget of the province have? How are the conditions of these hospitals when
compared with one another? Which hospitals can be a model (best practice��bench mark)
for other ineffective hospitals and how?
What are the real, practical, precise, and scientific solutions of inefficiency and wasting
the resources?
B. Iranian Health Care System
According to the WHO’s report, Iran as a oil exporter and medium income country, the
fourth country in Asia with 30 provinces, 885 cities, and nearly 68,000 villages have 94
human development rank among 177 countries and 69.5 years life expectancy at birth. In
Iran, with per capita health care expenditures (totally in both public and private sectors)
$604 (compare with Norway $4,080, Malta $1733, Brazil $1520, Argentina $1,274,
South Korea and Singapore $1,100, Lebanon $817), government (ministry of health and
medical education) have responsibility to providing and financing primary health care
(PHC) services. Recent remarkable progresses in health sector (PHC) such as establishing
health networks (Khanehyeh Behdasht) have caused to improving various health
indicators. However, one of the most important problems is that about 8 to 10 percent of
people do not have access to any insurance plans, and then they have to tolerate the out-
of-pocket and catastrophic payments to reach the health care services [3]. Limited and
inadequate access to the health care services in some poor and less developed provinces
cause to relatively significant lessening in the health care indices in these provinces [4].
In 1926 public health bureau (SAHIYYEH) was established in Iran and in 1941 ministry
replaced it. In 1958, permission was issues, to let the private sector to provide health care
services [5]. In 1979, after the revolution, in regards to the constitution (principle 44), the
Yaghoub Sheikh Zadeh et al. (2009) Public and Private Hospital Services Reform: An Investigation in Iranian Hospitals The 7th International Conference on Data Envelopment Analysis (by iDEAs), Philadelphia, PA.�
�
economy of Iran is based on three axes: government, private, and cooperation, and in
regards to principle 43, government is held responsible to be in charge of people’s health.
However, after the revolution, the first steps towards privatization were taken according
to the first 5-year economic, social, and cultural program. At the present time, health
care services system of country has a mixed nature, in which public, private, and
cooperative sectors are providing services.
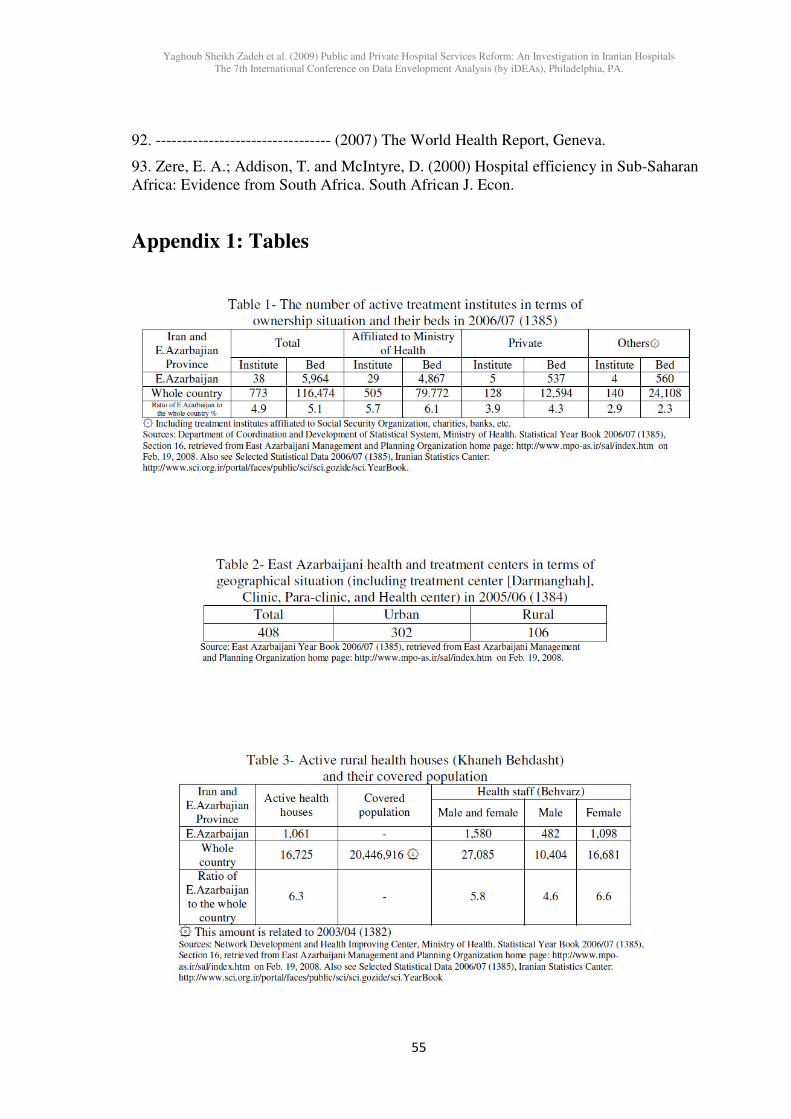
In 2006, there were 773 treatment institutes (hospitals, maternities, home cares) and
116,474 beds in the whole country. Also, the number of (public, private, and other)
institutes with their relevant beds were 505 public institutes (65.3%) with 79,772 beds
(68.5%); 128 private institutes (16.6%) with 12,594 beds (10.8%); and 140 other
institutes (18.1%) with 24,108 beds (20.7%) respectively [Table 1]. Furthermore, in that
year, 8,288 health and treatment centers (treatment places [Darmanghah], Clinics, Para-
clinics, and Health Centers) were active in all over country, where 77.1% governmental,
10.3% private, and 12.6% others [6]. Moreover, 70% of this health and treatment centers
were located in urban and the rest (30%) in rural areas. In 2005, there were 16,725 active
rural houses [Khaneh Behdasht] with 27,085 health staffs [Behvarz] that were able to
cover more than 20 million people [7].
According to the recent country budget Act in 2008, it has been dedicated 57,301.090
million Rials credits to the health and hygiene section that was 7.2 percent of the total
governmental general budget [8].
C. East Azerbaijani Health Care System
Based on the latest country’s divisions in 2004, East Azerbaijani Ostan (province)
consists of 19 townships, 42 districts, 57 towns, and 141 rural districts. Moreover,
Yaghoub Sheikh Zadeh et al. (2009) Public and Private Hospital Services Reform: An Investigation in Iranian Hospitals The 7th International Conference on Data Envelopment Analysis (by iDEAs), Philadelphia, PA.�
��
according to the general population and housing census in 1986, 1996, and 2006,
Azerbaijani population with annually growth rate 0.85 percent has been increased from
3,077,882, to 3,325,540, and then to 3,603, 456 people respectively and the life
expectancy was 70.7 years in 2005. In addition, the population of the province was
almost 5.1 percent of the whole country’s population [9].
Active Treatment Institutes in Terms of the Ownership and the Number of Beds
In 2006, there were 38 treatment institutes (4.9 percent of the whole country) which their
ownership status were as follows: 29 public (76.3%), 5 private (13.2%), and 4 other
institutes (10.5%) [Table 1].
1. Active Beds
Based on the information in 2006, there were 5,964 active beds (5.1 percent of the active
beds in the whole country) which their ownership situation were as follows: 4,867 public
(81.6%), 537 privates (9%), and 560 beds others (9.4%) including treatment institutes
affiliation to Social Security Organization, Charities affaires, Banks, and etc.) [Table 1].
2. Hospitals
25 out of 42 hospitals (about 60%) and the rest (17 out of 42, almost 40%) have been
located in Tabriz and other townships respectively [10].
3. Treatment Places (Darmanghah)
In 2005, 170 treatment centers were active throughout the province; that is, almost 4.86
treatment centers were provided their services per one hundred thousand people [11].
4. Health and Treatment Centers
In 2006, 106 out of 408 (74%) in cities and 106 out of 408 (26%) health and treatment
centers in the countries (rural districts) were active. Also, 319 out of these centers
Yaghoub Sheikh Zadeh et al. (2009) Public and Private Hospital Services Reform: An Investigation in Iranian Hospitals The 7th International Conference on Data Envelopment Analysis (by iDEAs), Philadelphia, PA.�
�
(78.2%) belong to public, 51 centers (12.5%) private, and 38 centers (9.3%) others [Table
2].
5. Rural Health house (Khaneh Behdasht Roostaei)
In 2005, there were 1,061 active rural health houses in the province (6.4% of the whole
country). In these house, 1,732 people (Behvarz, 68% male and 32% female) provided
health services in 3,047 villages for 1,232,877 people [Table 3 and 4]. In other words,
there were 8.62 rural health houses per ten thousand people.
6. Value-added of Health and Social Working Sector
This sector is divided up into four subsectors including public health care, private health
care, veterinary, and social working. According to regional accounts, in 2003 value added
of the province was 1,644.9 billion Rials which has been raised to last year remarkable
percent (57.15%) while the whole country’s growth was just 40.74%. This caused an
increase in the contribution of the provincial value added than the whole country from
3.65% in 2002 to 4.07% in 2003. The share of value added of health and social working
sector in province and the whole country were 3.68% and 3.43% respectively in 2003
[Table 5].
7. East Azerbaijani Health Care Budget in 2008
According to the national budget Act in 2008, 1,919,738 million Rials were dedicated to
the provincial health care plans (and not educational) which were equivalent to 3 percent
of the national health care budget [12].
8. Households’ Health Care Expenditures
In 2006, an urban household’s health care expenditures on average were 5,345,000 Rials
which consist of more than 10 percent of urban household’s total non-eatable
expenditures. Furthermore, in 2005, a rural household’s health care expenditures on
Yaghoub Sheikh Zadeh et al. (2009) Public and Private Hospital Services Reform: An Investigation in Iranian Hospitals The 7th International Conference on Data Envelopment Analysis (by iDEAs), Philadelphia, PA.�
��
average were 2,787,975 Rials (12 percent of rural household’s total non-eatable
expenditures) [Table 6]. Thus, it is perceivable that health care expenditures were one of
the most essential items in the provincial household’ consumption basket.
2. Literature Review
This section does not intend to do a comprehensive review of the health-related DEA
literature. Rather, it plans to provide brief information about just a limited number of
usages of this effective and developing method in the efficiency evaluation and various
aspects of the health systems.
The DEA has been extensively used in the various sectors of the developed countries’
economies to estimating the degree of the efficiency and planning the health care
systems.
In USA, Ozcan and Bannick [13] applied DEA to analyze the efficiency trends in defense
hospital. Ozcan et al. [14] obtained psychiatric hospitals’ efficiencies through DEA.
Huang [15] employed DEA in measuring the relative performance of Florida general
hospitals. Huang [16] utilized DEA to determine the efficiency of rural primary care
programs in North Carolina. In Connecticut, Chattopadhy and Ray applied DEA to
calculate the scores of the technical, scale, and size efficiency of 140 nursing homes
providing health care to the elderly [17]. Also, Shroff [18] used the DEA to examine the
efficiency of 26 potential sites for a long-term health care facility in the Northern
Virginia region.
In Europe, Kamal Field and Ali Emrouznejad [19] examined both technical and scale
efficiency using data envelopment analysis in a selection of 22 neonatal care units in
Scotland. Also, Parkin and Hollingsworth [20] utilized DEA to examine production
Yaghoub Sheikh Zadeh et al. (2009) Public and Private Hospital Services Reform: An Investigation in Iranian Hospitals The 7th International Conference on Data Envelopment Analysis (by iDEAs), Philadelphia, PA.�
��
efficiency of acute hospitals in the same country, Scotland [21]. Hollingsworth and
Parkin [22] applied DEA to investigate data of neonatal services for a sample of 49 units
in the United Kingdom by technical efficiency and economies of scale, to measure the
potential cost savings if the units were to run efficiently. Jacobs [23] using 232 UK
hospitals (Trusts) dataset compared the efficiency rankings of cost indicators with those
resulted using Data Envelopment Analysis (DEA) and Stochastic Frontier Analysis
(SFA). Linna et al. [24] applied a two-stage procedure to examine the technical and cost-
efficiencies (TE and CE) of oral care provision in Finland’s health centers. Thanassoulis
et al. [25] using DEA investigated service quality targets regarding perinatal-care in
England. Kooreman [26] applied DEA to estimate efficiency of home cares in the
Netherlands.
There is just limited number of international efficiency comparing in the Europe. Linna et
al. [27] compared degree of the cost-efficiency between 47 Finland’s public hospitals and
51 Norway’s ones. The other significant research is related to Locus Steinman [28] to
comparing efficiencies scores between 105 Germany’s hospitals and 251 of Swiss’ ones.
Furthermore, the powerful DEA approach method has been gradually used in the
developing and even some poor countries in Africa. Ersoy et al. [29] analyzed technical
efficiencies of Turkish hospitals using the DEA method. Majumdar [30] applied DEA to
measure relative efficiency points within the Indian pharmaceutical sector. Chang [31]
applied DEA to determine technical efficiency of six class one public hospitals in Taiwan
for five years. Using a variable return to scale (VRS) for DEA model, Wan et al. [32]
investigated the technical efficiency among 57 nursing units, in a third level care medical
centre in Taiwan (Republic of China).
Yaghoub Sheikh Zadeh et al. (2009) Public and Private Hospital Services Reform: An Investigation in Iranian Hospitals The 7th International Conference on Data Envelopment Analysis (by iDEAs), Philadelphia, PA.�
��
In Africa, some studies intended to apply DEA in the health industry. Kirigia et al. [33]
employed DEA to assess the technical and scale efficiency, and productivity change over
a four-year period among 17 public health centers in Seychelles. Kirigia et al. [34] used
DEA to find out what portion of 55 public hospitals of Kwazulu–Natal Province of South
Africa were operating efficiently, and for those inefficient hospitals, what inputs and
outputs contribute most to inefficiency. Kirigia et al. [35] applied DEA to estimate the
technical efficiencies among 155 primary health care clinics in Kwazulu–Natal Province
of South Africa. Eyob [36] estimated the technical efficiency among 86 public hospitals
in Eastern, Northern, and Western Cape Provinces of South Africa. In Zambia, Felix
Masiye et al. [37] estimated technical, allocative, and economic (cost) efficiencies for 40
private and public health centers. This study figured out that private centers had been run
more efficient than public ones. In other study on 18 public hospitals, 8 charity hospitals
(affiliated to the church), and 4 private hospitals (overall 30 hospitals) Masiye [38]
estimated technical efficiency. Kirigia et al. [39] assessed technical efficiencies of 32
public health centers and 54 district level public hospitals in Kenya. In Ghana, Daniel
Osey et al. [40] analyzed technical and scale efficiencies of 17 district hospitals and 17
health centers.
In Iran, there has been no such study but for the one done on 53 social security
organization hospitals just with analyzing efficiency scores by Hossein Hajialiafzali [41]
in 2002. Therefore, the present study is the first in its own kind in Iran.
3. Research Plan and Methodology
A. Research Plan
Yaghoub Sheikh Zadeh et al. (2009) Public and Private Hospital Services Reform: An Investigation in Iranian Hospitals The 7th International Conference on Data Envelopment Analysis (by iDEAs), Philadelphia, PA.�
��
1. General Goal
The present study tries to prepare the ground for optimizing interferences by presenting a
given economic model, i.e., obtaining Pareto optimal in the management of the province
and whole country’s hospitals through concept of cost-minimization, efficiencies, and
DEA approach.
2. Objectives
In this study, we are planning to present a model for the sample hospitals by making use
of efficiency criterion and identify the best practice standards. In other words, we plan to
establish efficient hospital systems maintaining a high quality and downsizing. Which
hospitals are efficient and inefficient in the public and private sectors in the samples of
the province? How much reduction in hospitals’ inputs can convert inefficient hospitals
to efficient ones? What are the impressive variables? And which variables do not play
any roles in enhancing efficiency? In other words, which variables are sensitive to
efficiency and which ones not? In this way, changes which improve hospitals are
identified and the way for presenting a new model is paved. This model can be tested in
one or two selected hospitals by interference in the system. If they responded positively,
this interference will also be made in other ineffective hospitals of the province and the
ground for structural reforms is prepared. It should be noted that the saved amounts can
be used for investment in various ways of preventing physical and mental diseases (for
example establishing gymnasiums, health clubs, healthy nutrition, etc). Finally,
successful accomplishment of these reforms can pave the way for extending these
reforms to regional and national levels and even introduce Iran as a successful example
for other developing countries. The findings of this research can help to save huge
amount of unnecessary expenditures and it can improve the health care and services. In
Yaghoub Sheikh Zadeh et al. (2009) Public and Private Hospital Services Reform: An Investigation in Iranian Hospitals The 7th International Conference on Data Envelopment Analysis (by iDEAs), Philadelphia, PA.�
��
fact, the health care expenditures like educational expenditures are considered as an
investment rather than consumption. Thereby, the optimal use of present scarce facilities
and resources will lead the system to new potentials in providing health care services.
Sustainable development will flourish when a successful health care system can bring
about a healthy and happy population, since the very nature of development depends on
capable, healthy and intelligent people. It is clear that the findings of this research can be
useful for policy-makers, executive managers, experts of economy, and health care
decision makers as well.
3. Research Questions
The main questions in this research are:
1- To what extent are the current public and private hospitals of the province (mixed
system) efficient?
2- Which hospitals (public and private) have higher efficiency?
3- What changes can improve the hospitals’ efficiency/health care system?
B. Methodology
1. Sample Size and Sampling: Hospitals’ Efficiency
In the present research, data and information obtained from the third level hospital were
used. In general, there are 42 first, second, and third level (rank) hospitals in the East
Azerbaijan province as follows: 25 out of 42 hospitals have been located in Tabriz
(nearly 60 percent) and the rest (about 40 percent) in other districts in the province. 33
hospitals out of 42 public ones (79% = 5% army forces [Sepah and Artesh] + 5% Social
Security Organization [Alinasab and 29 Bahman hospitals] + 69% [29 hospitals] are
affiliated to Tabriz Medical Sciences University). 6 hospitals out of 42, private hospitals
Yaghoub Sheikh Zadeh et al. (2009) Public and Private Hospital Services Reform: An Investigation in Iranian Hospitals The 7th International Conference on Data Envelopment Analysis (by iDEAs), Philadelphia, PA.�
��
(14%), are affiliated to the following organizations : 1 hospital out of 42, Zakaria
nonprofit hospital (2%, affiliated to Tabriz Azad University), 1 hospital out of 42, Tabriz
Amir-al-momenin Charity hospital (2%, general and urology), and finally 1 hospital out
of 42, Fajr hospital (2% affiliated to Janbazan Affairs Organization).
Based on the initial proposal, ten (5 public and 5 private) hospitals were to be
investigated in regards to their efficiency and other issues considering the approved
research design. To this end, after precise investigation of the statistical data and its
specifications and considering the research goals , holding several meetings with Tabriz
Medical Science University authorities and considering the financial situation of the
project, it was finally decided that 11 sample hospitals (6 samples from the first class
public hospitals and 5 samples from the private ones) to be selected ; that is, one sample
more than what already was approved (26 percent of the whole provincial hospitals).
The first class public hospitals which were selected includes Imam, Nikokari, Alzahra,
Sina, Kodakan (all located in Tabriz) and Amir-al-momenin hospital which is the only
first class hospital (from point of view of both the general and ward evaluations) out side
of Tabriz (located in Maragheh). Since all of the province’s private hospitals have been
located in Tabriz, thus all five private sample hospitals were selected from Tabriz.
In regards to the Islamic Azad University’s hospital (Zakaria hospital) which is a non-for-
profit hospital (neither public nor private), there remains just 6 private hospitals named
Shams, Bahbod, Shahryar (Azar), Nor Nejat, Shafa, and Mehr (ophthalmic hospital). And
only one (Shams) out of these 6 hospitals has been recognized as a class one hospital and
the rest just class two by the evaluation of health authorities/provincial vice
chancellorship of treatment. In the meanwhile, except Mehr hospital which was an
ophthalmology hospital, the rest run as general ones. As a result, 5 sample of private
Yaghoub Sheikh Zadeh et al. (2009) Public and Private Hospital Services Reform: An Investigation in Iranian Hospitals The 7th International Conference on Data Envelopment Analysis (by iDEAs), Philadelphia, PA.�
��
hospitals out of 6, the total provincial private hospitals are as follows: Shams, Behbod,
Shahryar, Nor Nejat, Shafa (all general, almost 83% of total private hospitals). In other
words, Mehr (ophthalomogy) private hospital is the only one which was not investigated.
Finally, it was mentioned and highlighted that 7 out of 11 selected hospitals (6 public
hospitals and one private one) have been chosen among the class one and important
provincial hospitals. In other words, considering 20 out of total number of the provincial
hospitals (48%) have been evaluated as class one (in a general evaluation), the selected
samples (hospitals) in this research have covered almost 35% of whole class one
hospitals. Thereby 10 hospitals out of 25, the total number of Tabriz hospitals (40%) have
been selected as the samples.
If “number of active bed” is taken into account as a measure of “size of hospital” and we
look at the samples from this point of view, according our investigation, 1,759 out of
5,964 total numbers of the provincial active beds (29.49%) belong to the selected
hospitals; in other words, this study investigates almost 29.49% of the population under
study [Table 1].
2. Data Collection and Tools
Statistical data of this investigation have been gathered by various tools such as
questionnaire, interview, documental profiles review including the regulation booklet of
the ministry of health, booklets, professional magazines, annual reports of creditable
domestic and international organizations such as the WHO and UNDP, internet sources,
websites affiliated to Tabriz Medical or other universities, research centers and national
or foreign medical statistical data institutes.
In this study, in addition to the DEASoft – V1, some other soft-wares such as Excel 2003,
SPSS 15, and LINDO 6.1 has been extensively used to analyze the data.
Yaghoub Sheikh Zadeh et al. (2009) Public and Private Hospital Services Reform: An Investigation in Iranian Hospitals The 7th International Conference on Data Envelopment Analysis (by iDEAs), Philadelphia, PA.�
�
The information and data has been collected by referring to the hospitals personally and
filling out the questionnaires about the inputs, outputs, and health services’ prices.
The contents of the hospitals’ questionnaires were gathered for the periodical and time
series data in the late 2005 and in 2005-7 respectively. The collected data were as
follows: the number of specialist physicians , general physicians, residents, nurses,
medical staff with a bachelor degree or higher, medical staff with a diploma or lower,
passive and active beds, emergency patients, outpatients, inpatients, mortalities after 24
hours of admission , land and building sizes (areas) , price of the hospitals’ land and
buildings, and medical equipments.
3. Methods: Data Envelopment Analysis and Statistical Test
To estimate the efficiency’s score, instead of using parametric methods such as
econometrics we used Data Envelopment Analysis (DEA), a nonparametric method, due
to the following reasons:
DEA can handle multiple input and multiple output models; it does not require an
assumption of a functional form relating inputs to outputs; decision making units (health
centers) are directly compared against a peer or combination of peers; and inputs and
outputs can have very different units of measurement [42]. Note that the nonparametric
methods like the DEA do not need to estimate the parameters the same as what we do in
the parametric methods like regression [43]. In the meanwhile,
Spearman’s correlation coefficient tests (2-tailed) were applied between potential double
variables and examined multiple variables regression tests in various scenarios to achieve
significant results. Furthermore to determine the different kinds of efficiencies, we can
look at the issue from two perspectives: comparison based on the whole systems
function; for example, the efficiency of each hospital can be investigated with regard to
Yaghoub Sheikh Zadeh et al. (2009) Public and Private Hospital Services Reform: An Investigation in Iranian Hospitals The 7th International Conference on Data Envelopment Analysis (by iDEAs), Philadelphia, PA.�
���
its technical efficiency or cost-effectiveness; or comparison based on different wards,
programs, and/or hospital given goals. In our study we use the first perspective; i.e. the
analysis of the whole system or hospital.
4. DEA’s Conceptual and Mathematical Framework
Through the production process, inputs (production factors) are converted into outputs
(medical and health services) by hospitals and medical centers. The inputs can be divided
up into three general groups as follows: labour force, materials, and capital; although
each group can be exposed into smaller components. The labour force contains
professional staff such as physician, nurse, paramedic, manager, and supporting
employee and nonprofessional one like driver, guardian, and butler. The materials consist
of drug, all nondrug materials, and other product to serve medical outcomes. And finally,
the capital contains land, building, medical equipments, vehicle, and bed. The
relationship between inputs and resulting outputs (production process) has been revealed
by diagram 1. It is obvious that hospitals and medical centers use from multiple inputs for
producing multiple outputs.
Diagram 1- A Simplified system of one typical hospital
Outputs:
- Emergency patient - Outpatient - Inpatient - Surgery operations - Securing and immunity - Advising and training - Patient’s satisfaction - Provider’s satisfaction - People happiness and mirth
�
Transformation:
Technical and organizational
relationship
Inputs:
- Physician - Nurse - Paramedic - Support staff - Medical equipments - Drug - Bed - Land and building - Other requirements
��
����������� Feedback
Yaghoub Sheikh Zadeh et al. (2009) Public and Private Hospital Services Reform: An Investigation in Iranian Hospitals The 7th International Conference on Data Envelopment Analysis (by iDEAs), Philadelphia, PA.�
��
The DEA model is a unique, almost unacquainted especially in Iran, and powerful to
estimate and analyze of efficiency of multiple inputs and multiple outputs which can have
very different units of measurement. As Ali Emrounejad mentioned in his homepage ,
“The measurement of relative efficiency where there are multiple possibly
incommensurate inputs and outputs was addressed by Farrell and developed by Farrell
and Fieldhouse focusing on the construction of a hypothetical efficient unit, as a weighted
average of efficient units, to act as a comparator for an inefficient unit.
A common measure for relative efficiency is:
which introducing the usual notation can be written as
(Note efficiency is usually constrained to the range [0,1]).
The variables of the above problem are the weights and the solution produces the weights
most favourable to unit j0 and also produces a measure of efficiency.
According to Joses M. Kirigia et al. (2004), the algebraic model is as follows:
Yaghoub Sheikh Zadeh et al. (2009) Public and Private Hospital Services Reform: An Investigation in Iranian Hospitals The 7th International Conference on Data Envelopment Analysis (by iDEAs), Philadelphia, PA.�
���
Note that as Ali Emrouznejad pointed out in his home page the above DEA model is a
fractional linear program. To solve the model it is first necessary to convert-it into linear
form so that the methods of linear programming can be applied. The linearisation process
is relatively straightforward. For the objective function it is necessary to observe that in
maximising a fraction or ratio it is the relative magnitude of the numerator and
denominator that are of interest and not their individual values. It is thus possible to
achieve the same effect by setting the denominator equal to a constant and maximising
the numerator.
where: TE0 is the technical efficiency score for decision making unit j0; Ur = the weight
given to output r (r = 1, … , t and t is the number of outputs); Vi = the weight given to
input i (i = 1, … ,m and m is the number of inputs); n = the number of health centers; t =
the number of outputs; m = the number of inputs; � = a small positive number; Yrj =
amount of output r produced by health center j ; Xij = amount of input i used by health
centers j ; and j0 = the health centers under assessment. To ensure analytic tractability to
linear programming methods this model can be converted into the following linear
program:
Yaghoub Sheikh Zadeh et al. (2009) Public and Private Hospital Services Reform: An Investigation in Iranian Hospitals The 7th International Conference on Data Envelopment Analysis (by iDEAs), Philadelphia, PA.�
���
where �j are dual variables, i.e. the shadow prices related to the constraints limiting the
efficiency of each DMU to be no greater than 1. Where a constraint is binding, a shadow
price will be normally positive and when the constraint is nonbinding the shadow price
will be zero. In the solution to the primal model therefore a binding constraint implies
that the corresponding DMU has an efficiency of 1 and there will be a positive shadow
price or dual variable. Hence positive shadow prices in the primal, or positive values for
the �j in the dual correspond to and identify the peer group for any inefficient unit. Sr and
Si are slack variables; if DMU j0 is efficient, the slacks will equal to 0 and the efficiency
measure Z0 equal to 1. Otherwise, if j0 is inefficient Z0 will be less than 1 and some
slacks may be positive.”
Shadow price is the amount that the objective function value would change if the named
constraint changed by one unit. The shadow prices are valid up to the allowable increase
or decrease in the constraint, that is, in each problem, they depend on the number of
constraints. In face, the shadow price is the change in the objective value of the optimal
solution of an optimization problem obtained by relaxing the constraint by one unit, other
things being equal. In other words, since constraints often are determined by resources, a
comparison of the shadow prices of each constraint provides valuable insight into the
most effective place to apply additional resources in order to achieve the best
Yaghoub Sheikh Zadeh et al. (2009) Public and Private Hospital Services Reform: An Investigation in Iranian Hospitals The 7th International Conference on Data Envelopment Analysis (by iDEAs), Philadelphia, PA.�
���
improvement in the objective function value. The shadow price reflects economic value
of each unit of the resource.
4.1. Strengths and weaknesses of DEA
There are some pros and cons of using DEA as follow:
4.1.1. Strengths of DEA
We chose to employ DEA approach to estimate technical efficiency of individual
hospitals and health centers because of its unique strengthens:
It can handle multiple input and multiple output models/scenarios typical of hospitals and
health centers;
It does not require an assumption of a functional form relating inputs to output (as
regression methods do);
Health facilities are directly compared against a peer or combination of peers;
Inputs and outputs can be very different units;
It does not require information on prices of inputs and outputs.
It dose not need to estimate the parameters (as regression model dose).
4.1.2. Weaknesses of DEA
Even though we chose to use DEA, we were fully aware that it has two main limitations:
It attributes any deviation from the "best practice frontier" to inefficiency, while some
could be due to statistical noise, e.g. epidemics or measurement errors.
Given that DEA is deterministic/nonparametric technique, it is difficult to conduct
statistical tests of hypotheses concerning the inefficiency and the structure of the
production function [44].
Important note: it is worth mentioning that the effectiveness numbers gained by this
method are relative and are not absolute. In other words, efficiency or inefficiency of the
Yaghoub Sheikh Zadeh et al. (2009) Public and Private Hospital Services Reform: An Investigation in Iranian Hospitals The 7th International Conference on Data Envelopment Analysis (by iDEAs), Philadelphia, PA.�
���
hospitals are evaluated in comparison with one another so when we say X hospital is
efficient, it means that it is efficient as compared with its peer hospitals; while if for
example Y hospital were also chosen among samples, X hospital perhaps would not have
been selected as an efficient hospital. This means that in DEA, one or more hospitals are
selected as efficient through a complex and repetitive linear program as efficient hospitals
and the extent of inefficiency of other inefficient selected hospitals is evaluated as
compared just with efficient hospitals. Therefore, when we say a hospital is efficient, it
does not mean it is a fully efficient hospital with no deficiencies. Other aspects such as
the quality of services, patients' satisfaction, service providers' satisfaction, innovation,
delivered services for emergency patients, or some services provided for patients at the
“end stage” by some important and central hospitals with high costs, are vital issues
which require enough attention to themselves. In DEA method, the implicit assumption is
that other conditions prevailing in hospitals are constant and similar.
4.2. Input and Output Orientation
In DEA, input orientation method is applied for health care industry because as
Emmanuel Thanassoulis pointed out in “Introduction to the Theory and Application of
Data Envelopment Analysis: A Foundation Test with Integrated Software”, “hospitals
have relatively little control over the output levels which would be patients of various
categories needing treatment. They would have more control over the input levels, likely
to be resources such as doctors, nurses etc, input orientation is appropriate when inputs
are controllable”. [45] Despite of this and in some cases, the output-oriented DEA model
was used for the health centre analysis. According to Daniel Osei et al. “given their
primary health care orientation, with a strong bias towards health promotion and disease
prevention, they can influence a great number of people seeking, for example, antenatal
Yaghoub Sheikh Zadeh et al. (2009) Public and Private Hospital Services Reform: An Investigation in Iranian Hospitals The 7th International Conference on Data Envelopment Analysis (by iDEAs), Philadelphia, PA.�
���
and postnatal care, family planning services, birthing services, immunisations and health
education, through their public health outreach work among communities.” [46]
However, in this study, the input-oriented DEA model was applied for the hospital
analysis.
4.3. Constant, Decreasing, and Increasing Returns to Scale
As Emmanuel Thanassoulis mentioned in “Introduction to the Theory and Application of
Data Envelopment Analysis: A Foundation Test with Integrated Software”, “A
proportion correspondence is said to exhibit increasing returns to scale (IRS) if a redial
increase in input levels (i.e. keeping input mix constant) leads under Pareto-efficiency to
a more than proportionate radial increase in output levels; If the redial increase in output
levels is less than proportionate we have decreasing returns to scale (DRS) and otherwise
we have constant returns to scale (CRS) [47].
Those hospitals and health centers manifesting CRS can be said to be operating at their
most productive scale sizes. In order to operate at the most productive scale size, a health
facility displaying DRS should scale down both outputs and inputs. If a health facility is
exhibiting IRS, it should expand both outputs and inputs in order tobecome scale efficient
[48].
5. Scale Efficiency
The scale efficiency values for each analyzed health unit can be obtained by the ratio
between the scores for technical efficiency with constant and variable returns [49].
6. Allocative Efficiency [50]
The relationship between the quantities of inputs and the resulting quantities of outputs is
described by a production function (PF). PF describes the maximum output feasible for a
Yaghoub Sheikh Zadeh et al. (2009) Public and Private Hospital Services Reform: An Investigation in Iranian Hospitals The 7th International Conference on Data Envelopment Analysis (by iDEAs), Philadelphia, PA.�
���
given set of inputs and a given level of technology (i.e., a given state of knowledge about
the various methods that might be used to transform inputs into outputs).
Suppose, for example, the inputs are full time nursing time and full time clinic officers
time per year, and that they are used to produce outpatient care, proxied by outpatient
visits. That production function can be depicted graphically (see Fig. 1) using an isoquant
(IS), i.e. a curve that shows all the possible combinations of inputs that yield the same
output. AB is the isocost, i.e. the minimum cost line.
Fig. 1 Health centers technical and allocative efficiencies
Technical efficiency (TE) is about ensuring no resources are wasted, i.e. the maximum
amount of output is obtained from the available inputs (Kirigia et al., 2001). Health
centers I, Q and S are technically efficient because they are operating on the production
function or isoquant or efficiency frontier. Their efficiency score is one (or 100%).
Health centers P and T are inefficient because they are using more nurses and clinic
officers time to produce the same level of output as health centers I, Q and S. The extent
Yaghoub Sheikh Zadeh et al. (2009) Public and Private Hospital Services Reform: An Investigation in Iranian Hospitals The 7th International Conference on Data Envelopment Analysis (by iDEAs), Philadelphia, PA.�
���
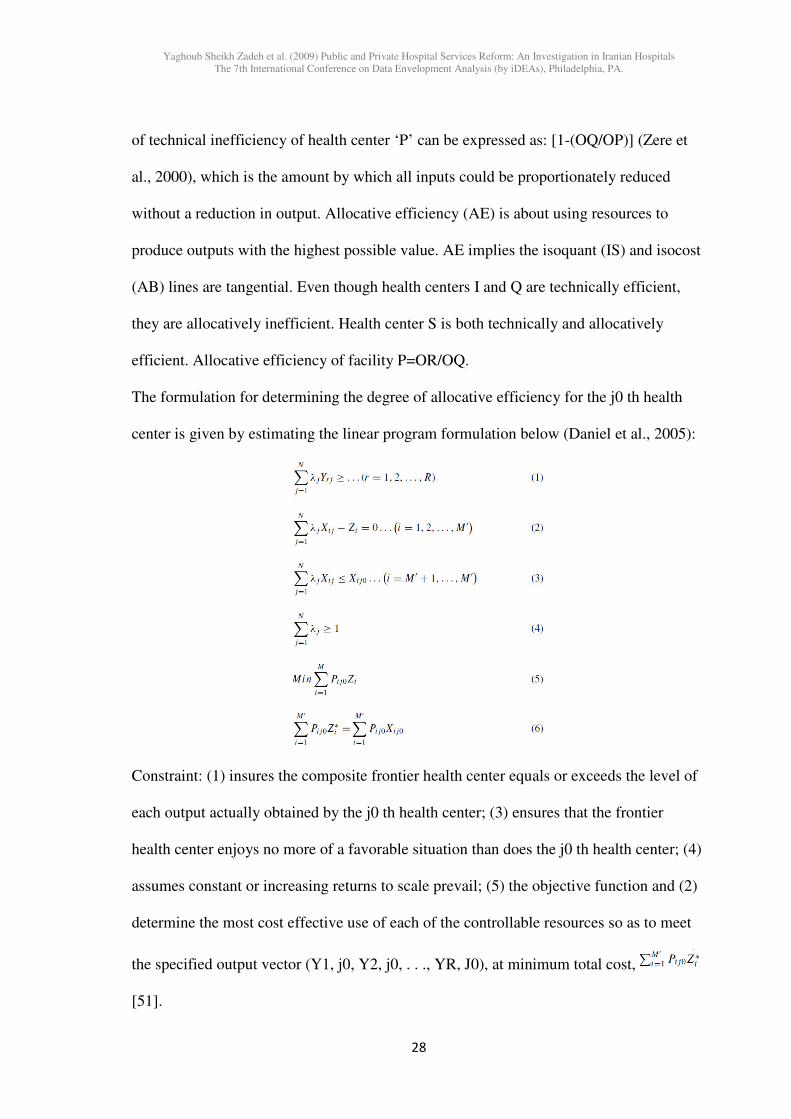
of technical inefficiency of health center ‘P’ can be expressed as: [1-(OQ/OP)] (Zere et
al., 2000), which is the amount by which all inputs could be proportionately reduced
without a reduction in output. Allocative efficiency (AE) is about using resources to
produce outputs with the highest possible value. AE implies the isoquant (IS) and isocost
(AB) lines are tangential. Even though health centers I and Q are technically efficient,
they are allocatively inefficient. Health center S is both technically and allocatively
efficient. Allocative efficiency of facility P=OR/OQ.
The formulation for determining the degree of allocative efficiency for the j0 th health
center is given by estimating the linear program formulation below (Daniel et al., 2005):
Constraint: (1) insures the composite frontier health center equals or exceeds the level of
each output actually obtained by the j0 th health center; (3) ensures that the frontier
health center enjoys no more of a favorable situation than does the j0 th health center; (4)
assumes constant or increasing returns to scale prevail; (5) the objective function and (2)
determine the most cost effective use of each of the controllable resources so as to meet
the specified output vector (Y1, j0, Y2, j0, . . ., YR, J0), at minimum total cost,
[51].
Yaghoub Sheikh Zadeh et al. (2009) Public and Private Hospital Services Reform: An Investigation in Iranian Hospitals The 7th International Conference on Data Envelopment Analysis (by iDEAs), Philadelphia, PA.�
��
7. Economic Efficiency or Cost Efficiency
Economic efficiency (or cost efficiency) (CE) combines both productive efficiency
(producing without waste, on the production possibilities frontier) with allocative
efficiency (allocating resources to their most highly valued uses) (Skaggs and Carlson,
1996). Therefore, cost efficiency of facility as follows:
CE = P = OR/OP = (OQ/OP) × (OR/OQ) = TE × AE, [52].
8. Inputs and Outputs
In this study, there were done adequate statistical and experimental analyses to obtaining
finalized inputs and outputs. Spearman’s correlation coefficient tests (2-tailed) were
applied between potential double variables and examined multiple variables regression
tests in various scenarios to achieve significant results. Also, sensitivity analysis and
several experimental tests through relatively many potential input-output variables were
used; and considering Emanuel Thanassoulis point of view [53] that “the ultimate aim is
that the input-output set used should conform to the exclusivity, exhaustiveness and
exogeneity requirements and should involve as few variables as possible”; and of course
taking into account practical statistical data gathering possibilities, some indices,
experience, expertise opinion [54]; some of variables were combined together if
applicable and then named in the same group as new variable and others just omitted
from the model and ultimately the following inputs and outputs were selected and
finalized for analyzing:
Inputs
Input 1: number of specialist physicians and upper
Input 2: number of general physicians + number of nurses + number of residents +
number of medical team having a degree (bachelour) or upper
Yaghoub Sheikh Zadeh et al. (2009) Public and Private Hospital Services Reform: An Investigation in Iranian Hospitals The 7th International Conference on Data Envelopment Analysis (by iDEAs), Philadelphia, PA.�
���
Input 3: number of medical team having 14 years diploma or lower + number of
nonmedical and support staff
Input 4: number of active beds
Outputs
Output 1: number of emergency patients
Output 2: number of outpatients
Output 3: number of inpatients × average daily inpatients’ residing
Average inpatient’s residing in one given period equals ratio of day bed occupancy rate to
number of whole released patients and mortalities in that period. In the present study, it
was used statistical data of average residing in the various wards of the East Azerbaijani
It is clear that in order to calculate allocative efficiency score, we need the information
related to production costs and prices in addition to quantities. In fact, one of the main
factors limiting calculation of allocative efficiency is more technical and financial
facilities needed and being able to estimate the costs and prices related to inputs and
outputs properly. That's why some researchers, in addition to the reasons mentioned
before, reduce the number of their inputs and outputs to make calculation of allocative
efficiency feasible.
Anyway, the prices of the data 1, 2, and 3 figured out 1,100,000, 656,000, and 504,000
Rials respectively on the base of the country’s standard monthly basic salary of PhD
Yaghoub Sheikh Zadeh et al. (2009) Public and Private Hospital Services Reform: An Investigation in Iranian Hospitals The 7th International Conference on Data Envelopment Analysis (by iDEAs), Philadelphia, PA.�
��
holder (equivalent to specialist); arithmetic mean of monthly basic salary of professional
doctor (708,000 Rials), master degree holder (698,000 Rials), and bachelor degree holder
(562,000 Rials); and arithmetic mean of monthly basic salary of diploma holder (540,000
Rials), high school diploma holder (521,000 Rials), and under high school diploma
(451,000 Rials) [56]. In the meanwhile, the price of data 4, that is, the value or cost of the
each hospital bed was estimated almost 4,000,000 Rials using cost opportunity concept
and based on the current and market value. Assuming 15 years as life span and zero Rials
as scrap value, monthly depreciation cost using straight line depreciation method was
calculated 2,222 Rials. Finally, medical tariffs in 2005 (1384) and 2006 (1385) were
applied to estimate the price of outputs 1 and 2 [57]; i.e. general and specialist
physicians’ visiting fees were consider as the price of each unit of the outputs 1 and 2
[58]. And also, hospital residing cost in 3-bed room or more in both public and private
sectors was separately taken into account as price of output 3 [59]. Note that in allocative
efficiency’s estimating process relative prices, rather than absolute ones, are effective.
Table 8 reveals mean and standard deviation amounts for inputs and outputs of the eleven
hospitals. In Table 9, there are general means of technical, scale, and allocative
efficiencies of the selected hospitals. Table 10 and 11 shows the situation of
technological structure and the scores of technical, scale, allocative, and cost efficiencies
about all selected hospitals in both public and private hospitals separately. It is
particularly important to note that the extent of effectiveness amounts ranges from 0
(completely inefficient) to 1 (100% that is efficient).
Finally, the structure of technology is defined by returns-to-scale properties. The shape of
the efficiency frontier (and therefore DEA scores) will depend upon whether constant
returns to scale (CRS) or non-increasing returns to scale (NIRS) or variable returns to
Yaghoub Sheikh Zadeh et al. (2009) Public and Private Hospital Services Reform: An Investigation in Iranian Hospitals The 7th International Conference on Data Envelopment Analysis (by iDEAs), Philadelphia, PA.�
���
scale (VRS) are assumed. In this study, it is reasonable to anticipate that hospital size is
more likely to be influenced by market environment more than institutional or
geographical constraints, implying that a CRS assumption is likely to be thick. Thus, the
less restrictive CRS assumption is specified [60].
Based on tables 10 and 11, 45% of selected hospitals are run under CRS and the rest
(55%) under VRS. Consideration of technical efficiency results confirms this issue. In
other words, all hospitals under CRS obtained technical efficiency scores 1 (100%), while
the inefficient hospitals -with technical efficiency scores less than one- had been run
under VRS. This means that efficient hospitals do not need to change their inputs and
outputs’ amounts to improve their efficiency scores since they had already been located
on the production possibilities frontier (Imam, Nikokari, Sina, Kodakan, and Behbod
hospitals), while on the contrary, ineffective hospitals with regard to technical issues
were located under the production possibilities frontier and therefore need to enhance
their activities (revising inputs and outputs’ quantities and some policy making issues) so
as to reach their optimum points (Alzahra, Amir-al-momenin, Shams, Shahryar, Nor
Nejat, and Shafa hospitals).
Out of the 11 hospitals included in the analysis, 5 (45%) were technically and scale
efficient, whereas the remaining 6 (55%) were technically and scale inefficient. Two out
of 6 (33%) of technically and scale inefficient hospitals belonged to public sector and the
rest (4 hospitals, 67%) technically and scale inefficient were under private sector’s
ownership. Among the six inefficient hospitals, 2 (33%) had a TE score of less than 50%
(both private), 2 (33%) between 51 and 74% (one private and one public) and the rest (2,
33%) between 75 and 99% (one private and one public). In the meanwhile, Behbod
hospital was the only one that had technical and scale efficiency of 100% and was under
Yaghoub Sheikh Zadeh et al. (2009) Public and Private Hospital Services Reform: An Investigation in Iranian Hospitals The 7th International Conference on Data Envelopment Analysis (by iDEAs), Philadelphia, PA.�
���
CRS. As a result, private hospitals were relatively more technically and scale inefficient
than public ones.
In general, the selected hospitals had an average TE score and a standard deviation of
0.79 and 0.24 respectively. Also, the inefficient hospitals had an average TE score of
61% and a standard deviation of 18%. This implies that on average, they could reduce
their utilization of all inputs by about 39% without reducing outputs. This is just the
concept of downsizing that has already been determined through the initial proposal’s
goals. It has to be mentioned that under VRS consumption, only Alzahra (public) and
Shams (private) hospitals were chosen as inefficient ones with technically efficient scores
0.85 and 0.66 respectively. Moreover, in a cross-sectional perspective and considering
that the inefficient hospitals in public and private sectors had average TE scores of 67%
and 59%, this reveals that on average, public and private hospitals are able to reduce their
consumption of all inputs by almost 33% and 41% respectively without reducing outputs
via optimizing economical management.
In this study also it has been proved that the average allocative efficiency scores among
the inefficient public and private hospitals were 72% and 70% respectively (almost the
same) implying there is potential for decreasing total inputs in both public and private
hospitals by about 30% using the existing capacity/size through re- allocating their
resources (physician, nurse, other staff, and bed) and producing the right services for the
right people at the right price.
From an economic (cost) efficiency point of view, average scores of this index have been
obtained 62% and 40% in public and private inefficient hospitals respectively. As a
result, it figured out that the inefficient hospitals are faced with a huge gap to being cost-
efficient so that they could minimize by about 38% and 60% of their idle expenditures
Yaghoub Sheikh Zadeh et al. (2009) Public and Private Hospital Services Reform: An Investigation in Iranian Hospitals The 7th International Conference on Data Envelopment Analysis (by iDEAs), Philadelphia, PA.�
���
respectively without reducing health services (outputs) using least-cost method to
converting into cost-efficient units.
Furthermore, although Nikokari, Sina, and Kodakan hospitals were classified beside
technically efficient public ones, while considering allocative and cost efficiencies’
viewpoint, they were dealing with severe problems. For example, since Sina hospital had
50% allocative and cost efficiencies’ scores; each of Imam (public) or Behbod (private)
hospitals was able to deliver exactly the same amount of medical services provided in
Sina hospital with spending only half of its total expenditures through creation of
efficient and effective policy making, reorganization and optimization of economical
management.
The digits into the parentheses in TE column in Table 10 indicate the number of times
each hospital had been selected as the best practice in repetitive process of linear
programming. Optimum hospitals from technical efficiency view of point were Imam
(public) and Behbod (private) hospitals which had been referenced 8 times each as bench
mark. Next ranks belonged to Nikokari (7 times), Kodakan (4 times), and Sina (3 times)
hospitals, and the rest of those did not achieved any point in this regard (Alzahra, Amir-
al-momenin, Shams, Shahryar, Nor Nejat, and Shafa hospitals). It is necessary to note
that the referenced hospitals are those that were able to deliver the same amount of
medical services using relatively less amounts of inputs were being employed by
inefficient hospitals. In other words, the referenced hospitals were those that could
provide relatively more medical services (to inefficient ones) using the same amounts of
inputs had been spent in inefficient hospitals.
From scale efficiency view of point, out of the 6 inefficient hospitals, 2 (33%) had a scale
efficiency score less than 50% (both private), 1 (17%) between 51 and 75% (public), and
Yaghoub Sheikh Zadeh et al. (2009) Public and Private Hospital Services Reform: An Investigation in Iranian Hospitals The 7th International Conference on Data Envelopment Analysis (by iDEAs), Philadelphia, PA.�
���
the rest 3 hospitals (50%) between 76 and 99% (one public and two private ones). In
other words, the number of both technical and scale inefficient hospitals was the equal (6
hospitals) and the only difference was an increase in scale efficiency scores of two
inefficient Alzahra and Amir-al-momenin hospitals to 97% and 99% respectively. The
amounts of technical and scale efficiencies of the rest selected hospitals were the same as
technical efficiencies scores.
The mean and standard deviation of scale efficiency scores among the selected hospitals
were 83% and 24% respectively. In other hand, the mean of scale efficiency scores
among the inefficient hospitals was 70% (with a standard deviation of 26%) revealing
there is potential for enhancing total outcomes by almost 30% using the existing capacity
and size.
Based on Table 9, mean of allocative and cost efficiencies for the selected hospitals were
76% and 61% respectively. Furthermore, Tables 10 and 11 present interesting data of
allocative and cost efficiencies in both individual public and private hospitals: the mean
of allocative efficiencies of public and private hospitals were 77% and 76% (almost
equal) and the mean of cost efficiencies of public and private hospitals were 68% and
52% respectively. As a result, while allocative efficiencies of public and private hospitals
on average were almost equal, cost (economic) efficiencies of public hospitals on average
were higher than private ones. In this study, it was figured out that just one of public
hospitals (Imam) and one of private hospitals (Behbod) out of all 11 selected ones (18%
of all samples) were efficient and had the best performance from point of view of all 4
measures: Technical, scale, allocative, and cost efficiencies (score efficiency of 1 or
100% for all four indices). It means the procedure, method, and quality and style of
management of these bench mark hospitals should be inspired and a source of the rest
Yaghoub Sheikh Zadeh et al. (2009) Public and Private Hospital Services Reform: An Investigation in Iranian Hospitals The 7th International Conference on Data Envelopment Analysis (by iDEAs), Philadelphia, PA.�
���
inefficient hospitals. Among the 9 allocative inefficient hospitals, one (11%) had AE
score of less than 50% (Shahryar private hospital), 5 hospitals (56%) between 51% and
75% (three public and two private) and the rest (3, 33%) between 75 and 99% (one
private and two public). Also, 4 out of 9 cost-inefficient hospitals (44.5%) had CE score
of less than 50% (one public and three private), 4 hospitals (44.5%) between 51% and
75% (three public and one private), and the rest (Nikokari public hospital, 11% of total
sample) between 76% and 99% (i.e. 94%). Note that all cost-inefficient hospitals should
able to deliver given medical services with relatively lower costs.
5. Discussion and Conclusion
A. Discussion
DEA method revealed that 55 percent of 11 selected hospitals were technical and scale
inefficient. To improve efficiency scores, either their costs (inputs) should be cut for
delivering given medical services (outputs) or their quantity of medical services must be
increased, subject to fixing hospital’s expenditures, that is, optimal value. It is clear that
we can practically reduce a certain percentage of the costs by increasing a certain
percentage of medical services simultaneously. Table 12 presents exact amounts of
required changes of inputs and outputs in order to convert inefficient hospitals into
efficient ones.
The observed inefficiency shows that these hospitals have made use of too much input as
compared with efficient ones, in other words they have not been able to provide enough
medical services using this amount of resources. Table 12 also contains valuable
information on possibility of reducible amount of each input in inefficient hospitals.
Authorities and policy makers of Iran’s health care system can make use of the
Yaghoub Sheikh Zadeh et al. (2009) Public and Private Hospital Services Reform: An Investigation in Iranian Hospitals The 7th International Conference on Data Envelopment Analysis (by iDEAs), Philadelphia, PA.�
���
percentage of variation in each input in order to determine the actual targets of their
interventions. For example, Shams hospital as an inefficient hospital is basically able to
downsize input 1 (number of specialist and post specialist physicians), input 2 (number of
general physicians + number of nurses + number of residents + number of medical team
having a degree (bachelor) or upper, input 3 (number of medical team having 14 years
diploma or lower + number of nonmedical and support staff), input 4 (number of active
beds) 48.0, 36.2, 118.4, and 111.6 units respectively without perceiving any negative
impact on its medical services. Furthermore, this hospital could consider the percentages
mentioned in the parentheses as clear suggestions of policy making and planning pattern
and reduces its inputs of 1, 2, 3, and 4; during a specific period of time, up to 34.8, 34.8,
39.7, and 60.0 percent respectively without any reduction in the quantity of medical
services (outputs). On the other hand, this hospital can likely choose to increase its
second output (accepting more outpatients) instead of reducing its inputs. Based on our
findings, an increase in outputs of 1 and 3 does not have any impacts on the efficiency of
Shams hospital. It means that this hospital’s efficiency score is not sensitive to outputs 1
and 3. Finally, it is worth noting that this hospital can choose one of these three options:
1- decreasing inputs, 2- increasing outputs, or 3- a mix of decreasing and increasing
inputs and outputs simultaneously. What is important is that by using this policy,
inefficient hospital moves towards its optimum production level and converts into an
effective unit.���
In this study it was specified that 82 percent of the selected hospitals were run under
allocative and cost inefficiency’s status. Therefore, to improve the status of allocative and
cost inefficiency, it is necessary to take all the items of costs into consideration to make
sure that they are being used in the most worthwhile means.
Yaghoub Sheikh Zadeh et al. (2009) Public and Private Hospital Services Reform: An Investigation in Iranian Hospitals The 7th International Conference on Data Envelopment Analysis (by iDEAs), Philadelphia, PA.�
���
Inefficient hospitals can to take two different perspectives: (i) to do nothing and insist in
continuing to operate with the current inefficiencies; (ii) to do something as follows:
ending current inefficiencies via issuing inefficiency warning to those staffs who work
under acceptable standard level, terminating contracts of the excess staff and/or taking
over the excess staff’s contract, benchmarking management procedures and organization
from efficient hospitals.
It is necessary that the policy makers of health system make a set of policies and develop
methods which are based on Table 12 findings to improve the efficiency of inefficient
hospitals as follows:
1. Transferring excess inputs of inefficient hospitals to efficient ones such as specialized
physicians, general physicians, residents, nurses, medical staff, nonmedical and support
staff, and finally active beds. This policy would remarkably strengthen these hospitals’
efficiency and potentially will improve provincial health care financial situation via using
idle and/or excess human recourses and facilities in order to enhance the capacity of
medical services to respond to people’s legitimate expectations.
2. Sending excess administrative and subordinate staff on early retirement. The saving
could be used to improve remuneration and benefits for the remaining staff.
3. In regards to excess beds, either: (i) transfer them to efficient hospitals; (ii) sell them;
or (iii) enter into a contract with private clinics practitioners or hospitals to use them at a
price, which should not be less than the marginal costs.
4. In general, the authorities and managers should take provincial saving and frugality
and excess nonwage expenditure into account either: (i) to improve the degree of
responsiveness of hospitals to patient’s legitimate expectations; (ii) to improve rural and
urban health centers quality of services; and (iii) to support communities to start or
Yaghoub Sheikh Zadeh et al. (2009) Public and Private Hospital Services Reform: An Investigation in Iranian Hospitals The 7th International Conference on Data Envelopment Analysis (by iDEAs), Philadelphia, PA.�
��
sustain systematic risk and resource pooling and cost sharing mechanisms for protecting
beneficiaries against unexpected health care costs. The saved funds could be used to
boost the capacity of the existing community-based health insurance schemes. According
to Carrin et al. [61] the government has four basic functions for enhancing the capacity of
Nonprofit Health Insurance Schemes (NPHIS): that of promoter of health insurance,
monitor of NPHIS activities, trainer in all dimensions of insurance, and that of co-
financier [62].
5. The government role in health care section should be gradually changed to like what is
in Canada, France, or Sweden from mostly ownership to stewardship and monitoring. In
other words, the government acts unfairly like an influential player or party who has the
first chance of winning this game, instead of being impartial arbiter, and doing its vital
duties which are taking care of principle players (private sector), preparation and
observation of standards, regulations and rules of the game. Please note that we do not
mean to eliminate all public hospitals and giving the whole health care system to the
private sector. Rather, we mean that the government should change its role from
extremist ownership and incumbency to controlling and watching the services provided
by the private sector in this regard. For the time being, the government is too laden and
cumbersome to be accurately able to perform these vital responsibilities. Almost, in the
most developed countries which have a modern health care system, the private sector
provides the main medical services together with a very limited number of public
hospitals; but the difference is that the government and/or insurance companies is the
financial mediator between the patient and hospital. In other words, the government as
public funder has the main responsibility of monitoring and financing of delivered health
and medical services by the private sector [63].
Yaghoub Sheikh Zadeh et al. (2009) Public and Private Hospital Services Reform: An Investigation in Iranian Hospitals The 7th International Conference on Data Envelopment Analysis (by iDEAs), Philadelphia, PA.�
���
B. Conclusion: Intervention in the System
The impacts of operationalizing the findings of this study and interfering in the system
can be different for public and private hospitals. The savings from allocating resources in
the public sector can help the process of converting a big and ineffective government to a
small but effective one by resorting to economics thought and pave the way for the
formation of a welfare state from the reserved resources which is one of the main needs
of Iran’ society. It is crystal clear that the very same idea can be applicable in other public
sectors such as education, banks, and other public departments.
In accordance to our findings, policy makers need to abandon the view that the way to
achieve an optimal health for Iran’s society goes only through the road of Ministry of
Health and Medical Education.
To achieve a healthy and happy society for the present and future generations, various
ministries such as Health and Medical Education, Education, Roads and Transportation,
Welfare and Social Security, Labor and Social Affairs, Ministry of Justice, Ministry of
the Interior, Housing and Urbanization, Science and Researches, Economic Affairs and
Finance, and organizations such as Physical Education, the Environment Protection
Organization, Standard, and Audio-Visual Organization should get together with a
systemic and harmonized view of sect oral planning, so as to present some ways for the
improvement of health of Iranian society with clear and realistic goals and defined
practical plans with practical guidelines and procedures.
To achieve this goal, we suggest in addition to establishing a Central National Health
Committee in the Health and Medical Education Ministry, a National Health Office can
be established in each ministry or organization which acts under the direct supervision of
Yaghoub Sheikh Zadeh et al. (2009) Public and Private Hospital Services Reform: An Investigation in Iranian Hospitals The 7th International Conference on Data Envelopment Analysis (by iDEAs), Philadelphia, PA.�
��
the Central Committee headed by deputy minister of Health and Medical Education. The
members of this central committee can be representatives of these ministries and
organizations and also some representatives from the presidency office (management and
planning organization), the parliament, the judiciary, the broadcasting organization,
Physical Education, and the Environmental Organizations. Similar committees and
offices can be established in provinces headed by medical science universities of each
province with the very same goals. To guarantee the execution of this plan, pure,
decisive, legal, financial, and executive support of all three systems of Legislative,
Judiciary, and Law-Enforcement is required.
In other words, we should create a condition in which instead of accepting patients at the
hospitals, assist them in finding their ways into the gymnasiums, sports, healthy nutrition,
and social exuberance together with proper education just as is done in developed
countries. For example, since Iran is one of the countries with a high rate of car accidents
[64], we can gradually transfer part of Iran’s annual budget from the ministry of Health
and Medical Education to Roads and Transportation ministry (under the supervision of
National Health Committee) so as to invest on safety of roads. In this way there would be
a significant reduction in the rate of accidents and consequently the budget required by
hospitals will be automatically decreased because of a reduction in the amount of
demand. Another example is preparing programs to familiarize people with appropriate
driving rules and maintaining the rule of fastening seatbelts in the mass media such as
Broadcasting organization under the supervision of National Health Committee and
presenting plans such as refresher courses for the traffic police, driving institutes and
traffic organization. These plans can include providing situations in which the authorities
and experts of the above-mentioned departments can observe the system of transportation
Yaghoub Sheikh Zadeh et al. (2009) Public and Private Hospital Services Reform: An Investigation in Iranian Hospitals The 7th International Conference on Data Envelopment Analysis (by iDEAs), Philadelphia, PA.�
���
and hold workshops about the new theoretical and practical traffic rules in developed
countries such as Canada, Australia, UK, the United States, and Japan [65].
This cannot be done unless there is proper education (in all levels and for all age groups
specially for primary and base education and mental development and establishing good
social manners in children from early ages), social security (welfares, life, unemployment
insurance, incapacity and disability insurances, enough old-age pension and so on),
employment (having a decent job which is safe), improving the quality and safety of
roads, reforms in traffic rules, educating people to drive safely (note that all these are
performed in developed countries at the moment. These countries spend these costs in
first levels for prevention purposes and sometimes for refreshment and pleasurable
purposes such as gymnasiums and sport clubs instead of hospitals), increasing people's
income by reforming the policy-making plans and inappropriate social, economic,
cultural, and political structures; group efforts to preserve and improve the environment,
creating possibilities to have safe and convenient houses, full observation of food and
technical standards without ignorance, having fair judiciary and concerned police, etc.
It is important to note that all these ministries', organizations', and related departments'
final goal is to preserve health and mind of human beings and improving their mental and
spiritual state which is feasible through having an organized and comprehensive plan.
Otherwise, most of the costs in Ministry of Health and Medical Education are considered
as a kind of wasting national resources.
Considering the tendency of general international economic system towards privatization,
the results of this study can provide the necessary resources for compensation of the costs
of private hospitals’ depreciation and connection to the network of international health
care markets (globalization) by optimizing the private sector and also enhancing new
Yaghoub Sheikh Zadeh et al. (2009) Public and Private Hospital Services Reform: An Investigation in Iranian Hospitals The 7th International Conference on Data Envelopment Analysis (by iDEAs), Philadelphia, PA.�
���
investments and eventually change the path into a smooth one by reinforcing
privatization.
C. Suggestions for the Future Researchers
1. To adopt practical and strategic policies in Iranian health care management field,
research projects on technical, scale, allocative, and costs efficiencies in the regional and
national level need to be approved with full support and enough financial aids. For
example, the present study can be applied in urban health centers, rural health houses,
clinics, and medical paraclinics and in all East Azerbaijani hospitals and also other
provinces and even at the national level.
2. An analysis of cost-efficiency and cost-effectiveness in health and other medical
centers and hospitals are necessary to present principled optimization solutions.
Therefore, there is a need to increase the number of such kinds of studies. Moreover, it is
suggested that efficiency and effectiveness investigations be applied in various wards of
hospitals.
3. Considering the financial limitations of this study, only 11 hospitals were studied, but
to achieve more reliable results, more samples (hospitals or medical centers) are needed
(at least 35% or more).
4. Studying the details related to efficient and in efficient units not only will help us to
recognize relatively efficient peers and allocate the existing necessary possibilities to
them, but also they would be very valuable tools for optimized planning and management
of relatively efficient units.
Yaghoub Sheikh Zadeh et al. (2009) Public and Private Hospital Services Reform: An Investigation in Iranian Hospitals The 7th International Conference on Data Envelopment Analysis (by iDEAs), Philadelphia, PA.�
���
5. To calculate technological and productivity change via Malmquist indices), we need
statistical data related to various years (time series); so this effective index is also
suggested to be considered in future researches.
The experts and executive policy makers of the province and deputy director general of
health and treatment center of the province can consider a selection of the following
points to improve the effectiveness of the hospitals and perform some reforms in medical
services:
D. Acknowledgment
During this work we have collaborated with many colleagues and people for whom we
have great regard and wish to extend our warmest thanks to all authorities and those who
have helped us with our work in East Azerbaijani Office of Treatment Deputy Minister of
Ministry of Health, provincial public and private hospitals, and Tabriz University of
Medical Sciences, Iran.
Footnotes
1. World Health Organization (2001) Health Systems: Concepts, Design and Performance (Tutor’s Guide), Working Document, Geneva, p.48.
2. Management and Planning Organization (2006-7) Iran’s Budget Act: 2007-8, Acts, Tables, Resources (Incomes) and Expenditures of Governmental General Budget, retrieved on Feb.15, 2007 from: http://law.majlis.ir/home
3. See the following source regarding out of pocket payments and catastrophic payments in Iran:��
- Yaghoub Sheikhzadeh, Reza Gholi Vahidi, V.K.Seth (2006) An Investigation on the Oil Income Elasticity of Health Care Expenditures during 1979-2004 and Lost and Faulty Links of Flow of Funds in Health Care System of Iran, presented at the 2nd International Conference of Health Financing in Developing Countries, CERDI, University of Auvergne, Clermont-Ferrand, France, www.cerdi.org.
http://www.emro.who.int/iran/countryprofile.htm4 . Retrieved on Feb. 2, 2008 from: and UNDP (2007) Ibid.
Yaghoub Sheikh Zadeh et al. (2009) Public and Private Hospital Services Reform: An Investigation in Iranian Hospitals The 7th International Conference on Data Envelopment Analysis (by iDEAs), Philadelphia, PA.�
���
5. Treatment vice-president of Tabriz Medical University, retrieved on Aug. 27, 2005 from: http://healthdata.tbzmed.ac.ir/
6. Iran Statistical Centre, retrieved on Feb. 15, 2008 from: http://www.sci.org.ir/portal/faces/public/sci
7. Statistical Year Book of East Azerbaijan (2006-7) East Azerbaijani Management and Planning Organization, retrieved on Feb.19, 2008 from: http://www.mpo-as.ir/sal/index.htm
8. Management and Planning Organization (2007-8) Iran’s Budget Act: 2008-9, Acts, Tables, Resources (Incomes) and Expenditures of Governmental General Budget, retrieved on Feb.25, 2008 from: http://www.majlis.ir/mhtml/��
9. East Azerbaijani Management and Planning Organization (2007) East Azerbaijani Economical, Social, and Cultural Report: 2005-6, Deputy Minister of Economical and Planning Affairs.
10. In this study, Asad Abadi Public Treatment Center that was converted into an Outpatient Treatment Center in 2006, Teeth and Mouth Dentistry Collage Hospital, inactive Haft-e-Tir Public Hospital (affiliated to Tabriz Medical University), inactive Tabriz Private Hospital, and other medical research centers affiliated to Tabriz Medical University like Diabetic and Pulmonary Research Center have not been taken into account.
11. East Azerbaijan Management and Planning Organization (2007) Ibid.
12. Management and Planning Organization (2007-8) Ibid.
13. Y. A. Ozcan, and R. R. Bannick (1994) Trends in department-of-defense hospital efficiency. J. Med. Syst. 18, pp. 69–83.��
14. Y. A., Ozcan, M. J., Mccue, and A. A., (1996) Okasha, Measuring the technical efficiency of psychiatric hospitals. J. Med. Syst. 20:141–150.
15. Y. Huang-GL. (1990) An application of data envelopment analysis: Measuring the relative performance of Florida general hospitals. J. Med. Syst. 14: p.191.
16. Y. Huang-GL. (1986) An evaluation of the efficiency of rural primary care programs: An application of data envelopment analysis in Chapel Hill, North Carolina. PhD Dissertation, School of Public Health, University of North Carolina, NC, 1986.
17. S., Chattopadhy and C. S. Ray (1996) Technical, Scale, and Size efficiency in Nursing home care: a nonparametric analysis of Connecticut, homes. Health Econ. 5, pp. 363–373.��
18. H. F. E., Shroff; T. R., Gulledge, K. E., Haynesand; and M. K., Oneill (1998) Siting efficiency of long-term health care facilities. Socioecon. Plann. Sci. 32(1), pp. 25–43.
19. Field, Kamal and Emrouznejad Ali (2003) Measuring the Performance of Neonatal Care Units in Scotland, Journal of Medical Systems, Vol. 27, No. 4, August 2003.
20. D. Parkin and B. Hollingsworth (1997) Measuring production efficiency of acute hospitals in Scotland, 1991–94: Validity issues in data envelopment analysis. Appl. Econ. 29 (11), pp.1425–1433.��
Yaghoub Sheikh Zadeh et al. (2009) Public and Private Hospital Services Reform: An Investigation in Iranian Hospitals The 7th International Conference on Data Envelopment Analysis (by iDEAs), Philadelphia, PA.�
���
21. B. Hollingsworth and D. Parkin (1997) The efficiency of Scottish acute hospitals - An application of data envelopment analysis. IMA. J. Math. Appl. Med. Biol. 12, pp. 161–173.��
22. B. Hollingsworth and D. Parkin (2001) The efficiency of the delivery of neonatal care in the UK. J. Public Health Med. 23(1), pp. 47–50.��
23. R. Jacobs (2001) Alternative methods to examine hospital efficiency: data envelopment analysis and stochastic frontier analysis. Health Care Manag. Sci. 4, pp. 103–115.
24. M. Linna, Nordblad, and M. Koivu (2003) Technical and cost efficiency of oral health care provision in Finnish health centres. Soc. Sci. Med., 56(2): pp. 343-53.
25. E. Thanassoulis, A. Boussfofiane, and R.G. Dyson (1995) Exploring output quality targets in the provision�of perinatal-care in England using data envelopment analysis.
Eur. J. Oper. Res. 80, pp. 588–607.
26. P. Kooreman (1994) Nursing-home care in the Netherlands—A nonparametric efficiency analysis. J. Health Econ. 13, pp. 345–346.
27. Miika Linna, Unto H¨akkinen, and Jon Magnussen (2006) Comparing hospital cost efficiency between Norway and Finland, Health Policy 77, pp. 268–278.
28. L. Steinman, G. Dittrich, A. Karmann, P. Zweifel (2004) Measuring and comparing the (in)efficiency of German and Swiss hospitals. European Journal of Health Economics, 5, pp. 26–216.��
29. K. Ersoy, S. Kavuncubasi, Y. A. Ozcan, and I. I. J. M., Harris (1997) Technical efficiencies of Turkish hospitals:DEAApproach. J. Med. Syst. 21(2), pp. 67–74.
30. S. K., Majumdar (1994) Assessing firms capabilities—theory and measurement—as study of Indian pharmaceutical, industry. Econ. Pol. Wkly. 29:M83–M89.
31. H. Chang, H. (1998) Determinants of hospital efficiency: the case of central government-owned hospitals in Taiwan. Omega Int. J. Manag. Sci. 26(2), pp. 307–317.
32. T. Wan, N. H. et al. (2002) Technical efficiency of Nursing Units in a tertiary care hospital in Taiwan. J. Med. Sys. 26(1), pp. 21–27.
33. Joses, Kirigia, M., Ali, Emrouznejad, Rui Gama, Vaz, Henry Bastiene, and , Jude Padayachy (2008) A comparative assessment of performance and productivity of health centres in Seychelles, International Journal of Productivity and Performance Management, Vol. 57 No. 1, pp. 72-92.
34. J. Kirigia, et al. (2000) Are public hospitals in Kwazulu-Natal Province of South Africa technically efficient? African J. Health Sci. 7(3–4), pp. 25–32.
35. J. M. Kirigia, L. G. Sambo, and H. Scheel (2001) Technical efficiency of public clinics in Kwazulu-Natal province of South Africa. East African Med. J. 78(3), pp. S1–S13.
36. Kirigia, J. et al. (2000) Are public hospitals in Kwazulu-Natal Province of South Africa technically efficient? African J. Health Sci. 7(3–4), pp. 25–32.
Yaghoub Sheikh Zadeh et al. (2009) Public and Private Hospital Services Reform: An Investigation in Iranian Hospitals The 7th International Conference on Data Envelopment Analysis (by iDEAs), Philadelphia, PA.�
���
37. Z. A. Eyob (2000) Hospital efficiency in Sub-Saharan Africa: Evidence from South Africa.Working Paper, No. 187, The United Nations University World Institute for Development Economics Research, pp. 1–39.
And also see: E. A. Zere, T. Addison, and D. McIntyre (2000) Hospital efficiency in Sub-Saharan Africa: Evidence from South Africa. South African J. Econ.
38. Felix Masiye et al. (2006) Efficient Management of Health Centers Human Resources in Zambia, Journal of Medical Systems, V. 30 , Issue 6, Plenum Press, New York, NY, USA, pp. 473 – 481.
39. Felix Masiye (2007) Investigating health system performance: An application of data envelopment analysis to Zambian hospitals, BMC Health Services Research, retrieved on Feb. 19, 2008 from: http://www.biomedcentral.com/1472-6963/7/58
40. Joses M. Kirigia, Ali Emrouznejad, Luis G. Sambo, Nzoya Munguti, and Wilson Liambila (2004) Using Data Envelopment Analysis to Measure the Technical Efficiency of Public Health Centers in Kenya, Journal of Medical Systems, Vol. 28, No. 2. And also see:��
Joses M. Kirigia, Ali Emrouznejad, L.G., Sambo (2002) Measurement of technical efficiency of public hospitals in Kenya: Using Data Envelopment Analysis. J. Med. Sys. 26(1), pp. 39–45.
41. Daniel Osei1, Selassi d’Almeida, Melvill O George, Joses M Kirigia, Ayayi Omar Mensah and Lenity H Kainyu, Technical efficiency of public district hospitals and health centers in Ghana: a pilot study (2005) Retrieved on Feb. 5, 08 from: http://www.resource-allocation.com/content/pdf/1478-7547-3-9.pdf
42. Hossein Hajialiafzali, J. Moss, and M. Mahmood (2007) Efficiency Measurement for Hospitals Owned by the Iranian Social Security Organisation, Journal of Medical Systems, Springer, Volume 31, Number 3, pp. 166-172 (7).
43. Ali Emrouznejad’s DEA HomePage, http://www.deazone.com,Warwick Business School,Warwick University, UK, 1995–2001.
44. A., Boussofiane, R. G. Dyson, and E. Thanassoulis (1991) Applied data envelopment analysis. Eur. J. Oper. Res. 52, pp.1–15.��
45. Joses M. Kirigia, Ali Emrouznejad, Luis G. Sambo, Nzoya Munguti, and Wilson Liambila (2004) Using Data Envelopment Analysis to Measure the Technical Efficiency of Public Health Centers in Kenya, Journal of Medical Systems, Vol. 28, No. 2. p.158. Also, for more information refer to: T. J. Coelli (1996) A guide to DEAP Version 2.1: A Data Envelopment Analysis Programme. CEPA, Working Paper 96/8, Department of Econometrics, University of New England, UK.
46. For more information in this regard, refer to some works of: Ali Emrouznejad, Emmanuel Thanssoulis, and Willam Kooper. For example: Thanassoulis, E. (2001) Introduction to the Theory and Application of Data Envelopment Analysis: A Foundation Test with Integrated Software. 1st edition. Hingham MA: Kluwer Academic, pp. 6-13.
47. Mostly extracted from Daniel Osei et al., Ibid, p.7.
Yaghoub Sheikh Zadeh et al. (2009) Public and Private Hospital Services Reform: An Investigation in Iranian Hospitals The 7th International Conference on Data Envelopment Analysis (by iDEAs), Philadelphia, PA.�
���
48. E. Thanassoulis (2001) Introduction to the Theory and Application of Data Envelopment Analysis: A Foundation Test with Integrated Software. 1st edition. Hingham MA: Kluwer Academic pp. 22-26.
49. Daniel Osei1 et al., Ibid, p.7.
50. E. Thanassoulis (2001) Ibid, pp. 124-125.
51. Daniel Osei1 et al., Ibid. Extracted from: Chattopadhy S, Ray CS (1996) Technical, scale, and size efficiency in nursing home care: a nonparametric analysis of Connecticut homes. Health Economics, 5, pp. 363-373.
52. T. J. Coelli (1996) A guide to DEAP Version 2.1: A Data Envelopment Analysis Programme, CEPA, Working Paper 96/8, Department of Econometrics, University of New England, UK., P.136.
53. Felix Masiye et al. (2006) Ibid.
54. E. Thanassoulis (2001) Ibid, p. 91.
55. Interview with Dr Ali Emrouznejad from Auston University in Feb. 2008.
56. Treatment vice-president of Tabriz Medical University, Retrieved on Feb. 27, 2008 from: http://healthdata.tbzmed.ac.ir/
57. Human Resources Management Office, Tabriz Medical Science University.
58. Treatment vice-president of Tabriz Medical University, Retrieved on Jan. 11, 2008 from: http://healthdata.tbzmed.ac.ir/ It seems the medical tariffs in 2006-7 and 2007-8 mostly have been influenced by beneficiary and political groups, individuals and forces rather than being indicators of scarcity and real relative prices; therefore, in this study, it has been utilized tariffs of 2004-5 and 2005-6 which are much better indicators of real relatively prices. It is necessary to note that in calculating allocative efficiency, we have to take relative prices into account and not absolute prices.
59. Job and Security web site, retrieved on Mar. 18, 2008 from:��
60. Treatment vice-president of Tabriz Medical University, Retrieved on Jan. 15, 2008 from: http://healthdata.tbzmed.ac.ir/ It is necessary to emphasize that, as we mentioned it before, in this study, technical efficiency has been calculated based on input-oriented DEA model (cost-minimization); therefore, output prices were not practically used.
61. Felix Masiye et al. (2006) Ibid.
In the meanwhile, all information related to technical efficiency (VRS) has been revealed in Appendix 2: DEA-Model 2.
62. G. Carrin et al. (2000) Social health insurance development in low-income developing countries: New roles for government and nonprofit health insurance organizations in Africa and Asia, Building Social Security: The Challenge of Privatization, Transaction publishers, New Brunswick, NJ, Chap. 10, pp. 125–153.
Yaghoub Sheikh Zadeh et al. (2009) Public and Private Hospital Services Reform: An Investigation in Iranian Hospitals The 7th International Conference on Data Envelopment Analysis (by iDEAs), Philadelphia, PA.�
��
63. Joses M. Kirigia, Ali Emrouznejad, Luis G. Sambo, Nzoya Munguti, and Wilson Liambila (2004), Ibid.
64. For obtaining more information regarding this subject, see the following workshop (was hold on Mordad 11, 1386, Iranian Calendar): Yaghoub Sheikhzadeh (2007) An Acquaintance with Health Care Systems of Canada and Ten Developed Countries: USA, England, France, Germany, Netherlands, Denmark, Sweden, Japan, Australia, and New Zealand, workshop, presented at NPMC, Tabriz, Iran.
65. Iran has one of the highest traffic accident rates in the world, one Iranian dies every 24 minutes from car accidents. Up to 22,000 deaths, and 87,000 injured in an average 200,000 cases reported each year related to car accidents. Retrieved on Feb.22, 2008 from: http://www.payvand.com/news/04/jan/1142.html http://english.peopledaily.com.cn/200301/06/eng20030106_109613.shtml
66. In 2004/05, Tehran, Ghilan, Khorasan, Esfahan provinces have been recorded the highest car accident rates 20.8, 10.9, 8.8, 8.1, and 6.8 respectively. Mortal accident in Ardabil, Ilam, Chahar Mahal va Bakhtiyari, Boshehr, Fars, Kordestan, Khozestan provinces have been dropped 85, 71, 67, 47, 45, and 42 percent respectively while this figure have been increased in West Azerbaijan, East Azerbaijan, and Kermanshah 180, 143, and 133 percent respectively….the main reasons of high car accident are as follows: increasingly vehicle demand to existing roads, lack of constant trainings to boosting cultural level, lack of efficient and effective monitoring on traffic, absence of drivers’ adequate and related knowledge, inattention to laws and regulations, unseasonable expediency, illegal speed, using drugs, technical problems, vehicle exhaustion, road engineering and sign problems, and other general delinquencies. Retrieved on Feb. 22, 2008 from: http://www.mrt.ir/New/Search/SearchF/News.asp?ID=175��
References A. Farsi (dates based on Iranian calendar): 1. East Azerbaijani Management and Planning Organization (1386) East Azerbaijani Economical, Social, and Cultural Report: 1384, Deputy Minister of Economical and Planning Affairs.
2. East Azerbaijani Management and Planning Organization (1387) Statistical Year Book of East Azerbaijan 1384.��
3. Economical, Social, and Cultural Report: Year 1384 (Bahman 1385) Economic and Planning Deputy Minister.
4. Iran Statistical Centre, retrieved on Feb. 15, 2008 from: http://www.sci.org.ir/portal/faces/public/sci
5. Management and Planning Organization (1385) Iran’s Budget Act: 1386, Acts, Tables, Resources (Incomes) and Expenditures of Governmental General Budget, retrieved on Feb.15, 2007 from: http://law.majlis.ir/home
Yaghoub Sheikh Zadeh et al. (2009) Public and Private Hospital Services Reform: An Investigation in Iranian Hospitals The 7th International Conference on Data Envelopment Analysis (by iDEAs), Philadelphia, PA.�
���
6. Management and Planning Organization (1386) Iran’s Budget Act: 1387, Acts, Tables, Resources (Incomes) and Expenditures of Governmental General Budget, retrieved on Feb.25, 2008 from: http://www.majlis.ir/mhtml/
7. Statistical Year Book of East Azerbaijan (1385) East Azerbaijani Management and Planning Organization, retrieved on Feb.19, 2008 from: http://www.mpo-as.ir/sal/index.htm
8. Treatment vice-president of Tabriz Medical University, retrieved on Aug. 27, 2005 from: http://healthdata.tbzmed.ac.ir/
9. Word Health Organization (1375) Research Methods in Health Care Systems, Translator: Translators’ Group, Part two, Ministry of Health, Treatment, and Medical Education.
10. Word Health Organization (1376) Research Methods in Health Care Systems, Translator: Esfandyar Stodeh Maram, Minstry of Health, Treatment, and Medical Education.
B. English 11. BANKER R.D. and MOREY R.C. (1986) Efficiency analysis for exogenously fixed inputs and outputs, Ops. Res., 34, 513-521.
12. Boussofiane, A.; Dyson, R. G.; and Thanassoulis, E. (1991) Applied data envelopment analysis. Eur. J. Oper. Res. 52, pp.1–15.��
13. Bryman, Alan and Cramer, Duncan; (2001), Quantitative Data Analysis with SPSS Release 10 for Windows: A guide for social scientists, Routledge.
14. Clemente, J.; Marcuello, A.; and Pueyo, F.; (2004) On the international stability of health care expenditure functions: are government and private functions similar? Journal of Health Economics, Volume 23, Issue, pp. 589-613.
15. Carrin, G. at al (2000) Social health insurance development in low-income developing countries: New roles for government and nonprofit health insurance organizations in Africa and Asia, Building Social Security: The Challenge of Privatisation, Transaction publishers, New Brunswick, NJ, Chap. 10, pp. 125–153.
16. Chang, H. (1998) Determinants of hospital efficiency: the case of central government-owned hospitals in Taiwan. Omega Int. J. Manag. Sci. 26(2), pp. 307–317.
17. Charles E. Phelps (1997) Health Economics, Translator: Manochehr Asghari, Eghtesad-e-Nou Press, Tehran.
18. Chattopadhy S. and Ray, C. S. (1996) Technical, Scale, and Size efficiency in Nursing home care: a nonparametric analysis of Connecticut, homes. Health Econ. 5, pp. 363–373.��
19. Chiang, Alpha c. (1984) Fundamental Methods of Mathematical Economics, Third Edition, McGraw-Hill.
20. Clemente, J. ; Marcuello, A. ;and Pueyo, F. (2004) On the international stability of health care expenditure functions: are government and private functions similar?, Journal of Health Economics, Value 23, Issue,pp.589-613.
Yaghoub Sheikh Zadeh et al. (2009) Public and Private Hospital Services Reform: An Investigation in Iranian Hospitals The 7th International Conference on Data Envelopment Analysis (by iDEAs), Philadelphia, PA.�
��
21. Coelli, T. J. (1996) A guide to DEAP Version 2.1: A Data Envelopment Analysis Programme, CEPA, Working Paper 96/8, Department of Econometrics, University of New England, UK.��
22. Dixon, Anna, and Mossialos, Elias (2002) Health care systems in eight countries: trends and challenges, European Observatory on Health Care Systems, pp 54, 109.
23. Diulio, Eugene A (1990) Theory and Problems of Macroeconomics, USA, McGraw-Hill.
24. Donaldson, Cam, Mugford, Miranda, Vale, Luke (2002) Evidence-based Health Economics: From effectiveness to efficiency in systematic review, BMJ.
25. Drache, D., and Sullivan, T. (editors) (1999) Health Reform: Public Success, Private Failure, Routledge.
26. Drummond, M. F., McGuire A. (2001) Economic Evaluation in Health Care: merging theory with Practice, 1st ed. Oxford, Oxford University Press.
27. Eckert, Ross D. and Leftwich, Richard H. (1998) The Price System and Resource Allocation, Int. edition, USA, The Dryden Press, p 59.
28. Emery, E. David (1984) Intermediate Micro-economics, USA, HBJ Press.
29. -------------------- (1986) Principles of Economics: Macroeconomics, USA, HBJ Press.
30. Emrouznejad, A., Ali Emrouznejad’s DEA HomePage, http://www.deazone.com, Warwick Business School, Warwick University, UK, 1995–2001.
31. Ersoy, K.; Kavuncubasi, S.; Ozcan, Y. A. and Harris, I. I. J. M. (1997) Technical efficiencies of Turkish hospitals:DEAApproach. J. Med. Syst. 21(2), pp. 67–74.
32. Eyob, Z. A. (2000) Hospital efficiency in Sub-Saharan Africa: Evidence from South Africa.Working Paper, No. 187, The United Nations University World Institute for Development Economics Research, pp. 1–39.
33. Farrell M.J. (1957) The measurement of productive efficiency, J.R. Statis. Soc. Series A 120, 253-281.
34. Farrell M.J. and Fieldhouse M. (1962) Estimating efficient production functions under increasing returns to scale, J.R. Statis. Soc. Series A 125, pp. 252-267.
35. Field, Kamal and Emrouznejad Ali (2003) Measuring the Performance of Neonatal Care Units in Scotland, Journal of Medical Systems, Vol. 27, No. 4, August 2003.
36. Friedman, Davide D. (1990) Price Theory: An Intermediate Text, 2nd Edition, USA, South Western.
37. Getzen, Thomas E. (2004) Health Economics: Fundamentals and Flow of Funds, 2nd Edition, USA, Wiley Press, p 8.
38. Green,S. (2000) Research Methods in Health, Social and Early Years Care, STANLEY THORNES.
40. Kirigia, J. et al. (2000) Are public hospitals in Kwazulu-Natal Province of South Africa technically efficient? African J. Health Sci. 7(3–4), pp. 25–32.
Yaghoub Sheikh Zadeh et al. (2009) Public and Private Hospital Services Reform: An Investigation in Iranian Hospitals The 7th International Conference on Data Envelopment Analysis (by iDEAs), Philadelphia, PA.�
���
41. Kirigia, J. M.; Sambo, L. G. and Scheel H. (2001) Technical efficiency of public clinics in Kwazulu-Natal province of South Africa. East African Med. J. 78(3), pp. S1–S13.
42. Kirigia, Joses M.; Emrouznejad, Ali; Sambo, Luis G. (2002) Measurement of technical efficiency of public hospitals in Kenya: Using Data Envelopment Analysis. J. Med. Sys. 26(1), pp. 39–45.
43. Kirigia, Joses M.; Emrouznejad, Ali; Sambo, Luis G.; Munguti, Nzoya; and Liambila, Wilson (2004) Using Data Envelopment Analysis to Measure the Technical Efficiency of Public Health Centers in Kenya, Journal of Medical Systems, Vol. 28, No. 2.
44. Kirigia, Joses M., Emrouznejad, Ali, Vaz, Rui Gama, and Bastiene, Henry, Padayachy, Jude (2008) A comparative assessment of performance and productivity of health centres in Seychelles, International Journal of Productivity and Performance Management, Vol. 57 No. 1, pp. 72-92.
45. Kooreman, P. (1994) Nursing-home care in the Netherlands—A nonparametric efficiency analysis. J. Health Econ. 13, pp. 345–346.
46. Hajialiafzali, Hossein; Moss, J.; and Mahmood, M. (2007) Efficiency Measurement , for Hospitals Owned by the Iranian Social Security OrganizationJournal of Medical
47. Henderson, James M., and Quandt Richard E. (1980) Microeconomic Theory: A Mathematical Approach, Third Edition, McGraw-Hill International Edition, pp 37-40.
49. Hollingsworth, B. and Parkin D. (1997) The efficiency of Scottish acute hospitals - An application of data envelopment analysis. IMA. J. Math. Appl. Med. Biol. 12, pp. 161–173.
50. Hollingsworth, B. and Parkin, D. (2001) The efficiency of the delivery of neonatal care in the UK. J. Public Health Med. 23(1), pp. 47–50.
51. Huang-GL, Y. (1990) An application of data envelopment analysis: Measuring the relative performance of Florida general hospitals. J. Med. Syst. 14: p. 191.
52. Huang-GL, Y. (1986) An evaluation of the efficiency of rural primary care programs: An application of data envelopment analysis in Chapel Hill, North Carolina. PhD Dissertation, School of Public Health, University of North Carolina, NC, 1986.
53. Issel, L. Michele (2004) Health Program Planning and Evaluation: A Practical, Systematic Approach for Community Health, USA, Jones and Bartlett Publishers, p.380.
54. Jacobs, R. (2001) Alternative methods to examine hospital efficiency: data envelopment analysis and stochastic frontier analysis. Health Care Manag. Sci. 4, pp. 103–115.
55. Levin, Henry M, and McEwan, Patrick J (2000) Cost-effectiveness Analysis as an Evaluation Tool, Forthcoming in the International Handbook of Educational Evaluation (Booklet).
56. Linna, M.; Nordblad, and Koivu, M. (2002) Technical and cost efficiency of oral health care provision in Finnish health centres. Soc. Sci. Med.
Yaghoub Sheikh Zadeh et al. (2009) Public and Private Hospital Services Reform: An Investigation in Iranian Hospitals The 7th International Conference on Data Envelopment Analysis (by iDEAs), Philadelphia, PA.�
���
57. Linna, Miika, H¨akkinen, Unto and Magnussen, Jon (2006) Comparing hospital cost efficiency between Norway and Finland, Health Policy 77, pp. 268–278.
58. Luce, B. R., Elixhauser, A., Culyer, A.J and Horisberger, B. (Eds) (1990) Standards for Socioeconomic Evaluation of Health Care Products and Services, Berlin, Springer.
59. Majumdar, S. K. (1994) Assessing firms capabilities—theory and measurement—as study of Indian pharmaceutical, industry. Econ. Pol. Wkly. 29: M83–M89.
60. Masiye, Felix et al. (2006) Efficient Management of Health Centers Human Resources in Zambia, Journal of Medical Systems, V. 30 , Issue 6, Plenum Press, New York, NY, USA, pp. 473 – 481
61. Masiye, Felix et al. (2007) Investigating health system performance: An application of data envelopment analysis to Zambian hospitals, BMC Health Services Research, Retrieved on Feb.5, 2008 from: http://www.biomedcentral.com/1472-6963/7/58
62. Nicholson, Walter (1989) Microeconomic Theory: Basic Principles and Extensions, fourth edition, Int. edition, USA, The Dryden Press, pp 187-188.
63. Osei1, Daniel et al., Technical efficiency of public district hospitals and health centers in Ghana: a pilot study (2005) Retrieved on Feb. 5, 2008 from: http://www.resource-allocation.com/content/pdf/1478-7547-3-9.pdf
64. Ozcan, Y. A., and Bannick, R. R. (1994) Trends in department-of-defense hospital efficiency. J. Med. Syst. 18, pp. 69–83.��
65. Ozcan, Y. A., Mccue, M. J., and Okasha, A. A. (1996) Measuring the technical efficiency of psychiatric hospitals. J. Med. Syst. 20, pp. 141–150.
66. Parkin, D. and Hollingsworth, B. (1997) Measuring production efficiency of acute hospitals in Scotland, 1991–94: Validity issues in data envelopment analysis. Appl. Econ. 29(11), pp. 1425–1433.
67. Peabody JW, Omar Rahman M, Gertler PJ, Luck J, Carter GM, Farley Do.(1999) Policy and Health; Implication or Development in Asia, Cambridge University Press.
68. Pearce, D.W. (2000) Macmillan Dictionary of Modern Economics, MACMILLAN.
69. Robbins, Stephen P. et al. (2006) Management. Toronto, Pearson Prentice Hall, p. 9.
70. Rumi, Jalaleddin Molavi, retrieved on August 30, 2008 from: http://www.sacred-texts.com/isl/masnavi/msn01.htm
71. Santerre, R.E. and Neun, S.P. (2000) Health Economics (Theories, Insights/ and Industry Studies), SOUTH- WESTERN/THOMSON LEARNING.
72. Sadeghi, G. ( 2002) A Research On Ceding Health and Treatment centers to private sector and Its Effects On Quantity and Quality of Provided Services. First Seminar of Resources Management in Hospital, Tehran.
73. Sheikhzadeh, Yaghoub; Vahidi, Reza Gholi; Seth V.K. (2006) Public Health Care Expenditures and Welfare in Iran Economy, presented at the 11th World Congress of Public Health, Rio de Janeiro, Brazil: https://www.saudecoletiva2006.com.br/ingles/poster.php?letra=Y
Yaghoub Sheikh Zadeh et al. (2009) Public and Private Hospital Services Reform: An Investigation in Iranian Hospitals The 7th International Conference on Data Envelopment Analysis (by iDEAs), Philadelphia, PA.�
���
74. Sheikhzadeh, Yaghoub; Vahidi, Reza Gholi; Seth V.K. (2005) An Investigation on the Oil Income Elasticity of Health Care Expenditures during 1979-2004 and Lost and Faulty Links of Flow of Funds in Health Care System of Iran, presented at the 2nd International Conference of Health Financing in Developing Countries, CERDI, University of Auvergne, Clermont-Ferrand, France, www.cerdi.org.
75. Sheikhzadeh, Yaghoub (2007) An Acquaintance with Health Care Systems of Canada and Ten Developed Countries: USA, England, France, Germany, Netherlands, Denmark, Sweden, Japan, Australia, and New Zealand, workshop, presented at NPMC, Tabriz, Iran.
76. Shroff, H. F. E., Gulledge, T. R., Haynes, K. E., and Oneill, M. K. (1998) Siting efficiency of long-term health care facilities. Socioecon. Plann. Sci. 32(1), pp. 25–43.
77. Steinman, L.; Dittrich, G.; Karmann; Zweifel, A.P. (2004) Measuring and comparing the (in)efficiency of German and Swiss hospitals. European Journal of Health Economics, 5, pp. 26–216.
78. Susna, De, and Shehata, Ibrahim (2001) Comparative Report of National Health Accounts Findings from Eight Countries in the Middle East and Africa, Partnerships for Health Reform, pp 11- 41.
79. Tabriz Medical Science University, Human Resources Management Center.��
80. Thai, Khi V., Wimberley, Edward T., and McManus, Sharon M. (2002) Handbook of International Health Care Systems, Marcel Dekker, Inc, pp 119-238.
81. Thanassoulis, E., Boussfofiane, A. and Dyson, R.G. (1995) Exploring output quality targets in the provision�of perinatal-care in England using data envelopment analysis.
Eur. J. Oper. Res. 80, pp. 588–607.
82. Thanassoulis, E. (2001) Introduction to the Theory and Application of Data Envelopment Analysis: A Foundation Test with Integrated Software. 1st edition. Hingham MA: Kluwer Academic, pp. 6-13, 22-26 and 140.
83. Thomas, R.L. (1999) Using Mathematics in Economics, 2nd Edition, FT Prentice Hall Press.
84. Wan, T. N. H. et al. (2002) Technical efficiency of Nursing Units in a tertiary care hospital in Taiwan. J. Med. Sys. 26(1), pp. 21–27.
85. Witter, S.; T. Ensor, M. Jowett and R. Thompson (2000) Health Economics for Developing Countries (A Practical Guide), BUPA, the University of York, MACMILLAN, p.6.
86. World Health Organization (1981) Health Programme Evaluation, Geneva, p.17.
87. --------------------------------- (1996) Research Methods in Health Systems, Group of Translators, Part2, Health Treatment and Medical Education Ministry Publication.
88. --------------------------------- (2001) Health Systems: Concepts, Design and Performance, part II, Geneva.
89. --------------------------------- (2001) Health Systems: Concepts, Design and Performance (Tutor’s Guide), Working Document, Geneva, p. 48.
90. --------------------------------- (2003) WHO Guide to Cost-Effectiveness Analysis, Geneva.
91. --------------------------------- (2005) The World Health Report, Geneva.
Yaghoub Sheikh Zadeh et al. (2009) Public and Private Hospital Services Reform: An Investigation in Iranian Hospitals The 7th International Conference on Data Envelopment Analysis (by iDEAs), Philadelphia, PA.�
���
92. --------------------------------- (2007) The World Health Report, Geneva.
93. Zere, E. A.; Addison, T. and McIntyre, D. (2000) Hospital efficiency in Sub-Saharan Africa: Evidence from South Africa. South African J. Econ.
Appendix 1: Tables
Yaghoub Sheikh Zadeh et al. (2009) Public and Private Hospital Services Reform: An Investigation in Iranian Hospitals The 7th International Conference on Data Envelopment Analysis (by iDEAs), Philadelphia, PA.�
���
Yaghoub Sheikh Zadeh et al. (2009) Public and Private Hospital Services Reform: An Investigation in Iranian Hospitals The 7th International Conference on Data Envelopment Analysis (by iDEAs), Philadelphia, PA.�
���
Yaghoub Sheikh Zadeh et al. (2009) Public and Private Hospital Services Reform: An Investigation in Iranian Hospitals The 7th International Conference on Data Envelopment Analysis (by iDEAs), Philadelphia, PA.�
���
Yaghoub Sheikh Zadeh et al. (2009) Public and Private Hospital Services Reform: An Investigation in Iranian Hospitals The 7th International Conference on Data Envelopment Analysis (by iDEAs), Philadelphia, PA.�