Public Attitudes Toward Social Security by Sally R. Sherman* Public opinion about Social Security has been favorable throughout the history of the program. Surveys have consistently shown that the program is popular and well-supported. Strong support has been voiced for the Government to spend more for Social Security, for benefits to increase with inflation, and for benefits to increase even if it means higher taxes. Many individuals rely on income from the program or expect to rely on it when they retire. The public clearly wants the program to continue. If participation were optional, about three-fourths of the public would remain in the program. A fiscal crisis in the trust fund that developed in the 1970’s led, in the late 1970’s and early 1980’s, to a decline in public confidence that Social Security would be able to pay benefits in the future. In 1975, a majority (63 percent) was confident in the future of the program. By 1978, confidence had fallen to 39 percent. In the 1982-84 period, it fell to its lowest point, with only one-third of the public expressing confidence in the future. The fiscal crisis was resolved through the provisions in the 1983 amendments, and public confidence has been rising since that time. By 1988, one-half of the public stated that they were confident in the future of Social Security. -‘Program Analysis Staff, Office of Research and Statistics, Office of Policy, Social Security Administration.
Transcript
Public Attitudes Toward Social Security by Sally R. Sherman*
Public opinion about Social Security has been favorable throughout the history of the program. Surveys have consistently shown that the program is popular and well-supported. Strong support has been voiced for the Government to spend more for Social Security, for benefits to increase with inflation, and for benefits to increase even if it means higher taxes. Many individuals rely on income from the program or expect to rely on it when they retire. The public clearly wants the program to continue. If participation were optional, about three-fourths of the public would remain in the program.
A fiscal crisis in the trust fund that developed in the 1970’s led, in the late 1970’s and early 1980’s, to a decline in public confidence that Social Security would be able to pay benefits in the future. In 1975, a majority (63 percent) was confident in the future of the program. By 1978, confidence had fallen to 39 percent. In the 1982-84 period, it fell to its lowest point, with only one-third of the public expressing confidence in the future. The fiscal crisis was resolved through the provisions in the 1983 amendments, and public confidence has been rising since that time. By 1988, one-half of the public stated that they were confident in the future of Social Security.
-‘Program Analysis Staff, Office of Research and Statistics, Office of Policy, Social Security Administration.
Since passage of the original Social Security Act in 1935, the program it created has been expanded greatly and now touches the lives of almost every American. Each month, approximately 1 of every 6-l/2 Americans receives a benefit from the program, and each year more than one-half of the population pays FICA (Federal Insurance Contributions Act) or SECA (Self-Employment Contributions Act) taxes on their earnings. The Old-Age, Survivors, and Disability Insurance program is widely regarded as one of the most successful and most popular social programs ever enacted by the U.S. Government. However, this statement does not imply that the public has not been concerned about the program.
A wide variety of surveys and polls have included questions relating to knowledge about and attitudes toward the Social Security program. Occasionally, an entire survey has been devoted to an examination of public opinions about Social Security. A baseline monograph (Schiltz, 1970) pulled together information from questions fielded during the first 30 years of the program. This article covers the period from the early 1970’s to the late 1980’s.
The past two decades have been particularly eventful for the Social Security program. Unforeseen economic problems led to a financial crisis in the solvency of the
trust funds beginning in 1975. Some measures to restore solvency were taken in 1977, but the long-range financing problems were not resolved until 1983. The sequence of expansion, crisis, and resolution was widely publicized and, during the financial crisis, public doubts grew over the ability of the program to meet its future obligations. Despite these worries, support for the program in its present form remained widespread. The provisions of the 1983 amendments returned the program to a sound financial footing (at least for the near term) and a degree of public confidence was restored.
This article first presents a brief summary of public attitudes during the earliest years of the Social Security program, and then reports data on public opinion from several national sample polls and surveys conducted during the 1970’s and 198O’s-set in the context of the evolving program.’ Two studies, one conducted in 1979 and the other in 1985, were wholly devoted to an examination of attitudes toward the program. They receive particular
1 Because Social Security-related questions are usually a small part of a larger survey or a question in a brief poll, much of the published data can be used only as a crude measure of trends over time. The questions have been posed in a variety of contexts, to different populations, and with different wordings. Further details on the sources used here are presented in the Technical Appendix on page 16.
attention in this article because, in addition to providing a rich source of data, they also frame the financial crisis and shed light on public attitudes before and after the restoration of trust fund solvency.
The Early Years
Schiltz reported that initial public acceptance of both the Old-Age Insurance (OAI) and Old-Age Assistance (OAA) programs was high, but public knowledge and understanding of the two programs, especially of the differences between them, was very low. Income maintenance for the aged received overwhelming support, which increased steadily from 68 percent of the population in 1936 to a nearly unanimous 96 percent in 1944. This strong support was common to all age, income, regional, and occupational subgroups of the population. One poll in 1937 indicated that the opposition to Social Security seemed to be to the programs shortcomings-not to Government- provided pensions in principle. Early surveys also showed support for extending coverage to groups not originally included. But, the responses also indicated a lack of knowledge regarding the issues of benefit receipt, benefit amount, and payroll deductions.
In the early years of the program, surveys often used the word
Social Security Bulletin, December 1969/Vol. 52, No. 12 3
“pension” to refer to both the OAI and OAA programs, a fact that may explain some of the confusion in public attitudes toward Social Security. Some surveys found that three-fourths of their respondents said pensions should be provided only for the aged needy, not for everyone. During the first decade of the program, a substantial portion of those paying into the system did not understand that their participation would entitle them to benefits regardless of need.
Since those early years, public understanding of Social Security has greatly increased. At the same time, the program continued to expand. What began as a program for the aged worker grew to include benefits for survivors, for the disabled, and for others. The growth in the program was accompanied by a growth in the reliance on Social Security benefits. By the early 1970’s, there were recommendations for significant increases in benefits.
Program Developments and Public Responses in the 1970’s
A major expansion designed to improve the program was contained in the Social Security Amendments of 1972. This legislation provided for a 20-percent increase in monthly cash benefits effective for September 1972 payments. The law also provided that, effective in 1975, benefits would increase automatically as prices rise. In the 2 years before the automatic adjustments took effect ad hoc benefit increases amounted to 11 percent.
Despite the growing complexity of the program, public awareness of its features continued to increase Although Schiltz had found very low levels of public understanding in the program’s early years, during the
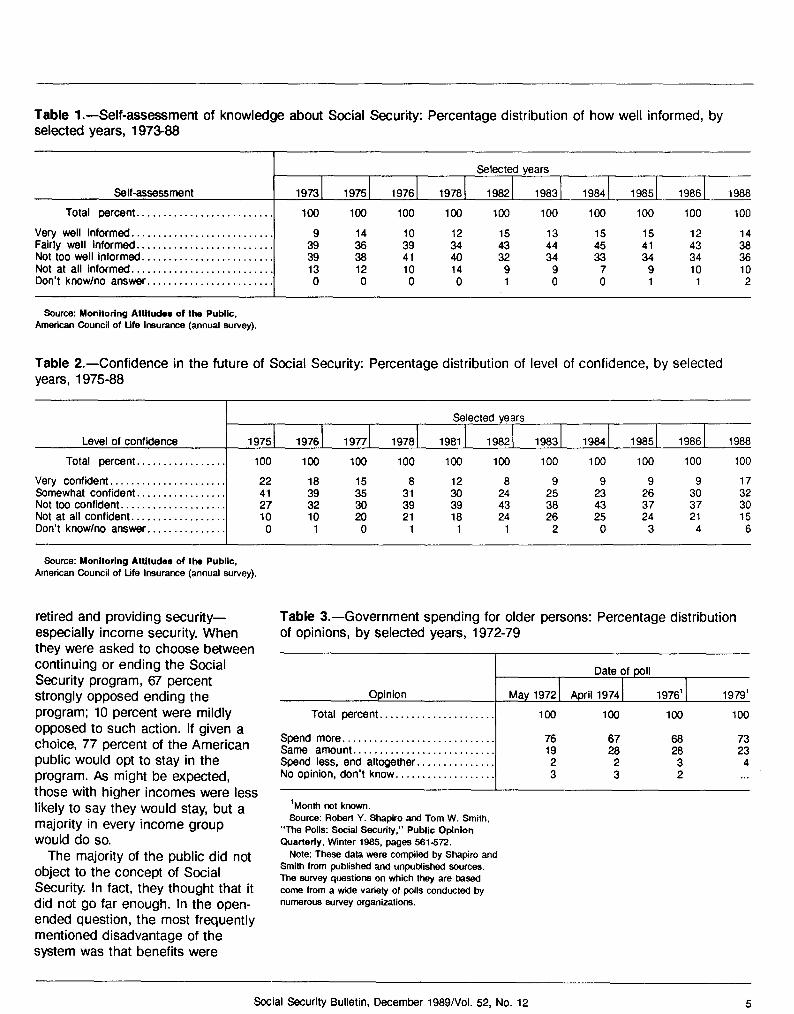
1970’s a steady proportion, about one-half, consistently reported that they were very well or fairly Well informed (table 1).
A number of other major provisions were included in the 1972 amendments, but the benefit increases, together with an economic downturn, precipitated a financial crisis in the trust funds. A higher than anticipated inflation triggered large automatic benefit increases at the same time that lower real wage levels and higher unemployment were decreasing the flow of taxes into the trust funds. Moreover, a technical flaw in the 1972 amendments resulted in benefit levels growing more rapidly than intended. Thus, by 1975, annual expenditures were exceeding annual income.
These ominous developments evidently did not go unnoticed by the public. Confidence in the future of the Social Security system declined considerably in the late 1970’s (table 2). In 1975, 63 percent of the American public had expressed confidence in the future of the program, and 37 percent had little or no confidence. By 1978, these proportions were virtually reversed, and the percentage who were “not at all confident” had doubled. However, the public remained largely committed to maintaining the major features of the program in its existing form. Towards the end of the decade, the weight of public opinion still supported the concept that the Government should spend more to help older people (table 3); that benefits should increase when the cost of living increases (table 4); and that benefits should be increased even if it means higher taxes (table 5-7). Opposition to a cut in payroll taxes remained solid if the cut was accompanied by a reduction in some benefits (table 8).
New legislation in 1977 contained provisions intended to reduce the projected trust fund deficits for 1978 and 1979 and to eliminate the deficits beginning in 1980, at least for the relatively near future The most important financial changes were an increase in future tax rates, an increase in the level of earnings subject to the payroll tax, and a revised benefit formula that modified the method of indexing benefits to take account of inflation. Another provision established the National Commission on Social Security to study both long-term and short-term questions regarding Social Security. One Commission-funded activity was a survey of public attitudes, conducted in 1979 by Peter D. Hart Research Associates, Inc.
The Hart Survey, 1979
The rapid loss during the late 1970’s of public confidence in the future of the program was reflected in data obtained in the 1979 Hart survey. Only 42 percent of the population were confident that Social Security would have the funds to provide their benefits. Even this response may have tended to overstate confidence about the longer-term viability of the program. Of those who were already retired (most of them currently receiving benefits and therefore concerned with the relatively short term), 73 percent expressed confidence in the future availability of benefits, compared with only 32 percent of the nonretired.
However, the public was generally quite supportive of the program. In an open-ended question asking for comments on the advantages and disadvantages of Social Security, more than 90 percent of the Hart survey population volunteered statements relating to Social Security helping the elderly or
4 Social Security Bulletin, December 1989/Vol. 52, No. 12
Table l.-Self-assessment of knowledge about Social Security: Percentage distribution of how well informed, by selected years, 197398
Source: Monitoring Attitudes of the Public, American Council of Life Insurance (annual survey).
retired and providing security- especially income security. When they were asked to choose between continuing or ending the Social Security program, 67 percent strongly opposed ending the program; 10 percent were mildly opposed to such action. If given a choice, 77 percent of the American public would opt to stay in the program. As might be expected, those with higher incomes were less likely to say they would stay, but a majority in every income group would do so.
The majority of the public did not object to the concept of Social Security. In fact, they thought that it did not go far enough. In the open- ended question, the most frequently mentioned disadvantage of the system was that benefits were
Table 3.-Government spending for older persons: Percentage distribution of opinions, by selected years, 1972-79
‘Monlh not known. Source: Robert Y. Shapiro and Tom W. Smith.
“The Polls: Social Security,” Public Opinion Quarterly, Winter 1985, pages 561572.
Note: These data were compiled by Shapiro and Smith from published and unpublished sources. The survey questions on which they are based come from a wide variety of polls conducted by numerous survey organizations.
Social Security Bulletin, December 1989/Vol. 52, No. 12 5
Table 4.-Benefits should increase when cost of living increases: Percentage distribution of opinions, by selected years, 1974-78
Source: Robert Y. Shapiro and Tom W. Smith, “The Polls: Social Security,” Public Opinion Ouarterly, Winter 1985, pages 561572.
Note: These data were compiled by Shapiro and Smith from published and unpuMished sources. The survey questions on which they are based come from a wide variety of polls conducted by numerous survey organizations.
Table S.-Improving benefits if tax increase is required: Percentage distribution of opinions, 1978-79
Date of poll
Opinion May 1978 Nov. 1978 May 1979
Total percent.........................,........ 100 100 100
inadequate. Nearly a third of the public and nearly two-fifths of the retired cited this disadvantage.
Although 65 percent of the total believed (correctly) that Social Security benefits alone were not meant to be the only source of retirement income to provide for all basic needs, more than 60 percent thought that benefits should be. Only 34 percent said that Social Security benefits should be a supplement to other retirement income. For those who may have been the most dependent on Social Security, even higher proportions thought the retirement benefit should meet all basic needs: 70 percent of nonretirees in the lowest income category and 74 percent of those who expected Social Security to be their most important source of retirement income.
This criticism reflected a broad concern with the economics of retirement. The Hart survey asked respondents whether their greater concern was not having enough to do in retirement or not having enough money. About 6 in 10 of both the retired and nonretired population said that having enough money was the greater concern. In general, that proportion varied little by either age or family income.
Closely related to this concern is whether or not people think they can live on their retirement income. With few differences, about a third of both retirees and nonretirees believed that their retirement income would not provide enough to pay their monthly bills, and another third felt that they would just get by. The percentage of nonretirees expecting to live comfortably varied considerably by family income, ranging from only 16 percent in the lowest income category to 55 percent in the highest income group. Pension coverage also affected expectations. Less than
6 Social Security Bulletin, December 1989/Vol. 52, No. 12
one-fourth of those not covered by a pension plan expected to live comfortably, compared with more than two-fifths of those with pension coverage.
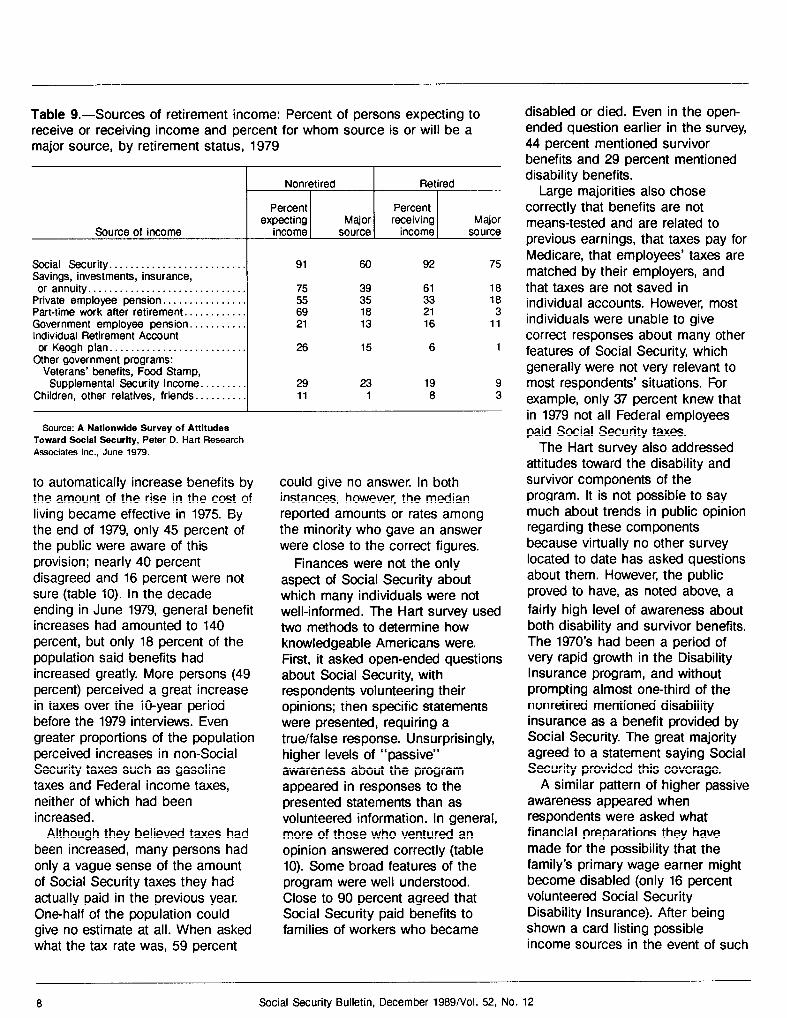
This fairly widespread concern with finances was directly relevant to Social Security because the program is expected to play such a major part in providing retirement income. When asked if they were receiving or expecting to receive income from various sources, respondents were by far the most likely to expect Social Security benefits-with more than 9 in 10 mentioning it (table 9). However, the retired were somewhat more likely to list Social Security as a “major” source of retirement income-75 percent, compared with 60 percent of the nonretired. The nonretired were consistently more likely to expect income from other sources and to expect these other sources to be major ones.
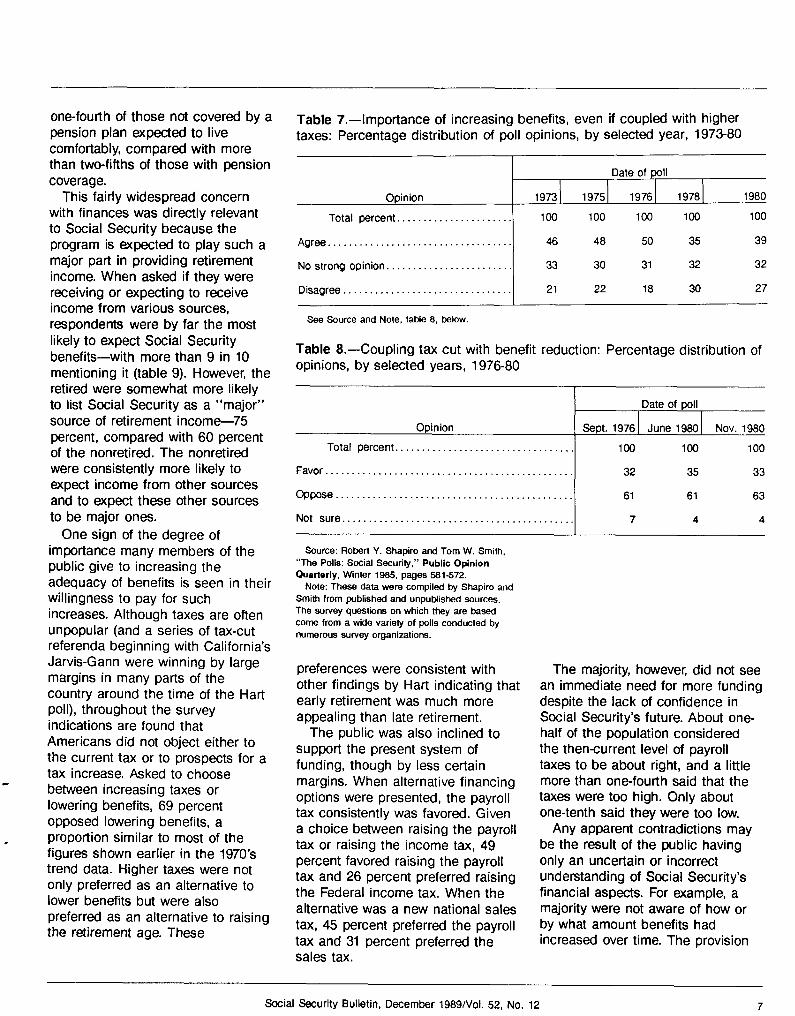
One sign of the degree of importance many members of the public give to increasing the adequacy of benefits is seen in their willingness to pay for such increases. Although taxes are often unpopular (and a series of tax-cut referenda beginning with California’s Jarvis-Gann were winning by large margins in many parts of the country around the time of the Hart poll), throughout the survey indications are found that Americans did not object either to the current tax or to prospects for a tax increase. Asked to choose between increasing taxes or lowering benefits, 69 percent opposed lowering benefits, a
c proportion similar to most of the figures shown earlier in the 1970’s trend data. Higher taxes were not only preferred as an alternative to lower benefits but were also preferred as an alternative to raising the retirement age. These
Table 7.-Importance of increasing benefits, even if coupled with higher taxes: Percentage distribution of poll opinions, by selected year, 197380
Not sure............................................ 7 4 4
Source: Robert Y. Shapiro and Tom W. Smith. “The Polls: Social Security,” Public Opinion tiarterly. Winter 1985, pages 561572.
Note: These data were compiled by Shapiro and Smith from Published and unpubfished sources. The survey questions on which they are based come from a wide variety of Polls conducted by numerous survey organizations.
preferences were consistent with other findings by Hart indicating that early retirement was much more appealing than late retirement.
The public was also inclined to support the present system of funding, though by less certain margins. When alternative financing options were presented, the payroll tax consistently was favored. Given a choice between raising the payroll tax or raising the income tax, 49 percent favored raising the payroll tax and 26 percent preferred raising the Federal income tax. When the alternative was a new national sales tax, 45 percent preferred the payroll tax and 31 percent preferred the sales tax.
The majority, however, did not see an immediate need for more funding despite the lack of confidence in Social Security’s future. About one- half of the population considered the then-current level of payroll taxes to be about right, and a little more than one-fourth said that the taxes were too high. Only about one-tenth said they were too low.
Any apparent contradictions may be the result of the public having only an uncertain or incorrect understanding of Social Security’s financial aspects. For example, a majority were not aware of how or by what amount benefits had increased over time. The provision
Social Security Bulletin, December 1989/Vol. 52, No. 12 7
Table 9.-Sources of retirement income: Percent of persons expecting to receive or receiving income and percent for whom source is or will be a major source, by retirement status, 1979
Source: A Nationwide Survey of Attitudes Toward Social Security, Peter D. Hart Research Associates Inc.. June 1979.
to automatically increase benefits by the amount of the rise in the cost of living became effective in 1975. By the end of 1979, only 45 percent of the public were aware of this provision; nearly 40 percent disagreed and 16 percent were not sure (table 10). In the decade ending in June 1979, general benefit increases had amounted to 140 percent, but only 18 percent of the population said benefits had increased greatly. More persons (49 percent) perceived a great increase in taxes over the IO-year period before the 1979 interviews. Even greater proportions of the population perceived increases in non-Social Security taxes such as gasoline taxes and Federal income taxes, neither of which had been increased.
Although they believed taxes had been increased, many persons had only a vague sense of the amount of Social Security taxes they had actually paid in the previous year. One-half of the population could give no estimate at all. When asked what the tax rate was, 59 percent
could give no answer. In both instances, however, the median reported amounts or rates among the minority who gave an answer were close to the correct figures.
Finances were not the only aspect of Social Security about which many individuals were not well-informed. The Hart survey used two methods to determine how knowledgeable Americans were. First, it asked open-ended questions about Social Security, with respondents volunteering their opinions; then specific statements were presented, requiring a true/false response. Unsurprisingly, higher levels of “passive” awareness about the program appeared in responses to the presented statements than as volunteered information. In general, more of those who ventured an opinion answered correctly (table 10). Some broad features of the program were well understood. Close to 90 percent agreed that Social Security paid benefits to families of workers who became
disabled or died. Even in the open- ended question earlier in the survey, 44 percent mentioned survivor benefits and 29 percent mentioned disability benefits.
Large majorities also chose correctly that benefits are not means-tested and are related to previous earnings, that taxes pay for Medicare, that employees’ taxes are matched by their employers, and that taxes are not saved in individual accounts. However, most individuals were unable to give correct responses about many other features of Social Security, which generally were not very relevant to most respondents’ situations. For example, only 87 percent knew that in 1979 not all Federal employees paid Social Security taxes.
The Hart survey also addressed attitudes toward the disability and survivor components of the program. It is not possible to say much about trends in public opinion regarding these components because virtually no other survey located to date has asked questions about them. However, the public proved to have, as noted above, a fairly high level of awareness about both disability and survivor benefits. The 1970’s had been a period of very rapid growth in the Disability Insurance program, and without prompting almost one-third of the nonretired mentioned disability insurance as a benefit provided by Social Security. The great majority agreed to a statement saying Social Security provided this coverage.
A similar pattern of higher passive awareness appeared when respondents were asked what financial preparations they have made for the possibility that the family’s primary wage earner might become disabled (only 16 percent volunteered Social Security Disability Insurance). After being shown a card listing possible income sources in the event of such
8 Social Security Bulletin, December 1989/Vol. 52, No. 12
a disability, 72 percent said they would expect to receive Social Security disability benefits, and 39 percent said it would be their major source of income. Generally, Social Security was the most frequently expected source of disability income, regardless of current family income levels. However, its selection as the most important source did vary-from 48 percent in the lowest income category to 26 percent in the highest. Still, in almost every category, Social Security was chosen more often than any other type of income.
The importance of Social Security is enhanced by the fact that most members of the public were less prepared for the possibility of disability than they were for retirement. A majority of the nonretired said that their financial preparations would not be enough to pay their monthly bills in the event of disability. This statement was true for less than one-third of those with current family income of more than $25,000, for more than one-half of those in the next lower income category, and for more than two-thirds of those in the lowest income group. Unmarried individuals and those who relied on Social Security as their major or most important source of income were especially concerned about this possibility.
Awareness of survivor protection was even higher than awareness of disability protection. Forty-four percent of the population-including 51 percent of the nonretired- volunteered that survivor insurance was provided by Social Security. Admittedly, when asked about provisions they had made for their families in the event of the death of the primary wage earner, far fewer volunteered Social Security (15 percent) than insurance/life insurance (60 percent) or personal resources (31 percent). When
Table lO.-Statments about Social Security: Percentage distribution of true/false responses, 1979
Selected statements
Social Security retirement benefits are computed without regard to levels of previous wages or salary..
Only those who can prove they are in need of income are eligible for Social Security benefits.. . . . . . . . . .
All Federal employees pay into the Social Security system . . . . . . . . . . . . . . . . . . . . . . . . . . . . . . . . . . . . . . . . . . .
Social Security pays benefits to the families of workers who die...........................................
Social Security benefits go up automatically to match the rise in the cost of living.. . . . . . . . . . . . . . . . . . . . . . . .
Social Security pays for the Food Stamp program.. . . .
Social Securuty tax money collected from an individual is set aside specifically for his or her retirement benefits .,..........,..............................
An employee’s Social Security taxes are matched by the same amount paid by the employer. . . . . . . . . . . . .
Social Security taxes pay for hospital care benefits (Medicare) for the elderly.. . . . . . . . . . . . . . . . . . . . . . . . .
‘Denotes correct response. Source: A Nationwide Survey of Attitudes
Toward Social Security, Peter D. Hart Research Associates Inc.. June 1979.
presented with a list of possible income sources, however, survivor benefits was the option most frequently selected (68 percent). And, 87 percent agreed with the statement that Social Security pays survivors’ benefits (table 10).
Social Security was cited more often as the most important source of survivors’ income (39 percent) than was life insurance policies (28 percent). Expected reliance on Social Security survivor benefits varied by retirement status. Far more retirees than nonretirees counted on it (57 percent and 33 percent, respectively).
.
.
Responses
I I I Total
percent True False Not sure
100
100
100
100
100
100
100
100
100
100
23
19
‘87
37
‘87
‘45
18
27
‘62
‘69
‘59 18
‘74 7
5 8
‘37 26
5 8
39 16
‘41 41
‘62 11
16 22
13 18
Crisis in the Early Eighties
The economic experience by the end of the 1970’s was even less favorable than had been anticipated by the forecasts underlying the 1977 amendments. Widespread media attention to the issue of solvency of the trust funds clearly had an effect on public opinion. In a 1981 study of attitudes toward aging and the aged conducted by Louis Harris and Associates, Inc., a majority of the American adults surveyed (54 percent) said they had hardly any confidence that Social Security would be able to pay them benefits when they retire. Those who were furthest from retirement-individuals aged 1654-were most likely to
Social Security Bulletin, December 1989/Vol. 52, No. 12 9
doubt the system’s future ability to pay (68 percent). However, despite their concerns, a majority supported maintaining the current structure of the program and most people rejected any program cutbacks.
According to the Harris survey, three-fourths of the public understood that Social Security was a pay-as-you-go system, but only a bare majority (51 percent) agreed that taxes should be raised if that action was necessary to provide adequate income for older people. Most other alternative responses to the funding crisis were even less popular. Strong opposition was voiced to reducing benefits for either people already retired (92 percent against) or those who will retire in the future (85 percent against). More than two-thirds (70 percent) did not want any reduction in the cost-of-living adjustments, A majority (more than 60 percent) disapproved of having need-based benefits or of eliminating benefits for minor children of retired workers, and a similar proportion did not approve of a raise in the retirement age.
Some other changes that would have helped the trust funds were more popular. Most of the study population approved of requiring Social Security taxes from workers not currently covered, and most approved of the use of Federal funds such as income taxes to pay for part of the cost of Social Security. A narrower majority (56 percent) were willing to make the indexing of benefits somewhat less generous by basing it on the lower of either increases in wages or prices.
In December 1981, shortly after the Harris survey was Completed, the National Commission on Social Security Reform was established to review the financial condition of the trust funds and to make recommendations based on its
findings. Those recommendations became the basis for the 1983 amendments. The 2 years during which the Commission’s work was completed can be characterized as the low ebb in public opinion. Confidence fell to its lowest levels in the polls, and in the period 1982-84, only one-third of the public said they were confident in Social Security’s future (table 2).
Media attention to Social Security was apparently reaching the public, and a majority of the population reported themselves to be well- informed about the program (table 1). An awareness of Social Security’s financial problems may have heightened the public’s concern that their own savings for retirement would run out. The data in table 11 show that such concern was high in 198384 (63-68 percent). Perhaps as a result of this concern, survey responses showed some signs that serious consideration was being given to reforms that traditionally have been unpopular,
Thus, although a variety of polls have shown large majorities of the public consistently opposed to raising the retirement age (Harris, 1981, and table 12), one poll in November 1982, at the depth of the crisis, showed considerably more divided feeling-52 percent of the population still opposed raising the age and 45 percent were in favor of
such action. By the time the 1983 amendments (described below) were signed into law, more than 60 percent of the public were again opposed to the higher age for retirement. Similarly, although strong majorities of about 60-80 percent usually opposed any reduction in cost-of-living adjustments (table 13)-even when the question was phrased as a postponement to reduce the Federal deficit-two polls taken in January 1983 showed a slight majority (53 percent and 54 percent) willing to delay the increase (table 14).
Despite this wavering, public opinion held firm in its general support for the program. About three-fourths of the population remained of the opinion that Social Security should provide enough for at least an adequate standard of living, according to polls in 1978, 1982, and 1984 (table 15). In spite of an occasional odd discrepancy between results from polls taken at about the same time, in nearly every case in the 1980’s, a majority said the Government should spend more on Social Security (table 16). There was firm and generally increasing opposition (76-95 percent) to a spending cut for Social Security (table 17). Numerous polls in the early 1980’s showed about
Table Il.-Concern that savings for retirement will run out: Percentage distribution of degree of concern, 1983-86
Source: Robert Y. Shapiro and Tom W. Smiih, “The Polls: Social Security.” Public Opinion tiarierty, Winter 1985, pages 561572.
Note: These data were compiled by Shapiro and Smith from published and unpubtished sources. The survey questions on which they are based come from a wide variety of polls conducted by numerous survey organizations.
Social Security Bulletin, December 1989/Vol. 52, No. 12 11
Table 15.-Level of financial support Social Security should provide: Percentage distribution of opinions, by selected years, 1978-84
Opinion
Total percent..................................
Social Security should provide by itself a retirement income sufficient for a comfortable standard of living. .
Social Security should provide by itself a retirement income sufficient for an adequate standard of living.. .
Social Security should provide a partial retirement income, not enough by itself to guarantee a minimum standard of living.. . . . . . . . . . . . . . . . . . . . . . . . .
three-fourths of the public choosing a cut in defense spending over a cut in Social Security benefits (table 18).
Return to Normal
The 1983 amendments made a number of changes, some of which were phased in gradually. Major provisions included the extension of coverage to specified categories of Federal employees and to employees of nonprofit organizations. Scheduled increases in the tax rates were accelerated, and tax rates for the self-employed were increased. Up to 50 percent of Social Security benefits were to be included in the taxable income of higher-income beneficiaries and the additional revenue generated would be transferred to the trust funds. Beginning early in the next century, the age of eligibility for full benefits would be increased gradually.
It soon became clear that the 1983 amendments had restored the financial soundness of the Social Security system. By 1985-86, the percent of the population expressing concern had dropped, though concern was still reported by more than half of the public. Correspondingly, in the mid-1980’s the proportion with confidence in
Table 17.-A spending cut for Social Security: Percentage distribution of opinions, 1980-85
Date of poll
Opinion March 1980 Jan. 1981 Aug. 1981 Sept. 1981 Aug. 1982 Jan. 1983 Summer 1984 Jan. 1985
Source: Robert Y. Shapiro and Tom W. Smith, “The Polls: Social Security,” Public Opinion Quarterly, Winter 1985, pages 581572.
Note: These data were compiled by Shapiro and Smith from published and unpuMished sources. The survey questions on which they are based come from a wide variety of polls conducted by numerous survey organizations.
the future of the system began edging up, and by 1988 nearly half of the public expressed such confidence.
In connection with the 50th anniversary of the Social Security Act, the American Association of Retired Persons (AARP) sponsored a national survey, conducted by Yankelovich, Skelly, and White, Inc., about what the American public thinks and feels about the system after a half century of actual experience. Survey results reflected the return of confidence found in other polls. Some 46 percent of the population expressed confidence in the program’s future, although the proportion differed considerably by age. Sixty-three percent of those aged 62 or older were confident about the future of the program, compared with only 33 percent of those in the youngest age group.
Although the overall proportion of persons expressing confidence was somewhat higher in 1985 than it had been in 1979, it was still a minority view. However, based on some focus group discussions that supplemented the questionnaire, the AARP report noted that the real concern among nonretirees was
less about the discontinuation of the program altogether than about the adequacy and level of benefits in the future. This apprehension echoes the pattern of poll results found earlier-that lack of confidence is less indicative of lack of support for the broad idea of Social Security than it is of concern about perceived shortcomings of the program in its present form.
In fact, the AARP survey contained overwhelming evidence that Social Security had strong public support. It was regarded as an important Government program by 96 percent of the population and as a success by 92 percent. Asked to choose between continuing or phasing out the program, 88 percent said it should continue. A large majority (94 percent) agreed that it was important to have Social Security because more people were living to an older age; many saw Social Security as relieving them of a great financial burden of having to care for aged parents (80 percent); and nearly everyone (98 percent) agreed that Social Security benefits are essential sources of income for many elderly Americans. Only 16
percent of the population stated that Social Security had outlived its usefulness. In the absence of Social Security, most believed that a person’s financial position would be worse off (78 percent); that some elderly would be forced to go on welfare (96 percent); and that some elderly would be forced to rely on their children (94 percent). Among nonretired individuals who knew someone receiving benefits, 82 percent had a favorable overall view of the system.
In spite of the Federal budget deficit, 68 percent of the public disagreed that the country could not afford Social Security It was lowest on the list of which programs to cut to reduce Federal spending. Only 11 percent would have cut retirement benefits; 87 percent opposed eliminating the cost-of-living adjustments. There continued to be a willingness to pay for Social Security. Seventy-nine percent knew that the taxes paid were used to pay benefits for current Social Security recipients, and nearly the same number considered these taxes to be fair.
Despite their lower levels of confidence in the future of Social Security, most nonretired persons said they would stay in the system even if they were given the option of leaving. The proportion that would remain was nearly as high (73 percent) as it had been in the 1979 study (77 percent). There was virtually no variation by age, although there was still some variation by income. But again, even in the highest income category, the majority of those not yet retired (60 percent) said they would not leave the program. In the lowest income category, the proportion who would remain in the program rose to 80 percent.
Respondents were asked to choose the most important source of retirement income. The
Social Security Bulletin, December 1989/Vol. 52, No. 12 13
importance of Social Security stood out. For those already retired, 55 percent chose Social Security (table 19). \n the \owest income category, fully 85 percent said Socia\ Security was the most important, compared with only 20 percent in the highest category. For these upper-income retirees, a company pension payment was the source most frequently reported (41 percent).
The expectations of the nonretired population were quite different. Only 23 percent anticipated that their main income would be from Social Security payments; more (28 percent) said that private company pension payments would be the main source of income. As in the 1979 survey, responses varied by income (table 20). Social Security was much more important than any other income source for those with the lowest level of current income, For those with the highest income, money from savings and investments was most often expected to be the main source of retirement income. Overall, however, with little variation by age, about 8 in 10 of the nonretired said they would rely on Social Security at least somewhat.
Part of the reason so few of the nonretired intended to rely primarily on Social Security might have been
that 4 in 10 perceived benefits as inadequate. To some extent, this belief reflects a rather high level of expectations. More than 7 in 10 said Social Security should provide a retirement income sufficient for an adequate or comfortable standard of living; only 38 percent thought that it actually did. However, those aged 25-61 (nonretired) in the AARP survey were not doing a great deal to build up other sources of retirement income. Nine in 10 said it was important to plan for retirement and more than 70 percent said they were worried that they may not have enough money to get by on. But, more than 80 percent of the nonretired group said they found it hard to put money away for retirement.
Of course, some of the younger nonretired in the broad-based AARP sample will have time to begin serious preparations for retirement later in their careers. In another survey in the same year-The Prime Life Generation-conducted for the American Council of Life Insurance, a sample of persons near retirement age (aged 5064) reported more active preparation. Regardless of income, the Prime Lifers indicated
Table 19.-Source of income relied on most: Percentage distribution of retired persons, by level of current income, 1985
Total retired Less than $10,000- $20,000 Main source of income persons $10,000 $19,ooo or more
Source: A Fifty Year Report Card on the Social Sacurity System-Tha Attitudea of tha American Public, Yankelovich, Sk&y. and White, Inc.. August 1965.
that their two greatest retirement worries were health and money. Two-thirds of them had already taken steps to provide for medica\ care insurance and almost as many said they had or were building up savings.
Clearly Social Security was playing an important part in meeting their financial concerns. SOme of the Prime Lifers were already retired. About 60 percent of these retirees received Social Security benefits, and these benefits were cited most often as the major source of income. Among couples with at least one spouse still employed, Social Security was anticipated to be a source of retirement income by about 90 percent, though these couples expected to rely less on Social Security and more on pensions, savings, and investments than couples who were already retired.
The 1983 amendments “rescued” Social Security in part by increasing the current tax burden. Despite the general unpopularity of taxes, large majorities of the public favor an even more expansive program. In a late 1986 survey sponsored by AARP and focused on attitudes of various age groups toward each other, there were strong indications of general support for the role of Government in helping the elderly. Sixty-four percent of the population strongly agreed that the Government was not doing enough for them, and the same percentage said the Government should spend more for Social Security payments. A clear majority perceived the Social Security tax to be fair, although there was some variation by age-from 67 percent of those aged 21-29 to 79 percent of those aged 62 or older.
14 Social Security Bulletin, December 1989/Vol. 52, No. 12
Table PO---Main source of expected income in retirement: Percentage distribution of nonretired persons, by level of current earnings, 1985
Total Less non- than $20,000- $30,000- $50,000
Main source of expected income retired $20,000 $29,000 $49,000 or more
Money from an IRA or Keogh plan.. . . . . . . 11 5 11 15 17 Other sources........................... 13 12 15 11 11 Not sure/no answer.. . . . . . . . . . . . . . . . 6 6 6 6 6
Source: A Fifty Year Report Card on the Social Security System-The Attitudes of the American Public, Yankelovich, Skelly. and White, II-C.. August 1985.
Summary
In the early years of the Social Security program, public support for old-age pensions was high but knowledge and understanding about benefits and taxes were low. Understanding has greatly increased, even though the program has expanded, and support for Social Security has remained high. Data from the surveys and polls examined in this article indicate that support for Social Security was strong even during the late 1970’s and early 1980’s, when a fiscal crisis generated a crisis of confidence in the public’s perception of the system’s ability to
* pay benefits in the future. The proportion of the American public declaring confidence in the program declined sharply from a large
, majority with confidence (63 percent) in 1975 to a minority with confidence (39 percent) in 1978. Following the restoration of program
financing through the provisions in the 1983 amendments, the trend has reversed. By 1988, nearly one- half of the public expressed confidence in the future of the Social Security program.
For the most part, other aspects of public opinion regarding Social Security have shown great stability over the years. The program is popular and has been well- supported. Support for the Government to spend more for Social Security has been consistently high, as has support for benefits to increase with inflation and for benefits to increase even if it means higher taxes. Many individuals rely on income from Social Security or expect to rely on it when they retire. It is clear that the public wants the program to continue. If participation were optional, about three-fourths of the population would stay in the program.
References
American Council of Life Insurance, Monitoring Attitudes of the Public, (annual survey).
American Council of Life Insurance and the Health Insurance Association of America, The Prime Life Generation, 1985.
American Enterprise Institute for Public Policy Research, “Social Security: Young and Old View the System’s Prospects,” Public Opinion, April/May 1985, pages 21-24.
Daniel Yankelovich Group, Inc., Intergenerational Tension in 1987: Real or Imaglned?, April 1987.
Louis Harris and Associates, Inc., Aging In the Eighties: America in Transition, November 1981.
Michael E. Schiltz, Public Attitudes Toward Social Security 1935-1965 (Research Report No. 33), Office of Research and Statistics, Social Security Administration, 1970.
Peter D. Hart Research Associations, Inc., A Nationwide Survey of Attitudes Toward Social Security, November 1979.
Robert Y. Shapiro and Tom W. Smith, “The Polls: Social Security,” Public Opinion Quarterly, Vol. 49, Winter 1985, pages 561-572.
Yankelovich, Skelly, and White, Inc., A Fifty-Year Report Card on the Social Security System-The Attitudes of the American Public, 1985.
Technical Appendix
Data used in the article are from published reports of the main surveys quoted (Hart, Harris, Prime Life, and AARP) and from published compilations of numerous poll results summarized in Public Opinion and Public Opinion Quarterly. The original source for some of the compilations was the Monitoring Attitudes of the Public surveys. The size and composition of the samples, the interviewing techniques, the questions asked, and the context in which the questions were asked all vary.
Monitoring Attitudes of the Public is an annual survey that has been conducted since 1968. The surveys collect information on a number of issues related to life and health insurance industries. The questions vary from year to year, though some are repeated frequently (such as those pertaining to the confidence in Social Security’s future). The sample is designed to represent noninstitutionalized adults aged 18 or older. The sample size is usually about 1,500 and personal interviews are conducted.
The 1979 Hart survey was a national sample of households. One adult respondent, aged 18 or older, was selected randomly in each household. Personal interviews were conducted with 1,549 respondents in November 1979. The entire survey was devoted to attitudes toward Social Security.
The 1981 Harris survey consisted Of 3,427 participants: 1,495 from a national cross section of adults aged 18 or older, the rest from oversamples of persons aged 65 or older (1,265); persons aged 55-64 (219); blacks (166); and Hispanics
(282). Personal interviews were conducted. The focus was on attitudes about aging and the aged. One of the issues examined was attitudes (confidence, knowledge, and support) toward Social Security.
The Prime Life study used a national telephone survey to collect data on attitudinal questions. Interviews were conducted with 997 persons aged 5WX Data collection occurred in October-November 1984. This study used Census data to examine the economic and demographic characteristics of the age group preparing for retirement (though some were already retired). The survey portion of the study was conducted to learn their attitudes regarding values, lifestyles, health, and finances. The attitudinal questions included some items about Social Security .
The 1985 AARP survey was a national sample of adults aged 25 or older. (The survey was supplemented by six small group discussions.) Telephone interviews were conducted with 2,052 respondents in April-May 1985. All of the questions concerned attitudes toward Social Security.
The 1987 AARP survey was a national sample of adults aged 21 or older. (It was supplemented by eight focus group discussions.) Telephone interviews were conducted with 2,000 respondents in September-October 1986. The questions focused on the attitudes and perceptions of younger and older Americans toward each other. One section asked about treatment of the elderly, support for Government spending for programs, and beliefs about Social Security.
The Public Opinion Quarterly article assembled poll questions pertaining to Social Security. The questions reported were from the files of the Policy Change and Public Opinion Change Project at the National Opinion Research Center, NORC. Data were compiled from published and unpublished sources of 15 archive or survey organizations. In most cases, the national sample sizes were at least 1,000. In constructing “trends,” the authors note that assessing support or change in preferences must take into account that there is often significantly different wording to questions; that response categories may differ; that questions may or may not describe the program in detail; that questions may ask about existing policies or proposed changes (changes receive less support); and that changes may be proposed to help the Social Security system or to reduce the Federal budget.
Public Opinion presented a selection of responses from several polls conducted by eight sponsoring agencies between 1975 and 1985. Sample descriptions for all the surveys were not given. Of the known sample sizes, two were under 1,000 persons and one was nearly 5,000 persons. Data shown are from single poll questions. Their context is not known, though some appear to be from political surveys.
16 .%cinl Secllritv Rldlpltin IXcnmtwr 19R!J/Vnl 57 Nn 17