Intertek Fisheries Certification (IFC) 10A Victory Park Victory Road Derby DE24 8ZF UK www.intertek.com/food/msc-certification INTERTEK FISHERIES CERTIFICATION September 2014 Ref: 82553 New Zealand Ling Trawl and Longline Fishery PUBLIC CERTIFICATION REPORT V5 Authors: J Akroyd, G Pilling Conformity Assessment Body: Client: Intertek Fisheries Certification Deepwater Group Limited 10A Victory Park Seafood Industry House Victory Road 74 Cambridge Terrace Derby Private Bag 24901 United Kingdom Wellington 6142 DE24 8ZF New Zealand
Transcript
Intertek Fisheries Certification (IFC)
10A Victory ParkVictory Road
DerbyDE24 8ZF
UKwww.intertek.com/food/msc-certification
INTERTEK FISHERIES CERTIFICATION
September 2014
Ref: 82553
New Zealand Ling Trawl and Longline Fishery
PUBLIC CERTIFICATION REPORTV5
Authors: J Akroyd, G Pilling
Conformity Assessment Body: Client:
Intertek Fisheries Certification Deepwater Group Limited10A Victory Park Seafood Industry HouseVictory Road 74 Cambridge TerraceDerby Private Bag 24901United Kingdom Wellington 6142DE24 8ZF New Zealand
NZ Ling MSC Full Assessment PCR v5 September 2014 page 2
3.4.1 The aquatic ecosystem, its status and any particularly sensitive areas, habitats orecosystem features influencing or affected by the fishery ............................................................31
3.4.2 The retained, bycatch and endangered, threatened or protected (ETP) species includingtheir status and relevant management history ..............................................................................34
NZ Ling MSC Full Assessment PCR v5 September 2014 page 4
Figures
Figure 1: Location of New Zealand Ling Fisheries Management Areas (FMA) .................................................. 12Figure 2: Area of ling stocks LIN 3, 4, 5, 6 and 7 and the 1000 m isobath. The boundaries used to separate
biological stock LIN6B from the rest of LIN6, and LIN 7QC (west coast South Island section of LIN7)from LIN 7CK (the Cook Strait section of LIN 7), are shown by broken lines (from Horn, 2013a). LIN 1, 2and 10 are not being assessed at this time..................................................................................................... 16
Figure 3: Maps of the 20-class version of the 2005 general purpose Marine Environment Classification (MEC,from Snelder et al. 2005; left) and Benthic Optimised Marine Environment Classification (BOMEC; fromLeathwick et al., 2010; right)........................................................................................................................ 51
Figure 4 : Map showing the general location of benthic protection areas and seamount closures within NZ EEZSource: Deepwater Group............................................................................................................................. 52
Figure 5. Total swept area of ling-targeted trawls over the period 1989-90 to 2009-10, from Black et al. (2013)....................................................................................................................................................................... 54
Tables
Table 1: Number of vessels by gear and target fishery for ling (LIN) stocks that reported landingsduring recent completed fishing years (Oct–Sept). . ............................................................ 16
Table 2 : Reported ling landings (t) from 1975 to 1987–88. ............................................................... 18Table 3 : Reported landings (t) of ling by fish stock from 1983–84 to 2011–12 and TACC (t) set for
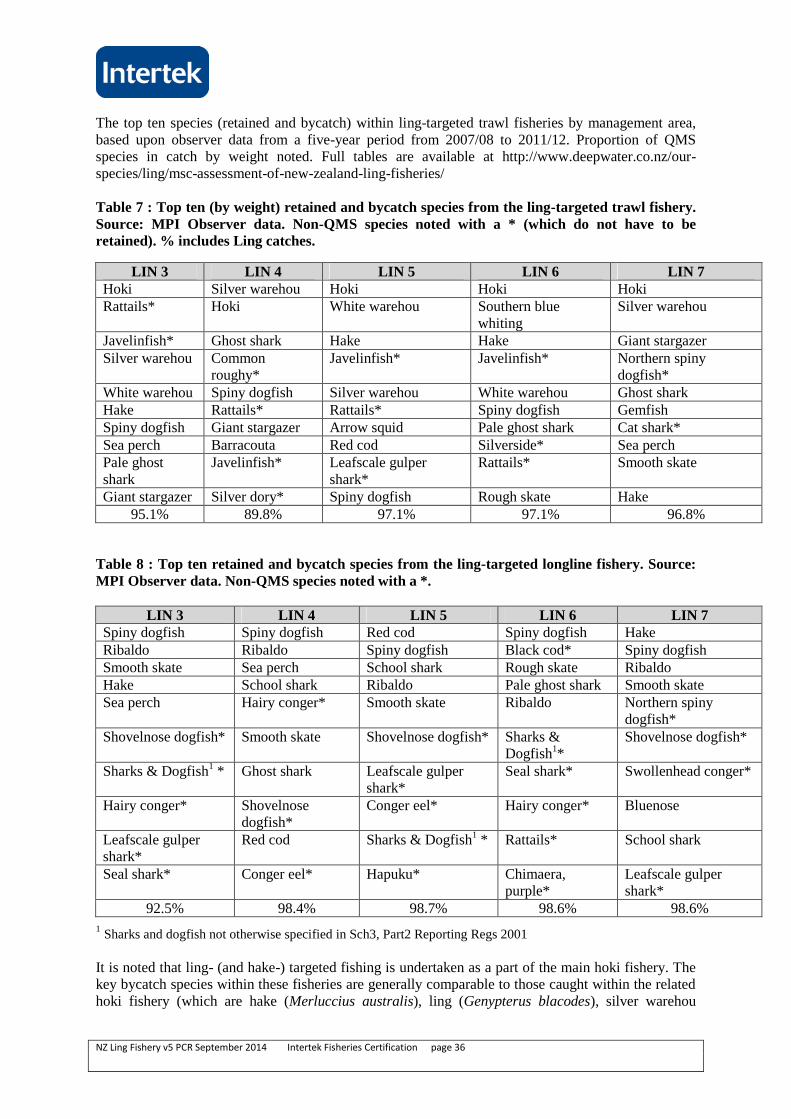
1986–87 to 2011–12. ............................................................................................................19Table 4 : Reference points and current state of stock for ling.. ........................................................... 22Table 5 : Results of projections for tested catches (base case models). ..............................................28Table 6: Percentage of observer coverage by fishing year and Unit of Certification . ....................... 36Table 7 : Top ten retained and bycatch species from the ling-targeted trawl fishery.. ........................ 37Table 8 : Top ten retained and bycatch species from the ling-targeted trawl fishery. . ....................... 38Table 9: Summary of all bird captures in ling trawl fisheries, with the number of tows, tows
observed, percentage of tows observed, number of observed captures, capture rate perhundred tows, total estimated captures with 95% confidence intervals, and percentage of tows included in the estimate. .............................................................................................. 45
Table 10: Summary of all bird captures in ling trawl fisheries, broken down by fishing areas, with thenumber or tows, number of tows observed, percentage of tows observed, number ofobserved captures, capture rate per hundred tows, total estimated captured with 95%confidence intervals, and percentage of tows included in the estimate. . ............................. 45
Table 11: Summary of all bird captures in ling longline fisheries, with the number of tows, tows observed, percentage of tows observed, number of observed captures, capture rate perhundred tows, total estimated captures with 95% confidence intervals, and percentage of tows included in the estimate................................................................................................ 46
Table 12: Summary of all bird captures in ling longline fisheries, broken down by fishing areas, withthe number or tows, number of tows observed, percentage of tows observed, number ofobserved captures, capture rate per hundred tows, total estimated captured with 95%confidence intervals, and percentage of tows included in the estimate. ............................... 47
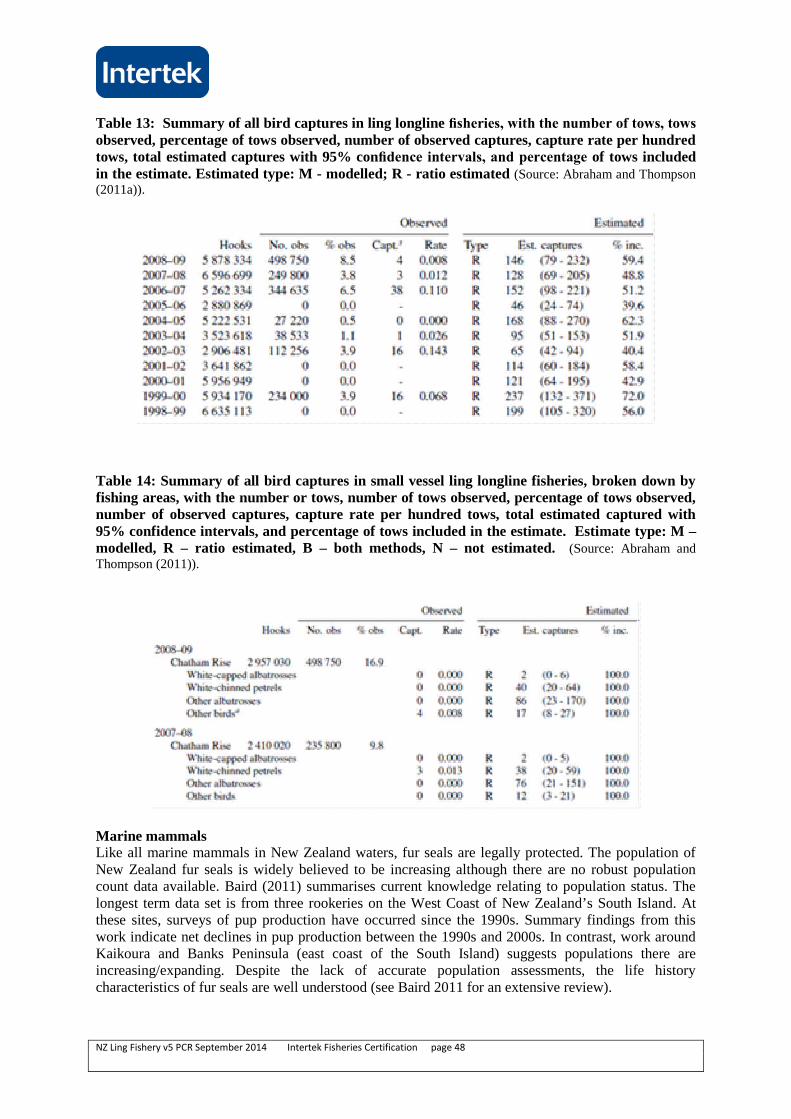
Table 13: Summary of all bird captures in ling longline fisheries, with the number of tows, tows observed, percentage of tows observed, number of observed captures, capture rate perhundred tows, total estimated captures with 95% confidence intervals, and percentage oftows included in the estimate................................................................................................ 49
Table 14: Summary of all bird captures in small vessel ling longline fisheries, broken down by fishingareas, with the number or tows, number of tows observed, percentage of tows observed,number of observed captures, capture rate per hundred tows, total estimated captured with95% confidence intervals, and percentage of tows included in the estimate. ..................... 49
NZ Ling MSC Full Assessment PCR v5 September 2014 page 5
Table 15: Summary of New Zealand fur seal captures in ling trawl fisheries, broken down by fishing areas, with the number of tows, tows observed, percentage of tows observed, number ofobserved captures, capture rate per hundred tows, total estimated captures with 95%confidence intervals, and percentage of tows included in the estimate. ............................... 50
Table 16: Swept area of ling-targeted tows between 1989-90 and 2009-10. ........................................54Table 17: List of stakeholders consulted during the 2009 assessment.................................................. 62Table 18: List of stakeholders consulted during 2013 assessment ....................................................... 63Table 19: Scoring elements................................................................................................................... 66Table 20: Final Principle Scores...........................................................................................................69Table 21: Summary of conditions.........................................................................................................76
NZ Ling MSC Full Assessment PCR v5 September 2014 page 6
Glossary of Acronyms and Abbreviations
ACE Annual Catch EntitlementB0 Unfished Equilibrium BiomassBPA Benthic Protection AreaCAB Conformance Assessment BodyCAY Current Annual YieldCITES Convention on International Trade in Endangered SpeciesCPUE Catch per Unit EffortCR Certification RequirementsDOC New Zealand Department of ConservationDWG Deep Water Group LtdEEZ Exclusive Economic ZoneETP Endangered, Threatened, Protected SpeciesEU European UnionF Fishing MortalityFAO Food and Agriculture Organisation of the United NationsFCV Foreign Charter VesselsFAM Fisheries Assessment MethodologyHAK HakeHOK HokiINMARC Interim Nearshore Marine ClassificationIFC Intertek Fisheries CertificationIMM Intertek Moody MarineIPI Inseparable or Practically InseparableLFR Licensed Fish ReceiversLIN LingLTL Low Trophic LevelMCMC Markov Chain Monte Carlo MethodMCS Monitor, Control and SurveillanceMCY Maximum Constant YieldMFish New Zealand Ministry of FisheriesMHR Monthly Harvest ReturnsMPD Maximum Posterior DensityMPI Ministry of Primary IndustriesMSY Maximum Sustainable YieldsNIWA National Institute of Water and Atmospheric ResearchNPA National Plan of ActionsNZ New ZealandOS Ocean SurveyPSA Productivity Sensitivity AnalysisQMA Quota Management AreaQMS Quota Management SystemRFMO Regional Fisheries Management OrganisationsSPRFMO South Pacific Regional Fisheries Management OrganisationsTAC Total Allowable CatchTACC Total Allowable Commercial CatchTCEPR Trawl Catch, Effort and Processing ReturnTL Total LengthVME Vulnerable Marine EcosystemVMP Vessel Management PlansVMS Vessel Monitoring SystemWWF World Wildlife Fund
NZ Ling MSC Full Assessment PCR v5 September 2014 page 7
Executive Summary
The Intertek Fisheries Certification assessment team
An assessment of the New Zealand ling longline and trawl fisheries using Marine StewardshipCouncil (MSC) Principles and Criteria was carried out in 2009 by a team of three Intertek FisheriesCertification assessors: Dr Paul Medley (Principle 1), Dr Graham Pilling (Principle 2) and Jo Akroyd(Principle 3) with Andrew Hough as Lead Assessor. At the client’s request the assessment processwas put on hold and then recommenced in 2013, with two of the original assessors: Jo Akroyd (Leadand P3) and Graham Pilling (P1 and P2). Paul Knapman joined as Project Director. In the course ofthis assessment Intertek Moody Marine changed its name to Intertek Fisheries Certification (IFC).
Process used
A site visit was made to Nelson and Wellington, New Zealand (NZ) in June 2009. An evaluation wascarried out, for the NZ ling fisheries, against the Marine Stewardship Council’s (MSC) Principles andcriteria for sustainable fishing (November 2002). Information gathered during this site visit was thenused in conjunction with other available literature to produce a draft report and score the fisheryagainst the MSC Performance Indicators. The MSC Fisheries assessment Methodology (FAM) v1(January 2008) was used. The draft report and scores of the fishery were then presented to the client,Deepwater Group (DWG), for review. The client determined that it would delay the assessmentprocess until particular issues within the fishery had been addressed. In August 2013 the clientrequested that the assessment be resumed. To ensure the assessment was brought up to date withcurrent information and to give stakeholders a further opportunity to participate in the assessmentprocess, a second site visit to Wellington took place in September 2013. Two of the original assessorsfrom IFC (Jo Akroyd and Graham Pilling) formed the IFC conformity assessment body (CAB).During this site visit the assessment team made themselves available to stakeholders and reviewed alladditional information relevant to the ling fishery before preparing this version (v2), the preliminaryclient draft assessment report. For this assessment, the recent assessment team used Part C of theMSC Certification Requirements V1.3 January 2013 and the default assessment tree contained within.
As a result, this report contains the findings and recommendations of the assessment team for ten unitsof certification (UoCs) for the NZ ling longline (5 UoCs) and trawl fisheries (5 UoCs) assessedagainst the MSC Principles and criteria.
The main strengths and weaknesses of the client’s operation
The NZ ling fishery has been managed under the NZ Quota Management System (QMS) since itsintroduction in 1986. Since then there have been many improvements in the management of thefishery. There are now well-defined and documented processes for most of the operations. Theamount of data available to evaluate consistency with the MSC Criteria is also a significant strength.The NZ hoki fishery has been MSC certified since 2001. Many of the operators and managers aresame for both fisheries.
There is a partnership approach to fisheries management between the DWG and the Ministry ofPrimary Industries1 (MPI), underpinned by a Memorandum of Understanding. The two parties havedeveloped a single joint-management framework with agreed strategic and operational priorities andworkplans.
1On July 1, 2011 the Ministry of Fisheries (MFish) merged with the Ministry of Agriculture and Forestry. The new Ministry
became the Ministry for Primary Industries (MPI) on 30 April 2012.
NZ Ling MSC Full Assessment PCR v5 September 2014 page 8
The strong communication and ongoing liaison between DWG and their operators is an importantfactor.
In recent years, the client has supported a shift away from prescriptive regulatory fisheriesmanagement to a strong focus on more collaborative fisheries management, including industryimplementation of operational plans which are monitored and audited by government.
Given the reliance on observer information to identify and monitor non-retained (non-QMS) speciesand ETP interactions within the fishery, a further weakness is the level and consistency of observercoverage within particular Units of Certification (UoC) of both the trawl and (inshore/offshore)longline fisheries. Coverage in particular UoCs was occasionally absent, or low and lacked year-on-year coverage to identify temporal trends. It is also noted that available analyses of bycatch and ETPinteractions tended to combine fisheries (e.g. into the hoki/hake/ling trawl fishery complex, orlongliners as a group), which means that the trends and impacts within the specific UoC was harder toidentify.
The determination reached
It has been determined by Intertek Fisheries Certification that this fishery should be certified inaccordance to the MSC principles and criteria.
NZ Ling MSC Full Assessment PCR v5 September 2014 page 9
Conditions and timescales
Three conditions of certification have been identified. Refer to Section 6.4 and Appendix 1.2 for
details.
Condition 1: Status ETP species PI 2.3.1
The client is required to demonstrate that the direct effects of <34 m longline vessels (not targetingbluenose or snapper) are highly unlikely to create unacceptable impacts to ETP bird species.
Timescale: By the first annual audit, the client will provide evidence in the form of a report on thework it has undertaken to demonstrate that the direct effects of <34 m longline vessels (not targetingbluenose or snapper) are highly unlikely to create unacceptable impacts to ETP bird species.
By the second annual surveillance audit the client will provide evidence in the form of a report toshow that the direct effects of <34 m longline vessels (not targeting bluenose or snapper) are highlyunlikely to create unacceptable impacts to ETP bird species.
Condition 2: Management Strategy ETP species. P 2.3.2The client is required to demonstrate that there is a strategy in place for managing the inshore longlinefishery component’s impact on ETP species, including measures to minimise mortality, which isdesigned to be highly likely to achieve national and international requirements for the protection ofETP species.
Timescale: By the first annual audit, the client will provide evidence in the form of a report on thework it has undertaken to develop a strategy for managing the inshore longline fishery component’simpact on ETP species, including measures to minimise mortality.
By the second annual surveillance audit the client will provide evidence in the form of a report on thefurther work it has undertaken to develop and implement a strategy for managing the inshore longlinefishery component’s impact on ETP species, including measures to minimise mortality.
By the third annual surveillance audit the client will provide evidence in the form of a report on thefurther work it has undertaken to develop and implement a strategy for managing the inshore longlinefishery component’s impact on ETP species, including measures to minimise mortality which isdesigned to be highly likely to achieve national and international requirements for the protection ofETP species
Condition 3: Information/monitoring ETP species PI 2.3.3The client is required to demonstrate that information is sufficient to measure trends and support a fullstrategy to manage impacts on ETP species.
Timescale: By the first annual audit, the client will provide evidence in the form of a report on thework it has undertaken to demonstrate that information is sufficient to measure trends and support afull strategy to manage impacts on ETP species, including measures to minimise mortality.
By the second annual surveillance audit the client will provide evidence in the form of a report on thefurther work it has undertaken to measure trends and support a full strategy to manage impacts onETP species, including measures to minimise mortality.
By the third annual surveillance audit the client will provide evidence in the form of a report todemonstrate that information is sufficient to measure trends and support a full strategy to manageimpacts on ETP species.
NZ Ling MSC Full Assessment PCR v5 September 2014 page 10
Authorship and Peer Reviewers
Team members
Jo Akroyd: Expert Advisor Principle 3 (P3) and Lead Assessor: Jo is a fisheries management andmarine ecosystem consultant with extensive international and Pacific experience. She has worked atsenior levels in both the public and private sector as a fisheries manager and marine policy expert. Jowas with the Ministry of Agriculture and Fisheries in New Zealand for 20 years. Starting as a fisheriesscientist, she was promoted to senior chief fisheries scientist, then Fisheries Management Officer, andthe Assistant Director, Marine Research. She was awarded a Commemoration Medal in 1990 inrecognition of her pioneering work in establishing New Zealand’s fisheries quota managementsystem. Among her current contracted activities, she is involved internationally in fishery certificationof offshore, inshore and shellfish fisheries as Fisheries Management Specialist and Lead Assessor forthe Intertek Fisheries Certification audit team. She has carried out the Marine Stewardship Councils’(MSC) certification assessment for sustainable fisheries. Examples include NZ (hoki, southern bluewhiting, albacore, hake, scallops), Fiji (longline albacore) Japan (pole and line tuna, flatfish,snowcrab, scallops), China (scallops) Antarctica (Ross Sea toothfish fishery).
Dr Graham Pilling: Expert Advisor Principle 1 (P1) and Principle 2 (P2): Currently a seniorfisheries scientist at the Secretariat of the Pacific Community, Graham has over nineteen years’experience working in tropical, temperate and polar marine and freshwater ecosystems, gaining indepth experience in the practical assessment and management of pelagic and demersal fisheriesthrough a wide range of methodologies and the provision of scientific advice to fisheries managersaround the world. Fisheries studied include industrial tuna fisheries and artisanal reef fisheries in thetropics and Arabian Gulf. The impacts of anthropogenic influences such as oil spill events and climatechange on fish stocks and fisheries have been examined. Graham has designed and developed modelsto simulate the long-term impacts of uncertainty in stock biology and assessments on fisheriesmanagement and methods to assess and manage data poor fisheries. He has also reviewedinternational biological stock assessments for scientific rigor. Chair of STECF SGMED (2008) andFAO GFCM stock assessment meetings for assessment of demersal species within the MediterraneanSea (2008 and 2009), and chair of the FAO meeting on data poor fisheries (2010). He has been amember of a large number of Marine Stewardship Council accreditation teams assessing fisheries forsustainability against the MSC principles and has played a key role at international commissions ontropical and polar regions. Graham’s work has contributed significantly to the institutionalstrengthening of fisheries institutions in the tropics.
Paul Knapman: General Manager /Project Director: Paul is the General Manager and a LeadAssessor for Intertek Fisheries Certification. He has extensive experience of the fishing industry inNorth America and Europe. He was previously a fisheries consultant working in Europe and Canada;head of a UK inshore fisheries management organization; a senior policy advisor to the UKgovernment on fisheries and environmental issues; and a fisheries officer.
Peer Reviewers
Dr Johanna Pierre
Dr Rob Blyth-Skyrme
NZ Ling MSC Full Assessment PCR v5 September 2014 page 11
Description of the Fishery
Unit(s) of Certification and scope of certification sought
Intertek Fisheries Certification (IFC) can verify that this fishery is not being conducted under acontroversial unilateral exemption to an international agreement and so conforms to Principle 3,Criterion A1 (MSC Certification Requirements v1.3 January 2013 (CR)). Fishing operations do notuse destructive fishing practices such as fishing with poisons or explosions and so conform toPrinciple 3, Criterion B14 (MSC CR).
During the assessment stage and site visit there were to be 12 UoCs , UoCs 1 – 6 covering the trawlfisheries in LIN 2, 3, 4, 5, 6 and 7 respectively, and UoCs 7 – 12 covering the longline fisheries inLIN 2, 3, 4, 5, 6 and 7 (see 3.1.1). However the client has requested that the assessment of LIN 2trawl and longline UoCs be postponed. UoC 1 (LIN 2 trawl) and UoC 7 (LIN 2 longline) have beenomitted from this report.
The Units of Certification (UoC) for the assessment:
The report refers to the UoCs in terms of LIN number and gear type.
3.1.1 Rationale for UoCs
Ling are widely distributed through the middle depths (200–800 m) of the New Zealand EEZ,particularly to the south of latitude 40° S. Current management divides the fishery into six FisheriesManagement Areas (FMA), LIN2, LIN3, LIN4, LIN5, LIN6, LIN7. An administrative fish stock(with no recorded landings) exists for the Kermadec Quota Management Area (QMA, LIN 10). Thelocation of the ling geographical areas is shown in Figure 1 below.
NZ Ling MSC Full Assessment PCR v5 September 2014 page 12
Figure 1: Location of New Zealand Ling Fisheries Management Areas (FMA)
The MSC requirements specify that the UoC is, "The target stock(s) combined with the fishingmethod/gear and practice (including vessel/s) pursuing that stock”.
The target stock for the trawl and longline fishery has six geographic areas requiring six UoCs foreach gear type. Five of these have been assessed against the MSC Principles and criteria, in thisreport.
3.1.2 Description of eligible fishers
Eligible fishers are those operators who have been fully assessed against the MSC's Principles andCriteria for Sustainable Fishing as part of the UoC; and are not currently part of the client group, butmay become eligible to join the client group under a certificate sharing arrangement.
The client group catches between 94% and 96% of the recorded ling landings. Those outside thegroup comprise fishers targeting the same stock using the same methods/gear and operating under thesame management regime as the fishers included in the client group.
NZ Ling MSC Full Assessment PCR v5 September 2014 page 13
In the course of the certification it is possible that these companies/vessels may join the client group.This would be in accordance with the MSC’s stated desire to allow fair and equitable access to thecertification.
3.1.3 Scope of Assessment in Relation to Enhanced Fisheries
The NZ ling fishery is not an enhanced fishery so the scope of assessment in relation to enhancedfisheries does not need to be considered in this assessment.
3.1.4 Scope of Assessment in Relation to Introduced Species Based Fisheries (ISBF)
Genypterus blacodes is native to New Zealand and as such the assessment is not required to considerthe fishery against the ISBF criteria.
3.2 Overview of the fishery
3.2.1 Management operation
DWG was formed in September 2005. The company is an amalgamation of EEZ fisheries quotaowners in New Zealand. It is a non-profit organisation. Fisheries managed by DWG are those targetedcommercially and usually fished at depths between 200 and 1,200 m. These include hoki, hake, ling,orange roughy, oreo dory, squid and jack mackerel.
Prior to September 2005, there were separate management companies for each of the hoki, squid andorange roughy fisheries in New Zealand. In 2005, the three companies agreed to amalgamate, andcombine all deepwater interests in a single management company with a mission to optimise thesustainable economic value of New Zealand deepwater fisheries.
Activities of the DWG include: representing the interests of quota holders with Government and government departments; undertaking fisheries research and stock assessment programs; implementing and monitoring fisheries management programs; working on multiple fronts to manage and minimise any adverse environmental affects; ensuring integrity at all levels of process and engagement; and maintaining fisheries management standards that meet or exceed those required for MSC
Certification.
The New Zealand deepwater fisheries industry involves more than 50 seafood companies, whichbetween them operate more than 60 commercial vessels and collectively employ more than 15,000people
3.2.2 Fleet and Gear Description
The fleets for the deep and mid-water fisheries of ling consist of trawls and bottom-set longlines(Table 1).
TrawlsThe trawl vessels possess exclusively high aspect ratio multipurpose doors which allow bottom ormidwater operation. Vessels exclusively use Furuno CN22/24 net monitoring system electronics,which monitors the headline height, ground rope/seabed relationship and water temperature. Some ofthe fleet have Scanmar or Simrad net monitoring of door spread and codend “fullness”, but none havetrawl sonar, as cabled systems are illegal.
NZ Ling MSC Full Assessment PCR v5 September 2014 page 14
Bottom trawls nets are of single or twin-rig and of two types:
Alfredo derivatives which are characterised by low twine surface area (small nets), lowheadline height (3-5m), short groundrope (20-30 m), small mesh (max 300 m, min 100 m)and medium groundrigs (300-450 mm rubber bobbins).
“Korean” type multipurpose trawls which are characterised by similar headline height andmesh sizes to Alfredo types, but longer groundrope and wings and small groundrope rigs.
The midwater trawls tend to be domestic in origin with a wide range of sizes measured by eitherheadline length or headline opening (opening from 25-75 m). They have an all-nylon net with ropeconstruction in the forepanel mesh in body and weights to open the net. Mesh sizes range from 65 mto 100 mm and can be used as pelagic or semi-pelagic gear.
“Kapron” trawls are used by the chartered 'Russian/Ukraine fleet'. The nets are of nylon constructionwith 12 m maximum mesh size and a 60 m maximum opening. They are a multipurpose trawl used onwide variety of species.
The ling fishery has a minimum mesh size of 100 mm for the cod end mesh.
LonglinersAs well as trawl, ling is targeted by bottom-set longline. Table 1 contains, for each vessel type, theproportion of the total estimated ling catch that was taken by that vessel type while the target specieswas also ling. This gives an indication of the relative importance of the different methods in targetingeach ling stock. In addition, Table 1 indicates the variation in size among the vessels targeting thedifferent stocks, where mean reported number of hooks set varies from 450 to 10339 and line length0.72 to 14.47 km. Although all liners broadly fish in the same way, larger vessels use an autolinersystem setting a larger numbers of hooks.
Bottom-set longline using the autoline system accounts for the majority of ling catches in NewZealand zone (Smith, pers. comm. 2009). The autoline system uses lines set on the bottom,predominately from 5 to 15 km long. The line can be 7 mm, 9 or 11.5 mm in diameter, and hasswivels at set spacing of 1.3 to 1.5 m. The 11.5 mm line is an integrated weighted line (IWL), whichenables the line to sink faster, reducing bird bycatch risk. The larger autoliners operate underCCAMLR conservation measures, which have various bird bycatch mitigation controls on theoperation which are highly effective. The smaller longline vessels, which do not operate in theCCAMLR jurisdiction, do not necessarily have these measures.
Hooks are from 12/0 through to 15/0, but hook size used to target for ling are generally 12/0s (Shaw,pers. comm., 2009). Gear is deployed out the stern of the vessels with a float attached to a grapple totake the line to the bottom and anchor it in place. There is a float and grapple on each end. Somevessels use what are called “droppers”, which is a line set so hooks are about 100 meters off thebottom, although this is used more to target bluenose and hapuka groper.
Table 1: Number of vessels by gear and target fishery for all ling (LIN) stocks that reportedlandings during recent completed fishing years (Oct–Sept). Source: Foster, 2014, pers comm. Notevessels using 'other methods' are not part of this assessment.
Stock Year
No. of vessels
that landed
stock
No. of vessels
that targeted
stock
No. of trawl
target
vessels
No. of lining
target
vessels
No. of target
vessels using
other methods
No. of target
trawl vessels
<28m
No. of target
trawl vessels
>28m
No. of lining
target vessels
<28m
No. of lining
target vessels
>28m
No. of target
vessels using
other methods
<28m
No. of target
vessels using
other methods
>28m
2007/08 108 32 11 19 2 10 1 19 2
2008/09 104 26 11 16 9 1 16
2009/10 97 22 8 15 6 1 15
2010/11 90 27 9 19 7 1 19
2011/12 83 28 10 17 2 7 2 17 2
2012/13 94 17 8 10 6 1 10
2007/08 98 38 10 27 1 8 2 25 2 1
2008/09 96 36 9 26 1 8 1 25 1 1
2009/10 98 37 10 27 9 1 26 1
2010/11 103 39 10 29 9 1 28 1
2011/12 97 42 10 31 1 10 31 1
2012/13 93 37 6 30 1 6 29 1 1
2007/08 130 39 16 21 8 10 6 18 3 8
2008/09 125 41 18 21 9 11 7 18 3 9
2009/10 124 40 22 14 10 14 8 12 2 10
2010/11 126 43 16 20 12 10 6 18 2 12
2011/12 124 38 13 17 11 10 3 14 3 11
2012/13 127 30 6 18 11 4 2 17 1 10 1
2007/08 51 21 10 11 10 6 5
2008/09 44 17 7 9 1 7 5 4 1
2009/10 41 16 8 7 1 8 5 2 1
2010/11 44 13 5 7 1 5 5 2 1
2011/12 39 8 2 6 2 4 2
2012/13 40 12 2 10 1 2 6 4 1
2007/08 84 32 23 8 1 2 21 5 3 1
2008/09 80 20 13 5 2 1 12 3 2 2
2009/10 83 23 15 6 2 4 11 5 1 2
2010/11 86 30 21 9 1 8 13 8 1 1
2011/12 88 29 24 5 7 17 4 1
2012/13 87 33 24 8 2 7 17 7 1 2
2007/08 40 22 19 3 19 1 2
2008/09 35 14 12 2 12 2
2009/10 36 10 8 2 8 1 1
2010/11 35 6 5 1 5 1
2011/12 36 10 8 2 8 1 1
2012/13 32 9 9 3 9
2007/08 116 26 14 13 1 11 3 13 1
2008/09 128 27 12 16 1 10 2 16 1
2009/10 126 34 16 18 1 12 4 18 1
2010/11 122 32 18 15 2 15 3 15 2
2011/12 116 26 15 11 1 13 2 11 1
2012/13 111 29 13 16 2 11 2 15 1 1 1
LIN6
LIN7
LIN1
LIN2
LIN3
LIN4
LIN5
3.2.3 History of fishing and management
Ling are taken mainly by large trawlers, often as bycatch in fisheries targeting hoki, although ling-target fisheries also exist. From 1975 to 1980 there was a substantial longline fishery on the ChathamRise (and to a lesser extent in other areas), carried out by Japanese and Korean longliners. Since 1980ling have been caught by large trawlers, both domestic and foreign owned, and by small domesticlongliners and trawlers. In the early 1990s the domestic fleet was increased by the addition of severallarger longliners fitted with autoline equipment. This caused a large increase in the catches of ling offthe east and south of the South Island (LIN 3, 4, 5 and 6). However, since about 2000 there has been adeclining trend in catches taken by line vessels in most areas, offset, to some extent, by increasedtrawl landings.
The principal grounds for smaller domestic vessels are the west coast of the South Island (WCSI) andthe east coast of both main islands south of East Cape. For the large trawlers the main sources of lingare Puysegur Bank and the slope of the Stewart-Snares shelf and waters in the Auckland Islands area.
Longliners fish mainly in LIN 3, 4, 5 and 6. In 2011–12, landings from Fish stocks LIN 3, LIN 4 andLIN 6 were significantly under-caught relative to their TACCs by 37%, 45% and 76%, respectively.The LIN 5 and LIN 7 TACCs were slightly over-caught (by 2% and 10%, respectively. (Figure 2).For the information of the reader, this section reports catch levels available from all ling FMAs.
Figure 2: Area of ling stocks LIN 3, 4, 5, 6 and 7 and the 1000 m isobath. The boundaries usedto separate biological stock LIN6B from the rest of LIN6, and LIN 7QC (west coast SouthIsland section of LIN7) from LIN 7CK (the Cook Strait section of LIN 7), are shown by brokenlines (from Horn, 2013a). LIN 1, 2 and 10 are not being assessed at this time.
Reported landings by nation from 1975 to 1987–88 are shown in Table 2, and reported landings byFishstock from 1983–84 to 2011–12 are shown in Table 3.
All stocks considered within this assessment were removed from the Adaptive ManagementProgramme on 30th September 2009. In an earlier proposal for the 1994–95 fishing year, TACCs forLIN 3 and 4 had been increased to 2810 and 5720 t, respectively. These stocks were removed fromthe AMP from 1 October 1998, with TACCs maintained at the increased level. However, from 1October 2000, the TACCs for LIN 3 and 4 were reduced to 2060 and 4200 t, respectively. From 1October 2004, the TACCs for LIN 5 and LIN 6 were increased by about 20% to 3595 t and 8505 t,respectively. From 1 October 2009, the TACC for LIN 7 was increased from 2225 t to 2474 t. Allother TACC increases since 1986–87 in all stocks are the result of quota appeals.
Table 2 : Reported ling landings (t) from 1975 to 1987–88. Data from 1975 to 1983 are obtainedfrom MAF; data from 1983–84 to 1985–86 are obtained from FSU; and data from 1986–87 to1987–88 are obtained from QMS, ‘-‘ means no data available.
New Zealand Foreign licensedLongline Trawl Grand Total
Calendar year. April 1 to March 31 (except domestic vessels, which reported by calendar year). April 1 to September 30 (except domestic vessels, which reported by calendar year).
October 1 to September 30.
It is believed that up to the mid 1990s some ling bycatch from the west coast hoki fishery was notreported. Estimates of total catch including non-reported catch are given in Table 3 for LIN 7.
It is believed that historically, some catch from LIN 7 was been reported against other ling stocks(probably LIN 3, 5, and 6). The likely levels of misreporting were considered moderate, being about250–400 t in each year from 1989–90 to 1991–92 (Dunn, 2003). Data for stock assessment wereadjusted accordingly.
The 1993-94 North region recreational fishing survey (Bradford 1996) estimated the annualrecreational catch from LIN 1 as 10 000 fish (CV 0.23). With a mean weight likely to be in the rangeof 1.5 to 4 kg, this equates to a harvest of 15–40 t.
Recreational catch was recorded from LIN 1, 5, and 7 in the 1996 national diary survey. Theestimated harvests (LIN 1, 3000 fish; LIN 5, < 500; LIN 7, < 500) were too low to provide reliableestimates.
Quantitative information on the level of Maori customary non-commercial take is not available. Lingbones have been recovered from archaic middens throughout the South Island and southern NorthIsland, and on Chatham Island (Leach & Boocock 1993). In South and Chatham Islands, lingcomprised about 4% (by number) of recovered fish remains.
User rights
The Quota Management System (QMS) is based on controlling outputs and is designed to ensuresustainable use of the fisheries resources while allowing economic efficiency in the industry. TheQMS approach is to directly limit the total quantity of fish taken. The major focus is on the amounttaken by the commercial fishing industry so that there are sufficient fish available for non-commercialuses and for the conservation of the resource. (The needs of recreational fishers and Maori customaryinterests are provided for before commercial quota levels are set.)
Within the commercial catch limit, access is determined by ownership of quota and ownership ofAnnual Catch Entitlement (ACE). Quota is a right which gives individuals and companies a share ofthe TACC for a particular species in a defined area. Quota can be bought or sold. ACE is generated inproportion to the amount of quota owned by an individual of company at the start of each fishing year,
and is the right to harvest a particular species in a defined area in that quota year. ACE "disappears" atthe end of each fishing year.
The QMS is also being used in dealing with Maori claims to commercial fisheries. The Governmenthas purchased quota and transferred it to the Te Ohu Kai Moana (TOKM, i.e., Treaty of WaitangiFisheries Commission) in recognition of Maori rights to the commercial fishery. TOKM distributesquota to iwi (Maori tribes). When the initial species were introduced into the QMS (e.g. ling) 10%was given to Maori. 20% of commercial quotas of all new species now brought into the QMS aregiven to the TOKM to distribute.
Principle One: Target Species Background
3.3.1 Fishery resources
Ling are widely distributed through the middle depths (200–800 m) of the New Zealand EEZ,particularly to the south of latitude 40°S.
Ling live to a maximum age of about 30 years; fewer than 0.2% of successfully aged ling have beenolder than 30 years. A growth study of ling from five areas (west coast South Island, Chatham Rise,Bounty Plateau, Campbell Plateau and Cook Strait) showed that females grew significantly faster andreached a greater size than males in all areas, and that growth rates were significantly differentbetween areas. Ling grow fastest in Cook Strait and slowest on the Campbell Plateau (Horn 2005).
M (natural mortality) was initially estimated from the equation M = loge100/maximum age, wheremaximum age is the age to which 1% of the population survives in an unexploited stock. The mean Mcalculated from 5 samples of age data was 0.18 (range = 0.17–0.20). However, a recent review of M,and results of modelling conducted in 2007, suggests that this parameter may vary between stocks(Horn 2008b). The M for Chatham Rise ling appears to be lower than 0.18, while for Cook Strait andwest coast South Island the value is probably higher than 0.18.
Ling in spawning condition have been reported in a number of localities throughout the EEZ (Horn2005). Time of spawning appears to vary between areas: July to November on the Chatham Rise;September to December on Campbell Plateau and Puysegur Bank; September to February on theBounty Plateau; July to September off west coast South Island and in Cook Strait. Little is knownabout the distribution of juveniles until they are about 40 cm total length, when they begin to appearin trawl samples over most of the adult range.
3.3.2 Stock assessment and the status of stocks
A review of ling stock structure (Horn 2005) examined diverse information from studies ofmorphometrics, genetics, growth, population age structures, and reproductive biology and behaviour,and indicated that there are at least five ling stocks, i.e., west coast South Island, Chatham Rise, CookStrait, Bounty Plateau, and the Southern Plateau (including the Stewart-Snares shelf and PuysegurBank). Stock affinities of ling north of Cook Strait are unknown, but spawning is known to occur offNorthland, Cape Kidnappers, and in the Bay of Plenty.
3.3.3 Assessments and information
Stock assessments are fully described in reports (Horn et al., 2013 and Horn and Francis, 2013) and inthe recent Plenary Reports (MPI 2013, b,c). The stock assessments for two ling stocks (LIN 7WC,west coast South Island; LIN 7CK, Cook Strait) were updated in 2013, although the updatedLIN2/7CK assessment (for those parts of LIN 2 and LIN 7 between latitudes 41° and 42° S andlongitudes 174° and 175.4° E, equating approximately to Statistical Areas 16 and 17 in Cook Strait)was considered unsuitable for the provision of management advice (see below). Assessments for otherstocks were updated in 2007 (LIN 6B, Bounty Plateau), or 2012 (LIN 3&4, Chatham Rise; LIN 5&6,
Sub-Antarctic). All assessments were updated using a Bayesian stock model implemented using thegeneral-purpose stock assessment program CASAL (Bull et al. 2012).
Fishery-independent surveys provide the main abundance of information for many of the key stockassessments performed, but are not available in all management areas. The exceptions were LIN 6Bwhere commercial longline CPUE data were used as the basis of a relative abundance series, and LIN7WC where (hoki) trawl fishery CPUE and LIN 2/7CK where trawl and line fishery CPUE was used,in the absence of a time series of fishery independent surveys in these regions. As noted in theFisheries Assessment Plenary document (MPI, 2013b), the association of Cook Strait ling (LIN 2CK)with that from the lower east coast of the North Island component of LIN2 is unknown, althougharound 75% of the Cook Strait landings were considered to be from LIN2 (from the Plenary documentof 2009). The proportion of the LIN2 catch taken in the Cook Strait relative to the remainder of LIN2varies from one fifth to one half annually (e.g. Horn and Ballara, 2012). For this audit, the assessmentin LIN2/7CK has been attributed to the LIN7 FMA, along with the LIN 7WC assessment.
Comprehensive trawl surveys have been conducted annually on the Sub-Antarctic (LIN 6) andChatham Rise (LIN 4) stocks, but are only sporadically available for the West Coast South Island(LIN 7WC) stock. The surveys use a random stratified sampling design and routinely collect acousticas well as trawl data (e.g. Stevens et al., 2012).
Age compositions and length compositions are available from the surveys and commercial catches(Horn and Sutton 2012, 2013). Commercial catch sampling takes place through the observerprogramme and is available for all stocks, but does not necessarily form a complete time series.Otolith ageing has been validated (Horn 1993).
The state of the stock is the estimate of the spawning stock biomass relative to the reference points(Table 4). The target, hard and soft limit reference points are 40%, 20% and 10% of the unexploitedstock (B0) by default.
Table 4 : Reference points and current state of stock for ling. The current value is the bestestimate (usually median) and the lower value is a lower bound reported in the assessment(either the lower 90% CI or lower value from the sensitivity analysis). All values arepercentages of the unexploited SSB.
LIN 3&4 (Chatham Rise stock)The stock assessment for LIN 3&4 (Chatham Rise) was updated in 2012. For final model runs, thefull posterior distribution was sampled using Markov Chain Monte Carlo (MCMC) methods, based onthe Metropolis-Hastings algorithm. Bounded estimates of spawning stock virgin (B0) and current(B2011) biomass were obtained. Year class strengths and fishing selectivity ogives were estimated inthe model. Trawl fishery and research survey selectivity ogives were fitted as double normal curves;line fishery ogives were fitted as logistic curves. MCMC chains were constructed using a burn-inlength of 5x10⁵ iterations, with every 1000th sample taken from the next 106 iterations (i.e., a finalsample of length 1000 was taken from the Bayesian posterior).
For LIN 3&4, model input data included catch histories, biomass and sexed catch-at-age data from asummer trawl survey series, sexed catch-at-age from the trawl fishery, line fishery CPUE, unsexed
catch-at-age and catch-at-length from the line fishery, and estimates of biological parameters. Thestock assessment model partitioned the population into two sexes, and age groups 3 to 25 with a plusgroup.
Most priors were intended to be uninformed, and were specified with wide bounds. The exception wasan informative prior for the trawl survey q. The prior on q for all the R.V. Tangaroa trawl surveys wasestimated assuming that the catchability constant was a product of areal availability (0.5–1.0), verticalavailability (0.5–1.0), and vulnerability between the trawl doors (0.03–0.40). The resulting(approximately lognormal) distribution had mean 0.13 and CV 0.70, with bounds assumed to be 0.02to 0.30. Penalty functions were used to constrain the model so that any combination of parameters thatdid not allow the historical catch to be taken was strongly penalised. A penalty was applied to theestimates of year class strengths to encourage estimates that averaged to 1.
Investigative model runs identified a conflict between the line fishery CPUE and the trawl surveybiomass index, where the line fishery biomass index declined between 1991 and 1997, but the trawlsurvey index remained relatively flat throughout. This difference could not be resolved in a singlemodel run by assuming different selectivity ogives for each biomass index. Therefore, to remove thisconflict, a base case model run (Base) used all the observational data except those from the linefishery; the trawl survey biomass index being preferred in the base case because these data werefishery independent. A sensitivity run (NoTrawl) then included the line fishery data, and excluded thetrawl survey data.
The error distributions assumed were multinomial for the at-age and at-length data, and lognormal forall other data. The weight assigned to each data set was controlled by the error coefficient of variation(CV). The observation-error CVs were calculated using standard formulae. An additional processerror CV of 0.2 was added to the trawl survey biomass index following Francis et al. (2001), and aprocess error CV for the line fishery CPUE was estimated at 0.15 following Francis (2011). Themultinomial observation error CVs for the at-age and at-length data were then adjusted using thereweighting procedure of Francis (2011). Reweighting of the at-age and at-length data was completedfor the base and sensitivity runs separately.
The fits to the biomass indices, catch-at-age and catch-at-length data, were reasonable to good in allmodel runs, with generally balanced residuals. Since 1980, year class strengths were below averageexcept for a period between 1994 and 1999, and in 2007. Estimated year class strengths were notwidely variable, with all medians being between 0.5 and 2. Ling were first caught by the trawl survey(mean selectivity A50 of 5.2 years), then the trawl fishery (mean A50 of 8.0 years), and then the linefishery (A50 of 11.0 years). Males were estimated to be less vulnerable than females to the trawl andline fisheries. The estimated median M was 0.15.
The assessment is driven by the catch history, and by catch-at-age data, which contain informationindicative of a stock decline during the 1990s. This is supported by a declining trend in the linefishery CPUE index during that time. Although estimates of current and virgin stock size wereimprecise, it was unlikely that B0 was lower than 110 000 t for this stock, and very likely that biomassin 2011 was greater than 44% of B0.
The model indicated an increasing biomass since 2004 (driven by a reduction in catch). Annuallandings from the LIN 3&4 stock have been less than 4600 t since 2004, markedly lower than the6000–8000 t taken annually between 1992 and 2003.
Differences in the trends between the two relative abundance series (line fishery CPUE declining andthen remaining constant; trawl survey series fluctuating without apparent trend) were noted, and whilenot necessarily incompatible further investigation was not pursued during this assessment.
LIN 5 & 6 (Sub-Antarctic stock)The stock assessment for LIN 5&6 (Sub-Antarctic) was updated in 2012. For final runs, the fullposterior distribution was sampled using Markov Chain Monte Carlo (MCMC) methods, based on theMetropolis-Hastings algorithm. Bounded estimates of spawning stock virgin (B0) and current (B2011)
biomass were obtained. Year class strengths and fishing selectivity ogives were also estimated in themodel. Trawl fishery selectivity ogives were fitted as double normal curves; line fishery and researchsurvey ogives were fitted as logistic curves. Selectivities were assumed constant over all years in eachfishery/survey.
MCMC chains were constructed using a burn-in length of 5x10⁵ iterations, with every 2500th sampletaken from the next 2.5x10⁶ iterations (i.e., a final sample of length 1000 was taken from theBayesian posterior).
For LIN 5&6, model input data include catch histories, biomass and catch-at-age data from summerand autumn trawl survey series, two line fishery CPUE series (from the spawning and home groundfisheries), catch-at-age from the spawning ground and home ground line fisheries, catch-at-age datafrom the trawl fishery, and estimates of biological parameters. A base case model run thatincorporated all the data except the CPUE series is presented, with a sensitivity run that included theCPUE series. The stock assessment model partitions the population into two sexes, and age groups 3to 25 with a plus group.
Lognormal errors, with known CVs, were assumed for all relative biomass, proportions-at-age, andproportions-at-length observations. The CVs available for those observations of relative abundanceand catch data allow for sampling error only. However, additional variance, assumed to arise fromdifferences between model simplifications and real world variation, was added to the samplingvariance. The additional variance, termed process error, was estimated in MPD runs of the model andfixed in all subsequent runs.
Most priors were intended to be relatively uninformed, and were specified with wide bounds. Theexceptions were the choice of informative priors for the trawl survey q. The priors on q for all theR.V. Tangaroa trawl surveys were estimated assuming that the catchability constant was a product ofareal availability (0.5–1.0), vertical availability (0.5–1.0), and vulnerability between the trawl doors(0.03–0.40). The resulting (approximately lognormal) distribution had mean 0.13 and CV 0.70, withbounds assumed to be 0.02 to 0.30.
Penalty functions were used to constrain the model so that any combination of parameters that did notallow the historical catch to be taken was strongly penalised. A small penalty was applied to theestimates of year class strengths to encourage estimates that averaged to 1.
Two model runs were reported:• Base case —with catch history and relative abundance series, M estimated as an ogive
independent of sex, double-normal selectivity ogives for the trawl fishery, logistic ogivesfor the line fisheries and the resource survey series.
• CPUE — the base case model, but incorporating the two line fishery CPUE series.
Three other sensitivities were investigated: (1) splitting the summer survey series into early (1992–2006) and recent (2007–09) series with independent qs, (2) excluding the 2001 survey biomass point,and (3) fitting the survey ogives as double-normal. These models all produced estimates of stockstatus that were little different to those from the reported models.
Posterior distributions of year class strength estimates from the base case model were examined; thedistribution from the CPUE model run differed little from the base case. Year classes were generallyweak from 1982 to 1992, strong from 1993 to 1996, and average since then (although 2005 may bestrong). Overall, estimated year class strengths were not widely variable, with all medians beingbetween 0.5 and 2. Consequently, biomass estimates for the stock declined through the 1990s, buthave exhibited an upturn during the last 12 years. The biomass trajectory from the CPUE model waslittle different to that derived from the base case.
Biomass estimates for the stock appear very healthy, with estimated current biomass from the tworeported models at about 89% of B0. Annual exploitation rates (catch over vulnerable biomass) werelow (less than 0.06) in all years as a consequence of the high estimated stock size in relationship to thelevel of relative catches.
Resource survey and fishery selectivity ogives were relatively tightly defined. The survey ogivesuggested that ling were fully selected by the research gear at about age 7–9. Fishing selectivitiesindicated that ling were fully selected by the trawl fishery at about age 9 years, and by the linefisheries at about age 12–16.
The assessment relied on biomass data from the Sub-Antarctic trawl survey series. The summersurvey series was not particularly well fitted and had clear patterns in the residuals. It was alsoapparent that there can be marked changes in catchability between adjacent pairs of surveys.Estimated trawl survey catchability constants were moderately low (about 4–15% based on doorspread swept area estimates), but are consistent with the priors.
The assessments indicated a biomass trough about 1999 and some recovery since then. Althoughestimates of current and virgin stock size are very imprecise, it is most unlikely that B0 was lower than200 000 t for this stock, and it is very likely that current biomass is greater than 70% of B0.
The relatively high level of uncertainty in the model precluded any updated estimation of MCY andCAY (although an MCY was estimated in the 2007 assessment).
LIN 6B (Bounty Plateau only)The stock assessment for the Bounty Plateau stock (part of LIN 6) was updated in 2007. For finalruns, the full posterior distribution was sampled using Markov Chain Monte Carlo (MCMC) methods,based on the Metropolis-Hastings algorithm. Bounded estimates of spawning stock virgin (B0) andcurrent (B2007) biomass were obtained. Year class strengths and fishing selectivity ogives were alsoestimated in the model. Line fishery ogives were fitted as logistic curves.
MCMC chains were constructed using a burn-in length of 5x10⁵ iterations, with every 1000th sampletaken from the next 106 iterations (i.e., a final sample of length 1000 was taken from the Bayesianposterior).
For LIN 6B, model input data include catch histories, line fishery CPUE, catch-at-age and catch-at-length from the line fishery, and estimates of biological parameters. In the absence of sufficient stock-specific data, maturity ogives were assumed to be the same as for LIN 3&4, a stock with comparablegrowth parameters to LIN 6B. Only a base case model run is presented. The stock assessment modelpartitions the population into two sexes, and age groups 3 to 35 with a plus group. There is one fishery(longline) in the stock.
Lognormal errors, with known CVs, were assumed for all relative biomass, proportions-at-age, andproportions-at-length observations. The CVs available for those observations of relative abundanceand catch data allow for sampling error only. However, additional variance, assumed to arise fromdifferences between model simplifications and real world variation, was added to the samplingvariance. The additional variance, termed process error, was estimated in MPD runs of the model andfixed in all subsequent runs.
The assumed prior distributions used in the assessment were intended to be relatively uninformed, andwere estimated with wide bounds.
Penalty functions were used to constrain the model so that any combination of parameters that did notallow the historical catch to be taken was strongly penalised. A small penalty was applied to theestimates of year class strengths to encourage estimates that averaged to 1.
Only a base case model run was completed. The assessment was driven largely by the catch-at-ageand catch-at-length series from the line fishery; the first two years of CPUE data were not well fitted.The assessment indicates a declining biomass throughout the history of the fishery. Estimates ofcurrent and virgin stock size are not well known, but current biomass is very likely to be above 50%of B0.
LIN 7WC (West coast South Island)The stock assessment for LIN 7WC (west coast South Island) was updated in 2013. The assessmentmodel partitions the population into age groups 3 to 28 with a plus group, with no sex in the partition.
The chosen base case was developed following the investigation of numerous previous models. It wasfound that the model could not reconcile some differences in sex ratios of the age-frequency data, sosex was removed from the partition.
Year class strengths and fishing selectivity ogives were also estimated in the model. Commercialtrawl and research survey selectivities were fitted as double normal curves; the line fishery ogive wasfitted as a logistic curve.
For final runs, the full posterior distribution was sampled using Markov Chain Monte Carlo (MCMC)methods, based on the Metropolis-Hastings algorithm. Bounded estimates of spawning stock virgin(B0) and current (B2008) biomass were obtained. MCMC chains were constructed using a burn-inlength of 2×10⁶ iterations, with every 4000th sample taken from the next 4×10⁶ iterations (i.e., a finalsample of length 1000 was taken from the Bayesian posterior). Single chain convergence tests wereapplied to resulting chains to determine evidence of non-convergence. No evidence of lack ofconvergence was found in the estimates of B0 or Bcurrent/B0 from the base case model run.
For LIN 7WC, model input data include catch histories, trawl fishery CPUE, extensive catch-at-agedata from the trawl fishery, sparse catch-at-age data from the line fishery, biomass estimates andproportion at age from comparable Tangaroa surveys in 2000 and 2012, and estimates of biologicalparameters. A line fishery CPUE series was available, but was rejected as unlikely to be indexingstock abundance. The base case estimated instantaneous natural mortality, M, as a constant.
The error distributions assumed were multinomial for the proportions-at-age and lognormal for allother data. Biomass indices had assumed CVs set equal to the sampling CV, with additional processerror of 0.2. The multinomial observation error effective sample sizes for the trawl fishery at-age datawere adjusted using the reweighting procedure of Francis (2011). An ad hoc procedure was used forthe at-age data from the line fishery and R.V. Tangaroa survey at-age data, giving the survey arelatively high weighting.
The assumed prior distributions used in the assessment were intended to be relatively uninformed, andwere specified with wide bounds. The prior for the survey q was informative and was estimated usingthe Sub-Antarctic ling survey priors as a starting point because the survey series in both areas used thesame vessel and fishing gear. However, the WCSI survey area in the 200–650 m depth range in strata0004 A–C and 0012 A–C comprised 6619 km2; seabed area in that depth range in the entire LIN 7WC biological stock area (excluding the Challenger Plateau) is estimated to be about 20 100 km2. So,because biomass from only 33% of the WCSI ling habitat was included in the indices, the Sub-Antarctic prior on μ was modified accordingly (i.e., 0.13 × 0.33 = 0.043), and the bounds were alsoreduced from [0.02, 0.30] to [0.01, 0.20]. The prior for M was informed and based on expert opinion.Priors for all selectivity parameters were assumed to be uniform.
Penalty functions were used to constrain the model so that any combination of parameters that did notallow the historical catch to be taken was strongly penalised. A small penalty was applied to theestimates of year class strengths to encourage estimates that averaged to 1.
MCMC runs of the base case and one sensitivity (where M was fixed at 0.18) were conducted. Bothmodel runs were indicative of a B0 greater than about 50 000 t. The upper bound on B0 is highlyuncertain and dependent on the priors on the survey q and M. Both model runs also indicated abiomass decline from 2000-2012. The model fit to the CPUE series was poor. Model estimatessuggest a period of higher recruitment from 1978 to 1990 followed by lower recruitment since 1992.There was also some evidence for stronger recruitment in the most recent year for which an estimatecan be made but this is highly uncertain.
LIN 2/7CK (Cook Strait)A stock assessment of ling in Cook Strait (LIN 2/7CK) was completed in 2013. Because it is believedthat the true M for the Cook Strait stock is higher than the ‘default’ value of 0.18, it was considereddesirable to estimate M in the model, and so incorporate the effect of this uncertainty in M in theassessment. However, the simultaneous estimation of B0 and M was not successful owing to theadoption of a multinomial likelihood (rather than lognormal) for proportions-at-age. Consequently,
models with fixed M values were run, and although the age data were reasonably well fitted, themodel failed to accurately represent declines in resource abundance that appear evident from CPUEvalues, which have been declining since 2001. As a consequence the model was considered unsuitablefor the provision of management advice.
The last stock assessment for LIN 2/7CK (Cook Strait) accepted by the Working Group wascompleted in 2010, and it is reported here. The stock assessment model partitions the population intotwo sexes, and age groups 3 to 25 with a plus group. Year class strengths and fishing selectivityogives were also estimated in the model. Commercial trawl selectivity was fitted as double normalcurves; line fishery ogives were fitted as logistic curves.
For final runs, the full posterior distribution was sampled using Markov Chain Monte Carlo (MCMC)methods, based on the Metropolis-Hastings algorithm. Bounded estimates of spawning stock virgin(B0) and current (B2008) biomass were obtained. MCMC chains were constructed using a burn-inlength of 4x10⁶ iterations, with every 2000th sample taken from the next 20x106 iterations (i.e., a finalsample of length 1000 was taken from the Bayesian posterior).
For LIN 7CK, model input data include catch histories, trawl and line fishery CPUE, extensive catch-at-age data from the trawl fishery, sparse catch-at-age data from the line fishery, and estimates ofbiological parameters. Initial modelling investigations found that the line CPUE produced implausibleresults; this series was rejected as a useful index. The base case used all catch-at-age data from thefisheries, and the trawl CPUE series. Instantaneous natural mortality was estimated in the model
Lognormal errors, with known CVs, were assumed for all CPUE and proportions-at-age observations.The CVs available for those observations allow for sampling error only. However, additional variance(termed process error), assumed to arise from differences between model simplifications and realworld variation, was added to the sampling variance.
The assumed prior distributions used in the assessment were intended to be relatively uninformed, andwere specified with wide bounds.
Penalty functions were used to constrain the model so that any combination of parameters that did notallow the historical catch to be taken was strongly penalised. A small penalty was applied to theestimates of year class strengths to encourage estimates that averaged to 1.
A single model was presented incorporating a catch history, trawl and line fishery catch-at-age, trawlCPUE series, with double-normal ogives for the trawl fishery and logistic ogives for the line fishery,and M estimated in the model.
The assessment is driven by the trawl fishery catch-at-age data and tuned by the trawl CPUE. Bothinput series contain information indicative of an overall stock decline in the last two decades. Theconfidence bounds around biomass estimates are wide. Median M was estimated to be 0.24 (95%confidence interval 0.16–0.30). Estimates of biomass are very sensitive to small changes in M, butclearly there is information in the model encouraging an M higher than the ‘default’ value of 0.18.The model indicated a slight overall biomass decline to about 2000, followed by a much steeperdecline from 2000 to 2010. Exploitation rates (catch over vulnerable biomass) were very low up to thelate 1980s, and have been low to moderate (up to about 0.12 yr–1) since then. Since the early 1990s,trawl fishing pressure has generally declined, while line pressure has generally increased.
Estimates of biomass projections derived from this assessment had a relatively high level ofuncertainty in the model, which precluded any updated estimation of MCY and CAY.
Projections for LIN 6B from the 2006 assessment indicated that the LIN 6B stock (Bounty Plateau) islikely to decline out to 2011, but probably will still be higher than 50% of B0. Projections out to 2015for LIN 2/7CK indicate that biomass is likely to increase with future catches equal to recent catchlevels, or decline slightly if catches are equal to the mean since 1990. New projections made in 2011out to 2016 for LIN 3&4 and 5&6, assuming future annual catches equal to recent catch levels: forLIN 3&4, stock size is likely to remain about the same; for LIN 5&6, stock size is likely to increase
slightly; for LIN 7 WC the Working Group did not consider that projections using either run werereliable and so no projections were presented.
3.3.4 Management advice
OverviewThe stated objective is to have the stock fluctuating around the management target (40% unexploitedbiomass), with some acceptable, but undefined, variation. A formal time-constrained rebuilding planis to be implemented if the soft limit is reached, and the hard limit defines to level below which thefishery should be considered for closure. The rebuilding plan requires that the ling biomass be rebuiltto the target level with an acceptable probability. The rebuild should be achieved between the time itwould take for the stock to rebuild in the absence of fishing and twice that time (see the HarvestStrategy Standard (MFish 2008a)).
The stock assessment results are reported in MPI Fisheries Assessment Plenary documents (e.g. Hornand Francis, 2013; Horn et al., 2013), consistent with the harvest strategy, with the likelihood ofcurrent and projected stock status being below target and both soft and hard limit levels beingreported. Scientific advice is consistent with achieving the target biomass or the achieving acceptablerisks.
Table 5 : Results of projections for tested catches (base case models). The low value is the lowerbound of the 95% credible interval.
Stock Projectionto Year
ProjectedCatch
Projected StatusMedian Low
Chatham Rise (LIN3 & 4) 2016 3900 55 41
Sub-Antarctic (LIN 5 & 6, exclBounty Plateau)
2016 5900 103 84
Bounty Plateau (LIN 6B) 2011 600 53 26
West Coast South Is. (LIN 7WC) Not considered reliable
Cook Strait (LIN 2/7CK)2015
220 59 24
420 52 11
Chatham Rise (LIN 3 & 4)
Information Commentary
Reference Points Management Target: 40% B0
Soft Limit: 20% B0
Hard Limit: 10% B0
Status in relation to Target B2011 was estimated to be about 55% B0; Very Likely (> 90%)to be at or above the target
Status in relation to Limits B2011 is Exceptionally Unlikely (< 1%) to be below both theSoft and Hard Limits
Recent Trend in Biomass or Proxy Biomass is very unlikely to have been below 40% B0.Biomass is estimated to have been increasing since 2003.
Recent Trend in Fishing Mortality orProxy
Fishing pressure is estimated to have been declining since1999.
Trends in Other Relevant Indicatorsor Variables
Recruitment since the early 1990s is estimated to have beenfluctuating slightly around the long-term average for this
Stock Projections or Prognosis Biomass is uncertain but current catch is unlikely to causedecline. Catches at level of the TACC have unknownprognosis.
Probability of Current Catch orTACC causing decline below Limits
Soft Limit: Exceptionally Unlikely (< 1%)
Hard Limit: Exceptionally Unlikely (< 1%)
Sub-Antarctic stock (LIN 5 & 6)
Information Commentary
Reference Points Management Target: 40% B0
Soft Limit: 20% B0
Hard Limit: 10% B0
Status in relation to Target B2011 was estimated to be between 70% and 101% B0; VirtuallyCertain (> 99%) to be at or above the target
Status in relation to Limits B2011 is Exceptionally Unlikely (< 1%) to be below the Soft or HardLimits
Recent Trend in Biomass orProxy
Biomass appears to have been increasing since 2000.
Recent Trend in FishingMortality or Proxy
Fishing pressure is estimated to have always been low, anddeclining since 1998.
Trends in Other RelevantIndicators or Variables
Recruitment throughout the 1980s was low relative to the long-termaverage for this stock, but has been average or better since 1993.
Stock Projections or Prognosis Stock status is predicted to improve over the next 5 years at catchlevels equivalent to that from recent years (i.e., 5900 t per year) orequivalent to the TACC (i.e., 12 100 t).
Probability of Current Catch orTACC causing decline belowLimits
Soft Limit: Exceptionally Unlikely (< 1%)
Hard Limit: Exceptionally Unlikely (< 1%)
The following qualifying comments were noted: The summer trawl survey biomass estimates are variable and catchability clearly varies
between surveys. The general lack of contrast in this series (the main relative abundanceseries) makes it difficult to accurately estimate past and current biomass.
The assumption of a single Sub-Antarctic stock (including the Puysegur Bank), independentof ling in all other areas, is the most parsimonious interpretation of available information.However, this assumption may not be correct.
Although the catch history used in the assessment has been corrected for some misreportedcatch, it is possible that additional misreporting exists.
Although estimates of absolute current and reference biomass are unreliable, B0 was probablyover 200 000 t. The stock has probably only been lightly fished.
Status in relation to Target B2006 was estimated to be 61% B0; Very Likely (> 90%) to be ator above the target
Status in relation to Limits B2006 is Very Unlikely (< 10%) to be below the Soft Limit andExceptionally Unlikely (< 1%) to be below the Hard limit
Recent Trend in Biomass orProxy
Median estimates of biomass are unlikely to have been below61% B0. Biomass is estimated to have been declining since 1999.
Recent Trend in FishingMortality or Proxy
Fishing pressure is estimated to have been low, but erratic, since1980.
Trends in Other RelevantIndicators or Variables
Recruitment was above average in the early 1990s, but belowaverage in the late 1990s. No estimates of recruitment since 1999are available.
Stock Projections or Prognosis Stock status is predicted to continue declining slightly over thenext 5 years at a catch level equivalent to the average since 1991(i.e., 600 t per year).
Probability of Current Catch orTACC causing decline belowLimits
Note that there is no specific TACC for the Bounty Plateau stock.
Soft Limit: Very Unlikely (< 10%)
Hard Limit: Very Unlikely (< 10%)
Qualifying comments included: There are no fishery-independent indices of relative abundance, so the assessment is driven
largely by the line fishery CPUE series.
Stock projections are based on a constant future catch of 600 t per year. However, historiccatches from this fishery have fluctuated widely, so future catches could be markedlydifferent from 600 t per year.
There is no separate TACC for this stock; it is part of the LIN 6 Fish stock that has a TACCof 8505 t.
West coast South Island (LIN 7)Information Commentary
Reference Points Management Target: 40% B0
Soft Limit: 20% B0
Hard Limit: 10% B0
Overfishing threshold: F corresponding to 40% B0
Status in relation to Target B2012 was estimated to be 71% B0; Very Likely (> 90%) to beat or above the target
Status in relation to Limits B2012 is Exceptionally Unlikely (< 1%) to be below the Softor Hard limit
Recent Trend in Biomass or Proxy Biomass is estimated to have been declining.
Recent Trend in Fishing Mortality orProxy
Unknown
Trends in Other Relevant Indicators orVariables
The age structures of both the commercial catch and trawlsurvey catch are broad, indicating a low exploitation rate.
Stock Projections or Prognosis No projections were reported.
Probability of Current Catch or TACCcausing decline below Limits
Soft Limit: Unknown
Hard Limit: Unknown
Qualifying comments included:
This assessment is very uncertain but it is highly probable that B2012 is greater than 40% B0
and it could be much higher.
Cook Strait (LIN 2/7 CK)Information Commentary
Reference Points Management Target: 40% B0
Soft Limit: 20% B0
Hard Limit: 10% B0
Overfishing threshold: F corresponding to 40% B0
Status in relation to Target B2010 was estimated to be 54% B0; Likely (> 60%) to be at or abovethe target
Status in relation to Limits B2010 is Exceptionally Unlikely (< 1%) to be below the Soft or Hardlimit
Status in relation to overfishing Overfishing is Very Unlikely (< 10%) to be occurring.
Recent Trend in Biomass orProxy
Biomass is estimated to have been declining since 1999, but isunlikely to have dropped below 30% B0.
Recent Trend in FishingMortality or Proxy
Overall fishing pressure is estimated to have been relativelyconstant since the mid 1990s, but has trended down for trawl and upfor line.
Trends in Other RelevantIndicators or Variables
Recruitment from 1995 to 2006 was low relative to the long-termaverage for this stock. There are no estimates for the more recentyear classes.
Stock Projections or Prognosis Stock status is predicted to improve slightly over the next 5 years ata catch level equivalent to that since 2006 (i.e., 220 t per year), orremain relatively constant at a catch equivalent to the mean since1990 (i.e., 420 t per year).
Probability of Current Catch orTACC causing decline belowLimits
Note that there is no specific TACC for the Cook Strait stock.
Hard Limit: Catch 220 t, Exceptionally Unlikely (< 1%); Catch 420t, Very Unlikely (< 10%).
Probability of Current Catch orTACC causing Overfishing tocontinue or to commence
Very Unlikely (< 10%).
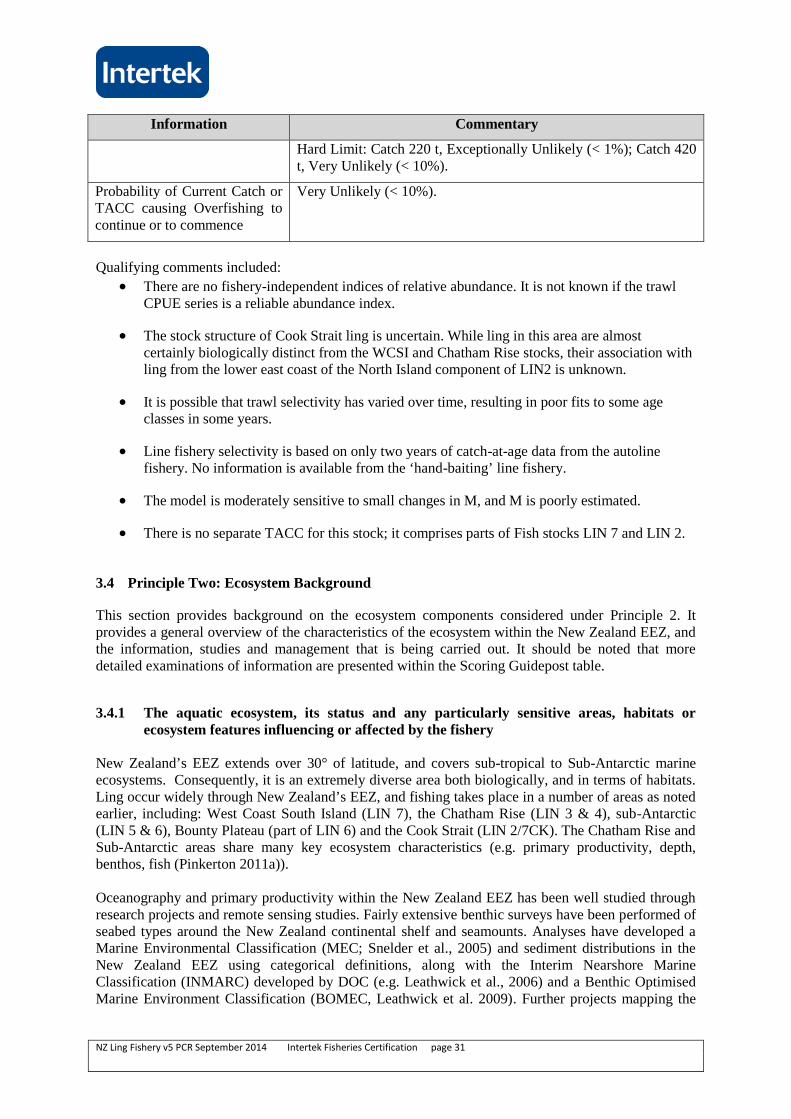
Qualifying comments included:
There are no fishery-independent indices of relative abundance. It is not known if the trawlCPUE series is a reliable abundance index.
The stock structure of Cook Strait ling is uncertain. While ling in this area are almostcertainly biologically distinct from the WCSI and Chatham Rise stocks, their association withling from the lower east coast of the North Island component of LIN2 is unknown.
It is possible that trawl selectivity has varied over time, resulting in poor fits to some ageclasses in some years.
Line fishery selectivity is based on only two years of catch-at-age data from the autolinefishery. No information is available from the ‘hand-baiting’ line fishery.
The model is moderately sensitive to small changes in M, and M is poorly estimated.
There is no separate TACC for this stock; it comprises parts of Fish stocks LIN 7 and LIN 2.
3.4 Principle Two: Ecosystem Background
This section provides background on the ecosystem components considered under Principle 2. Itprovides a general overview of the characteristics of the ecosystem within the New Zealand EEZ, andthe information, studies and management that is being carried out. It should be noted that moredetailed examinations of information are presented within the Scoring Guidepost table.
3.4.1 The aquatic ecosystem, its status and any particularly sensitive areas, habitats orecosystem features influencing or affected by the fishery
New Zealand’s EEZ extends over 30° of latitude, and covers sub-tropical to Sub-Antarctic marineecosystems. Consequently, it is an extremely diverse area both biologically, and in terms of habitats.Ling occur widely through New Zealand’s EEZ, and fishing takes place in a number of areas as notedearlier, including: West Coast South Island (LIN 7), the Chatham Rise (LIN 3 & 4), sub-Antarctic(LIN 5 & 6), Bounty Plateau (part of LIN 6) and the Cook Strait (LIN 2/7CK). The Chatham Rise andSub-Antarctic areas share many key ecosystem characteristics (e.g. primary productivity, depth,benthos, fish (Pinkerton 2011a)).
Oceanography and primary productivity within the New Zealand EEZ has been well studied throughresearch projects and remote sensing studies. Fairly extensive benthic surveys have been performed ofseabed types around the New Zealand continental shelf and seamounts. Analyses have developed aMarine Environmental Classification (MEC; Snelder et al., 2005) and sediment distributions in theNew Zealand EEZ using categorical definitions, along with the Interim Nearshore MarineClassification (INMARC) developed by DOC (e.g. Leathwick et al., 2006) and a Benthic OptimisedMarine Environment Classification (BOMEC, Leathwick et al. 2009). Further projects mapping the
biodiversity of sea beds and the spatial and temporal extent of fishing are underway through NIWA.These include the ongoing ‘Chatham/Challenger’ project, which aims to map and compare habitatsand diversity of sea-bed communities in fishable depths at key locations across the Chatham Rise andthe Challenger Plateau (Probert and Grove, 1998; McKnight and Probert, 1997). The project isemploying both acoustic mapping approaches and underwater camera work to map biodiversity andhabitat types. In turn, the Ocean Survey 20/20 (OS 20/20) project aims to map the seafloor habitatsand biodiversity of New Zealand’s marine environment across large areas of the EEZ, butconcentrating on the Chatham Rise and Challenger Plateau. Ongoing studies are expandingknowledge of the distribution of cold-water corals. The location of key vulnerable habitat types(smokers, hydrothermal vents etc.) is known.
Data from surveys, logbooks and the Ministry for Primary Industries’ observer programme areavailable to allow the location of impacts by the fishery on habitat types to be identified. In turn, thefootprint of the fishery is well established through VMS records and the TCEPR data. Bottomtrawling that targets the hoki/hake/ling fishery complex is carried out most extensively in the areas ofthe Chatham Rise and the sub-Antarctic, with effort also concentrated on the west coast of the SouthIsland, commonly in depths of around 200-800m.
The main impacts from demersal trawls on the benthic habitat concentrate on the removals of mobileand sessile species, and the disturbance and modification of the structure of the seafloor. Studieselsewhere in the world (e.g. Thrush and Dayton 2002; Clark and Rowden 2009) have demonstratedthat repeated trawl disturbance can alter the benthic community by damaging or removingmacrofauna, with the potential encouragement of anaerobic bacterial growth. A loss of sedimentdiversity can also occur, while processes such as nutrient transfer, oxygenation and productivity canalso be impaired. The cumulative impact of trawling on the seabed will also depend upon the degreeof previous trawling; there being a reduced impact per trawl over time.
The rate of recovery depends on the nature of the benthic habitat, with more mobile sediments such asmud and sand in high energy environments recovering faster than, for example, rocky sediments withslow growing organisms in low energy environments. This is the subject of continued studies withinthe New Zealand EEZ (e.g. projects BEN2007/01, BEN2007/04). In the Chatham Rise and sub-Antarctic regions, the majority of trawling is within higher-energy sediments such as sandy silt andclay, although some lower-energy areas exist in these regions. Impacts on underwater topographicalfeatures (UTFs) have been identified (Clark and Rowden, 2009).
Effectively, through Seamount closures or as a result of being within BPAs 80% of the seamountswithin the New Zealand EEZ are closed to demersal trawling. These closures confer effective habitatprotection. Closures occur largely outside the areas fished intensively for ling (Ministry of Fisheries2010a). Finally, Benthic Protection Areas, which close over 30% of the New Zealand EEZ todemersal trawling, were established in 2007 for the purpose of benthic biodiversity protection (Helsonet al. 2010, but see Leathwick et al. 2008).
Management of the ling fishery has not yet included an extensive assessment of ‘significant’ habitats.However, relevant information in this regard includes areas of particular importance for fisherysustainability (e.g. for spawning, or occupied by juvenile ling), spatial overlays of trawl tracks withmarine environment and/or biological classifications. Currently, the best single tool currentlyavailable to characterising the likely impacts of bottom trawling on benthic organisms within differenthabitat categories is the Benthic-Optimised Marine Environment Classification (BOMEC) for NewZealand waters (Leathwick et al. 2009; Leathwick et al. 2010). However, BOMEC is not in and ofitself a spatial map delineating different benthic habitats. It has not been ‘ground-truthed’ against thespatial disposition of extant benthic habitats in the real world and hence should be viewed with somecaution. Using the fifteen classes categorised therein, Black and Wood (2011) overlaid demersal trawltracks comprising hoki fishing effort for each fishing year from 1989/90 – 2009/10. Resultingexposure to demersal trawling is summarised in Black et al. (2013). This analysis highlights the areal
extent and intensity of demersal trawling for ling. Of the six ling fisheries analysed (LIN2-LIN7), fivehad an area closed and/or not trawled of over 98.8% for 1989/90 to 2011/12. LIN5 Over the last fivefishing years all six fisheries have an area closed and/or not trawled of over 99%, the lowest againbeing LIN5 at 99.5%. The most extensively trawled BOMEC class is 9, where from 1989/90 -2009/10, 4.6% was trawled. Black and Wood (2011) overlaid demersal trawl tracks within eachFisheries Management Area to highlight the areal extent and intensity of demersal trawling for ling(e.g., trawling covers parts of the same habitat classes inter-annually). Results from Black (2013)indicate that within the 400-800m depth area, where most of the ling fishing takes place, 1.7% of thearea was contacted between 1989-90 and 2009-10 (between 0-400m 1.34% was contacted over thesame period). Of the entire fishable region within the EEZ for ling (1,408,210 km2), 0.97% has beencontacted once or more, between 1989-90 and 2009-10.
The impact of trawling for conservation and species diversity/persistence can be limited if trawlingaffects small proportions of a habitat type within an area. Trawling of small proportions of eachhabitat type may therefore be acceptable, and impact on benthic ecosystems reduced in this situationas the biodiversity is maintained in neighbouring areas. This is discussed further under Section3.4.3.1.
The New Zealand Government closed 17 BPAs (Benthic Protection Areas) within the New ZealandEEZ (Exclusive Economic Zone) to bottom trawl fishing methods in perpetuity as of late 2007 (seeFigure 4 for distribution). These areas comprise over 1.2 million km2 of seabed. Protection is alsoprovided under the accord to 52% of all UTFs within the New Zealand EEZ and 88% of identifiedhydrothermal vents. Demersal trawling and dredging is prohibited in these areas (pelagic fishing anddemersal longlining being allowed). Regulations promulgated pursuant to the Fisheries Act (1996)implemented the closure of seamounts in 2001, representing 100,997 km2
The ecosystem structure around New Zealand has been examined through the collection and analysisof stomach contents in key fish species (juveniles and adults) on the Chatham Rise and sub-Antarcticregions of the New Zealand EEZ (e.g. Livingston and Stevens, 2004). This includes the dietary habitsof ling. Ling appear to be mainly bottom dwellers, feeding on crustaceans such as Munida squatlobsters and scampi and also on fish, with commercial fishing discards being a significant dietarycomponent (Dunn et al. 2010). However, they may at times be caught well above the bottom, forexample when feeding on hoki during the hoki spawning season.
The structure of the mid-water food web is broadly understood for the Chatham Rise and Sub-Antarctic areas through numerous studies, which underpin existing and developing ecosystem models(Bradford-Grieve et al., 2003; ENV 2006/04, ZBD 2004/02; Pinkerton, 2011a). No model has yetbeen developed for the west coast South Island. Given the different ecosystems covered by existingmodels and studies, information is adequate to understand the functions of the key elements of theecosystem. Information from the observer programme, and the logbooks (for the main 5 species in thecatch) as well as continued sampling of stomachs, allow the main consequences for the ecosystem tobe inferred.
The developed Ecopath models would allow the impacts of the fishery on components to beexamined, ling being a component of fish groups within the model, although this analysis has not yetbeen performed.
The Chatham Rise fishery is best understood, and an ecosystem model has been developed for thisfishery (Pinkerton 2011a). Changes include declines in the mean trophic level of commercial andtrawl survey catches and changes in species abundance (Tuck et al. 2009, Pinkerton 2011b) althoughthis may be a consequence of the data analysed in these analyses coming from a period when thebiomass of hoki was declining. The ecosystem supporting the ling fishery in the Sub-Antarctic area isless well studied than that on the Chatham Rise. Ongoing change is reported from the Sub-Antarctic
ecosystem, including declining mean trophic level (Tuck et al. 2009). A key driver of this observedchange is expected to have been the decline in hoki (rather than ling) biomass. At an EEZ level, theimpacts of fisheries’ removals on ecosystem productivity have also been examined. The effects offisheries were assessed, preliminarily, to be sustainable in an energetic context (Knight et al. 2011).However, with the recovery of hoki stocks and key species being removed at levels close to or aboveBMSY, there would be a sizeable proportion of biomass remaining in the ecosystem, and removals atthis level are unlikely to lead to serious harm.
In summary, the two most significant ecosystem-level considerations in the ling fishery are the effectsof removal of hoki biomass from the system through the ling-related fishery, and the impacts ofdemersal trawling activity on the benthos and benthic habitats. Retained, bycatch, and ETP species areconsidered further below.
Other fisheries overlap with the ling fishery spatially, such as trawl fisheries targeting hoki and hake(Ministry of Fisheries 2011a). Consequently, while considered separately for the purposes of thisassessment, trawl activity in all these fisheries will naturally have additive effects on the marineecosystems that support them.
3.4.2 The retained, bycatch and endangered, threatened or protected (ETP) species includingtheir status and relevant management history
Data on catch rates and the relative abundance of non-target species in the fishery are available fromthree main sources:
The TCEPR (Trawl catch, effort and processing return) forms, which provide green-weightcatch totals for the top five species (dependent on vessel size and fishing method) on afishing-event basis, and daily summary of TACC species caught.
The Ministry for Primary Industries observer data, which provides catch weight for all QMSand non-QMS species caught, on an observed tow-by-tow basis. This provides accurate andverifiable information, if on variable and patchy coverage). The observers monitored around20% of trawls in 2007/08 in the HAK/HOK/LIN trawl fishery (see Table 6).
Fishery independent trawl surveys on the Chatham Rise and Sub-Antarctic regions (and lessfrequent surveys on the west coast South Island), provide abundance estimates of finfish,cartilaginous fish, and squid species, as well as catch weights of macroinvertebrates. Furtherinshore surveys also provide some information on TACC stocks.
Observer coverage has varied considerably over time and between UoC (Table 6). Note that for theinshore longline fishery, data are only available for the combined ‘Inshore ling, bluenose hapuka andbass’ fishery, and hence the exact coverage within the specific inshore ling longline component hasnot been published.
Table 6: Percentage of observer coverage by fishing year and Unit of Certification (from Ramm,2010, 2012a, b and Rowe, 2010). Dashes indicate no information (may equate to no fishing activity).
UoC % tows/lines observed Average, weighted bythe fishing effort each
year2007/08 2008/09 2009/10 2010/11 2011/121
Trawl LIN3 12.5 16.1 16.7 19.1 X 16.0Trawl LIN4 10.5 9.1 7.9 16.8 X 11.1Trawl LIN5 29.0 21.8 29.5 25.0 X 26.4Trawl LIN6 44.6 44.4 63.9 33.1 X 46.1
1 Crosses indicate that bycatch data from observers from these UoC provided to IFC by the client, butcoverage was not yet available in an MPI/DOC publication (available to the Working Group).
In a scientific sense, an acceptable level of observer coverage will depend upon the objective of theprogramme. Data in the current study have been used by different authors to estimate the level ofcatch in non-target species and interactions with ETP species (PI 2.1, 2.2, 2.3), rather than a goal ofcompliance (where nearer 100% coverage might be required). While there is no set goal for observercoverage by fishing unit in New Zealand fisheries, and such a benchmark would need to be calculatedfor individual circumstances (being influenced by the likely probability of encounters, frequency offishing events, etc.) target levels of up to 30% have been desired to analyse interactions with - forexample - sea lions in the squid fishery2. In turn, practical and operational issues will limit access tolongline vessel trips, particularly in the inshore fishery.
While statistical approaches can be developed to 'cope' with intermittent coverage and 'fill in' wheredata are lacking, the level of uncertainty will increase the lower the coverage, and the shorter andmore intermittent the time series. Examination of the weighted averages calculated above show that,while the trawl fishery has consistent and reasonably high observer coverage over the last four years(>10%), only the offshore longline fishery in LIN4, and 6 (noting that LIN5 is based upon 100%coverage in one year) surpass a generic benchmark of 10%, while the inshore fishery in LIN3 showslower but more consistent coverage. Indeed, based on these figures there has been 5% or lesscoverage in all other units of certification.
Under Principle 2, the longline fishery in each area is comprised of two different elements - theinshore longline fishery (smaller vessels) and the offshore longline fishery (larger vessels). We havetherefore scored the longline fishery by area consistent with MSC Certification Requirements 27.10.7,and for each scoring element assigned the lowest score obtained by the inshore and offshore fishery.
3.4.2.1 Retained and bycatch species
The ling fishery is a component of New Zealand’s Deepwater and Middle-depth fisheries which targeta range of species (Ministry of Fisheries, 2010a). Data from the observer programme were used toassess the main retained and discarded non-target species within the catches by management area.These data were available for a five-year period from 2007/08 to 2011/12, and therefore represent theaverage catch levels over a significant time period. Temporal trends in the data could not be identifiedas a result, but the data period does reduce the impact of year-to-year fluctuations on results. Ballaraet al. (2010) also provides an overview of catches and discards in the hoki/hake/ling fishery.
2 e.g. http://www.fish.govt.nz/en-nz/Publications/Statements+of+Intent/SOI-2004-2008/Research+Services/Aquatic+Environment/Research+Observer+Days+-+SQU6T+and+SQU1T.htm).
The top ten species (retained and bycatch) within ling-targeted trawl fisheries by management area,based upon observer data from a five-year period from 2007/08 to 2011/12. Proportion of QMSspecies in catch by weight noted. Full tables are available at http://www.deepwater.co.nz/our-species/ling/msc-assessment-of-new-zealand-ling-fisheries/
Table 7 : Top ten (by weight) retained and bycatch species from the ling-targeted trawl fishery.Source: MPI Observer data. Non-QMS species noted with a * (which do not have to beretained). % includes Ling catches.
LIN 3 LIN 4 LIN 5 LIN 6 LIN 7Hoki Silver warehou Hoki Hoki HokiRattails* Hoki White warehou Southern blue
whitingSilver warehou
Javelinfish* Ghost shark Hake Hake Giant stargazerSilver warehou Common
Table 8 : Top ten retained and bycatch species from the ling-targeted longline fishery. Source:MPI Observer data. Non-QMS species noted with a *.
LIN 3 LIN 4 LIN 5 LIN 6 LIN 7Spiny dogfish Spiny dogfish Red cod Spiny dogfish HakeRibaldo Ribaldo Spiny dogfish Black cod* Spiny dogfishSmooth skate Sea perch School shark Rough skate RibaldoHake School shark Ribaldo Pale ghost shark Smooth skateSea perch Hairy conger* Smooth skate Ribaldo Northern spiny
Red cod Sharks & Dogfish1 * Rattails* School shark
Seal shark* Conger eel* Hapuku* Chimaera,purple*
Leafscale gulpershark*
92.5% 98.4% 98.7% 98.6% 98.6%
1Sharks and dogfish not otherwise specified in Sch3, Part2 Reporting Regs 2001
It is noted that ling- (and hake-) targeted fishing is undertaken as a part of the main hoki fishery. Thekey bycatch species within these fisheries are generally comparable to those caught within the relatedhoki fishery (which are hake (Merluccius australis), ling (Genypterus blacodes), silver warehou
(Seriolella punctata), and frostfish (Lepidopus caudatus) and the non-commercial spiny dogfish(Squalus acanthias), javelinfish (Lepidorhynchus denticulatus) and rattails (Macrouridae)). Whilesome specific differences are found, and the assessment performed here is based upon retained specieslevels within the ling-targeted fishery (trawl and longline, separately), examination of the retainedspecies levels within the hoki/hake/ling fishery relative to sustainable levels is recommended.
Retained species are, by regulation, the Quota Management System (QMS) species, which areenumerated and retained on board (unless '6th schedule' species like spiny dogfish, which areenumerated before return to the sea as per Schedule 6 of the Fisheries Act 1996: Stocks which may bereturned to the sea or other waters in accordance with stated requirements). The main QMS speciesare the subject of analytical stock assessments and active management that is based upon formalisedbiologically based limits. For the remaining QMS species, the TACC system, which aims to limit theoverall catch of species, combined with the ‘deemed value’ process, represents the managementstrategy for these species.
Information is sufficient to quantitatively estimate outcome status with a high degree of certainty forthe majority of main QMS species caught, by target fishery and management area. However,information for some main QMS species and other QMS species is more limited and quantitativeestimates of outcome status are not routinely developed, although qualitative assessments have beenperformed for particular species; trends in the abundance of key retained species that are adequatelysampled by trawl surveys on the Chatham Rise and Sub-Antarctic have been reported following eachsurvey. In theory action would be initiated if negative trends in particular species were identified. Thepotentially low statistical power of the survey data for some species is noted.
The New Zealand system identifies species by 'tier', Tier 1 being target species, Tier 2 being key non-target (bycatch) WMS species and tier 3 being non-QMS species.
For non-QMS species (Tier 3 species), stock assessments are not performed, and assessments of thepotential impact of the fishery on population levels are highly uncommon. These species are notmanaged under the TACC process, although the increasing number of species within the QMS systemdemonstrates that substantial catches of non-QMS species tends to lead to the establishment of theirQMS status, and hence become subject to more formalised monitoring and must be retained on boardvessels. Species can be added to the QMS under Section 17B of the Fisheries Act and/or the speciesmanaged under Section 11 of the Act (see also the QMS Introduction Process Standard; MPI (2008)).Section 17B of the Act requires that stocks or species be added to the QMS if the existingmanagement is not ensuring sustainability or is not providing for utilization. Under the Act, ‘ensuringsustainability’ means ‘maintaining the potential of fisheries resources to meet the reasonablyforeseeable needs of future generations and avoiding, remedying, or mitigating any adverse effects offishing on the aquatic environment’ while ‘utilisation’ means ‘conserving, using, enhancing anddeveloping a fisheries resource to enable people to provide for their social, economic, and culturalwellbeing’.
Two recent species introductions into the QMS were Patagonian toothfish (Ministry of Fisheries,2010c) and attached bladder kelp (Ministry of Fisheries, 2010d). The latter was added to the QMSinter alia because the Ministry of Fisheries concluded that there was increasing demand for thespecies. While the QMS Introduction Process Standard provides a framework further formalisation ofthe procedure for moving non-QMS species within the QMS framework, and to monitoring ‘minor’QMS species status and trends, given the information collected, would further improve thecomprehensiveness of the by-catch management framework within the QMS. As noted, this has beenperformed for specific species, and could be prioritised based upon identification of key low-productivity species through a formalised Productivity-Sensitivity Analysis (as indicated within theframework).
Given that formal assessments of non-QMS species are not performed, for the purposes of the currentassessment a number of assumptions have had to be made. We have assumed that where assessmentsor qualitative evaluations are lacking, a species may be at risk where they represent >5% of the totalcatch, or are caught at levels greater than 10 tonnes per year where this species is considered of lowproductivity (identified through a Productivity-Sensitivity Analysis (PSA)). We recognise that aspecies may have low abundance and high catchability, which may lead to incorrect estimation ofstatus using these criteria. This approach is comparable to that taken under P1, in separating thedetermination of outcome from the management approach and information necessary to underpin thatmanagement.
In this section, the available information on the status of retained species which constitute over 5% ofthe observed catch during 2007-08 to 2011-12 is summarised. Of those species representing the 'main'retained species (>5% of the catch); for trawl fisheries:
Hoki is assessed as two stocks (HOK1 and HOK10) but only the former overlaps with theareas of ling examined here. HOK1 is estimated to be above both the soft limit and target withhigh probability (>90%).
Silver warehou represented up to 5% of the catch weight of ling-targeted tows in LIN 3(equivalent to SWA 3) and 22% in LIN4 (a sub-set of the SWA4 area). Biomass indices fromR.V. Tangaroa fishery-independent trawl surveys in QMAs 3 (part), 4 and 5 since 1991 arevariable between years and have high CVs. They were therefore unsuitable for stockassessment. The Plenary report noted that "In most years from 2000-01 to 2008-09 catches inSWA 3 and SWA 4 were well above the TACCs as fishers landed catches well in excess ofACE holdings. The sustainability of current TACCs and recent catch levels for these fishstocks is not known, and it is not known if they will allow the stocks to move towards a sizethat will support the maximum sustainable yield." 2% (~20t) of the observed catch within thisarea was from ling-targeted tows.
Ghost shark (Hydrolagus novaezealandiae) represents around 9% of the catch weight of ling-targeted tows in LIN 4 (equivalent to GSH 4). Examination of survey biomass trends in thisregion did not indicate any consistent trend since 1999, suggesting no declines in biomass.While catches have generally been below the TACC for this species, it was above that level in2008-09 and 20011-12. While the plenary report notes that the data do not allow definitivejudgement on whether recent catches have been sustainable in the long term, the biomasstrends suggest there are no current concerns for the stock. This will continue to be monitoredthrough the surveys.
White warehou represented up to 9% of the catch weight of ling-targeted tows in LIN 5(equivalent to part of WWA 5B). Catches of white warehou in this area are below the TACC.Comparison of survey time series in the Southland and Sub Antarctic region (Bagley et al.,2013) indicating significant uncertainty in estimates. Examining data from surveys in 2009and 2011, white warehou biomass dropped from 2093 t in 2009 to 393 t in 2011, but highc.v.s associated with higher estimates indicate that these are typically the result of one-offlarge catches. However, examining the survey information showed little trend in biomassestimates in the core depth strata in R.V. Tangaroa surveys in the Sub-Antarctic region,although the uncertainty in annual estimates was notable.
Southern blue whiting represented up to 8% of the catch weight of ling-targeted tows in LIN6 (equivalent to SBW6A/B/I/R). All stocks are estimated to be unlikely (<40%) orexceptionally unlikely to be below the soft limit (<1%) and stocks are assessed to be as likelyas not (40-60%) or likely to be above the target reference point, or believed to be only lightlyexploited between 1993-2002. However, status in 6A is unknown.
Spiny dogfish (Squalus acanthias) represented 19% of the catch weight of ling-targeted setsin LIN 3, 23% in LIN 4, 8% in LIN 6 (equivalent to SPD3, SPD4 and SPD5, respectively).Catches in each region have been below the corresponding TACC. Based on a combination ofCVs, variability in biomass indices and the time span of each series, it is concluded thatsurveys only provide reliable indices of dogfish abundance off the west coast of the SouthIsland (SPD7, not under consideration here) and on the Chatham Rise (SPD 4). Relativebiomass indices suggest that spiny dogfish became more abundant on the Chatham Riseduring the early to mid 1990s. Although the relevant surveys were discontinued, spinydogfish appear also to have increased substantially in abundance off the east coast of theSouth Island (SPD 3) and on the Stewart-Snares shelf (SPD5) in the mid 1990s. Indeed, spinydogfish biomass in the core strata (30–400 m) for the east coast South Island trawl surveyincreased markedly in 1996 and although it fluctuated since then it has remained high with2012 biomass 11% above the post-1994 average of 31 978 t. Catches within SPD 1 are low,and, in comparison to catches within other areas of the New Zealand EEZ which have not ledto declines in available abundance indices, are highly likely to be within biologically basedlimits.
Ribaldo represented 12% of the catch weight of ling-targeted sets in LIN 3 (equivalent to RIB3). Catches in this area have been below the TACC level (176 tonnes) throughout, bar oneyear. Assessments based upon the relative biomass index of ribaldo from summer middledepth trawl surveys of the Chatham Rise indicated they were relatively flat over time.Precision was generally good in this time series (< 20%). Although numbers of individualribaldo caught were low the Working Group considered this index to be suitable to monitormajor trends in this stock. The working group summarised that stock size was likely (> 60%)to remain near current levels under current catches and unlikely (<40%) to fall below soft orhard limits at those catch levels.
Rough skate represented 6% of the catch weight of ling-targeted sets in LIN 6 (equivalent topart of RSK3). Catches in this region have been below the TACC level (1653 tonnes)throughout, bar one year. The plenary report noted that it was “unknown if recent catch levelsor the TACC will cause their populations to decline.” However, biomass estimates availablefrom the east coast South Island showed a generally increasing trend in biomass across theavailable time period. Biomass in the core strata (30–400 m) for the east coast South Islandtrawl survey in recent years is about double that of the 1990s. Coefficients of variation arevariable ranging from 19 to 30% (mean 22%), but overall are low to medium.
Pale ghost shark represented 5% of the catch weight of ling-targeted sets in LIN6 (equivalentto part of GSP5). Catches in this region have been well below the adjusted TACC level.Biomass estimates from the R.V. Tangaroa trawl survey time series show no clear trend, withnotable inter-annual fluctuations, and a general increase in biomass since 2005. This suggeststhat current bycatches are highly likely to be within biologically-based limits.
Hake represented 11% of the catch weight of ling-targeted sets in LIN 7 (equivalent to HAK7). Catches in recent years (2005-06 to 2011-12) have been well below the TACC (7700tonnes) which was adjusted upward at that time, but prior to that period were frequentlyabove the TACC (6855 tonnnes). The stock assessment available for this region indicated thatthe stock was very unlikely (<10%) to be below the soft limit, and exceptionally unlikely(<1%) to be below the hard limit. B2012 was estimated to be 58% B0; Very Likely (> 90%) tobe at or above the target.
Non-retained (non-QMS) species that constituted more than 5% of the trawl catch during 2007-08 to2011-12 represented rattails (family Macrouridae) and javelinfish (Lepidorhynchus denticulatus) in
LIN 3 and common roughy in LIN 4. Analysis of bycatch within the trawl fishery (Ballara et al.,2010) showed a declining trend in the bycatch of rattails, and no clear trend in the bycatch ofjavelinfish. Examination of rattail biomass from Chatham Rise survey time series has shown anincreasing trend, suggesting that in this region the fishery is having no negative effect (Stevens et al.,2010). For common roughy, available survey biomass estimates for common roughy suggest catchlevels < 1% of the biomass.
Non-retained (non-QMS) species that constituted more than 5% of the longline catch during 2007-08to 2011-12 represented black cod (Paranotothenia magellanica) in LIN 6 (Sub-Antarctic) at 6%.
No assessments exist for these species. However, data on trends in biomass of rattails and javelinfishare available from surveys on the Chatham Rise. Both species are very well monitored by thesesurveys. Javelinfish appear to be increasing, while the most abundant rattail species, Bollons’ rattailexhibits no trend, at least on the Chatham Rise (O’Driscoll et al. 2011).
For black cod, a non-QMS species, survey information has not been reported for the Sub-Antarctic.Catches averaged just over 20 tonnes per annum over the period, and in the past two years have beenwell below one tonne; the average was increased by high catches in 2007/08 and 2008/09. The growthof this species (K=0.26y-1), fecundity, trophic level (3.4) and medium resilience (see Fishbase.org)suggest that recent catches appear unlikely to lead to fishing impacts based on the biology of thespecies.
In relation to Tier 2 species (key bycatch species), it will not always be easy to implement specificharvest strategies. Management Action 28 in the Annual Operational Plan for the deepwater fisheries(MPI, 2012) aims to develop management procedures for silver warehou and white warehou. Thesespecies were selected taking account of their size and extent. Fisheries characterizations, e.g. for silverwarehou (Parker and Fu 2011), could provide additional information for lesser species. They involveanalysing all available data including: (a) survey data, (b) catch-effort information, and (c) observerdata. Catch-effort data can be used to inform spatial distribution as well as how and when a species iscaught. Observer data provide better biological data such as length and perhaps age-compositions. Inprinciple, changes in the age-compositions among years can be used to estimate changes in fishingmortality over time.
As noted above, Tier 3 species (non-QMS species, usually discarded) can be added to the QMSsystem under Section 17B of the Fisheries Act and/or the species managed under Section 11 of theAct (see also the QMS Introduction Process Standard) if a sustainability problem is detected.
It is difficult to detect whether there is a sustainability concern for many Tier 2 (QMS) and Tier 3(non-QMS) species (e.g. MPI 2013a, b, c) but as noted in the National Deepwater plan (Ministry ofFisheries, 2011) management of species based on CPUE and size-based trends are underway. Anumber of projects related to improving the information base for Tier 2 and Tier 3 species are eitherplanned or underway, including a project (DEE2011-03) to conduct Level 1 risk assessments for Tier3 species which could lead to additional research being conducted (see Management Action #16 of theAnnual Operational Plan for Deepwater Fisheries 2012/13; MPI, 2012b). Furthermore, the use ofCPUE time series and size classes are becoming more frequent for Tier 2 species (MPI, 2013a, b, c).
3.4.2.2 ETP species
The Wildlife Act 1953 gives absolute protection to wildlife throughout New Zealand and itssurrounding marine Exclusive Economic Zone. All marine mammals (including all seal, dolphin andwhale species) are fully protected throughout New Zealand and its EEZ under the Marine MammalsProtection Act 1978. The result of this is that almost all native birds and all marine mammals andmarine reptiles (including visiting turtles and sea snakes) are fully protected in New Zealand (underone of two Acts), and out as far as the edge of the EEZ. The exceptions are a small number of nativebirds managed as game birds, and a few other native birds that are partially protected. Just one native
bird, the black-backed gull, is currently unprotected. In addition, Schedule 7A of the Wildlife Act listscertain marine species that are legally protected, i.e., all species in the orders Antipatharia (blackcorals), Gorgonacea (gorgonian corals), and Scleractinia (stony corals) and the family Stylasteridae(hydrocorals). Fish protected under the Wildlife Act include the oceanic whitetip, basking, deepwaternurse, white pointer, and whale sharks, manta and spinetail devilrays, and two groupers. CITES listedspecies include: the New Zealand fur seal; elephant seal; a number of cetaceans; basking, Great white,scalloped, hammerhead and porbeagle sharks; as well as black coral (Antipatharia spp)(http://www.doc.govt.nz/about-doc/role/international/endangered-species/cites-species/nz-cites-listed-species/).
The national requirements for ETP protection in New Zealand law notes that while interactions arenot forbidden (i.e. zero), the law requires interactions to be reported on MPI’s Non-fish and ProtectedSpecies Catch Return form3. The long-term aim is to minimise mortalities where possible, with thezero interactions being described as the aspirational objective. The approach requiring reporting ofinteractions, combined with observer coverage. provides good information on the potential effects ofthe fishery on ETP species. No specific limits on interactions have been set; activities aimed atminimising interactions are underway (see mitigation approaches described below).
It is recognised that the fishery is a sub-set of the hoki/hake/ling-targeted fishery. Catch rates of thesedifferent components of the effort have been examined. Given that the area-based breakdown betweenspecies-specific fisheries management areas is different (not all areas correspond), it is difficult toassess area-specific overall ETP interactions within the hoki/hake/ling complex. The target-fishery-specific area data are used here, although it is recommended that analysis across the fishery complexis performed in future.
Information is available on ETP species interactions through the on-going observer programme onboard vessels. This information is analysed based upon the identified ‘target’ fishery. As noted earlier,an issue for the longline fisheries and their interactions with ETP species is the level of observercoverage by area that allows these model estimates to be developed. Weighted average observercoverage, calculated earlier, indicated that while the trawl fishery has consistent and reasonably highobserver coverage over the last four years (>10%), only the offshore longline fishery in LIN4, 5 and 6and the inshore longline fishery in LIN6 surpassed a generic benchmark of 10%. Indeed, based onthese figures there has been 5% or less coverage in all other units of certification.
For the ling fishery, interactions focus on seabirds, marine mammals, and cold water corals.
Seabirds
Bird interactions in the ling fishery have been analysed in a number of studies (e.g. Abraham andThompson, 2011), which provide detailed breakdowns of interactions and model the likely impact ofthe total fishing fleet based upon data from observed vessels. Note that the estimates of capturesdetailed below and in provided references include recorded captures in the net, on the warps, ortangled in line, and hence includes observed warp strikes, and captures are also estimated by fishingmethod, being categorised by whether they were warp captures, net captures, or reported caughtthrough some other means (see https://data.dragonfly.co.nz/psc/v20121101/birds/ling/all-vessels/eez/all/ for a breakdown by year and interaction type for the ling fishery). They excludeanimals that landed on the deck or collided with the vessel’s superstructure (Abraham and Thompson,2011).
Population estimation studies are also underway for both birds and marine mammals, which allow anevaluation of the likely impact of interactions on ETP species populations to be evaluated. In turn,ecological risk assessment studies for birds have been completed (Richard et al., 2009; Richard and
Abraham 20134), which allow evaluations to focus on potentially more at risk species. These datahave been used within the current study to evaluate the potential impact of the fishery on ETP birdand marine mammal populations. In turn, National Plans of Action have been developed for birds andsharks (MPI, 2013d).
Across the deepwater trawl fleet managed by the DWG, vessels >28 m now have Vessel ManagementPlans in place, which document their fish waste management procedures. The implementation of theseplans is audited by onboard observers and DWG staff when vessels are in port. By law, trawlers over28 m in length fishing in New Zealand waters are required to use one of three specified devices toreduce seabird interactions with trawl warps: paired streamer lines, a bird baffler, or a warp scarer(New Zealand Gazette 2010). The efficacy of these devices has been examined in New Zealand(Middleton and Abraham 2007) and internationally (e.g., Bull 2009; Løkkeborg 2011). Streamer linesare the most effective in reducing seabird strikes on trawl warps. There are a number of trawl vesselsoperating in LIN3, 5 and 7 of sizes smaller than 28 m as noted (see Table 1). Vessel size is includedwithin the models used to estimate seabird interactions (Abraham and Thompson, 2011) and hencewill be incorporated within the analysis of overall interaction rates discussed below. However, giventhe lack of requirements for bird (and other ETP) interaction mitigation approaches for these vessels,a recommendation for the collection and analysis of specific information on ETP interactions for thisvessel size class has been generated to confirm interaction rates and develop appropriate mitigationapproaches if and as required.
General mitigation approaches being employed by trawlers, supported through legislation, includevoluntary industry-led codes of practice, detailed in Vessel Management Plans.
Vessel Management Plans are developed on a vessel-specific basis. These include methodologies tolimit offal discharge during periods of vulnerability for birds, and are audited by MPI observers. Thisapproach allows mitigation methods to be adapted to a particular vessel’s operations, but may noteliminate interactions. Cleaning of the net before shooting is also required. Studies on trawl netinteraction mitigation processes have been undertaken (Clement and Associates 2009). Reportingpractices are also in place, so that bird captures trigger action by DWG and are reported to MPI.
The majority of seabird interactions with the ling trawl fishery involve white-chinned petrels, white-capped albatrosses, sooty shearwaters, and other albatrosses and seabirds (Table 9. Abraham andThompson 2011. Note that this information is updated regularly). Information from the most recentyears shows a decline in captures, although the rate of interactions has shown an increase over thefishery as a whole (DWG, 2013a). Interactions were primarily in LIN5/6. The situation will continueto be monitored through the observer programme. A Level 1 risk assessment (based on expertknowledge) concluded that the hoki/hake/ling fishery did not represent an especially high risk forseabird populations, as long as effective management measures, including effective mitigation, are inplace (Rowe 20135). Richard and Abraham (2013) provide a Level 2 risk assessment (based on semi-quantitative approaches, following Hobday et al., 2007) which identifies at-risk species caught in NewZealand commercial fisheries. This was used to support the updated National Plan of Action –Seabirds (2013, see below).
Table 9: Summary of all bird captures in ling trawl fisheries, with the number of tows, tows observed, percentage of tows observed, number of observed captures, capture rate per hundredtows, total estimated captures with 95% confidence intervals, and percentage of tows includedin the estimate. Estimated type: M - modelled; R - ratio estimated (Source: Abraham and Thompson(2011a)).
Key locations for 2008-09 captures were Chatham Rise (LIN 4) with a modelled maximum of 16interactions with sooty shearwaters. Captures in other locations and in 2007-08 were below 15 acrossall species.
Table 10: Summary of all bird captures in ling trawl fisheries, broken down by fishing areas,with the number or tows, number of tows observed, percentage of tows observed, number ofobserved captures, capture rate per hundred tows, total estimated captured with 95%confidence intervals, and percentage of tows included in the estimate. Estimate type: M –modelled, R – ratio estimated, B – both methods, N – not estimated. (Source: Abraham andThompson (2011)).
Compared to the trawl fishery, notable numbers of birds interacted with the ling longline fishery. Themajority of seabird interactions with the ling longline fishery involve white-chinned petrel, greypetrel, Salvin's albatross, sooty shearwater, Cape petrels, petrel (unidentified), albatross (unidentified),and Chatham albatross (Table 11, Abraham and Thompson 2011). Information from the most recentyears shows no trend in estimated captures, although the relatively low observer coverage leads togreater uncertainty in overall estimates (DWG, 2013b). Interactions were primarily in the southernregion LIN3-6. The situation will continue to be monitored through the observer programme.
Table 11: Summary of all bird captures in ling longline fisheries, with the number of tows, tows observed, percentage of tows observed, number of observed captures, capture rate per hundredtows, total estimated captures with 95% confidence intervals, and percentage of tows includedin the estimate. Estimated type: M - modelled; R - ratio estimated (Source: Abraham and Thompson(2011a)).
Key locations for 2008-09 captures were Chatham Rise (LIN 4) and the Sub-Antarctic (LIN 6) with amodelled maximum of 1,100 interactions with white-chinned petrels in LIN 4, and 221 interactionswith white-chinned petrels in LIN 6.
IUCN status of species reported captured ranges from Least Concern (e.g. Cape Petrel) to Vulnerable(e.g., Salvin’s albatross) (www.iucnredlist.org). Almost all seabirds are legally protected in NewZealand by the Wildlife Act (1953). Some have specific management strategies applied to them (e.g.for indigenous harvest of the sooty shearwater), and some breed on islands with strictly managedaccess (e.g. the Auckland Islands). Most seabirds interacting with the ling fishery breed on offshoreislands where there are no permanent human settlements. A new NPOA Seabirds has been developed(MPI, 2013). The NPOA-Seabirds aims to reduce the number of seabird deaths from fishing and setsout an approach for the coming five years. It defines over-arching objectives for the prevention,monitoring and management of incidental seabird capture. It sets out how these objectives are to beaddressed and implemented by the Ministry for Primary Industries, and provides clear expectationsfor regular review and reporting on progress towards meeting the objectives. It outlines ways toreduce fishing-related seabird deaths by raising awareness of the problem and encouraging theresearch and resourcing of new measures and methods. The risk assessment (Richard and Abraham2013) underpinning the NPOA-Seabirds guides management expectations. For example, seabirdspecies identified as at very high or high risk of having commercial fisheries bycatch exceedpopulation sustainability limits should be managed to a lower risk category by 2018. Species in thesecategories that are reported caught in ling fisheries include white-capped albatross, Buller’s albatross,Chatham albatross and Salvin’s albatross.
The level of understanding of seabird populations and ecology is highly variable, and depends on anumber of factors, including accessibility of breeding islands and the severity of perceived threats.For example, despite being captured in many New Zealand fisheries, Salvin’s albatross is a less wellstudied species, due to the largest population breeding on the remote and inhospitable Bounty Islands.Population studies have commenced on a number of seabird species affected by fisheries, includingthe hoki fishery, during the last 5-10 years (e.g. white-capped albatross and white-chinned petrel).There are also a small number of longer term studies, e.g. of Buller’s albatross on the Snares Islands.Albatrosses and petrels generally lay a single egg each breeding event, and many don’t breed everyyear. Adult survival is the most important parameter determining population trends.
Table 12: Summary of all bird captures in ling longline fisheries, broken down by fishing areas,with the number or tows, number of tows observed, percentage of tows observed, number ofobserved captures, capture rate per hundred tows, total estimated captured with 95%confidence intervals, and percentage of tows included in the estimate. Estimate type: M –modelled, R – ratio estimated, B – both methods, N – not estimated. (Source: Abraham andThompson (2011)).
A Level 2 risk assessment was completed for seabirds in 2011 (Richard et al. 2011). This assessmenthighlights the effects of cumulative seabird catches across New Zealand fisheries. The hoki/hake/lingtrawl fishery was not thought by experts to represent an especially high risk for seabird populations,as long as effective management measures, including mitigation, are in place (Rowe 2010). However,when considered across New Zealand fisheries (Richard et al. 2011), the following species may bethreatened by commercial fisheries activities (species in italics have been observed captured in the
ling fisheries): black petrel, grey-headed albatross, Westland petrel, Chatham albatross, flesh-footedshearwater, Salvin’s albatross, light-mantled albatross, Stewart Island shag, northern giant petrel,northern royal albatross, New Zealand king shag, Campbell albatross, Buller’s albatross, Gibson’salbatross, Antipodean albatross, white-capped albatross, white-chinned petrel, cape petrel, andsouthern royal albatross.
The risk assessment noted that annual potential seabird fatalities within the deepwater trawl complexwere between 1% and 50% of the PBR. Seabird captures in the ling fishery account for approximately1% of seabirds caught in New Zealand offshore trawl fisheries in 2007/08 and 2008/09 (Abraham andThompson 2011b). Captures of potentially at-risk species require particularly careful monitoring toensure that the impact of the ling trawl fishery does not threaten sustainability.
The risk assessment noted that annual potential seabird fatalities within the 'large' longline complexwere between 1% and 50% of the species PBR, while the 'small' (sized) longline complex weregenerally less than 10% of the species PBR, but between 10 and 30% of the PBR for flesh-footedshearwater, between 30 and 100% of the PBR for Salvin's albatross and Chatham Island albatross, andover the PBR for Black petrel (Richard and Abraham, 2013a).
The black petrel (Procellaria parkinsoni) was the species most at risk from commercial fishingactivities (Richard and Abraham 2013). The black petrel is endemic to New Zealand and is classifiedas Vulnerable by the IUCN (IUCN, 2013). It breeds in only two colonies: approximately 2000 annualpairs on Great Barrier Island, and approximately 100 annual pairs on Little Barrier Island. Mostobserved captures were close to its breeding grounds, primarily in the bottom longline snapperfishery, but also in the bottom longline bluenose fishery, and in inshore trawl fisheries. Francis & Bell(2010) found that the main black petrel population breeding on Great Barrier Island has beenincreasing with an average of 1.2% per year, from 1,598 breeders in 1988 to 1,964 breeders in 2005.This was, however, primarily based on two population surveys that used different methods. Theuncertainty associated with these surveys was not taken into account, and it is possible that thepopulation has been declining despite this apparent increase. Fisheries bycatch data were notconsidered by Francis & Bell (2010). Black petrel migrate to eastern Pacific waters outside of thebreeding season, and will also be vulnerable to capture in fisheries there. They may also be caught byrecreational fishers in the Hauraki Gulf area (Abraham et al. 2010a). These sources of fisheriesmortality were not included in the risk assessment. While the ling longline fishery is not implicatedwithin the significant captures of Black petrel, further monitoring of interactions should occur infuture audits.
Small vessel ling longline interactions were estimated by Abraham and Thompson (2011). Meanestimates peaked in 1999-00 at 237 interactions (Table 13), and a maximum of 170 'other albatrosses'were caught in Chatham Rise in 2008-09 (Table 14).
Seabird captures in the ling trawl fishery account for approximately 1% of seabirds caught in NewZealand offshore trawl fisheries in 2007/08 and 2008/09 (Abraham and Thompson 2011b). Capturesof potentially at-risk species require particularly careful monitoring to ensure that the impact of theling trawl fishery does not threaten sustainability.
Table 13: Summary of all bird captures in ling longline fisheries, with the number of tows, tows observed, percentage of tows observed, number of observed captures, capture rate per hundredtows, total estimated captures with 95% confidence intervals, and percentage of tows includedin the estimate. Estimated type: M - modelled; R - ratio estimated (Source: Abraham and Thompson(2011a)).
Table 14: Summary of all bird captures in small vessel ling longline fisheries, broken down byfishing areas, with the number or tows, number of tows observed, percentage of tows observed,number of observed captures, capture rate per hundred tows, total estimated captured with95% confidence intervals, and percentage of tows included in the estimate. Estimate type: M –modelled, R – ratio estimated, B – both methods, N – not estimated. (Source: Abraham andThompson (2011)).
Marine mammalsLike all marine mammals in New Zealand waters, fur seals are legally protected. The population ofNew Zealand fur seals is widely believed to be increasing although there are no robust populationcount data available. Baird (2011) summarises current knowledge relating to population status. Thelongest term data set is from three rookeries on the West Coast of New Zealand’s South Island. Atthese sites, surveys of pup production have occurred since the 1990s. Summary findings from thiswork indicate net declines in pup production between the 1990s and 2000s. In contrast, work aroundKaikoura and Banks Peninsula (east coast of the South Island) suggests populations there areincreasing/expanding. Despite the lack of accurate population assessments, the life historycharacteristics of fur seals are well understood (see Baird 2011 for an extensive review).
Fur seals are caught in trawl and other fisheries around New Zealand. Numerically across all lingtrawl fisheries, they are the most captured New Zealand protected species. Captures of fur seals in theling fishery occur in all fishing areas (Table 15), and estimated total captures peaked in 2004-05 at 55individuals across all fisheries (mean estimate of 29 in 2008-09). This represents 5-6% of the totalestimated trawl captures of New Zealand fur seals in those years. Other fisheries capturing fur sealsinclude trawl fisheries targeting hoki, southern blue whiting, and surface longline fisheries (Ramm2010, 2011).
Fewer fur seals are caught in longline fisheries around New Zealand, and no interactions have beennoted specifically with the ling longline fishery (Abraham and Thompson, 2011).
No interactions have been noted with sea lions within any of the ling fisheries (Abraham andThompson, 2011). In turn, no whale interactions have been observed interacting with ling fisheries.
There are no specific regulations defining mitigation approaches for marine mammal interactionswithin this fishery. All vessels managed under the DWG are required to follow specific operatingprocedures to reduce the risk of seal captures. Procedures are described in the Operating Procedures:Marine Mammals, based on data analyses and expert opinion (Deepwater Group 2011c). Theserequire the rapid reporting of mortalities so that action can be taken. In turn, operating procedures arealso provided to minimise the danger period when the trawl net is close to the surface, shallow turnswhile trawling, and to avoid discharging offal (as in the VMP for bird bycatch mitigation). Somevessels avoid shooting nets where marine mammals are present (Rowe, 2009). Reporting practices arein place, so that marine mammal captures trigger action by DWG and are reported to MPI. Currentresearch and management priorities for fur seals include better assessments of capture levels in CookStrait, identifying the regional provenance of by-caught fur seals, and investigating female foragingbehaviour.
Table 15: Summary of New Zealand fur seal captures in ling trawl fisheries, broken down by fishing areas, with the number of tows, tows observed, percentage of tows observed, number ofobserved captures, capture rate per hundred tows, total estimated captures with 95%confidence intervals, and percentage of tows included in the estimate. Estimated type: M -modelled; R - ratio estimated (Source: Abraham and Thompson (2011)).
SharksFive species of sharks (the basking shark, deepwater nurse shark, white shark, oceanic whitetip shark,and the whale shark) are protected by domestic legislation in New Zealand waters. The basking sharkhas been reported to interact with the hoki trawl fishery (e.g. Francis and Lyon, 2012; Francis andSutton, 2012). However, there have been no observed interactions with key shark species the lingfishery noted over the period 2007/08 - 2011/12.
3.4.3 Protected benthos
The following benthic organisms are protected in New Zealand (e.g. listed on Schedule 7A of theWildlife Act): black corals (all species in the order Antipatharia), Gorgonian corals (all species in theorder Gorgonacea), Stony corals (all species in the order Scleractinia), and Hydrocorals (all species inthe family Stylasteridae). As for other protected species, protection does not make capture incommercial fisheries illegal. However, captures are required by law to be reported in accordance withMPI reporting regulations. Similar to other protected species, observers on commercial vessels alsodocument captures of these species. Where identification is unclear, samples can be returned toexperts onshore.
Red and Black coral distribution within New Zealand waters has been mapped. The ‘red coral’ isnoted to include all species in the genus Errina (which lies within the family Stylasteridae) but is alsothe common name of a number of coral species in the order Gorgonacea. Cold water corals capturedin trawls are noted by observers present onboard, and where they cannot be identified they arereturned to NIWA for more detailed examination under DOC funded projects. Fishery-independentsurveys are also underway using cameras inside and outside the main fishery areas.
For protected cold water corals, the designation of Benthic Protection Areas, which include seamountsknown to include such key species, acts as a non-directed strategy for managing the fishery’s impactson these species.
Understanding of the distribution of benthic organisms, including protected species, is graduallygrowing for New Zealand waters. Baird et al. (2012) summarised knowledge gathered from researchsurveys and observed commercial fishing effort to develop a data set of 7731 records. Coral recordsfrom the four orders (Scleractinia (stony corals), Anthoathecata (hydrocorals), Alcyonacea(gorgonians) and Antipatharia (black corals)) were distributed throughout the Fishery ManagementAreas, though differences by area and depth were evident at the family and genus level, where lowertaxonomic detail was available. Modelled distributions were predicted to concentrate in deeper watersand areas of high relief. Generally the areas predicted to have the greatest probability of coraloccurrence were outside the main fisheries areas, except for some deepwater fisheries that occurred onareas of steeper relief. The fisheries that pose the most risk to protected corals are the deepwater trawlfisheries for species such as orange roughy, oreo species, black cardinalfish, and alfonsino. Inshallower waters, scampi trawl fisheries appear to pose the greatest risk to coral in all protectedorders. Bottom longline fisheries pose a particular risk to those corals that have a branching or bushystructure. Examining table E1 of the report, reported interactions within the ling fishery occurred for 2hydrocorals (observed in FMA 4 and FMA 6), and 1 bamboo coral (FMA 4). These represented0.01% or less, of the noted interactions across fisheries.
3.4.3.1 Details of any critical environments or sources of concern and actions required toaddress them.
The New Zealand government commissioned an environmental classification to provide a spatialframework that subdivided the TS and EEZ into areas having similar environmental and biologicalcharacter. This Marine Environment Classification (MEC) was launched in 2005 (e.g. Snelder et al.,
2005, 2006) using available physical and chemical predictors, and because environmental pattern wasthought a reasonable surrogate for biological pattern (e.g. Figure 4). However, the MEC was viewedas less appropriate for benthic invertebrates, and this led to the development of other systems morefocused towards benthic systems (e.g. a classification optimised for demersal fish; Leathwick et al.,2006), and BOMEC in 2009 (Leathwick et al.,(2009)).
The Ministry of Fisheries commissioned a Benthic-Optimised Marine Environment Classification,BOMEC, to build upon the work underpinning the MEC (MPI, 2012). Many more physical, chemical,and biological data layers were available for the development and tuning of this classification,including information of greater relevance for benthic invertebrates. The BOMEC classes werestrongly driven by depth, temperature, and salinity into five major groups: inshore and shelf; upperslope; northern mid-depths; southern mid-depths; and deeper waters (generally beyond the fishingfootprint, down to 3000 m, the limit of the analysis). While BOMEC represents the most current toolfor considering likely impacts of bottom trawling on benthic organisms within different definedhabitat categories, and recent testing (Bowden et al., 2011) indicated that the BOMEC outperformsthe original MEC at predicting benthic habitat classes, there remain limitations at finer spatial scales.Bowden et al. (2011) found that only at large spatial scales (100s-1000s km) was therecorrespondence between the distribution of biotic habitats and the environmental classes defined byMEC and BOMEC classifications. Bowden et al. (2011) also found that resolution increased at higherclass levels, especially for the MEC; and at finer scales (BOMEC 15 Class level) there was littleevidence of correspondence between individual biotic habitats and environmental classes from any ofthe classifications. Furthermore, the BOMEC classification, has not yet been ground-truthed againstdirect observations of benthic habitats.
MEC BOMEC
Figure 3: Maps of the 20-class version of the 2005 general purpose Marine EnvironmentClassification (MEC, from Snelder et al. 2005; left) and Benthic Optimised MarineEnvironment Classification (BOMEC; from Leathwick et al., 2010; right).
Spatial closures are the main tool used in New Zealand waters to mitigate captures of vulnerablebenthic species. For example, 18 seamounts closed to fishing are located around the EEZ. An industryinitiative led to the creation of Benthic Protected Areas (see Figure 4). The development of BPAs wasbased upon the marine environment classification studies available at that time, but furtherinformation has continued to be collected.
Figure 4 : Map showing the general location of benthic protection areas and seamount closureswithin NZ EEZ Source: Deepwater Group
The changes within previously fished habitats inside BPAs over time have been examined. This hasmainly used camera surveys to examine benthic faunal recovery. The impact of introducing BenthicProtection Areas on previously fished seamounts has been monitored, and evidence of recovery incoral cover has been seen (where extant corals in neighbouring areas may allow better recruitment,noting that this depends on the species-specific recovery rate).
Change within the main fished area has not been directly examined, and is inferred from literature onother fisheries. The observer programme notes benthic invertebrates brought up in the trawl fishery,although the taxonomic resolution of these groups is less detailed. Taxonomic guides developed byNIWA for cold water corals and sponges are improving species recognition, while still unidentifiedcorals are returned for professional taxonomic identification.
The pattern of New Zealand's trawl footprint for deepwater fisheries has been monitored relative tothe Benthic-Optimised Marine Environment Classification (BOMEC) (e.g. Black et al., 2013). Thisprovides an indicative mechanism with which to regionally assess the impacts of the ling fishery onbenthic habitat, keeping in mind that the BOMEC classifications (as outputs from a model) are yet tobe ground truthed, and that the communities inhabiting these habitat types are less known andrelatively difficult to sample. Examined compared to the BOMEC grid codes (15 classes, referred toas A-0 in Figure 3 and 1-15 below), the maximum swept area covered represents just under 5% ofBOMEC type 9 (Table 16).
Table 16: Swept area of ling-targeted tows between 1989-90 and 2009-10 (from Black et al., 2013).
Examinations of the trawl footprint by LIN region have also been undertaken (Black, 2013). Over thelast five fishing years, the swept area recorded in the 300-600 m depth zone is always less than 3%,except for LIN 5 where it was 7.9%. For full information and further figures, the reports are availableat http://www.deepwater.co.nz/our-species/ling/msc-assessment-of-new-zealand-ling-fisheries/. Anexample is presented in Figure 5.
Figure 5. Total swept area of ling-targeted trawls over the period 1989-90 to 2009-10, fromBlack et al. (2013).
3.5 Principle Three: Management System Background
The NZ ling fishery is a single jurisdiction fishery.
The management system
Ling was introduced into the Quota Management System (QMS) in 1986 and since that time theQuota Management Area (QMA) boundaries have not changed. There are five biological stocks of
ling that do not align with the quota management areas (see Section 3.3.2). Stock assessments for lingfisheries are completed based on biological stock, rather than QMAs. Under the National DeepwaterPlan all ling stocks in LIN3, LIN4, LIN5, LIN6 and LIN7 are Tier 1 stocks as they are high volumeand/or high value fisheries. The Tier 1 stocks undergo a formal assessment based on targeted research.
3.5.1 Management approach
Since 1986, the major commercial fisheries in New Zealand fisheries waters (including ling) havebeen managed through a quota management system (QMS) based on individual transferable quotas(ITQs). Within the QMS, fisheries sustainability objectives are achieved by setting a total allowablecatch (TAC) that is consistent with the productivity of a fishery. TACs can be reviewed on an annualbasis and a total allowable commercial catch (TACC) is then determined taking into account anyrecreational and customary harvesting. The TACC for each fishery is then apportioned to quotaholders as an annual catch entitlement according to the percentage of quota they hold for a fishery.Fishers are required to hold sufficient annual catch entitlement to cover all target and bycatch speciescaught, or alternatively, to pay deemed values. Annual catch entitlements are widely traded duringtheir period of validity to enable fishers to balance catches taken against quota held. Total catch limitsare also set for some commercial fisheries not managed within the QMS. A fishing permit is requiredto fish for QMS and non-QMS species
Since 2006 the following management changes have been made to further improve sustainability: Management partnership between the Ministry and quota owners established TACC changes in response to research and stock assessments implemented Management Reference Points revised and implemented Rebuilding strategy developed and implemented Management Strategy Evaluation completed and findings implemented Fisheries Plan completed, approved by Minister of Fisheries, and implemented Compliance Group established to achieve improved compliance Audits against agreed KPIs (Key Performance Indicators) show compliance rates of 96-100%
with management requirements Ecosystem indicators developed Ecological Risk Assessment completed and findings being implemented Bycatch and discard rates assessed Risk assessment of incidental interactions with seabirds completed Incidental interactions with seabirds reduced Interactions with benthic communities assessed
3.5.2 Interested parties
Interested parties include: MPI: NZ Government department responsible for the management of NZ Fisheries; DWG (ling) Quota Owners; ACE Owners; Selected Vessel Operators; Seafood Industry Council (SeaFIC), representing all sectors of the seafood industry, now
restructured into Seafood New Zealand; Department of Conservation: NZ Government department responsible for the management
protected species; and E-NGOs, representing Environmental interests.
NOTE: there are no recreational or customary access rights in this fishery.
There is widespread consultation across all stakeholder groups and interested parties on proposedmanagement measures and every encouragement and support is made to incorporate stakeholders’views into final management interventions.
Ongoing consultationsManagement decisions are clearly linked to a set of agreed high-level objectives for a fishery. Theproven collaborative management regime ensures there is stakeholder participation in thedevelopment and implementation of management changes. This collaborative approach means there isgood exchange of information to enable full cost/benefit assessments of proposed managementmeasures. The management approach and decisions are documented and are publicly available in aformat that is accessible to all interested parties.
3.5.4 Non fishery users
Section 12 of the 1996 Fisheries Act includes a range of specific consultation requirements, and theadditional requirement to provide for input and participation of tangata whenua6 in particularcircumstances. There are three aspects to this section:
a) Under Section 12(a) of the 1996 Act, the Minister of Fisheries is required to consult withthose classes of persons having an interest (including, but not limited to, Maori,environmental, commercial and recreational interests) in the stock or the effects of fishing onthe aquatic environment in the area concerned;
b) Section 12(1)(b) outlines the Crown’s commitments to provide for the input and participation
of tangata whenua. Involving tangata whenua in fisheries management decisions reflects the
provisions in the Treaty of Waitangi (Fisheries Claims) Settlement Act 1992, and the Crown’s
commitment to its partner.
c) Section 12(1)(b)(ii) requires that the Minister have particular regard for the exercise of
kaitiakitanga in relation to the people of the area.
Section 12 only relates to certain sections of the 1996 Act. There are many other sections of the 1996Act that require the Minister or MPI Chief Executive to consult with stakeholders before making adecision. There are also other MPI activities where consultation is encouraged, e.g., setting of policiesand guidelines.
Although the consultation requirements set out in Section 12 specifically relate to sustainabilitydecisions, the general principles outlined can be applied to all consultation activities including:
engagement with Scientific Service providers (including: National Institute of Water andAtmospheric Research Limited (NIWA), GNS Science, Dragonfly, 42oS, InnovativeSolutions Ltd, Cawthron Institute);
MPI and DWG Partnership Agreement (See DWG (2010) Memorandum of Understandingbetween the MPI and the Deepwater Group: Continuing a partnership between the MPI andthe deepwater fishing industry for the management of New Zealand’s deepwater fisheries);
eNGOs – as required and for specified matters (e.g. ERA), and the Science Working Groups(Middle depth, Deepwater and Aquatic Environment Working Groups).
6 Māori term of the indigenous peoples of New Zealand and literally means "people of the land", from tangata,'people' and whenua land
Consultation is required wherever it is prescribed under Section 12 or another section of the 1996Fisheries Act. Consultation may also be required in cases where it is not legislatively mandated, suchas on policy statements or standards.
Other considerations that will influence whether to consult include:a) whether consultation is required on any decision that is likely to materially affect the ability
or interest of a person in fisheries resources;
b) the degree to which the outcome of a decision may affect the interests of a particular group ofstakeholders, e.g. a significant change in livelihood or business practices. Note that thisimpact may not necessarily depend on the number of people affected. However, the mannerof consultation will vary depending on whether only one person is potentially affected, or twoor more;
c) the appropriateness of limiting consultation (e.g. considerations of legal risk, stakeholderrelationships and impacts on the quality of informed decision-making);
d) the nature of the proposed measure, whether the amendment is substantive or technical;
e) the benefits of consulting the widest number of stakeholders for the longest period possible,including considerations of stakeholder buy-in and improvements to Ministry processes andquality of decision-making. In general MPI will consult widely and for long periods ondecisions that affect stakeholders.
f) the management framework, (e.g., development of the Statement of Intent, the developmentof Environmental Performance Standards, and the development of Fisheries ManagementPlans).
Administrative law also provides some guidance to the decision-maker. A decision to consult or not toconsult, and any decision made after consultation, must be made in accordance with the principles ofadministrative law, and in accordance with Fisheries Act obligations. These principles requiredecision-makers to act:
in accordance with law;
reasonably; and
fairly, in accordance with the principles of natural justice.
Decisions not made in accordance with these requirements may be challenged.
The requirement to act fairly is most relevant to consultation. Decision-makers must follow properprocesses to ensure that those individuals or groups affected by their decisions are given naturaljustice. A decision can be challenged if a decision-maker is biased in such a way that prevents him orher from fairly considering the issue with an open mind. Examples include where a decision-makerhas a financial interest in the issue or has already made up his or her mind before considering relevantinformation (i.e., predetermination). Any statements or conduct which may suggest a closed mind orpredetermination - in the sense that decision-makers are not open to persuasion or argument - shouldbe avoided.
3.5.6 Objectives for the fishery
The Fisheries Plan (MPI, 2010d) outlines the objectives for the all deepwater and middle-depthfisheries:
The ling fishery specific chapter of the National Deepwater Plan has specific objectives tailored to theling fisheries that are achievable, and which directly guide actions in the ling fisheries. These are thenspecified within the Annual Operational Plan (AOP) by year. These fishery specific objectives aresubject to the Annual Review report and are measureable.
Utilisation-focused Operational Objectives
OO1.1 Support the relevant ling fisheries in achieving and maintaining credible third partycertification and ensure any Conditions of Certification are met within the required timeframe
OO1.2 Enable quota owners to develop and implement a harvest regime that will maximise the valueobtained from ling fisheries
OO1.3 Ensure satisfactory levels of compliance are achieved in ling and associated fisheries
OO1.4 Develop and implement a stock monitoring and management regime for the ling fisheries toenable development of appropriate management settings and harvest strategy
OO1.5 Collaboratively assess potential management tools to manage ling based on biological stockboundaries
Environment-focused Operational Objectives
OO2.1 Develop an agreed harvest strategy for ling fisheries, including a stock rebuild strategy that isconsistent with the Harvest Strategy Standard
OO2.2 Develop and implement a management strategy for ribaldo (bycatch species)
OO2.3 Implement appropriate spatial management measures to address any adverse effects of fishingfor ling on the benthic habitat
OO2.4 Ensure that incidental seabird mortalities in ling fisheries are mitigated and minimised
OO2.5 Monitor incidental bycatch of Tier 3 species in ling fisheries
3.5.7 Fleet characteristics
Records from the fisheries begin in the 1970s, when foreign longliners began fishing for ling, butsoon expanded to include large foreign and domestic trawlers, small domestic longliners and smalldomestic trawlers.
In recent years, the fisheries continue to be prosecuted by both deepwater and inshore vessels usinga variety of methods. The main fishing method and proportion of catch taken by inshore vesselsdiffers by fishery.
The deepwater trawl fleet fishes predominantly on the west coast of the South Island and in the sub-Antarctic fishery at Puysegur Bank and the slope of the Stewart-Snares shelf .
Between 2001/02 and 2010/11, trawlers greater than 28 m have taken 55-71% of the annual ling catchfrom the fishery. A significant amount of ling is taken as bycatch in trawl fisheries for hoki, hake, andsilver warehou.
The deepwater longline fleet consists of several autoliners which take the majority of the bottomlongline proportion of the catch. These vessels almost exclusively target ling, with most of the catchcoming from the sub-Antarctic and Chatham Rise fisheries. The Bounty Platform fishery is fishedalmost entirely by this fleet, but catches are smaller than those in the sub-Antarctic and Chatham Risefisheries. Between 2001/02 and 2010/11, deepwater bottom longliners have taken 15-31% of theannual ling catch from fisheries covered in this chapter.
Inshore vessels catch ling primarily from the west coast South Island fishery south of HokitikaCanyon, with over 50% of catches in that fishery coming from inshore vessels in 2009-10. Overall, infisheries covered in this chapter, inshore vessels have caught 9-22% of the total annual catch. Thisproportion has been increasing in recent years. Within the inshore fleet, 60% of catches are taken bylonglining and about 30% by trawling, with the remainder taken by other methods such as setnetting,drop lining, and as a bycatch in blue cod potting.
3.5.8 Rights of access to fishery
Since 1986, the major commercial fisheries in New Zealand fisheries waters have been managedthrough a QMS based on ITQs. A fishing permit is required to fish for QMS and non-QMS species,all fishing vessels must be registered, and all fishing permit holders are required to furnish accuratemonthly returns on locations fished, fishing gear used, catches of main species, information onprocessing and landing of catches and to reconcile these against ACE.
The Fisheries Act 1996 (the Act) requires that, prior to setting management measures for ling, theMinister of Fisheries shall consult with persons having an interest in the stock or the effects of fishingon the aquatic environment in the area in which the fishery takes place, including Maori,environmental, commercial and recreational interests. In addition, the Act requires that in setting aTAC under section 13, the Minister shall have regard to such social, cultural and economic factors(s)he considers relevant.
Social and cultural factors include those related to the harvesting of ling by all parties; commercial,recreational and customary. However, there is little recreational or customary fishing for ling. Thereare no recreational or customary allowances for any ling fish stock.
Social and cultural factors also include the non-extractive value of healthy ling and key bycatch stocksand the values associated with an aquatic environment that is not adversely impacted on by lingfishing activity. These intrinsic values must also be considered when determining the appropriatemanagement measures for a fishery.
3.5.9 Measures for regulation of the fishery
MPI and the DWG to work in partnership outlining the priority areas and workplan to better managedeepwater fisheries. The two parties have developed a single joint-management framework withagreed strategic and operational priorities and workplans and timeframes.The partnership was formedto:
advise the Minister of Fisheries on clear and agreed objectives for the deepwater fisheries; advise the Minister of Fisheries on management measures to support these objectives; define service requirements to support these objectives; ensure efficient delivery and value from these services; and provide consistent and agreed advice to the Minister wherever possible.
The partnership is focused on determining the maximum economic yield of the deepwater fisheries bysetting catch limits that maximise returns over the long term within the constraints of ecologicalsustainability. This collaborative approach to fisheries management has an industry-wide impact on
the behaviour of seafood companies by way of creating a "self management" responsibility amongstindustry participants.
This co-operation between seafood companies replaces historical competitive behaviours, improvesindustry wide management initiatives and subsequent compliance with standards and outcomes set,monitored and audited by government.
3.5.10 Monitoring control and surveillance
Vessel registrationSection 103 of the Fisheries Act 1996 requires vessels to be registered in the Fishing Vessel Registerin order to take fish, aquatic life, or seaweed for sale, in New Zealand fisheries waters.
Permitting of commercial fishersAny person who wishes to take fish for the purpose of sale can only do so under the authority of acommercial fishing permit issued under the Fisheries Act 1996 (the Act). Commercial fishers arerequired to:
fish from a registered fishing vessel;
keep records of all catch, effort and landings;
report regularly to the Ministry their effort and landings;
not discard quota species (with limited, documented exceptions);
land catch to approved licensed fish receivers (LFRs) (with limited, documented exceptions);
and
furnish Monthly Harvest Returns (MHRs) to MPI detailing all the catches made for that
month by the permit holder, as they may fish from more than one vessel.
Foreign Charter Vessels (FCVs)Foreign Charter Vessels (FCVs) are vessels owned or operated by an overseas entity under contract orcharter to a New Zealand company. While FCVs remain flagged to a foreign State during thetime of the charter, their registration status makes them subject to New Zealand's law and fisheriesmanagement regime, including an obligation to meet all the requirements listed above, while fishingin New Zealand waters.
In recent years the industry has supported a shift away from prescriptive regulatory fisheriesmanagement to a strong focus on more collaborative fisheries management, including industryimplementation of operational plans which are monitored and audited by government. Thiscollaboration includes all stakeholders and shareholders in the DWG along with government and non-government organisations and interested parties.
3.5.11 Details of any planned education and training for interest groups.
With respect to avoiding or mitigating interactions with ETP species, DWG has implemented a rangeof non-regulatory measures and supplementary measures. As part of this DWG has an EnvironmentalLiaison Officer whose role is to:
ensure each vessel’s management plan is implemented and up to date; assist with development and implementation if required; lecture vessel operators, skippers (on all trawlers >28m and from 2011 all trawlers <28m in
the Cook Strait as well as small trawlers and longliners in other places) on best practice; and provide a best practice manual
The ling specific chapter of the National Fisheries Plan for Deepwater has specific objectives tailoredto the ling fisheries, that are achievable, and which directly guide actions in the ling fishery. These arethen specified in the Annual Operating Plan (AOP) each year. Progress against the objectives in theplan is reviewed annually and reported in the Annual Review Report. The objectives also guideplanning in the Annual Operating Plan, however the Fish Plan itself is only reviewed every five years.
3.5.13 Research Plan
The 10 Year Research Programme for deepwater fisheries sets out the research and monitoringapproach for ling over the next 10 years.Ling stocks will be assessed at a 2-3 year interval using the following information:
Trawl surveys – primarily for LIN3, LIN4, LIN 5 and LIN7; CPUE from the trawl bycatch (LIN7 and Cook Strait); Regular length-frequency sampling by Observers; and Routine catch-at-age analysis of otoliths collected by Observers and during trawl surveys.
The 10 Year Research Plan also identifies monitoring environmental interactions including: Environmental monitoring Benthic impacts ETP species
Fish bycatch
4 Evaluation Procedure
4.1 Harmonised fishery assessments
No other ling fisheries have been either certified or are under MSC assessment.
The New Zealand ling fishery does overlap with the MSC certified hoki fishery and the NZ hakefishery, currently under assessment. The hake and the ling fishery assessments are occurring at thesame time.
The ling fishery assessment has been harmonised (where appropriate) with hoki and hake in thefollowing ways
The same default assessment tree has been used for hoki, hake and ling Consistency of outcomes has been ensured so as not to undermine the integrity of the MSC
fishery assessments. In scoring the fishery the assessment team looked to provideconsistency of scoring outcome for PIs, reviewed the scoring rationales for the hoki fisheryand, where appropriate, i.e. under P2 and P3 in particular, took then into account.
As the NZ hake and ling fishery are occurring at the same time important steps in theassessment have been harmonised, e.g. site visits, stakeholder inputs, client meetings,assessment planning, coordinated process steps and timing of reports.
Fisheries information has been shared between fisheries. Conclusions, where appropriate, are consistent between the three fisheries with respect to
evaluation, scoring and conditions. This is especially relevant for Principle 3 for all speciesand Principle 2 for hoki, hake and ling trawl UoCs.
4.2 Previous assessments
This fishery has not been previously MSC assessed or certified.
This assessment of the NZ ling fishery has been carried out using the Marine Stewardship Council’sCertification Requirements v 1.3 14 January 2013.
The full assessment reporting template has been used without any adjustments.
The default assessment tree has been used without any adjustments
4.4 Evaluation Processes and Techniques
4.4.1 Site visits
A number of stakeholders who previously expressed an interest in the New Zealand deepwater andmiddle-depth species certification were contacted prior to the commencement of this latestreassessment. Other potential new stakeholders were also contacted. The full list of those individualsand organisations contacted is contained below in Table 17 for 2009 and Table 18 for 2013.
Inspection of the fishery focused on the practicalities of fishing operations, the mechanisms andeffectiveness of management agencies and the scientific assessment of the fisheries.
Table 17 : List of stakeholders consulted during the 2009 assessment
David Foster (Fisheries Analyst)Aoife Martin (Manager, Deep WaterFisheries)Tom Chatterton (Manager, Deep WaterFisheries)Vicky Reeve (Fisheries Analyst)Jeremy Helson (Senior Fisheries
10th Sept 2013 Edward Abraham Dragonfly Dragonflystakeholdermeeting
OpenFinlay Thompson Dragonfly
Philipp Neubauer Dragonfly
Tiffany Bock MPI
Richard Wells DWG
10th Sept 2013 Paul Crozier WWF NZ eNGOstakeholdermeeting
ClosedKevin Hackwell Forest and Bird
Barry Weeber(subject to proviso)
ECO
7 Please note IMM Assessors Jo Akroyd and Graham Pilling attended all meetingsPlease note all stakeholders were asked if they preferred an open or closed meeting.
Consultations were held with the individuals and organisations as identified in 4.4.1 above.
A written record was made for all interviews. These were sent to interviewees who, where necessary,made alterations and confirmed by email as a true and accurate record. The corrected and confirmedrecords are attached as Appendix 2.
4.4.3 Evaluation techniques
MediaAs well as notification on the MSC website, advertisements were placed in three major NZnewspapers, The NZ Herald, The Press and the Nelson Mail. This was to inform any New Zealanderwho wished to participate in the process when the site visit was occurring and who to contact if theywere interested. A further notification was made on the MSC website prior to the second site visit andall know interested parties were contacted by email.
Methodology usedAll recognised stakeholders including government agencies, industry, eNGOs and research providerswere contacted prior to the re-assessment and encouraged to participate in the re-assessment processto ensure that the CAB would be exposed to a working knowledge of the management and fishingoperations.
Inspection of the fishery focused on the practicalities of fishing operations, the mechanisms andeffectiveness of management agencies and the scientific assessment of the fisheries.
Scoring processAfter the team compiled and analysed all relevant information (including technical, written andanecdotal sources), the fishery was scored against the Performance Indicators and Scoring Guideposts(PISGs) in the default assessment tree. The team:
weighed up the balance of evidence; and used its judgement to agree a final score following the processes below.
In summary the team used a group consensus approach.
Decision ruleThe team scored individual performance indicators by applying the following:
SG60If any one or more of the SG60 scoring issues was not met, the fishery would fail and there would beno further scoring. If all of the SG60 scoring issues were met, the PI would achieve at least a 60 score.
SG80The team assessed each of the scoring issues at the SG80 level. If all of the SG80 scoring issues weremet, the PI scored 80. If any of the scoring issues under the SG80 were not met an intermediate score(65, 70 or 75) was allocated, reflecting the overall performance against the different SG80 scoringissues. In order to achieve an 80 score, all of the 60 scoring issues and all of the 80 issues had to bemet and each scoring issue justified by supporting rationale.
If all of the SG80 scoring issues were met, the PI achieved at least an 80 score and the team assessedeach of the scoring issues at the SG100 level.
SG100In order to achieve a 100 score, all of the 60 issues, all of the 80 issues, and all of the 100 issuesneeded to be met and each scoring issue justified by supporting rationale.
If only some of the SG100 scoring issues were met the PI was given an intermediate score (85, 90 or95) reflecting overall performance against the different SG100 scoring issues
In Principle 2, the team scored PIs comprised of differing scoring elements (species or habitats) thatcomprised part of a component affected by the fishery. If any single scoring element failedsubstantially to meet SG80, the overall score for that element became less than 80 and a condition wasraised. The score given reflected the number of elements that failed, and the level of their failure,rather than being derived directly as a numerical average of the individual scores for all elements.
Scores were determined for each scoring element by applying the process as above.
Table C2 MSC certification requirements v 1.3, was used to determine the overall score for the PIfrom the scores of the different scoring elements.
The weighted average score for all Criteria under each Principle for the fishery was calculated. If anyof the three Principles individually scored <80 the fishery would not pass the MSC standard.
A summary of the scoring elements considered under Principles 1 and 2 are summarised in Table 19.
Table 19: Scoring elements
UoC Component Scoring elements (fishery) Main/not main Data-deficient or notLIN3 1.1/1.2 Ling Not data deficient
UoC Component Scoring elements (fishery) Main/not main Data-deficient or not2.1 Silver warehou (trawl) Main Not data deficient2.1 Spiny dogfish (longline) Main Not data deficient2.1 Ribaldo (longline) Main Not data deficient2.2 Javelinfish (trawl) Not main Not data deficient2.2 Rattails (trawl) Not main Not data deficient2.3 Cold water corals (trawl and longline) Not data deficient2.4 Benthic habitat (trawl and longline) Not data deficient
LIN4 1.1/1.2 Ling Not data deficient2.1 Hoki (trawl) Main Not data deficient2.1 Silver warehou (trawl) Main Not data deficient2.1 Ghost shark (trawl) Main Not data deficient2.1 Spiny dogfish (longline) Main Not data deficient2.2 Common roughy (trawl) Main Not data deficient2.3 White-capped albatross (Longline) Not data deficient2.3 Sooty shearwaters (trawl and longline) Not data deficient2.3 White-chinned petrel (longline) Not data deficient2.3 Fur seals (trawl) Not data deficient2.3 Cold water corals (trawl and longline) Not data deficient2.4 Benthic habitat (trawl and longline) Not data deficient
LIN5 1.1/1.2 Ling Not data deficient2.1 Hoki (trawl) Main Not data deficient2.1 White warehou (trawl) Main Not data deficient2.3 Sooty shearwaters (longline) Not data deficient2.3 White-chinned petrel (trawl and longline) Not data deficient2.3 Fur seals (trawl) Not data deficient2.3 Cold water corals (trawl and longline) Not data deficient2.4 Benthic habitat (trawl and longline) Not data deficient
LIN6 1.1/1.2 Ling Not data deficient2.1 Hoki (trawl) Main Not data deficient2.1 Southern blue whiting (trawl) Main Not data deficient2.1 Spiny dogfish (longline) Main Not data deficient2.1 Rough skate (longline) Main Not data deficient2.1 Pale ghost shark (longline) Main Not data deficient2.2 Black cod (longline) Main Not data deficient2.3 White-capped albatrosses (trawl) Not data deficient2.3 Sooty shearwaters (longline) Not data deficient2.3 White-chinned petrel (trawl and longline) Not data deficient2.3 Fur seals (trawl) Not data deficient2.3 Cold water corals (trawl and longline) Not data deficient2.4 Benthic habitat (trawl and longline) Not data deficient
LIN7 1.1/1.2 Ling Not data deficient2.1 Hoki (trawl) Main Not data deficient2.1 Hake (longline) Main Not data deficient2.3 Cold water corals (trawl and longline) Not data deficient2.4 Benthic habitat (trawl and longline) Not data deficient
The client has aked that in order for client group members to gain the maximum benefit of thecertification the actual eligibility date is taken as 6 months prior to the publication of the PublicComment Draft Report (PCDR). The PCDR was published on 3rd July 2014, therefore, the actualeligibility date is 3rd January 2014. It should be noted that any client group member wishing to takeadvantage of the actual eligibility date will need to meet and be able to demonstrate the necessarychain of custody requirements were in place.
5.2 Traceability within the Fishery
Existing fisheries management requirements include the clear identification of species, quantity,fishing method and area of capture by all vessels landing fish from the fishery. All catches arereported in logbooks and in catch and effort landing returns. On-board observer coverage alsomonitors, cross checks and verifies catches and landings with the vessels logbook.
Cross referencing of VMS data with logbooks, observer and aerial and at-sea surveillance reports alsoensures that fish is reported from the correct area of capture. All landings are monitored by a docksidemonitoring program. Vessels have to advise MPI before landing and maybe subject to monitoring byenforcement officers
5.2.1 Tracking and tracing
As with the certified hoki fishery, clear traceability and tracking is already in place. Procedures andaudits are regularly carried out. Procedures that are in place include “when fish product is brought onto a factory site that is not from a MSC fishery or not from a site with a chain of custody certificationfor (a) reprocessing, or (b) future sale, it must be brought on to inventory with the appropriate qualitystatus and a logistic status. The narrative will read “Not MSC certified”. This will prevent itsmovement without proper control.” (DWG, Quality Manual).
If a vessel were fishing outside the Unit of Certification there are systems in place to record that fact.All factory trawlers in NZ are operating under NZ Food Safety Authority (NZFSA) and NZ FisheriesAct rules and regulations. As such, they are required to both land all catch of QMS species (such ashake) and ensure that any fish that will not be fit for human consumption (through damage oraccidental contamination) is not able to be inadvertently sold into market. This drives the need for allvessels to be able to mark, ‘ring-fence’ and inventory product or products on a reasonably regularbasis. This is coupled with the fact that all vessels produce a wide range of species and products, all ofwhich are needed to be marked by date and numerous other information, and able to be sorted onarrival in port and inventoried for market and export purposes. Both physical and electronic inventorymanagement is inherent in the systems that these vessels operate.
5.2.2 Vessels fishing outside the Unit of Certification
No ling caught outside NZ EEZ is processed in New Zealand. The processes and procedures forreporting and landing fish in New Zealand will ensure that Ling caught in geographic area LIN2(lower east coast North Island and Cook Straight) are never sold as MSC-certified.
At-sea processing occurs on all the major factory ships participating in this fishery. At-sea processingincludes the sorting, heading and gutting, filleting, freezing, reduction to surimi and packaging of ling.
There are two levels of process technology in the fleet: Fully integrated weighing labelling systems which barcode every carton on production and
before storage in the ship’s hold. This data is downloaded on arrival, reconciled on landingfigures and thus final inventory is arrived at. This system allows the tagging of product lineswhich are non-certified so that they are barcoded as non-certified and trackable and separableever after simply by scanning. Onshore systems in load-out audit of exports.
The rest of the fleet practice standard practice where all product (by carton) is labelled as perMAF and NZFSA requirements. The outer markings are used to separate and inventory allproduct on landing.
Under MPI regulations every container in which fish is packaged on a licenced fish receiver’s premiseshall be marked with species name, date, licenced fish receivers name, processed state and area fished.Therefore, the risk of substitution is considered to be well managed and therefore negligible.
5.2.4 Transhipping
Transhipping is rare in the ling fishery. However if it did occur there is legislation in place to ensurethe potential traceability risks are minimal. Section 110, of the Fisheries Act states:
Fish taken in New Zealand fisheries waters must be landed in New Zealand—
(1) No person shall land, at any place outside New Zealand, any fish… taken in New Zealand fisherieswaters unless… has the prior approval of the chief executive and is in accordance with any conditionsimposed… .
(2) For the purposes of subsection (1) of this section, fish, aquatic life, or seaweed shall be deemed tohave been landed at a place outside New Zealand if—
(a)It is transported beyond the outer limits of the exclusive economic zone by the vessel that tookit; or
(b)It is taken… and transferred to a vessel and then transported… beyond the outer limits of theexclusive economic zone without having been lawfully purchased or acquired by a licensedfish receiver in New Zealand before transportation; or
(c) It is transhipped… to another vessel.
(3) The conditions that may be imposed on any approval granted under subsection (1) of this sectioninclude conditions relating to one or more of the following:
(a)The vessel that will take the fish, aquatic life, or seaweed:(b)Any vessel, which will receive the fish, aquatic life, or seaweed:(c)The manner and conditions under which the storage, transportation, transhipment, recording,
reporting, landing, and disposal of the fish, aquatic life, or seaweed will take place.
If transhipment takes place then CoC is not compromised due to checks including records andlabelling, that are in place.
5.3 Eligibility to enter further Chains of Custody
To be eligible to carry the MSC logo, product from the certified fishery, must enter into separateChains of Custody certifications from first point of landing.
The main points of landing for this fishery are all major New Zealand ports.
The scope of this certification ends at the point of landing. Downstream certification of the productwould require appropriate certification of storage and handling facilities at these locations.
IFC determined that the systems in place for tracking and tracing are sufficient, therefore, fish andfish products from the fishery may enter into further certified chains of custody and be eligible tocarry the MSC ecolabel.
The eligible parties to use the fisheries certificate are shareholders of the Deepwater Group. Currently99.5% of total ling quota is held by DWG shareholders. Anyone who owns ling quota has theopportunity to become a DWG.
5.4 Eligibility of Inseparable or Practically Inseparable (IPI) stock(s) to enter further Chains
of Custody
There are no IPI stocks involved with this fishery.
NB: details of rationale for condition and timelines for action are in Appendix 1.3: Conditions
Conditionnumber
Condition PerformanceIndicator
Related topreviously raised
condition?(Y/N/N/A)
1
The client is required to demonstrate that thedirect effects of <34 m longline vessels (nottargeting bluenose or snapper) are highly unlikelyto create unacceptable impacts to ETP birdspecies.
2.3.1 N/A
2
The client is required to demonstrate that there isa strategy in place for managing the inshorelongline fishery component’s impact on ETPspecies, including measures to minimisemortality, which is designed to be highly likely toachieve national and international requirementsfor the protection of ETP species.
2.3.2 N/A
3
The client is required to demonstrate thatinformation is sufficient to measure trends andsupport a full strategy to manage impacts on ETPspecies.
2.3.3 N/A
Recommendation 1:
There are a number of trawl vessels operating in LIN 3, 5 and 7 of vessel lengths smaller than 28 m(see Table 1). Their small size technically excludes them from the requirement to put in place birdinteraction mitigation methods, although voluntary code of conduct approaches may be present.Vessel size is included within the models used to estimate seabird interactions (Abraham andThompson, 2011). Hence if information is available from these smaller vessels, it will be incorporatedwithin the analysis of overall interaction rates, which as noted within this document are below levelsof concern. However, it is recommended that the results of existing models be examined to identifyvessel-size factors for the UoC, and if necessary targeted data collection undertaken to support furtheranalyses of ETP interactions for this vessel size class within the UoC be performed. Where resultsshow a basis for concern, appropriate mitigation approaches should be considered.
Recommendation 2:
Observer data available from coverage on the longline component in LIN 7 in the 2011/12 year hasbeen judged sufficient to provide an estimate of the outcome status of the main bycatch species withrespect to biologically-based limits, and to support a partial strategy to manage bycatch species.However, we note that this is a single year of information and inter-annual variability in catches seenin the other FMAs increases the uncertainty in the judgements made. It is recommended that theobserver coverage be continued within this UoC in the coming years, and that the results be monitored
Abraham, E.; Berkenbusch, K.; Richard, Y. (2010a). The capture of seabirds and marine mammals in
New Zealand non-commercial fisheries. New Zealand Aquatic Environment and Biodiversity Report
No. 64. 52 p.
Abraham, E.R. and Thompson, F.N. (2011). Summary of the capture of seabirds, marine mammals,and turtles in New Zealand commercial fisheries 1998-1999 to 2008-09. New Zealand AquaticEnvironment and Biodiversity Report No. 80.
Bagley, N.W. and O’Driscoll, R.L. (2012). Trawl survey of hoki, hake, and ling in the Southland andSub-Antarctic areas, November–December 2009 (TAN0911). New Zealand Fisheries AssessmentReport 2012/05. 72p.
Bagley, N.W.; O’Driscoll, R.L.; Oeffner, J. (2013). Trawl survey of hoki and middle-depth species inthe Southland and Sub-Antarctic areas, November–December 2011 (TAN1117). New ZealandFisheries Assessment Report 2013/23. 70 p.
Baird, S.J. (2008). Net captures of seabirds during trawl fishing operations in New Zealand waters.NIWA Client Report WLG2008-22. 51p.
Baird, S.J. (2011). New Zealand fur seals - summary of current knowledge. New Zealand AquaticEnvironment and Biodiversity Report No. 72. 51p.
Baird, S.J., Tracey, D., Mormede, S. and Clark, M. (2012). The distribution of protected corals inNew Zealand waters. NIWA client report for DOC, No: WLG2012-43. 95p.
Baker, B., Jensz, K., Cawthorn, M. and Cunningham, R. (2009). Census of New Zealand fur seals onthe West Coast of New Zealand's South Island. Latitude 42 Environmental Consultants report for theDeepwater Group Ltd. 22p.
Ballara, S.L., O'Driscoll, R.L., Anderson, O.F. (2010). Fish discards and non-target fish catch in thetrawl fisheries for hoki, hake and ling in New Zealand waters. New Zealand Aquatic Environment andBiodiversity Report No. 48. 100p.
Black, J., Wood, R., Berthelsen, T. and Tilney, R. (2013). Monitoring New Zealand's trawl footprintfor deepwater fisheries: 1989-90 to 2009-10. New Zealand Aquatic Environment and BiodiversityReport No. 110. 61p.
Black, J. (2013). Hake and ling trawl footprint analysis: 1989/90 - 2011/12. Letter to DeepwaterGroup Ltd, 5/9/13.
Blackwell, R.G. (2010). Distribution and abundance of deepwater sharks in New Zealand waters,2000–01 to 2005–06. New Zealand Aquatic Environment and Biodiversity Report No. 57.
Bowden, D., Compton, T.J., Snelder, T.H. and Hewitt, J.E. (2011). Evaluation of the New ZealandMarine Environment Classifications using Ocean Survey 20/20 data from Chatham Rise andChallenger Plateau. New Zealand Aquatic Environment and Biodiversity Report No. 77.
Boyd, I. (2011). Ecological risk assessment of the New Zealand hoki fisheries. Report for theDeepwater Group Limited, Nelson, March 2011.
Bradford E. (1996). Marine recreational fishery survey in the Ministry of Fisheries North region,1993–94. NZ Fisheries Data Report No. 80. 83 p.
Bradford-Grieve, J.M., Probert, P.K., Nodder, S.D., Thompson, D., Hall, J., Hanchet, S., Boyd, P.,Zeldis, J., Baker, A.N., Best, H.A., Broekhuizen, N., Childerhouse, S., Clark, M., Hadfield, M., Safi,K., and Wilkinson, I. (2003). Pilot trophic model for subantarctic water over the Southern Plateau,New Zealand: a low biomass, high transfer efficiency system. Journal of Experimental MarineBiology and Ecology 289, 223– 262.
Bull, L.S. 2009. New mitigation measures reducing seabird by-catch in trawl fisheries. Fish andFisheries 10: 408–427.
Bull, B., Francis, R.I.C.C., Dunn, A., McKenzie, A., Gilbert, D.J., Smith, M.H. and Bian, R. (2008).CASAL (C++ algorithmic stock assessment laboratory): CASAL User Manual v2.20- 2008/02/14.NIWA Technical Report 130. 275 p.
Bull, B., Francis, R.I.C.C., Dunn, A., McKenzie, A., Gilbert, D.J., Smith, M.H. and Bian, R. (2012).CASAL (C++ algorithmic stock assessment laboratory): CASAL User Manual v2.30-2012/03/21.NIWA Technical Report 135. 280 p.
Clark M.R. and Rowden, A.A. (2009). Effect of deepwater trawling on the macro-invertebrateassemblages of seamounts on the Chatham Rise, New Zealand. Deep Sea research Part 1:Oceanographic Research Papers 56: 1540-1554
Clement and Associates. (2009). MIT2006/02 Final report: Mitigating seabird net captures in trawlfisheries. Department of Conservation, Wellington, New Zealand. Available fromhttp://www.doc.govt.nz/publications/conservation/marine-and-coastal/conservation-services-programme/csp-reports/archive/2008-2009/mit2006-02-final-report-mitigating-seabird-net-captures-in-trawl-fisheries/
Deepwater Group Ltd. (2009). Vessel Management Plan (VMP) Deepwater Factory Trawler over 28m. Version 4.0.
Deepwater Group Ltd. (2011a). Operating Procedures: Marine Mammals. Version 7. 1 October 2011.
Deepwater Group Ltd (2011b). Reporting operational procedures v5 2011-2012
Department of Conservation (2005). Marine Protected Areas: Policy and Implementation Plan. 25p.
Department of Conservation (2012). Conservation Services Programme Annual Plan 2012/13. 66p.
Dunn A. (2003). Investigation of evidence of area misreporting of landings of ling in LIN 3, 4, 5, 6,and 7 from TCEPR records in the fishing years 1989–90 to 2000–01. Final Research Report.(Unpublished document held by Ministry of Fisheries, Wellington.)
Dunn M.R., Connell A., Forman J., Stevens D.W., and Horn P.L. (2010). Diet of two large sympatricteleosts, the ling (Genypterus blacodes) and hake (Merluccius australis). PLoS ONE 5(10): e13647.doi:10.1371/journal.pone.0013647
Francis, R.; Bell, E.A. (2010). Fisheries risks to the population viability of black petrel (Procellariaparkinsoni). New Zealand Aquatic Environment and Biodiversity Report No. 51. 57 p.
Francis, M. and Sutton, P. (2012). Basking Shark Bycatch Review Final Report (Draft) for DOCContract 4346. 38p.
Francis, M. and Lyon, W. (2012). Review of commercial fishery interactions and populationinformation for eight New Zealand protected fish species. Final Report for DOC Contract 4345. 74p.
Francis, R.I.C.C.; Hurst, R.J.; Renwick, J.A. (2001). An evaluation of catchability assumptions inNew Zealand stock assessments. New Zealand Fisheries Assessment Report 2001/1. 37 p
Francis, R.I.C.C.; Haist, V.; Bull, B. (2003). Assessment of hoki (Macruronus novaezelandiae) in2002 using a new model. New Zealand Fisheries Assessment Report 2003/6. 69 p.
Froude, V.A., and Smith, R. (2004). Area-based restrictions in the New Zealand marine environment.Department of Conservation MCU Report.
Hamilton, S. and Baker, B. (2010). Assessment of the impact of selected fisheries mortality on NewZealand fur seal populations using the Potential Biological Removal (PBR) approach. Latitude 42Environmental Consultants report for the Deepwater Group Ltd. 37p.
Hewitt, J., Julian, K. and Bone, E.K. (2011). Chatham–Challenger Ocean Survey 20/20 Post-VoyageAnalyses: Objective 10 – Biotic habitats and their sensitivity to physical disturbance. New ZealandAquatic Environment and Biodiversity Report No. 81. 36p.
Hobday, A.J., Smith, A., Webb, H., Daley, R., Wayte, S., Bulman, C., et al. (2007). Ecological riskassessment for the effects of fishing: methodology. Unpublished report (R04/1072) held by theAustralian Fisheries Management Authority, Canberra.
Horn, P.L. (1993). Growth, age structure, and productivity of ling, Genypterus blacodes (Ophidiidae),in New Zealand waters. New Zealand Journal of Marine and Freshwater Research 27: 385–397.
Horn P.L. (2005). A review of the stock structure of ling (Genypterus blacodes) in New Zealandwaters. New Zealand Fisheries Assessment Report 2005/59. 41 p.
Horn, P.L. and Ballara, S.L. (2012). A descriptive analysis and CPUE from commercial fisheries forling (Genypterus blacodes) in Fishstocks LIN 2, 3, 4, 5, 6 and 7 from 1990 to 2009. New ZealandFisheries Assessment Report 2012/13. 69 p.
Horn, P.L. and Francis, R.I.C.C. (2013). Stock assessment of ling (Genypterus blacodes) in CookStrait for the 2010–11 fishing year. New Zealand Fisheries Assessment Report 2013/7. 35p.
Horn, P.L. and Sutton, C.P. (2012). Catch-at-age for hake (Merluccius australis) and ling (Genypterusblacodes) in the 2009–10 fishing year and from a trawl survey in summer 2010–11, with a summaryof all available data sets. New Zealand Fisheries Assessment Report 2012/3. 53 p.
Horn, P.L. and Sutton, C.P. (2013). Catch-at-age for hake (Merluccius australis) and ling (Genypterusblacodes) in the 2010–11 fishing year and from trawl surveys in summer 2011–12, with a summary ofall available data sets. New Zealand Fisheries Assessment Report 2013/19. 55p.
Horn, P.L., Dunn, M.R. and Ballara, S.I. (2013). Stock assessment of ling (Genypterus blacodes) onthe Chatham Rise (LIN 3&4) and in the Sub-Antarctic (LIN 5&6) for the 2011–12 fishing year. NewZealand Fisheries Assessment Report 2013/6. 87 p.
Horn P.L. (1993). Growth, age structure, and productivity of ling, Genypterus blacodes (Ophidiidae),in New Zealand waters. New Zealand Journal of Marine and Freshwater Research 27: 385–397.
IUCN. (2010). IUCN Red List of threatened species. version 2010.4. Retrieved 5 December 2010,from http://www.iucnredlist.org.Kazmierow, B., Booth, K. and Mossman, E.,(2011). Commercialfisher’s compliance decision making: Perceptions, experiences, and factors influencing regulatorycompliance. Report prepared for Ministry of Fisheries by Lindis Consulting.
Knight, B., Sinner, J. and Jiant, W. (2011). Sustainability of NZ's deepwater fisheries from anenergetics perspective - an update. Cawthron Institute Report 2044. 42p.
Leach B.F., Boocock A.S. (1993). Prehistoric Fish Catches in New Zealand. British ArchaeologicalReports International Series 584. 38 p.
Leathwick J, Francis M and Julian K (2006). Development of a demersal fish communityclassification for New Zealand’s Exclusive Economic Zone. Prepared for Department ofConservation. NIWA Client Report HAM2006-062. Hamilton.
Leathwick, J.R., Rowden, A, Nodder, S, Gorman, R, Bardsley, S, Pinkerton, M, Baird, S.J., Hadfield,M, Currie, K. and A. Goh. (2009). Benthic-optimised marine environment classification for NewZealand waters. Final Research Report for BEN2006-01. Ministry of Fisheries, Wellington.
Leathwick, J.R., Rowden, A.A., Nodder, S., Gorman, R., Bardsley, S., Pinkerton, M., Baird, S.J.,Hadfield, M., Currie, K. and Goh, A. (2010). Benthic optimised marine environment classification forNew Zealand waters. Final Research Report for Ministry of Fisheries Project BEN2006/01, Objective5. 52 p. Unpublished report held by Ministry of Fisheries, Wellington.
Lock, K. and Lesie, S. (2007). New Zealand’s Quota Management System: A History of the first 20years. Motu working paper 07-02. Motu Economic and Public Policy research.
Løkkeborg S. 2011. Best practices to mitigate seabird bycatch in longline, trawl and gillnetfisheries—efficiency and practical applicability. Marine Ecology Progress Series 435: 285-303.
McKnight, D.G. and Probert, P.K. (1997). Epibenthic communities on the Chatham Rise, NewZealand. New Zealand Journal of Marine and Freshwater Research 31, 505-513.
Middleton, D.A.J. and Abraham, E.R. 2007. The efficacy of warp strike mitigation devices: trails inthe 2006 squid fishery. Final Research Report IPA2006-02, Ministry of Fisheries, Wellington.Available at: http://fs.fish.govt.nz/Page.aspx?pk=113&dk=22910
Ministry of Fisheries. National Fisheries Plan for Deepwater and Middle-depth Fisheries, Part 1A.59p.
Ministry of Fisheries. (2008a). Harvest Strategy Standard for New Zealand Fisheries. 30p.
Ministry of Fisheries (2008b). Identification of candidate stocks for QMS introduction - standards andorganisational procedures. 28p.
Ministry of Fisheries (2008c). QMS introduction process standard - executive summary. 19p.
Ministry of Fisheries (2009a). Compliance Information Sheer 01. Misreporting.
Ministry of Fisheries (2009b) Stakeholder Consultation Process Standard. Ministry of Fisheries
Ministry of Fisheries. (2010a). Introduction of Bladder Kelp Seaweed, Macrocystispyrifera (KBB), inFisheries Management Areas 3 and 4 into the Quota Management System on 1 October 2010.
Ministry of Fisheries. (2010b). Introduction of Patagonian Toothfish (PTO) into the QuotaManagement System on 1 October 2010: Final Advice Paper.
Ministry of Fisheries. (2010c). Research Specifications for the 10-year Research Programme forDeepwater Fisheries. Document dated 28 July 2010.
Ministry of Fisheries (2010d). National Fisheries Plan for Deepwater and Middle-depth Fisheries.
Ministry of Fisheries (2010e). 10 year research Programme for Deepwater Fisheries, Ministry ofFisheries. 148p
Ministry of Fisheries (2010f). Compliance Information Sheet 03. How to monitor the accuracy ofyour reporting.
Ministry of Fisheries (2010g). Compliance Information Sheet 06. Requirements for correct use ofseabird mitigation devices
Ministry of Fisheries (2010h). Compliance Information Sheer 07. Benthic protection areas andseamount closures
Ministry of Fisheries (2010i). Review of regulatory measures and other management controls for 1December 2010. Vol 1: Final Advice Papers and summary recommendations
Ministry of Fisheries (2010j). Review of regulatory measures and other management controls for 1December 2010. Vol 2: Initial Position Paper and submissions
Ministry of Fisheries (2010k). Overview of New Zealand’s Fishery Science Peer Review Processes.Unclassified Ministry of Fisheries June 2010. 24p
Ministry of Fisheries (2010l). Statement of Intent. 1July 2010 to 30 June 2015. Ministry of Fisheries.20p
Ministry of Fisheries.(2011a).Terms of Reference for Fisheries Assessment Working Groups(FAWGs) in 2011. Undated document.
Ministry of Fisheries. (2011b). Review of Sustainability Measures and Other Management Controlsfor Deepwater Fisheries. Final Position Paper - September 2011.
Ministry of Fisheries. (2011c). Operational guidelines for New Zealand’s Harvest Strategy Standard.Revision 1. June 2011.
Ministry of Fisheries. (2011d). Draft policy for addressing the fishing-related mortality of seabirds inNew Zealand fisheries waters. May 2011.
Ministry of Fisheries. (2011e). Annual Operating Plan for Deepwater Fisheries 2011-2012. 71p
Ministry of Fisheries (2011f). Annual Report 2010/11. Ministry of Fisheries 86p Ministry for PrimaryIndustries (2012a). Aquatic Environment and Biodiversity Annual Review 2012. Compiled by theFisheries Management Science Team, Ministry for Primary Industries, Wellington, New Zealand. 387p.
Ministry for Primary Industries (2012b). Annual Operational Plan for Deepwater Fisheries for2012/13. 71p.
Ministry for Primary Industries (2012c). Introduction of all school shark stocks to Schedule 6 of theFisheries Act 1996. Regulatory Impact Statement. 9p.
Ministry for Primary Industries (2012d). National fishing Plan Deepwater and Middle-depth FisheriesPart 1B- Ling, Ministry for Primary Industries (2013a). Fisheries Assessment Plenary, Vol. 1. May2013. 466p.
Ministry for Primary Industries (2013b). Fisheries Assessment Plenary, Vol. 2. May 2013. 474p.
Ministry for Primary Industries (2013c). Fisheries Assessment Plenary, Vol. 3. May 2013. 436p.
New Zealand Gazette (2010). Fisheries Commercial Regulations 2001: Seabird Scaring DevicesCircular 2010 (No. F517). No. 29. New Zealand Government.
Pierre, J.P., Abraham, E.R., Middleton, D.A.J., Cleal, J., Bird, R., Walker, N.A. and Waugh, S.M.(2010). Reducing interactions between seabirds and fisheries: Responses to foraging patchesprovided by fish waste batches. Biological Conservation 143: 2779-2788.
Pinkerton, M.H. (2011a). A balanced trophic model of the Chatham Rise, New Zealand. Accessed at:http://www.niwa.co.nz/sites/default/files/chatham-model_32.pdf
PricewaterhouseCoopers (2008). Fisheries 2013- Vision result areas and action plan
Probert, P.K. and Grove, S.L. (1998). Macrobenthic assemblages of the continental shelf and upperslope off the west coast of South Island, New Zealand. Journal of the Royal Society of New Zealand28, 259-280.
Punt, A. E., Smith, A. D. M., Smith, D. C., Tuck, G. N., and Klaer, N. L. (2013). Selecting relativeabundance proxies for BMSY and BMEY. – ICES Journal of Marine Science, doi.10.1093
Ramm, K. (2010). Conservation Services Programme Observer Report: 1 July 2008 to 30 June 2009.Final Report. 126p.
Ramm, K. (2012a). Conservation Services Programme Observer Report: 1 July 2009 to 30 June 2010.Final Report. 130p.
Ramm, K. (2012b). Conservation Services Programme Observer Report: 1 July 2010 to 30 June 2011.212p.
Richard, Y., Abraham, E.R. and Filippi, D. (2009). Assessment of the risk to seabird populations fromNew Zealand commercial fisheries. Final Research Report prepared for the Ministry of Fisheries(project IPA2009/19, Objective 1 Milestone 4; project IPA2009/20, Objective 1, Milestone 4).
Richards, Y. and Abraham, E.R. (2013a) Risk of commercial fisheries to New Zealand seabirdpopulations. New Zealand Aquatic Environment and Biodiversity Report No. 109. 62p.
Richards, Y. and Abraham, E.R. (2013b) Application of potential biological removal methods toseabird populations. New Zealand Aquatic Environment and Biodiversity Report No. 108. 34p.
Rowe, S.J. (2010). Conservation Services Programme observer report 1 July 2007 to 30 June 2008.DOC Marine Conservation Services Series 4. 98p.
Snelder TH; Leathwick JR; Dey KL; Weatherhead MA; Fenwick GD; Francis MP; Gorman RM;Grieve JM; Hadfield MG; Hewitt JE; Hume T; Richardson KM; Rowden AA; Uddstrom MJ; Wild M;Zeldis JR (2005) The New Zealand Marine Environment Classification. Ministry for theEnvironment. Wellington.
Snelder TH; Leathwick JR; Dey KL; Rowden AA; Weatherhead MA; Fenwick GD; Francis MP;Gorman RM; Grieve JM; Hadfield MG; Hewitt JE; Richardson KM; Uddstrom MJ; Zeldis JR (2006).Development of an ecological marine classification in the New Zealand region. EnvironmentalManagement 39: 12–29.
Stevens, D.; Smith, M.H.; Grimes, P.; Devine, J.; Sutton, C.; MacGibbon, D.; Ó Maolagáin, C.(2010). Age, growth, and maturity of four New Zealand rattail species. New Zealand AquaticEnvironment and Biodiversity Report No. 59. 39p.
Stevens, D.W., Hurst, R.J. and Bagley, N.W. (2011). Feeding habits of New Zealand fishes: aliterature review and summary of research trawl database records 1960 to 2000. New Zealand AquaticEnvironment and Biodiversity Report No. 85. 218p.
Stevens, D.W.; O’Driscoll, R.L.; Dunn, M.R.; Ballara, S.L.; Horn, P.L. (2012). Trawl survey of hokiand middle depth species on the Chatham Rise, January 2011 (TAN1101). New Zealand FisheriesAssessment Report 2012/10. 98 p.
Thompson, F.N., Berkenbusch, K. and Abraham, E.R. (2013a). Marine mammal bycatch in NewZealand trawl fisheries, 1995–96 to 2010–11. New Zealand Aquatic Environment and BiodiversityReport No. 105. 77p.
Thompson, F.N., Abraham, E.R. and Berkenbusch, K. (2013b). Common dolphin (Delphinus delphis)bycatch in New Zealand commercial trawl fisheries. PLoS ONE 8(5): e64438.doi:10.1371/journal.pone.0064438.
Thrush, S.F. and Dayton, P.K. (2002). Disturbance to marine benthic habitats by trawling anddredging: implications for marine biodiversity. Annual Review of Ecology and Systematics 33: 449-473.
Tuck, I., Cole, R. and Devine, J. (2009). Ecosystem indicators for New Zealand fisheries. AquaticEnvironment and Biodiversity Report No. 42. Ministry of Fisheries
PI 1.1.1The stock is at a level which maintains high productivity and has a lowprobability of recruitment overfishing
Scoring Issue SG 60 SG 80 SG 100
a
Gu
idep
ost It is likely that the
stock is above thepoint whererecruitment would beimpaired.
It is highly likely thatthe stock is above thepoint where recruitmentwould be impaired.
There is a high degree ofcertainty that the stock is abovethe point where recruitmentwould be impaired.
Met? Y Y Y
LIN 3&4 Chatham Rise
The current biomass for the Chatham Rise stock as a percentage of B0 is 55%,which is well above the target reference point (40%). The 95% credible interval (44–71%) also excludes the current limit reference points. As a result, the latest Plenaryreport noted that B2011 was Exceptionally Unlikely (< 1%) to be below both the Softand Hard Limits. A score of 100 is given.
LIN 5&6 Sub-Antarctic (excl Bounty Plateau)
The current biomass for the Sub-Antarctic stock as a percentage of B0 is 89%,which is above the target reference point (40%). The 95% credible interval (69–100%) also excludes the current limit reference points. As a result, the latestPlenary report noted that B2011 was Exceptionally Unlikely (< 1%) to be below theSoft or Hard Limits. A score of 100 is given.
LIN 6B Bounty Plateau
The last stock assessment for this region was updated in 2007. The biomass B2006
for the Bounty Plateau stock as a percentage of B0 is 61%, which is above thetarget reference point (40%). The 95% credible interval (45–79%) also excludes thecurrent limit and target reference points. B2006 was Exceptionally Unlikely (< 1%) tobe below the Hard Limit and very unlikely to be below the soft limit (<10%).Projections at 600 t per year showed that the stock was very unlikely (<10%) to bebelow the soft and hard limits. Projections out to 2011 (~current) showed a declinein biomass was likely but that at those catch levels (600 mt) the stock was unlikelyto fall below the soft limit (B2011 = 26-116%B0). A score of 100 is given.
LIN 7WC West Coast South Island
The current biomass for the West Coast South Island stock as a percentage of B0 is71%, which is above the target reference point (40%). The 95% credible interval(56–85%) also excludes the current limit reference points. As a result, the latestPlenary report noted that B2012 was Exceptionally Unlikely (< 1%) to be below theSoft or Hard Limits. A score of 100 is given.
LIN 7CK Cook Strait
The 2010 estimated biomass for the Cook Strait stock (7CK) as a percentage of B0
is 54%, which is above the target reference point (40%). The 95% credible interval(23–80%) also excludes the current limit reference points, noting that the level ofuncertainty is wide. As a result, the latest Plenary report noted that B2010 wasExceptionally Unlikely (< 1%) to be below the Soft or Hard Limits. It is noted that the2013 assessment was rejected due to an inability to reflect CPUE (and henceresource abundance) declines, and the 2010 assessment was used for advice.Following that year, the plenary document shows longline CPUE has declined.
PI 1.1.1The stock is at a level which maintains high productivity and has a lowprobability of recruitment overfishing
Ju
sti
ficati
on
Projections under the higher of two alternative future catch levels indicated a 10%chance of falling below the soft limit by 2015, and a 2% chance of falling below thehard limit. While there remains some uncertainty over current status, the 2% riskmeets the MSC definition of a 'high degree of certainty' (95th percentile) and ascore of 100 is given.
b
Gu
idep
ost
The stock is at orfluctuating around itstarget reference point.
There is a high degree ofcertainty that the stock hasbeen fluctuating around itstarget reference point, or hasbeen above its target referencepoint, over recent years.
Met? Y Y (N - LIN6B, LIN 7CK)
LIN 3&4 Chatham Rise
The current biomass for the Chatham Rise stock as a percentage of B0 is 55%,which is well above the target reference point (40%). The Plenary report notes thatthe stock is Very Likely (> 90%) to be at or above the target, while the assessmentindicates the stock has been above the target level since the start of the time series.While the biomass of the Chatham Rise stock was uncertain, the current catch wasfelt unlikely to decline based on projection results, and exceptionally unlikely (<1%)to fall below the soft limit. A score of 100 is therefore given.
LIN 5&6 Sub-Antarctic (excl Bounty Plateau)
The current biomass for the Sub-Antarctic (excl Bounty Plateau) stock as apercentage of B0 is 89%, which is well above the target reference point (40%). ThePlenary report notes that the stock is virtually certain (> 99%) to be at or above thetarget, while the assessment indicates the stock has been above the target levelsince the start of the time series. The biomass of the Sub-Antarctic stock waspredicted to improve under recent catch levels or the TACC, and was exceptionallyunlikely (<1%) to fall below the soft limit. A score of 100 is therefore given.
LIN 6B Bounty Plateau
The current biomass for the Bounty Plateau stock as a percentage of B0 is 61%,which is well above the target reference point (40%). The Plenary report notes thatthe stock is very likely (> 90%) to be at or above the target, while the assessmentindicates the stock has been above the target level since the start of the time series.The biomass of the Bounty Plateau stock was predicted to continue decliningslightly over the next 5 years at recent average catch levels, and was very unlikely(<10%) to fall below the soft limit. However, the historical nature of this assessmentincreases the uncertainty over the stock status and a score of 80 is given.
LIN 7WC West Coast South Island
The current biomass for the West Coast South Island stock as a percentage of B0 is71%, which is well above the target reference point (40%). The Plenary report notesthat the stock is very likely (> 90%) to be at or above the target, while theassessment indicates the stock has been above the target level since the start ofthe time series. No projections were reported in the assessment, however the lowerbounds of the current status estimates are well above the target and limit levels. Ascore of 100 is therefore given.
PI 1.1.1The stock is at a level which maintains high productivity and has a lowprobability of recruitment overfishing
Ju
sti
ficati
on
LIN 7CK Cook Strait
The 2010 biomass for the Cook Strait stock as a percentage of B0 is 54%, which iswell above the target reference point (40%). The Plenary report notes that the stockis likely (> 60%) to be at or above the target, while the assessment indicates thestock has been above the target level since the start of the time series. Thebiomass of the Cook Strait stock was predicted to improve slightly over the next 5years at a catch level equivalent to that since 2006, or remain relatively constant ata catch equivalent to the mean since 1990, and was very unlikely (<10%) to fallbelow the soft limit. Recent catches have been around the level of 140 mt, lowerthan either of the two future scenarios examined. However, the historical nature ofthis assessment increases the uncertainty over the stock status and a score of 80 isgiven.
OVERALL PERFORMANCE INDICATOR SCORE: All of the scoring issues ofthe 60, 80 and 100 scoring guideposts are met for all stocks except LIN6Band LIN 7CK which do not achieve one of the two SG100 scoringguideposts. The final score is 100 for all stocks except LIN6B and LIN 7CK,where the score is 90.
PI 1.1.2 Limit and target reference points are appropriate for the stock
Scoring Issue SG 60 SG 80 SG 100
a
Gu
idep
ost
Generic limit andtarget reference pointsare based onjustifiable andreasonable practiceappropriate for thespecies category.
Reference points areappropriate for thestock and can beestimated.
Met? Y Y
Ju
sti
ficati
on
The Management Target (0.4B0) is consistent with maintaining the stock at a BMSY
proxy level (and is often above the BMSY level calculated under deterministicconsiderations). The limit reference point on which this re-assessment is based (thesoft limit of 0.2B0) is at 50% of the Management Target. The values for the B0
reference points are calculated as part of the stock assessment. The referencepoints are therefore appropriate for the stocks and can be estimated. A score of 80is given.
b
Gu
idep
ost
The limit referencepoint is set above thelevel at which there isan appreciable risk ofimpairing reproductivecapacity.
The limit reference point is setabove the level at which thereis an appreciable risk ofimpairing reproductive capacityfollowing consideration ofprecautionary issues.
Met? Y N
Ju
sti
ficati
on
Given the assumed form of the stock-recruitment relationship (Beverton-Holt) andthe assumed extent of compensation (a steepness of 0.9), the hard limitcorresponds to a reduction in expected recruitment from virgin levels of around 40%and the soft limit to a reduction in expected recruitment from virgin levels of 25%.Given the nature of time-series of stock and recruitment for ling, it is currently notpossible to estimate steepness. However, steepness estimates for similar speciestend to be higher than 0.75. The limit reference point is therefore above the level atwhich there is an appreciable risk of impairing reproductive capacity.
However, the hard and soft limits are defaults under the harvest strategy standard.There is no evidence that they were selected to be deliberately precautionary; thelimit reference point does not take account of the uncertainty in estimating B0 orcurrent biomass. A Score of 80 is given.
c
Gu
idep
ost
The target referencepoint is such that thestock is maintained at alevel consistent withBMSY or some measureor surrogate withsimilar intent oroutcome.
The target reference point issuch that the stock ismaintained at a level consistentwith BMSY or some measure orsurrogate with similar intent oroutcome, or a higher level, andtakes into account relevantprecautionary issues such asthe ecological role of the stockwith a high degree of certainty.
PI 1.1.2 Limit and target reference points are appropriate for the stock
Ju
sti
ficati
on
40% B0 is often used as a proxy for MSY, and is the basis for the Harvest StrategyStandard. This level may be higher than the actual MSY for a stock, althoughcalculations for the stock and fleet combinations are not readily available. Thisapparent discrepancy is primarily because these estimates are based on theassumption of perfect information about the fishery and the population, andbecause targeting a deterministic BMSY would lead to an undesirably high probabilityof breaching the soft limit (as noted in stock assessment documents). TheManagement Target is precautionary in the sense that it reduces the risk of thestock dropping below the soft and hard limits, and the target reference point willmaintain the stock above BMSY. Given that ling is not considered a keystone specieswithin the food web and ecology of New Zealand's waters, this level should maintainecological integrity. A score of 100 is therefore given.
d
Gu
idep
ost
For key low trophiclevel stocks, the targetreference point takesinto account theecological role of thestock.
Met? Not relevant
Ju
sti
ficati
on
Ling does not satisfy the criteria for a LTL species: (a) family Ophidiidae does notappear in the list of “key LTL species” in MSC Certification Requirements, and (b)the diet of ling is not predominantly plankton and ling do not have the biologicalcharacteristics of LTL species identified in the MSC Certification Requirements.
References
Horn and Francis, 2013
Horn et al., 2013
MPI, 2013a
Punt et al., 2013
Ministry of Fisheries, 2008
MSC, 2012
OVERALL PERFORMANCE INDICATOR SCORE: The score is 90 because all of the scoringissues for the 80 scoring guidepost are met as is one of the two scoring issues for the 100 scoringguidepost.
PI 1.1.3Where the stock is depleted, there is evidence of stock rebuilding within aspecified timeframe
Scoring Issue SG 60 SG 80 SG 100
a
Gu
idep
ost
Where stocks aredepleted rebuildingstrategies, which havea reasonableexpectation ofsuccess, are in place.
Where stocks are depleted,strategies are demonstrated tobe rebuilding stockscontinuously and there is strongevidence that rebuilding will becomplete within the specifiedtimeframe.
Met? (Y/N) (Y/N)
Ju
sti
ficati
on
These stocks are currently above the target reference point level, so rebuilding isnot necessary and this performance indicator does not apply.
b
Gu
idep
ost
A rebuilding timeframeis specified for thedepleted stock that isthe shorter of 30 yearsor 3 times itsgeneration time. Forcases where 3generations is lessthan 5 years, therebuilding timeframe isup to 5 years.
A rebuilding timeframeis specified for thedepleted stock that isthe shorter of 20 yearsor 2 times itsgeneration time. Forcases where 2generations is less than5 years, the rebuildingtimeframe is up to 5years.
The shortest practicablerebuilding timeframe isspecified which does notexceed one generation time forthe depleted stock.
Met? (Y/N) (Y/N) (Y/N)
Ju
sti
ficati
on
N/A
c
Gu
idep
ost
Monitoring is in placeto determine whetherthe rebuildingstrategies are effectivein rebuilding the stockwithin a specifiedtimeframe.
There is evidence thatthey are rebuildingstocks, or it is highlylikely based onsimulation modelling orprevious performancethat they will be able torebuild the stock withina specified timeframe.
PI 1.2.1 There is a robust and precautionary harvest strategy in place
Scoring Issue SG 60 SG 80 SG 100
a
Gu
idep
ost
The harvest strategy isexpected to achievestock managementobjectives reflected inthe target and limitreference points.
The harvest strategy isresponsive to the stateof the stock and theelements of the harveststrategy work togethertowards achievingmanagementobjectives reflected inthe target and limitreference points.
The harvest strategy isresponsive to the state of thestock and is designed toachieve stock managementobjectives reflected in the targetand limit reference points.
Met? Y Y Y
Ju
sti
ficati
on
The harvest strategy for ling is consistent with the New Zealand Harvest StrategyStandard, HSS. The strategy aims to “provide a consistent and transparentframework for setting fishery and stock targets and limits and associated fisheriesmanagement measures, so that there is a high probability of achieving targets, avery low probability of breaching limits, and acceptable probabilities of rebuildingstocks that nevertheless become depleted, in a timely manner”. The harveststrategy standard specifies probabilities for each of these outcomes and includesthe definition of (a) a target level about which a fishery or stock should fluctuate, (b)a soft limit that triggers a requirement for a formal, time-constrained rebuilding plan,and (c) a hard limit below which fisheries should be considered for closure.
The HSS requires a rebuilding plan when a stock is depleted to be below the softlimit (or fishery closure if the stock is estimated to be below the hard limit). Thiscontrasts with the MSC guidelines for PI 1.1.3 which consider a stock to bedepleted when it is consistently below the target reference point. However, underthe HSS objectives, management measures and controls should result in the stockfluctuating about the target level. How that is to be achieved for stocks between thetarget and soft limit is not explicitly prescribed in the HSS. A recent managementdecision for scampi illustrates management actions for a stock projected to dropbelow the soft limit, suggesting that the harvest strategy will react before a stockdrops below the limit reference point.
The harvest strategy standard was established following extensive consultation andreview (including international peer-review of a draft of the standard). A review wasundertaken in 2007 of the fisheries stock assessment process and the sustainabilityadvice, and found that broadly the process worked well. Some weaknesses inimplementation were also identified.
The stock assessment documents report stock status relative to the referencepoints and quantify the implications of future TACC levels. It is noted that thestandard does not address issues pertinent to multispecies catches, since ling istaken as bycatch in the hoki trawl fishery. However, it should be noted that theTACC, ACE and Deemed Value system provides a flexible framework which shouldin theory allow management of these issues.
The harvest strategy is therefore responsive to the state of the stock and isdesigned to achieve stock management objectives, as reflected by the target andlimit reference points. A score of 100 is given.
PI 1.2.1 There is a robust and precautionary harvest strategy in place
bG
uid
ep
ost
The harvest strategy islikely to work based onprior experience orplausible argument.
The harvest strategymay not have beenfully tested butevidence exists that itis achieving itsobjectives.
The performance of the harveststrategy has been fullyevaluated and evidence existsto show that it is achieving itsobjectives including beingclearly able to maintain stocksat target levels.
Met? Y Y N
Ju
sti
ficati
on
The implementation of the proposed harvest strategy for all ling stocks includes: (a)a stock assessment estimating the current biomass (b) a precautionary regionbetween the soft limit reference point and the hard limit reference points where aformal rebuild strategy is needed, (c) fishery closure to be considered if the stock isbelow the hard limit. The harvest strategy is not specified as a mathematicalfunction.
Under an Adaptive Management Programme proposal for the 1994–95 fishing year,TACCs for LIN 3 and 4 were increased to 2810 and 5720 t, respectively. Thesestocks were removed from the AMP from 1 October 1998, with TACCs maintainedat the increased level. However, from 1 October 2000, the TACCs for LIN 3 and 4were reduced to 2060 and 4200 t, respectively. The TACC for LIN 3 was exceededin the mid-1990s, and in the early 2000s following the reduction, but have beenexceeded slightly in one year since then. In LIN 4 the TACC has not been exceededsince it was reduced, and the TACC is not currently limiting the fishery.
From 1 October 2004, the TACCs for LIN 5 and LIN 6 were increased by about 20%to 3595 t and 8505 t, respectively. The TACC in LIN 5 has been exceeded in fourout of eight years since it was increased in 2004-05, by a maximum of 15%, whilethat in LIN 6 has not been exceeded since that time.
From 1 October 2009, the TACC for LIN 7 was increased from 2225 t to 2474 t. Allother TACC increases since 1986–87 in all stocks are the result of quota appeals.The catch has exceeded the TACC in the majority of years. The decline in catches(still above the TACC) in recent years may at least in part be due to the reducedhoki exploitation rate which is undergoing rebuilding, and increases in the TACC forthat species are mirrored by increases in LIN7 catches in recent years.
The quota management areas frequently does not quite coincide with the specificstock assessments, in particular that of LIN 6 and 7, which have been separatedinto sub-units. This is accounted for in the assessment and this has not caused adetectable stock management problem.
The strategy has not been fully tested, preventing a higher score under thisindicator. Although stock assessments are not annual, stock status indices(primarily catches and age compositions, with intermittent fishery-independentsurveys in the case of LIN 4 & 7, but including abundance indices for LIN 4; see PI1.2.3) are updated each year for monitoring purposes. This level of monitoringshould detect significant problems created by the harvest strategy. However, theimplications of uncertainty on the performance of the harvest strategy have notbeen evaluated formally and the harvest strategy has not been in place sufficientlylong that it is possible to evaluate its performance empirically. Evidence exists thatmanagement is prepared to apply controls consistent with the harvest strategystandard. This appears to be consistent with the relative risks posed to these stocksby the fishery.
While the HSS recognizes the value of MSE to evaluate harvest strategies, MSEhas not been used for New Zealand ling stocks. Specifically, given that the harveststrategy is not mathematically specified, any MSE evaluation can only beapproximate. Thus, it is premature to conclude that the harvest strategy has beenfully evaluated. A score of 80 is given.
PI 1.2.1 There is a robust and precautionary harvest strategy in place
cG
uid
ep
ost
Monitoring is in placethat is expected todetermine whether theharvest strategy isworking.
Met? Y
Ju
sti
ficati
on
Fishery-dependent and –independent data are available to monitor trends inabundance as well as the age- and sex-structure of the populations and theremovals from the population. These data are included in the stock assessment,which estimates stock status relative to limit and target reference points. A plan is inplace which determines future levels of monitoring (surveys and sampling for ageand length; see the 10 year research plan for Deepwater Fisheries). Thus,monitoring is in the place that is expected to determine whether the harvest strategyis working. The fishery passes the 60 level.
d
Gu
idep
ost
The harvest strategy isperiodically reviewed andimproved as necessary.
Met? Y
Ju
sti
ficati
on
The HSS was published in 2008, and represents the current constraints on theharvest strategy. The guidelines for applying the HSS were revised in 2011. Themajor changes to the document relate to metrics for quantifying fishing intensity aswell as to the roles and responsibilities of Science Working Groups and fisheriesmanagers. For specific stocks, TACC levels for ling have been changed, along withchanges in hoki TACC but as noted above do not appear to constrain the fishery.However, the harvest strategy for ling has evolved over time, with the developmentof formal limits and target reference points, demonstrating that the harvest strategyhas been reviewed periodically and revised. A score of 100 is therefore given.
e
Gu
idep
ost
It is likely that sharkfinning is not takingplace.
It is highly likely thatshark finning is nottaking place.
There is a high degree ofcertainty that shark finning isnot taking place.
Met? Not relevant Not relevant Not relevant
Sharks are not a target species, hence this element is not scored.
References
Ministry of Fisheries, 2008
Ministry of Fisheries, 2010c
Ministry of Fisheries. 2011a, b, c
MSC. 2012
OVERALL PERFORMANCE INDICATOR SCORE: The score is 95 because all of thescoring issues for the 80 scoring guidepost are met as are two of the three scoringissues for the 100 scoring guidepost.
PI 1.2.2 There are well defined and effective harvest control rules in place
Scoring Issue SG 60 SG 80 SG 100
a
Gu
idep
ost
Generally understoodharvest rules are inplace that areconsistent with theharvest strategy andwhich act to reducethe exploitation rate aslimit reference pointsare approached.
Well defined harvestcontrol rules are inplace that areconsistent with theharvest strategy andensure that theexploitation rate isreduced as limitreference points areapproached.
Met? Y Y
Ju
sti
ficati
on
The harvest control rule for New Zealand ling is comprised of “Management actionsdetermined by the results of a series of forward projections under a range of catchassumptions, guided by the biological reference points”. The harvest control rule isnot a catch control rule (a mathematical function which pre-determines TACCsbased on stock status relative to limit and target reference points). Rather theharvest control rules are consequences of the requirements of the Fisheries Act1996 and Harvest Strategy Standard.For this PI, and consistent with the hoki certification, the harvest control rule isinterpreted as comparing estimated stock status with the soft and hard limits,implementing a rebuilding plan if the stock is assessed to be below the soft limit,considering the fishery for closure if the stock is below the hard limit, and using 5-year projections to assess future stock status given assumptions regarding futurerecruitment, TACCs and catch limits for the western and eastern stocks. The HSSindicates that the probability of breaching the soft limit should not exceed 10%.While the harvest strategy standard recognizes the need for action when stocks arebelow targets, but above the soft limit, consistent with the MSC standard, it lacksdetails on exactly how the exploitation rate will be reduced below the soft limit (thedeemed value system may make actual control difficult). The short-termconsistency of TACC levels with the target biomass (0.4 B0) is identified throughprojections. In practice, TACCs have remained by default at the same level unlessthere is a practical need to change them. However, action has been demonstratedin other fisheries; e.g. the TACC for scampi was reduced in 2011 when stock wasprojected to drop between the target and limit reference points. Thus, the harvestrules are well defined and consistent with the harvest strategy and will act to reducethe exploitation rate as the limit reference point is approached. A score of 80 isgiven.
b
Gu
idep
ost The selection of the
harvest control rulestakes into account themain uncertainties.
The design of the harvestcontrol rules takes into accounta wide range of uncertainties.
PI 1.2.2 There are well defined and effective harvest control rules in place
Ju
sti
ficati
on
The assessment is based on a series of scenarios which capture the mainassessment-related uncertainties. Short-term projections are undertaken for asubset of these scenarios, using specific scenarios for future catch, and thoseprojections account for uncertainty regarding future recruitment (by drawing onestimated historical recruitments, which while ignoring the potential change in futurerecruitment due to the stock-recruitment relationship is not unreasonable given anassumed steepness of 0.9 and the longevity of the species). The results of theprojections are expressed in terms of probabilities of failing to achieve variousgoals. Thus, the selection of the harvest control rules takes into account the mainuncertainties related to stock status and conducting projections. However, while theharvest strategy standard provides a formal and well specified process for settingharvest regulations and is designed so that a range of uncertainties can beaccounted for, the uncertainty examined within the stock assessment and projectionprocess for ling cannot be said to be 'wide', given the potential for structural andbiological uncertainties noted within the assessment documents. A score of 80 isgiven.
c
Gu
idep
ost
There is someevidence that toolsused to implementharvest control rulesare appropriate andeffective in controllingexploitation.
Available evidenceindicates that the toolsin use are appropriateand effective inachieving theexploitation levelsrequired under theharvest control rules.
Evidence clearly shows that thetools in use are effective inachieving the exploitation levelsrequired under the harvestcontrol rules.
Met? Y Y N
Ju
sti
ficati
on
The main tools used to implement the harvest control rules are the TACC. A systemof deemed values is used to deter or deal with catches over quota. There are otherways to handle over catch by individual operators, e.g. purchase of ACE from otherquota holders. However, the deemed value also discourages discarding, animportant attribute where ling is taken as retained non-target species in the muchlarger hoki fishery. The estimated catch has generally been less than the TACCsince 2005, the exceptions being in regions LIN 5 and LIN 7, and generally do notconstrain catches. Persistent over-catch of TACC would lead to reviews of thecauses and if necessary controlling mechanism (e.g. deemed value to discourageover-catch). Overall, it is not yet clear how effective the tools will be during currenthoki rebuilding, when the quota value would become very high if the ling quotaconstrains the hoki fishery. While available evidence shows that the tools used toimplement harvest control rules are appropriate and effective in controllingexploitation, clearer evidence under developing conditions within the fishery shouldbe provided over the coming years. A score of 80 is given.
ReferencesMinistry of Fisheries, 2008
Ministry of Fisheries, 2011a, b
MPI, 2013a,b,c
OVERALL PERFORMANCE INDICATOR SCORE: All of the scoring issues for the 80scoring guidepost are met.
PI 1.2.3 Relevant information is collected to support the harvest strategy
Scoring Issue SG 60 SG 80 SG 100
a
Gu
idep
ost
Some relevantinformation related tostock structure, stockproductivity and fleetcomposition isavailable to supportthe harvest strategy.
Sufficient relevantinformation related tostock structure, stockproductivity, fleetcomposition and otherdata is available tosupport the harveststrategy.
A comprehensive range ofinformation (on stock structure,stock productivity, fleetcomposition, stock abundance,fishery removals and otherinformation such asenvironmental information),including some that may not bedirectly related to the currentharvest strategy, is available.
Met? Y Y N
The report of the Stock Assessment Plenary (and individual stock assessmentreports) summarizes information on stock structure and biology of ling, includinggrowth, natural mortality and maturity. Stock abundance is estimated from a stockassessment, which requires data on catches, abundance indices, age and sizecomposition. Otolith ageing has been validated. Sufficient data are all available toobtain good estimates of stock abundance from the assessment. Information on allvessels is held through a registry and licence system. Vessel activity is monitoredthrough VMS and an observer programme. Monitoring of information not directlyused in the harvest strategy includes mapping of spawning aggregations, remotesensing environmental change, productivity, physical oceanographic processes andbathymetry.
1. Stock structure. Ling are managed as eight administrative QMAs, althoughfive of these (LIN 3, 4, 5, 6, and 7) currently produce about 95% of landings.Research has indicated that there are at least five major biological stocks of ling inNew Zealand waters: the Chatham Rise, the Sub-Antarctic (including the Stewart-Snares shelf and Puysegur Bank), the Bounty Platform, the west coast of the SouthIsland, and Cook Strait. The stock assessment process recognises these stocksand combines QMAs accordingly. Analysis of morphometrics, genetics and lifthistory characteristics underpins these divisions, although it appears unlikely thatthe stocks are genetically distinct.
2. Productivity. Data on growth rates are available from age and growthstudies, fecundity-at-size has been estimated for the stocks, although someparameters are shared with neighbouring stocks (e.g. LIN 6B uses LIN 3 & 4maturity ogives). Natural mortality estimates have been estimated using empiricalapproaches and also within the assessment model, but in common with mostassessments is kept constant over time. Understanding of the drivers of recruitmentremains poor, and consequently the assessment conducts projections where futurerecruitment is sampled from historical estimates.
3. Fleet composition. The total effort in the fishery is known, andcomprehensive data are available at fine spatial scales. Although detailedinformation is available on catch and effort, including gear type and location, thisinformation is generally not used to construct an index of abundance that is used inthe stock assessment, primarily because of the availability of fishery-independentdata sources. However, commercial CPUE time series have been developed forthose regions where fishery-independent time series are absent or intermittent.
4. A variety of other data sources (diet, environmental conditions etc.) is alsoavailable for use in assessments and other analyses.
PI 1.2.3 Relevant information is collected to support the harvest strategy
Ju
sti
ficati
on
Thus, relevant information related to stock structure, stock productivity and fleetcomposition is available to support the harvest strategy. However, while there isconsiderable information on the biology of ling in New Zealand, sufficient data gapsremain (e.g. environmental influences, movement) that it cannot be concluded thatthe range of information available is comprehensive. A score of 80 is thereforegiven.
b
Gu
idep
ost
Stock abundance andfishery removals aremonitored and at leastone indicator isavailable andmonitored withsufficient frequency tosupport the harvestcontrol rule.
Stock abundance andfishery removals areregularly monitored at alevel of accuracy andcoverage consistentwith the harvest controlrule, and one or moreindicators are availableand monitored withsufficient frequency tosupport the harvestcontrol rule.
All information required by theharvest control rule is monitoredwith high frequency and a highdegree of certainty, and there isa good understanding ofinherent uncertainties in theinformation [data] and therobustness of assessment andmanagement to this uncertainty.
Met? Y Y Y: LIN 3&4, LIN 5&6 and LIN7WC only
While extensive survey time series is available from regions LIN 3 & 4 and LIN 5 &6, supplemented with standardised longline CPUE indices, and LIN 7WC, it is notedthat the survey has changed over time. The assessment allows for the samplingerrors associated with the survey data and catch samples, as well as additionalvariance based on the methodology of Francis (2001).
The sampling coefficients of variation, CVs, of the abundance indices range from0.05 to 0.46, with estimates commonly in the range of 0.05-0.2, while that of thecommercial time series vary between 0.03 and 0.36, with some CVs being fixed at0.04. Additional variance (“process error”) is usually added to these CVs to accountfor unquantified uncertainty between stock abundance and the abundance indices.
Removals are estimated by region and fishery, and information on age and lengthare sampled from the catches and the surveys. Catches are regularly sampled forage and structure, and analyses account for the sampling protocol whenassembling the data for use in the stock assessment. Length- and age-frequenciesare based on '00s of measurements and otoliths of fish each survey.
It is believed that up to the mid-1990s some ling bycatch from the west coast hokifishery was not reported. Estimates of total catch including non-reported catch areincluded within the assessment. It is also believed that in recent years, some catchfrom LIN 7 has been reported against other ling stocks (probably LIN 3, 5, and 6).The likely levels of misreporting are moderate, being about 250–400 t in each yearfrom 1989–90 to 1991–92. Estimates of recreational catch are available, while thereare none on customary non-commercial catches. There is likely to be somemortality associated with escapement from trawl nets, but the level is not knownand is assumed to be negligible.
For LIN 3&4, LIN 5&6, the information required by the harvest control rule ismonitored with high frequency and a high degree of certainty, and there is a goodunderstanding of inherent uncertainties in the data and the robustness of theassessment and management to this uncertainty. A score of 100 is given.
PI 1.2.3 Relevant information is collected to support the harvest strategy
Ju
sti
ficati
on
For LIN 7CK (considered part of LIN 7 here), the lack of fishery-independentsurveys is a gap where the harvest control rule requires high accuracy and thestock assessment method used to achieve this accuracy seems to require explicitabundance indices. This suggests that while stock abundance and fishery removalsare regularly monitored at a level of accuracy and coverage consistent with theharvest control rule, and one or more indicators are available and monitored withsufficient frequency to support the harvest control rule, while the sources ofuncertainty are understood, the information cannot be said to have a high degree ofcertainty. A score of 80 is therefore given for LIN 7.
c
Gu
idep
ost There is good
information on all otherfishery removals fromthe stock.
Met? Y
Ju
sti
ficati
on Catches by gears other than trawl are negligible. The landed catches by Maori for
customary purposes and by recreational fishers are considered negligible and/orestimated. Catches by all commercial fishing sectors (including non-ling fisheries)are counted against the TACC. Thus, there is good information on all fisheryremovals from the stocks. A score of 80 is given.
References
Colman, 1998a, b
Bagley et al., 2013
Francis et al., 2001
Francis et al., 2003
MPI 2013a,b,c
Horn, 2005
Horn and Francis, 2013
Horn et al., 2013
Dunn, 2003
OVERALL PERFORMANCE INDICATOR SCORE: All LIN areas meet thescoring issues at SG80. One 100 scoring guidepost is met in LIN 3&4, LIN5&6, and hence they score 90
PI 1.2.4 There is an adequate assessment of the stock status
Scoring Issue SG 60 SG 80 SG 100
a
Gu
idep
ost
The assessment isappropriate for thestock and for theharvest control rule.
The assessment is appropriatefor the stock and for the harvestcontrol rule and takes intoaccount the major featuresrelevant to the biology of thespecies and the nature of thefishery.
Met? Y Y
Ju
sti
ficati
on
The latest assessments for each stock were carried out in 2011-2013, dependentupon the stock, using an age-structured CASAL model with Bayesian estimation ofposterior distributions. The exceptions are LIN 6B and LIN 7CK, where the lastaccepted assessments were in 2007 and 2010 respectively.
The assessment uses fishery independent abundance indices (or primarilycommercial catch indices in some areas), catch-at-age from the commercial fisheryand trawl surveys, and estimates of biological parameters. The population modelcan account for the biology of different sexes, as applied in most ling assessments.Stock structure has been examined using genetics, morphology and sizecomposition, so that appropriate size selectivity and stock structure is used in themodel.
There is no formal (i.e. mathematical) harvest control rule for New Zealand ling.Rather, decisions regarding the TACC is based on stock status as it assessedrelative to biomass-based reference points. The projections conducted for current oralternative levels of future catches are adequate to inform decision makersregarding changes in (relative) abundance (stock status is not generally well knownin absolute terms). The assessment is appropriate for the stock and the harvestcontrol rules. However the assessment is seen to be sensitive to the assumptionsmade on the biological structure (sex separation, natural mortality, etc., e.g. in LIN3&4) within the model, although relative outputs for LIN 3&4 were reasonably robustto these uncertainties. Given the assessments examine the major features relevantto the biology of ling, a score of 100 is given.
b
Gu
idep
ost The assessment
estimates stock statusrelative to referencepoints.
Met? Y
Ju
sti
ficati
on
The stock assessment provides estimates of spawning biomass relative to (a) thesoft and hard limits (0.1 and 0.2B0), (b) where it has been estimated/reported (forsome stocks) estimates of BMSY values under the assumption of deterministicdynamics, and (c) the Management Target (0.4 B0). Thus, the assessmentestimates stock status relative to reference points, and meets the SG.
PI 1.2.4 There is an adequate assessment of the stock status
cG
uid
ep
ost The assessment
identifies majorsources of uncertainty.
The assessment takesuncertainty intoaccount.
The assessment takes intoaccount uncertainty and isevaluating stock status relativeto reference points in aprobabilistic way.
Met? Y Y Y
Ju
sti
ficati
on
The assessment is based on the CASAL package, which accounts for bothobservation and process error. Each assessment includes sensitivity tests (“runs”)which explore key uncertainties. Uncertainty is explored in the report of the StockAssessment Plenary, but in greater detail within the stock assessment reportsreviewed by the Fisheries Assessment Working Group, which includes somestructural uncertainty. The report of the Stock Assessment Plenary does contains a'major sources of uncertainty' section, and the outputs of alternative runs are notedin a 'qualifying comments' section. The Plenary report also identifies uncertaintyregarding recent and future recruitment as key.
The results of the assessment include the probability that the current spawningstock biomass exceeds the hard and soft limits, and the Management Target.Posterior distributions based on MCMC sampling are also provided for currentspawning biomass and for year class strength. The results of the projections includeprobability intervals for future stock size, and the probability of dropping belowvarious biomass levels. Thus, the assessment takes uncertainty into account, and isevaluating stock status relative to reference points in a probabilistic way. A score of100 is given.
It is noted that the choice of a 'key' stock assessment run as the basis formanagement advice, while common practice, does not incorporate the full structuraluncertainty within the assessments.
d
Gu
idep
ost The assessment has been
tested and shown to be robust.Alternative hypotheses andassessment approaches havebeen rigorously explored.
Met? N
Ju
sti
ficati
on
The assessment method, CASAL, has been applied extensively in New Zealandand elsewhere. However, results of, for example, simulation studies exploringestimation performance for CASAL as it is applied to ling are not available. Theassessment considered alternative hypotheses regarding some factors, but allanalyses are within the CASAL framework. Thus, it cannot be concluded that theassessment has been fully tested and alternative assessment approaches arerigorously explored.
e
Gu
idep
ost The assessment of
stock status is subjectto peer review.
The assessment has beeninternally and externally peerreviewed.
PI 1.2.4 There is an adequate assessment of the stock status
Ju
sti
ficati
on
The assessment is reviewed internally at NIWA before review at the Fisheriesassessment working group and publication in the Plenary document. This is theprimary form of peer-review; Fisheries Assessment Working Groups (FAWGs)evaluate relevant research, determine the status of fisheries and fish stocks andevaluate the consequences of alternative future management scenarios. They donot make management recommendations or decisions (this responsibility lies withMPI Fisheries Management and the Minister of Fisheries). These groups are opento the public (see Ministry of Fisheries [2011] for Terms of Reference). The WorkingGroup is chaired by MPI, and includes members from NIWA, MPI, industry andenvironmental NGOs, Thus, the assessment of stock status is subject to peerreview. However, the stock assessments have not been subject to external peerreview. A score of 80 is therefore given.
References
Horn and Francis, 2013
Horn et al., 2013
MPI, 2011a
Bull et al. 2008, 2012
Dunn, 2003
OVERALL PERFORMANCE INDICATOR SCORE: All of the scoring issues for the 80scoring guidepost are met in all regions. Two of the four scoring issues for the 100scoring guidepost are also met.
PI 2.1.1The fishery does not pose a risk of serious or irreversible harm to the retainedspecies and does not hinder recovery of depleted retained species
Scoring Issue SG 60 SG 80 SG 100
a
Gu
idep
ost
Main retained speciesare likely to be withinbiologically basedlimits (if not, go toscoring issue c below).
Main retained speciesare highly likely to bewithin biologicallybased limits (if not, goto scoring issue cbelow).
There is a high degree ofcertainty that retained speciesare within biologically basedlimits and fluctuating aroundtheir target reference points.
Met? Y Y N
Retained species are, by regulation, the Quota Management Species (QMS), whichare enumerated and retained on board (unless 6th schedule species like spinydogfish). The main QMS are the subject of analytical stock assessments and activemanagement that is based upon formalised biologically based limits, whichrepresents a full strategy. For the remaining QMS species, the TACC system, whichaims to limit the overall catch of species, combined with the ‘deemed value’process, represents a partial strategy for these species. For others, the impact ofthe fishery on these species depends upon the extent to which they are caughtwithin the ling trawl and longline fisheries.
For trawls, the main retained species in this fishery were:
Hoki (all fisheries), assessed to be above the soft limit with very high probability(>99%) and above the target with high probability (>90%)
Silver warehou (LIN3 and 4), In the absence of assessments, biomass indices fromR.V. Tangaroa trawl surveys suggest no declines in estimated biomass. Combinedwith the generally low levels of annual capture in this fishery (the average timeseries capture being skewed by a large event in one year) and pattern of catchesagainst the TACC, this suggests that the stock is highly likely to be withinbiologically based limits. However, the level of capture should be monitored inannual audits.
Ghost shark (LIN 4). Survey data showed no specific trends since 1999, indicatingno declines in biomass, suggesting there are no current concerns for the stock.
White warehou (LIN 5). While survey data were limited and uncertain, little trend inbiomass estimates in the core depth strata were seen, suggesting there are nocurrent concerns for the stock. However the uncertainty in estimates is noted.
Southern blue whiting (LIN 6) Available assessments indicated the stocks to beunlikely (<40%) or exceptionally unlikely (<1%) to be below the soft limit and stocksare assessed to be as likely as not (40-60%) or likely to be above the targetreference point, or believed to be only lightly exploited between 1993-2002.However, status in 6A, a sub-set of region 6, is unknown.
For longlines, the main retained species in this fishery were:
PI 2.1.1The fishery does not pose a risk of serious or irreversible harm to the retainedspecies and does not hinder recovery of depleted retained species
Ju
sti
ficati
on
Spiny dogfish (LIN 3, 4, and 6). Survey indices suggest no declines in biomass.
Ribaldo (LIN 3). Survey-based assessments indicated the stock was likely to remainnear current levels under current catches, and unlikely (<40%) to fall below soft orhard limits.
Rough skate (LIN 6). Available biomass estimates from surveys are generallyincreasing.
Pale ghost shark (LIN6). Catches in this region have been well below the adjustedTACC level. Biomass estimates from the R.V. Tangaroa time series show no cleartrend, with notable inter-annual fluctuations, and a general increase in biomasssince 2005. This suggests that current bycatches are highly likely to be withinbiologically-based limits
Hake (LIN 7). Assessments show the stock is very likely to be above the target,unlikely (<10%) to be below the soft limit and exceptionally unlikely (<1%) to bebelow the hard limit.
Based on this information, while the main retained species in each fishery are highlylikely to be within biologically based limits, and most can be confirmed to be andfluctuating around their target reference points, this cannot be confirmed for allspecies caught. Other retained QMS species within the LIN areas are subject ofTACC limits. However, these levels are not necessarily based upon analyticalassessments and biologically based limits, although these could be performed forsome species with available bycatch information and data from fishery-independentsurveys. This would be required for a higher score. A score of 80 is given.
b
Gu
idep
ost Target reference points are
defined for retained species.
Met? N
Ju
sti
ficati
on
Target reference points are defined for several retained species, e.g. hoki and hake.Explicit target reference points are, however, not set for many other retainedspecies, although the harvest strategy standard provides guidance on what thesemight be were assessments available. Therefore target reference points are notdefined for all retained species. The SG100 is not met.
c
Gu
idep
ost
If main retainedspecies are outsidethe limits there aremeasures in place thatare expected to ensurethat the fishery doesnot hinder recoveryand rebuilding of thedepleted species.
If main retainedspecies are outside thelimits there is a partialstrategy ofdemonstrably effectivemanagement measuresin place such that thefishery does not hinderrecovery andrebuilding.
PI 2.1.1The fishery does not pose a risk of serious or irreversible harm to the retainedspecies and does not hinder recovery of depleted retained species
Ju
sti
ficati
on
N/A.
However, TACCs are set for all of the retained species and could be adjusted giventhe results of assessments. The assessments for hoki and ling assess stocksrelative formally-specified limit and target reference points. The harvest strategystandard (Ministry of Fisheries 2008) includes specific measures which need to beimplemented if the soft limit is breached. Therefore, had assessments / datasuggested that one of the stocks of the main retained species were outside thelimits there are measures in place that are expected to ensure that the fishery doesnot hinder recovery and rebuilding of the depleted species.
d
Gu
idep
ost
If the status is poorlyknown there aremeasures or practicesin place that areexpected to result inthe fishery not causingthe retained species tobe outside biologicallybased limits orhindering recovery.
Met? (Y/N)
Ju
sti
ficati
on N/A
References Ministry of Fisheries. 2008. Harvest Strategy Standard for New Zealand Fisheries
MPI (2013a,b,c)
OVERALL PERFORMANCE INDICATOR SCORE: The main retained species are thesubject of stock assessments and are within biologically based limits. However, notall retained species are the subject of stock assessments and managed relative toreference points. This would be required for a higher score.
PI 2.1.2There is a strategy in place for managing retained species that is designed toensure the fishery does not pose a risk of serious or irreversible harm toretained species
Scoring Issue SG 60 SG 80 SG 100
a
Gu
idep
ost
There are measures inplace, if necessary,that are expected tomaintain the mainretained species atlevels which are highlylikely to be withinbiologically basedlimits, or to ensure thefishery does not hindertheir recovery andrebuilding.
There is a partialstrategy in place, ifnecessary, that isexpected to maintainthe main retainedspecies at levels whichare highly likely to bewithin biologicallybased limits, or toensure the fishery doesnot hinder theirrecovery andrebuilding.
There is a strategy in place formanaging retained species.
Met? Y Y N
Ju
sti
ficati
on
TACCs are set for all of the retained species in the QMS, and the status of eachQMS species is reviewed by the Stock Assessment Plenary. The process forproviding management advice involves collecting fishery-dependent and –independent data, analysing those data using a stock assessment model, catchsurvey analysis or trends in biomass indices, assessing stock status relative toagreed reference points and conducting projections under alternative TACCs forstocks with stock assessments, and setting a TACC which is consistent with theFisheries Act 1996. This type of harvest strategy has all the characteristics of asystem which is expected to achieve stock management objectives as reflected inthe target and limit reference points.
Several of the retained species (hake, southern blue whiting) are managed usingthe same harvest strategy (based on hoki). The TACCs for most of the otherretained species are seldom changed, but the species are all monitored under theQMS, and using observer and vessel-based reporting. Management Action 28 inAnnual Operational Plan aims to develop specific management procedures forsilver warehou and white warehou; these are not yet in place although SWA1 iscurrently managed through an adaptive management programme (overlap with LIN7) and work is planned to establish CPUE series for SWA3&4, related to the hokifishery (Annual Operational Plan for Deepwater Fisheries for 2012/13). There is awider range of QMS species taken in this fishery than those species noted above.For those species, there is less documented evidence on the frequency andframework for assessing the catches of minor QMS species against TACC overtime, the full basis of the TACC levels set, and the relationship between thesecatches and trends in the survey data, nor the decision making process behindmany of the changes made. The implementation of such a formalised managementplan and process for all QMS species, including the development of routinemonitoring of bycatch indicators currently planned, would represent a strategy thatwould increase the score against this PI.
PI 2.1.2There is a strategy in place for managing retained species that is designed toensure the fishery does not pose a risk of serious or irreversible harm toretained species
b
Gu
idep
ost
The measures areconsidered likely towork, based onplausible argument(e.g., generalexperience, theory orcomparison withsimilarfisheries/species).
There is someobjective basis forconfidence that thepartial strategy willwork, based on someinformation directlyabout the fishery and/orspecies involved.
Testing supports highconfidence that the strategy willwork, based on informationdirectly about the fishery and/orspecies involved.
Met? Y Y N
Ju
sti
ficati
on
Few changes have been made the TACCs for the main target species. However,the stocks of many main species are all assessed to be above their target levelswhile no indications of declining stock sizes have been found for other species.There is consequently some objective basis for confidence that the partial strategywill work, based on some information directly about the fishery and/or speciesinvolved. In turn, there is evidence for the effectiveness of the approach for keyspecies such as ling, where TACC reductions to address poor status have provedsuccessful. However, no testing of the strategies for all main retained species hasbeen undertaken. A score of 80 is therefore given.
c
Gu
idep
ost There is some
evidence that thepartial strategy is beingimplementedsuccessfully.
There is clear evidence that thestrategy is being implementedsuccessfully.
Met? Y N
Observers conduct detailed monitoring of trawled catches at sea as well asoperational measures. In the hake/hoki/ling fishery in LIN3-7, an average 11.1-46.1% of trawl tows have been covered on average by observers between 2007/08and 2010/11 fishing years. For the deepwater longline fishery, where the focus isgenerally focused more on ETP interactions but includes monitoring of bycatchspecies, coverage ranged from 0% (LIN7, although data are available for 2011/12),through 4.6% in LIN3 respectively, to 12.1%, 15.9% and 43.5% in LIN5, 4 and 6.For longliners, while interactions in LIN 3 and 7 can be inferred or modelled fromcoverage in most recent years or neighbouring regions (e.g. ETP species), theresulting estimates will be more uncertain. Observer coverage of inshore fisherieshas historically been at very low levels, due to the difficulties in placing observerson small vessels. Since 2008/09 inshore there has been an increased focus oninshore fisheries; coverage in 2010/11 focused on some of the less observed lingand bluenose bottom longline vessels. Within this complex, coverage on averagewas less than 2% in regions LIN4, 5, 6 and 7 (zero in LIN6), with a maximum of5.1% in LIN3. Coverage has varied notably between years in each managementregion.
Reporting on the main species caught is also required from vessels throughlogsheets. This provides a comprehensive dataset for species with which to assessimplementation of catch management strategies for these species. There is clearevidence, based on this information, that the strategy for managing main retainedspecies is being implemented successfully for offshore trawl fisheries, through thestock assessments and variations in TACC that result where required (e.g. hake,hoki, southern blue whiting), and through monitoring of catch and survey dataavailable in other regions.
QMS main non-target species in the (combined, in that observer information from
PI 2.1.2There is a strategy in place for managing retained species that is designed toensure the fishery does not pose a risk of serious or irreversible harm toretained species
inshore and offshore longline fisheries was examined) longline fishery includedthose for which stock assessments were available, those for which survey andCPUE-style indices have been examined, supplemented by relative catch levels.However, for many species, the phrase used within the Plenary document is"Estimates of current and reference biomass are not available for any [species]stocks and therefore it is not known if current TACCs and recent catches aresustainable or whether they are at levels which will allow the stocks to movetowards a size that will support the maximum sustainable yield". This indicates thatthe strategy is not formally apply to all QMS species.
A score of 80 is given. However, the increasing use of the survey time series tosupport indications of stock status is noted as a positive development. Continuedsurveys within LIN7 would further support this. Concerns over the observercoverage in specific longline fleets are discussed under other PIs.
d
Gu
idep
ost
There is some evidence that thestrategy is achieving its overallobjective.
Met? N
Ju
sti
ficati
on Regular updates of stock assessments underlying harvest strategies for the main
species occur to include new information, and TACCs are reviewed regularly. Withthese tools and processes, there is therefore some evidence that the strategy isachieving its overall objective for main species, but the effectiveness for the minorQMS species is not clear, and as noted supporting evidence for stock levels is notalways available. However, the SG100 level text is not met.
e
Gu
idep
ost It is likely that shark
finning is not takingplace.
It is highly likely thatshark finning is nottaking place.
There is a high degree ofcertainty that shark finning isnot taking place.
Met? Y Y Y
Shark finning, as defined by the MSC standard, is "The practice of removing any ofthe fins of a shark (including the tail) while at sea and discarding the remainder ofthe shark at sea". Under current provisions of the Animal Welfare Act 1999, it is anoffence to willfully ill-treat an animal. It is considered that the practice of removingthe fins from a shark and returning it to the sea while still alive fits within thedefinition of ill-treating an animal.
All retained shark species are within the QMS, and hence are required to beretained on board: “No commercial fisherman shall return to or abandon in the seaor any other waters any fish, aquatic life, or seaweed of legal size, or for which nolegal size is set, that is subject to the quota management system (See Fisheries Act1996, s 72(1))”. The exception is Schedule 6 species, detailed in the Fisheries Act
1996. This lists species and stocks which may be returned to the sea in accordancewith stated requirements. For fish species listed on this schedule, the requirementsinclude that the individual be likely to survive on return to the sea, and that the
PI 2.1.2There is a strategy in place for managing retained species that is designed toensure the fishery does not pose a risk of serious or irreversible harm toretained species
Ju
sti
ficati
on
return takes place as soon as practicable after the take. Spiny dogfish have aunique status on Schedule 6, in that they are allowed to be returned to the seaeither alive or dead as long as they are reported and counted against Annual CatchEntitlement. This allows operators to choose whether to land spiny dogfish or returnthem to the sea. At the time this provision was implemented there were limitedmarkets for spiny dogfish and the management objective was to set catch limits andensure that there was full reporting against those limits. The provision of choice tofishers aimed to mitigate costs associated with landing spiny dogfish and possiblyneeding to dispose of them on land. This approach was expected to result in betterreporting of spiny dogfish catches by reducing the incentive to illegally dump andnot report catches. Without accurate reporting, appropriate management settingsfor this fishery could not be established.
Since the NPOA-sharks 2008, school shark (Galeorhinus galeus) has been addedto Schedule 6, and is a relatively rare bycatch in ling trawls and uncommon inlongline fisheries (<5% of catch weight).
The Deepwater Group has implemented a number of principles in order to optimizethe applicability of the NPOA sharks of banning shark finning consistent with theMSC definition. The new NPOA-sharks, which has now been finalised,has onespecific objective of eliminating shark finning in New Zealand fisheries (Objective2.4). As noted in that document, within the deepwater fishery as a whole, excludingspiny dogfish, 97.4% of QMS sharks were fully utilised or released. Half of alldeepwater spiny dogfish catch was fully utilised, with the remainder returned to thesea under Schedule 6 provisions; MPI confirmed that all retained shark were withfins attached.
The information available is supported by the monitoring by observers in the fishery.MPI note that the catch balancing system ensures that nothing is landed that isn’treported, and that sharks were confirmed to be returned to the water whole. A scoreof 100 is given.
References
Ramm, 2012
MPI, 2013b
MPI, 2013d
Observer species catch records, 2007/08 to 2011/12
Interview with MPI
Ballara et al., 2010
MPI 2012c
MPI 2013a, b, c
OVERALL PERFORMANCE INDICATOR SCORE: All of the scoring issues for the 60and 80 scoring guidepost are met as are one of four 100 scoring guideposts. Theresultant score is 85.
PI 2.1.3Information on the nature and extent of retained species is adequate todetermine the risk posed by the fishery and the effectiveness of the strategyto manage retained species
Scoring Issue SG 60 SG 80 SG 100
a
Gu
idep
ost
Qualitative informationis available on theamount of mainretained species takenby the fishery.
Qualitative informationand some quantitativeinformation areavailable on theamount of mainretained species takenby the fishery.
Accurate and verifiableinformation is available on thecatch of all retained speciesand the consequences for thestatus of affected populations.
Met? Y Y N
Ju
sti
ficati
on
Data on catch rates and the relative abundance of non-target catch species in thefishery are available from three main sources:
The TCEPR (Trawl catch, effort and processing return) forms and longlinelogbooks, which provide green-weight catch totals for the top five/eight species(dependent on vessel size and fishing method) on a fishing-event basis, and dailysummary of TACC species caught.
The MPI fisheries observer data, which provides catch weight for all QMS and non-QMS species caught, on an observed tow-by-tow/set-by-set basis. This providesaccurate and verifiable information (if on variable and patchy coverage in thelongline fishery in particular). In the hake/hoki/ling fishery in LIN3-7, coverage hasbeen on average above 11% of trawl tows.. For the deepwater longline fishery,coverage ranged from less than 5% (LIN3 and 7), to over 12% (LIN4-6), althoughcoverage varies year on year. Inshore longline coverage has varied moresignificantly from year to year with many areas having no coverage in particularyears, or no coverage at all in LIN6 (where little 'inshore' fishing occurs). Averagecoverage in LIN3 was 5%.
Fishery independent trawl surveys on the Chatham Rise and Sub-Antarctic regions,and much less frequently the west coast South Island region, provide abundanceestimates of finfish, cartilaginous fish, and squid species, as well as catch weightsof macroinvertebrates. Further inshore surveys also provide some information onTACC stocks.
Data on removals of all retained species are collected and are available aresummarized in the report of the Stock Assessment Plenary. Thus, somequantitative information is available on the amount of main retained species takenby the fishery. However, due to lack of knowledge of population parameters of allspecies across the geographic regions of interest, consequences for the status ofall affected populations cannot be assessed as required at the SG100 level. A scoreof 80 is given. Issues with low observer coverage are raised under other SG.
b
Gu
idep
ost
Information isadequate toqualitatively assessoutcome status withrespect to biologicallybased limits.
Information is sufficientto estimate outcomestatus with respect tobiologically basedlimits.
Information is sufficient toquantitatively estimate outcomestatus with a high degree ofcertainty.
PI 2.1.3Information on the nature and extent of retained species is adequate todetermine the risk posed by the fishery and the effectiveness of the strategyto manage retained species
Ju
sti
ficati
on
The stocks of hoki, hake and southern blue whiting are assessed using the CASALmodelling platform. These assessments make use of indices of abundance fromtrawl surveys, catch-rate indices, as well as age and length composition data.Trends in abundance from surveys are also available for some other retainedspecies, combined with observer coverage, provide independent monitoring oflanded catch. Thus, information is sufficient to estimate outcome status with respectto biologically based limits.
However, not all of the retained species are indexed well by surveys and trends incatch-rate indices may not always be plausible. While a number of researchprojects are either underway or are planned which could increase the informationbase for the retained species, currently the sustainability of some TACC levels isunknown. While status can be inferred through catch trends and levels, combinedwith knowledge of stock biology, it cannot be said that information is sufficient toquantitatively estimate outcome status with a high degree of certainty. A score of 80is therefore given.
c
Gu
idep
ost
Information isadequate to supportmeasures to managemain retained species.
Information is adequateto support a partialstrategy to managemain retained species.
Information is adequate tosupport a strategy to manageretained species, and evaluatewith a high degree of certaintywhether the strategy isachieving its objective.
Met? Y Y Y (LIN3&4,5&6), N (LIN7)
Ju
sti
ficati
on
The Harvest Strategy Standard provides a basis for a comprehensive strategy tomanage retained species and there are survey results, length compositioninformation, and catch-rate data. In addition, observer coverage in the trawl fisheryhas been of sufficient consistent coverage to identify bycatch species and supportmanagement strategies. In the longline fishery, the coverage has been morevariable (LIN4 & 6 of the offshore longline fishery being exceptions).
This coverage provides independent monitoring of fishery operations and catchcharacteristics. Many of these data are used to investigate and analyse fisheryperformance against strategic and management objectives. Combined with theregular trawl surveys used within assessments in LIN3&4 and LIN5&6, informationbeing collected is adequate to support a comprehensive strategy to manageretained species, and evaluate with a high degree of certainty whether the strategyis achieving its objective, and a score of 100 is given.
The current lack of trawl survey time series for LIN7 that allows a time series ofrelative abundance to be developed, and means information is only adequate tosupport a partial strategy. A score of 80 is given.
d
Gu
idep
ost
Sufficient data continueto be collected todetect any increase inrisk level (e.g. due tochanges in theoutcome indicatorscore or the operationof the fishery or theeffectiveness of thestrategy)
Monitoring of retained speciesis conducted in sufficient detailto assess ongoing mortalities toall retained species.
Met? Y Y (Trawl fisheries in LIN3-7,offshore longline LIN6). N (allother UoC)
PI 2.1.3Information on the nature and extent of retained species is adequate todetermine the risk posed by the fishery and the effectiveness of the strategyto manage retained species
Ju
sti
ficati
on
For trawl fisheries, observer monitoring and catch reporting is consistent andreasonably extensive, both in terms of placements on vessels and coverage of tows(see above). For longline fisheries, coverage has been relatively consistent in LIN6,but in other FMAs is less extensive and more variable than the trawl coverage, withover 12% achieved only in the offshore fishery in areas LIN4, while the inshorefishery observer coverage has only been over 5% in LIN3 (reasonably consistentcoverage in the last few years) and intermittent in other areas. As a result, only theLIN6 longline component exhibits consistent coverage in the offshore longlinecomponent, noting that there is negligible fishing in the inshore component of thisregion given the offshore location of the FMA.
Vessel-based logbook reporting also occurs for the main species caught in allfisheries.
Thus, monitoring of retained species is conducted in sufficient consistent detail toassess ongoing mortalities of all retained species in trawl fisheries in LIN3-7 and thelongline fishery in LIN6 and a score of 100 is given.
For the other offshore and inshore longline fisheries (LIN3,4,5,7), sufficient datacontinue to be collected through the majority of approaches, and a score of 80 isgiven.
References
MPI, 2013a, b, c
Bagley et al., 2013
Ballara et al., 2010
O'Driscoll et al., 2011
MPI (2012a)
DWG, pers comm.
OVERALL PERFORMANCE INDICATOR SCORE: All of the scoring issuesfor the 60 and 80 scoring guidepost are met in all UoCs.
Two of four 100 scoring guideposts are met for the trawl fisheries in LIN3,4, 5 and 6, and the longline fishery in LIN 6, and a score of 90 is given.One 100 scoring guidepost is met by longliner fisheries in LIN3, 4, 5 and6 and the trawl fishery in LIN 7, and a score of 85 is given. A score of 80is given for LIN 7 longline
PI 2.2.1The fishery does not pose a risk of serious or irreversible harm to the bycatchspecies or species groups and does not hinder recovery of depleted bycatchspecies or species groups
Scoring Issue SG 60 SG 80 SG 100
a
Gu
idep
ost
Main bycatch speciesare likely to be withinbiologically basedlimits (if not, go toscoring issue b below).
Main bycatch speciesare highly likely to bewithin biologicallybased limits (if not, goto scoring issue bbelow).
There is a high degree ofcertainty that bycatch speciesare within biologically basedlimits.
Met? Y Y N
Due to the lack of information on status for non QMS species, we have taken thefollowing approach. The main bycatch species are defined as those considered torepresent >5% of the catch, or as being particularly vulnerable (e.g. non-QMSelasmobranch species). For the purposes of this assessment, we have thereforeassumed that a species may be at risk where they represent >5% of the total catch,or are caught at levels greater than 10 tonnes per year where this species isconsidered of low productivity. We recognise that a species may have lowabundance and high catchability, which may lead to incorrect estimation of statususing these criteria. This is picked up under PI 2.2.2. This approach is comparableto that taken under P1, in separating the determination of outcome from themanagement and information. All interactions with birds, marine mammalsetc areconsidered under 2.3.
Observers present on vessels record and estimate the weight of all species broughton board, while vessel logbooks also record these species if they are among themost frequent species within the catch. Monitoring bycatch and addressingsignificant levels of catch represents a partial strategy, based upon the review ofpotential QMS status (see 2.2.2). For this purpose, longline catch in each regionhas been grouped. However, it is noted that more unit specific information would bedesirable from the inshore fishery component (see 2.2.3).
For trawls, main (>5% of the catch weight) bycatch species fall within LIN3 (rattailsand javelinfish) and LIN4 (common roughy). Bycatch trends and survey indicesindicated that rattails and javelinfish were highly likely to be within biologically basedlimits, while available survey biomass estimates for common roughy suggest catchlevels < 1% of the biomass. MSC guidelines defining 'highly unlikely' state that thereshould be no more than a 30% probability that the true status is at a level wherethere is a risk of serious or irreversible harm. Taking that point to be the hard limit,the stock is highly likely to be within biologically based limits.
For longline fisheries, black cod was a main non-QMS species in LIN6 (all otherareas showed no main non-QMS species by weight). Catches averaged over 20tonnes per annum, a figure skewed by high ( but highly variable from year-to-year,with no trend) catches in the past - in the last two years catches were below onetonne. The growth of this species (K=0.26y
-1), fecundity, trophic level (3.4) and
medium resilience (see Fishbase.org) suggest that catches at this level appearunlikely to lead to fishing impacts.
PI 2.2.1The fishery does not pose a risk of serious or irreversible harm to the bycatchspecies or species groups and does not hinder recovery of depleted bycatchspecies or species groups
Ju
sti
ficati
on
In general, the 2010 ERA for related hoki fisheries concluded that impacts ondeepwater sharks and rays were negligible-minor (although the confidence in thisconclusion was ‘low’), and deepwater dogfish was minor-moderate (although theconfidence in this conclusion was ‘low’). Given the trends in bycatch levels andsurvey indices available, and the relatively small catches considered, it reasonableto conclude the main vulnerable species are highly likely (probability > 0.7) to bewithin biologically based limits. However, given the large number of bycatch speciesand the difficulty monitoring many of these, it is not possible to draw conclusionsregarding all bycatch species in each unit of certification with a high degree ofcertainty, as required at the SG100 level. A score of 80 is given.
b
Gu
idep
ost
If main bycatchspecies are outsidebiologically basedlimits there aremitigation measures inplace that areexpected to ensurethat the fishery doesnot hinder recoveryand rebuilding.
If main bycatch speciesare outside biologicallybased limits there is apartial strategy ofdemonstrably effectivemitigation measures inplace such that thefishery does not hinderrecovery andrebuilding.
Met? N/A N/A
Ju
sti
ficati
on N/A
c
Gu
idep
ost
If the status is poorlyknown there aremeasures or practicesin place that areexpected to result inthe fishery not causingthe bycatch species tobe outside biologicallybased limits orhindering recovery.
Met? N/A
Ju
sti
ficati
on N/A.
However, if a sustainability problem is detected, a species can be added to theQMS and/or the species managed under Section 11 of the Act. However, it isdifficult to detect whether there is a sustainability concern for many of the bycatchspecies.
PI 2.2.1The fishery does not pose a risk of serious or irreversible harm to the bycatchspecies or species groups and does not hinder recovery of depleted bycatchspecies or species groups
MPI (2013b)
O'Driscoll et al., 2011
OVERALL PERFORMANCE INDICATOR SCORE: The score is 80 because all of thescoring issues for 80 scoring guidepost are met, but none for the 100 scoringguideposts.
PI 2.2.2There is a strategy in place for managing bycatch that is designed to ensurethe fishery does not pose a risk of serious or irreversible harm to bycatchpopulations
Scoring Issue SG 60 SG 80 SG 100
a
Gu
idep
ost
There are measures inplace, if necessary,that are expected tomaintain the mainbycatch species atlevels which are highlylikely to be withinbiologically basedlimits, or to ensure thefishery does not hindertheir recovery andrebuilding.
There is a partialstrategy in place, ifnecessary, that isexpected to maintainthe main bycatchspecies at levels whichare highly likely to bewithin biologicallybased limits, or toensure the fishery doesnot hinder theirrecovery andrebuilding.
There is a strategy in place formanaging and minimizingbycatch.
Met? Y Y N
Ju
sti
ficati
on
Specific main (including 'vulnerable') species are discussed under 2.1.1. Ongoingmonitoring of trawl and longline catches occurs through the observer programme.
The QMS Introduction Process Standard is one of the ways to give effect to theMinistry’s statutory requirements for sustainability of species caught. This approachlimits catch, which may also limit fishing effort. Species outside the QMS systemtend to be considered as low risk of being caught unsustainably. Substantialcatches of non-QMS species tends to lead to the establishment of their QMS status.Furthermore, the framework of continual monitoring of bycatch catches through theobserver programme, and the noting of species catches within vessel logbooks ifthey represent the most frequent species caught in a fishing event, provides a basisfor simple assessments of the impact of the fishery on these species or speciesgroups. Once included in the QMS, reports have to be produced for such species,and TACCs could be adjusted to ensure that the stock remains above the soft limit.
There is increasing evidence of continued monitoring of non-QMS species throughthe observer data (primarily for the trawl fishery, notably less for particular regionsand components of the longline fishery) and available survey time series (primarilyLIN3&4 and LIN5&6). Continued monitoring and quantification of bycatch is also akey management objective of the National deepwater plan 2012-13 (MO2.1), withactivities including the accurate reporting of bycatch information through observerprogrammes, with a focus on identifying deepwater shark species (Action #16),while action #30 describes monitoring catches of and assessing risks to non-QMS(Tier 3) species from deepwater fishing activity. Completion and action on thefindings of these activities for the fishery under certification would demonstrate acohesive strategy.
Combined with the QMS Introduction Process Standard and associated activities,this forms a partial but developing strategy for managing bycatch. A score of 80 isgiven.
PI 2.2.2There is a strategy in place for managing bycatch that is designed to ensurethe fishery does not pose a risk of serious or irreversible harm to bycatchpopulations
b
Gu
idep
ost
The measures areconsidered likely towork, based onplausible argument(e.g. generalexperience, theory orcomparison withsimilarfisheries/species).
There is someobjective basis forconfidence that thepartial strategy willwork, based on someinformation directlyabout the fishery and/orspecies involved.
Testing supports highconfidence that the strategy willwork, based on informationdirectly about the fishery and/orspecies involved.
Met? Y Y N
Ju
sti
ficati
on
Adding a species to the QMS allows catches of the species to be restricted.Catches are generally below TACCs, especially for lower value non-target species.A system of deemed values is used to deter or deal with catches over quota andthis has been adjusted for specific retained species/stocks to remove overfishing.There are other ways to handle over catch by individual operators, e.g. purchase ofquota from other quota holders.
Components of the QMS framework are regularly reviewed, based on speciesharvests recorded and any other significant new information.
The strategy has been tested through various species being incorporated into theQMS and represents an explicit part of the management framework for ling. Noapparent collapses have been identified through examination of survey time series.However, as noted within the Plenary document, there is no fully objective basis forconfidence that the TACCs for all minor QMS species are set within biologicallybased limits and hence the strategy cannot be said to be fully tested. A score of 80is given.
c
Gu
idep
ost There is some
evidence that thepartial strategy is beingimplementedsuccessfully.
There is clear evidence that thestrategy is being implementedsuccessfully.
Met? Y N
Ju
sti
ficati
on
As species have moved from bycatch to QMS status within the fishery, they havebeen subject to more formalised monitoring and must be retained on board vessels.Two recent examples of species introduced through the QMS Introduction ProcessStandard are Patagonian toothfish and attached bladder kelp. The Patagoniantoothfish was introduced because MPI recognised that continued managementoutside the QMS (as an open-access fishery) could lead to an unsustainableincrease in catch over a relatively short timeframe. Attached bladder kelp wasintroduced firstly to ensure the sustainable use of this resource, and secondly toprevent future sustainability concerns that could arise from unrestricted use. Thereis clear evidence that the strategy is being implemented successfully for mainbycatch species but not for all bycatch species. A score of 80 is therefore given.
PI 2.2.2There is a strategy in place for managing bycatch that is designed to ensurethe fishery does not pose a risk of serious or irreversible harm to bycatchpopulations
Ju
sti
ficati
on
The strategy appears to be achieving its objective, in that the Standard is followedand new species are brought under the QMS framework, facilitating closer andmore formal management of sustainability issues. The strategy is not for ALLbycatch species . A score of 100 is not given.
References
Ministry of Fisheries 2010a,b
Ministry of Fisheries, 2008b, c
MPI 2013a, b, c
OVERALL PERFORMANCE INDICATOR SCORE: All of the scoring issues for the 60and 80 scoring guidepost are met in all regions. None of the four 100 scoringguideposts are met, and the resultant score is 80
PI 2.2.3Information on the nature and the amount of bycatch is adequate to determinethe risk posed by the fishery and the effectiveness of the strategy to managebycatch
Scoring Issue SG 60 SG 80 SG 100
a
Gu
idep
ost
Qualitative informationis available on theamount of mainbycatch species takenby the fishery.
Qualitative informationand some quantitativeinformation areavailable on theamount of mainbycatch species takenby the fishery.
Accurate and verifiableinformation is available on thecatch of all bycatch species andthe consequences for the statusof affected populations.
Met? Y Y N
Ju
sti
ficati
on
Key quantitative information on the level of bycatch (non-QMS species and hencegenerally not enumerated on logsheets) comes from the observer programme.
Resulting ‘main’ species (or those to be considered ‘vulnerable’) are noted in 2.1.1.Information on status is supported by studies on trawl survey data in regions, andwhere catches are of sufficient importance, these should be noted on logsheets.
The observer programme provides for the production of estimates of bycatch byquota area and fishery. The coverage of the ling trawl fishery is considered to begood for the fisheries under assessment. The precision of bycatch estimatesdepends on the level of observer coverage and are therefore less precise for thelongline fishery, whose coverage has generally been more intermittent and onaverage lower. The exception is LIN6 offshore longline (there being no inshorelongline component given the offshore location of the FMA), where an average of43.5% of sets have been observed. All other regions have had some observationsover the last five years, providing some quantitative information. However, thegenerally lower degree of coverage in the inshore fishery is noted and discussedunder other scoring elements.
An increasing number of studies have examined and summarized trends inabundance of non-target species from trawl surveys for the Chatham Rise and sub-Antarctic region, and compared the disjointed time series for the west coast SouthIsland. However, survey information is not available for all regions of the fishery andsome bycatch species are not well monitored by the surveys undertaken.
Therefore, while qualitative information and some quantitative information isavailable on the main bycatch species affected by the fishery, it is not possible toevaluate the consequences of fishing activities on all bycatch species’ populationsin each of the areas. A score of 80 is given.
b
Gu
idep
ost
Information isadequate to broadlyunderstand outcomestatus with respect tobiologically basedlimits
Information is sufficientto estimate outcomestatus with respect tobiologically basedlimits.
Information is sufficient toquantitatively estimate outcomestatus with respect tobiologically based limits with ahigh degree of certainty.
PI 2.2.3Information on the nature and the amount of bycatch is adequate to determinethe risk posed by the fishery and the effectiveness of the strategy to managebycatch
Ju
sti
ficati
on
The status of main vulnerable species caught in bycatch are monitored throughavailable trawl surveys (areas LIN3 and 4, LIN5 and 6), noting that the survey in theWCSI (LIN7) provides a very limited time series. It is noted that the 10 yearresearch plan includes a combined trawl/acoustic survey on the WCSI. To date,trends in abundance have not been detected in any of the surveys. On this basis,information is sufficient to estimate relative abundance, as a proxy for biologically-based limits.
In LIN regions 3-7, trawl observer reporting provides high quality information onthose catches, while longline observer data provides sufficient information toestimate outcome status, where these data sources are combined with trawl surveydata (noting that an increasing time series in LIN7 will develop in the future, and arecommendation (recommendation 2) has been developed accordingly).Information available in these areas on population parameters is therefore sufficientto estimate outcome status for bycatch species with respect to biologically-basedlimits . A score of 80 is therefore given.
c
Gu
idep
ost
Information isadequate to supportmeasures to managebycatch.
Information is adequateto support a partialstrategy to managemain bycatch species.
Information is adequate tosupport a strategy to manageretained species, and evaluatewith a high degree of certaintywhether the strategy isachieving its objective.
PI 2.2.3Information on the nature and the amount of bycatch is adequate to determinethe risk posed by the fishery and the effectiveness of the strategy to managebycatch
Ju
sti
ficati
on
The primary source of bycatch information is through the observer programme,supplemented by available survey information.
In the hake/hoki/ling trawl fishery in LIN3-7, coverage has been on average above10% of trawl tows. For the deepwater longline fishery, coverage ranged from lessthan 5% (LIN3 and 7, with LIN7 being estimated using data supplied by DWG forthe 2011/12 year), to over 10% (LIN4-6), although coverage varies year on year.Coverage in the offshore longline LIN 6 FMA has been relatively high andconsistent. Inshore longline coverage has varied more significantly from year toyear with many areas having no coverage in particular years. Average coverage inLIN 3 was generally over 5%, with this region also showing relatively consistentyear-on-year coverage.
In addition to data collection by observers, there is also vessel-based reporting ofspecies caught where those catches are significant. When combined withinformation collected through trawl surveys in most areas, as well as inshore alongthe coast, a significant body of data is available to support a strategy to managebycatch, and evaluate whether this strategy is achieving its objective.
A score of 100 is given for the trawl fisheries in LIN3-7, noting the combination ofsurvey information, observer coverage and logsheet information is adequate tosupport a strategy to manage retained species, and evaluate with a high degree ofcertainty whether the strategy is achieving its objective.
For the longline fishery, a score of 100 is given for the offshore longline fishery inLIN6, noting the survey information, observer coverage and logsheet information isadequate to support a strategy to manage retained species, and evaluate with ahigh degree of certainty whether the strategy is achieving its objective, while 80 isgiven for LIN3-5, noting the combination of survey information, reasonable observercoverage to identify the key species and their catch rates/levels, and logsheetinformation to support. For LIN 7 longline a score of 80 has also been given, notingthat the available information indicates no main bycatch species within this UoC.The short time series of information available is recognised, and recommendation 2has been developed accordingly.
d
Gu
idep
ost
Sufficient data continueto be collected todetect any increase inrisk to main bycatchspecies (e.g., due tochanges in theoutcome indicatorscores or the operationof the fishery or theeffectively of thestrategy).
Monitoring of bycatch data isconducted in sufficient detail toassess ongoing mortalities to allbycatch species.
Met? Y Y (LIN3 and 4, LIN5 and 6trawl, LIN6 longline) N (all otherUoC)
PI 2.2.3Information on the nature and the amount of bycatch is adequate to determinethe risk posed by the fishery and the effectiveness of the strategy to managebycatch
Ju
sti
ficati
on
The data collected from surveys are generally sufficient to cover the major areas ofthe fishery (Chatham Rise & sub-Antarctic, LIN3 and 4, LIN5 and 6), but the timeseries in west coast South Island is notably limited (LIN7).
In combination with the ongoing observer coverage (LIN3 and 4, LIN5 and 6 trawl,and the LIN6 offshore fishery but not for the remaining longline fishery FMAs, whereeither the inshore or offshore component in each LIN area shows intermittent andlow coverage) and actions detailed in the Annual Operational Plan for the fishery,this is sufficient to detect increases in risk to the main bycatch species. That said,the precision of estimates for particular bycatch species within the trawl surveys, inparticular the WCSI is more limited. This will improve with further surveys in thisarea.
A score of 100 is given for LIN3 and 4, LIN5 and 6 trawl, and a score of 80 is givenfor all other LIN areas, reflecting the reduced information from fishery-independentsurveys and observer programmes in those areas.
References
Ballara et al., 2010
Bagley et al., 2013
Ramm, 2012
O'Driscoll et al., 2011
OVERALL PERFORMANCE INDICATOR SCORE:
For the trawl fishery, all of the scoring issues for the 60 and 80 scoringguidepost and two of the four 100 guideposts is met in LIN 3,4,5 and 6,and a score of 90 is given. For LIN7, all 80 guideposts are met, and ascore of 80 given.
For longline, all 80 scoring guideposts are met in LIN3-6 and LIN7 and ascore of 80 is given. For LIN6, two of the four 100 guideposts are met,and a score of 90 is given.
The fishery meets national and international requirements for the protectionof ETP species
The fishery does not pose a risk of serious or irreversible harm to ETPspecies and does not hinder recovery of ETP species
Scoring Issue SG 60 SG 80 SG 100
a
Gu
idep
ost
Known effects of thefishery are likely to bewithin limits of nationaland internationalrequirements forprotection of ETPspecies.
The effects of thefishery are known andare highly likely to bewithin limits of nationaland internationalrequirements forprotection of ETPspecies.
There is a high degree ofcertainty that the effects of thefishery are within limits ofnational and internationalrequirements for protection ofETP species.
Met? Y Y Y (trawl LIN3-7) N (all longlinersall regions)
The Fisheries Act specifies that associated or dependent species should bemaintained above a level that ensures their long-term viability and that biologicaldiversity of the aquatic environment should be maintained. Further, in the absenceof a population management plan, the Minister of Fisheries may, after consultationwith the Minister of Conservation, take such measures as s/he considers arenecessary to avoid, remedy, or mitigate the effect of fishing-related mortality on anyprotected species. Thus, accidental and incidental captures of legally protectedspecies by permitted commercial fisheries operations are not prohibited in NewZealand. Captures must be reported to the Ministry of Fisheries on a mandatoryform (Compliance Information Sheet 8), and the long-term aim is to minimisemortalities where possible. This provides good information on the potential effectsof the fishery on ETP species.
It is also noted that the NPOA-Seabirds requires that seabird species identified asat very high or high risk of having commercial fisheries bycatch exceed populationsustainability limits should be managed to a lower risk category by 2018. The newNPOA-sharks also specifies a risk-based approach to identifying and managingimpacts on sharks.
Trawl vessels over 28 m in length are also required to deploy specified mitigationmeasures to reduce seabird captures; compliance with these measures is assessedby government observers. In turn, regulation requires the use of a streamer lineduring the setting of bottom longlines on vessels greater than 7 m in length, andtherefore may not cover the whole fleet. Line weighting approaches are also used.Occasionally, the New Zealand government will identify a maximum allowablemortality level for protected species in accordance with legislative provisions. Nospecific limits on interactions have been set in the ling fishery; the activities aimedat minimising interactions are underway. It is noted that the interaction rate will bepopulation size dependent, and therefore there is a need to explicitly considerpopulation size estimates to evaluate unacceptable impact levels.
CITES Appendix 1 includes the Basking shark, which is also legally protected inNew Zealand fisheries waters. The Agreement for the Conservation of Albatrossesand Petrels (ACAP) covers 29 species of these seabirds, the majority of whichoccur in New Zealand waters (and are legally protected). This Agreement requiresNew Zealand to take measures to achieve and maintain a favourable conservationstatus for albatrosses and petrels.
Good observer coverage and reporting within the ling trawl fishery means that theeffects of the fishery are known and estimable, in terms of bycatch of ETP species
The fishery meets national and international requirements for the protectionof ETP species
The fishery does not pose a risk of serious or irreversible harm to ETPspecies and does not hinder recovery of ETP species
and implementation of sustainability measures (e.g. deployment of mitigationdevices) required. Observers identify and photograph all protected species landeddead. They also return most protected species landed dead for expert identificationonshore. Focused coverage can be implemented to improve knowledge whereadditional information is required for management. These include protection andmonitoring of bird and mammal breeding sites. Data collected are subjected toappropriate exploratory and/or quantitative analyses, e.g. monitoring populations,modelling population parameters, the Ecological Risk Assessment, and a level 2risk assessment (for seabirds). Limits focus on sustainability and minimisingincidental catch of ETP species. Regular (annual) estimates of interactions offisheries with ETP species are developed raising observer information up to thelevel of the fishery.
Through these approaches, the risk assessment for birds, existing populationestimates for key ETP species allow the current interaction rates to be viewed inrelation to national and international requirements with a high degree of certainty,and are highly likely to be within limits of national and international requirements.For trawls in LIN3-7, a score of 100 is given, reflecting the greater certainty inannual interaction estimates. For longliners, a score of 80 is given, reflecting thegreater uncertainty in estimates. Further discussions on observer coverage aremade under 2.3.3.
B
Gu
idep
ost Known direct effects
are unlikely to createunacceptable impactsto ETP species.
Direct effects are highlyunlikely to createunacceptable impactsto ETP species.
There is a high degree ofconfidence that there are nosignificant detrimental directeffects of the fishery on ETPspecies.
Met? Y Y (trawl fisheries) N(longline vessels)
Y (trawl fisheries) N (longlinevessels)
Birds
Observer reports of bird kills within the ling fishery have varied over time, and byLIN area. Numbers available from the observer programme focus on warp-strike events (allgears), hooking (longliners), as well as trawl-net interactions, and less on deck-strikes, sincethe former events were the most common prior to the implementation of mitigationmeasures. It is recommended that the recording of deck-strike and in particular trawl netinteractions continue to be improved For trawlers, 8 incidences of birds being landeddead from the trawl warps or doors have been reported by observers since the2004/05 fishing year. Four times that many net captures have been reported
8.
The majority of interactions with the trawl fishery involve white-chinned petrels,white-capped albatrosses, sooty shearwaters and 'other albatrosses and seabirds'.Key locations for captures were LIN4 (a maximum of 16 sooty shearwaters),numbers being below 5 in other locations. Conservative population estimatesinclude: sooty shearwaters around 5 million adult pairs; white-capped albatrossaround 100,000 pairs; and white-chinned petrels around 70,000 (uncertainestimate). When taking the overall mortalities within the fishery into account, white-chinned petrel fall within the ‘moderate’ risk category. Based upon these numbersand the catch rate in the ling trawl fishery, the effects of the trawl fishery appearhighly likely to be within national limits. This is supported by the risk assessment forbirds, which indicated that annual potential seabird fatalities within the deepwatertrawl complex were between 1% and 50% of the PBR. Seabird captures in the lingfishery account for approximately 3% of seabirds caught in New Zealand offshore
The fishery meets national and international requirements for the protectionof ETP species
The fishery does not pose a risk of serious or irreversible harm to ETPspecies and does not hinder recovery of ETP species
The longline fishery showed greater levels of bird interactions than trawls, withinteractions noted in LIN4, LIN5 and LIN6 (Chatham Rise, Sub-Antarctic, Puysegurand Stewart-Snares regions). During the period 2007-2009 no other region showedrecorded bird interactions (while observer coverage was generally low in thoseareas and years, interactions should have been noted although interactions onvessels without observer coverage cannot be confirmed). Estimated bird bycatcheshave varied between years, often being zero in particular years, demonstrating thepotential inter-vessel, inter-area and inter-year variability that can occur. Keylocations for 2008-09 captures were Chatham rise (LIN4) and the Sub-Antarctic(LIN6) with a modelled maximum of 1,100 interactions with white-chinned petrels inLIN4 and 221 interactions in LIN6. In 'small bottom-set longline' fisheries (describedas vessels <34m not targeting bluenose or snapper, but combining the targeting ofa number of species), the seabird risk assessment noted estimated Salvin'salbatross and Chatham albatross fatalities were notable; indeed the small-vesselgroup had the highest vulnerability. Conservative population estimates for key birdspecies are: white-chinned petrels are around 70,000 (uncertain estimate) andwhen taking the overall mortalities within fisheries into account, white-chinned petrelwere within the ‘moderate’ risk category; sooty shearwaters around 5 million adultpairs; this species was within the low risk category. The uncertainty in the risk ratiowas more sensitive to uncertainty in bottom-longline fatalities than information onmortalities in other fisheries or biological characteristics. The risk assessmentsuggested that the larger bottom longline vessels were of relatively low risk with amean annual potential fatality value between 1-10% of the PBR, suggesting directeffects are highly unlikely to create unacceptable impacts to ETP species.
The smaller bottom longline vessels (noting that this was not split into ling vesselsspecifically - see 2.3.3) showed greater risk, with black petrel interactions beinggreater than the mean PBR, Salvin's albatross and Chatham Island albatrossinteractions being between 30-100% of the PBR, and Flesh-footed shearwaterinteractions being between 10-30% of the PBR. While the ling small bottom longlinecomponent of this category is unlikely to create unacceptable impacts to ETPspecies, this uncertainty needs to be addressed. As the longline UoC combinesboth small and large longline vessels, and given the risk and uncertainty overinteraction rates for these gears resulting from variable observer coverage, a scoreof 60 is given for the longline fishery.
Marine mammals
Interactions between the ling trawl fishery and marine mammals are typically withfur seals. In the past few years, interactions have varied between LIN areas, andpeaked in 2008-09 at 7 (0-23) interactions at Puysegur and Chatham Rise.Populations are monitored, and estimates of total New Zealand population sizes,and number of breeding colonies are generally increasing; total populationestimates around New Zealand exceed 50,000 adults and are thought to beexpanding following direct historical exploitation. However there remains someuncertainty over population status in the WCSI. Overall population growth suggeststhat mortalities in the LIN trawl fisheries are highly unlikely to directly affect theincreasing population, although continued study is warranted. No fur sealinteractions have been observed in the ling longline fishery. No interactions with sealions or dolphins have been noted.
Fish
There have been no observed interactions of basking sharks, or other protectedshark species,with the ling fishery.
Cold water corals
Observer data shows that protected cold water corals are brought up in trawls in theareas under certification, and reported interactions within the ling fishery have been
de
detailed in the main text. These represented 0.01% or less of noted interactions.Recent reports indicated that the ling/hoki/ling fishery did not pose a great risk to
The fishery meets national and international requirements for the protectionof ETP species
The fishery does not pose a risk of serious or irreversible harm to ETPspecies and does not hinder recovery of ETP species
Ju
sti
ficati
on
detailed in the main text. These represented 0.01% or less of noted interactions. Recentreports indicated that the ling/hoki/ling fishery did not pose a great risk to coral.
A score of 100 is therefore given for the trawl fishery.
Given the level of interactions with seabirds and concerns raised over the estimated levelsof capture in the small bottom longline component relative to calculated PBRs in the riskassessment, a score of 60 is given for longline vessels. A condition is raised.
Indirect effects havebeen considered andare thought to beunlikely to createunacceptable impacts.
There is a high degree ofconfidence that there are nosignificant detrimental indirecteffects of the fishery on ETPspecies.
Met? Y N
Ju
sti
ficati
on
On trawlers, indirect effects are being managed through attempts to limit thedischarge of offal through Vessel Management Plans while the timing of offaldischarge is managed on longline vessels. Offal provides food for birds and to alesser extent marine mammals. There is no evidence of hook losses from longlinesleading to chick mortalities from the bird population surveys. It is therefore unlikelythat indirect effects will create unacceptable impacts. Indirect effects on ETPspecies are subject to ongoing review by DOC as part of the Marine ConservationServices Programme.
References
Abraham and Thompson 2011b
Thompson et al., 2013a, b
Thompson et al., 2010
Richards et al., 2011
Richards and Abraham, 2013a; 2013b
Francis and Smith, 2010
Baird et al., 2012
Baird, 2011
Ministry of Fisheries Compliance Information sheet 8
New Zealand Gazette 2010
www.acap.aq
DOC, 2012
Baker et al., 2009
Hamilton and Baker, 2010
Thompson et al., 2013
Baird, 2008
OVERALL PERFORMANCE INDICATOR SCORE: All of the scoringissues for the 60 scoring guidepost are met.
For trawlers, all 80 scoring guidepost are met in all regions and twoof the three 100 scoring guideposts are met. A score of 95 is given.
For longliners, two of the three 80 scoring guideposts are met. Ascore of 75 is given and a condition raised.
The fishery has in place precautionary management strategies designed to: Meet national and international requirements; Ensure the fishery does not pose a risk of serious harm to ETP
species; Ensure the fishery does not hinder recovery of ETP species; and Minimise mortality of ETP species.
Scoring Issue SG 60 SG 80 SG 100
a
Gu
idep
ost
There are measures inplace that minimisemortality of ETPspecies, and areexpected to be highlylikely to achievenational andinternationalrequirements for theprotection of ETPspecies.
There is a strategy inplace for managing thefishery’s impact on ETPspecies, includingmeasures to minimisemortality, which isdesigned to be highlylikely to achievenational andinternationalrequirements for theprotection of ETPspecies.
There is a comprehensivestrategy in place for managingthe fishery’s impact on ETPspecies, including measures tominimise mortality, which isdesigned to achieve abovenational and internationalrequirements for the protectionof ETP species.
Met? Y Y (trawl) N (longline) N
Key legislation for ETP species includes the Fisheries Act (1996), the Wildlife Act(1953), which also protects specific fish species, Marine Mammals Protection Act(1978), and specific regulations for birds (relating to bycatch mitigationapproaches). Combined with the requirement to report injury or mortality ofprotected species to the Department of Conservation without offence, and theobserver programme on board trawlers, these provide a strategy to monitor thefishery and hence implement the legislation. An environmental risk assessmentprocess has been performed to support the revision of New Zealand’s NPOA –Seabirds, by identifying those species most under pressure from additional mortalityabove natural levels. A new NPOA sharks has been finalised and is publicallyavailable.
General mitigation approaches for trawlers, supported through legislation, includevoluntary industry-led codes of practice. These include individual vesselsdeveloping a Vessel Management Plan, which cover methodologies to limit offaldischarge during periods of vulnerability for birds, and which are audited by MPIobservers. This approach allows mitigation methods to be adapted to the particularsof vessel operations, but as a result may be unable to eliminate interactions. In turn,regulations require the use of one of three potential bird scaring devices: pairedstreamer lines, a bird baffler or warp deflector, which must be deployed as soon aspossible after trawl shooting by all vessels 28 m or greater in length (we note thatthere are a number of vessels under 28m operating in LIN 3, 5 and 7 and arecommendation has been developed for this component of the fishery). Theefficacy of these devices has been examined in New Zealand and internationally(e.g., Bull 2009; Løkkeborg 2011). Streamer lines are the most effective in reducingseabird strikes on trawl warps. These devices have been shown through theobserver programme data to have successfully reduced mortalities through warpstrikes. The cleaning of the net before shooting is also required. Cleaning of the netbefore shooting is also required. Studies on trawl net interaction mitigationprocesses have been undertaken.. Reporting practices are also in place, so thatbird captures trigger action by DWG and are reported to MPI.
The fishery has in place precautionary management strategies designed to: Meet national and international requirements; Ensure the fishery does not pose a risk of serious harm to ETP
species; Ensure the fishery does not hinder recovery of ETP species; and Minimise mortality of ETP species.
Ju
sti
ficati
on
General mitigation approaches for longliners, supported through legislation, includevoluntary industry-led codes of practice. These include individual vessels’ VesselManagement Plans, which cover methodologies to limit offal discharge duringperiods of vulnerability for birds, and which are audited by MPI observers. Thisapproach allows mitigation methods to be adapted to the particulars of vesseloperations, but as a result may be unable to eliminate interactions. In turn,regulation requires the use of a streamer line during the setting of bottom longlineson vessels greater than 27 m in length, and therefore may not cover the whole fleet.Line weighting approaches are also used. Reporting practices are also in place, sothat bird captures trigger action by DWG and are reported to MPI.
While there are no specific regulations defining mitigation approaches for marinemammal interactions within this fishery, the industry has developed operatingprocedures to identify and react to marine mammal bycatch events. Reportingpractices are in place, so that marine mammal captures trigger action by DWG andare reported to MPI. In turn, operating procedures are also provided to minimise thedanger period when the trawl net is close to the surface, shallow turns whiletrawling, and to avoid discharging offal (as in the VMP for bird bycatch mitigation).Some vessels avoid shooting nets where marine mammals are present.
For ETP fish species, legislation provides the main strategy to minimise mortality.The implementation of this strategy is essentially operational. Fisheries plans underdevelopment for the hoki and deepwater trawl fisheries will include basking sharkwithin them.
For protected cold water corals, the operational strategy of towing within thehistorical footprint provides some protection to cold water corals, although it is notedthat corals are still brought up in trawls. The designation of Benthic ProtectionAreas, which include seamounts known to include such key species, act as a non-directed strategy for managing the fishery’s impacts on these species. While theeffectiveness of these areas relative to the overall population of protected coralshas not been specifically examined, risk assessments indicate that the ling fishery isunlikely to cause a risk to populations.
While operational plans appear effective, not all ETP are managed throughcomprehensive strategies, as defined by MSC, designed to exceed national andinternational requirements (e.g. basking sharks, corals). The 80 ievel is met fortrawlers. For longliners, information suggests that the (not regulated)implementation of bird-scaring devices may be less rigorous in the inshore sector.The 60 level is met but not the 80 and a condition raised.
b
Gu
idep
ost
The measures areconsidered likely towork, based onplausible argument(e.g., generalexperience, theory orcomparison withsimilarfisheries/species).
There is an objectivebasis for confidencethat the strategy willwork, based oninformation directlyabout the fishery and/orthe species involved.
The strategy is mainly based oninformation directly about thefishery and/or species involved,and a quantitative analysissupports high confidence thatthe strategy will work.
The fishery has in place precautionary management strategies designed to: Meet national and international requirements; Ensure the fishery does not pose a risk of serious harm to ETP
species; Ensure the fishery does not hinder recovery of ETP species; and Minimise mortality of ETP species.
Ju
sti
ficati
on
There is an objective basis for confidence that the strategy will work, based oninformation derived from scientific research, knowledge of species and theirinteractions with fisheries, global best practice, and past performance underoperational plans.
Seabirds: Tori lines (one of the three gazetted measures that can be selected forseabird bycatch reduction) are an international best practice measure for reducingwarp strikes. Quantitative analyses in other fisheries (involving some of the sameseabird species) demonstrate the efficacy of these devices. VMPs describe offalretention measures demonstrated to reduce seabird interactions with trawl gear.The efficacy of VMPs as a whole has not been tested. However, there is asubstantial body of work on fisheries waste management which showsquantitatively that holding waste, discharging in batches, etc is effective in reducingseabird interactions with vessels.
Fur seals: The OPMM is based on detailed knowledge (and expert opinion) ofmarine mammal species, the hoki/ling/ling fishery, and interactions with marinemammals. Quantitative analyses of fur seal interactions with the fishery have beenconducted. However, the efficacy of the particular measures the strategy containshave not been evaluated quantitatively in the fishery.
Protected corals: Spatial management measures have not yet been fully evaluatedwith respect to their efficacy in managing impacts on protected corals (e.g. inclusionof corals within closed areas especially BPAs, and representativeness of habitatsprotected). However, as noted the risk assessment indicates that the ling fishery isnot a risk factor for these species.
Protected fishes: No specific operational actions are in place to minimise capturesof protected fishes, specifically the basking shark, noting the rarity of interactions.
While the management strategy is multi-faceted, and considers information from thefishery, the efficacy of some components has not been evaluated quantitatively. Ascore of 80 is therefore given.
c
Gu
idep
ost There is evidence that
the strategy is beingimplementedsuccessfully.
There is clear evidence that thestrategy is being implementedsuccessfully.
Met? Y Y (trawlers) N (longline vessels)
For the framework in place, detailed monitoring is conducted by fisheries Observerson some vessels in some UoCs, at levels clearly sufficient to estimate interactionlevels and rates. Observers complete the “Vessel Management Plan/MarineMammal Operating Procedure Observer Reviews” form, as well as record ETPinteractions with fishing gear. Compliance monitoring of spatial management areasalso occurs; BPAs are monitored through VMS and observer coverage, andevidence shows that they are being adhered to. Camera surveys on closedseamounts have shown that the closure of areas with protected cold water coralswithin them has allowed recovery where impacts have occurred previously.
Strategic documents are also reviewed from time to time, e.g. the AnnualOperational Plan, the finalised NPOA – Sharks and legislation (reviews in recentyears have included the addition of new species as legally protected, revisedreporting regulations, and gazetting of required mitigation measures). A score of100 is therefore given for trawlers.
In turn, while there are clear regulations for the use of seabird scaring devices on
The fishery has in place precautionary management strategies designed to: Meet national and international requirements; Ensure the fishery does not pose a risk of serious harm to ETP
species; Ensure the fishery does not hinder recovery of ETP species; and Minimise mortality of ETP species.
longline vessels, the implementation and hence effectiveness of these approachesto mitigate bird interactions in inshore (longline) fisheries is less known. Given theintermittent and frequently limited observer coverage on these vessels, it cannotben said that there is clear evidence from available observations and informationfrom enforcement, that the existing strategy is being implemented successfully, anda score of 80 is given for the longline component.
d
Gu
idep
ost There is evidence that the
strategy is achieving itsobjective.
Met? N
Ju
sti
ficati
on
Management objectives to achieve environmental outcomes desired from the lingfishery focus on avoiding and minimising adverse environmental impacts, includingon ETP species. As noted, the strategic framework includes operational proceduresdeveloped with the intent of reducing impacts. However, empirical evidence that thestrategy is achieving its objectives is difficult to provide for all ETP. The 100 scoringguidepost is not met.
References
New Zealand Gazette 2010
Abraham and Thompson, 2011
Bull LS. 2009. New mitigation measures reducing seabird by-catch in trawlfisheries. Fish and Fisheries 10:408–427.
Deepwater Group Ltd., 2009.
Deepwater Group Ltd., 2011.
Department of Conservation. 2012.
MPI. 2013d.
Ministry of Fisheries. 2010
MPI, 2012b
MPI, 2013d
Ministry of Fisheries. 2011d.
New Zealand Gazette 2010.
Pierre et al., 2010.
Ramm, 2012.
Rowe, 2010.
Middleton and Abraham 2007
Bull 2009.
Løkkeborg 2011.
Clement and Associates 2009.
OVERALL PERFORMANCE INDICATOR SCORE: For trawlers, all of thescoring issues of the 60 and 80 scoring guideposts are met, and onecomponent of the 100 scoring guidepost. A score of 85 is given.
For longliners, two of the three 80 scoring guideposts are met, and ascore of 75 is given.
The fishery has in place precautionary management strategies designed to: Meet national and international requirements; Ensure the fishery does not pose a risk of serious harm to ETP
species; Ensure the fishery does not hinder recovery of ETP species; and Minimise mortality of ETP species.
Relevant information is collected to support the management of fisheryimpacts on ETP species, including:
Information for the development of the management strategy; Information to assess the effectiveness of the management strategy;
and Information to determine the outcome status of ETP species.
Ju
sti
ficati
on
The DOC Marine Conservation Services Programme aims to monitor the effects ofcommercial fishing on protected species. Estimates of captures for seabird andmarine mammal bycatch are publically available online.
Monitoring seabird mortality within trawl fisheries is a specific role of the observeron board vessels. The coverage of observers has been sufficient to developreasonably precise estimates of the likely total mortality of seabirds, and to monitortrends in the mortalities over time, including the impacts of bird mortality mitigationapproaches discussed under 2.3.2. Captures are observed by 'type', includingentanglement within the net and warp strikes.However, the limited observer coverage ofinshore longline fishing vessels means the impact of these vessels on ETPpopulations is a concern, particularly given the potential impact of that componenton some ETP groups. This is discussed further under element c. Surveys of birdpopulations are underway, and estimates of breeding population size are availablewhich allow quantitative estimates of outcome status. There remain difficulties inassessing non-warp strike bird mortalities such as those related to netentanglements, for specific fisheries.
Monitoring of marine mammal mortalities within the fisheries is also a specific roleof the observer on board vessels. The coverage of observers has been sufficient todevelop estimates of the likely total mortality of marine mammals, and to monitortrends in the mortalities over time. Where information is less robust, specific datacollection initiatives have been developed. Surveys of relevant marine mammalpopulations are underway, but these are not yet able to definitively indicateabundance levels in all areas to allow the outcome status to be identified with a highdegree of certainty.
For particular protected fish species (e.g. basking sharks), specific projects havebeen funded in an attempt to gather some information on population sizes. In turn,tagging projects have been performed on great white sharks. Low interaction ratesnoted by observers do allow quantitative estimates to be made.
Cold water corals captured in trawls are noted by observers present onboard, andwhere they cannot be identified they are returned to experts on shore for moredetailed examination. Fishery-independent surveys are also underway usingcameras inside and outside the main fishery areas and the recovery of corals withinnewly closed areas of the New Zealand EEZ have been undertaken. Furtherprojects have examined other biological aspects of cold water corals. These datahave been combined to examine the overlap of fishing vessel operations with thedistribution of protected cold water corals to be identified, and a risk-basedevaluation of the potential degree of impacts undertaken.
Areas or fishing units where observer coverage has been low, and for specieswithout a robust population estimate, the outcome status of ETP species cannot bequantitatively estimated with a high degree of certainty. A score of 80 is thereforegiven.
b
Gu
idep
ost
Information isadequate to broadlyunderstand the impactof the fishery on ETPspecies.
Information is sufficientto determine whetherthe fishery may be athreat to protection andrecovery of the ETPspecies.
Accurate and verifiableinformation is available on themagnitude of all impacts,mortalities and injuries and theconsequences for the status ofETP species.
Relevant information is collected to support the management of fisheryimpacts on ETP species, including:
Information for the development of the management strategy; Information to assess the effectiveness of the management strategy;
and Information to determine the outcome status of ETP species.
Ju
sti
ficati
on
Information from the observer programme is sufficient to support the strategy of birdmitigation to manage impacts, and data have shown decreases in bycatch followingthe introduction of mitigation methods, allowing the impact to be identified with areasonably high degree of certainty. This programme also provides information onthe interactions between gears and sea mammals, ETP fish species and coral.Combined with the fishery-independent underwater surveys, they allow theeffectiveness of any mitigation approaches to be evaluated. However, for manyseabird species and fur seals, population estimates can be dated or imprecise andfate information is not comprehensive. Current information has, however, allowedrisk assessments to be performed on fishing risks to ETP species populations formain fishery groups (trawl, offshore and inshore bottom longliner groups). A scoreof 80 is given.
c
Gu
idep
ost
Information isadequate to supportmeasures to managethe impacts on ETPspecies.
Information is sufficientto measure trends andsupport a full strategyto manage impacts onETP species.
Information is adequate tosupport a comprehensivestrategy to manage impacts,minimize mortality and injury ofETP species, and evaluate witha high degree of certaintywhether a strategy is achievingits objectives.
Met? Y Y (trawlers LIN3-7) N(longliners LIN3-7)
N
Information on ETP species available through observer data collection and scientificresearch is sufficient to support a full strategy to manage impacts on ETP species.For seabirds, effective bycatch reduction measures are known, for example,monitoring of warp strikes has indicated reductions in Salvin's albatross and white-cappedalbatross within fisheries following the introduction of mandatory warp mitigation inJanuary 2006 For fur seals, some effective bycatch reduction measures are known,and others (which would benefit from testing) are based on expert opinion andobservation of the species. Fishing impacts on protected coral species aredetermined by weight, and managed using spatial measures. Knowledge of thedistribution of coral species is broadly known in areas of relevance to the fishery. Anumber of population-level research projects are also underway on other ETPspecies, which will provide information useful for management.
Trends in fisheries captures and mortalities are measured through observer datacollection. Trends can be derived using effort information and observations fromspecific years, these interpolations can only be adequate to support measures(SG60), rather than sufficient to measure trends (SG80) given the additionaluncertainty that results in the modelling process, and the potential for unusual yearsto form the basis of model results. Available reports providing estimates by UoCdemonstrate the patchy nature of data. Where observer coverage has beenrelatively high (e.g. LIN6), confidence intervals remain relatively high, suggestingbycatch patterns that vary, and which affect the measurement of trends.
Relevant information is collected to support the management of fisheryimpacts on ETP species, including:
Information for the development of the management strategy; Information to assess the effectiveness of the management strategy;
and Information to determine the outcome status of ETP species.
Ju
sti
ficati
on
Data coverage and time series is considered through expert opinion to be sufficientwithin the trawl fisheries in LIN3-7 to provide information sufficient to measuretrends and support a full strategy, and a score of 80 is given.
Although expert opinion has been used to make this judgment, a fullerunderstanding would require further inputs from the modelling approach to identifywhat is a 'sufficient' level for each unit of certification.
PI 2.4.1The fishery does not cause serious or irreversible harm to habitat structure,considered on a regional or bioregional basis, and function
Scoring Issue SG 60 SG 80 SG 100
a
Gu
idep
ost
The fishery is unlikelyto reduce habitatstructure and functionto a point where therewould be serious orirreversible harm.
The fishery is highlyunlikely to reducehabitat structure andfunction to a pointwhere there would beserious or irreversibleharm.
There is evidence that thefishery is highly unlikely toreduce habitat structure andfunction to a point where therewould be serious or irreversibleharm.
Met? Y Y N
Trawlers
As the trawl net is deployed to towing depth, pelagic habitats will experience short-term disruption. Some disruption of the water column and its inhabitants will alsooccur as the net is towed. However, longer term and more severe effects of thefishery on habitat structure are benthic, given the bottom trawl method widely used.The degree of trawling impact on the seabed will be dependent upon sedimenttypes, and is some concern. Research in other geographic areas and studies of theimpacts of trawling on the Chatham Rise have identified the stirring of sedimentsand benthos, the degree of impacts dependent upon the substrate type and level ofprevious trawl disturbance events. The footprint of the trawl fisheries has beenexamined within the New Zealand EEZ.
Currently, the best single tool currently available to evaluate benthic habitat types isthe Benthic-Optimised Marine Environment Classification (BOMEC) for NewZealand waters. The pattern of New Zealand's trawl footprint for deepwater fisherieshas been monitored relative to the BOMEC categories. The estimated swept area ofthe gear in relation to the BOMEC category areas within the New Zealand EEZ as awhole (rather than within the individual regions of certification under thisassessment) has been less than 5%, and generally less than 2%.
Examinations of the trawl footprint by LIN region have also been undertaken.Trawling occurred mainly in the 300-600m depth zone, sweeping a maximum of7.9% of that depth band in LIN5.
Vessel operational strategy indicates that the same tracks are being trawled; it ishighly unlikely that habitat structure and function will be degraded further, pendingappropriate management action.
Lost gear events appear to be rare, and given the value of the gear all efforts aremade to retrieve any that are lost.
The examination of the trawl footprint of the fishery relative to the area of BOMECclassifications and LIN fishery areas provides evidence that the fishery is highlyunlikely to reduce habitat structure and function to a point where there would beserious or irreversible harm. However, further evidence on the basis of the inter-relationship between the BPAs, ground-truthing of the latest habitat classification(relative to the rate of recovery following disturbance), combined with the currentanalysis of trawl paths, is recommended to increase the score. Note that issues withcold water corals are dealt with under PI2.3. A score of 80 is given.
PI 2.4.1The fishery does not cause serious or irreversible harm to habitat structure,considered on a regional or bioregional basis, and function
Ju
sti
ficati
on
Longliners
The impacts of demersal longlining on the benthic habitat will be limited to themovement of longlines and anchors across the bottom on shooting and hauling, aswell as due to shifting that results from underwater currents. Bottom-set longlinesmay snag on benthic epifauna, particularly to those corals that have a branching orbushy structure, and irregular objects on the bottom, and may damage or moveobjects, but may also break and gradually entangle itself around bottom features.The key determinant of the effects of longlines is how far they travel over theseabed during setting and retrieval. In addition to the line and hooks, anchors canbe pulled some distance across the seabed before ascending. In general, however,longline fisheries offer the potential to conduct fisheries with less significant habitatdamage. Impacts are generally considered to be relatively minor (but certainly notnegligible). In turn, cold water corals are known to occasionally be brought up onlonglines, although the potential impact is expected to be much lower than trawls,despite the fact that these gears can fish inside BPAs. A recent report on thedistribution of coral species (primarily considered under 2.3) indicated that 'bottomlongline fisheries... operate in areas where protected corals are found but the catchfrom these fisheries is not well understood.' This demonstrates the potential forbenthic interactions, but these are expected to be negligible compared to bottomtrawling. A score of 80 is given.
References
Black et al. 2013
Black, 2013
Hewitt et al., 2011
Snelder et al., 2005, 2006
Leathwick et al., 2006
Bowden et al. 2011
MPI, 2012
OVERALL PERFORMANCE INDICATOR SCORE: The fishery satisfies the scoringissues for the 60 scoring guidepost and the scoring issues of the 80 scoringguidepost, but not the 100 scoring guidepost.
PI 2.4.2There is a strategy in place that is designed to ensure the fishery does notpose a risk of serious or irreversible harm to habitat types
Ju
sti
ficati
on
The Marine Reserves Act (1971) provides the basis for enacting protected areaswithin New Zealand, while the Conservation Act (1987), Wildlife Act (1953), andFisheries Act (1996) also provide a framework for implementation. The NewZealand Biodiversity Strategy (2000) identified the need to develop a MarineProtected Areas Policy to protect a full range of natural marine habitats andecosystems to effectively conserve marine biodiversity, using a variety ofappropriate mechanisms, including legal protection. The MPI Strategy forManagement of the Environmental Effects of Fishing provides a further frameworkfor managing impacts, aiming to implement an Ecosystem Approach to Fisheries,make significant improvements in managing the environmental effects of fishing,and to ensure the Ministry for Primary Industries meets its environmentalobligations under the Fisheries Act 1996 and other legislation in an efficient andconsistent manner.
Trawlers
While the processes are ongoing, currently around a third of the New Zealand EEZhas been encompassed by Benthic Protection Areas (from 2007). The requirementfor the BPA design was to encompass not less than 10% of each oceanic class ofthe MEC and each oceanic class was to be represented in two or more BPAs. Theywere also spread by latitude and longitude throughout the New Zealand EEZ, whichruns from sub-tropical waters to sub-Antarctic waters, and to protect benthichabitats over a range of depths. The designated BPAs are indicated to protect: 28percent of Underwater Topographic Features (including seamounts); 52 percent ofseamounts (underwater mountains over 1000 metres in height); and 88 percent ofactive hydrothermal vents. Demersal trawling and dredging is prohibited in theseareas (pelagic fishing and demersal longlining being allowed). In turn, data continueto be collected to underpin studies. Further development of Marine Protected Areascontinues primarily within the Territorial Sea (from the coast to the 12-mile limit).
Combined, the BPAs and seamount closures, along with the operational strategy oftowing within the path of historical trawl footprints, represent a partial strategy. Thefishery does not have a cohesive and strategic arrangement in place to manage thefishery impacts on habitats, which also includes mechanisms for the modificationfishing practices in the light of the identification of unacceptable impacts (MSC2011). For example, the work overlaying trawl tracks and habitat types is extremelyinformative, but there is no clear link between the findings and its use formanagement of habitat impacts. Issues for consideration could include when animpact on a habitat class is deemed worthy of management attention, how practicesmight be changed to manage identified impacts, any restrictions on trawling newareas or trawl gear, etc. A score of 80 is therefore given.
Longliners
In addition to the partial strategy given by the legislative framework detailed above,the further strategy for longliners is an operational one - impacts of demersallongline fishing will be reduced when compared to those of demersal trawls, andany impacts will be highly localised. A score of 80 is given.
b
Gu
idep
ost
The measures areconsidered likely towork, based onplausible argument(e.g. generalexperience, theory orcomparison withsimilarfisheries/habitats).
There is someobjective basis forconfidence that thepartial strategy willwork, based oninformation directlyabout the fishery and/orhabitats involved.
Testing supports highconfidence that the strategy willwork, based on informationdirectly about the fishery and/orhabitats involved.
PI 2.4.2There is a strategy in place that is designed to ensure the fishery does notpose a risk of serious or irreversible harm to habitat types
Ju
sti
ficati
on
Reporting of interactions between fisheries and habitats is critical to understandinghabitat impacts. Spatial management is the most effective measure currentlydeployed for mitigating habitat impacts due to demersal trawling and the closure ofareas such as seamounts and the Benthic Protection Areas, combined with theirlocation, the use of VMS and the analysis of trawl tracks relative to BOMEC areasprovides an objective basis that the partial strategy will work. A score of 80 is given.We noted that there was a proposal to review BPAs in 2013, which has not as yetbeen progressed.
c
Gu
idep
ost
There is someevidence that thepartial strategy is beingimplementedsuccessfully.
There is clear evidence that thestrategy is being implementedsuccessfully.
Met? Y N
Ju
sti
ficati
on
Fisheries observers monitor compliance with the boundaries of Benthic ProtectionAreas or other closed areas, particularly on trawl vessels where coverage hasgenerally been more consistent. The MPI and DWG are able to follow up ifcompliance anomalies are detected. VMS data from trawl vessels also providesinformation on the trawl footprint which has been related to the BOMEC areas.There is therefore clear evidence that the strategy as stands is being implementedsuccessfully. This provides some evidence that the partial strategy is beingimplemented. A score of 80 is given.
d
Gu
idep
ost There is some evidence that the
strategy is achieving itsobjective.
Met? N
Ju
sti
ficati
on
As noted in b), a strategy is not considered to be in place.
References
Black et al., 2013
DOC, 2012
DOC, 2005
MPI, 2012b
OVERALL PERFORMANCE INDICATOR SCORE: The fishery satisfies the scoringissues for the 60 scoring guidepost and the scoring issues of the 80 scoringguidepost, but none at the 100 scoring guidepost.
PI 2.4.3Information is adequate to determine the risk posed to habitat types by thefishery and the effectiveness of the strategy to manage impacts on habitattypes
Scoring Issue SG 60 SG 80 SG 100
a
Gu
idep
ost
There is basicunderstanding of thetypes and distributionof main habitats in thearea of the fishery.
The nature, distributionand vulnerability of allmain habitat types inthe fishery are knownat a level of detailrelevant to the scaleand intensity of thefishery.
The distribution of habitat typesis known over their range, withparticular attention to theoccurrence of vulnerablehabitat types.
Met? Y Y N
Ju
sti
ficati
on
Oceanography and primary productivity has been well studied through projects andremote sensing studies. Fairly extensive benthic surveys have been performed ofseabed types around the New Zealand continental shelf and seamounts.Characteristics of habitats within the New Zealand EEZ have been classified andmapped through several projects, e.g. the Marine Environment Classification, theOceans 20/20 work (e.g. on the Chatham rise; the Chatham-Challenger project),and BOMEC. The projects aimed to map and compare habitats and diversity of sea-bed communities in fishable depths at key locations across the Chatham Rise andthe Challenger Plateau, using both acoustic mapping approaches and underwatercamera work to map biodiversity and habitat types. In turn, the Ocean Survey 20/20(OS 20/20) project aimed to map the seafloor habitats and biodiversity of NewZealand’s marine environment across large areas of the EEZ, concentrating on theChatham Rise and Challenger Plateau. The location of key vulnerable habitat types(smokers, hydrothermal vents etc) is known.
Habitat mapping data, combined with the results of specimen collections fromknown trawl locations by fisheries observers, allow the nature, distribution andvulnerability of main habitat types to be known in the fishery, at a level of detailrelevant to the scale and intensity of the fishery. Beyond areas of fishing activity,the degree of habitat knowledge at sub-regional scales is patchier. In turn, thefootprint of the fishery is well established through VMS records and the TCEPRdata, and has been used within risk assessments for key benthic species. However,the extent of habitat knowledge at sub-regional scales, including for vulnerablehabitat types, is patchier. A score of 80 is therefore given.
b
Gu
idep
ost
Information isadequate to broadlyunderstand the natureof the main impacts ofgear use on the mainhabitats, includingspatial overlap ofhabitat with fishinggear.
Sufficient data areavailable to allow thenature of the impacts ofthe fishery on habitattypes to be identifiedand there is reliableinformation on thespatial extent ofinteraction, and thetiming and location ofuse of the fishing gear.
The physical impacts of thegear on the habitat types havebeen quantified fully.
PI 2.4.3Information is adequate to determine the risk posed to habitat types by thefishery and the effectiveness of the strategy to manage impacts on habitattypes
Ju
sti
ficati
on
Data from surveys, logbooks and the observer programme are available to allowimpacts of the fishery on habitat types to be identified. The VMS provides reliableinformation on the spatial extent, timing and location of use of the fishing gear. Inturn, reviews of the distribution of BOMECs and recent fishing trawl survey trackshas clarified the distribution and change of the fishery footprint relative to theecosystem, providing an assessment of the main areas of potential impact sensitiveto recovery times. The changes within previously fished habitats inside BPAs overtime have been examined, particularly for seamounts. That on the main fished areahas not been examined, and is inferred from literature on other fisheries; demersaltrawling is a fishing method that typically destroys habitat features and complexity.The observer programme notes benthic invertebrates brought up in the trawls, whilerecords are also available from observers on longline vessels. Taxonomic guidesdeveloped by NIWA for cold water corals and sponges are improving speciesrecognition, while still unidentified corals are returned for professional taxonomicidentification. The body of information on the physical impacts of the gear on habitatis therefore growing, but cannot be said to have been quantified fully. A score of 80is therefore given.
c
Gu
idep
ost
Sufficient data continueto be collected todetect any increase inrisk to habitat (e.g. dueto changes in theoutcome indicatorscores or the operationof the fishery or theeffectiveness of themeasures).
Changes in habitat distributionsover time are measured.
Met? Y N
Ju
sti
ficati
on
The continuation of the observer programme, logbook records, and surveys,provides sufficient data to detect any increase in risk to habitat. The continuedcollection of information and study of cold water corals has allowed riskassessments to be performed for the fisheries in general, and the continued overlayof BOMEC distributions and trawl footprints provides a mechanism to identifyincreased risk. However, no regular sampling regimes exist that are designed tomeasure changes in habitat distributions over time. A score of 80 is therefore given.
References
Snelder et al., 2007
Leathwick et al. 2009
Bowden et al. 2011
Hewitt et al., 2011
Black et al., 2013
OVERALL PERFORMANCE INDICATOR SCORE: : The fishery satisfies the scoringissues for the 60 scoring guidepost and the scoring issues of the 80 scoringguidepost, but none at the 100 scoring guidepost.
PI 2.5.1The fishery does not cause serious or irreversible harm to the key elements ofecosystem structure and function
Scoring Issue SG 60 SG 80 SG 100
a
Gu
idep
ost
The fishery is unlikelyto disrupt the keyelements underlyingecosystem structureand function to a pointwhere there would bea serious orirreversible harm.
The fishery is highlyunlikely to disrupt thekey elementsunderlying ecosystemstructure and functionto a point where therewould be a serious orirreversible harm.
There is evidence that thefishery is highly unlikely todisrupt the key elementsunderlying ecosystem structureand function to a point wherethere would be a serious orirreversible harm.
Met? Y Y N
Ju
sti
ficati
on
At an EEZ level, New Zealand fisheries have been preliminarily assessed to besustainable in an energetic context. However, Knight et al. (2011) note that thisenergetic-based sustainability assessment is not a replacement for a food web-based analysis, and that their frameworks are appropriately deployed as a high-level guide for monitoring cumulative effects of multiple fisheries, rather thanconsidering removals at a species-specific level.
Beyond energetic demands, high volume removals of species are expected to resultin some level of ecosystem effects. Relative to this, the Chatham Rise fishery isbest understood as change is ongoing; the ecosystem has not stabilised at analternative state. However, studies show: no evidence of loss of communityconstituents, although mean trophic level of commercial and trawl survey catches isdeclining, i.e. fishing is affecting higher trophic levels. There is also evidence forchanges in species abundance; no evidence of loss of ecosystem function; noevidence of loss of species over time. However, in other systems biogeochemicalcycles have been reported to be disrupted by bottom trawling. This can beevaluated using the presence and dynamics of organisms over time.
Based upon logical argument and the position of ling within the ecosystem in theareas under certification, the extraction of ling and the range of QMS and non-QMSspecies from the ecosystem through the fishery is unlikely to disrupt key elementsof underlying ecosystem structure and function.
Ecosystem models developed for the sub-Antarctic region and Chatham Rise havenot yet been specifically used to assess whether fishery removals at current levels(with stocks often well above single species BMSY levels) may impact upon themodelled ecosystems. However, the trophic model of the Southern Plateauecosystem, where hoki, rather than ling, forms a large part of the fish component,suggests the area has low productivity and energy transfer between components isefficient. A model for Chatham Rise suggests a more productive web. Stock sizes ofling in these areas indicate there remains a sizeable proportion of biomass in theecosystem, and removals at this level are unlikely to lead to serious harm. This isparticularly true given the recovery of the hoki population within these ecosystems.
Developing understanding of relationships between ecosystem components (e.g.functional groups), indicators and fishery characteristics would effectively contributeto improving management. “Evidence” in this SG requires a 20% probability that thetrue status of the component is within the range where there is risk of serious orirreversible harm. Sufficient uncertainty exists on the impact of fishing for thisspecific species such that further work on ecosystem effects of the fishery would beworthwhile, particularly for less-studied areas. A score of 80 is given.
PI 2.5.1The fishery does not cause serious or irreversible harm to the key elements ofecosystem structure and function
Tuck et al. 2009
Thrush and Dayton, 2002
MacDarmid et al., 2005
Bradford-Grieve et al., 2003
OVERALL PERFORMANCE INDICATOR SCORE: The fishery satisfies the scoringissues for the 60 scoring guidepost and the scoring issues of the 80 scoringguidepost, but not the 100 scoring guidepost.
PI 2.5.2There are measures in place to ensure the fishery does not pose a risk ofserious or irreversible harm to ecosystem structure and function
Scoring Issue SG 60 SG 80 SG 100
a
Gu
idep
ost There are measures in
place, if necessary.There is a partialstrategy in place, ifnecessary.
There is a strategy that consistsof a plan, in place.
Met? Y Y Y
Ju
sti
ficati
on
The partial strategy in place is represented by the TACCs in operation within thefishery for all the QMS species, combined with numerous measures in place toreduce impacts of the fishery on individual ecosystem components (and therebystructure), e.g., for ETP species as described above (PI 2.3.2), and the target (e.g.PI 1.1.1, 1.1.2), retained (PI 2.1.2) and bycatch (PI 2.2.2) species. This takes intoaccount available information collected through the logbook system, observerprogramme and fishery-independent surveys. In addition, implementation of BPAswill help maintain ecosystem integrity in nearby areas.
There are no measures in place relating to ecosystem function specifically. Thereis, however, a legislative, policy and operational framework to manage ecosystemimpacts, and address knowledge gaps relevant to fishery management, whichbuilds upon the partial strategy. This includes components such as: The FisheriesAct (to avoid, remedy or mitigate any adverse effects of fishing on the aquaticenvironment) and Wildlife Act; The Annual Operational Plan for DeepwaterFisheries; The National Fisheries Plan for Deepwater and Middle-depth Fisheries;and research specifications for the 10 year research programme for deepwaterfisheries, which includes a specific focus on ecosystem functioning and trophiclinkages.
The result of these elements includes to maintain QMS species at or above targetlevels, limit impacts on non-QMS species, and reduce the impact of gear onhabitats. While they do not form a specific strategy aimed primarily at ecosystemmaintenance, they work together to do so to form a plan. A score of 100 istherefore given.
b
Gu
idep
ost
The measures takeinto account potentialimpacts of the fisheryon key elements of theecosystem.
The partial strategytakes into accountavailable informationand is expected torestrain impacts of thefishery on theecosystem so as toachieve the EcosystemOutcome 80 level ofperformance.
The strategy, which consists ofa plan, contains measures toaddress all main impacts of thefishery on the ecosystem, andat least some of thesemeasures are in place. Theplan and measures are basedon well-understood functionalrelationships between thefishery and the Componentsand elements of the ecosystem.
This plan provides fordevelopment of a full strategythat restrains impacts on theecosystem to ensure the fisherydoes not cause serious orirreversible harm.
PI 2.5.2There are measures in place to ensure the fishery does not pose a risk ofserious or irreversible harm to ecosystem structure and function
Met? Y Y N
Ju
sti
ficati
on
The measures listed above either require some consideration of impacts (e.g. theFisheries Act), take account of them with the intent of delivering better management(e.g. fisheries management objectives), or seek to manage them to reduce theenvironmental effects of fishing (e.g. ETP bycatch measures). Furthermore,research outcomes are fed back into management, although in the areas ofecosystem structure and function, stronger links could be developed. Whereunacceptable impacts are detected, the current framework allows them to beaddressed, including through fishery management measures. It is noted that, todate, responses have focussed on individual ecosystem components (e.g. targetstock status, seabird bycatch levels) rather than broader effects, demonstrating thatwhile the elements naturally work together, this is not through a specific ecosystemdesign; they are currently not developed across ecosystem components/functionsto the level required for the SG100 level. A score of 80 is therefore given.
c
Gu
idep
ost
The measures areconsidered likely towork, based onplausible argument(e.g., generalexperience, theory orcomparison withsimilarfisheries/ecosystems).
The partial strategy isconsidered likely towork, based onplausible argument(e.g., generalexperience, theory orcomparison with similarfisheries/ecosystems).
The measures are consideredlikely to work based on priorexperience, plausible argumentor information directly from thefishery/ecosystems involved.
Met? Y Y N
Ju
sti
ficati
on
Strategic and operational measures that are in place are considered likely to work,based on information about the fishery and ecosystem components involved (e.g.target and retained species, some ETP species, habitat). For example, targetspecies stocks have been actively managed, fish species brought under the QMSstructure, and seabird bycatch mitigation measures introduced, to addresssustainability concerns specifically, while BPAs have been put in place. Annualreview of the Annual Operational Plan for Deepwater Fisheries provides a naturalforum for reviewing the efficacy of measures, and identification of ongoing and newissues. Detailed monitoring of many aspects of the fishery (e.g. catches of target,retained species, and bycatch) allows such review.
Ling is not a low trophic level species and current populations are likely or highlylikely to be above the target biomass reference levels. However, it is also a subsetof the hoki fishery and a bycatch in hoki-targeted trawls. Indeed the role of hoki inthe fishery, and the response of the ecosystem to hoki removals, has been studiedin greater depth than that of ling across the fishery areas evaluated here. Thisprovides plausible argument that the strategy for the ling fishery is likely to work. Itwill be monitored during the surveillance audits based upon the decisions made onTACC levels - noting the potential for increased ling bycatch in hoki targeted fishing-which have generally remained unchanged following recovery of the hoki fishery.
A score of 80 is given.
d
Gu
idep
ost
There is someevidence that themeasures comprisingthe partial strategy arebeing implementedsuccessfully.
There is evidence that themeasures are beingimplemented successfully.
PI 2.5.2There are measures in place to ensure the fishery does not pose a risk ofserious or irreversible harm to ecosystem structure and function
Ju
sti
ficati
on
With particular reference to individual ecosystem components (rather thanfunctions), there is evidence that the strategy is being implemented successfully.For example, stock assessments of the target and retained species and monitoringof incidental mortalities of ETP species are ongoing, combined with fishery-independent surveys for many areas, while TACCs and other control mechanismsare being monitored and for the main species adjusted where necessary. BPAs aremonitored through observer and VMS coverage, and as part of the partialmanagement strategy should provide some ecosystem buffering. There is thereforeevidence that the approaches are being implemented successfully. A score of 100is given.
References
MPI, 2013a, b, c
Ministry of Fisheries 2010b
New Zealand Gazette, 2010
Thompson et al., 2013a
Richard and Abraham, 2013a
Baird et al., 2012
Francis and Lyon, 2012
Horn, 2013a, b
OVERALL PERFORMANCE INDICATOR SCORE: The fishery satisfies the scoringissues for the 60 scoring guidepost and the scoring issues of the 80 scoringguidepost, and two of the four at the 100 scoring guidepost.
PI 2.5.3 There is adequate knowledge of the impacts of the fishery on the ecosystem
Scoring Issue SG 60 SG 80 SG 100
a
Gu
idep
ost
Information isadequate to identifythe key elements ofthe ecosystem (e.g.,trophic structure andfunction, communitycomposition,productivity patternand biodiversity).
Information is adequateto broadly understandthe key elements of theecosystem.
Met? Y Y
Ju
sti
ficati
on
Stomach content analysis projects have been performed provides information toadequately broadly understand the functions of the key elements of the ecosystem,including trophic structure, community composition, productivity and biodiversity.Studies on the Chatham Rise have expanded existing analyses, and include thediet of juvenile fish of key species. However, recent projects have not examined thepredators of the key fish species, although they are generally understood. Thestructure of the mid-water food web is broadly understood for the Chatham Riseand Sub-Antarctic areas through a number of studies, which underpin ecosystemmodels. No model has yet been developed for the west Coast South Island butinformation from areas is adequate to broadly understand the key elements of theecosystem. Given the different ecosystems covered by existing models and studies,information is adequate to broadly understand the functions of the key ecosystemelements. A score of 80 is given.
b
Gu
idep
ost
Main impacts of thefishery on these keyecosystem elementscan be inferred fromexisting information,and have not beeninvestigated in detail.
Main impacts of thefishery on these keyecosystem elementscan be inferred fromexisting informationand some have beeninvestigated in detail.
Main interactions between thefishery and these ecosystemelements can be inferred fromexisting information, and havebeen investigated.
Met? Y Y Y (LIN3&4, LIN5&6), N (otherLIN areas)
Ju
sti
ficati
on
The main impacts of the fishery on the ecosystem elements can be inferred fromthe stock assessments (for key species), QMS catch trends, and surveys whichcover the target, related species, and most levels of the ecosystems. Investigationshave been particularly detailed on the Chatham Rise. For the Southern Plateau andChatham Rise (LIN 3&4, LIN 5&6) existing models includes ling within fish groups,and have been used to investigate the impacts of fishing on those ecosystems andfeed into the fishery management process; hence the main interactions have beeninvestigated for the ling fishery. For LIN3- LIN6, therefore, a score of 100 is given.For other LIN areas, where models have not been used (but impacts can beinferred from existing models, noting that specific ecosystem elements have beeninvestigated through existing target, bycatch, ETP and habitat studies) a score of 80is given.
PI 2.5.3 There is adequate knowledge of the impacts of the fishery on the ecosystem
cG
uid
ep
ost
The main functions ofthe Components (i.e.,target, Bycatch,Retained and ETPspecies and Habitats)in the ecosystem areknown.
The impacts of the fishery ontarget, Bycatch, Retained andETP species are identified andthe main functions of theseComponents in the ecosystemare understood.
Met? Y N
Ju
sti
ficati
on
The main functions of the components of the ecosystem have been identifiedthrough the ecosystem sampling programme undertaken to parameterise theecosystem models for the Chatham Rise and sub-Antarctic regions around NewZealand. It is noted that ecosystem data for the west of New Zealand is lessabundant. The main functions of ecosystem components are known, though not indetail for some species. Diet studies have been integral to the development of thisknowledge.
The impacts of the fishery on main functions of the target, bycatch, and ETPspecies components are identified through ongoing monitoring that is a corecomponent of the fishery management regime, and the main functions of some ofthese species can be understood from existing information. However, for somebycatch species and protected benthic species, knowledge of ecosystem functionsis minimal, or absent. There is also the potential for trawl gear to affect theproductivity of benthic communities. Scientific research suggests that while certaincommunities will be adversely affected, others might benefit from increasedavailability of particular organisms, and that productivity may overall be increased.
A score of 80 is therefore given.
d
Gu
idep
ost
Sufficient information isavailable on theimpacts of the fisheryon these Componentsto allow some of themain consequences forthe ecosystem to beinferred.
Sufficient information isavailable on the impacts of thefishery on the Components andelements to allow the mainconsequences for theecosystem to be inferred.
Met? Y Y (LIN3&4 and LIN5&6), N(other LIN areas)
Ju
sti
ficati
on
Information from the observer programme, and logbooks (for the main 5 species inthe catch) as well as continued sampling of stomachs, allow the mainconsequences for the ecosystem to be inferred. The developed Ecopath modelsallow the impacts of the fishery on components to be examined, although thisanalysis has not yet been performed for areas other than LIN4. There is thereforeconsiderable knowledge about the ecosystem components, and some elementsthat the fishery coexists with. While the consequences of fishery impacts on someecosystem characteristics are not well understood, sufficient information is availableon the components and elements of the ecosystem to allow the main consequencesof the fishery to be inferred in LIN3-LIN6, as evidenced by the ecosystem modelsdeveloped for these regions. A score of 100 is therefore given. For other areas, thereduced survey frequency and lack of an existing ecosytem model reduce the scorefor this region, noting that sufficient information is still available on the impacts ofthe fishery on the Components to allow some of the main consequences for theecosystem to be inferred. A score of 80 is given.
PI 2.5.3 There is adequate knowledge of the impacts of the fishery on the ecosystem
eG
uid
ep
ost
Sufficient data continueto be collected todetect any increase inrisk level (e.g., due tochanges in theoutcome indicatorscores or the operationof the fishery or theeffectiveness of themeasures).
Information is sufficient tosupport the development ofstrategies to manageecosystem impacts.
Met? Y Y
Ju
sti
ficati
on There is a growing body of information available on the ecosystem components in
which ling occurs and interacts. Linkages between all ecosystem components andthe ling fishery cannot be quantified, making the scale of responses to changes infishing patterns difficult to predict. However, sufficient information is available tosupport the development of strategies to manage ecosystem impacts. A score of100 is given.
References
Dunn et al., 2010
Stevens et al., 2011
Horn, 2013a,b
Pinkerton, 2011
Bradford-Grieve et al., 2003
Horn and Dunn, 2010
Baird 2011
OVERALL PERFORMANCE INDICATOR SCORE: The fishery satisfies thescoring issues for the 60 scoring guidepost and the scoring issues of the80 scoring guidepost. For LIN3&4 and LIN5&6, three of the four 100 scoringguideposts are met and the score is 95. For other LIN areas, one of the four100 scoring guideposts are met and the score is 85.
The management system exists within an appropriate legal and/or customaryframework which ensures that it: Is capable of delivering sustainable fisheries in accordance with MSC
Principles 1 and 2; and Observes the legal rights created explicitly or established by custom of
people dependent on fishing for food or livelihood; and Incorporates an appropriate dispute resolution framework.
Scoring Issue SG 60 SG 80 SG 100
a
Gu
idep
ost
There is an effectivenational legal systemand a framework forcooperation with otherparties, wherenecessary, to delivermanagementoutcomes consistentwith MSC Principles 1and 2
There is an effectivenational legal systemand organised andeffective cooperationwith other parties,where necessary, todeliver managementoutcomes consistentwith MSC Principles 1and 2.
There is an effective nationallegal system and bindingprocedures governingcooperation with other partieswhich delivers managementoutcomes consistent with MSCPrinciples 1 and 2.
The management system exists within an appropriate legal and/or customaryframework which ensures that it: Is capable of delivering sustainable fisheries in accordance with MSC
Principles 1 and 2; and Observes the legal rights created explicitly or established by custom of
people dependent on fishing for food or livelihood; and Incorporates an appropriate dispute resolution framework.
Ju
sti
ficati
on
MPI is responsible for the utilisation of New Zealand's fisheries resources whileensuring sustainability in accordance with its governing legislation - the FisheriesAct 1996.
Where ensuring sustainability means—
(a) maintaining the potential of fisheries resources to meet the reasonablyforeseeable needs of future generations; P1
and
(b) avoiding, remedying, or mitigating any adverse effects of fishing on the aquaticenvironment P2
utilisation means conserving, using, enhancing, and developing fisheriesresources to enable people to provide for their social, economic, and cultural well-being.
There are legal protection provisions for marine wildlife, as in the Wildlife Act 1953and the Marine Mammals Protection Act 1978, and reporting requirements aroundthe incidental capture of these species during fishing
The Fisheries Act binds the Crown. Decisions made under power given by the Actare judicially reviewable by the Courts in the event of disputes. Procedures andprocesses that apply to disputes about the effects of fishing on the fishing activitiesof any person that has a current fishing interest provided for under the Act. are setout under Part 7 of the Fisheries Act.
MPI's fisheries management responsibilities extend to the 200 nautical mile limit ofthe NZ EEZ. MPI provides management, licencing (where applicable) research andcompliance and education services for commercial, recreational and customaryfishing. MPI assists the Minister for Primary Industries in the administration of therelevant Acts.
The Government’s commitment to wide consultation and engagement is set out inSection 12 of the Act. MPI is required to consult with those classes of personshaving an interest (including, but not limited to, Maori, environmental, commercialand recreational interests) in the stock or the effects of fishing on the aquaticenvironment in the area concerned. . MPI do this in a number of ways eg throughregular meeting of working groups. These meetings are open to everyone, andconsider fish stocks and the effects of fishing on the aquatic environment.There isan effective national legal system and binding procedures governing cooperationwith other parties which delivers management outcomes consistent with MSCPrinciples 1 and 2. This SI meets 100.
b
Gu
idep
ost
The managementsystem incorporates oris subject by law to amechanism for theresolution of legaldisputes arising withinthe system.
The managementsystem incorporates oris subject by law to atransparent mechanismfor the resolution oflegal disputes which isconsidered to beeffective in dealing withmost issues and that isappropriate to thecontext of the fishery.
The management systemincorporates or is subject by lawto a transparent mechanism forthe resolution of legal disputesthat is appropriate to thecontext of the fishery and hasbeen tested and proven to beeffective.
The management system exists within an appropriate legal and/or customaryframework which ensures that it: Is capable of delivering sustainable fisheries in accordance with MSC
Principles 1 and 2; and Observes the legal rights created explicitly or established by custom of
people dependent on fishing for food or livelihood; and Incorporates an appropriate dispute resolution framework.
Ju
sti
ficati
on
The Fisheries Act provides opportunities to negotiate and resolve disputes. TheMinister may appoint a Disputes Commissioner and the Minister makes the finaldetermination. The consultation process is an attempt to avoid unresolved disputesby ensuring all interested parties have an opportunity to participate and have aninput into decisions. There have been occasions when there has not been asatisfactory outcome and then this has gone to litigation and the Court has made adecision. The Memorandum of Understanding between the Deepwater Group Ltdand the Ministry for Primary Industries has encouraged better working relationships,and fostered avoidance of the need for litigation between the Ministry and industry.The management system incorporates or is subject by law to a transparentmechanism for the resolution of legal disputes that is appropriate to the context ofthe fishery and has been tested and proven to be effective. A score of 100 is given
d
Gu
idep
ost
The managementsystem has amechanism togenerally respect thelegal rights createdexplicitly orestablished by customof people dependenton fishing for food orlivelihood in a mannerconsistent with theobjectives of MSCPrinciples 1 and 2.
The managementsystem has amechanism to observethe legal rights createdexplicitly or establishedby custom of peopledependent on fishingfor food or livelihood ina manner consistentwith the objectives ofMSC Principles 1 and2.
The management system has amechanism to formally committo the legal rights createdexplicitly or established bycustom of people dependent onfishing for food and livelihood ina manner consistent with theobjectives of MSC Principles 1and 2.
Met? Y Y Y
Ju
sti
ficati
on
MPI is responsible for the administration of the Treaty of Waitangi (FisheriesClaims) Settlement Act 1992, which implements the 1992 Fisheries Deed ofSettlement under which historical Treaty of Waitangi claims relating to commercialfisheries have been fully and finally settled. The Ministry is also responsible for theMaori Fisheries Act 2004, which provides that the Crown allocates 20% of quota forany new quota management stocks brought into the QMS to the Treaty of WaitangiFisheries commission. For non-commercial fisheries, the Kaimoana CustomaryFishing Regulations 1998 and the Fisheries (South Island Customary Fishing)Regulations 1998 strengthen some of the rights of Tangata Whenua to managetheir fisheries. These regulations let iwi and hapü manage their non-commercialfishing in a way that best fits their local practices, without having a major effect onthe fishing rights of others. When the government sets the total catch limits forfisheries each year, it allows for this customary use of fisheries. The managementsystem therefore has a mechanism to formally commit to the legal rights createdexplicitly or established by custom of people dependent on fishing for food andlivelihood in a manner consistent with the objectives of MSC Principles 1 and 2. Ascore of 100 is given.
References
Fisheries Act 1996
DWG Partnership 2010
Treaty of Waitangi (Fisheries Claims) Settlement Act 1992
The management system exists within an appropriate legal and/or customaryframework which ensures that it: Is capable of delivering sustainable fisheries in accordance with MSC
Principles 1 and 2; and Observes the legal rights created explicitly or established by custom of
people dependent on fishing for food or livelihood; and Incorporates an appropriate dispute resolution framework.Customary Fisheries Regs 1998
OVERALL PERFORMANCE INDICATOR SCORE: All of the scoring guideposts aremet for 60, 80 and 100.
The management system has effective consultation processes that are opento interested and affected parties.
The roles and responsibilities of organisations and individuals who areinvolved in the management process are clear and understood by all relevantparties
Organisations andindividuals involved inthe managementprocess have beenidentified. Functions,roles andresponsibilities areexplicitly defined andwell understood for keyareas of responsibilityand interaction.
Organisations and individualsinvolved in the managementprocess have been identified.Functions, roles andresponsibilities are explicitlydefined and well understood forall areas of responsibility andinteraction.
The management system has effective consultation processes that are opento interested and affected parties.
The roles and responsibilities of organisations and individuals who areinvolved in the management process are clear and understood by all relevantparties
Ju
sti
ficati
on
The Ministry of Primary industries (MPI) is the Government agency responsible forthe utilisation and sustainable management of the fisheries resources. The role ofMPI, working with other government agencies, is to advise on and implementgovernment policy in the following areas of core responsibility:
ensuring sustainability of fish stocks and the protection of the aquaticenvironment;
meeting international and Deed of Settlement obligations; providing for maximum value to be realised; facilitating sustainable development; and ensuring integrity of management systems.
MPI is charged with consistently monitoring the fishery resource, and making timelyand appropriate policy advice on all aspects of fisheries management to theGovernment. The Ministry is also responsible for carrying out the Government'spolicies to manage and conserve fisheries, and to actively encourage compliance offisheries regulations by all fishers.The Department of Conservation (DOC) is the central government organisationcharged with conserving the natural and historical heritage of New Zealand. Thedepartment is responsible for marine reserves and protected species (includingalmost all seabirds, all marine mammals such as dolphins, whales, sea lions andfur seals, some sharks and some coral species).DWG is an amalgamation of EEZ fisheries quota owners in New Zealand. DWG is anon-profit organisation, and is the commercial stakeholder organisation responsiblefor the majority of deepwater and middle-depth fisheries. It is working inpartnership with the MPI and other interest groups to ensure New Zealand gains themaximum economic yields from its deepwater fisheries resources managed within along-term, sustainable framework. The vast majority (95%) of ling quota owners arerepresented through the DWG. The MPI and DWG signed a Memorandum ofUnderstanding (MOU) in 2006 which sets out how DWG and MPI workcollaboratively to improve the management of deepwater fisheries (including ling).eNGOs and other stakeholders have an important role in participating andcontributing to management processes.Therefore, organisations and individuals involved in the management process havebeen identified and their functions, roles and responsibilities are explicitly definedand well understood for key areas of responsibility and interaction. A score of 100 isgiven.
b
Gu
idep
ost
The managementsystem includesconsultation processesthat obtain relevantinformation from themain affected parties,including localknowledge, to informthe managementsystem.
The managementsystem includesconsultation processesthat regularly seek andaccept relevantinformation, includinglocal knowledge. Themanagement systemdemonstratesconsideration of theinformation obtained.
The management systemincludes consultation processesthat regularly seek and acceptrelevant information, includinglocal knowledge. Themanagement systemdemonstrates consideration ofthe information and explainshow it is used or not used.
The management system has effective consultation processes that are opento interested and affected parties.
The roles and responsibilities of organisations and individuals who areinvolved in the management process are clear and understood by all relevantparties
Ju
sti
ficati
on
Section 12 of the 1996 Act includes a range of specific consultation requirements.MPI is required to consult with those classes of persons having an interest(including, but not limited to, Maori, environmental, commercial and recreationalinterests) in the stock or the effects of fishing on the aquatic environment in the areaconcerned; Section 12 only relates to certain sections of the 1996 Act. Howeverthere are other sections of the 1996 Act that require the Minister or MPI ChiefExecutive to consult with stakeholders before making a decision.MPI has a well-defined process for stakeholder consultation. The consultationprocess:
- sets out best practice process for how MPI will meet its obligations underSection 12 of the Fisheries Act 1996 and for other decisions requiringconsultation with fisheries stakeholders;
- helps to ensure a consistent approach across all MPI business groupswhen consulting with fisheries stakeholders; and
- sets out minimum performance measures where appropriate, e.g., aminimum period for stakeholder consultation.
The consultation process standard includes the following:• identification of stakeholders “having an “interest” for consultation purposes;• a time frame for consultation;• notification of decision to stakeholders; and• monitoring, review and oversight.There is evidence that consultation occurs on a regular basis and that informationprovided by stakeholders is often taken into account. Explanations on howinformation is used or not used are conveyed by letters, emails and in the FinalAdvice paper.The management system therefore includes consultation processes that regularlyseek and accept relevant information, including local knowledge. The managementsystem demonstrates consideration of the information and explains how it is used ornot used. A score of 100 is given.
c
Gu
idep
ost
The consultationprocess providesopportunity for allinterested and affectedparties to be involved.
The consultation processprovides opportunity andencouragement for allinterested and affected partiesto be involved, and facilitatestheir effective engagement.
The management system has effective consultation processes that are opento interested and affected parties.
The roles and responsibilities of organisations and individuals who areinvolved in the management process are clear and understood by all relevantparties
Ju
sti
ficati
on
MPI has a well-defined process for stakeholder consultation. The consultationprocess:
- sets out best practice process for how MPI will meet its obligations underSection 12 of the Fisheries Act 1996 and for other decisions requiringconsultation with fisheries stakeholders;
- helps to ensure a consistent approach across all MPI business groupswhen consulting with fisheries stakeholders; and
- sets out minimum performance measures where appropriate, e.g., aminimum period for stakeholder consultation.
The consultation process standard includes the following:• identification of stakeholders “having an “interest” for consultation purposes;• a time frame for consultation;• notification of decision to stakeholders; and• monitoring, review and oversight.There is evidence of the MPI seeking stakeholder views throughout the year using,for example, the Initial Position process, the Working group forums, and fisheriesplanning meetings.
As part of the consultation process, stakeholders are given the opportunity toprovide feedback on the delivery of the process itself. The feedback is evaluatedand used to fine tune future consultation processes. Stakeholders are encouragedto be involved. The consultation process provides opportunity and encouragementfor all interested and affected parties to be involved, and facilitates their effectiveengagement. A score of 100 is given.
References
Fisheries Act 1996
DWG 2010
MFish 2010i
MFish 2010j
MFish 2010 l
MP I2012b
DOC 2012
OVERALL PERFORMANCE INDICATOR SCORE: All of the scoring guideposts aremet for 60, 80 and 100.
PI 3.1.3The management policy has clear long-term objectives to guide decision-making that are consistent with MSC Principles and Criteria, and incorporatesthe precautionary approach
Scoring Issue SG 60 SG 80 SG 100
a
Gu
idep
ost
Long-term objectivesto guide decision-making, consistentwith the MSCPrinciples and Criteriaand the precautionaryapproach, are implicitwithin managementpolicy
Clear long-termobjectives that guidedecision-making,consistent with MSCPrinciples and Criteriaand the precautionaryapproach are explicitwithin managementpolicy.
Clear long-term objectives thatguide decision-making,consistent with MSC Principlesand Criteria and theprecautionary approach, areexplicit within and required bymanagement policy.
Met? Y Y Y
Long-term fishery and environmental objectives are included within both NZfisheries and environmental legislation and these guide decision making. inregarding information principles, Section10 of Fisheries Act states: “All personsexercising or performing functions, duties, or powers under this Act, in relation tothe utilisation of fisheries resources or ensuring sustainability, shall take intoaccount the following information principles:
Decisions should be based on the best available information:
Decision makers should consider any uncertainty in the information available in anycase:
Decision makers should be cautious when information is uncertain, unreliable, orinadequate:
The absence of, or any uncertainty in, any information should not be used as areason for postponing or failing to take any measure to achieve the purpose of thisAct.”
Fisheries 2030 sets the strategic direction for the management and use of NewZealand’s fisheries resources. One of the principles guiding Fisheries 2030 is“Precautionary approach: particular care will be taken to ensure environmentalsustainability where information is uncertain unreliable or inadequate.”
The National Fisheries Plan for Deepwater and Middle-depth Fisheries (the NationalDeepwater Plan) establishes the 5-year enabling framework for the management ofNew Zealand’s deepwater fisheries. It is further divided into two parts – Part 1A andPart 1B.
Part 1A details the overall strategic direction for New Zealand’s deepwater fisheries.Specifically it describes:
the wider strategic context that Fisheries Plans are part of, including Fisheries 2030;
the nature and status of the management objectives that will apply across alldeepwater fisheries; and
how the National Deepwater Plan will be implemented and how stakeholders will beengaged during the implementation phase.
PI 3.1.3The management policy has clear long-term objectives to guide decision-making that are consistent with MSC Principles and Criteria, and incorporatesthe precautionary approach
Ju
sti
ficati
on
Part 1A of the National Deepwater Plan has been approved by the Minister ofFisheries under Section 11A of the Fisheries Act 1996. This means that it must beconsidered each time the Minister makes decisions or recommendationsconcerning regulation or control of fishing or any sustainability measures relating tothe stocks managed through this plan.
Part 1B of the National Deepwater Plan comprises the fishery-specific chapters ofthe National Deepwater Plan which provide greater detail on how deepwaterfisheries will be managed at the fishery level, in line with the managementobjectives. To date, fishery-specific chapters have been completed for the hoki,orange roughy, southern blue whiting, and ling fisheries. The fishery-specificchapters describe the operational objectives for each target fishery and their keybycatch species, as well as how performance against both the management andoperational objectives will be assessed at the fishery level. These chapters alsodescribe any agreed harvest strategy for the relevant species.
On an annual basis the National Deepwater Plan is delivered through the AnnualOperational Plan which describes management actions scheduled for deliveryduring the financial year for which the Operational Plan applies, and themanagement services required to deliver the management actions. The AnnualOperational Plan also clearly demonstrates how these management actionscontribute to the long-term objectives in the National Deepwater Plan.
Clear long-term objectives that guide decision-making, consistent with MSCPrinciples and Criteria and the precautionary approach, are therefore explicit withinand required by management policy.
Clear long-term objectives that guide decision-making, consistent with MSCPrinciples and Criteria and the precautionary approach, are explicit within andrequired by management policy. This SI scores 100.
References
Fisheries Act
MFish 2010d
MFish 2010f
Pricewaterhouse Coopers 2008
OVERALL PERFORMANCE INDICATOR SCORE: All of the scoring guideposts aremet for 60, 80 and 100.
PI 3.1.4The management system provides economic and social incentives forsustainable fishing and does not operate with subsidies that contribute tounsustainable fishing
Scoring Issue SG 60 SG 80 SG 100
a
Gu
idep
ost
The managementsystem provides forincentives that areconsistent withachieving theoutcomes expressedby MSC Principles 1and 2.
The managementsystem provides forincentives that areconsistent withachieving the outcomesexpressed by MSCPrinciples 1 and 2, andseeks to ensure thatperverse incentives donot arise.
The management systemprovides for incentives that areconsistent with achieving theoutcomes expressed by MSCPrinciples 1 and 2, and explicitlyconsiders incentives in aregular review of managementpolicy or procedures to ensurethey do not contribute tounsustainable fishing practices.
Met? Y Y P
Ju
sti
ficati
on
Incentives: The QMS and the use of ITQs provides stability and security for quotaowners and hence incentives for sustainable utilisation (Fisheries Act). Themanagement system also includes customary provisions (e.g., Maori Fisheries Act2004 and Treaty of Waitangi (Fisheries Claims) Settlement Act 1992).Subsidies: There are no subsidies in the New Zealand ling fishery. Themanagement system has explicit mechanisms that facilitate regular review ofmanagement policy or procedures (Fisheries Act).Under Section 13 of the Fisheries Act 1996 the Minister of Fisheries needs to takesocial, cultural and economic factors into account as well as the status of the stocksand all environmental considerations when setting a TAC for a fishery.There are regular reviews of the Quota Management System and MPI managementpolicy and procedures to ensure they contribute to sustainable fishing. Otherstrategies that contribute to sustainable fishing are also regularly reviewed e.g.deemed values and the harvest strategy. There do not appear to be explicitincentives and encouragement not to catch marine mammals and protectedspecies, i.e. there no positive feedback for those not catching these species.
The management system does not explicitly consider incentives in a regular reviewof management policy or procedures to ensure they not contribute to unsustainablefishing practices. As such, the fishery only partially meets the 100 level ofperformance
References Fisheries Act 1996
Lock et al 2007
OVERALL PERFORMANCE INDICATOR SCORE: The scoring guideposts are met for60 and 80 and partially met for 100.
PI 3.2.1The fishery has clear, specific objectives designed to achieve the outcomesexpressed by MSC’s Principles 1 and 2
Scoring Issue SG 60 SG 80 SG 100
a
Gu
idep
ost
Objectives, which arebroadly consistent withachieving theoutcomes expressedby MSC’s Principles 1and 2, are implicitwithin the fishery’smanagement system
Short and long-termobjectives, which areconsistent withachieving the outcomesexpressed by MSC’sPrinciples 1 and 2, areexplicit within thefishery’s managementsystem.
Well defined and measurableshort and long-term objectives,which are demonstrablyconsistent with achieving theoutcomes expressed by MSC’sPrinciples 1 and 2, are explicitwithin the fishery’smanagement system.
Met? Y Y Y
Ju
sti
ficati
on
The management system has explicit short and long-term objectives which are setout in long-term plans e.g., Fisheries 2030, National Fishing Plan Deepwater andMiddle depths Plan and Annual Operational. Objectives are subject to an annualreview report.. The objectives specific to the ling fishery are set out in the nationalFishing Plan for deepwater and Middle depth fisheries Part 1B- Ling. These arethen specified within the annual Operating Plan. These are fishery specific, subjectto annual review and are measurable.
The National Plans of Action for sharks and seabirds, both revised and published in2013, provide additional examples of management objectives (relating to some ETPspecies) that are applicable to the assessed fisheries and consistent with Principle2.
References
Pricewaterhouse Cooper 2008
MFish 2010d
MFish 2011e
MPI 2012b
MPi 2012d
OVERALL PERFORMANCE INDICATOR SCORE: The scoring guideposts are met for60 and 80 and 100.
The fishery-specific management system includes effective decision-makingprocesses that result in measures and strategies to achieve the objectives,and has an appropriate approach to actual disputes in the fishery underassessment.
Scoring Issue SG 60 SG 80 SG 100
a
Gu
idep
ost
There are somedecision-makingprocesses in place thatresult in measures andstrategies to achievethe fishery-specificobjectives.
There are establisheddecision-makingprocesses that result inmeasures andstrategies to achievethe fishery-specificobjectives.
Met? Y Y
Ju
sti
ficati
on
The decision-making process is clearly outlined in the Fisheries Act (specificallySections 10,11&12). Section 10 of the Fisheries Act requires that all decisions bebased on the best available information. The management of fisheries to achievethese goals is based upon the scientific evaluation of:
the sustainable yields of fisheries resources;
the effects of fishing on the aquatic environment, including on the viability ofassociated or dependent species, and on biological diversity;
alternative strategies for achieving the desired level of yield while avoiding,remedying, or mitigating adverse effects of fishing on the aquatic environment;
relevant cultural, economic, and social factors that may need to be included in themanagement decision process; and
the specific measures needed to implement the preferred strategy.
There is also the process of advice development – working groups reviewing information,preparation of initial position papers, consultation, preparation of final advice papers, adviceprovided to the Minister, and Ministerial decisions being made.
There are therefore established decision-making processes that result in measuresand strategies to achieve the fishery-specific objectives. A score of 80 is given.
b
Gu
idep
ost
Decision-makingprocesses respond toserious issuesidentified in relevantresearch, monitoring,evaluation andconsultation, in atransparent, timely andadaptive manner andtake some account ofthe wider implicationsof decisions.
Decision-makingprocesses respond toserious and otherimportant issuesidentified in relevantresearch, monitoring,evaluation andconsultation, in atransparent, timely andadaptive manner andtake account of thewider implications ofdecisions.
Decision-making processesrespond to all issues identifiedin relevant research,monitoring, evaluation andconsultation, in a transparent,timely and adaptive mannerand take account of the widerimplications of decisions.
The fishery-specific management system includes effective decision-makingprocesses that result in measures and strategies to achieve the objectives,and has an appropriate approach to actual disputes in the fishery underassessment.
Ju
sti
ficati
on
Section 10 of the Fisheries Act requires all decisions to be based on the bestavailable information. The management of fisheries to achieve these goals is basedupon the scientific evaluation of:
the sustainable yield from fisheries resources; the effects of fishing on the aquatic environment, including on the viability of
associated or dependent species, and on biological diversity; alternative strategies for achieving the desired level of yield while avoiding,
remedying, or mitigating adverse effects of fishing on the aquaticenvironment;
relevant cultural, economic, and social factors that may need to be includedin the management decision process; and
the specific measures needed to implement the preferred strategy.Consultation is a central component of the management decision making process(Fisheries Act Section 12, Stakeholder Consultation Process Standard). TheMinister makes the final decision based on advice received from other parties(Section 12 - the Minister shall consult with such persons or organisations as theMinister considers are representative of those classes of persons having an interestin the stock or the effects of fishing on the aquatic environment in the areaconcerned including Maori, environmental, commercial, and recreational interests).The MPI ensures that the Minister is provided with analysed alternatives forconsideration before making any decisions (information is both from within andoutside the Ministry (Stakeholders, Science)). The feedback process is formalised,involving planning, consultation, project development, and scientific enquiry.
The IPP/FAP process highlights the extent of consultation, engagement andtransparency of the decision making process; see the following:
Hon. Phil Heatley (2011). Minister’s Decision Letter on SustainableMeasures.
Ministry of Fisheries (2011) Review of Sustainability Measures and Othermanagement Controls for Deepwater Fisheries – Final Advice Paper.
Ministry of Fisheries (2011) Submissions received on the Review ofSustainability Measures and other management Controls for DeepwaterFisheries.
Thus, decision-making processes respond to serious and other important issuesidentified in relevant research, monitoring, evaluation and consultation, in atransparent, timely and adaptive manner and take account of the wider implicationsof decisions.
Although management decision-making can be shown to respond to serious andimportant issues, a very large number of ‘issues’ are identified during research andmonitoring. Management does not respond formally to all of these. However,response may be informal or through discussion at various fora, such as workinggroups. All issues are addressed through such mechanisms, although this may notbe to the satisfaction of all stakeholders.
The assessment team does not have full evidence that decision-making processesrespond to all issues identified in relevant research, monitoring, evaluation andconsultation, in a transparent, timely and adaptive manner and take account of thewider implications of decisions. A score of 80 is met.
The fishery-specific management system includes effective decision-makingprocesses that result in measures and strategies to achieve the objectives,and has an appropriate approach to actual disputes in the fishery underassessment.
c
Gu
idep
ost
Decision-makingprocesses use theprecautionary approachand are based on bestavailable information.
Met? Y
Ju
sti
ficati
on
The FAO technical consultation on the precautionary approach to capture fisheriestook place in Sweden in 1995. One outcome of this consultation was a set ofguidelines which set out principles for the precautionary approach for capturefisheries.
The precautionary approach must be followed by the MPI. Section 10 of theFisheries Act Information principles states:” All persons exercising or performingfunctions, duties, or powers under this Act, in relation to the utilisation of fisheriesresources or ensuring sustainability, shall take into account the followinginformation principles:
(a) Decisions should be based on the best available information:(b) Decision makers should consider any uncertainty in the information
available in any case:(c) Decision makers should be cautious when information is uncertain,
unreliable, or inadequate:(d) The absence of, or any uncertainty in, any information should not be used
as a reason for postponing or failing to take any measure to achieve thepurpose of this Act.
Evidence of the application of the precautionary approach is seen in the Ministry ofFisheries (2011) Review of Sustainability Measures and Other managementControls for Deepwater Fisheries – Final Advice Paper.Thus, decision-making processes use the precautionary approach and are basedon best available information. This SI meets 100.
d
Gu
idep
ost
Some information onfishery performanceand managementaction is generallyavailable on request tostakeholders.
Information on fisheryperformance andmanagement action isavailable on request,and explanations areprovided for anyactions or lack of actionassociated withfindings and relevantrecommendationsemerging fromresearch, monitoring,evaluation and reviewactivity.
Formal reporting to allinterested stakeholdersprovides comprehensiveinformation on fisheryperformance and managementactions and describes how themanagement systemresponded to findings andrelevant recommendationsemerging from research,monitoring, evaluation andreview activity.
The fishery-specific management system includes effective decision-makingprocesses that result in measures and strategies to achieve the objectives,and has an appropriate approach to actual disputes in the fishery underassessment.
Ju
sti
ficati
on
Management decision-making processes are clearly outlined in the Fisheries Act1996. Intentions are shared through a transparent process, which includes long-and short-term goals and objectives that are publically available (e.g., NationalFisheries Plan, Annual Operational Plan, Statements of Intent, Initial PositionPapers, press releases and reports).These publications are considered to be responses or invitations to respond tofindings and relevant recommendations emerging from research, monitoring,evaluation and review activity. These reports also include cultural/social issues aswell as fisheries management issues.
Formal responses on management decisions research, monitoring and evaluationare provided. Formal responses consistent with formalised reporting andconsultation processes such as the IPP/FAP process, the Stakeholder ConsultationProcess Standard or the National Fisheries Plan for Deepwater and Middle- DepthFisheries and the annual Operating Plan for Deepwater Fisheries are alwaysprovided to stakeholders.
There are annual review reports produced by MPI to describe performance anddelivery on fisheries management objectives, e.g., for deepwater fisheries:
A score of 100 is given.
e
Gu
idep
ost
Although themanagement authorityor fishery may besubject to continuingcourt challenges, it isnot indicating adisrespect or defianceof the law byrepeatedly violatingthe same law orregulation necessaryfor the sustainabilityfor the fishery.
The managementsystem or fishery isattempting to comply ina timely fashion withjudicial decisionsarising from any legalchallenges.
The management system orfishery acts proactively to avoidlegal disputes or rapidlyimplements judicial decisionsarising from legal challenges.
Met? Y Y Y
There are procedures and processes under Part 7 of the Fisheries Act that apply todisputes about the effects of fishing on the fishing activities of any person that has acurrent fishing interest provided for under the Act. The Act provides opportunities tonegotiate and resolve disputes. The Minister may appoint a Disputes Commissionerand the Minister makes the final determination. However, this mechanism does notseem to be widely used. Rather, the consultation process is an attempt to avoidunresolved disputes by ensuring all interested parties have an opportunity toparticipate and have an input into decisions. There have been occasions whenthere has not been a satisfactory outcome and then this has gone to litigation andthe Court has made a decision. The Memorandum of Understanding between theDeepwater Group Ltd and the MPI should encourage better working relationships,and avoid the need for litigation between the Ministry and industry. Themanagement system is therefore subject by law to a transparent mechanism for theresolution of legal disputes which is considered to be effective in dealing with mostissues and that is appropriate to the context of the fishery.
The fishery-specific management system includes effective decision-makingprocesses that result in measures and strategies to achieve the objectives,and has an appropriate approach to actual disputes in the fishery underassessment.
Ju
sti
ficati
on
There are procedures and processes under Part 7 of the Fisheries Act that apply todisputes about the effects of fishing on the fishing activities of any person that has acurrent fishing interest provided for under the Act. The Act provides opportunities tonegotiate and resolve disputes. Co-operation and partnership between the Ministryand Industry has been successful in pre-empting disputes. The managementsystem is therefore attempting to comply in a timely fashion within binding judicialdecisions arising from any legal challenges.
The ‘inform and assist’ compliance model, as well as the co-operation andpartnership between the Ministry and Industry have been successful in pre-emptingdisputes. MPI Compliance acts proactively in providing education and awarenessprogrammes, fact sheets and meetings with management and industry. MPICompliance also works collegiately with the fishing industry to proactively avoidlegal disputes.
A score of 100 is given.
References
Fisheries Act 1996
MFish 2009b
MFish 2010i
MFish 2010j
OVERALL PERFORMANCE INDICATOR SCORE: All of the scoring issues for the 60and 80 scoring guidepost are met as is two of the three for the 100 scoringguidepost.
PI 3.2.3Monitoring, control and surveillance mechanisms ensure the fishery’smanagement measures are enforced and complied with
Scoring Issue SG 60 SG 80 SG 100
A
Gu
idep
ost
Monitoring, control andsurveillancemechanisms exist, areimplemented in thefishery underassessment and thereis a reasonableexpectation that theyare effective.
A monitoring, controland surveillancesystem has beenimplemented in thefishery underassessment and hasdemonstrated an abilityto enforce relevantmanagementmeasures, strategiesand/or rules.
A comprehensive monitoring,control and surveillance systemhas been implemented in thefishery under assessment andhas demonstrated a consistentability to enforce relevantmanagement measures,strategies and/or rules.
Met? Y Y N
The ling management system has an effective monitoring, control and surveillancesystem.
Satellite Vessel Monitoring System. All New Zealand fishing vessels exceeding28 m in overall length must participate in the compulsory satellite Vessel MonitoringSystem (VMS) and carry and operate on board an automatic location communicator(ALC) (see Fisheries (Satellite Vessel Monitoring) Regulations). Both the vesseloperator and the vessel master must ensure that the ALC on board is in workingorder and is transmitting information. It is an offence to not have a working ALC onboard, and the person in breach can be liable to a fine not exceeding $100,000unless they can show that the breach occurred due to accidental mechanical ortechnical failure.
Government observers may be placed on board any vessel for the purpose ofcollecting information for fisheries research, fisheries management, and fisheriesenforcement (Fisheries Act, ss 223-224). Observers may be placed on board toobserve fishing and as well as any transhipment, and transportation, and collect anyinformation on ling fisheries resources (including catch and effort information), andthe effect of ling fishing on the aquatic environment (ss 223-224). Any person onboard a fishing vessel who fails to provide reasonable assistance or hinders theobserver in anyway is committing an offence (s225).
Accurate Reporting and Recordkeeping. The Fisheries Act and FisheriesRegulations impose on all persons operating in the ling fisheries (including: fishers,masters and owners of vessels, and owners of premises, vessels or vehicles wherefish is received, purchased, stored, transported, processed, or sold) record-keepingand recording requirements (Fisheries Act ss 187-195; also see FisheriesRegulations). The purpose of these requirements is to establish auditable andtraceable records to ensure all catches are counted and do not exceed the ACEheld by each operator (Fisheries Act s 190; also see Fisheries Regulations).Accurate reporting and record-keeping also demonstrates effectiveness.Compliance with record-keeping and recording requirements is essential to fulfil thefishers legal obligations in relation to the commercial fishing for ling (Fisheries Actss 189-190; also see Fisheries Regulations).The required returns include:
catch, effort, and landing returns (CELR);
catch landing returns (CLR);
trawl catch, effort, and processing returns (TCEPR); and
non-fish and protected species catch return (NF-PSCR).
PI 3.2.3Monitoring, control and surveillance mechanisms ensure the fishery’smanagement measures are enforced and complied with
Ju
sti
ficati
on
Other measures include:
fishing permit requirements;
requirement to hold ACE to cover all target and bycatch species caught, oralternatively, to pay deemed values;
fishing permit and fishing vessel registers;
vessel and gear marking requirements;
fishing gear and method restrictions;
vessel inspections;
control of landings (e.g. requirement to land only to licensed fish receivers);
auditing of licensed fish receivers;
control of transhipment;
monitored unloads of fish;
information management and intelligence analysis;
analysis of catch and effort reporting and comparison with VMS, observer, landingand trade data to confirm accuracy;
boarding and inspection by fishery officers at sea; and,
aerial and surface surveillance.
Thus, a monitoring, control and surveillance system has been implemented in thefishery under assessment and has demonstrated an ability to enforce relevantmanagement measures, strategies and/or rules. And meets the 80 level.
However it is considered that there is minimal observer coverage. Observerprogrammes are part of best practice approaches for fisheries management, andachieving a comprehensive monitoring system without a reasonable level ofobserver coverage (or electronic) monitoring seems impossible. In addition, theremust be a demonstrated consistent ability to enforce management measures etc.“Consistent” seems to imply comprehensive monitoring to be at reasonable levelsover time. While the framework exists (e.g. legislative provisions for observers, andthe existence of a programme) observers still need to be deployed in fisheries to beeffective. The 100 level is not met.
b
Gu
idep
ost
Sanctions to deal withnon-compliance existand there is someevidence that they areapplied.
Sanctions to deal withnon-compliance exist,are consistently appliedand thought to provideeffective deterrence.
Sanctions to deal with non-compliance exist, areconsistently applied anddemonstrably provide effectivedeterrence.
Met? Y Y Y
Offences. The majority of offences against the Fisheries Act 1996 or any of theFisheries Regulations are strict liability offences (s 240).Defences. For offences against the Fisheries Act 1996 or any of the FisheriesRegulations, the offender has to satisfy a reverse onus and establish that theoffence was outside their control, that they took reasonable precautions andexercised due diligence to avoid the contravention, and, where applicable, theyreturned fish that was unlawfully taken and complied with all recording and reportingrequirements.Penalties - Penalties are very severe. They include:
- Monetary penalties and Imprisonment - Fines range $250 and $750 (forinfringement-type offences) to more serious intentional offences that inaddition to imprisonment for up to five years, include a fine up to $500,000(ss 231, 233 & 252, also see Fisheries (Infringement Offences) Regulations
PI 3.2.3Monitoring, control and surveillance mechanisms ensure the fishery’smanagement measures are enforced and complied with
2001).- Forfeiture of property. Upon conviction, any vessel and other property
used in the commission of any of the more serious fisheries offences willautomatically be forfeited to the Crown. This is subject of course to theexistence of ‘special reasons’ (s 255 A-E).Forfeiture is in addition to otherpenalties imposed by the Court (s 256).
Ju
sti
ficati
on
- Prohibition. Upon conviction of two or more separate fisheries offences thecourt shall, in addition to any other penalty imposed, prohibit, for a period ofthree years, from holding any licence or permit, engaging in fishing orfishing related activity and deriving any beneficial income from activitiesassociated with the taking of fish (s 257).
Sanctions are consistently applied if necessarily. However, the preferred approachis to work collaboratively with industry to prevent non-compliance.
Sanctions to deal with non-compliance exist, and are consistently applied. The MPICompliance group report that they do demonstrably provide effective deterrence.Major noncompliance is rare and, if detected, the penalties are very severeincluding fines, loss of vessel, and loss of quota. Vessels don’t reoffend. A score of100 is given.
c
Gu
idep
ost
Fishers are generallythought to comply withthe managementsystem for the fisheryunder assessment,including, whenrequired, providinginformation ofimportance to theeffective managementof the fishery.
Some evidence existsto demonstrate fisherscomply with themanagement systemunder assessment,including, whenrequired, providinginformation ofimportance to theeffective managementof the fishery.
There is a high degree ofconfidence that fishers complywith the management systemunder assessment, including,providing information ofimportance to the effectivemanagement of the fishery.
PI 3.2.3Monitoring, control and surveillance mechanisms ensure the fishery’smanagement measures are enforced and complied with
Ju
sti
ficati
on
The combination of rigorous legal requirements, traceable documentation, effectivesurveillance, landing and reconciliation of catch against ACE, catch documentationaudits, and checks against past catch all lead to a very high degree of confidence incompliance. An external report of fisher compliance and perceptions of compliancefound that compliance with the management system is good (Kazmierow et al.2010). Thus, some evidence exists to demonstrate that fishers comply with themanagement system under assessment, including, when required, providinginformation of importance to the effective management of the fishery.
The Ministry is currently working in collaboration with Industry on the ObserverProgramme and there is an acknowledgement that observers will play a greatermonitoring role into the future in New Zealand Deepwater fisheries, with observersnot just conducting scientific and biological sampling, but also used in mitigatingrisks. Currently, the MPI Compliance Business Group has 100 dedicated sea daysto this. However, the MPI Observer Business coming back into the Field ServicesBusiness Group, coupled with enhanced maritime surveillance planning, use ofdefence assets and the six new navy vessels for domestic use, will see asubstantially increased surveillance and monitoring effort in the deepwater fisheries,including a greater utilisation of observers.
There is a designated liaison person acting between MPI and industry.
Fishers cooperate, where necessary, with management authorities in the collectionof catch, discard and other information that is of importance to the effectivemanagement of the resources and the fishery. A score of 100 is given.
d
Gu
idep
ost There is no evidence of
systematic non-compliance.
Met? Y
Ju
sti
ficati
on Although there has been evidence, in the past, of non-compliance in the ling fishery;
e.g. ‘trucking” and high grading, this has been investigated by MPI compliance. Thisis not considered to be systematic, and has been dealt with by MPI. Those vesselsnow have high levels of observer coverage. SG80 is met.
References
DWG 2009
DWG 2011b
MFish 2009 a
MFish 2010d
MFish 2010f
MFish 2011b
MFish 2011c
MFish 2011e
MFish 2011f
MPI 2012b
MPI 2013f
MPI 2013
OVERALL PERFORMANCE INDICATOR SCORE: All of the scoring issues of the 60,80 and 100 scoring guideposts are met.
PI 3.2.4The fishery has a research plan that addresses the information needs ofmanagement
Scoring Issue SG 60 SG 80 SG 100
a
Gu
idep
ost
Research isundertaken, asrequired, to achievethe objectivesconsistent with MSC’sPrinciples 1 and 2.
A research planprovides themanagement systemwith a strategicapproach to researchand reliable and timelyinformation sufficient toachieve the objectivesconsistent with MSC’sPrinciples 1 and 2.
A comprehensive research planprovides the managementsystem with a coherent andstrategic approach to researchacross P1, P2 and P3, andreliable and timely informationsufficient to achieve theobjectives consistent withMSC’s Principles 1 and 2.
Met? Y Y Y
There are MPI Deepwater, middle depths and Aquatic Environment medium termresearch plans that together provide a strategic approach to research, and includetimelines and priorities. A Research Co-ordinating Committee meets fisheriesstakeholders annually to discuss, evaluate, and make recommendations on thedirection of research that is to be conducted, that is based on the goals andobjectives of Fisheries 2030, Statements of Intent, the National Fisheries Plan, andthe Annual Operational Plan. The recommendations come from Research PlanningGroups who contribute to the process in regards to specific research areas.
The MPI, in collaboration with the DWG, has developed and implemented a 10-Year Research Program for deepwater fisheries. The research programme focuseson research to monitor and assess stock status, and research to monitorinteractions with the marine environment.
Fisheries research falls into four key areas, each of which has its own specificgoal. These research areas and associated goals are:
Fisheries Resources - to provide the information on sustainable yields andstock status required for the sustainable utilisation of New Zealand’sfisheries resources;
Harvest Levels - to determine the nature and extent of commercial andrecreational catch, Maori customary take, illegal catch, and fishery inducedmortality;
Cultural, Economic, and Social Research - to provide information oncultural, economic, and social factors that may need to be considered in themanagement decision-making process to enable people to provide for theirsocial, economic and cultural well-being; and
Traditional and Customary Research - to provide information on thetraditional and customary factors that may need to be considered in themanagement decision making-process to enable the Minister to dischargehis/her obligations to tangata whenua under the Deed of Settlement and theTreaty of Waitangi (Fisheries Claims) Settlement Act to enable Maori toprovide for their traditional and customary well-being.
PI 3.2.4The fishery has a research plan that addresses the information needs ofmanagement
Ju
sti
ficati
on
The research programme also has the flexibility to deliver one-off specific researchprojects to address particular management requirements. The ling fisheries areincluded in this programme and the research has been planned and contracted fordelivery for the ten year period starting in 2010-11.
Reports are released into the public domain.
The increasing extent to which DOC and MPI are working together on protectedspecies research planning. An example of a recent DOC research plan for fisheriesinteractions can be found at: www.doc.govt.nz/Documents/conservation/marine-and-coastal/marine-conservation-services/approved-csp-annual-plan-2013-14.pdf.The strategic plan guiding the production of this research plan is at:www.doc.govt.nz/Documents/conservation/marine-and-coastal/marine-conservation-services/reports/csp-strat-statement2013.pdfCollaboration amongst the two agencies extends to planning observer services,especially in areas of shared priority and inshore fisheries (though not capturinginshore ling fisheries currently), e.g., www.fish.govt.nz/NR/rdonlyres/4C71155C-BD92-4D6E-A4B9-198DA7BA7717/0/FINALInshoreObserverProgramme201314.pdf
As a comprehensive research plan provides the management system with acoherent and strategic approach to research across P1, P2 and P3, and reliableand timely information sufficient to achieve the objectives consistent with MSC’sPrinciples 1 and 2. This SI meets the 100 level.
b
Gu
idep
ost
Research results areavailable to interestedparties.
Research results aredisseminated to allinterested parties in atimely fashion.
Research plan and results aredisseminated to all interestedparties in a timely fashion andare widely and publiclyavailable.
PI 3.2.4The fishery has a research plan that addresses the information needs ofmanagement
Ju
sti
ficati
on
The Middle Depths and Aquatic Environment Medium Term Plans are readilyavailable, and stakeholders provide input into these plans. The Working Groupmeetings where research results are discussed are scheduled at the start of theyear so that all can be aware of upcoming timeframes
There are MPI Deepwater, Middle depths and Aquatic Environment medium termresearch plans that together provide a strategic approach to research, and includestimelines and priorities. A Research Coordinating Committee meets fisheriesstakeholders annually to discuss, evaluate, and make recommendations on thedirection of research that is to be conducted, that is based on the goals andobjectives of Fisheries 2030, Statements of Intention, the National Fisheries Plan,and the Annual Operational Plan. The recommendations come from ResearchPlanning Groups who contribute to the process in regards to specific researchareas.
Regular research projects are planned and contracted to monitor the environmentaleffects of deepwater fishing activity on the marine environment. The MPI researchplanning process ensures that results are disseminated to all interested parties in atimely fashion. Research is planned, discussed and evaluated in the Deepwater,Middle depths Working Group and Aquatic Environment Working Group (which areresults focused) in a timely fashion.
Work on protected species-fisheries interactions (therefore relevant to P2) done bythe Conservation Services Programme at DOC. CSP follows a similar process toMPI in terms of consulting stakeholders and disseminating project outputs. Forexample, see: www.doc.govt.nz/conservation/marine-and-coastal/conservation-services-programme/meetings-and-project-updates/.
Plans and results are widely disseminated – all Plans from goals and objectives ofFisheries 2030, Statements of Intention, the National Fisheries Plan, & the AnnualOperational Plan, are readily available and stakeholders provide input into theseplans. Research results are reported in publically available reports and articles,press statements to media.
This SI meets the 100 level.
References
DOC 2012
MFish2010c
MFish 2010d
MFish 2010k
MFish 2010l
MFish 2011a
MPI 20013g
OVERALL PERFORMANCE INDICATOR SCORE: All the Scoring guideposts are metfor 60, 80 and 100
There is a system of monitoring and evaluating the performance of thefishery-specific management system against its objectives
There is effective and timely review of the fishery-specific managementsystem
Scoring Issue SG 60 SG 80 SG 100
A
Gu
idep
ost The fishery has in
place mechanisms toevaluate some parts ofthe managementsystem.
The fishery has inplace mechanisms toevaluate key parts ofthe managementsystem
The fishery has in placemechanisms to evaluate allparts of the managementsystem.
Met? Y Y Y
Ju
sti
ficati
on
The management system has internal processes to evaluate managementperformance. These include evaluations of policy, research, operations, complianceand enforcement. There is also an Annual Review Report that is an internal reviewof the performance and delivery of the management system.The stock assessment process is rigorously reviewed.The development and implementation of the Fisheries Plan framework – NationalDeepwater Plan, fishery specific chapters, Annual Operational Plan and AnnualReview Report – ensures there is a structured process to ensure the performanceof the fishery specific management system against its objectives. There is fullstakeholder engagement on the development of all components of the FisheriesPlan framework and all documents are publicly available.The Ministry implements a comprehensive peer-review process for all scienceresearch that is used to inform fisheries management decisions. In addition to therecently-released Research Standard it also includes:
(a) a range of science working groups which include members of the scientificcommunity, research providers, commercial fishers, fisheries managers andenvironmental stakeholders
(b) the availability of all peer-reviewed and accepted research papers to thewider public; and
(c) options for independent and external peer-review of novel or contentiousresearch.
Thus, mechanisms are in place to evaluate key parts of the management system.
The management system has internal processes to evaluate managementperformance. These include evaluations of policy, research, operations; complianceand enforcement (see MFish (2011) Statement of Intent, 2011-14; MFish (2010)Statement of Intent, for the period 1 July 2010 to 30 June 2015; MFish (2010)National Fisheries Plan for Deepwater and Middle-depth Fisheries. Part 1A & 1B).In addition, the planning process, which includes both the development andimplementation of fisheries plans (Fisheries 2030, Statements of Intention, theNational Deepwater Plan, the Annual Operational Plan & and Annual ReviewReport) is not only driven by Goals and objectives, it also ensures the performanceof the fishery specific management system conforms to its goals and objectives.DWG have mechanisms in place to evaluate all parts of the management systemand is subject to regular internal and external review.MPI and DWG have in place mechanisms to evaluate all parts of the managementsystem. The 100 level is reached.
The fishery-specificmanagement system issubject to regularinternal and occasionalexternal review.
The fishery-specificmanagement system is subjectto regular internal and externalreview.
Met? Y Y N
Ju
sti
ficati
on
The Ministry implements a comprehensive peer-review process for all scienceresearch that is used to inform fisheries management decisions. In addition to therecently released Research Standard it also includes:
(a) a range of science working groups which include members of the scientificcommunity, research providers, commercial fishers, fisheries managers andenvironmental stakeholders
(b) the availability of all peer-reviewed and accepted research papers to thewider public; and
(c) options for independent and external peer-review of novel or contentiousresearch
The harvest strategy was subject to external review. However there has not been areview of the ling stock assessment in recent times. However the working groupreviewed the versions of the assessments reported in the fish stocks plenaryreportsThe fishery-specific management system is subject to regular internal andoccasional external review. This SI meets the 80 SG.
References
Mfish 2010d
Mfish 2010f
Mfish 2010k
Mfish2010l
Mfish 2011b
Mfish 2011e
MPI 2012a
MPI2012b
MPI2013f
OVERALL PERFORMANCE INDICATOR SCORE: : All of the scoring guideposts meetthe 60 and the 80 and one of the two at 100 level
90
CONDITION NUMBER (if relevant):
Final report NZ Ling: v4 August 2014 Page 181 of 240
PI 2.3.1. The fishery meets national and international requirements for theprotection of ETP species. The fishery does not pose a risk of serious orirreversible harm to ETP species and does not hinder recovery of ETPspecies
Score Longliners: 75
Rationale
Risk assessment analyses have shown that the known effects of the smallbottom longline fishery (<34m not targeting bluenose or snapper) on birdpopulations have the potential to create unacceptable impacts on particularspecies, but the contribution to this issue by the specific Units of Certification isnot clear.
ConditionThe client is required to demonstrate that the direct effects of <34 m longlinevessels (not targeting bluenose or snapper) are highly unlikely to createunacceptable impacts to ETP bird species.
Milestones
By the first annual audit, the client will provide evidence in the form of a reporton the work it has undertaken to demonstrate that the direct effects of <34 mlongline vessels (not targeting bluenose or snapper) are highly unlikely to createunacceptable impacts to ETP bird species. This milestone has been defined asa means to monitor progress. Meeting the milestone would likely not result in achange in score at this surveillance audit.
By the second annual surveillance audit the client will provide evidence in theform of a report to show that the direct effects of <34 m longline vessels (nottargeting bluenose or snapper) are highly unlikely to create unacceptableimpacts to ETP bird species. Meeting this milestone will demonstrate that allscoring issues of the SG 80 have been met and would result in a score of 80 forthis performance indicator.
Client action plan
Year 1:
Continue to monitor and report observed seabird captures in the lingfisheries in accordance with MO1.2, MO1.6, MO2.5 and MO2.6 of theNational Fisheries Plan (MPI, 2013).
Review existing information to assess the nature and extent of seabirdinteractions in the ling longline fisheries. Review will include analyses ofcaptures by species, area, method and vessel size, and take into accountNew Zealand seabird risk assessment framework.
Assess the operational aspects of seabird interactions in ling long linevessels <34 m,
Develop and implement Operational Procedures for ling long line vessels<34 m, including seabird mitigation, Vessel Management Plans, educationand outreach, as required.
Final report NZ Ling: v4 August 2014 Page 182 of 240
Continue to monitor and report observed bird captures in the ling fisheriesin accordance with MO1.2, MO1.6, MO2.5 and MO2.6 of the NationalFisheries Plan (MPI, 2013)
Continue implementation and monitoring of the Operational Procedures forling long line vessels (<34 m).
Assess the nature and extent of the of seabird interaction, by the ling long-line vessels (<34 m) including analyses of captures by bird species, area,fishing method and vessel size, and take into account New Zealandseabird risk assessment framework.
Consultation oncondition
MPI has confirmed that it supports the intentions of Deepwater Group Ltd withregards to the certification of trawl and bottom longline fisheries in LIN3-LIN7.
The Ling Client Action Plan was drafted by DWG in consultation with MPI, andMPI is committed to supporting implementation of the Action Plan whereverpossible.
Table A1.3: Condition 2
PerformanceIndicator
PI 2.3.2. The fishery has in place precautionary management strategiesdesigned to:
• Meet national and international requirements;• Ensure the fishery does not pose a risk of serious harm to ETP
species;• Ensure the fishery does not hinder recovery of ETP species; and• Minimise mortality of ETP species
Score Longliners; 75
RationaleThere is no current consistent strategy for managing bird interactions within theinshore longline fishery component, which is part of the fishery component thatthe bird Risk Assessment has noted presents a notable risk to seabirdpopulations.
Condition
The client is required to demonstrate that there is a strategy in place formanaging the inshore longline fishery component’s impact on ETP species,including measures to minimise mortality, which is designed to be highly likely toachieve national and international requirements for the protection of ETPspecies.
Milestones
By the first annual audit, the client will provide evidence in the form of a reporton the work it has undertaken to develop a strategy for managing the inshorelongline fishery component’s impact on ETP species, including measures tominimise mortality. This milestone has been defined as a means to monitorprogress, meeting the milestone would likely not result in a change in score atthis surveillance audit.
By the second annual surveillance audit the client will provide evidence in theform of a report on the further work it has undertaken to develop and implement
Final report NZ Ling: v4 August 2014 Page 183 of 240
a strategy for managing the inshore longline fishery component’s impact on ETPspecies, including measures to minimise mortality. This milestone has beendefined as a means to monitor progress, meeting the milestone would likely notresult in a change in score at this surveillance audit.
By the third annual surveillance audit the client will provide evidence in the formof a report on the further work it has undertaken to develop and implement astrategy for managing the inshore longline fishery component’s impact on ETPspecies, including measures to minimise mortality which is designed to be highlylikely to achieve national and international requirements for the protection ofETP species. Meeting this milestone will demonstrate that all scoring issues ofthe SG 80 have been met and would result in a score of 80 for this performanceindicator.
Client action plan
Year 1:
Continue to monitor and report observed bird captures in the ling fisheriesin accordance with MO1.2, MO1.6, MO2.5 and MO2.6 of the NationalFisheries Plan (MPI, 2013)
Review existing information to assess the nature and extent of seabirdinteractions in the ling long line fisheries, use this information in thedevelopment of the management strategy for ling long-line vessels
Assess the operational aspects of seabird interactions in ling long linevessels <34 m,
Develop and implement Operational Procedures for ling long line vessels<34 m, including seabird mitigation, Vessel Management Plans, educationand outreach, as required.
Year 2:
Continue to monitor and report observed bird captures in the ling fisheriesin accordance with MO1.2, MO1.6, MO2.5 and MO2.6 of the NationalFisheries Plan (MPI, 2013)
Continue implementation and monitoring of the Operational Procures forling long line vessels (<34 m).
Assess the nature and extent of the of seabird interaction, by the ling long-line vessels (<34 m)
Year 3:
Continue to monitor and report observed bird captures in the ling fisheriesin accordance with MO1.2, MO1.6, MO2.5 and MO2.6 of the NationalFisheries Plan (MPI, 2013)
Report the efficacy of the management strategy (which includes a riskbased management framework, observation and reporting, andOperational Plan for long-line vessels.
Consultation oncondition
MPI has confirmed that it supports the intentions of Deepwater Group Ltd withregards to the certification of trawl and bottom longline fisheries in LIN3-LIN7.
The Ling Client Action Plan was drafted by DWG in consultation with MPI, andMPI is committed to supporting implementation of the Action Plan whereverpossible.
Final report NZ Ling: v4 August 2014 Page 184 of 240
PI 2.3.3. Relevant information is collected to support the management offishery impacts on ETP species, including:
• Information for the development of the management strategy;• Information to assess the effectiveness of the management
strategy; and• Information to determine the outcome status of ETP species.
Score Longliners: 75
Rationale
A key component of quantifying ETP interactions within the fishery is theinformation obtained through the observer programme. Currently, observercoverage in key components of the longline fishery in all areas is felt to beinsufficient to measure trends and support a full strategy to manage impacts onETP species. In turn, it is not clear whether the absence of interaction estimatesfor some UoC reflects the absence of interactions, or the limitations of availabledata.
Condition The client is required to demonstrate that information is sufficient to measuretrends and support a full strategy to manage impacts on ETP species.
Milestones
By the first annual audit, the client will provide evidence in the form of a reporton the work it has undertaken to demonstrate that information is sufficient tomeasure trends and support a full strategy to manage impacts on ETP species,including measures to minimise mortality. This milestone has been defined as ameans to monitor progress, meeting the milestone would likely not result in achange in score at this surveillance audit.
By the second annual surveillance audit the client will provide evidence in theform of a report on the further work it has undertaken to measure trends andsupport a full strategy to manage impacts on ETP species, including measuresto minimise mortality. This milestone has been defined as a means to monitorprogress, meeting the milestone would likely not result in a change in score atthis surveillance audit.
By the third annual surveillance audit the client will provide evidence in the formof a report to demonstrate that information is sufficient to measure trends andsupport a full strategy to manage impacts on ETP species. Meeting thismilestone will demonstrate that all scoring issues of the SG 80 have been metand would result in a score of 80 for this performance indicator.
Client action plan
Year 1:
Continue to monitor and report observed bird captures in the ling fisheriesin accordance with MO1.2, MO1.6, MO2.5 and MO2.6 of the NationalFisheries Plan (MPI, 2013)
Conduct a review of available data to assess the nature and extent of ETP
Final report NZ Ling: v4 August 2014 Page 185 of 240
seabird interaction information for ling long-line fisheries
Ascertain whether this information is adequate to support a strategy tomanage ETP seabird species and support progress towards determiningthat the fisheries do not pose a threat to the protection and recovery ofETP species.
Identify main information gaps in order to target future data gatheringactivities
Year 2:
Continue to monitor and report observed bird captures in the ling fisheriesin accordance with MO1.2, MO1.6, MO2.5 and MO2.6 of the NationalFisheries Plan (MPI, 2013).
If the gap analysis undertaken in Year 1 fails to demonstrate that there isadequate information available on ETP seabird interactions to support astrategy for management and determine that ling longline fisheries do notpose a threat to the protection and recovery of ETP species:
Develop an agreed strategy to increase the information available tosupport a management strategy for bycatch. This agreed strategy couldinclude:
Assessing the requirements of observer coverage across seasons, sub-areas and across each fish stock in accordance with MO1.4 of theNational Fisheries Plan (MPI, 2013)
Assessing whether MPI is able to increase observer coverage ling bottomlongline fishing effort
Assessing the feasibility of independent third party observers or fisheriestechnicians to collect required information
Year 3:
Continue to monitor and report observed bird captures in the ling fisheriesin accordance with MO1.2, MO1.6, MO2.5 and MO2.6 of the NationalFisheries Plan (MPI, 2013)
Provide evidence of the nature and extent of the of seabird interaction inling long-line fisheries, demonstrate that information is sufficient tomeasure trends and support a full strategy to manage impacts on ETPseabird species in ling long-line fisheries.
Consultation oncondition
MPI has confirmed that it supports the intentions of Deepwater Group Ltd withregards to the certification of trawl and bottom longline fisheries in LIN3-LIN7.
The Ling Client Action Plan was drafted by DWG in consultation with MPI, andMPI is committed to supporting implementation of the Action Plan whereverpossible.
Final report NZ Ling: v4 August 2014 Page 186 of 240
Has the assessment team arrived at anappropriate conclusion based on the evidencepresented in the assessment report?
Yes/NoYes (in mostcases)
Conformity Assessment BodyResponse
Justification:The assessments made in this report are especiallychallenging given the restricted information base availablefor some UoCs - in particular UoCs in which very littleobserver coverage has been achieved. Broadly, theinformation supports the scores assigned. However, in somecases, the lack of information would have contributed to thisreviewer assigning a different score.
If included:Do you think the client action plan is sufficientto close the conditions raised?
Yes/NoPI 2.3.1: NoPI 2.3.2: YesPI 2.3.3: No
Conformity Assessment BodyResponse
Justification:PI 2.3.1: The information base available on the vessels in thissize class is very small. The condition most likely requiresthe collection of new information. If monitoring is expectedto be conducted using “typical” levels of observer coverageassigned to these vessels, meeting the condition will mostlikely be extremely challenging. If new data is to be collected,a longer timeframe is required to meet the conditioneffectively.
PI 2.3.2: Demonstrating the ongoing commitments toimplementing the strategy would also be necessary.
See responses above.
Do you think the condition(s) raised areappropriately written to achieve the SG80outcome within the specified timeframe?
Yes/NoPI 2.3.1: NoPI 2.3.2: YesPI 2.3.3: No
Conformity Assessment BodyResponse
Justification:PI 2.3.1: The timeframe over which progress against thecondition is measured would be more likely to support thedesired outcomes if longer. Bycatch events are variablebetween years, sometimes due to factors beyond thefishery’s sphere of influence. Demonstrating, with any at-seainformation, that longline vessels <34 m (not targetingbluenose or snapper) are highly unlikely to createunacceptable impacts to ETP bird species would beexpected to take longer than one year. Given the lack ofinformation currently available on bycatch by vessels of thissize class, the collection of new information is expected tobe required to meet this condition. Adding at least one moreyear is recommended. Adding another two years in which thecondition can be addressed is desirable.
PI 2.3.2: The timeframe over which the condition is to beaddressed is achievable. Note that at-sea monitoring aboverecent levels implemented by government would be expectedto be necessary to close out the condition. Demonstratingthe ongoing commitments to implementing the strategywould also be necessary.
PI 2.3.3: The timeframe over which the condition is to beaddressed would benefit from being longer, to allow moreinformation to be collected where new information isrequired. As noted under PI 2.3.1 above, bycatch events arevariable between years, sometimes due to factors beyondthe fishery’s sphere of influence. Therefore, more than oneyear of information is required to address this condition anda commitment to ongoing data collection is necessary.Further, the long lead-in time that is typically required to planthe allocations of government observer services couldconstrain addressing the condition in the current timeframe.Extending the timeframe by one year is recommended.
In addition, there are two recommendations made in thereport. The content of these recommendations is appropriateto the assessment.
We note the response, and agreethat if the first milestone (whichincludes review of existinginformation from the observerprogramme for this specific fleet)indicates that further informationneeds to be collected, the timescalefor meeting this Condition may beextended. This will be reviewedduring the first annual audit.
Agreed, and this would be subject toscrutiny during the future annualaudits. Failure to maintain a strategywould reduce the score for this PIaccordingly.
We note and agree with theresponse. As for Condition 1 above,this would be subject to review at thefirst annual audit.
PI 2.3.3: Information to measure trends would need to have atemporal extent of more than one year. Deferring the finalreporting on the condition to Year 4 is recommended.Demonstrating the ongoing elements of informationcollection as needed to support a full strategy would also beimportant.
Performance Indicator ReviewPlease complete the table below for each Performance Indicator which are listed in the Conformity Assessment Body’s Public CertificationDraft Report.
Performance
Indicator
Has all the
relevant
information
available been
used to score
this Indicator?
(Yes/No)
Does the
information
and/or rationale
used to score this
Indicator support
the given score?
(Yes/No)
Will the
condition(s)
raised improve
the fishery’s
performance to
the SG80 level?
(Yes/No/NA)
JustificationPlease support your answers by referringto specific scoring issues and anyrelevant documentation where possible.Please attach additional pages ifnecessary.
Conformity Assessment Body Response
1.1.1 Yes Yes NA Ministry for Primary Industries’ PlenaryReports reflect the best available informationdescribing the status of New Zealandcommercial fish stocks. The information usedto assess stock status is drawn from thesereports. Stock assessments captured inplenary reports are conducted by contractedscientists and reviewed by a working groupprocess open to all stakeholders. Stockassessment results convey confidenceintervals which relate to the certainty levelsrequired in assessing the scoring issues(e.g., a high degree of certainty).1.1.1(b): LIN3&4: The lower bound of the95% credible interval of spawning biomassas a percentage of B0 briefly dips below themanagement target of 40% in the early2000s. Consider clarifying this in the text.
1.1.2 Yes Yes NA 1.1.2(c): The dominant precautionary issueconsidered appears to be the imperfectinformation base on the fishery andpopulation, rather than ecological context perse.
A note on the position of ling within thefoodweb (it is not a 'keystone' species) andthe maintenance of ecological integrity at theTRP level in particular has been added.
1.1.3 NA NA NA The stocks under assessment are notconsidered depleted.
1.2.1 Yes Yes NA
1.2.2 Yes Yes NA 1.2.2(c): It would be useful to elaborate onhow the east-west split relates to lingharvests.Rationale could usefully describe whathappens when TACCs are overcaught (e.g.,is there an evaluation of the cause ofovercatch, how might this feed back intomanagement frameworks). Persistentovercatch may be indicative of issues withthe design and/or implementation of harvestcontrol rules, or the management structure.
This sentence has been removed.
Agreed, text has been added to cover this.
1.2.3 Yes Yes NA
1.2.4 Yes Yes NA 1.2.4(b): Identify for which stocks BMSY
values have been estimated under theassumption of deterministic dynamics.1.2.4(d): The age of the (2006 and 2010,respectively) LIN 6B and LIN 7CKassessments may reduce theappropriateness of their application to thecurrent fishery (i.e., robustness in practicalterms, rather than intrinsic robustness of themodels themselves at the time they weredone). (This could also reflected further inthe rationale for scoring issue 1.2.4(a)).
We have clarified that BMSY has only beenestimated/reported for some stocks, notingthat the management framework is using %B0
as reference levels.
We note the historical nature of theassessments for LIN 6B and LIN 7CK in PI1.1.1 and score that PI accordingly.
2.1.1 Yes Yes NA The variable level of information available forassessing the retained species is noted.Building knowledge of stock statuses forpoorly known species is encouraged.For some species, consideration under2.1.1(d) seems appropriate (or the rationaleas to why this is not appropriate presented –e.g., accompanying Table 19’s listings). Forexample, the MPI Plenary Report is clearthat the status of white warehou is unknown,and the sustainability of the current TACC(and catch level) is also unknown.
We disagree with the part of this commentfocusing on 2.1.1d, noting that 2.1.1d formspart of the SG60 hierarchy text, and hencewould be scored if a main stock wereconsidered only likely to be within biologicallybased limits. White warehou is, for thereasons articulated in that section,considered highly likely to be withinbiologically-based limits. As noted in thescoring guidepost text for 2.1.1.a (80) " Mainretained species are highly likely to be withinbiologically based limits (if not, go to scoringissue c below)." As noted we recommend thatthe level of capture of this species should bemonitored in the annual audits.
2.1.2 Yes Yes NA 2.1.2(b): Examples of other fisheries forwhich TACCs have been revised wouldprovide additional evidence of the efficacy ofthis kind of partial strategy.2.1.2(e): The NPOA-Sharks 2013 is nowfinalised and published, and includesinformation relating to the management ofshark finning:http://www.fish.govt.nz/en-nz/Consultations/npoa+sharks+2013/default.htm
-Note the comment about consistency inscoring approaches in the “Any othercomments” box below.
Agreed, the example of hoki has been added.
Agreed, the NPOA was finalised following thesubmission of the review draft. The text hasbeen updated accordingly.
2.1.3 Yes No NA 2.1.3(c): For UoCs with very low levels (orunknown, for LIN7 offshore) of observercoverage (e.g., Inshore LIN7, LIN4, LIN5 andOffshore LIN3), the best possible score forthis SI is 80 in my view (noting that the 100-level score relates to all retained species, notmain). Information to support a strategyshould include information on the fishery andcatches of all retained species (ideally withthe independence and detail that observerdata provides).
We disagree. While the low level of observercoverage does indeed lead to a lower scorefor elements a, b and d, in our view howeverthe information to support a strategy tomanage retained (QMS) species is availablethrough the logsheets, the available observerinformation, and fishery-independent surveyinformation which allows the monitoring of theretained species population (rather than thesub-component seen by observers).
2.2.1 No No NA 2.2.1(a): Orange roughy is a QMS species,and so by definition not a bycatch species.The introductory text section mentionscommon roughy, which may be what ismeant here. In that case, information oncommon roughy would be needed to makean assessment.
This was a typo - should read commonroughy - text adjusted.
2.2.2 Yes Yes NA Note the comment about consistency inscoring approaches in the “Any othercomments” box below.
2.2.3 Yes Yes NA 2.2.3(b): The score is appropriate at 80, butthe text for the 100-level SI is included.2.2.3(c): Include scoring conclusions for allUoCs under the SI100 box.2.2.3(d): The lack of observer coverage forsome UoC is especially challenging for thisSI.
2.3.1 Yes No 2.3.1(a): Where no observer coverage has occurred, theeffects of the fishery on ETP species can be qualitativelyassessed but cannot be “known”. Therefore, in my view,in fisheries for which minimal (e.g., < 5% coverage)observer (or electronic monitoring) information isavailable, SG80 cannot easily be met.-Noting the requirement of the NPOA-Seabirds (i.e., thatseabird species identified as at very high or high risk ofhaving commercial fisheries bycatch exceed populationsustainability limits should be managed to a lower riskcategory by 2018-including species reported caught inling fisheries such as Salvin’s albatross, Buller’salbatross, white-capped albatross and Chathamalbatross) would be useful.https://fs.fish.govt.nz/Doc/23121/AEBR_109_2596_PRO2010-02,%20Obj.%201,%20MS4,%20RR2,1.pdf.ashx-Similarly, requirements of the National Plan of Action-Sharks should be considered, to the extent that theserelate to ETP shark species.2.3.1(b): Observer-collected information and modellingoutputs, including estimated captures, are now publiclyavailable for seabird and marine mammal bycatch, to theend of the 2010/11 fishing year(https://data.dragonfly.co.nz/psc/). For trawlers, 8incidences of birds being landed dead from the trawlwarps or doors have been reported by observers sincethe 2004/05 fishing year. Four times that many netcaptures have been reported (https://data.dragonfly.co.nz/psc/v20130304/birds/ling-trawl/all-vessels/eez/all/). Reporting all interactions with trawlgear is deemed important, rather than recommendingany focus on a subset of that gear.Tidying up the rationale text explaining why offshorebottom longline vessels are considered problematic inthis SI would be helpful-the uncertainty around estimatesseems to be the reason. The inshore case is clear.
Through the modelling approach used, thepotential impact of bycatches can bedeveloped through the available observationsor by 'inference'. However, as noted under2.3.1a, this leads to greater uncertainty inestimates, such that the effects of the fisheryare known. Improvement of the availableinformation is needed to address this, andhence has been raised as the subject of aCondition.
Noted, these further references have beenadded to the text of this PI as well as PI2.3.3where relevant to information.
2.3.2 Yes No NA 2.3.2(a): Please clarify which legislationprovides the strategy to minimise ETP fishmortality.2.3.2(c): The scoring rationale relates largelyto trawlers. For fisheries where minimalobserver coverage or other vessel-based at-sea monitoring has occurred, I do notconsider that there can be evidence that thestrategy is being implemented successfully.Referring to the regulations for thedeployment of seabird bycatch reductionapproaches in bottom longline fisherieswould be helpful in this section.
We have clarified the text.
This has been clarified in the text, noting thatwhile the observations available do notprovide 'clear evidence', the availableinformation from observers and enforcementagencies to provide evidence. A reference tothe regulations has been added.
2.3.3 Yes Yes NA 2.3.3(c): It would be useful to give a specificexample of uncertainties applicable to LIN6longline, given the high levels of observercoverage achieved in that UoC.
Text updated to note the relatively highuncertainty/variability in the resulting modelestimates for this region, which despite therelatively high observer coverage will affectthe ability to measure UoC-specific trends.
2.4.1 Yes Yes NA
2.4.2 Yes Yes NA 2.4.2(a): I suspect the Marine Reserves Act(1971) is the intended Act here.-Note the comment about consistency inscoring approaches in the “Any othercomments” box below.
Agreed, text updated
2.4.3 Yes Yes NA I would consider the benthic surveys done inthe NZ EEZ to be extensive, rather thancomprehensive. Significant gaps remainacross a very large area.
2.5.2 No Yes NA 2.5.2(d): Where observer coverage is verylow, there will be minimal or no evidence thatsome measures intended to reduce fishingimpacts on components of the ecosystemare being implemented (e.g., lack ofinformation on seabird bycatch reductionmeasures required to be deployed in longlinefisheries). In my view, the SI cannot bescored at the 100 level.
We disagree, noting that observer coverageis but one part of the different informationalelements available to managers across thesefisheries, including the observer coverage onrelated fisheries within the regions, combinedwith the benthic surveys, VMS, etc. Thisprovides evidence that measures for themanagement of ecosystem structure andfunction are being implemented successfully.For specific key components of theecosystem (in particular ETP species), keyUoC have already been 'marked down' as aresult of the limited observer coverage within2.3.
2.5.3 Yes No NA 2.5.3(c): The rationale for scoring notes that“The main functions of some of thesespecies can be understood from existinginformation. However, for some bycatchspecies and protected benthic species,knowledge of ecosystem functions isminimal, or absent.” This appears to be atodds with a score of 80 allocated to thisscoring issue. The score of 80 requries that“The main functions of the Components (i.e.,target, Bycatch, Retained and ETP speciesand Habitats) in the ecosystem are known.”
Agreed, this has been clarified in the text.
3.1.1 Yes Yes NA 3.1.1(a): The rationale could also include thelegal protection provisions for marine wildlife,as in the Wildlife Act 1953 and the MarineMammals Protection Act 1978, and reportingrequirements around the incidental captureof these species during fishing.
This has been added to the text
3.1.2 Yes Yes NA
3.1.3 Yes Yes NA Fisheries Act s10 (d) could be considered asnot in support of managing according to theprecautionary principle, when information islacking (for example, where utilisation wentahead despite important gaps inenvironmental knowledge).
Noted. However this view has been debatedand MPI consider that the precautionaryapproach is always considered.
3.2.1 Yes Yes NA The National Plans of Action for sharks andseabirds, both revised and published in2013, provide additional examples ofmanagement objectives (relating to someETP species) that are applicable to theassessed fisheries and consistent withPrinciple 2.
3.2.2 Yes Yes NA 3.2.2(a): The rationale could also reflect theprocess of advice development – workinggroups reviewing information, preparation ofinitial position papers, consultation,preparation of final advice papers, adviceprovided to the Minister, and Ministerialdecisions being made.3.2.2(c): Identifying key outcomes from theFAO document and comparing those to theFisheries Act provisions would be useful.Fisheries Act s10 (d), included in thejustification for scoring issue (c), could beconsidered as not in support of managingaccording to the precautionary principle,when information is lacking.3.2.2(d): The rational for this SI could alsoinclude the annual review reports producedby MPI to describe performance and deliveryon fisheries management objectives, e.g., fordeepwater fisheries:www.mpi.govt.nz/Default.aspx?TabId=126&id=1827 andhttp://deepwater.hosting.outwide.net/wp-content/uploads/2014/03/MPI-2013-Annual-Review-Report-2012-13-ARR.pdf
These comments are helpful and text hasbeen added to incorporate the main pointsraised.
3.2.3 Yes No NA 3.2.3(a): In my view, for fisheries with minimalobserver coverage the scoring issue cannot bemet at the 100 level. This requires (amongst otherthings) the implementation of a comprehensivemonitoring system. Observer programmes arepart of best practice approaches for fisheriesmanagement, and achieving a comprehensivemonitoring system without a reasonable level ofobserver coverage (or electronic) monitoringseems impossible. In addition, there must be ademonstrated consistent ability to enforcemanagement measures etc. “Consistent” seemsto imply comprehensive monitoring to be atreasonable levels over time. While the frameworkexists (e.g. legislative provisions for observers,and the existence of a programme) observers stillneed to be deployed in fisheries to be effective formonitoring.3.2.3(c): Clarify the extent of the 100 sea daysreferred to, i.e., is this allocation intended toprovide for the collection of information relating tocompliance by government observers across all(assessed?) ling fisheries?In future, it would be worth exploring thecompletion of non-fish protected species catchreturns by fishers. While a required part of thereporting framework, utilisation of these forms ispatchy (e.g., Pierre et al. 20139).
Agree the justification has been changed toaddress this and the score reduced from 100to 90 to reflect this.
3.2.4 No Yes NA 3.2.4(a): The rationale could note the increasingextent to which DOC and MPI are workingtogether on protected species research planning.An example of a recent DOC research plan forfisheries interactions can be found at:www.doc.govt.nz/Documents/conservation/marine-and-coastal/marine-conservation-services/approved-csp-annual-plan-2013-14.pdf.The strategic plan guiding the production of thisresearch plan is at:www.doc.govt.nz/Documents/conservation/marine-and-coastal/marine-conservation-services/reports/csp-strat-statement2013.pdfCollaboration amongst the two agencies extendsto planning observer services, especially in areasof shared priority and inshore fisheries (though notcapturing inshore ling fisheries currently), e.g.,www.fish.govt.nz/NR/rdonlyres/4C71155C-BD92-4D6E-A4B9-198DA7BA7717/0/FINALInshoreObserverProgramme201314.pdf3.2.4(b): Rationale could also reflect the work onprotected species-fisheries interactions (thereforerelevant to P2) done by the Conservation ServicesProgramme at DOC. CSP follows a similarprocess to MPI in terms of consulting stakeholdersand disseminating project outputs. For example,see: www.doc.govt.nz/conservation/marine-and-coastal/conservation-services-programme/meetings-and-project-updates/.
Agreed. Text has been added to thejustification for these scoring issues.
3.2.5 Yes Yes NA 3.2.5(a), (b): The Annual Review Reportprovides another form of internal review, ofthe performance and delivery of themanagement system.3.2.5(b): Clarifying the extent of stockassessment review would be helpful. Thetext notes “However there has not been areview of the ling stock assessment in recenttimes.” However, the working group reviewedthe versions of the assessments reported inthe fish stocks plenary reports. Some ofthese assessments are somewhat datednow, and so this comment may refer tothese, or possibly a lack of wider externalreview?
References have been omitted for this PI, butshould be added.
The comments are accepted and textchanges made.
References have been added
Any Other CommentsComments Conformity Assessment Body Response
There appeared to be one consistency issue in the report around the assessment ofpartial strategies and strategies across scoring issues. In PI 2.4.2, scoring issue (a)identifies whether a partial strategy or a strategy is in place. Scoring issue (d) isbased on a strategy (which is not considered to exist in this case, and the scoringissue is not assessed). However, in previous situations (e.g., PI 2.1.2, scoring issues(a) and (d); PI 2.2.2, scoring issue (a), (c) and (d)), the assessment of ‘strategy’scoring issues continued in cases where only partial strategies were considered to bein existence.
This has been noted, along with the comments made by the other reviewer, and thescores adjusted accordingly.
Has the assessment team arrived at anappropriate conclusion based on the evidencepresented in the assessment report?
YesConformity Assessment BodyResponse
Justification:
In general, yes, the assessment team has arrived at anappropriate conclusion based on the evidence presented.Specific comments are made with respect to PIs in the scoringassessment, below (and particularly with respect to some P2PIs), and clarification on those points is required. Assumingthat the information is provided and the data (for example onretained and bycatch species) show what is expected, thefishery should still proceed through the assessment with onlythe existing three proposed conditions of certification.
If included:Do you think the client action plan is sufficientto close the conditions raised? Yes
Conformity Assessment BodyResponse
Justification:
Again, no further comments – the conditions appear to beappropriately written.
For reports using the Risk-Based Framework please follow the link.
For reports assessing enhanced fisheries please follow the link.
Do you think the condition(s) raised areappropriately written to achieve the SG80outcome within the specified timeframe?
YesConformity Assessment BodyResponse
Justification:
No further comments – the conditions appear to beappropriately written.
General Comments on the Assessment Report (optional)
The Executive Summary does not describe the fishery – there is no indication of what gears are used, where thefishery operates, how much of the target species is taken and what other species are taken as incidental catches.It would be very useful for readers to have that description before being presented with the scores for 10 scoredUoCs (and what do the acronyms LIN2, LIN3, etc. mean?).
Some additional text has been added to better describe the fishery.
It is noted that the fisheries are almost always referred to by the LIN number rather than by UoCnumber. For example, Table 1 shows vessels by gear and target fishery but does not indicate how thisrelates to UoCs, and even the scores for the PIs are given by LIN number, for example for PI 2.1.3they are given as “90 (LIN3,4,5,6 trawl, LIN6 longline) LIN7 trawl, LIN3,4,5 longline) 80 LIN 7longline”. This is not helpful in an MSC report where fisheries are assessed by UoC, but it’sparticularly unhelpful given that there are 10 UoCs being scored covering 5 geographic areas and 2gear types, and where the LIN numbers don’t correspond to the UoC numbers (ie. LIN 3 = UoCs 2 and8, LIN 4 = UoCs 3 and 9). Given the complexity, adding the UoC numbers in to the text in parenthesesfollowing any mention of LIN numbers is more or less essential if understanding is to be imparted toreaders.
While the point is well taken, given the fishery is managed using LIN numbers and stakeholders aremore familiar with this description the team consider it appropriate to refer to the LIN number ratherthan the UoC number .
Section 3.1.1. Please describe/define QMA, and add to list of acronyms.
Acronym spelt out in the text and is in the list of acronyms.
Section 3.2.2. It is noted that “An unpublished report written by Baird, et al. (2002) on the spatial extent andnature of mobile bottom fishing methods within the New Zealand EEZ, 1989-90 to 1998-99 provides furtherdata on trawl gear types.” But, unless it is available (i.e. published), this report is not useful. In any case,the citation for Baird et al. 2002 is not provided in the reference list.
Reference removed.
Section 3.2.2. The report states “The fleets for the deep and mid-water fisheries of ling consist of semi-pelagic
trawls” but then goes on to describe Alfredo and Korean bottom trawl net designs. Please clarify if thefleets use only semi-pelagic gears or a combination of bottom trawl and semi-pelagic gears.
Clarified in the report
Section 3.2.2. The report states ““Kapron” trawls are used by the Russian/Ukraine fleet”. Please indicate howthis fleet fits in with the NZ fishery.
Clarified in the report
Table 1 source is Foster 2014. This is missing in the reference list.
Table 1 indicates ‘trawl target vessels’, ‘lining target vessels’ and ’target vessels using other methods’.What other methods are these, and are they included somewhere in the assessment or not included(because the existing UoCs only specify trawl or long-line methods)?
Clarified
Section 3.2.3. Non-NZ vessels are reported to have harvested ling previously. Are any non-NZ vesselsstill permitted or active inside the NZ EEZ?
All vessels are New Zealand owned or in partnership/chartered by New Zealand companies
Section 3.2.3. Please define/describe AMP, and add to list of acronyms.
The acronym has been spelt out. As this no longer applies, we have left the text as is.
Table 3. It would be useful to provide the mean landings by UoC for the last 5 years in the different LINs.
These are available on the MPI website, and to ensure the report is not overly long is not reproducedhere.
Section 3.2.3. It would be very helpful to explain the relationship between the FMAs, QMAs and fishstocks, early in this section. For example, Table 3 lists the QMAs against the fish stocks (LINs), butQMAs 8 and 9 are not shown in Figures 1 or 2, which show the FMAs (LINs). Why do QMAs 8 and 9not appear in Figures 1 or 2?
It is agreed that with the Ling fishery areas can be confusing as the management areas (QMAs andFMAs) do not always align with the biological stocks. The caption under Fig 2 has been revised toclarify the different areas. We note as per table 3, QMAs 8 and 9 are part of stock area LIN7 andLIN1, respectively.
Section 3.3.3. In combination with comment 11, above, a figure showing LIN 2 and 7 in detail is neededsomewhere. Figure 2 shows the FMAs in general, but the existing text states that parts of LIN 2 and 7are associated and uses the descriptors CK and WC which are not shown in the figure. Andwhere/what is LIN 2/7CK?
This is detailed in the re-arranged text for Section 3.3.3.
Similarly, Table 3 shows fish stock LIN 2 to be associated with QMA 2, and fish stock LIN 7 to beassociated with QMAs 7 and 8. The NZ government website indicates that QMA 8 is analogous toLIN 7CK, but how this all fits together is not clear at all from the report.
See response above.
Section 3.3.3. starts “Stock assessments are fully described in reports (Horn et al., 2013 and Horn and Francis,
2013) and in the recent Plenary Reports. Details are not reproduced here”. In fact, large chunks of the textin this section specific to the different UoCs have been copied from the detailed plenary reports. Whileusing appropriately referenced text in this way is not necessarily an issue, readers of MSC reportsshould not be required to have specialist knowledge of stock assessment methodologies in order to
understand the text. However, this is the case, here, where sentences such as “MCMC chains wereconstructed using a burn-in length of 5x10⁵ iterations, with every 1000th sample taken from the next 106iterations (i.e., a final sample of length 1000 was taken from the Bayesian posterior).” are almost certainlycompletely meaningless to most readers. A relatively simple summary of the stock assessmentapproach taken in each area would be of far more use to the average reader – P1 specialists can bedirected to read the detailed text in the plenary reports if they want more information.
Noted and well taken, however, extracting text that describes the stock assessment is considered to bethe most effective way to ensure it is accurately reported
Section 3.4.1 states “The impact of trawling for conservation and species diversity/persistence can be limited iftrawling affects small proportions of a habitat type within an area.” I agree, but is there any informationavailable on the time taken for recovery in these areas?
A cross-reference to section 3.4.3.1 has been added.
Table 6. Please indicate what the dashes, crosses and empty cells mean.
This has been clarified.
Section 3.4.1. The report states “The New Zealand Government closed 17 BPAs (Benthic Protection Areas)within the New Zealand EEZ (Exclusive Economic Zone) to bottom trawl fishing methods in perpetuity as oflate 2007 ... Demersal trawling and dredging is prohibited in these areas (pelagic fishing and demersallonglining being allowed)”. As at least some of the trawl gear used in the ling fishery is semi-pelagic, sodo these BPA closures extend to the ling fishery?
See Section 3.4.3.1
Section 3.4.2. This states that Ministry of Fisheries observer data are available, and that these provide accurate
and verifiable information on catch weight for all QMS and non-QMS species caught. However, Tables 7(trawl) and 8 (longline) do not indicate which are retained and which are bycatch (i.e. discarded)species, does not provide quantities or a percentage of each species relative to the ling catch, and isonly for the top 10 species (how is ‘top ten’ defined – by weight??). This lack of information preventsthe reader from understanding which are main retained or main bycatch species, and whether or notthere are more species that should have been considered as ‘main’. Some of this information isprovided later in the text, but this still provides no indication of whether these species and quantitiesare retained or bycatch, or some combination of both. It would be simplest and clearest to extendTables 7 and 8 and provide totals for all species taken down to a sensible minimum contribution.
Within Table 6, non-QMS species (which are not required to be retained, a point which has beenadded to the Table heading) are noted with a *.Clarified that the top 10 are defined by weight.We note that the paragraph above the table states "The top ten species (retained and bycatch) withinhake-targeted trawl fisheries by management area, based upon observer data from a five-year periodfrom 2007/08 to 2011/12. Proportion of QMS species in catch by weight noted"
Section 3.4.2.2 states “IUCN status of species reported captured ranges from Least Concern (e.g. Cape Petrel) to
Vulnerable (www.iucnredlist.org).” It would be useful if the species in the vulnerable category were
Described and reference to Hobday et al., 2007 added.
Section 3.4.2.2 states “The risk assessment noted that annual potential seabird fatalities within the 'large'longline complex were between 1% and 50% of the species PBR, while the 'small' longline complex weregenerally less than 10% of the species PBR”. Does the ‘small’ longline complex comprise all or a part ofthe ling longline fleet, or is the complex just a part of the ling longline fleet?
Clarified.
Section 3.4.2.2 states “Five species of sharks (the basking shark, deepwater nurse shark, white shark, oceanicwhitetip shark, and the whale shark) are protected by domestic legislation in New Zealand waters. The baskingshark has been reported to interact with the hoki trawl fishery (e.g. Francis and Lyon, 2012; Francis andSutton, 2012). However, there have been no observed interactions with the ling fishery noted over the period2007/08 - 2011/12.” The final sentence appears to refer to basking sharks. Have any interactions beenobserved or reported for the other species?
Clarified to note no observations of the other listed species seen.
Section 3.4.3.1. Figures 3 and 4 are somewhat interesting but they would more useful if they included thefishing areas or, even better, summary trawl VMS data, in order to allow readers to see where thefishery was working in comparison to habitats.
Section 3.4.3.1. A figure showing fishing activity (e.g., summary VMS data or hours fished by gridsquare) would be a very useful addition to the report. At present, readers are given no indication ofwhere fishing occurs except on a gross scale.
A figure (Figure 5) and reference to the location of the documents on the DWG website has beenadded
Section 4.1. It is stated that harmonization between the hake, fishery and the ling and hoki fisheries hasoccurred (e.g. “Consistency of outcomes has been ensured” and “Conclusions, where appropriate, are
consistent between the three fisheries with respect to evaluation, scoring and conditions”), but no evidencehas been provided. A table showing scores and providing reasons for any substantial differenceswould be useful.
MSC requirements state that “where an assessment overlaps with a certified fishery or fishery inassessment that a CAB has already scored, the team shall base their assessment on the rationale andscores detailed for the previously scored fishery”. In this case the CAB has taken into account thecertified hoki fishery and the under assessment ling fishery.Further the MSC requirements state “to achieve harmonisation, CABs shall undertake the followingkey activities:
a. The use of complementary assessment trees.b. The sharing of fishery information.c. The achievement of consistent conclusions with respect to evaluation, scoring and conditions.”. Thishas been done andCI3.2.3.3 says “The team shall explain and justify any difference in the scores in the scoring rationalefor relevant PIs.” There are no substantial differences in the scores for these fisheries for relevant PIs.
A number of typographic mistakes were spotted in the report. These were highlighted and the reportreturned to the authors.
Performance Indicator ReviewPlease complete the table below for each Performance Indicator which are listed in the Conformity Assessment Body’s Public CertificationDraft Report.
Performance
Indicator
Has all the
relevant
information
available been
used to score
this Indicator?
(Yes/No)
Does the
information
and/or rationale
used to score this
Indicator support
the given score?
(Yes/No)
Will the
condition(s)
raised improve
the fishery’s
performance to
the SG80 level?
(Yes/No/NA)
JustificationPlease support youranswers by referring tospecific scoring issues andany relevant documentationwhere possible. Pleaseattach additional pages ifnecessary.
Conformity Assessment Body Response
1.1.1 Yes (all UoCs) Yes (all UoCs) N/A N/A
1.1.2 Yes (all UoCs) Yes (all UoCs) N/A N/A
1.1.3 Not scored Not scored N/A N/A
1.2.1 Yes (all UoCs) Yes (all UoCs) N/A N/A
1.2.2 Yes (all UoCs) Yes (all UoCs) N/A N/A
1.2.3 Yes (all UoCs) Yes (all UoCs) N/A N/A
1.2.4 Yes in general(all UoCs)
Yes in general (allUoCs)
N/A I have some concern overscoring UoCs 6 and 12 thesame as the other UoCs,when the most recentassessment for the LIN 2/7CKstock was rejected. Acomment from the authorswould be welcomed.
Which refer to the assessment for stock inLIN7. Given that the assessment model iscomparable to those used in the other stockareas, we consider it appropriate for the thestock and management regime, but 'markdown' these UoCs based on the informationavailable (1.2.3) and the historical nature ofthe assessment (1.1.1) noting that projectionsindicate the stock should remain healthy atrecent catch rates.
No (all UoCs) No (all UoCs) N/A In general, it is very difficult tounderstand how the differentUoCs have been scored asthe text indicates species byLIN rather than by UoCs.
Information on the quantitiesof retained non-target speciesin the different UoCs isdiscussd but not presentedclearly (e.g., in a table)anywhere in the report. Atpresent, readers are informedwhich are the main retainedspecies, and this looks to havebeen determined on the basisof weight as a percentage ofcatch. However, while weightis an important criterion for‘main’, the MSC GCR requiresthat vulnerability and value arealso considered. In my opinionit is essential that readers areprovided with simple,summarid catch data orobserver data to allow them todetermine if the decisionshave been taken appropriatelywith regard to deciding whichspecies are main or not.
Further to this expectation thata list of all retained speciesand their catch quantities isprovided, PI 2.1.1 SId SG60does not specify only ‘main’species. What measures orpractices are in place that areexpected to result in the
Note response to earlier main-text commentsand reference to the location of the fullspreadsheet on the DWG website. Note wehave also included an evaluation of thevulnerability of stocks when considering non-QMS species in particular.
We disagree with this part of the comment,noting that 2.1.1d forms part of the SG60hierarchy text in the MSC CertificationRequirements and hence would be scored ifa main stock were considered only 'likely' tobe within biologically based limits. That is notthe case for the main species in this fishery
fishery not causing theretained species (i.e., allretained species) to be outsidebiologically based limits orhindering recovery – N/A is notan appropriate answer, here,given the lack of otherinformation.
No (all UoCs) No (all UoCs) N/A Understanding the scoringrationale here is againhampered by the lack ofinformation provided on catchcomposition.
SId requires that there is astrategy in place (for allretained species), but SIaindicates that there is not astrategy in place. A ‘N’ istherefore appropriate for SId,togetehr with an overlal scoreof 85.
See comments above
The scoring has been amended to 85
Yes (all UoCs) Yes (all UoCs) N/A The scores for this PI seemsappropriate, but it is noted thatthe rationale states “Data onremovals of all retainedspecies are collected and areavailable are summarized inthe report of the StockAssessment Plenary”. A tablesummarising that informationby UoC would be useful(essential in my opinion) in theassessment report.
See comments above
No (all UoCs) No (all UoCs) N/ASimilar to the comment on PI2.1.1., there are no dataprovided on actual catch
Note response to earlier main-text commentsand reference to the location of the fullspreadsheet on the DWG website.
composition, which wouldgreatly aid in theunderstanding of the scoring.
Also similar to PI 2.1.1, PI2.2.1 SIc SG60 does notspecify only ‘main’ species.What measures or practicesare in place that are expectedto result in the fishery notcausing the bycatch species(i.e., all bycatch species) to beoutside biologically basedlimits or hindering recovery? Inparticular, a comment on howUoC 11 meets thisrequirement with respect toblack cod (where the reportstates: “Catches averagedover 20 tonnes per annum, afigure skewed by high catchesin the past - in the last twoyears catches were below onetonne.”) is required, given therisk that the recent reduction incatches may indicate a stockdecline.
We do not agree with this part of thecomment, noting that 2.2.1c forms part of theSG60 hierarchy text in the MSC Certificationrequirements, and hence would be scored if amain bycatch stock were considered only'likely' to be within biologically based limits.That is not the case here. For black cod, wehave clarified what was meant by highcatches in the past – considerable variabilityin catches from year to year, with no trend.
No (all UoCs) No (all UoCs) N/A It would be helpful to restatewhich species are consideredto be main.
SIc and SId require that astrategy is in place. As this isnot the case (SIa), all UoCscan achieve no more than theSG 80 level of performance-the score should be lowered
A reference to PI 2.1.1. has been added.
Score amended to 80.However, given 2.2.2focuses on strategy, rather than specificstocks, the current text is viewed asappropriate.
More information on howspecies outside the QMSsyetem ‘tend to be consideredas low risk’, and which speciesare outside the system, wouldsupoprt the scoring, here.
The report notes “Catches aregenerally below TACCs,especially for lower value non-target species”, but it shouldalso be noted that this,therefore, does not necessarilyprotect these stocks fromoverharvesting in anymeaningful way if the TACC isnot based on the results of anappropriate stock assessmentor other analyses of stockstatus.
Agreed, we have re-arranged the text toclarify the process.
We do not disagree, and this is one of thestated reasons why the current partialstrategy does not achieve the SG 100 level
Yes (all UoCs) No (all UoCs) N/A Again, it would be helpful torestate which species areconsidered to be main, here.
SIb is not specific to ‘main’species and so all speciesneed to be considered. It is notclear if all species have beenconsidered, however.
A reference to PI 2.1.1. has been added.
As per earlier responses, scoring element (b)relates to the text under a), hence at the 60and 80 level refers to the 'main' species, if soscored under a).
Yes (UoCs 2 –7, No (UoCs 8 –12)
Yes (UoCs 2 – 7,Yes probably(UoCs 8 – 12)
Scoring here is complicated bythe difficulty in distinguishingbetween seabird mortalitiesresulting from the ling-targetedlongline fishery, and seabirdmortlaities resulting from
As the reviewer notes, the combinedestimated catches for the grouped longlinefishery is above the estimated PBR. Acondition has been raised to examinewhether interactions from the specific UoClead to significant interactions. The client will
longline fisheries targetingother species. But, the reportnotes that “…black petrelinteractions being greater thanthe mean PBR” withoutspecifying how far above thePBR the mortalities are. Thisis important information and,although a condition has beenset to address uncertainty, acomment from the authors asto how the longline UoCs meetthe SG60 requirement of SIbwould be useful. For example,a check on the number of lingvessels versus other vesselsin the reporting group mightprovide some evidence toback up the assertion that“Known direct effects areunlikely to createunacceptable impacts to ETPspecies“.
A number of elasmobranchspecies are listed as beingprotected in NZ waters in theintroductory sections, but onlybasking shark is mentioned inthe scoring rationale. Can theauthors please confirm that noprotected shark species aretaken in the different UoCs?
be asked to provide information on therelative proportion of inshore- ling targetingvessels vs ‘other species’ targeting vessels. Ifthe relative proportion for ling is low then thefleet is unlikely to exceed the PBR on itsown. This would be checked through thecondition at the annual audit.
Yes (all UoCs) Yes (all UoCs) N/A The report states in thissection that “For example, thework overlaying trawl tracksand habitat types is extremelyinformative...”. It is noted,though, that there is nographical representation of theareas fished in comparison tohabitat provided in the report! Iagree that such a figure orfigures would be informative,and should be provided.
Agreed, a figure has been added (Figure 5)along with a reference to the documents onthe DWG website to the main text.
Yes (all UoCs) Yes (all UoCs) N/A As noted in another comment,a reference and clarificationfor the statement “The locationof key vulnerable habitat types(smokers, hydrothermal ventsetc) is known.” would behelpful, particularly given thelatter statement that “However,the extent of habitatknowledge at sub-regionalscales, including for vulnerablehabitat types, is patchier”.
See response to earlier comment.
Yes (all UoCs) No (all UoCs) N/A Given this is a demersalfishery, a comment on anyimpacts of the fishery onecosystem productivity andlinks to marine habitats maybe appropriate. This commentapplies to PIs 2.5.2 and 2.5.3,also.
Additional text on the impact of benthictrawling on ecosystem productivity has beenadded under 2.5.3. We note that, given thespecific layout of the MSC process, benthichabitat issues are dealt with under 2.4 andare not covered here.
Yes (all UoCs) No (all UoCs) N/A The rationale for SIa isinsufficient to justify a score of100. The report states “The
The text has been clarified to note that thepartial strategy of TACCs and measures tocontrol impacts on individual ecosystem
partial strategy in place…” and“There are no measures inplace relating to ecosystemfunction specifically”, while theMSC GCR states “A strategy... should be designed tomanage impact on thatcomponent specifically.”Ascore of 80 is appropriate,however.
components is built upon by a legislativeframework that together form a plan. We feelthat (consistent with the scoring for NZ hoki)this achieves the SG100 level.
No (all UoCs) Yes (all UoCs) N/A The rationale for SIb does notsupport a score of 100 for anyUoC. The report states “Withthe exception of the SouthernPlateau and Chatham Risewhere models includes lingwithin fish groups, existingmodels have not been used toinvestigate the impacts offishing on those ecosystemsor feed into the fisherymanagement process, andhence the main interactionshave not been fullyinvestigated for the lingfishery” while the SG100requirement is that “Maininteractions between thefishery and these ecosystemelements can be inferred fromexisting information, and havebeen investigated.” A score of80 seems more appropriate.
We have clarified the text to remove themisunderstanding. For LIN 3-6, existingEcopath models have been developed andused, and hence a score of 100 is given. Forthe other UoC where models do not exist (butimpacts can be inferred from existingmodels), a score of 80 is given.
Yes (all UoCs) Yes (all UoCs) N/A PI 3.1.1., SIa states that “MPIis required to consult withthose classes of persons
having an interest (including,but not limited to, Maori,environmental, commercialand recreational interests) inthe stock or the effects offishing on the aquaticenvironment in the areaconcerned” An example ofhow and where this hashappened may be useful.
Yes (all UoCs) Yes (all UoCs) N/A PI 3.1.2., SIb states: “There isevidence that consultationoccurs on a regular basis andthat information provided bystakeholders is often takeninto account.”.. Similarly to PI3.1.1, an example of how andwhere this has happened maybe useful.
Yes (all UoCs) No (all UoCs) N/A PI 3.2.1 SG100 requires “Welldefined and measurable shortand long-term objectives ...are explicit within the fishery’smanagement system”. Whileconfirming that there are shortand long-term objectives, thereport does not confirm thatthe objectives are measurable.A comment from the authorswould be useful.
Text has been added tot the report to confirmthat objectives are measurable
Yes (all UoCs) No (all UoCs) N/A This PI is scored 90 overall,although both SIa and SIb areconsidered to meet the SG80level of perofmrnace but nomore. A score fo 80 isappropriate.
The text has been ammeneded to justify the90 score
Any Other CommentsComments Conformity Assessment Body Response
Does the reportclearly explainhow the processused todetermine riskusing the RBFled to the statedoutcome?Yes/No
Are the RBF riskscores well-referenced?Yes/No
Justification:
Please support your answers byreferring to specific scoring issues andany relevant documentation wherepossible. Please attach additionalpages if necessary.
Conformity Assessment Body Response:
1.1.1N/A
2.1.1N/A
2.2.1N/A
2.4.1N/A
2.5.1N/A
For reports assessing enhanced fisheries:Does the report clearly evaluate any additional impacts that might arisefrom enhancement activities?
There were no written submissions made by stakeholders received prior to the deadline. However following this date, MSC did send a submission that has been takeninto account
Date: 08/08/2014
SUBJECT: MSC Review and Report on Compliance with the scheme requirements
Dear Jo Akroyd
Please find below the results of our partial review of compliance with scheme requirements.
CAB Intertek Fisheries Certification Ltd. (IFC)
Lead Auditor Jo Akroyd
Fishery Name New Zealand EEZ ling trawl and longline
6073 Minor 67 CR-27.12.1.3 v.1.3 27.12.1 The CAB shall determine if the systems oftracking and tracing in the fishery are sufficient tomake sure all fish and fish products identified andsold as certified by the fishery originate from thecertified fishery. The CAB shall consider thefollowing points and their associated risk for theintegrity of certified products: 27.12.1.3 Theopportunity of substitution of certified with non-certified fish prior to or at landing fraudulentclaims from within and outside ther certifiedfishery.
The report does not adequately address how thesystems of tracking and tracing addressesopportunities of substituting with non-certified fish.The report states that the fishery certificate ends atlanding but not what happens at this point, particularlyin relation to segregation of fish from the 5% fishersnot part of DWG. 5.2.1 describes purchases from non-CoC holders, but it is not clear why this is relevant ifthe fishery certificate cannot extend beyond first pointof sale.
6077 Guidance 68- 69 CR-27.12.2.1 v.1.3 27.12.2 If the CAB determines the systems aresufficient, fish and fish products from the fisherymay enter into further certified chains of custodyand be eligible to carry the MSC ecolabel. The CABshall determine:27.12.2.1 The scope of the fisherycertificate, including the parties and categories ofparties eligible to use the certificate and the point(s) at which chain of custody is needed. a. Chain ofcustody certification shall always be requiredfollowing a change of ownership of the product toany party not covered by the fishery certificate. b.Chain of custody certification may be required at anearlier stage than change of ownership if theteam determines that the systems within thefishery are not sufficient to make sure all fish andfish products identified as such by the fisheryoriginate from the certified fishery. c. If the pointwhere chain of custody certification is required iscovered by the fishery certificate, the team shalldetermine the parties or category of partiescovered by the fishery certificate that require chainof custody certification.
The traceability section of the report does not providereference to a list of eligible parties that can supplyMSC certified fish or vessels that are part of thefishery. Presumably these are the DWG shareholder,but a link to where this list is publically available wouldbe useful.
This report is provided for action by the CAB and ASI in order to improve consistency with the MSC scheme requirements; MSC does not review all work productssubmitted by Conformity Assessment Bodies and this review should not be considered a checking service. If any clarification is required, please contact Maylynn Nunnon +61 2 9524 8400 for more information.
The report does not adequately address how the systems of tracking and tracing addresses opportunities ofsubstituting with non-certified fish. The report states that the fishery certificate ends at landing but not whathappens at this point, particularly in relation to segregation of fish from the 5% fishers not part of DWG. 5.2.1describes purchases from non- CoC holders, but it is not clear why this is relevant if the fishery certificatecannot extend beyond first point of sale..
IFC response: Section 5.2.1 has been revised to better address the tracking and tracing systems that are in placefor this fishery.Section 5.3 has been changed to read Chain of Custody required from first point of landing.The Ministry of Primary Industries recent catch records for LIN by DWG Shareholders and othercompanies/fishers who contract catch, buy LIN ACE, or whose catches of HAK are sold by DWG shareholdersto establish both the level of representation of 'fishers' in the ling fisheries and as a basis to assess the CoCmatters. Over the last five years 99.5% of ling catch is related to DWG catch. The report has been amended tosay this.
MSC REF 6074 Guidance.
The report does not clearly define how during at-sea- processing, particularly for surimi, it is ensured MSC lingand other species are not mixed or substituted for non MSC products.
IFC Response: The labelling system used by the fishing fleet has been described in section 5.2.3. The sectionhas been strengthened to describe procedures are in place to ensure species are not mixed or substituted.
MSC REF 6075 Minor CR 27.12.1.2 v1.3Page 12 of the audit report refers to only 5 out of 6 of the geographic areas where ling is fished being within theUoC. However in the traceability section 5.2.2. it does not reference this or explain how it is ensured that fishfrom the geographic region not covered within the UoC are never sold as MSC-certified.
IFC Response: Existing fisheries management requirements include the clear identification of species, quantity,fishing method and area of capture by all vessels landing fish from the fishery. All catches are reported inlogbooks and in catch and effort landing returns. On-board observer coverage also monitors, cross checks andverifies catches and landings with the vessels logbook. Any ling caught in an area within a UoC will be clearlyidentified and not mixed with UoC ling. Section 5.2.2 has been strengthened.
MSC REF 6076 Guidance CR 27.12.1.2 V 1.3
The traceability section of the report does not detail how the gear specification is managed, for example meshsize and number of hooks set, and if additional gear types -outside of the UoC- may be taken out by the clientgroup.
IFC response: The traceability section has been amended to address this. Gear specification, areas to fish etc areall listed in the Fishing permit. This is heavily monitored both at sea- observers and port inspections – Ministryof primary industries. Any breach would be severely punished.
DWG vessels will have only certified ling at point of landing. These will be clearly labelled eg vessel name andas MSC certified fish. The labelling and documentation accompanies fish all the way from landing to final pointof sale. Ling from a non Deepwater Group vessel will not be able to be labelled as certified. The fish will be
clearly identified as to which vessel the fish was caught. Ling from different vessels is never mixed and neversold together.
MSC REF 6077 Guidance CR 27.12.2.1 v1.3
The traceability section of the report does not provide reference to a list of eligible parties that can supply MSCcertified fish or vessels that are part of the fishery. Presumably these are the DWG shareholder, but a link towhere this list is publically available would be useful.
IFC Response: More than 99% of the ling are caught by DWG members. The website is www.deepwater.co.nz
IMM AttendeesLead Auditor/Coordinator: Seran DaviesTeam Members:Geoff Tingley (Lead Principle 1), Graham Pilling (Lead Principle 2) and Jo Akroyd (Lead Principle 3)Stakeholders:
Affiliation RepresentativesGreenpeace Karli Thomas (Oceans Campaigner)
Geoff Keey (Political Advisor)ECO Barry Weeber (Co-Chair and Main Fisheries Specialist)
Cath Wallace (Co-Chair and Economist)Location: Ministry of Fisheries, Wellington, New Zealand.
Date: 23rd July 2009
2. StatusWhat is the nature of the organisations interest in the fishery (e.g. client / science / management / industry /eNGO etc)
eNGO
3. Stakeholder Key IssuesWhat, if any, specific substantive issues or concerns are identified regarding the fishery? (P1 – P2 – P3)What information is available to allow us to determine the status of the fishery in relation to each issue?
P1TACC is higher than the stock. TACC should be reduced. There is a verbal agreement to “shelve” the TACCi.e. they will not fish to the higher TACC.
These fisheries have areas where there are either none or very old stock assessments.
6A and 6R stock is unknown as there is no stock assessment. 6R was last assessed in 1998 based upon oneecosound reading. The biggest catch was through tracking of southern blue whiting (Japanese vessel in 2001).
There are no stock assessments for LIN 1 and LIN 2. HAK4 and HAK1 have reasonable assessments. HAK7there is a problem with the fishery information. All of HAK7 needs to be acoustically assessed.
The extent to which New Zealand manage the TAC/TACC follows stocks enables the approach to effectivelyfish stocks right down.Ambiguities within section 10 of the Fisheries Act.
P2BPAs are not marine reserves and are not deemed as being suitable for protecting endemic biodiversity. Around½ of these areas are located in areas where no fishing occurs. They therefore provide limited protection from athreat which historically does not occur there. Also, these BPAs are voluntary so industry could potentiallyrevoke the non-fishing activity. It is considered that this industry led approach is actually undermining theactual MPA programme.
Bottom trawling cannot be considered as a sustainable fishing practice. Greenpeace require a broader definitionof the term “destructive fishing” which should include bottom trawling, canyoning, dredging and drift nets.
Trawling is destructive and causes damage, has been reported by NIWA scientists that trawlers can “wander”into closed and protected areas such as sea mounts.
Bycatch of fur seals and sea lions within these fisheries.
The long line fleet have a large impact upon seabirds (range of petrels and albatross species). The trawl fisheryis better managed to avoid bird with various forms of mitigation.
There are discrepancies in observer coverage across these fisheries.
Compliance issue with the non-reporting of bycatch species on boats which do not carry observers. The Westcoast hake and Ling fisheries, SBW, Campbell and Bounty Island fisheries all have marine mammal bycatch.
There is a large shark bycatch in the deepwater fisheries. Spiny dogfish in ling fishery (previously non QMS).
Concern that hake and ling are being certified “on the coat tails” of New Zealand hoki. Two independentreview panels state that this (hoki) fishery should not have been certified.
P3
Hake has a high rate of juvenile catch both retained and discarded (run through fish meal plant). This isaffecting small areas which are targeted and this calls into question how this is affecting stock.
High grading occurs within the hoki fishery.
Public access to fishery management is required. Management is currently deemed to be quite secretive andmanagement documents are not within the public domain (no public engagement within the process). Section12 of the fisheries act- no public right to be involved in management of fisheries.
Management is reliant on the fishing industry for money.
4. Other issues(e.g. any other stakeholders we should contact, any written submissions to follow?)
IMM AttendeesLead Auditor/Coordinator: Seran DaviesTeam Members:Geoff Tingley (Lead Principle 1), Graham Pilling (Lead Principle 2) and Jo Akroyd (Lead Principle 3)
Stakeholders:Affiliation RepresentativesRoyal Forest & Bird Kevin Hackwell (Advocacy Manager) and Kirstie Knowles
(Marine Conservation Advocate)
Location: Ministry of Fisheries, Wellington, New Zealand.
Date: 23rd July 2009
2. StatusWhat is the nature of the organisations interest in the fishery (e.g. client / science / management / industry /eNGO etc)
eNGO
3. Stakeholder Key IssuesWhat, if any, specific substantive issues or concerns are identified regarding the fishery? (P1 – P2 – P3)What information is available to allow us to determine the status of the fishery in relation to each issue?
The BPA’s should not be considered very highly within this assessment. The position of them is incorrect andno research, knowledge of habitat or suitable benthos was undertaken to support them. RF&B do not agree thatthe BPA’s address the protection of some of the hake, ling & SBW (Southern Blue Whiting) grounds. Researchneeds to be undertaken on the habitats and the BPA’s should not be given much weighting within these EEZfishery assessments.
High grading occurs within the NZ EEZ fisheries.
Southern Blue Whiting (SBW)Key issues raised with regard to P2 but also some concerns regarding status of stock under P1. High catches ofmarine mammals (mostly NZ fur seals but also some NZ sea lions). The squid trawl fishery has the worstrecord for this and has a plan to rectify the situation. Argue to the contrary that the code of practice does notwork. Murray Smith has undertaken modelling work on bycatch & Sophie Manual (NIWA). Bounty Islandspose the biggest risk area with large amounts of bycatch. Factors contributing to capture include turning whilsttrawling plus the time of day when trawling takes place- these things are not picked up by the codes of practice.Also seasonal strategies do not come into play. This fishery has killed more mammals than the squid fishery.95% of New Zealand Sea lions are breeding on the Auckland Islands. Louise Chilvers (DOC) and Igor Debsky(DoC)/Nathan Walker (MFish) have further information on this. Observer coverage is misaligned to the periodof increased bycatch. Seabird bycatch is not particularly high but it is a diverse range of birds. There ispotential underreporting of marine mammal bycatch.In addition there are trophic impacts and habitat impacts associated with bottom trawling. The range of speciescaught as bycatch is not as well-known as from the hoki fishery.
LingLong line: Currently low level in NZ waters. Fishing occurs around the Bounty Islands in smaller vessels.Vessels over 28m have seabird mitigation in place. Ed Abraham has information showing high seabird bycatch
from longline fishery (smaller vessels). Also sponges and corals are brought up from the seabed by the lines.There is a long history of misreporting from this Ling fishery.Problem raised with Hoki are the same for hake and ling as it is the same fishery. There is a research paper onmisreporting in the hoki fishery which also includes ling misreporting information (Philip Clarke, 2009). Otherresearch includes information on the misreporting of observer documents (Tracey Batman (MFish) RichardBurns & Geoffrey Cove (Lincoln University), Graham Brewer (Dunedin).TrawlIssue with P2- fur seal bycatch. The SLEDS (Sea Lion Exclusion Devices) do not work for fur seals and thisresults in unacceptably high levels of fur seal bycatch.
HakeThe hake fishery has the same issues as identified for Ling. Problem with single species focus stockassessments (as hake, ling and hoki are all caught together e.g. hake/ling may be bycatch in the hoki fishery andvice versa. Issue therefore with the three overlap species of hoki, hake and ling.Issue with process and transparency at the Ministry (MPI). Scientists results and information are not alwaysintegrated into Ministry decisions especially with regard to ETP and habitats.RF&B support real time catch reporting.
Bounty Islands has a serious fur seal bycatch problem. Some areas are good, but equally some are not e.g. noseabird standard in place etc. ENGO’s contacted to comment by MPI. DW Fish plan (DWG & DWTeam)provided to RF& B to comment on but there was no scientific involvement & they do not consult with scientistsinternally.There is no drive regarding the working towards minimising the bycatch. Aerial counts of fur seal populationsare informative for distribution but cannot be used for abundance information. Boat based informationundertaken in Fjordland (South Island) is the same.Trawls should only go over old trawl areas- no expansion into new areas. For BPAS – areas of significanceneed to be identified as well as areas being put to one side to study the rate of recovery of the seabed fromtrawling in order to better understand the impact of the fishery.NO MPAs are planned within NZ’s EEZ until 2013. The considered approach for the MPA protection wassquashed by the BPA plan.RF&B would like to discuss the BPAs with DWG. MFish and DOC have been told to freeze all work due tothe agreement for the BPAS.
Overview:Issue with P2 for Southern Blue WhitingAutoliners are ok within the longline fleet (but the small vessels are not- less regulations, more issues withbycatch etc)With regard to the trawl fisheries, RF&B do not think that the hoki fishery met the MSC standard (althoughhake and ling are slightly better than hoki).
4. Other issues(e.g. any other stakeholders we should contact, any written submissions to follow?)
Hugh Best (Marine conservationist) has 16 years worth of fur seal data.Barry Weever (ECO) - key person to be contacted on fisheries stock assessments.Louise Chilvers (DOC) and Igor Debsky (DoC)/Nathan Walker (MFish)Murray Smith & Sophie Manual (NIWA)Ed Abraham
IMM AttendeesLead Auditor/Coordinator: Seran DaviesTeam Members:Geoff Tingley (Lead Principle 1), Graham Pilling (Lead Principle 2) and Jo Akroyd (Lead Principle 3)Stakeholders:Affiliation RepresentativesWWF Peter Trott (WWF-Australia. Fisheries Programme Manager)
Rebecca Bird (WWF- New Zealand. Marine Programme Manager)
Location: Talley’s Seafood, Nelson, New Zealand.
Date: 24th July 2009
2. StatusWhat is the nature of the organisations interest in the fishery (e.g. client / science / management / industry /eNGO etc)
eNGO
3. Stakeholder Key IssuesWhat, if any, specific substantive issues or concerns are identified regarding the fishery? (P1 – P2 – P3)What information is available to allow us to determine the status of the fishery in relation to each issue?
There is no management in place for bycatch species (except if QMS) e.g. what about sharks? General harveststrategies are in place not specific to the fisheries themselves for appropriate reference points e.g. SBW.There is not enough information on the habitat types e.g. % of areas fished and sensitivity level of habitat.Require demonstrable proof regarding impacts to trophic structure and ecosystem modelling.There is not enough convincing evidence that seals will survive SLEDs. Critical injury and hypoxia may occur.SEDs are effective in other fisheries and should be introduced here in addition to the SLEDS.
HakeSimilar issues as for Hoki. Bycatch problems with fur seals, birds, sharks and skates. Issues with Trawlfootprints. Concerns for hake stock on Chatham rise classified as overfished in last 5 years. Information is notcausing concern for sub-Antarctic stocks.
Hake and Ling fisheries are not precautionary enough. Variability in stocks not considered.
Concerned that the harvest strategy is not tried and tested as it is a generic strategy.
There is an impact of this fisheries gear type on the habitat. The severity of this impact is not well known.Discarding is occurring within the fishery predominantly of bycatch species (also happens with QMS species).Monitoring & compliance: prosecutions are occurring due to high grading within the hoki fishery (same fisheryas for hake). There is also a compliance issue with tracking the products fo this fishery.
There is underreporting present throughout the EEZ fisheries and the trawl fisheries have an issue withcompliance.
LingChatham rise is fully fished. There is limited information regarding stock status for west coast South Island.Impacts of this fishery upon bycatch species are unknown also; discarding of bycatch is known to occur.
Inshore long lines have high interactions with seabirds and no effective mitigation nor codes of practice.Australian fisheries abide by CCAMLR regulations which are proving to be effective- suggest the sameapproach for NZ fisheries.
Southern Blue WhitingThere is an issue with the stock especially Campbell and Bounty stocks. Uncertainties in stock assessmentsalso unknown stock trend. Damaging gear type used in fishery. Protected species are affected-especiallyaround the Bounty’s e.g. sea lions, birds and other marine mammals. Model is based upon the squid fisheryonly (using information based upon sea lion capture). Not enough convincing information to suggest that theusage of the SLEDS is allowing survival (high percentage is suffering hypoxia or serious injury). Current on-going monitoring is not effective and further information is required.
4. Other issues(e.g. any other stakeholders we should contact, any written submissions to follow?)
Comments:Meeting 1. Deepwater and ScienceMeeting 2 Compliance
2. StatusWhat is the nature of the organisations interest in the fishery (e.g. client / science / management /industry / eNGO etc)
MPI are the Managers of the NZ fisheries
3. IMM Assessment Team QuestionsAssessment team questions for stakeholders
Deepwater and sciencePlease describe the processes involved in the management of the fishery and the activities involvedrelating to management of P1 and P2 species, as well as the processes relevant to P3.CompliancePlease could you describe the compliance in these two fisheries, any concerns you have and anyenforcement issues
4. Stakeholder Key Issues and responses
Deepwater and Science
- With regard the process involved in setting the TACCs, the underpinning science was definedwithin the 10 year research programme, which holds for 5 years with a subsequent 5 yearextension. The science is peer reviewed through the NZ working group structure and put forward
to managers who consider options for TACC changes (including status quo) usually based uponconstant catch projections of future status. These options undergo statutory consultation throughthe IPP (initial position paper) that allows the incorporation of stakeholder views andcommentary. This consultation process is a requirement of the Fisheries Act. Based onconsultation, final advice is then provided to the Minister. The final advice paper (FAP) includesinformation on the environmental impacts, biology of the stocks, ETP and bycatch, as well asmultispecies issues. The IPPs and FAPs are placed on the website. Advice is probabilistic wherefeasible which was generally discussed in detail at the Working Group level.
- The criteria for the rebuilding period (less than twice the time that stock rebuilding would occurin the absence of fishing) was detailed.
- A paper by Dr Mace on the harvest strategy, as submitted to the MSC process for hoki, wasnoted.
- MPI provided details on the number of recent decisions on TACC change, their directions, andthe level of support for these from the industry stakeholder
- The working relationship between MPI and DWG was described- The consultation process on the 10 year research plan was described, including the consultation
planning meeting in 2010- Further examples of the process involved were noted through the NPOA seabirds and sharks
process- The QMS and tier levels of species were described, noting that the Fishery Plan provides the
higher level goals that drive the Annual Operational Plan, progress on which is reported onannually (Annual report reviewing progress vs the Annual Operational Plan). The pattern ofintroduction of species into the QMS was described, noting the QMS Introduction and FinalAdvice Paper 2008
- The Official Information Act was also noted- The role of the PBR within the management system was discussed. It was noted that the Fisheries
Act (section 15(2)) presents an obligation on protected species, along with in section 9. However,neither presents specific numbers or statutory targets for specific protected species. In general, theMinister may take measures considered necessary to avoid, remedy or mitigate the effect offishing on any protected species. PBR were considered to act as one indicator for action, ratherthan absolute trigger values. Trigger values are available under the Fisheries Act but require aformal process to be established. This has not occurred in the fisheries in question as it has beendeemed unnecessary based on historical catch of protected species. It was noted that oneinteraction itself acts as a trigger for action. The AEWG has not reviewed the PBRs for keyspecies (e.g. sea lions). Some PBRs have been reviewed by the AEWG Working Group; there arealso more detailed Bayesian models for other sea lion populations that have been extensively peerreviewed. The exception is the sea lion PBR for the Campbell Islands southern blue whitingfishery (SBW6I).
- The Science 2012 process aims to provide a better understanding of the risk that fisheries pose forother ETP species beyond seabirds (a risk assessment for which has already been completed).This project is currently running up to 2013 and was started in 2012. It will examine cumulativeimpacts on species as well as the risk posed by individual fisheries
- It was noted that the squid SQU6T has been closed in some years due to sea lion bycatch levels,based on assumed strike rates, so that sanction can be used in that fishery and could be extendedto other fisheries if deemed necessary.
- The history of the BPAs and their utility was discussed, and the discussions undertaken as part ofthe recent hoki assessment were noted. MPI are monitoring the fishery footprint and inter-annualchanges through statutory reporting of fishing positions and VMS (required on vessels >28m).
- Fishery plans for hake and ling (and SBW, ORH, JMA and HOK) have been approved by theMinistry and relate to management objectives,- The pattern of trawl surveys, as detailed in the 10
year plan, was described. The importance of the surveys in the WCSI to support the fishery-basedCPUE time series was noted.
Compliance- Currently there are no particular compliance concerns with risk in the hake or ling fisheries- MPI compliance are looking at wider compliance eg FCV reviews, corrective actions and culture
on some of the fishing vessels.- MPI compliance are working collaboratively with DWG to identify risks.- There have been no recent compliance issues- In 2007/2008 using MPI profiling and observed vs non observed data, misreporting between LIN
5 and 6 was identified. Three major operations took place involving Korean, Japanese andRussian vessels. This resulted in 3 prosecutions. It was the first time a co Director had been takento court, sending clear signals that company’s and Directors would be held accountable.
-- Since then observers and profiling have confirmed that there is now minimal risk of this occurring
however monitoring still takes place.- A number of years ago trucking in Hake was identified as an issue involving ~1500t of hake per
year, taken in HAK7 but misreported as having been taken in HAK4 and HAK1. An investigationwas launched – it involved Korean vessels. Six vessels were prosecuted. There has since beenclose monitoring with good results. The catches were taken into account in the stock assessments.
- Hake and ling are now considered low risk fisheries; this has been largely attributed to a changein behavior in foreign charters.
- Any minor compliance issues are brought to the attention of the DWG who have the opportunityto work with the company or vessel to resolve an issue. If this is not resolved satisfactorily thentarget specific vessels will be targeted and if no behavioral change, will be prosecuted if it is adeliberate criminal offence, repetitive or serious.
- the “VADE” (Voluntary, Assisted, Rirected, Enforced) compliance model seems to be workingwell and it was emphasized that hake and ling are not considered a compliance risk
6. Closing
IMM Lead Assessor: Summary of key points – stakeholder to confirm in writing (sign if hard copy)
7. Confirmation of record of meeting:
IMM Lead Assessor Signature: Stakeholder Signature:
Stakeholder Interview Record NZ Hake and Ling : NIWA 10th September 2013
Assessment Team NamesLead Assessor Jo AkroydP1 Team Member Graham PillingP2 Team Member Graham PillingP3 Team Member Jo Akroyd
Meeting Location WellingtonDate 10th September 2013Stakeholders Name AffiliationRosemary Hurst NIWAPeter Horn NIWACharles Edwards NIWA
2. StatusWhat is the nature of the organisations interest in the fishery (e.g. client / science / management / industry /eNGO etc)
Research providers
3. IMM Assessment Team QuestionsAssessment team questions for stakeholders
What are the key updates with the HAK and LIN stock assessments in recent years?What are the areas of uncertainty within the stock assessments?Have the assessments been subject to external review?What analyses are performed for lower tier species?What is the latest work on cold water coral distribution and status?What research has been undertaken on ecosystem analyses?What activities have been undertaken on benthic habitat structure?
4. Stakeholder Key Issues and responses
- Recent HAK assessments in regions 1,4 and 7- General patterns in stock size detailed in the plenary report were detailed, and the frequency of resource
fishery-independent surveys noted- Noted that while Chatham Rise stock has increased in recent years due to better recruitments, projections
show the stock is likely to decline in the future- West Coast South Island stock assessment was the subject of some uncertainty due to the lack of fishery-
independent stock assessments. The assessment therefore relied on commercial CPUE data. Two surveysin 2000 and 2012 allowed some ‘ground-truthing’ of the commercial CPUE time series and reduced (butdid not eliminate) the uncertainty. A further survey has recently been completed and will be included inthe next assessment.
- Recent LIN assessments in regions 3&4, 5&6, and 7, as well as the Bounty Plateau (part of the LIN6 area)and Cook Strait (overlapping parts of areas LIN2 and 7)
- No stock assessment for LIN2- LIN7 assessment contained the same uncertainty as HAK7
- The Cook Strait assessment was not accepted, and suffered from conflicts in the catch-at-age and CPUEdata
- The hoki assessment was externally reviewed, which covered the CASAL modeling approach. However,the specific hake and ling assessments have not been externally reviewed. It was noted that the internalreview process of new assessments is quite rigorous
- Tier II and Tier III species are subject to risk assessment approaches (tier III) and characterization analyses(e.g. using trends in CPUE – tier II), as detailed in the 10 year research plan. An internally funded NIWAproject is looking into data poor assessment approaches, while others are progressing ageing for non-tier Ispecies (e.g. deepwater shark ageing)
- A summary of cold water coral analyses will be provided- Trophic studies of the Chatham Rise have supported Ecopath analyses for areas 3&4- These will also underpin future ‘Atlantis’ ecosystem modeling of the Chatham Rise region- There are ongoing discussions on spatial modeling of benthic species, including Vulnerable Marine
Ecosystem work. Further analyses to examine the BOMEC activities, including the ocean survey 2020 onChatham Rise, are ongoing. Relevant camera-based work will be summarized.
6. Closing
IMM Lead Assessor: Summary of key points – stakeholder to confirm in writing (sign if hard copy)
7. Confirmation of record of meeting:
16/09/2013 18/9/2013
IMM Lead Assessor Signature: Stakeholder Signature:
Meeting Dragonfly for MSC Assessment NZ Hake and Ling : September 10th 2013
Assessment Team NamesLead Assessor Jo AkroydP1 Team Member Graham PillingP2 Team Member Graham PillingP3 Team Member Jo Akroyd
Meeting Location Dragonfly offices, WellingtonDate 10/09/2013Stakeholders Name AffiliationEdward Abraham DragonflyFinlay Thompson DragonflyPhilipp Neubauer Dragonfly
2. StatusWhat is the nature of the organisations interest in the fishery (e.g. client / science / management / industry /eNGO etc)
Research Providers
4. IMM Assessment Team QuestionsAssessment team questions for stakeholders
Please detail the approach, outputs and uncertainties in the modeling of non-target (ETP) species in the hakeand ling fisheries
3. Stakeholder Key IssuesWhat, if any, specific substantive issues or concerns are identified regarding the fishery? (P1 – P2 – P3) andwhat information is available to allow us to determine the status of the fishery in relation to each issue?
- A summary of the results available in the Dragonfly reports was given, broken down by unit ofcertification
- Noted differences between the autoliner (offshore) and smaller manual setting longliners (inshore)- Noted that year trend model estimates in the trawl fishery were influenced by the pattern seen in
the hoki fishery, as those year effects were modeled across the fishery- Noted that the 2010 mitigation requirements (e.g. integrated weight line) were integrated into the
model (in terms of the capture rates) but not directly taken into account within the model- The recent coverage of observers within the fleets has been sufficient to estimate interactions, but
a greater coverage tends to increase precision in the estimates, and reduce biases due to unevencoverage of fleet units
- Model details are available in the 2010/2011 Dragonfly report- Results are presented and reviewed at the Scientific Working Group and further analysis
performed on the basis of feedback- Noted that the risk assessment for seabirds has been completed, and highlights uncertainty in the
estimates for the smaller inshore vessels due to the low observer coverage. Current estimatesindicate, for example, a high risk for black petrels
- Analyses for marine mammals were also detailed- Month-effects were noted with greater movement potential in the winter months as individuals
may move further offshore, while pupping activity may constrain activity in summer months- Links between the Auckland Island and Campbell Island were noted for sea lions based on
tagging info- A risk assessment approach for marine mammals is currently underway- Uncertainties in the inputs to the PBR calculation were discussed, with Rmax considered
reasonably consistent for marine mammals, with population size being viewed as a key area ofuncertainty. PBR was viewed more as a figure to provide context rather than a ‘critical level’value
6. Closing
IMM Lead Assessor: Summary of key points – stakeholder to confirm in writing (sign if hard copy)
7. Confirmation of record of meeting:
16/09/13 Confirmation by emailIMM Lead Assessor Signature: Stakeholder Signature:
Stakeholder Interview Record e NGOs 9th September 2013
Assessment Team NamesLead Assessor Jo AkroydP1 Team Member Graham PillingP2 Team Member Graham PillingP3 Team Member Jo Akroyd
Meeting Location WWF Wellington OfficesDate 10th September 2013Stakeholders Name AffiliationPaul Crozier WWF NZKevin Hackwell Forest and BirdBarry Weeber ECO
Comments:- The representative from Eco requested that it be clearly noted that his presence at the meeting did
not legitimize the MSC process being undertaken in NZ, in particular for these fisheries, and notedconcerns over the composition of the audit team and the availability of information for thestakeholders.
2. StatusWhat is the nature of the organisations interest in the fishery (e.g. client / science / management /industry / eNGO etc)
E NGO
3. Stakeholder Key IssuesWhat, if any, specific substantive issues or concerns are identified regarding the fishery? (P1 – P2 –P3) and what information is available to allow us to determine the status of the fishery in relation toeach issue?
ENGO’s concerns- It was noted by all eNGO representatives that their attendance and involvement at Working
Groups, in particular for stock assessment, were hindered by funding and manpower. If possible,they would concentrate on stock assessment meetings for those fisheries under MSC certification,and noted that given industry received Government support for the MSC process that it was unfairthat NGOs did not receive the same
- With respect to reference points, it was noted that for particular species (e.g. black cardinalfish)management action may not be taken when limits were reached
- It was noted that changes in TACC tended to take a long time after the stock assessment advicewas supplied, and that it appeared easier to increase TACCs than decrease them
- eNGOs felt they and other key stakeholders were not involved sufficiently in the development ofthe 10 year research plan in recent years
- EFF groups were felt to be useful and engagement on the NPOAs for seabirds and sharks wasmore successful, but communications between eNGOs and other stakeholders remained limited
- The proposed identification guides for sharks as part of the NPOA sharks was noted as a positivedevelopment to improve data collection
- The issue of the charter fleet and the recent Parliamentary Enquiry were noted, which raisedmanagement issues such as misreporting
- The limited observer coverage on the inshore longline fleet fishing for ling was noted- 80% of Benthic Protection Areas were noted to be outside the depth that formed the focus of
trawl activities- A Standards NZ review of benthic impact standards was said to have stalled after 6 months. A
report by Leathwick on fisheries captures by habitat types was noted as an important document- On ecosystem issues, the compendium from the Aquatic Environment Working Group was noted.- For ETP species, issues with uncertainty in the ling inshore (small) longline fleet was noted,
given patchy observer coverage, while fur seals were also noted within the trawl fishery- Concern was raised that recent decisions to increase the TACC for hoki might lead to increases in
the catch of hake and ling to levels above the TACC for those species, or potential discarding- It was noted that while 100% observer coverage had been achieved on the hoki/hake/ling fishery
this year, the 24 hour pattern of activity in these vessels would mean that some tows may beunobserved as the observer must sleep at some point
- concern with the amount of by-catch of deep water sharks in these fisheries, and the fact that theyare extremely vulnerable to fishing practices
6. Closing
IMM Lead Assessor: Summary of key points – stakeholder to confirm in writing (sign if hard copy) Comments not to be attributed to individuals with the exception of Mr Weeber’s concern re the
process and expertise of the auditors. The IMM team would take the eNGOs concerns into account when writing the report and
scoring the fishery7. Confirmation of record of meeting:
16/09/13 Confirmation by email
IMM Lead Assessor Signature: Stakeholder Signature: